64. - Economics of Agriculture
454
-
Upload
khangminh22 -
Category
Documents
-
view
1 -
download
0
Transcript of 64. - Economics of Agriculture

64.
“Сагласно одлуци из члана 27. став 1. тачка 4), Закона о научноистраживачкој делатности („Службени гласник РС”, бр. 110/05, 50/06-испр. и 18/10), утврђeна
је категоризација домаћих научних часописа
Листа часописа за друштвене науке
5. Економика пољопривреде M24”(Часопис међународног значаја)
http://www.nauka.gov.rs (28. Jun 2010)
Београд, јул-септембар 2017. годинеBelgrade, July-September, 2017

Часопис◊ ЕКОНОМИКА ПОЉОПРИВРЕДЕ ◊
Journal◊ ECONOMICS OF AGRICULTURE ◊
Основан 1954. године / Established 1954
ИЗДАВАЧИ / PUBLISHERSНаучно друштво аграрних економиста Балкана, Београд
The Balkan Scientific Association of Agrarian Economists, Belgrade Институт за економику пољопривреде, Београд (Србија)
Institute of Agricultural Economics, Belgrade, (Serbia)Академија економских наука, Букурешт (Румунија) Academy of Economic Studies, Bucharest (Romania)
EDITOR-IN-CHIEFProf. Drago Cvijanovic, Ph.D., Univesity of Kragujevac,
Faculty of Hotel Management and Tourism, Vrnjci Spa, Serbia
Адреса уредништва / Editorial officeБеоград, Волгина 15; тел/факс (+381)11/6972-848; E-mail: [email protected]
Belgrade, Volgina 15; phone/fax (+381)11/6972-858; E-mail: [email protected]
http://ea.bg.ac.rs

INTERNATIONAL EDITORIAL BOARD
Prof. Radovan Pejanovic, Ph.D., Faculty of Agriculture, Novi Sad, Serbia, Prof. Zorica Vasiljevic, Ph.D., Faculty of Agriculture, Belgrade, Serbia, Prof. Vladimir I. Trukhachev, Ph.D., Stavropol State Agrarian University, Stavropol, Russian Federation, Prof. Аlan Randall, Ph.D., Faculty of Agriculture, Food and Natural Resources, University of Sydney, Sydney, Australia, Prof. Vincent Dolle, Ph.D., Mediterranean Agronomic Institute Montpellier (IAMM-CIHEAM), Montpellier, France, Prof. Andras Nabradi, Ph.D., University of Debrecen, Debrecen, Hungary, Prof. Eirik Romstad, Ph.D., Norwegian University of Life Sciences, Aas, Norway, Prof. Wim Heijman, Ph.D., Wageningen University, Wageningen, The Netherlands, Prof. Nicolae Istudor, Ph.D., Academy of Economic Studies, Bucharest, Romania, Prof. Andrzej Kowalski, Ph.D., Institute of Agricultural and Food Economics, Warsaw, Poland, Prof. William H. Meyers, Ph.D., College of Agriculture, Food and Natural Resources, Columbia, Missouri, USA, Prof. Thomas Glauben, Ph.D., Leibniz – IAMO Institute, Halle, Germany, Tomas Doucha, Ph.D., Institute of Agricultural Economics and Information, Prague, Czech Republic, Prof. Margaret Loseby, Ph.D., State University of Tuscia, Viterbo, Italy, Prof. Aleksandar Ostojic, Ph.D., Faculty of Agriculture Banja Luka, Republika Srpska, Bosnia and Herzegovina, Prof. Toma Dinu, Ph.D., University of Agricultural Sciences and Veterinary Medicine, Bucharest, Romania,Prof. Natalia Nikolaevna Balashova, Ph.D., Faculty of Economy, Volgograd State Agricultural Academy, Volgograd, Russian Federation, Prof. Masahiko Gemma, Ph.D., Waseda University, Tokyo, Japan.
EXECUTIVE EDITORS
Prof. Dragic Zivkovic, Ph.D., Faculty of Agriculture, Belgrade, Serbia, Prof. Branislav Vlahovic, Ph.D., Faculty of Agriculture, Novi Sad, Serbia,Prof. Dorel Dusmanescu, Ph.D., Petroleum Gas University, Faculty of Economy, Ploiesti, Romania,
ASSOCIATE EDITORS
Prof. Zoran Rajic, Ph.D., Faculty of Agriculture, Belgrade, Serbia, Prof. Zoran Njegovan, Ph.D., Faculty of Agriculture, Novi Sad, Serbia, Prof. Jonel Subic, Ph.D., Institute of Agricultural Economics, Belgrade, Serbia, Jean Vasile Andrei, Ph.D., Petroleum Gas University, Faculty of Economy, Ploiesti, Romania, Ferhat Cejvanovic, Ph.D., Government of Brcko District, Bosnia and Herzegovina.

INTERNATIONAL EDITORIAL REVIEW BOARD
Prof. Koviljko Lovre, Ph.D., Faculty of Economy, Subotica, Serbia, Prof. Snezana Djekic, Ph.D., Faculty of Economy, Nis, Serbia, Prof. Veljko Radojevic, Ph.D., Azotara Pancevo, Serbia, Prof. Pero Petrovic, Ph.D., Institute of International Politics and Economics, Belgrade, Serbia, Prof. Vlade Zaric, Ph.D., Faculty of Agriculture, Belgrade, Serbia, Prof. Nedeljko Tica, Ph.D., Faculty of Agriculture, Novi Sad, Serbia, Prof. Vesna Rodic, Ph.D., Faculty of Agriculture, Novi Sad, Serbia, Vesna Popovic, Ph.D., Institute of Agricultural Economics, Belgrade, Serbia, Prof. Milan R. Milanovic, Megatrend University, Belgrade, Serbia, Prof. Ivan Milojevic, Ph.D., Military Academy, University of Defence, Belgrade, Serbia, Prof. Nikolai I Kuznetsov, Ph.D., Saratov State Agrarian University – N.I. Vavilov, Saratov, Russian Federation, Prof. Kenneth Thomson, Ph.D., University of Aberdeen, Aberdeen, Scotland, UK, Dan Marius Voicilas, Ph.D., Romanian Academy of Science, Institute of Agricultural Economics, Bucharest, Romania, Prof. Claudiu Cicea, Ph.D., Academy of Economic Studies, Bucharest, Romania, Prof. Adrian Turek Rahoveanu, Ph.D., University of Agricultural Sciences and Veterinary Medicine of Bucharest, Romania,Marek Wigier, Ph.D., Institute of Agricultural and Food Economics, Warsaw, Poland, Prof. Mile Pesevski, Ph.D., University “Ss Cyril and Methodius”, Faculty of Agricultural Sciences and Food, Institute of Agroeconomics, Skopje, Republic of Macedonia, Prof. Blagica Sekovska, Ph.D., Faculty of Veterinary Medicine, Skopje, Republic of Macedonia, Prof. Aleksandra Despotovic, Ph.D., Biotechnical Faculty, Podgorica, Montenegro,Prof. Marko Ivankovic, Ph.D., Federal Agro-Mediterranean Institute, Mostar, Bosnia and Herzegovina, Prof. Bahrija Umihanic, Ph.D., Faculty of Economy, Tuzla, Bosnia and Herzegovina, Prof. Alexandru Stratan, Ph.D., Institute of Economy, Finance and Statistics, Chisinau, Moldova, Prof. Mihael Toman, Ph.D., Biotechnical faculty, University of Ljubljana, Domzale, Slovenia, Klaus Wagner, Ph.D., Federal Institute of Agricultural Economics, Vienna, Austria, Prof. Andrea Segre, Ph.D., Faculty of Agriculture, Bologna, Italy, Prof. Raluca Ion, Ph.D., Academy of Economic Studies, Bucharest, Romania, Zbigniew Florianczyk, Ph.D., Institute of Agricultural and Food Economics, Warsaw, Poland, Crina Turtoi, Ph.D., Romanian Academy of Science, Institute of Agricultural Economics, Bucharest, Romania, Vasily Erokhin, Ph.D., Stavropol State Agrarian University, Stavropol, Russian Federation, Prof. Ivo Grgic, Ph.D., Faculty of Economy, Zagreb, Croatia, Prof. Stane Kavcic, Ph.D., University of Ljubljana, Biotechnical Faculty, Ljubljana, Slovenia,
Prof. Anatoli Saiganov Semenovich, Ph.D., Institute of System Research in the Agro-industrial Complex of National Academy of Sciences of Belarus, Minsk, Republic of Belarus, Prof. Natalia Sergeevna Morozyuk, Ph.D., Odessa State Agrarian University, Odessa, Ukraine, Goran Maksimovic, Ph.D., Faculty of Agriculture Lesak, Serbia, Bahrija Kacar, Ph.D., Government Office for the Sustainable Development of Underdeveloped Areas of the Republic of Serbia, Novi Pazar, Serbia, Prof. Kadrija Hodzic, PhD, Faculty of Economics, University of Tuzla, Tuzla, Bosnia and Herzegovina, Rumen Popov, Ph.D., Institute of Agricultural Economics, Sofia, Bulgaria, Prof. Carlos Saborio Viquez, Ph.D., University of Costa Rica, San Hose, Costa Rica, Prof. Miguel Moreno Millan, Ph.D., University of Cordoba, Cordoba, Spain, Prof. Ion Iarca, Ph.D., Petroleum and Gas University, Economic Sciences Faculty, Ploiesti, Romania, Prof. Done Ioan, Ph.D., Petroleum and Gas University, Economic Sciences Faculty, Ploiesti, Romania, Prof. Riza Avcioglu, Ph.D., Aegean University, Faculty of Agriculture, Izmir, Turkey, Prof. Diran Akinleye, Ph.D., University of Lagos, Akoka, Nigeria, Prof. Zorica Sredojevic, Ph.D., Faculty of Agriculture, Belgrade, Serbia, Prof. Nataljia Bogdanov, Ph.D., Faculty of Agriculture, Belgrade, Serbia, Prof. Elena Stoian, Ph.D., University of Agricultural Sciences and Veterinary Medicine, Bucharest, Romania, Prof. Victor Manole, Ph.D., Academy of Economic Studies, Bucharest, Romania, Prof. Gabriel Popescu, Ph.D., Academy of Economic Studies, Bucharest, Romania, Prof. Dan Boboc, Ph.D., Academy of Economic Studies, Bucharest, Romania, Prof. Aurelia Felicia Stancioiu, Ph.D., Academy of Economic Sciences, Bucharest, Romania, Prof. Constantinos Alexiou, Ph.D., Polytechnic School, Aristotle University, Thessaloniki, Greece, Prof. Nicholas Apergis, Ph.D., University of Piraeus, Piraeus, Greece, Prof. Zaklina Stojanovic, Ph.D., Faculty of Economics, Belgrade, Serbia,Prof. Snezana Stetic, Ph.D., The College of Tourism, Belgrade, Serbia,Prof. Dusko Jovanovic, Ph.D., Business Economics Academy, Cacak, Serbia,Prof. Sait Engindeniz, Ph.D., Ege University, Faculty of Agriculture, Department of Agricultural Economics, Izmir, Turkey,Prof. Tetyana Mostenska, Ph.D., National University of Food Technologies, Kyiv, Ukraine,Corina Ene, Ph.D., Petroleum and Gas University, Economic Sciences Faculty, Ploiesti, Romania,Anna Ivolga, Ph.D., Stavropol State Agrarian University, Stavropol, Russian Federation,Prof. Andreja Borec, Ph.D., University of Maribor, Faculty of Agriculture and Life Sciences, Hoce, Slovenia,Prof. Mihai Mieila, Ph.D., Faculty of Economic Sciences, Valahia University, Targoviste, Romania,Prof. Donatella Privitera, Ph.D., Department of Educational Sciences, University of Catania, Catania, Italy,Prof. Marco Platania, Ph.D., Department of Formational Sciences, University of Catania, Catania, Italy,Adrian Stancu, Ph.D., Petroleum and Gas University, Economic Sciences Faculty, Ploiesti, Romania,Prof. Natalya Bannikova Vladimirovna, Ph.D., Stavropol State Agrarian University, Russian Federation,
Prof. Darina Zaimova, Ph.D., Trakia University, Stara Zagora, Bulgaria, Prof. Matteo Vittuari, Ph.D., Faculty of Agriculture, Bologna, Italy, Prof. Zoran Grgic, Ph.D., Faculty of Agriculture, Zagreb, Croatia, Vesna Milicic, Ph.D., University of Ljubljana, Biotechnical Faculty, Ljubljana, Slovenia,Alexandr Trukhachev, Ph.D., Stavropol State Agrarian University, Russian Federation,Prof. Dimitre Nikolov, Ph.D., Institute of Agricultural Economics, Sofia, Bulgaria,Prof. Christina Yancheva, Ph.D., Agricultural University, Plovdiv, Bulgaria,Dario Simicevic, Ph.D., College of Tourism, Belgrade, Serbia, Prof. Vladislav Zekic, Ph.D., Facultu of Agriculture, Novi Sad, Serbia,Aleksandar Rodic, Ph.D., Institute Mihailo Pupin, Belgrade, Serbia,Prof. Sanjin Ivanovic, Ph.D., Facultu of Agriculture, Belgrade, Serbia,Prof. Milan Pocuca, Ph.D., Business Academy, Faculty of Law, Novi Sad, Serbia,Prof. Dragana Gnjatovic, Ph.D. Faculty of Hotel Management and Tourism, Vrnjci Spa, Serbia,István Kapronczai, Ph.D. Research Institute of Agricultural Economics, Budapest, Hungary,Branko Mihailovic, Ph.D., Institute of Agricultural Economics, Belgrade, Serbia,Vesna Parausic, Ph.D., Institute of Agricultural Economics, Belgrade, Serbia,Vlado Kovacevic, Ph.D., Ministry of Agriculture, Belgrade, Serbia,Natasa Kljajic, Ph.D., Institute of Agricultural Economics, Belgrade, Serbia,Vladimir Zakic, Ph.D.,Faculty of Agriculture, Belgrade, Serbia, Boris Kuzman, Ph.D., Institute of Agricultural Economics, Belgrade, Serbia,Prof. Jovan Zubovic, Ph.D., Institute of Economic Sciences, Belgrade, Serbia,Zoran Simonovic, Ph.D., Institute of Agricultural Economics, Belgrade, Serbia,Prof. Zeljko Vojinovic, Ph.D., Independent university, Economic faculty, Banja Luka, Republika Srpska, Bosnia and Herzegovina,Svetlana Roljevic, Ph.D., Institute of Agricultural Economics, Belgrade, Serbia.

Economics of Agriculture, Year 64, No. 3 (861-1312) 2017, Belgrade
UDC 338.43:63 ISSN 0352-3462
ECONOMICS OF AGRICULTURE
CONTENT
1. Drago Cvijanović, Jelena Matijašević – Obradović, Sanja Škorić THE IMPACT OF AIR QUALITY CONDITIONED BY EMISSION OF POLUTTANTS TO THE DEVELOPMENT OF RURAL TOURISM AND POTENTIALS OF RURAL AREAS 871
2. Dejan Đurić, Jelena Ristić, Dragana Đurić, Ivana Vujanić EXPORT OF AGRICULTURAL AND FOOD PRODUCTS IN THE FUNCTION OF ECONOMIC GROWTH OF REPUBLIC OF SERBIA 887
3. Tamara Gajić, Aleksandra Vujko, Mirjana Penić, Marko D. Petrović, Milutin Mrkša SIGNIFICANT INVOLVEMENT OF AGRICULTURAL HOLDINGS IN RURAL TOURISM DEVELOPMENT IN SERBIA 901
4. Muuz Hadush EXPLORING FARMERS’ SEASONAL AND FULL YEAR ADOPTION OF STALL FEEDING OF LIVESTOCK IN TIGRAI REGION, ETHIOPIA 919
5. Mina Kovljenić, Mirko Savić FACTORS INFLUENCING MEAT AND FISH CONSUMPTION IN SERBIAN HOUSEHOLDS - EVIDENCE FROM SILC DATABASE 945
6. Bojan Krstić, Jelena Petrović, Tanja Stanišić, Ernad Kahrović ANALYSIS OF THE ORGANIC AGRICULTURE LEVEL OF DEVELOPMENT IN THE EUROPEAN UNION COUNTRIES 957
7. Mirjana Lukač Bulatović, Veljko Vukoje, Dušan Milić ECONOMIC INDICATORS OF THE PRODUCTION OF IMPORTANT FRUIT-SPECIFIC SPECIES IN VOJVODINA 973
8. Goran Maksimović, Božidar Milošević, Radomir Jovanović RESEARCH OF CONSUMERS’ ATTITUDES ON THE ORGANIC FOOD CONSUMPTION IN THE SERBIAN ENCLAVES IN KOSOVO 987
Economics of Agriculture, Year 64, No. 3 (861-1312) 2017, Belgrade
9. Ivan Mičić, Zoran Rajić, Jelena Živković, Dragan Orović, Marko Mičić, Ivana Mičić, Marija Mičić OPTIMAL FLOCK STRUCTURE OF PIG FARM PROVIDING MINIMUM COSTS 1003
10. Miroslav Miškić, Goran Ćorić, Danijela Vukosavljević BUILDING FINANCIAL AND INSURANCE RESILIENCE IN THE CONTEXT OF CLIMATE CHANGE 1019
11. Vladimir Njegomir, Ljubo Pejanović, Zoran Keković AGRICULTURAL ENTREPRENEURSHIP, ENVIRONMENTAL PROTECTION AND INSURANCE 1035
12. Nenad Perić, Andrijana Vasić Nikčević, Nenad Vujić CONSUMERS ATTITUDES ON ORGANIC FOOD IN SERBIA AND CROATIA: A COMPARATIVE ANALYSIS 1049
13. Branko Vučković, Branislav Veselinović, Maja Drobnjaković FINANCING OF PERMANENT WORKING CAPITAL IN AGRICULTURE 1065
14. Bahrija Kačar, Jasmina Curić, Selma Ikić ISLAMIC BANKS AND FINANCE AND THE POSSIBILITY OF AGRICULTURAL INVESTMENTS IN THE REPUBLIC OF SERBIA 1081
15. Aleksandar Damnjanović, Neđo Danilović, Erol Mujanović, Zoran Milojević NONLINEAR STOCHASTIC MODELLING DYNAMIC OF THE AGRICULTURAL PRODUCTS EXCHANGE RATES 1101
16. Filip Đoković, Radovan Pejanović, Miloš Mojsilović, Jelena Đorđević Boljanović, Katarina Plećić OPPORTUNITIES TO REVITALISE RURAL TOURISM THROUGH THE OPERATION OF AGRARIAN COOPERATIVES 1115
17. Aleksandar Jazić, Miloš Jončić THE IMPACT OF TRANSITION ON AGRICULTURE AND RURAL AREAS IN HUNGARY 1133
18. Vlado Kovačević, Mirjana Bojčevski, Biljana Chroneos Krasavac IMPORTANCE OF FEEDBACK INFORMATION FROM FARM ACCOUNTANCY DATA NETWORK OF THE REPUBLIC OF SERBIA 1147
Economics of Agriculture, Year 64, No. 3 (861-1312) 2017, Belgrade
19. Dalibor Krstinić, Nenad Bingulac, Joko Dragojlović CRIMINAL AND CIVIL LIABILITY FOR ENVIRONMENTAL DAMAGE 1161
20. Boris Kuzman, Nedeljko Prdić, Zoran Dobraš THE IMPORTANCE OF THE WHOLESALE MARKETS FOR TRADE IN AGRICULTURAL PRODUCTS 1177
21. Nadežda Ljubojev, Marijana Dukić Mijatović, Željko Vojinović LEGAL PROTECTION OF NEW PLANT VARIETIES IN THE REPUBLIC OF SERBIA 1191
22. Miodrag Mićović THE LEGAL NATURE AND THE FRAMEWORK FOR COOPERATIVE ACTIVITIES 1205
23. Lana Nastic, Todor Markovic, Sanjin Ivanovic ECONOMIC EFFICIENCY OF EXTENSIVE LIVESTOCK PRODUCTION IN THE EUROPEAN UNION 1219
24. Goran Paunovic, Dragan Solesa, Marko Ivanis SITE SELECTION OF THE CONSTRUCTION OF THE SYSTEM FOR THE PRODUCTION OF PASTA IN AP VOJVODINA 1231
25. Milan Počuča, Jelena Matijasevic - Obradovic, Bojana Draskovic CORRELATION BETWEEN THE AIR QUALITY INDEX SAQI_11 AND SUSTAINABLE RURAL DEVELOPMENT IN THE REPUBLIC OF SERBIA 1249
26. Jovanka Popov-Raljić, Milica Aleksić, Vesna Janković, Ivana Blešić, Milan Ivkov RISK MANAGEMENT OF ALLERGENIC FOOD INGREDIENTS IN HOSPITALITY 1263
27. Tanja Vujović, Sonja Vujović, Miloš Pavlović SOCIAL RESPONSIBILITY IN MARKETING OF THE FOOD INDUSTRY AND ITS DISTRIBUTORS 1277


871
Original scientific paper
EP 2017 (64) 3 (871-885)
Economics of Agriculture 3/2017UDC 502.3:613.15]:338.48-44(1-22)
THE IMPACT OF AIR QUALITY CONDITIONED BY EMISSION OF POLUTTANTS TO THE DEVELOPMENT OF RURAL TOURISM AND POTENTIALS OF RURAL AREAS
THE IMPACT OF AIR QUALITY CONDITIONED BY EMISSION OF POLUTTANTS TO THE DEVELOPMENT OF RURAL TOURISM AND
POTENTIALS OF RURAL AREAS
Drago Cvijanović1, Jelena Matijašević – Obradović2, Sanja Škorić3
Abstract
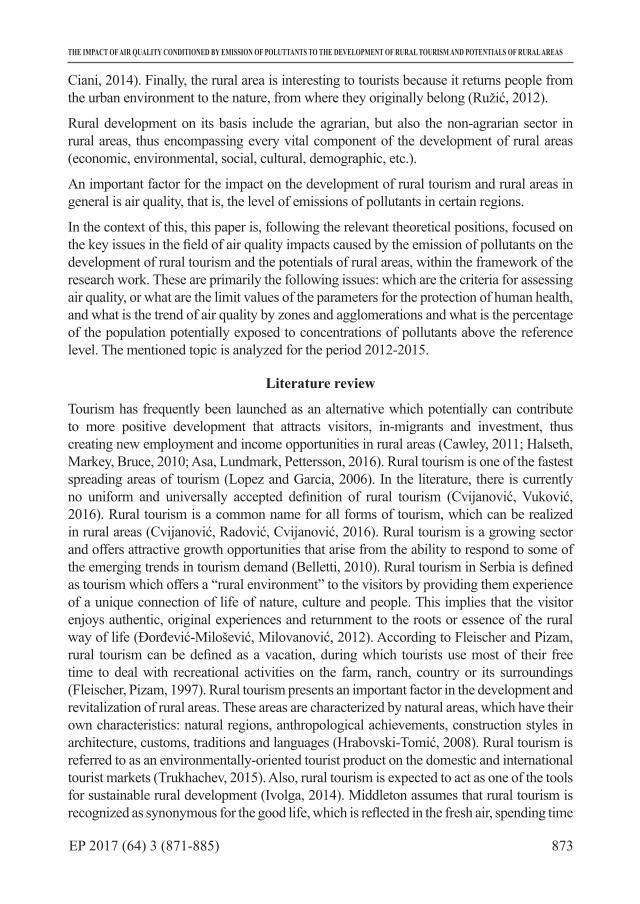
Significant potentials for tourism development in Serbia are related to rural areas. Rural development, on its basis, includes the agrarian, but also the non-agrarian sector in rural areas, thus encompassing every vital component of the development of rural areas. This paper is, following the relevant theoretical positions, focused on key issues in the field of air quality impacts caused by the emission of pollutants to the development of rural tourism and the potentials of rural areas. These are primarily the following issues: which are the criteria for assessing air quality, or what are the limit values of the parameters for the protection of human health, and what is the trend of air quality by zones and agglomerations and what is the percentage of the population potentially exposed to concentrations of pollutants above the reference level. The mentioned topic is analyzed for the period 2012-2015. Analysis of the results of the degree of emission of suspended particles by zones and agglomerations in Serbia is presented correlatively in conclusion with concluding reviews on the existing ecological potential for the development of the basic rural areas in Serbia - Vojvodina, which makes up 28% of the total area of Serbia, Central Serbia, which consists of 29% of the total area of Serbia and South Serbia, which accounts for 44% of the total area of Serbia.
Key words: air quality, ecological potential, emission of suspended particles, rural tourism, sustainable rural development.
JEL: F64, L83, O13, O18, O44, Q19.
1 Drago Cvijanovic Ph.D., Full Professor, Principal Research Fellow, Dean of Faculty of Hotel Management and Tourism in Vrnjacka Banja University of Kragujevac, Vojvođanska street no. 5a, Vrnjačka Banja 36 210, Serbia, Phone: +381 63 295 111; E-mail: [email protected]; [email protected]
2 Jelena Matijašević-Obradović Ph.D., Associate professor, Faculty of Law for Commerce and Judiciary in Novi Sad, Geri Karolja street no. 1, Novi Sad 21 000, Serbia, Phone: +381 60 065 2249, E-mail: [email protected]
3 Sanja Škorić Ph.D., Assistant professor, Faculty of Law for Commerce and Judiciary in Novi Sad, Geri Karolja street no. 1, Novi Sad 21 000, Serbia, Phone: +381 63 8219 788, E-mail: [email protected]

872 EP 2017 (64) 3 (871-885)
Drago Cvijanović, Jelena Matijašević – Obradović, Sanja Škorić
Introduction
Rural tourism is tourism of rural areas, whose basic resource is natural and healthy environment.
Tourism is generally considered in scientific literature as an industry that has a significant effect on the economic, social and functional structure of rural areas and as an essential factor in the revitalization and diversification of rural economy (Ristić, Vujičić and Leković, 2016). Significant potentials for the development of tourism in Serbia are related to rural areas, where organic production of food with an authentic note of the area from which it is produced can be further initiated. Considering that „as many as 75% of the world’s poor live in the rural areas and more than one-third of rural areas are in arid and semiarid regions” (Chaudhry, Gupta, 2010), one can certanly start with the attitude that „by introducing new non-agricultural activities (especially rural tourism), additional revenue can be generated and it would enable the improvement of quality of life and stop the demographic decline in rural areas“(Popesku, 2008). In this context rural tourism is identified as a tool for rural revitalization (Okech, Haghiri, George, 2012).
Rural areas in Serbia occupy about 85% of the territory inhabited by more than half of the total population (55%), with a population density of 63 inhabitants per square kilometer (according to the OECD, the area of up to 150 inhabitants per km2 is considered rural). In rural areas, most of the country’s natural resources are located (agricultural land, forests, water) with its rich ecosystems and biodiversity. According to the Strategy of Agriculture and Rural Development of the Republic of Serbia for the period 2014-2024. (Official Gazette of the Republic of Serbia, No. 85/2014) the positive improvement made in previous years in organic production, wine production, products with geographical origin and agro tourism is emphasized.
Rural areas are interested to tourists, because rural areas, among other things, provide tourists a great opportunity for fun and entertainment. According to the geographic, economic, social, infrastructural and other trends, one can notice a high differentiation level of the Serbian rural areas (Cvijanović, Mihailović, 2016). According to the list drawn up by the Council of Europe, tourism activities in the rural area are numerous (Ružić, 2012). Namely, in the mentioned list, over 30 tourist activities, which are classified into 7 groups, can be noticed, such as: tours, water activities (rivers and lakes), air activities, sports activities, activities of work processes, culture activities and health character activities (Demonja, Ružić, 2010). The two main outcomes offered by rural tourism: farm hosting, in which country homes were used to provide hospitality, and farm holidays, during which the tourist was placed in rural areas and participated actively in the rural lifestyle that had been preserved as a primary agricultural activity (Corner, Swarbrooke, 2004). According to a market research consumers choose rural tourism for the following reasons: be in contact with nature, feel free, sunbathing, being outdoors, do unusual things, make an holiday to rest and be quiet (Ohe, 2000; Fagioli, Diotallevi, Ciani, 2014). The characteristics of visitors, which can easily be extended to matters concerning rural tourism are: love for nature, pleasure of genuine things, desire for peace, taste for the new, ability to adapt (Fagioli, Diotallevi, and
873EP 2017 (64) 3 (871-885)
THE IMPACT OF AIR QUALITY CONDITIONED BY EMISSION OF POLUTTANTS TO THE DEVELOPMENT OF RURAL TOURISM AND POTENTIALS OF RURAL AREAS
Ciani, 2014). Finally, the rural area is interesting to tourists because it returns people from the urban environment to the nature, from where they originally belong (Ružić, 2012).
Rural development on its basis include the agrarian, but also the non-agrarian sector in rural areas, thus encompassing every vital component of the development of rural areas (economic, environmental, social, cultural, demographic, etc.).
An important factor for the impact on the development of rural tourism and rural areas in general is air quality, that is, the level of emissions of pollutants in certain regions.
In the context of this, this paper is, following the relevant theoretical positions, focused on the key issues in the field of air quality impacts caused by the emission of pollutants on the development of rural tourism and the potentials of rural areas, within the framework of the research work. These are primarily the following issues: which are the criteria for assessing air quality, or what are the limit values of the parameters for the protection of human health, and what is the trend of air quality by zones and agglomerations and what is the percentage of the population potentially exposed to concentrations of pollutants above the reference level. The mentioned topic is analyzed for the period 2012-2015.
Literature review
Tourism has frequently been launched as an alternative which potentially can contribute to more positive development that attracts visitors, in-migrants and investment, thus creating new employment and income opportunities in rural areas (Cawley, 2011; Halseth, Markey, Bruce, 2010; Asa, Lundmark, Pettersson, 2016). Rural tourism is one of the fastest spreading areas of tourism (Lopez and Garcia, 2006). In the literature, there is currently no uniform and universally accepted definition of rural tourism (Cvijanović, Vuković, 2016). Rural tourism is a common name for all forms of tourism, which can be realized in rural areas (Cvijanović, Radović, Cvijanović, 2016). Rural tourism is a growing sector and offers attractive growth opportunities that arise from the ability to respond to some of the emerging trends in tourism demand (Belletti, 2010). Rural tourism in Serbia is defined as tourism which offers a “rural environment” to the visitors by providing them experience of a unique connection of life of nature, culture and people. This implies that the visitor enjoys authentic, original experiences and returnment to the roots or essence of the rural way of life (Đorđević-Milošević, Milovanović, 2012). According to Fleischer and Pizam, rural tourism can be defined as a vacation, during which tourists use most of their free time to deal with recreational activities on the farm, ranch, country or its surroundings (Fleischer, Pizam, 1997). Rural tourism presents an important factor in the development and revitalization of rural areas. These areas are characterized by natural areas, which have their own characteristics: natural regions, anthropological achievements, construction styles in architecture, customs, traditions and languages (Hrabovski-Tomić, 2008). Rural tourism is referred to as an environmentally-oriented tourist product on the domestic and international tourist markets (Trukhachev, 2015). Also, rural tourism is expected to act as one of the tools for sustainable rural development (Ivolga, 2014). Middleton assumes that rural tourism is recognized as synonymous for the good life, which is reflected in the fresh air, spending time
874 EP 2017 (64) 3 (871-885)
Drago Cvijanović, Jelena Matijašević – Obradović, Sanja Škorić
in the natural environment and life in harmony with nature and the community (Midlleton, 1982). Rural tourism is based on the principles of sustainability and includes a range of activities and services that the rural population is organizing precisely on the basis of the elements that characterize these rural areas (Đorđević-Milošević, Milovanović, 2012). Accordingly, rural tourism creates economic and social benefits for countryside, and it is an effective means of saving nature, culture and tradition values (Ališauskas, Jankauskiene, 2008). In addition, the offer in rural tourism does not only include visible characteristics of nature, architecture, folk creations, gastronomy, but also those invisible, such as, for example, traditional hospitality, customs, culture of relations with nature, culture of communication, beliefs and legends of the local population of different nationalities and religions that have developed a specific way of life in a specific area (Đorđević-Milošević, Milovanović, 2012). According to Pourova (2002), rural tourism as the tourism evolving both outside recreation and tourism centres and outside of urban areas (Pourova, 2002; Šimkova, 2007).
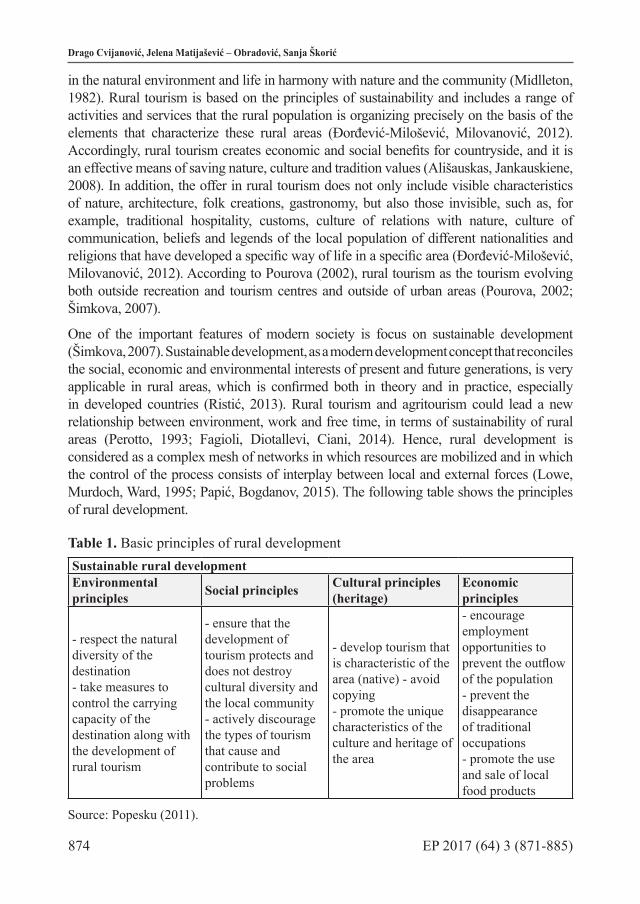
One of the important features of modern society is focus on sustainable development (Šimkova, 2007). Sustainable development, as a modern development concept that reconciles the social, economic and environmental interests of present and future generations, is very applicable in rural areas, which is confirmed both in theory and in practice, especially in developed countries (Ristić, 2013). Rural tourism and agritourism could lead a new relationship between environment, work and free time, in terms of sustainability of rural areas (Perotto, 1993; Fagioli, Diotallevi, Ciani, 2014). Hence, rural development is considered as a complex mesh of networks in which resources are mobilized and in which the control of the process consists of interplay between local and external forces (Lowe, Murdoch, Ward, 1995; Papić, Bogdanov, 2015). The following table shows the principles of rural development.
Table 1. Basic principles of rural developmentSustainable rural developmentEnvironmental principles Social principles Cultural principles
(heritage)Economic principles
- respect the natural diversity of the destination- take measures to control the carrying capacity of the destination along with the development of rural tourism
- ensure that the development of tourism protects and does not destroy cultural diversity and the local community- actively discourage the types of tourism that cause and contribute to social problems
- develop tourism that is characteristic of the area (native) - avoid copying- promote the unique characteristics of the culture and heritage of the area
- encourage employment opportunities to prevent the outflow of the population- prevent the disappearance of traditional occupations- promote the use and sale of local food products
Source: Popesku (2011).

875EP 2017 (64) 3 (871-885)
THE IMPACT OF AIR QUALITY CONDITIONED BY EMISSION OF POLUTTANTS TO THE DEVELOPMENT OF RURAL TOURISM AND POTENTIALS OF RURAL AREAS
It can be concluded that the sustainable development of rural tourism must be economically justified while preserving the natural, social and cultural characteristics of the tourist destination.
Namely, the versatile rural development implies demographic reconstruction, the use of available resources for the production of healthy food, the development of non-agricultural activities, urbanization in terms of infrastructure development, education, culture and preservation of the ecological environment. The concept of development of farm, small and medium enterprises, agro-production and agro-production, rural tourism, service activities of business cooperatives and advisory services is especially important (Veselinović, Ignjatijević, 2013).
Methodology and data sources used
The subject of the analysis in this paper are the key issues in the field of air quality impact caused by the emission of pollutants to the development of rural tourism and the potential of rural areas: criteria for assessing the quality of air, i.e. what are the limit values of parameters for the protection of human health, and what is the air quality trend by zones and agglomerations and how much percentage of the population is potentially exposed to concentrations of pollutants above the reference level. The survey will cover the four-year period - from 2012 to 2015.
In the theoretical part of the paper, the method of theoretical analysis of contents was primarily applied with the basic methods of concretization and specialization, while statistical and analytical-deductive methods were used in the research part of the paper, as well as the method of quantitative data analysis.
The research is based on official statistical data of Statistical Office of the Republic of Serbia.
Research results and discussion
In accordance with Article 5 of the Law on Air Protection (Official Gazette of RS, No. 36/2009 and 10/2013), the Decree on the Determination of Zones and Agglomerations (Official Gazette of the Republic of Serbia, Nos. 58/11 and 98/12) on the territory of the Republic of Serbia have been determined three zones and eight agglomerations (Popović et al., 2016; Popović et al., 2015; Popović et al., 2014; Popović et al., 2013):
- Zones: 1.) Zona „Serbia“, which includes the territory of the Republic of Serbia except the territories of the autonomous provinces, the city of Belgrade, the city of Niš, the city of Uzice, the city of Smederevo, the municipality of Kosjeric and the municipality of Bor; 2.) “Vojvodina” zone, which includes the territory of the Autonomous Province of Vojvodina except the territory of the cities of Novi Sad and Pancevo; 3.) The “Kosovo and Metohija” Zone, which includes the territory of the Autonomous Province of Kosovo and Metohija.
- Agglomerations: 1.) Agglomeration “Belgrade”, which includes the territory of the
876 EP 2017 (64) 3 (871-885)
Drago Cvijanović, Jelena Matijašević – Obradović, Sanja Škorić
city of Belgrade; 2.) Agglomeration “Novi Sad”, which includes the territory of the city of Novi Sad; 3.) Agglomeration “Niš”, which includes the territory of the city of Niš; 4.) “Bor” agglomeration, which includes the territory of the municipality of Bor; 5.) “Uzice” agglomeration, which includes the territory of the city of Uzice; 6.) “Kosjerić” agglomeration, which includes the territory of the municipality of Kosjerić; 7.) “Smederevo” agglomeration, which includes the territory of the city of Smederevo; 8.) The agglomeration “Pančevo”, which includes the territory of the town of Pančevo.
The assessment of air quality based on the measured concentrations of pollutants in the air is carried out using the criteria for the assessment of air quality in accordance with the Regulation on conditions for monitoring and air quality requirements (Official Gazette of RS, No. 11/2010, 75/2010 and 63 / 2013) (Popović et al., 2016).
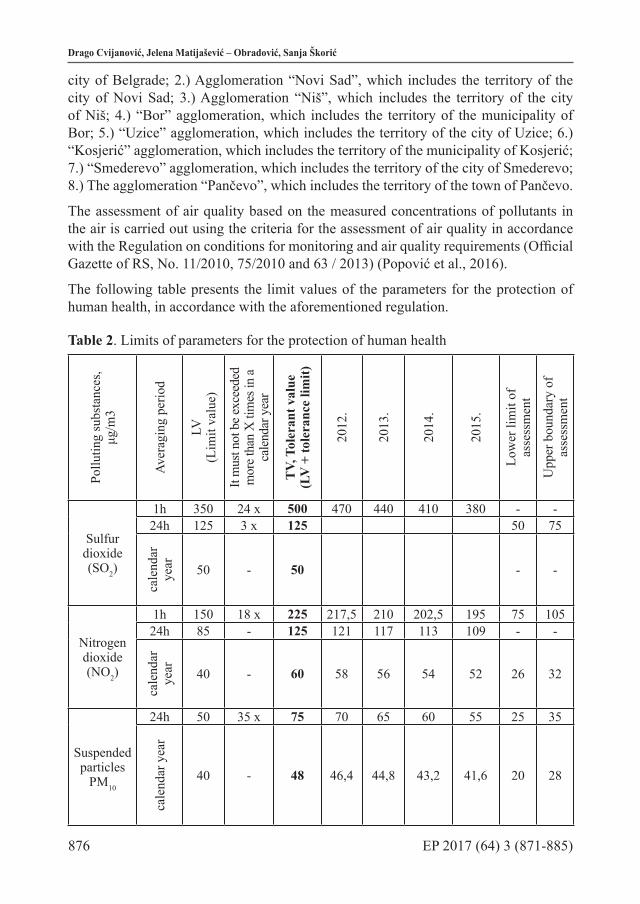
The following table presents the limit values of the parameters for the protection of human health, in accordance with the aforementioned regulation.
Table 2. Limits of parameters for the protection of human health
Pollu
ting
subs
tanc
es,
μg/m
3
Aver
agin
g pe
riod
LV(L
imit
valu
e)
It m
ust n
ot b
e exc
eede
d m
ore t
han
X ti
mes
in a
ca
lend
ar y
ear
TV,
Tol
eran
t val
ue(L
V +
tole
ranc
e lim
it)
2012
.
2013
.
2014
.
2015
.
Low
er li
mit
of
asse
ssm
ent
Upp
er b
ound
ary
of
asse
ssm
ent
Sulfur dioxide (SO2)
1h 350 24 x 500 470 440 410 380 - -24h 125 3 x 125 50 75
cale
ndar
ye
ar
50 - 50 - -
Nitrogen dioxide (NO2)
1h 150 18 x 225 217,5 210 202,5 195 75 10524h 85 - 125 121 117 113 109 - -
cale
ndar
ye
ar
40 - 60 58 56 54 52 26 32
Suspended particles
PM10
24h 50 35 x 75 70 65 60 55 25 35
cale
ndar
yea
r
40 - 48 46,4 44,8 43,2 41,6 20 28

877EP 2017 (64) 3 (871-885)
THE IMPACT OF AIR QUALITY CONDITIONED BY EMISSION OF POLUTTANTS TO THE DEVELOPMENT OF RURAL TOURISM AND POTENTIALS OF RURAL AREAS
Pollu
ting
subs
tanc
es,
μg/m
3
Aver
agin
g pe
riod
LV(L
imit
valu
e)
It m
ust n
ot b
e exc
eede
d m
ore t
han
X ti
mes
in a
ca
lend
ar y
ear
TV,
Tol
eran
t val
ue(L
V +
tole
ranc
e lim
it)
2012
.
2013
.
2014
.
2015
.
Low
er li
mit
of
asse
ssm
ent
Upp
er b
ound
ary
of
asse
ssm
ent
Suspended particles
PM2.5 cale
ndar
ye
ar 25 - 30 30 29,3 28,5 27,8 12,5 17,5
Ozon(O3)
8h max 120
25 x in the
year for 3 years
Carbon monoxide
(CO)
8h max 10000 - 16000 14800 13600 12400 11200 5000 7000
24h 5000 - 10000 9000 8000 7000 6000 - -
cale
ndar
ye
ar 3000 - - 3
Lead (Pb)
24h 1 - 1 - -
cale
ndar
ye
ar 0,5 - 1 0,9 0,8 0,7 0,6 0,25 0,35
Benzene (C6H6) ca
lend
ar
year 5 - 8 7 6,5 6 5,5 2
Source: Popović et al., (2016). Annual report on the air quality condition in the Republic of Serbia for 2015, Environmental Protection Agency, Belgrade, p. 13; Popović et al., (2015). Annual report on the air quality condition in the Republic of Serbia for 2014, Environmental Protection Agency, Belgrade, p. 18; Popović et al., (2014). Annual report on the air quality condition in the Republic of Serbia for 2013, Environmental Protection Agency, Belgrade, p. 19; Popović et al., (2013). Annual report on the air quality condition in the Republic of Serbia for 2012, Environmental Protection Agency, Belgrade, p. 13.
In accordance with the provisions of the Law on Air Protection, and according to the level of pollution, based on the prescribed limit and tolerance values, based on the results of the measurements, the following air quality categories are determined (Popović et al., 2016;

878 EP 2017 (64) 3 (871-885)
Drago Cvijanović, Jelena Matijašević – Obradović, Sanja Škorić
Popović et al., 2015; Popović et al., 2014; Popović et al., 2013):
1.) the first category - pure or slightly polluted air where the limit values of the level for one pollutant are not exceeded;
2.) the second category - moderately polluted air where the level limit values for one or more pollutants are exceeded but tolerant values for one pollutant are not exceeded not for one pollutant;
3.) the third category - excessively polluted air where tolerant values for one or more pollutants are exceeded.
The following table shows the trend of air quality by zones and agglomerations, and in line with previously clarified air quality categories for the period 2012-2015.
Table 3. Trend of air quality by zones and agglomerations for the period 2012-2015.
Population Categories of air quality2012 2013 2014 2015
ZON
ES
Serbia 2,818,693 I I I IThe City of Kragujevac 179,417 II III
The City of Valjevo 90,312 III III III III
Vojvodina 1,386,830 I I I IThe City of Sremska Mitrovica
79,940 II III
AG
GLO
MER
ATI
ON
S
Novi Sad 341,625 I I I IIBelgrade 1,659,440 III III II IIIPančevo 123,414 III I I IIISmederevo 108,209 III III IIIBor 48,615 III III III IIIKosjerić 12,090 III II IUžice 78,040 II III III IIINiš 260,237 II I I
Source: Popović et al., (2016). Annual report on the air quality condition in the Republic of Serbia for 2015, Environmental Protection Agency, Belgrade, p. 45; Popović et al., (2015). Annual report on the air quality condition in the Republic of Serbia for 2014, Environmental Protection Agency, Belgrade, p. 40; Popović et al., (2014). Annual report on the air quality condition in the Republic of Serbia for 2013, Environmental Protection Agency, Belgrade, p. 42.
By analyzing the data in Table 2, the limit values of the parameters for the protection of human health can be observed. Specifically, in accordance with Article 3 of the Regulation on the conditions for monitoring and air quality requirements (hereinafter: the Regulation), air quality requirements are, inter alia, the limit values of the levels of pollutants in the air; the upper and lower limits for assessing the level of pollutants in the air; the limits of tolerance and tolerance; concentrations dangerous to human health;

879EP 2017 (64) 3 (871-885)
THE IMPACT OF AIR QUALITY CONDITIONED BY EMISSION OF POLUTTANTS TO THE DEVELOPMENT OF RURAL TOURISM AND POTENTIALS OF RURAL AREAS
critical levels of pollutants in the air, etc. Article 7 of the Regulation regulates that the level of air pollution is monitored by measuring the concentrations for sulfur dioxide, nitrogen dioxide and nitrogen oxides, suspended particles (PM10, PM2.5), lead, benzene, carbon monoxide, terrestrial ozone, arsenic, cadmium, nickel and benzo(a)pyrene in the air by instruments for automatic measurement and/or sampling and their analysis. Air quality monitoring is also carried out at the basic rural locations outside the direct impact of significant sources of air pollution to provide, as a minimum, information on the total mass concentration and the chemical composition of the suspended particles (PM2.5) based on the annual average (Article 9 of the Regulation). Boundary and tolerant values are the basis for: 1) air quality assessment; 2) division of zones and agglomerations into categories based on the level of air pollution; 3) air quality management (Article 15, paragraph 4 of the Regulation). In zones and agglomerations where the level of pollutants below the limit values is determined in Table 1, it is necessary to keep the concentrations of pollutants at a level below the limit values in order to preserve the best air quality in accordance with the principles of sustainable development. For polluting substances for which the tolerance limit is not prescribed, their threshold value is taken as tolerant value (Article 15, paragraphs 2 and 3 of the Regulation).
When there is sufficient data available, exceeding the upper and lower limits of assessment are determined based on the concentrations recorded over the past five years. The margin of appreciation is deemed to be exceeded if overtime has occurred during at least three of the mentioned five years (Prologue VII Section B of the Regulation).
By analyzing the data from Table 3, the following conclusions can be made. In the agglomeration “Novi Sad”, the air was from 2012-2014. clean or slightly polluted, while in 2015 it transferred to the second category by pollution (moderately polluted), which indicates the growth trend of suspended particles in the last year shown. In the agglomeration “Belgrade”, air was excessively polluted in 2012, 2013 and 2015, and was only moderately polluted in 2014, indicating a trend of decreasing the growth of suspended particles during 2014. In the Pancevo agglomeration, air was excessively polluted in 2012 and 2015, while in 2013 and 2014 it was clean or slightly polluted, which indicates a trend of significant reduction in the growth of suspended particles during the mentioned two years. In the agglomeration “Smederevo”, air was polluted from 2012 to 2014, while in 2015 this agglomeration was not assessed. In the Bor agglomeration, the air was over-polluted in all four analyzed years, indicating a continuous emission trend and concentration of suspended particles in this area. In the Kosjeric agglomeration, air pollution was excessively polluted in 2012, moderately polluted in 2013, while air was either clean or slightly polluted in 2014, indicating a trend of decreasing the growth of suspended particles. In 2015, the agglomeration “Kosjerić” was not assessed In the “Užice” agglomeration, the air was moderately polluted in 2012, while in the period 2013-2015. it was excessively polluted, indicating a trend of increasing the growth of suspended particles in this area. In the agglomeration “Nis”, the air was moderately polluted in 2012, while in 2013 and 2014 it was clean or slightly polluted, which indicates a trend of decreasing the growth of suspended particles in this area. In 2015, the agglomeration

880 EP 2017 (64) 3 (871-885)
Drago Cvijanović, Jelena Matijašević – Obradović, Sanja Škorić
“Nis” has not been assessed.
If a review of the percentage of the population of the Republic of Serbia exposed to a different degree of air pollution in zones and agglomerations is made, the following conclusions can be drawn.
During 2015, 58.5% of the population of the Republic of Serbia had clean or slightly polluted air. In the same period, 36.2% of the population had air quality that required improvement. In 2015, there was an increase in the percentage of the population in category III again (Popović et al., 2016). During 2014, 68.8% of the population of the Republic of Serbia had clean or slightly polluted air. In the same period, 31.2% of the population had air quality that required improvement. In 2014, the percentage of population decreased in III, and increased in II category, which is a consequence of the transition of agglomeration Belgrade to the category of mild air pollution (Popović et al., 2015). In 2013, 28% of the population of the Republic of Serbia were potentially exposed to concentrations of pollutants above reference levels, above the limit and tolerant values (Popović et al., 2014). Observing the agglomerations in 2012, 74.16 population out of the total population in all eight agglomerations had air that belonged to category III after pollution.
Conclusion
Sustainable rural development depends on the practical application of the combination of the concept of multifunctional agriculture and the development of other economic activities in accordance with the available natural and human resources, the overall improvement of living conditions, as well as the socioeconomic position of villages and rural communities (Đorđević-Milošević, Milovanović, 2012). Certainly, air quality, as an important element of ecological capital, significantly influences the development of rural areas and rural tourism as activities that can greatly contribute to the development of the potential of rural areas.
Rural areas in Serbia are classified through a tripartite division, and include: 1.) the North Plains of Vojvodina, which makes up 28% of the total area of Serbia and 26% of its total population; 2.) Mountains and mountain regions of Central Serbia, which make up 29% of the total area of Serbia with 44% of its population, and 3.) The mountains and valleys of South Serbia, which account for 44% of the total area of Serbia (Đorđević-Milošević, Milovanović, 2012). If we look at the presented data for eight agglomerations in Serbia, classified in three categories, according to the degree of air pollution to agglomerations with clean or slightly polluted air, agglomerations with moderately polluted air, and agglomerations with excessively polluted air, we can realize that the percentage of suspended pollutant particles varied in agglomerations by years (2012-2015), and that the data indicate the following conclusions:
- agglomeration “Novi Sad” can be classified in a group of areas with mostly clean or slightly polluted air (in the period from 2012-2014, the air was clean or slightly polluted, while in 2015 it was transferred to another category by pollution - moderately polluted

881EP 2017 (64) 3 (871-885)
THE IMPACT OF AIR QUALITY CONDITIONED BY EMISSION OF POLUTTANTS TO THE DEVELOPMENT OF RURAL TOURISM AND POTENTIALS OF RURAL AREAS
air), which, from the aspect of air quality, is a significant potential for the development of rural areas in this part of Serbia;
- agglomerations “Pancevo”, “Kosjeric” and “Nis” can be classified in a group of areas with mostly moderately polluted air (in the agglomeration “Pancevo”, the air was excessively polluted in 2012 and 2015, while in 2013 and 2014, air was clean or slightly polluted; in the Kosjeric agglomeration, air pollution was excessively polluted in 2012, moderately polluted in 2013, while in 2014 air was clean or slightly polluted. In 2015, the Kosjerić agglomeration was not assessed; In the agglomeration “Nis”, the air was moderately polluted in 2012, while in 2013 and 2014 it was clean or slightly polluted. In 2015, the agglomeration Nis was not evaluated), which, from the aspect of air quality in these areas, is a solid potential for the development of rural areas in this part of Serbia, which still requires further improvements in further rural development;
- agglomerations “Smederevo”, “Bor”, “Belgrade” and “Uzice” can be classified in a group of areas with predominantly excessively polluted air (in agglomeration “Bor”, air was polluted over all four years analyzed; in agglomeration “Smederevo”, the air was polluted from 2012 to 2014, while in 2015 this agglomeration was not assessed; in the agglomeration “Belgrade “, the air was polluted in 2012, 2013 and 2015, and was only moderately polluted in 2014, while in the “Uzice” agglomeration, the air was moderately polluted in 2012, while in the period 2013 -2015 was over-polluted) which, observed from the aspect of air quality, is a factor that does not stimulate the development of rural areas in this part of Serbia, and in these agglomerations it is necessary to introduce a series of changes and improvements that will lead to a reduction in pollutant emissions, and enable better ecological potential in further stages of rural development.
Literature
1. Ališauskas, K., Jankauskiene, A. (2008): Kaimo pletros tendencijos Plunges rajone, Ekonomika ir vaduba: aktualijos ir perspektyvos, Vol. 2, No. 11, pp. 34-43, Šiaulių universitetas, Lietuva.
2. Asa, A., Lundmark, L., Pettersson, O. (2016): Public spending on rural tourism in Sweden, Fennia, Vol. 194, No. 1, pp. 18-31, Geographical Society of Finland, Finland.
3. Belletti, G. (2010): Ruralità e Turismo, Agriregionieuropa, Vol. 6, No. 20, Associazione “Alessandro Bartola”, Ancona.
4. Cawley, M. (2011): Adding value locally through integrated rural tourism: lessons from Ireland, Proceedings from the conference - The next rural economies: constructing rural place in global economies, Wallingford, England, pp. 89–101.
5. Chaudhry, P., Gupta, R. K. (2010): Urban greenery and its sustainable extension strategies in hot arid region of India. International Journal of Sustainable Society, Vol. 2, No. 2, pp. 146-155, Inderscience Publishers, United Kingdom.
6. Corner, S., Swarbrooke, J. (2004): International Cases in Tourism Management, Butterworth-Heinemann, Oxford, United Kingdom.
7. Cvijanović, D., Mihailović, B. (2016): Developmental aspects of the Rural Tourism

882 EP 2017 (64) 3 (871-885)
Drago Cvijanović, Jelena Matijašević – Obradović, Sanja Škorić
in Serbia, Proceedings from the conference - Tourism in function of Development of the Republic of Serbia - Spa Tourism in Serbia and Experiences of Other Countries, Vrnjačka Banja, The Republic of Serbia, pp. 1-16.
8. Cvijanović, D., Radović, G., Cvijanović, G. (2016): Resources and the Rural Tourism Development in the Republic of Serbia, Proceedings from the conference - Horizons, Bitola, The Republic of Macedonia, Vol. 20, pp. 41-52.
9. Cvijanović, D., Vuković, P. (2016): Perspectives of Sustainable Tourism Development of Smederevo, Agricultural Bulletin of Stavropol Region, Vol. 24, No. 4, pp. 14-16, Stavropol State Agrarian University, Stavropol, Russia.
10. Demonja, D., Ružić, P. (2010): Ruralni turizam u Hrvatskoj s primjerima dobre prakse i europskim iskustvima, Meridijani Samobor, Zagreb, Republika Hrvatska.
11. Đorđević Milošević S., Milovanović J. (2012): Održivi turizam u funkciji ruralnog razvoja - Mala poljoprivredna gazdinstva i ruralni turizam u Srbiji, Fakultet za primenjenu ekologiju Futura Univerziteta Singidunum, Beograd, Republika Srbija; Agroznanje, Vršac, Republika Srbija; FAO, Budimpešta, Republika Mađarska.
12. Fagioli, F. F., Diotallevi, F., Ciani, A. (2014): Strengthening the sustainability of rural areas: the role of rural tourism and agritourism, Rivista di Economia Agraria, Vol. 69, No. 2-3, pp. 155-169, Firenze University Press, Firenze, Italia.
13. Fleischer, A., Pizam, A. (1997): Rural tourism in Israel, Tourism Management, Vol. 18, No. 6, pp. 367-372, Elsevier, Amsterdam, The Nederlands.
14. Halseth, G., Markey, S., Bruce, D. (2010): The next rural economies: constructing rural place in global economies, CABI Publishing, Wallingford, England.
15. Hrabovski Tomić, E. (2008): Selektivni oblici turizma, Fakultet za uslužni biznis, Sremska Kamenica, Republika Srbija.
16. Ivolga, A. (2014): Overview of contemporary issues of sustainable rural development in Russia in terms of existing differences between regions, Economics of Agriculture, Vol. 61, No. 2, pp. 331-345, Institute of Agricultural Economics, Belgrade, The Republic of Serbia.
17. Lopez, E. P., Garcia, F. J. C. (2006): Agrotourism, Sustainable Tourism and Ultraperipherial Areas: The Case of Canary Islands, PASOS - Revista de Turismo y Patrimonio Cultural, Vol. 4, No. 1, pp. 85-97, The Institute for Social and Tourism Research of University of La Laguna and The University Institute of Maia-ISMAI, Islas Canarias, Spain.
18. Lowe, P., Murdoch, J., Ward, N. (1995): Networks in rural development beyond exogenous and endogenous models, in Book - Beyond modernization: The impact of endogenous rural development, Vol. 1, pp. 87-106, Van Gorcum, Assen, Netherlands.
19. Midlleton, T.C.V. (1982): Tourism in rural areas, Tourism Management, Vol. 3, No. 1, pp. 52-58, Elsevier, Amsterdam, The Nederlands.
20. Okech, R., Haghiri, M., George, P. B. (2012): Rural tourism as a sustainable development alternative: an analysis with special reference to Luanda, Kenya, Cultur,

883EP 2017 (64) 3 (871-885)
THE IMPACT OF AIR QUALITY CONDITIONED BY EMISSION OF POLUTTANTS TO THE DEVELOPMENT OF RURAL TOURISM AND POTENTIALS OF RURAL AREAS
Vol. 6, No. 3, pp. 36-54, Universidade Estadual de santa Cruz, Brasil.21. Ohe, Y. (2000): On-farm Tourism Activity and Attitudes of the Operators: A Hiroshima-
Umbria Comparative Case Study, The Technical Bulletin of Faculty of Horticulture, Vol. 54, pp. 73-80, Chiba University, Japan.
22. Papić, R., Bogdanov, N. (2015): Rural Development Policy – a perspective of local actors in Serbia, Economics of Agriculture, Vol. 62, No. 4, pp. 1079-1093, Institute of Agricultural Economics, Belgrade, The Republic of Serbia.
23. Perotto P.G. (1993): Il paradosso dell’economia; Manuale di rivoluzione cultural, Franco Angeli, Milano, Italia.
24. Popesku, J. (2008): Održivi turizam, u Brošuri - Ruralni razvoj i ruralni turizam, pp. 9-13, Agromreža, Novi Sad, Republika Srbija.
25. Popesku, J. (2011): Sustainable development of rural tourism, Taiex, Chamber of Commerce, Belgrade, The Republic of Serbia, (available at: http://www.kombeg.org.rs/Slike/UdrTurizam/2011/novembar/TAIEX/Prezentacije/Beograd.pdf).
26. Popović, T., Knežević, J., Jović, B., Marić-Tanasković, L., Dimić, B. (2016): Annual report on the air quality condition in the Republic of Serbia for 2015, Environmental Protection Agency, Ministry of Agriculture and Environmental Protection, Belgrade, The Republic of Serbia.
27. Popović, T., Jović, B., Marić-Tanasković, L., Knežević, J., Dimić, B. (2015): Annual report on the air quality condition in the Republic of Serbia for 2014, Environmental Protection Agency, Ministry of Agriculture and Environmental Protection, Belgrade, The Republic of Serbia.
28. Popović, T., Jović, B., Marić-Tanasković, L., Knežević, J., Mitrović Josipović, M., Dimić, B. (2014): Annual report on the air quality condition in the Republic of Serbia for 2013, Environmental Protection Agency, Ministry of Agriculture and Environmental Protection, Belgrade, The Republic of Serbia.
29. Popović, T., Jović, B., Marić-Tanasković, L., Knežević, J., Đorđević, D., Dimić, B. (2013): Annual report on the air quality condition in the Republic of Serbia for 2012, Environmental Protection Agency, Ministry of Agriculture and Environmental Protection, Belgrade, The Republic of Serbia.
30. Pourová, M. (2002): Agroturistika, Credit, Prague, Czech Republic.31. Regulation on determining zones and agglomerations, Official Gazette, The Republic
of Serbia, No. 58/2011 and 98/2012.32. Regulation on monitoring conditions and air quality requirements, Official Gazette,
The Republic of Serbia, No. 11/2010, 75/2010 and 63/2013.33. Ristić, L. (2013): Strazegijsko upravljanje održivim ruralnim razvojem u Republici
Srbiji, Ekonomski horizonti, Vol. 15, No. 3, pp. 229-243, Ekonomski fakultet Univerziteta u Kragujevcu, Kragujevac, Republika Srbija.
34. Ristić, L., Vujičić, M., Leković, M. (2016): Tourism as a factor of Ssustainable Development of rural areas belonging to Rudnička Morava, Economics of Agriculture,
884 EP 2017 (64) 3 (871-885)
Drago Cvijanović, Jelena Matijašević – Obradović, Sanja Škorić
Vol. 63, No. 2, pp. 665-680, Institute of Agricultural Economics, Belgrade, The Republic of Serbia.
35. Ružić, P. (2012): Analiza posebnosti i percepcije ruralnog turizma Istre, Ekonomska misao i praksa, Vol. 21, No. 1, pp. 217-238, Univerzitet u Dubrovniku, Dubrovnik, Republika Hrvatska.
36. Strategija poljoprivrede i ruralnog razvoja Republike Srbije za period 2014-2024. godine, Službeni glasnik, Republika Srbija, no. 85/2014.
37. Šimkova, E. (2007): Strategic approaches to rural tourism and sustainable development of rural areas, Agricultural Economics, Vol. 53, No. 6, pp. 263-270, Czech Academy of Agricultural Sciences, Prague, Czech Republic.
38. The Law on Air Protection, Official Gazette, The Republic of Serbia, No. 36/2009 and 10/2013.
39. Trukhachev, A. (2015): Methodology for Evaluating the Rural Tourism Potentials: A Tool to Ensure Sustainable Development of Rural Settlements, Sustainability, Vol. 7, No. 3, pp. 3052-3070, MDPI Publishing Services, Basel, Switzerland.
40. Veselinović, J., Ignjatijević, S. (2013): Pravni okvir i ekonomske mere za unapređenje agroturizma, Zbornik radova sa konferencije - Planska i normativna zaštita prostora i životne sredine, Subotica - Palić, Republika Srbija, pp. 145-150.
885EP 2017 (64) 3 (871-885)
THE IMPACT OF AIR QUALITY CONDITIONED BY EMISSION OF POLUTTANTS TO THE DEVELOPMENT OF RURAL TOURISM AND POTENTIALS OF RURAL AREAS
UTICAJ KVALITETA VAZDUHA USLOVLJENOG EMISIJOM ZAGAĐUJUĆIH MATERIJA NA RAZVOJ RURALNOG TURIZMA I
POTENCIJALA RURALNIH PODRUČJA
Drago Cvijanović4, Jelena Matijašević – Obradović5, Sanja Škorić6
Apstrakt
Značajni potencijali za razvoj turizma u Srbiji tiču se upravo ruralnih područja. Ruralni razvoj u svojoj osnovi obuhvata agrarni, ali i neagrarni sektor u ruralnim područjima, te time obuhvata svaku vitalnu komponentu razvoja ruralnih područja. U radu je nakon relevantnih teorijskih stavova, pažnja usmerena na ključna pitanja u oblasti uticaja kvaliteta vazduha uslovljenog emisijom zagađujućih materija na razvoj ruralnog turizma i potencijala ruralnih područja. To su prevashodno sledeća pitanja: koji su kriterijumi za ocenjivanje kvaliteta vazduha, odnosno šta su i kolike su granične vrednosti parametara za zaštitu zdravlja ljudi, te kakav je trend kvaliteta vazduha po zonama i aglomeracijama i koliki je procenat stanovništva potencijalno izložen koncentracijama zagađujućih materija iznad referentnog nivoa. Pomenuta tematika analizirana je za period 2012.-2015. godina. Analiza rezultata o stepenu emisije suspendovanih čestica po zonama i aglomeracijama u Srbiji, u zaključku je korelativno predstavljena sa zaključnim osvrtima na postojeći ekološki potencijal za razvoj osnovnih ruralnih oblasti u Srbiji - Vojvodine, koja čini 28% ukupne površine Srbije, Centralne Srbije, koji čine 29% ukupne površine Srbije i Južne Srbije, koja čini 44% ukupne površine Srbije.
Ključne reči: kvalitet vazduha, ekološki potencijal, emisija suspendovanih čestica, ruralni turizam, održivi ruralni razvoj.
4 Redovni profesor, dr Drago Cvijanović, Dekan Fakulteta za hotelijerstvo i turizam u Vrnjačkoj Banji, Univerzitet u Kragujevcu, Vojvođanska ulica br. 5a, 36210 Vrnjačka Banja, Srbija, Telefon: +381 63 295 111; E-mail: [email protected]; [email protected]
5 Vanredni profesor, dr Jelena Matijašević-Obradović, Pravni fakultet za privredu i pravosuđe u Novom Sadu, Ulica Geri Karolja br. 1, Novi Sad, Srbija, Telefon: +381 60 065 2249, E-mail: [email protected].
6 Docent, dr Sanja Škorić, Pravni fakultet za privredu i pravosuđe u Novom Sadu, Ulica Geri Karolja br. 1, Novi Sad, Srbija, Telefon: +381 63 8219 788, E-mail: [email protected].


887
Original scientific paper Economics of Agriculture 3/2017UDC: 339.564:338.439(497.11)
EP 2017 (64) 3 (887-900)
EXPORT OF AGRICULTURAL AND FOOD PRODUCTS IN THE FUNCTION OF ECONOMIC GROWTH OF REPUBLIC OF SERBIA
EXPORT OF AGRICULTURAL AND FOOD PRODUCTS IN THE FUNCTION OF ECONOMIC GROWTH OF REPUBLIC OF SERBIA
Dejan Đurić1, Jelena Ristić2, Dragana Đurić3, Ivana Vujanić4
Summary
A low export activity and a high level of trade deficit are negative features of the Serbian trade with foreign countries in the long run. Considering the state of foreign trade flows of our country, it is clear that the increase in exports of goods and services is emerging as one of the most important tasks of economic policy in the years to come. In this sense, the main goal of this work is the understanding of the importance of the agricultural and food products sector in foreign trade of Republic of Serbia, as well as proposing of measures to be taken towards encouraging export and raising competitiveness of the sector in the international market.
Agricultural and food sector can significantly contribute to reduction of the trade deficit and boost the export activities of the national economy. However, the potentials of this sector have not yet been fully utilized. Although exports of agricultural and food sector have a dominant position in the structure of domestic exports, its competitiveness is still at a low level, and the increase of competitiveness and the degree of processing of these products stand out as the key challenges in the future.
Key words: export, agricultural and foodsector, globalization, international competivness
JEL: Q17, F49
1 Dejan Đurić, Ph.D., Professor, Business School of Applied Studies Novi Sad, Vladimira Perića Valtera Street, no. 4, 21000 Novi Sad, Republic of Serbia, Phone: +381 63 80 57 420; E-mail:[email protected]
2 Jelena Ristić, Ph.D., Professor, Business School of Applied Studies Blace, Kralja Petra I Street, no. 70, 18420 Blace, Republic of Serbia, +381 63 404 202; E-mail:[email protected]
3 Dragana Đurić, Ph.D., Professor, Business School of Applied Studies Blace, Kralja Petra I Street, no. 70, 18420 Blace, Republic of Serbia, +381 65 80 57 420; E-mail:[email protected]
4 Ivana Vujanić, Ph.D. student at the European University in Belgrade, Faculty of European Business and Marketing, Carigradska no. 28, Belgrade, Serbia Phone: +381 62 979 28 66, E-mail: [email protected]

888 EP 2017 (64) 3 (887-900)
Dejan Đurić, Jelena Ristić, Dragana Đurić, Ivana Vujanić
Introduction
Contemporary international economic environment is characterized by the globalization process of national and regional markets as a result of accelerated internationalization in the global plan. Intensive technological changes and the general scientific progress constantly strengthen the intensity of the globalization process so that it becomes the dominant economic and political phenomenon of the modern world.
National markets cannot be isolated from foreign competition in modern international economic relations to, so that countries and companies need a new approach to inclusion into the globalized and competitive economic environment. The globalization of the world economy imposes the need for all countries to be more intensively involved in international trade flows, i.e. the exchange of goods, services, labor and capital. Adjustement to the challenges of globalization is an important task for all countries to be able to fulfill their primary economic objective, and that is the growth of living standards of all citizens. In this regard, strengthening export activity is emerging as one of the most important conditions for increasing the economic activity of a country.
Agricultural and food sector has a very important role in the economic development of Republic of Serbia, considering that it significantly participates in the structure of domestic exports. Serbia has the potential for production and processing of high quality and healthy products and development of conventional, integral and organic agricultural production for the needs of the domestic market and export (Cvijanović et al., 2016). In this regard, the creation of a competitive agricultural and food sector can greatly contribute to strengthening the overall competitiveness of the domestic economy and its active participation in the international exchange of goods. There are chances for intensifying export activities of this sector above all, thanks to the available natural and human resources, as well as the relatively high level of agricultural techniques and technologies. Due to the scientific and technological revolution, especially from the middle of the last century on, there have been certain changes in the agricultural activity by its mechanization and usage of chemical substances, which relates to the contents and kind of work in the agriculture...(see: Cvijanović et al., 2013). However, there are serious limitations, such as low level of labor productivity, inadequate agricultural policy and insufficient investments in the sector of agriculture.
Methodology
Theoretical elaboration and the goals have influenced the authors of this paper to use the descriptive, comparative-historical and analytical-synthetical methodology, whereby an attempt was made to consider and understand the problem. Moreover, the analysis of the contetnt of the adopted documents and the results of previous research was used. The basic data sources are represented by the statistics of the external trade. Materials of the Ministry of Finances of Republic of Serbia, Chamber of Commerce of Serbia, Statistical Office of Republic of Serbia and other relevant sources.
889EP 2017 (64) 3 (887-900)
EXPORT OF AGRICULTURAL AND FOOD PRODUCTS IN THE FUNCTION OF ECONOMIC GROWTH OF REPUBLIC OF SERBIA
The need to strengthen the export activities of the tradable goods sector
Republic of Serbia, as a relatively small country with an underdeveloped economy and scarce development resources must be export-oriented, with a developed tradable sector (agriculture and industry). The Serbian economy is not only uncompatitive due to the lack of sufficient high quality products to be launched on foreigh markets, but due to the state’s non activities, while the unioins do not support the employers sufficiently in their claims for a better economic environment (Cvijanović, Mihailović, 2012). In such a country there is a need for an increase in exports due to the following reasons:
- the limitations of the domestic market cannot provide the economies of scale, and thus one of the most important conditions for strengthening the competitive position of domestic companies on the world market;
- lack of basic production inputs and the necessity of meeting the needs of all citizens, through purchase of goods and services, will inevitably lead to the growth of imports, which also increases the need for greater exports to the foreign trade sector to be held in balance. A small country cannot provide a range of goods wide enough and therefore has to import and provide the required level of exports for payments of imports.
Considering the importance of export for Republic of Serbia, it is obvious that witout its growth Republic of Serbia cannot realize its basic economic goals. In that sense, the main task of economic policy in the forthcoming period is the increase of exports in order to:
- Increase production and thus the employment and the living standards of the citizens;
- Provide macro economic stability by the reduction of sensitivity of economic growth depending on the inflow of capital;
- Enable regular service of external debt (Strategy of increasing exports of Republic of Serbia for the period from 2008 to 2011).
To continuously achieve high rates of economic growth and a constant increase in gross domestic product and the standard of living, Serbia must constantly and rapidly increase its exports. The increase in export revenue is an important condition for service foreign debt and provide financing for the import of equipment and technology, and that means a prerequisite for economic development in the years to come. The projected dynamic growth of external debt payment shows that in the future for regular servicing of debt obligations an increased share of GDP will be allocated.
The economy of Serbia in the period after 2000 achieved a relatively high level of foreign currency reserves. However, with the increase in debt repayments falling due in the coming years, the pressure on foreign exchange reserves will grow, so it is necessary to insist on the augmentation of exports as the best way of financing the deficit of the trade balance. Also, one should not underestimate the fact that foreign exchange inflows from remittances of our workers abroad cannot be indefinitely increased, that based on exchange operations foreign exchange inflows cannot be indefinitely increased, so that in the long term, only the increase of exports and reduction of trade deficit can provide

890 EP 2017 (64) 3 (887-900)
Dejan Đurić, Jelena Ristić, Dragana Đurić, Ivana Vujanić
a satisfactory basis for regular servicing of foreign debts without compromising the country’s external liquidity.
The increase in exports of goods and services in GDP is imposed as one of the most important tasks of economic policy in the coming years. This task is especially important because of the need to ensure a stable foreign currency income which will be sufficient for regular servicing of foreign liabilities, as well as payment of necessary imports. In order to achieve this, it is necessary to work towards achieving qualitative changes in the structure of domestic exports and to adapt global demand for imports. This means that the increase in exports at the same time must be accompanied by qualitative structural changes in exports, due to the fact that the national export is now too much based on primary products and products of lower processing phase. Such export structure does not promise a permanent and long-term growth rate of exports.
The basic measure of the competitiveness of modern economies is the ability of companies, industries and sectors of the economy to lower operating costs and development and thus achieve economic competitiveness, i.e. competitiveness on the basis of price, and the ability of companies, industries and sectors of the economy to improve performances of products and services, above all, quality, functions and after-sales service. Based on this criteria, the majority of the Serbian economy has no satisfactory ability to reduce costs and improve product quality and, consequently, does not reach the necessary economic and technological competitiveness in domestic and foreign markets (Đurić, 2007). In this regard, the fundamental problems of low competitiveness of domestic exports can be resolved only by entrepreneurs, innovators and investors in a stimulating economic environment. On these grounds, the production, export and technological performance of the Serbian economy would be improved and the level of its international competitiveness would be raised.
Export growth in the long term implies an increase in competitiveness of the economy based on productivity growth, wage growth in line with productivity growth as well as a real exchange rate that reflects the strength of the economy. Also, any Serbian company must see its comparative advantages and potentials and work on developing its own strategies of competitiveness in regional and global markets, and this necessarily means an increase in added value products or services. The key instruments for achieving these objectives are the application of knowledge and innovation in product development, design application, investment in new technologies and distribution channels.
The formation of clusters is, for example, one of the possibilities to increase Serbian exports, particularly to large markets that need large quantities of certain goods (especially in agriculture). More companies should produce the same products at the same given the standards required by the market that they are intended to. The formation of regional clusters is one of the measures of the regional development of Serbia and the way to formation of local brands. The possibility that the higher forms of cooperation with countries with developed economies should be considerd and thus take advantage of the preferential status of our goods to the Russian market and other markets (Nikolić, 2014).
891EP 2017 (64) 3 (887-900)
EXPORT OF AGRICULTURAL AND FOOD PRODUCTS IN THE FUNCTION OF ECONOMIC GROWTH OF REPUBLIC OF SERBIA
Special importance to reduce the foreign trade imbalance in the coming period will have a high inflow of foreign direct investments, especially greenfield investments in export-oriented sectors of the economy in which they need to increase productivity, exports and foreign exchange inflows. These sectors strengthen the export offer and reduce import demand and consequently improve the balance of payments position of the country and lead the financing of the current account deficit without increase of government borrowing. A key role in this is the inflow of foreign direct investments into the tradables sector.
Scope and dynamics of foreign trade flows after 2000
As a result of the re-inclusion of our country in the international economic environment there was a revival of foreign trade activities in Serbia after 2000. The long isolation from the world market and the inability to come up with necessary products caused a strong need for dynamic import of goods and services, which led to an increase in trade deficit and current account deficit.
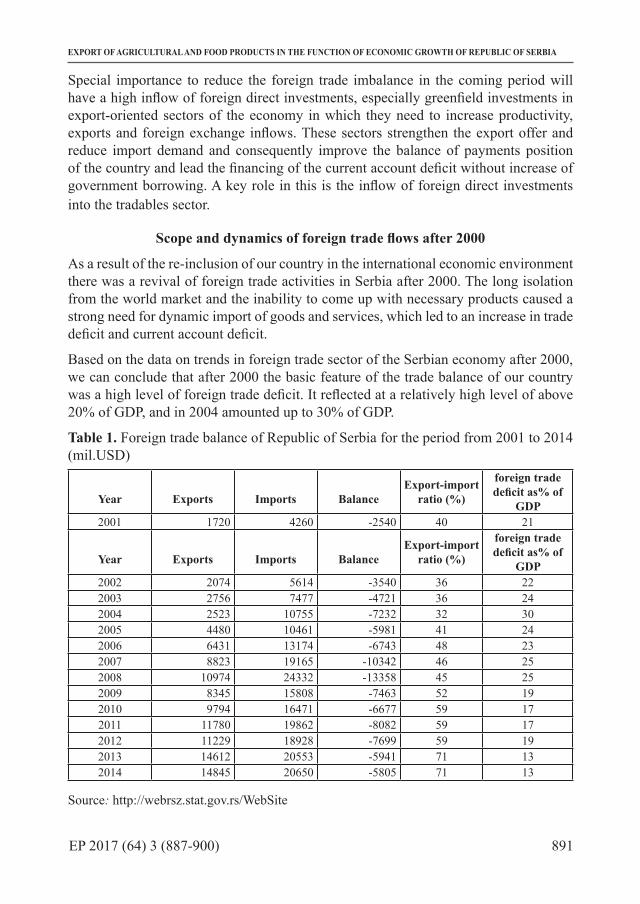
Based on the data on trends in foreign trade sector of the Serbian economy after 2000, we can conclude that after 2000 the basic feature of the trade balance of our country was a high level of foreign trade deficit. It reflected at a relatively high level of above 20% of GDP, and in 2004 amounted up to 30% of GDP.
Table 1. Foreign trade balance of Republic of Serbia for the period from 2001 to 2014 (mil.USD)
Year Exports Imports BalanceExport-import
ratio (%)
foreign trade deficit as% of
GDP2001 1720 4260 -2540 40 21
Year Exports Imports BalanceExport-import
ratio (%)
foreign trade deficit as% of
GDP2002 2074 5614 -3540 36 222003 2756 7477 -4721 36 242004 2523 10755 -7232 32 302005 4480 10461 -5981 41 242006 6431 13174 -6743 48 232007 8823 19165 -10342 46 252008 10974 24332 -13358 45 252009 8345 15808 -7463 52 192010 9794 16471 -6677 59 172011 11780 19862 -8082 59 172012 11229 18928 -7699 59 192013 14612 20553 -5941 71 132014 14845 20650 -5805 71 13
Source: http://webrsz.stat.gov.rs/WebSite

892 EP 2017 (64) 3 (887-900)
Dejan Đurić, Jelena Ristić, Dragana Đurić, Ivana Vujanić
Based on the movement of foreign trade flows in recent years, we can see that the share of goods exports almost continuously increases, which, along with the stabilization of the share of goods imports, led to a substantial decline in the share of foreign trade deficit. However, this does not at all mean that there has been a significant improvement in export activities in our country. It can be concluded on the basis that the export of Serbia in relation to GDP is still considerably lower than in similar countries of Central Europe. While in Serbia, export of goods and services in 2014 amounted up to 44% of GDP, the share of exports in GDP in countries of similar size (Bulgaria, the Czech Republic and Hungary), in the same year was about 80%. Starting from the level of external debt of the country and the need to import raw materials and intermediate goods for domestic production, export ratio could have reached a value above 50% of GDP (Ministry of Finance of Republic of Serbia). Therefore, Serbia has a great potential for growth in exports and reduction of the trade deficit on this basis. In addition, export growth is a key drive of sustainable growth of the Serbian economy in the coming years, and double-digit growth rates of exports would be a signal that Serbia is on a sustainable path of growth (Quarterly Monitor, 2015).
Considering the fact that from the standpoint of the economic interests of our country it is very important to intensify and strengthen the export competitiveness of the economy at the global level, in the next part we pay the attention to the economic importance of the agricultural and food sector as a development opportunity of the domestic economy.
Dynamics of foreign trade of agricultural and food products
The agricultural sector has a significant share in the total foreign trade, and the results achieved in this sector can influence the improvement of foreign trade balance and balance of the total national economy (Katić, Popović, 2007). As noted earlier, the basic feature of the trade balance of our country after 2000 is a high level of foreign trade deficit. However, unlike the other sectors, the sector of agricultural food products in the overall structure of goods exchange has a positive balance, causing a decrease of the total trade balance deficit and contributes to the overall macro-economic stability.
Table 2. Foreign trade agricultural exchange of Serbia (mil.EUR); 2008-20132008 2009 2010 2011 2012 2013
Export 1,336 1,395 1,700 1,956 2,131 2,104Import 1,056 991 819 1,053 1,221 1,177
Source: Statistical Office of the Republic of Serbia
The largest trade balance was recorded in 2013 and it amounted 927 million euros, which is 2% higher than the surplus achieved in 2012 (910 million euros). Foreign trade of agricultural and food products in the observed years is in a constant rise (Report on the state of agriculture in Republic of Serbia in 2013). The share of agriculture in total export value of the Serbian economy is about 23% higher than the share of agriculture in imports, in some years, even triple.
893EP 2017 (64) 3 (887-900)
EXPORT OF AGRICULTURAL AND FOOD PRODUCTS IN THE FUNCTION OF ECONOMIC GROWTH OF REPUBLIC OF SERBIA
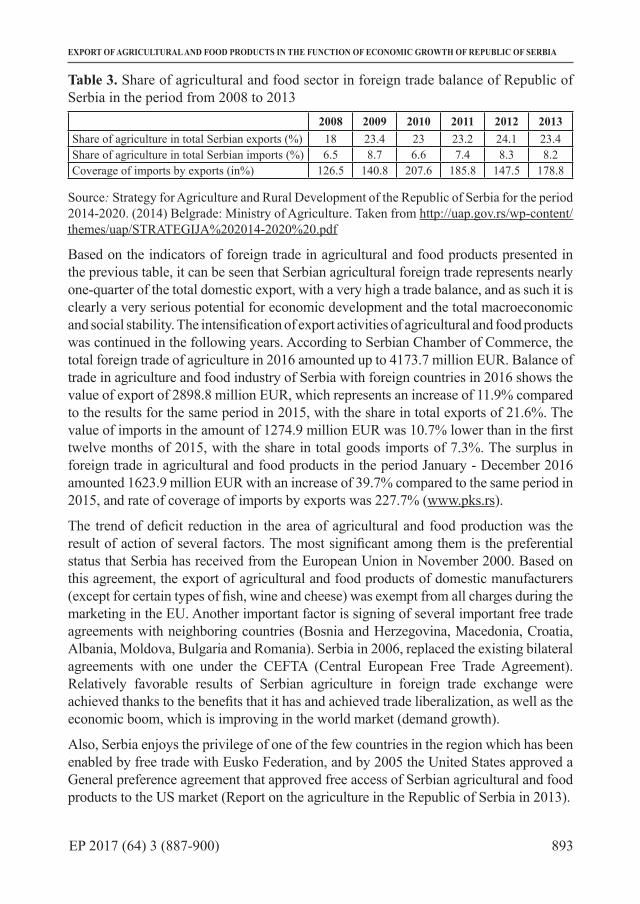
Table 3. Share of agricultural and food sector in foreign trade balance of Republic of Serbia in the period from 2008 to 2013
2008 2009 2010 2011 2012 2013Share of agriculture in total Serbian exports (%) 18 23.4 23 23.2 24.1 23.4Share of agriculture in total Serbian imports (%) 6.5 8.7 6.6 7.4 8.3 8.2Coverage of imports by exports (in%) 126.5 140.8 207.6 185.8 147.5 178.8
Source: Strategy for Agriculture and Rural Development of the Republic of Serbia for the period 2014-2020. (2014) Belgrade: Ministry of Agriculture. Taken from http://uap.gov.rs/wp-content/themes/uap/STRATEGIJA%202014-2020%20.pdf
Based on the indicators of foreign trade in agricultural and food products presented in the previous table, it can be seen that Serbian agricultural foreign trade represents nearly one-quarter of the total domestic export, with a very high a trade balance, and as such it is clearly a very serious potential for economic development and the total macroeconomic and social stability. The intensification of export activities of agricultural and food products was continued in the following years. According to Serbian Chamber of Commerce, the total foreign trade of agriculture in 2016 amounted up to 4173.7 million EUR. Balance of trade in agriculture and food industry of Serbia with foreign countries in 2016 shows the value of export of 2898.8 million EUR, which represents an increase of 11.9% compared to the results for the same period in 2015, with the share in total exports of 21.6%. The value of imports in the amount of 1274.9 million EUR was 10.7% lower than in the first twelve months of 2015, with the share in total goods imports of 7.3%. The surplus in foreign trade in agricultural and food products in the period January - December 2016 amounted 1623.9 million EUR with an increase of 39.7% compared to the same period in 2015, and rate of coverage of imports by exports was 227.7% (www.pks.rs).
The trend of deficit reduction in the area of agricultural and food production was the result of action of several factors. The most significant among them is the preferential status that Serbia has received from the European Union in November 2000. Based on this agreement, the export of agricultural and food products of domestic manufacturers (except for certain types of fish, wine and cheese) was exempt from all charges during the marketing in the EU. Another important factor is signing of several important free trade agreements with neighboring countries (Bosnia and Herzegovina, Macedonia, Croatia, Albania, Moldova, Bulgaria and Romania). Serbia in 2006, replaced the existing bilateral agreements with one under the CEFTA (Central European Free Trade Agreement). Relatively favorable results of Serbian agriculture in foreign trade exchange were achieved thanks to the benefits that it has and achieved trade liberalization, as well as the economic boom, which is improving in the world market (demand growth).
Also, Serbia enjoys the privilege of one of the few countries in the region which has been enabled by free trade with Eusko Federation, and by 2005 the United States approved a General preference agreement that approved free access of Serbian agricultural and food products to the US market (Report on the agriculture in the Republic of Serbia in 2013).
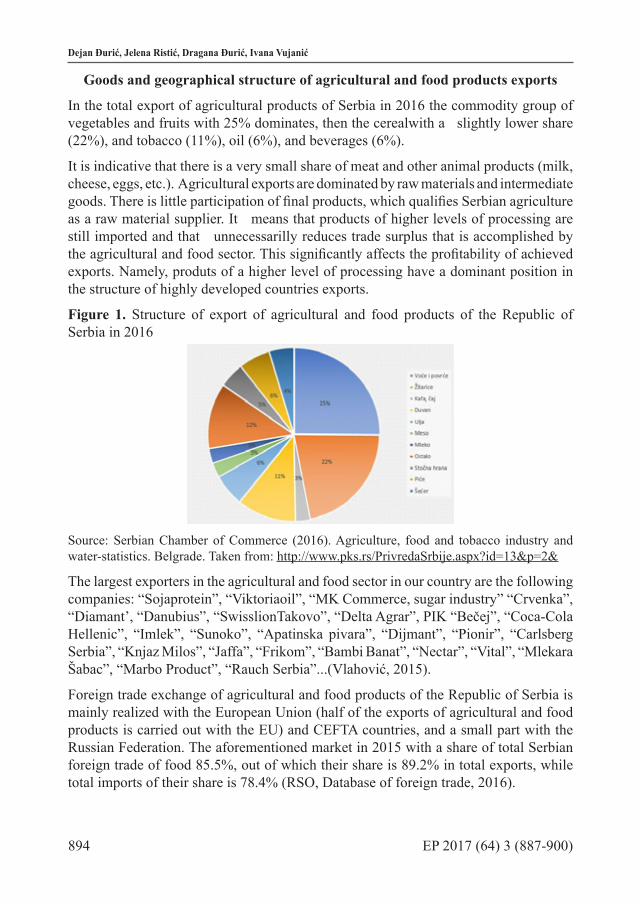
894 EP 2017 (64) 3 (887-900)
Dejan Đurić, Jelena Ristić, Dragana Đurić, Ivana Vujanić
Goods and geographical structure of agricultural and food products exports
In the total export of agricultural products of Serbia in 2016 the commodity group of vegetables and fruits with 25% dominates, then the cerealwith a slightly lower share (22%), and tobacco (11%), oil (6%), and beverages (6%).
It is indicative that there is a very small share of meat and other animal products (milk, cheese, eggs, etc.). Agricultural exports are dominated by raw materials and intermediate goods. There is little participation of final products, which qualifies Serbian agriculture as a raw material supplier. It means that products of higher levels of processing are still imported and that unnecessarilly reduces trade surplus that is accomplished by the agricultural and food sector. This significantly affects the profitability of achieved exports. Namely, produts of a higher level of processing have a dominant position in the structure of highly developed countries exports.
Figure 1. Structure of export of agricultural and food products of the Republic of Serbia in 2016
Source: Serbian Chamber of Commerce (2016). Agriculture, food and tobacco industry and water-statistics. Belgrade. Taken from: http://www.pks.rs/PrivredaSrbije.aspx?id=13&p=2&
The largest exporters in the agricultural and food sector in our country are the following companies: “Sojaprotein”, “Viktoriaoil”, “MK Commerce, sugar industry” “Crvenka”, “Diamant’, “Danubius”, “SwisslionTakovo”, “Delta Agrar”, PIK “Bečej”, “Coca-Cola Hellenic”, “Imlek”, “Sunoko”, “Apatinska pivara”, “Dijmant”, “Pionir”, “Carlsberg Serbia”, “Knjaz Milos”, “Jaffa”, “Frikom”, “Bambi Banat”, “Nectar”, “Vital”, “Mlekara Šabac”, “Marbo Product”, “Rauch Serbia”...(Vlahović, 2015).
Foreign trade exchange of agricultural and food products of the Republic of Serbia is mainly realized with the European Union (half of the exports of agricultural and food products is carried out with the EU) and CEFTA countries, and a small part with the Russian Federation. The aforementioned market in 2015 with a share of total Serbian foreign trade of food 85.5%, out of which their share is 89.2% in total exports, while total imports of their share is 78.4% (RSO, Database of foreign trade, 2016).

895EP 2017 (64) 3 (887-900)
EXPORT OF AGRICULTURAL AND FOOD PRODUCTS IN THE FUNCTION OF ECONOMIC GROWTH OF REPUBLIC OF SERBIA
Since 2001, Serbian agriculture has had a positive trade balance in trade with the EU. The surplus in the trade has a tendency of growth year to year, so it wasincre ased to 1,027 million in 2014 when compared to 170 million dollars in 2001. The agriculture exports of Serbia in the EU in 2015 were represented with 47.7%, and the dominant export products were primary agricultural products (raw materials) - about 94%.
Such a geographical structure of agricultural and food products exports shows a very low geographical diversification of exports and the huge dependence on the economic and political situation in the European Union, as the most important Serbian foreign trade partner. Although the European Union has approved the abolition of all quantitative restrictions, customs duties and taxes on imports (except beef, sugar and wine) (Aničić, Simić, 2017), Serbia fails to increase the level of finalization of products exported to this economic integration. Mainly they are raw materials, i.e. fresh and frozen fruits and vegetables, as well as cereals, although there is a purchasing demand on the level of the European Union.
Another important foreign trade partner of Serbia is the region of the Southeast Europe (CEFTA countries). Due to the proximity of the market and traditional integration, this region is a very important market for agricultural and food products from Serbia. Balance of trade in agriculture and food industry of Serbia with the CEFTA countries in 2015 shows that export in value of 920 million dollars was realized. At the same time, the value of imports was in the amount of 173 million dollars. Surplus in foreign trade of agricultural and food products in that period was 747 million dollars. CEFTA agreement enables market expansion and trade under the same conditions for all countries, opens up a larger market for investments and creats agencies that are competent for management in this area (Vidović, Milunović, 2017). This agreement allows the Serbian businessmen to sell goods without customs duties on the market that includes about 30 million people, and increases the chance for appearance on European markets (Đurić et al., 2016). Observed by countries within the CEFTA region, the most part is exported to Bosnia and Herzegovina, and a large export is realized in Macedonia and Montenegro. The structure of foreign trade exchange, when we talk about these countries, is far different from the exchange with the European Union, because it is about products of a relatively higher level of product finalization. The essential fact is that Serbia is, when compared to all the signatory countries of CEFTA, a net exporter of food, while the main export products are cereals, ie.products from cereals.
Among other countries, the most important export partner is the Russian Federation. Republic of Serbia is one of the few countries in Europe that has signed a free trade agreement with the Russian Federation that allows free access to the Russian market for our agricultural and food products. There is a fundamental problem in the foreign trade of agricultural and food products with the Russian Federation - the inability to fill quotas and satisfy a large contingent of goods required from retail chains in the country. A larger share of final products, ie.food products are noticeable in the structure of trade with Russia.

896 EP 2017 (64) 3 (887-900)
Dejan Đurić, Jelena Ristić, Dragana Đurić, Ivana Vujanić
Proposal of measures for exports boosting
The global economic and financial crisis has shown that the then current model of economic growth of the Republic of Serbia which was essentially based on growing domestic consumption and imports and a small share of exports and investments in the structure of GDP use was untenable . It became apparent that such a model should be replaced by the pro-investment and export-oriented model of economic growth. This means that a new model of economic growth that should allow changes in the structure of creation and use of GDP in the strengthening of tradables sector must be formulated.
Strengthening the tradables sector (agriculture and manufacturing) involves primarily the technological modernization according to the EU standards and productivity growth and living standards respectivly. This sector needs to gain a competitive advantage in the market products with high added value, instead of the production and export of raw materials and semi-final products. Much of the Serbian economy is lagging behind the developed countries due to a long period of disinvestment and spending of depreciation spending and neglect of innovation and knowledge as a development resource, which resulted in low exports values, high deficit in the current balance, depreciation of the dinar and rising debt (Bošnjak, 2011).
The main problems of domestic exports are:
- export structure is based on domination of reproduction products i.e. product of low degree of processing,
- generating a low level of concentration, in spite of a relatively small value the total export,
- the lack of competitiveness of export supply in terms of products (product design and development; technical standards; durability and appearance, presentation) and in terms of price (the price of raw materials, financing costs, taxes and transport).
- export activities of several enterprises determine the overall dynamics of exports,
- the production and export of the food industry are largely influenced by meteorological conditions (genus farming)
- there is a significant correlation between exports and imports, and thus the largest exporters are also the biggest importers at the same time.
Thus, there are numerous problems which limit the powerful boosting of export activities of Serbian economy. A first highlight is an inadequate structure of the domestic economy, i.e. unfavorable structure of exports which cannot provide sufficient competitiveness in the international market. The export structure of our country is still dominated by products for reproduction i.e. products of a low degree of processing, and the structural changes in the real sector are fundamental prerequisite to raise the export to the higher level of competitiveness. In this sense, Serbia needs a fundamental change in export structure towards increasing the participation of higher finalization of the products, as
897EP 2017 (64) 3 (887-900)
EXPORT OF AGRICULTURAL AND FOOD PRODUCTS IN THE FUNCTION OF ECONOMIC GROWTH OF REPUBLIC OF SERBIA
done by more advanced transition countries that are already in the European Union.
A more intense appearance in the international market of agricultural and food products in the future must be based on:
- strategic concept of developmental and export-oriented agriculture,
- improving the competitiveness of goods of agricultural origin,
- improving the quality of products and
- commitment to further liberalization of international trade.
The concept of increasing exports of agricultural and food products, in addition to stable and sustainable growth in production should include the adjustment of the export structure requirements of import demand and improve the competitiveness of exports using comparative advantages in exports, based besides to the agro-ecological potential and technological modernization, on improving the concept of education, management and organizational knowledge and experience. In order to increase the competitiveness of Serbian agriculture proposes the following are being suggested:
- growth of the multiple economies in the structure of overall agriculture in order to simultaneously increase the productivity of agricultural sector;
- reorganization of the agricultural market with the aim of reducing the monopoly on the demand side, in order to ensure stability, and the price competitiveness of the export;
- increase the agricultural budget with much greater participation of subsidies (Petrović, 2013).
Liberalization of the market in our country has led, as we have pointed out before, to the growth of foreign trade of agricultural and food products, so in this context, improving the competitiveness of domestic agricultural production and processing industry by increasing productivity, efficiency and technological standards of production, will form the basis to maintain and improve the positive foreign trade balance in the field of agricultural and food products (Birovljev et al., 2015).
Production and technological restructuring and productivity growth as well as greater competition in the domestic and international markets, should be based on environmental, energetic and economic criteria. At the same time, the development of scientific research and the application of existing and new knowledge and technologies will create conditions for a significant increase in the volume and cost of this production. Strict implementation of the national program for the development of agricultural production, food processing, and comprehensive development of villages, modern and industrialized agricultural production and food industry would constitute the basis of the rapid development of the entire economy and contribute to faster development of other branches of industry and infrastructure.

898 EP 2017 (64) 3 (887-900)
Dejan Đurić, Jelena Ristić, Dragana Đurić, Ivana Vujanić
In recent years as one of the most important sources of competitiveness of the agricultural sector the creation of brands, or brands, is also mentioned. In this regard, it is important to point out that the efforts to make a brand that can be competitive on the world market from products typical of our area have to be made. In order to succeed, it is necessary to develop a branding strategy, improve the level of processing of the products and their packaging. When the traditional products are in question, it is necessary to work on the protection of geographical origin of the products and branding of certain regions and areas. Besides the registration of the mark geographic origin, it is necessary to improve and strengthen marketing activities and strengthen additional promotional activities by the state authorities.
Conclusion
Achieving high rates of economic growth and a stable increase in gross domestic product and the living standard of Republic of Serbia a strong involvement of the country in the international division of labor and strengthen its export activities must be included. The increase in export revenue is an important condition for servicing high levels of external debt and provision of finacing for the import of equipment and technology, and that means a prerequisite for economic development in the years to come. In this sense, the sector of agricultural and food products has an extremely important role, and creating a competitive market of agriculture can greatly contribute to the strengthening of export potential of the domestic economy. Since Republic of Serbia faces a long-term deficit of the trade balance, the improvement in foreign trade of agricultural and food products is becoming a necessity. In this way it is necessary to radically change the structure of exports in order to enhance the competitiveness of these products and to remove limitations which are the result of low labor productivity, inadequate agricultural policy in the past decade and the lack of funds for investment in the sector of agriculture.
Literature
1. Birovljev, J., Matkovski, B., Ćetković, B., (2015): Konkurentnost poljoprivredno-prehrambenih proizvoda Srbije na tržištu zemalja regiona, Anali Ekonomskog fakulteta u Subotici, p. 61-78, Republika Srbija.
2. Bošnjak M., (2011): Globalna ekonomska i finansijska kriza i njen uticaj na privredu i finansije Srbije, Ministarstvo finansija Republike Srbije, Beograd.
3. Cvijanović, D., Ignjatijević, S., Milivojević, I., Mihailović, B., (2016): Potencijali Srbije u međunarodnim okvirima - značaj poljoprivrede i zdravstvenog turizma, Monografija, Fakultet za hotelijerstvo i turizam u Vrnjačkoj banji, Republika Srbija.
4. Cvijanović, D., Popović, V., Subić, J., Paraušić, V., (2013): Stanje i mogućnosti razvoja održive poljoprivrede i ruralnog razvoja u podunavlju, Monografija, Institut za ekonomiku poljoprivrede Beograd, Republika Srbija.

899EP 2017 (64) 3 (887-900)
EXPORT OF AGRICULTURAL AND FOOD PRODUCTS IN THE FUNCTION OF ECONOMIC GROWTH OF REPUBLIC OF SERBIA
5. Cvijanović, D., Mihailović, B., (2012): Međunarodni marketing kao factor razvoja izvozne konkurentnosti, Monografija, Institut za ekonomiku poljoprivrede Beograd, Republika Srbija.
6. Đurić, D., Ristić, J., Đurić, D., (2016): Foreign Direct Investments in the Role of Strengthening the Export Competitiveness of the Serbian Economy, Economics of Agriculture, Vol. 63, No. 2 pp. 357-740, ISSN 0352-3462, Belgrade, p. 531-546.
7. Đurić, D., (2007): Jačanje i unapređenje izvoznih aktivnosti kao najvažniji cilj ekonomske politike u 2007. godini, Konferencija – Izazovi ekonomske politike Srbije u 2007. godini, Zbornik radova, Naučno društvo ekonomista sa AEN i Ekonomski fakultet u Beogradu, Beograd, p. 273.
8. Katić, B., Popović, V., (2007): Dinamika i struktura razmene poljoprivredno-prehrambenih proizvoda između Srbije i Evropske unije u periodu 2000-2006.godine. Ekonomika poljoprivrede, Vol. 54, No. 3, p.303-320, Institut za ekonomiku poljoprivrede Beograd, Republika Srbija.
9. Aničić, A., Simić, M. (2017): Tobinov porez u EU, Oditor, Vol. 3, No. 2, pp. 100-106.
10. Kvartalni monitor No. 40, 2015. (available at: https://www.fren.org.rs/sites/default/files/qm/T-4_0.pdf)
11. Ministarstvo poljoprivrede i zaštite životne sredine, Izveštaj o stanju u poljoprivredi u Republici Srbiji u 2013.godini, Republika Srbija, Beograd (available at: http://webrzs.stat.gov.rs.beg.org.rs/Komora/OpstaA.aspx?veza=14305)
12. Nikolić G., (2014): Dinamika i kvalitativne promene robne razmene Srbije – Ključna karika napretka, Okosnica nove razvojne strategije Srbije: bez izvoza nema izlaza
13. Petrović, J., Jovanović, D., Petrović, D., Berjan, S., (2013): The impact of Serbian agriculture exports on its trade deficit. Fourth International Scientific Agricultural Symposium “Agrosym” 2014 Jahorina (Bosna i Hercegovina): Poljoprivredni fakultet Univerziteta Istočno Sarajevo, p. 1356-1362, Bosna i Hercegovina
14. Privredna komora Srbije, Spoljnotrgovinska razmena poljoprivrede i prehrambene industrije Srbije sa svetom u 2016. (available at: http://www.pks.rs/SADRZAJ/Files/Poljoprivreda/Razmena%20agrara%20za%20period%20I%20-%20XII%202016%20%20godine.pdf)
15. Privredna komora Srbije (2016). Poljoprivreda, prehrambena i duvanska industrija i vodoprivreda–statistika. Beograd. (available at: http://www.pks.rs/PrivredaSrbije.aspx?id=13&p=2&)
16. Republički zavod za statistiku Srbije (2016). Baza podataka o spoljnoj trgovini, Beograd. (available at: http://webrzs.stat.gov.rs).
17. Strategija povećanja izvoza Republike Srbije za period od 2008. do 2011. godine (available at: http://www.srbija.gov.rs/vesti/dokumenti_sekcija.php?id=45678)
18. Vlahović, B., (2015): Tržište agroindustrijskih proizvoda, Univerzitet u Novom

900 EP 2017 (64) 3 (887-900)
Dejan Đurić, Jelena Ristić, Dragana Đurić, Ivana Vujanić
Sadu, Poljoprivredni fakultet, Republika Srbija19. Vidović, Z., Milunović, M. (2017): Revizija svrsishodnosti poslovanja, Oditor,
Vol. 3, No. 2, pp. 37-53.20. Foreign trade balance of Republic of Serbia: http://webrsz.stat.gov.rs/WebSite
IZVOZ POLJOPRIVREDNO-PREHRAMBENIH PROIZVODA U FUNKCIJI EKONOMSKOG RASTA REPUBLIKE SRBIJE
Dejan Đurić5, Jelena Ristić6, Dragana Đurić7, Ivana Vujanić8
Rezime
Niska izvozna aktivnost i visok nivo trgovinskog deficita, negativno su obeležje trgovinske razmene Srbije sa inostranstvom u dužem vremenskom periodu. Imajući u vidu stanje spoljno-trgovinskih tokova naše zemlje, jasno je da se porast izvoza roba i usluga nameće kao jedan od najvažnijih zadataka ekonomske politike u narednim godinama. U tom smislu, osnovni cilj ovog rada jeste sagledavanje mesta i značaja sektora poljoprivredno-prehrambenih proizvoda u spoljnotrgovinskoj razmeni Republike Srbije, kao i predlaganje mera koje bi trebalo preduzeti u pravcu podsticanja izoza i podizanja nivoa konkurentnosti posmatranog sektora na inostranom tržištu.
Poljoprivredno-prehrambeni sektor može značajno doprineti smanjenju spoljnotrgovinskog deficita i dinamiziranju izvoznih aktivnosti nacionalne ekonomije. Međutim, potencijali ovog sektora još uvek nisu u potpunosti iskorišćeni. Iako izvoz poljoprivredno-prehrambenog sektora ima dominantno mesto u strukturi domaćeg izvoza, njegova konkurentnost je još uvek na niskom nivou, pa se povećanje konkurentnosti i stepena obrade ovih proizvoda nameću kao ključni izazovi u budućnosti.
Ključne reči: izvoz, poljoprivredni i prehrambeni sektor, globalizacija, međunarodna konkurencija.
5 Profesor, dr Dejan Đurić, Visoka poslovna škola strukovnih studija Novi Sad, Vladimira Perića Valtera br. 4, 21000 Novi Sad, Republika Srbija, telefon: +381 63 80 57 420; e-mail:[email protected]
6 Profesor, dr Jelena Ristić, Visoka poslovna škola strukovnih studija Blace, Kralja Petra I br. 70, 18420 Blace, Republika Srbija, telefon: +381 63 404 202; e-mail:[email protected]
7 Profesor, dr Dragana Đurić, Visoka poslovna škola strukovnih studija Blace, Kralja Petra I br. 70, 18420 Blace, Republika Srbija, telefon: +381 65 80 57 420; e-mail:[email protected]
8 Ivana Vujanić M.A., doktorant na Evropskom Univerzitetu u Beogradu, Fakultet za evropski biznis i marketing, ul. Carigradska br. 28, 11000 Beograd, Srbija. Telefon: +381 62 979 28 66, E-mail: [email protected]
901
Original scientific paper Economics of Agriculture 3/2017UDC: 338.48-55(497.11)
EP 2017 (64) 3 (901-918)
SIGNIFICANT INVOLVEMENT OF AGRICULTURAL HOLDINGS IN RURAL TOURISM DEVELOPMENT IN SERBIA
SIGNIFICANT INVOLVEMENT OF AGRICULTURAL HOLDINGS IN RURAL TOURISM DEVELOPMENT IN SERBIA1
Tamara Gajić2, Aleksandra Vujko3, Mirjana Penić4, Marko D. Petrović5, Milutin Mrkša6
SummaryThere are a large number of farms in Serbia, which survived with a little capital and labor, and today one of the perspectives they see in the integration with the rural tourism. Tourism development is an incentive for the introduction of improvements in agricultural production, processing and supply of food, as well as the introduction of modern standards that are difficult to apply on small farms because of the high costs of their implementation. Rural tourism in Serbia is not at a satisfactory level of development, although there are all preconditions for its intensive development. Due to unfavorable political and economic position of Serbia, rural tourism has not encountered the support of its favorable development among its competitors. The authors have tried to point out a study for the attitude of the hosts as a service providers on the current status and problems faced in providing services in rural tourism. Investigated in 15 municipalities in Vojvodina (Northern Serbia), Southwestern Serbia and Southeastern Serbia, and in a total of 46 owners of small farms. Using the tests methods questionnaires and processing in SPSS, version 19.0, and analysis of the data, authors led to the confirmation of certain hypotheses of which started in the investigation.
Key words: rural tourism, farms, Serbia, integration.
JEL: Q15, R11
1 The research was supported by Ministry of Education, Science and Technological Development, Republic of Serbia (Grant III 47007).
2 Tamara Gajić Ph.D., Professor of professional studies, Novi Sad Business School, Vladimira Perića Valtera Street no. 4, Novi Sad, Serbia, Phone: +381 63 565 544, E-mail: [email protected].
3 Aleksandra Vujko Ph.D., Lecturer, Novi Sad Business School, Vladimira Parića Valtera Street no. 4, Novi Sad, Serbia, Phone: +381 64 914 26 45, E-mail: [email protected].
4 Mirjana Penić Ph.D., Lecturer, Faculty of Natural Sciences, Dositeja Obradovica Square no. 3, Novi Sad, Serbia, E-mail: [email protected].
5 Marko D. Petrović Ph.D., Research Associate, Geographical Institute “Jovan Cvijić”, Serbian Academy of Sciences and Arts (SASA), Djure Jakšića Street no. 9, 11000 Belgrade, Serbia, E-mail: [email protected].
6 Milutin Mrksa Ph.D., Lecturer, Novi Sad Business School, Vladimira Parića Valtera Street no. 4, Novi Sad, Serbia, E-mail: [email protected].

902 EP 2017 (64) 3 (901-918)
Tamara Gajić, Aleksandra Vujko, Mirjana Penić, Marko D. Petrović, Milutin Mrkša
Introduction
Serbia has a good basis for the development of rural tourism (pronounced natural and social values, rich cultural and historical heritage and favorable geographic and traffic position). Hitherto unfavorable political and economic situation slowed down the development of tourist activities. Rural tourism in Serbia should contribute to the development of the middle, but also that economic motivate the local population to remain in the country (Gajić, 2009). Small agricultural farms, in Serbia, although often unprofitable from the perspective of space, survived the times, and usually have little capital, land and labor. They are often characterized by a high share of net non-farm income, and a somewhat higher level of formal education than we have in the rest strictly oriented farming households (Lankford et al., 1994: Choi et al., 2006: Andereck et al., 2005). Today’s wide range of agricultural products produced mainly dedicated to meeting family needs for food, but the selection of products often does not correspond exactly to the terms of the environment, so that this production is not always economically and environmentally justified (Iorio et al., 2010; Aguilo et al., 2005; Chen et al., 2010). These farms are usually very closed and trying to maintain their way of life and traditions and are reluctant to introduce any changes in the system that allowed its owners to persist for years. With their current economic difficulties, there is a risk that the development of the agri-food chain will be continue to marginalize, and to see a chance only in association with tourism development and marketing in the tourism market (Gajić, 2009).
The introduction of tourism in the rural economy provides more opportunities for the consistent application of environmental farm practices, as well as the actualization of the role of agriculture as an ecological service, which provides conditions for the rural areas retain and recruit younger workforce (Augustin et al., 2007; Sharpley, 2014; Rivera et al., 2015). For tourism as an economic activity, agriculture and farming are not only essential food source, but also a source of attractive activities and creator attractive environment, landscape and biodiversity, which help in increasing the diversity of tourist attractions (Akis et al., 1996; Jaafari, 1986). Tourism, on the other hand, reviving rural environment, because the local community has a specific financial benefit from maintaining its attractive traditional appearance. The focus of this research is to determine the conditions of rural tourism development and integration with farms, the existing problems of development, and then to determine the services and products offered in rural tourism, determining the attitudes of their owners on the inclusion in the tourist offer, looking at tourism activities of each household and determine the most common forms of promotion. Authors used the method of personal interviews and analyzed data in SPSS software, version 19.0. The survey was conducted in 15 municipalities in Serbia (Vojvodina Province – Northern Serbia, Southwestern Serbia and Southeastern Serbia), in a total of 46 of respondents. The sample included a relatively equal number of households, from the three large regions of Serbia.

903EP 2017 (64) 3 (901-918)
SIGNIFICANT INVOLVEMENT OF AGRICULTURAL HOLDINGS IN RURAL TOURISM DEVELOPMENT IN SERBIA
Theoretical framework and hypotheses development
The importance of rural tourism in economy development
Development of rural tourism and its importance is acute topic of the 21st century, both in developed and undeveloped regions. The importance of the development of rural tourism is reflected in stimulating local economic development because it creates services and job opportunities, and establishes foreign sources of revenue (Gurung et al., 2000). Many rural communities in the world enjoy the complementary support of the local government in terms of general economic assistance policies and targeted housing support (Jeong et al., 2017). Rural areas outside urban areas are also considered to be repositories of older ways of life and cultures that respond to the postmodern tourists’ quest for authenticity (Urry, 2002). The encouragement for the development of this form of tourism has become a common policy both in developed countries (Canoves et al., 2004; Hall et al., 1998; Long et al., 2000; MacDonald at al., 2003) and also in developing ones (Briedenhann at al., 2004; Hall, 2004; Carrilat et al., 2007). There are many investigations concerning confirmation of the fact that rural tourism provided economic and social benefits in various rural areas in Europe and elsewhere. Cerezo (2005) pointed out that rural tourism enterprises provided new sources of income for families living in a remote rural area of Chile.
According to Komppulаs’ research (2007), rural tourism, in general, refers to small family enterprises and lifestyle entrepreneurship. Rural tourism benefits local communities in terms of economic growth, sociocultural development, the provision of essential and nonessential services, and rising standards of living (Sharpley et al., 2011; Nunkoo et al., 2012). Development of rural tourism is the ideal solution for the growth of small and medium-sized enterprises, rural tourism also offers the ideal market for small businesses directly and indirectly bringing economic benefits to local businesses, and encouraging the development of related small businesses (Wild et al., 1994; Vargas et al., 2011; Sinclaire et al., 2014). Theorists argue that rural tourism which contributes to small businesses have several specific characteristics. In many cases, these businesses have non-economic goals (Ko et al., 2002; Ladhari et al., 2009, Perez et al., 2010; Kim et al., 2013; Ko et al., 2002). Very often, the development of rural tourism is the wish of the host only to meet their needs and aspirations, such as the way of life, the business might have started in response to the owner’s needs or desire for a particular lifestyle (Vujko et al., 2014).
In some rural areas, small businesses often lack even basic governmental supports, including welfare and financial services, training and education programs, and other incentives for local community support for tourism activities (Ateljević, 2009). In Croatia, rural tourism contributes toward sustaining the regional agriculture industry (Petrić, 2003). Rural tourism is a growing sector of the overall tourism market, representing a significant source of income and employment for rural economies (Gajić, 2009), contributing to the sustainability of local communities (Vujko et al., 2014), and revitalizing flagging rural economies (Petrović et al., 2017). A very specific conclusion about rural tourism development is provided by Hall

904 EP 2017 (64) 3 (901-918)
Tamara Gajić, Aleksandra Vujko, Mirjana Penić, Marko D. Petrović, Milutin Mrkša
(2004). He points out that profit from the development of rural tourism contributes to the positive effects and in other spheres: the development of local agriculture, handicrafts, trade, presentation of traditional quality of domestic products, and the opportunity to reevaluate a region’s heritage, symbols, environment, and identity.
The needs and abilities of integration of agriculture and tourism
Tourism in the world presents a theory of modernization, where the problems of agriculture and rural areas are considered serious. The policy of integration of agriculture and tourism in the world has long been a hot topic of research (Rasoolimanesh et al., 2017). In most countries agriculture represents the main source of income and employment, which is not the case in rural areas of Serbia. Young people are increasingly leaving rural areas and go to the cities in search of better conditions (Allen et al., 1993, Dyer et al., 2007; Jaafar et al., 2015, Petrović et al., 2017). Rural areas have economic potential which is largely untapped and can be better utilized for the benefit of the rural population and overall national development. Rural areas in Serbia are facing decline through attrition and an aging population, a low skills base and low average productivity (Vujko et al., 2014).The focus is not only to overcome regional disparities and differences between urban and rural development, but also coordinates the development of agriculture and other activities and services in rural areas, to ensure a better quality of life and improve the standard of living rational use of resources and their preservation for future generations (Petrović et al., 2017; Rebeca et al., 2004). Hence the need for the development of tourism activities in rural areas, in order to stabilize the situation and overcome problems (Sharpley, 2011). Agriculture is still the largest user of rural resources and the decisive factor that affects the appearance of the rural area of Serbia.
Evaluation of rural category in the EU and Serbia - the state of rural tourist facilities in Serbia
In the European Union lives 57% of the rural population, wherein the average density of 38 people per square kilometer in predominantly rural regions (except Finland: 2 inhabitants per square kilometer). More developed economies of Europe’s rural areas it is often low-income and high unemployment rates, particularly in the new member countries, but also in some old EU-15 countries (Portugal, Spain, Italy, Greece, Finland) (Rasoolimanesh et al., 2017). Romania and Bulgaria, with a total of 7.5 million households with less than 5 ha of land, and most cannot make a sufficient income for their farm household. In the new member states in Central and Eastern Europe, privatization of agricultural land has led to the almost complete disappearance of cooperatives. Cooperatives and commercial farms are located on a large percentage of arable land in Slovakia (76%), Bulgaria (74%), Czech Republic (72%) and Hungary (50%). Small, individual farms cover most of the cultivated land in Slovenia (94%), Latvia (90%) and Poland (86%).
According to the 2002 census at present there are about 778,900 private households, the average size of 2.5 hectares of arable land (total of privately owned 83.7% of the total number of cultivable land, 5.4 million acres). In Vojvodina, there are fewer villages than in other regions and relatively low population density - 94 people per square kilometer. The

905EP 2017 (64) 3 (901-918)
SIGNIFICANT INVOLVEMENT OF AGRICULTURAL HOLDINGS IN RURAL TOURISM DEVELOPMENT IN SERBIA
unemployment rate in rural areas reached 21%, and the GDP per capita, only 74% of the national average. Holdings up to 3 ha has about 328,000, and those make up about 56% of all households in the rural areas. Over 600,000 households have less than 5 ha of land. The average size of family farms in Serbia is about 3.7 ha (Agriculture and Rural Development RS 2014, 2013). Agricultural population includes over 60 years with a lower degree of education and the high percentage of dependents over the age of 15 years. Most small farms have income from employment outside agriculture, sales of agricultural products and of pensions. Demographic trends in Serbia, especially in its rural areas, are increasingly unfavorable from 1991 to 2002, the population in rural areas of Serbia decreased by 3.6% compared with the overall population decline in the country by 1%, while from 2002-2011 there has been a decline in the total population of 4.15%, which was primarily the result of negative natural increase and migration abroad. About 55% of the Serbian population lives in rural areas, producing 41% of the country’s GDP (Agriculture and Rural Development RS 2014, 2013).
The rural population in this period decreased by 311,139 inhabitants (10.9%) and now makes 40.6% of the total population of Serbia. In addition to negative demographic trends in rural areas of the fact that in about 1,000 the village population is less than 100, which indicates that practically every fifth settlement before quenching; the largest concentration of such settlements in the south and east of the country (Agriculture and Rural Development RS 2014, 2013). Given that about 85% of Serbian rural, rural tourism can be assumed that a significant part of the overnight stays in mountain and spas.
On the territory of the Republic of Serbia is 6,158 settlements, of which 193 belong to the city (3.1%), and 5,965 were other settlements, which are automatically considered rural. It is currently estimated that more than 32,000 beds in rural areas plays an important role in the sector of rural tourism, and about 300 rural households with 8,000 beds, offers catering services and generate more than 150,000 overnight stays per year (Petrović et al, 2017). It is estimated that there was a total of 10 billion in revenue from rural tourism (5 billion RSD revenue comes from housing and about 5 billion RSD are direct revenues). What is 16% of total 62 billion RSD of total direct tourism GDP that is for Serbia in 2010. It is estimated that every household that are engaged in rural tourism year certainly remains quite up to 5,000 Euros. Those with luxury accommodation and a better offer, the annual salary of up to 12,000 Euros (Master Plan for Sustainable Development of Rural Tourism of Serbia, 2011). In one household received from 750 to 1,500 per night. More than 1,000 overnight stays a year, makes 60 households. Around 240 objects realized 700-1,000, and 150 has 350-700 nights. About 300 households have less than 350 nights a year. The average length of stay of tourists in households was 2.8 days (Petrović et al., 2017).
Based on these data and many studies on the current topic, the authors of the work are set up several hypotheses:
H1: Rural tourism in Serbia is not at adequate level of development.H2: Provided services are not on satisfactory level of quality.H2a: Locals (hosts), mainly, through the development of rural tourism, see the financial benefits.

906 EP 2017 (64) 3 (901-918)
Tamara Gajić, Aleksandra Vujko, Mirjana Penić, Marko D. Petrović, Milutin Mrkša
H2b: Locals do not attach great importance to promotional activities, as well as the best methods of advertising and exiting the market.H3: There is a low level of integration of agricultural holdings and tourism industry.H4: Owners of farms, that provide tourist services, see the revitalization in the higher level of integration with tourism.
Research MethodologyAs the main method of research in this part of the test methods will be used, which is a way to gain access to primary data, information, and its essence is to collect data over the statements of other entities (subjects), a form of verbal communication with them using questionable testimony. In the realization of field research as a means of testing methods was used questionnaire. As used forms of communication between the interviewer and the respondents in the completion of field trials listed: personal and written communication. Issues that are listed in the questionnaire intended to explore the attitudes of the owner of rural households were formed on the basis of a critical analysis of contemporary literature dealing with the same topic (Petrović et al., 2017). The basis for the implementation of test methods are standardized questionnaires with simple or double scale. While in the case of simple scales, as a rule, with the help of Likert scale (1-5) includes observation of the quality keeping in mind certain attributes or the expectation of consumers before using the services and to compare the experiences after the service. Based on double the scale developed one of the most multi-attributes procedures for measuring service quality called Servqual.
Results and discussion
Area and sampling
Total number of survey, owners of rural households that provide tourist services in rural areas of Serbia who have studied in this paper, is 46. The study included 15 municipalities which are grouped in the following regions: Vojvodina, Southwestern and Southeastern Serbia. The objective of this phase of the research is to gain insight into the state of rural tourism and service quality from the perspective of the owners of rural households and the local population. The sample included a relatively equal number of households from the three large regions of Serbia. In Southeastern Serbia has covered 32.6% of households, in Vojvodina the distribution of questionnaires was 32.61%, and in Southwestern Serbia 34.78%. The questionnaire for the hosts contains a total of 23 questions, of which 5 closed nature and related to socio-demographic characteristics of the host, and other issues to focus on the cognitive and experiential characteristics of the host.
Certain data obtained by the analysis will be presented throughout the text, with no tabulation, and also form part of the written part of statistical research. According to the study, the highest percentage of tourists who had been visited households were domestic tourists 89%, while the foreign visitors only 11%. of which domestic tourists, mainly in the largest percentage, were regular guests. The largest percentage of visitors stay 5 days (63%), followed by seven

907EP 2017 (64) 3 (901-918)
SIGNIFICANT INVOLVEMENT OF AGRICULTURAL HOLDINGS IN RURAL TOURISM DEVELOPMENT IN SERBIA
days, about 26%. Total 2% of tourists stay two weeks, but longer than that percentage remains 4%. Just one day only 55 tourists stay in rural households that have taken in the investigation. Based on the analysis of the structure of respondents it can be seen dominating the number of hosts that are engaged in agriculture (23.9%) and exclusively tourism (43.5%), which means that residents who are engaged in rural tourism, people are opting for it as their primary activity, or farmers who are looking for an additional source of income. Analysis of the age structure shows, that the hosts are mainly people older than 50 years (32.6%). Further analysis shows that respondents are mainly locals persons with secondary education and they make up 54.3% of total respondents. When looking at the height of monthly revenue, nearly a third of respondents (26.7%) answered that their income does not exceed 200 euros, while only 4 (8.7%) of respondents earning more than 600 euros per month, which indicates relatively low earnings host dealing with rural tourism and compared to the average income in Serbia. All data indicates a low level of development of the rural tourist industry and confirm H1 hypothesis.
Table 1. Socio-demographic characteristics of the owners of farms
Gender structure Frequency Percent %
GenderMale 24 52.2%
Female 21 46.7%Total 46 100% Occupation structure Frequency Percent %
Primary occupation
Agriculture 11 23.95Tourism 20 43.5%Crafts 6 13.0%Other 6 19.6%
Total 46 100% Age structure Frequency Percent %
Age
21-30 1 2.2%31-40 8 17.4%41-50 9 19.6%51-60 15 32.6%> 61 13 29.3%
Total 46 100% Educational structure Frequency Percent %
EducationUnfinished primary school 1 2.2%
Primary school 8 17.4%Secondary school 25 54.3%
Higher or high school 12 26.1%
Total 46 100%

908 EP 2017 (64) 3 (901-918)
Tamara Gajić, Aleksandra Vujko, Mirjana Penić, Marko D. Petrović, Milutin Mrkša
Earning structure Frequency Percent %
Earning (in Euros)
< 200 12 26.7%201-400 23 50.0%401-600 6 13.0%>601 4 8.7%
Total 46 100%
Source: Prepared by the author based on data analysis in SPSS 19.0.
In households that receive tourists mainly live two members (29%), which is likely, considering the most dominant age structure among the hosts, indicating an older couple whose children have left home and who need additional sources of income. Estates and houses that host tourists mostly located inside the village, 78%, while a smaller portion of households outside the village. When it comes to farm the largest percentage of those 200 square meters of surface. Since it is the tourist facilities of smaller areas, it can be concluded that the majority of households hosts tourists in their private dwellings. Data show that the host home in 73% of cases older than 20 years. Tourist facilities that are available to visitors in rural areas of Serbia, for the most part (44%) are in the second category.
In the rural areas of Southwestern and Southeastern Serbia, mainly dominate objects of the second category, while in Vojvodina dominated the third category. A significant proportion of tourist facilities the first category is recorded only in Southwestern Serbia. Most households (38%) have between 100 and 500 visits per year, while at 16% of households have from 500 to 1,000. From the sample, we can conclude that the Serbian households are choosing to offer full board to visitors of rural landscapes (52%). As for accommodation facilities, just one host has only one room that offers to the tourists, 17% of the home has two bedrooms, the home with three rooms in its offer is presented with 20%, while the largest number of respondents with several rooms of the above (61%). Data analysis showed that 80% of households’ issue of accommodation throughout the year, without the expressed seasonality. As the most important parameter of quality and factor of making tourists decisions is price. According to the results of survey research it was found that the price varies widely, ranging from 640 RSD to 3,500 RSD (1 Euro = 124 RSD).
Table 2. Basic data of households
Number of household members 1 2 3 4 57% 29% 24% 27% 13%
Surface of property (square meters) 100 200 300 do 700 700 +27% 47% 11% 2% 13%
Categorization of objects(IP= in process)
I II III IV IP
18% 44% 28% 4% 6%
Number of visitors per year 50 50-100 100-500 500-1000 1000+
23% 7% 38% 16% 16%

909EP 2017 (64) 3 (901-918)
SIGNIFICANT INVOLVEMENT OF AGRICULTURAL HOLDINGS IN RURAL TOURISM DEVELOPMENT IN SERBIA
Type of accommodation (mean: B&B= bed and breakfast)
Full accommodation B&B Overnight All Total52% 26% 11% 11% 100%
Rooms in households3 rooms 2 rooms 1 room more
20% 17% 2% 61%
Prices of services (RSD) <1.000 <1.500 <2000
< 3.500
24% 27% 33% 16%
Source: Prepared by the author based on data analysis in SPSS 19.0.
Table 3. Type of provided service in homes on farms engaged in rural tourismProvided service Yes NoHeating in winter 91% 9%Air conditioners 40% 60%French bed 63% 37%Sofa 35% 65%The bathroom 98% 2%Homemade food 93% 7%Sports activities 43% 57%Field trips 80% 20%Participation in activities 52% 48%Creative workshops 37% 63%Homemade drink 76% 24%
Source: Prepared by authors of the quality on data analysis in SPSS 19.0.
Table 4. The attitude of the owner of the farms about characteristics of servicesAssessment of equipment by the host
Rate 5 4 3 2Percent 54% 35% 9% 2%
Assessment of cleanliness and hygieneRate 5 4 3 2Percent 76% 20% 4% -
Spaciousness and brightnessRate 5 4 3 2Percent 63% 26% 11% -
Assessment of peace and tranquilityRate 5 4 3 2Percent 87% 11% 2% -
Method of preparation of food
Guest Kitchen Host cooks Outside the household They share with the host All
69% 9% 4% 16% 2%
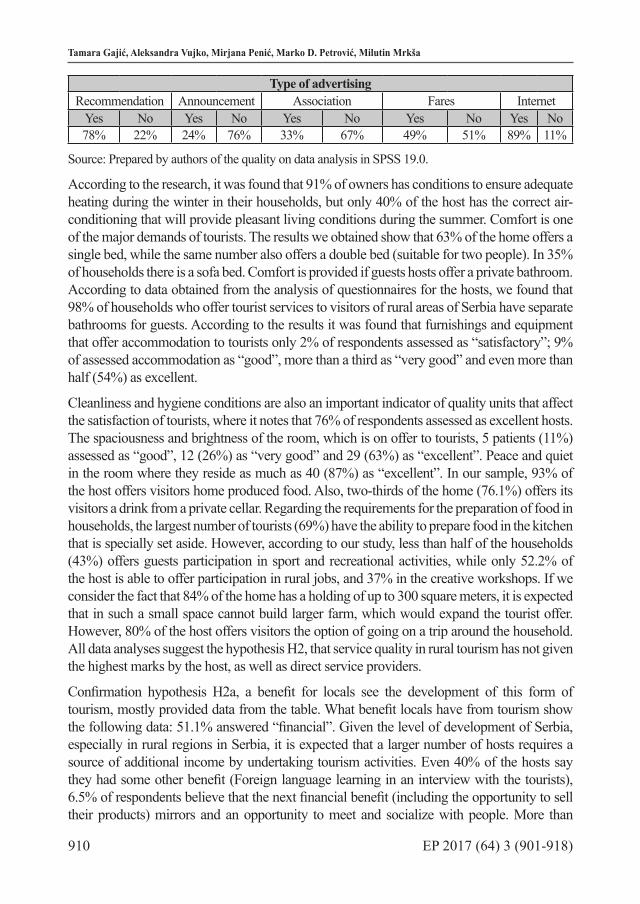
910 EP 2017 (64) 3 (901-918)
Tamara Gajić, Aleksandra Vujko, Mirjana Penić, Marko D. Petrović, Milutin Mrkša
Type of advertisingRecommendation Announcement Association Fares Internet
Yes No Yes No Yes No Yes No Yes No78% 22% 24% 76% 33% 67% 49% 51% 89% 11%
Source: Prepared by authors of the quality on data analysis in SPSS 19.0.
According to the research, it was found that 91% of owners has conditions to ensure adequate heating during the winter in their households, but only 40% of the host has the correct air-conditioning that will provide pleasant living conditions during the summer. Comfort is one of the major demands of tourists. The results we obtained show that 63% of the home offers a single bed, while the same number also offers a double bed (suitable for two people). In 35% of households there is a sofa bed. Comfort is provided if guests hosts offer a private bathroom. According to data obtained from the analysis of questionnaires for the hosts, we found that 98% of households who offer tourist services to visitors of rural areas of Serbia have separate bathrooms for guests. According to the results it was found that furnishings and equipment that offer accommodation to tourists only 2% of respondents assessed as “satisfactory”; 9% of assessed accommodation as “good”, more than a third as “very good” and even more than half (54%) as excellent.
Cleanliness and hygiene conditions are also an important indicator of quality units that affect the satisfaction of tourists, where it notes that 76% of respondents assessed as excellent hosts. The spaciousness and brightness of the room, which is on offer to tourists, 5 patients (11%) assessed as “good”, 12 (26%) as “very good” and 29 (63%) as “excellent”. Peace and quiet in the room where they reside as much as 40 (87%) as “excellent”. In our sample, 93% of the host offers visitors home produced food. Also, two-thirds of the home (76.1%) offers its visitors a drink from a private cellar. Regarding the requirements for the preparation of food in households, the largest number of tourists (69%) have the ability to prepare food in the kitchen that is specially set aside. However, according to our study, less than half of the households (43%) offers guests participation in sport and recreational activities, while only 52.2% of the host is able to offer participation in rural jobs, and 37% in the creative workshops. If we consider the fact that 84% of the home has a holding of up to 300 square meters, it is expected that in such a small space cannot build larger farm, which would expand the tourist offer. However, 80% of the host offers visitors the option of going on a trip around the household. All data analyses suggest the hypothesis H2, that service quality in rural tourism has not given the highest marks by the host, as well as direct service providers.
Confirmation hypothesis H2a, a benefit for locals see the development of this form of tourism, mostly provided data from the table. What benefit locals have from tourism show the following data: 51.1% answered “financial”. Given the level of development of Serbia, especially in rural regions in Serbia, it is expected that a larger number of hosts requires a source of additional income by undertaking tourism activities. Even 40% of the hosts say they had some other benefit (Foreign language learning in an interview with the tourists), 6.5% of respondents believe that the next financial benefit (including the opportunity to sell their products) mirrors and an opportunity to meet and socialize with people. More than

911EP 2017 (64) 3 (901-918)
SIGNIFICANT INVOLVEMENT OF AGRICULTURAL HOLDINGS IN RURAL TOURISM DEVELOPMENT IN SERBIA
half of respondents (56.5%) are a member of an association of rural households. The survey results show that 96% of the host cooperates with them, which is a positive indicator of their interest to increase tourist demand and offer. Ways to promote a means of attracting tourists and providing tourist development of rural regions. However, these funds require financial investments is due to the unstable economic situation and the crisis in Serbia, it is very difficult to provide. According to the research, the hosts among the respondents do not advertise its tourist offer. This is a very disappointing result, which is due to low income and worsened the economic situation in the country. Due to lack of funds for advertising in the media, local Serbian rural areas rely on oral recommendations of relatives, fellow citizens and guests.
According to the survey, 78% of respondents believe that the arrival of new guests comes from the recommendations, while 22% disagree with this statement. Research has shown that the largest number of households advertised via the Internet, since it is currently the cheapest means of promotion and, unfortunately, only way of promotion that some household in Serbia can afford. Even 89% of respondents use the Internet to present its tourist offer and attracting guests. This confirms the hypothesis H2b. When asked if they received incentives or any other form of assistance from the municipality to improve the rural tourism product, 65% of households responded affirmatively. However, about a third of the sample, namely 28%, a negative answer to this question, which is a significant number. Based on statistical research and analyzed research data it is obviously that there is expressed very weak integration between agricultural holdings and tourism industry, which confirms the hypothesis H3. Of the total respondents, 89%, declared that the revitalization of rural areas is also integrated with tourism, thus confirming the hypothesis H4.
Conclusion
According to Bramwell and Lane (1994) rural tourism is a multifaceted activity rather than farm-based tourism only. The role of rural tourism in developing of economy saw many theorists (Sharpley, 2000). Rural small businesses are sustained with an absolute minimum of staff and rely on a high turnover of sales (Hollick et al., 2005; Reijonen, 2008; Brida et al., 2010; Gursoy et al., 2002). Consequently, rural tourism is regarded important economic strategy for improving rural social conditions (Liu, 2006). Farm owners who deal with involvement their farms in tourism sector earners large part of their income and contribute to a large influx of money to the district, the state and the farmers (Brandth et al., 2011). Agricultural tourism has become a sector that is rapidly expanding in European countries (Burton, 2004). This type of tourism allows farmers to gain additional income and improve the economy of rural areas (Kegel et al., 2003). Turning on farms in rural farm tourism includes such branch, which is adapted users and their activities, such as reading squash, fruits and vegetables, mating with the animals, and the like (Brandth et al., 2011).
According to the latest data from the US Department of Agriculture 2012, farms involved in agri-tourism earned $ 700 million, an increase of 24 % in five years (Huller et al., 2017). Rural communities in Serbia must face many challenges, contributing to weaker economic performance, or the occurrence of poverty. It is believed that, due to the fact that the rural

912 EP 2017 (64) 3 (901-918)
Tamara Gajić, Aleksandra Vujko, Mirjana Penić, Marko D. Petrović, Milutin Mrkša
areas of Serbia and in the future, will be affected by the negative climate change, changed conditions for the development of agriculture can produce even worse consequences for the survival of rural communities, and the larger of the effects of the current economic crisis. Rural tourism is a major potential for the economic development of Serbia. The difficult economic and political situation that befell Serbia at the end of the 20th century and today, has major implications on the entire economic development. Of course, these consequences are sensible and in the tourism sector. The authors carried out the research in Vojvodina, Southwestern and Southeastern Serbia, with a total of 46 respondents. The statistics on the number of households that are engaged in rural tourism, their due, categorization and other parameters point to confirm the starting hypothesis H1 that rural tourism is underdeveloped in the country. Based on the data on the evaluation of the quality of services by the host multiply conclude that the top-rated services such as domestic food (93%), tours (80%), and serving domestic drinks (76%). Rating of other services provided is not satisfactory perceived by the host.
In order to be said about the revitalized rural areas and integration with tourism, every household would have to be able to accommodate 45-50 people, what is the usual standard for tours with bus transport. If this condition is not fulfilled, the tourists in this town will keep no longer active, but not perfect offer food, entertainment and the like. Therefore, the authors confirmed the hypothesis H2, that provided services are not at adequate and expected level. In terms of prescribed standards of quality units, identified numerous problems that the owners of rural households are facing. Households in rural areas of Serbia are generally small and have no room for improvement of tourist offer. If we take into account the limited possibility of investing in the expansion of tourist facilities in Serbia, leads to the conclusion that the tourism facilities in rural tourism is relatively small areas, do not allow hosting a large number of tourists, and are thus able to expand these activities are very limited. Accordingly, categorization is quite inadequate. In the Southwestern and Southeastern Serbia dominated by objects second categories, while in Vojvodina is dominated by objects of the third and then the second category.
A significant proportion of tourist facilities first category is recorded only in Southwestern Serbia. They are mostly older buildings (73%). Locals have also pleaded the biggest percentage of them in the development of rural tourism, sees mostly-financial or material benefit (certificate H2a). In the development of rural tourism play an important role of public and state institutions as well as non-profit organizations by providing resources, whether in the form of finance or some other form, helping to promote and improvement of tourist offer of the region that are less developed. Statistical analysis showed that households Southwestern Serbia, compared to Vojvodina and Southeastern Serbia, largely undertaken marketing and promotional activities for the presentation of its tourist offer. Only half of the owners of rural households (56%) is a member of an association of rural households, while the majority relies on cooperation with travel agencies.
In addition, even 76% of households have a prominent notice on the issuing of stay. Appalling fact, which is determined in this study is that 35% of owners of rural households had no access to financial assistance for the improvement of the tourism product. It was found that among
913EP 2017 (64) 3 (901-918)
SIGNIFICANT INVOLVEMENT OF AGRICULTURAL HOLDINGS IN RURAL TOURISM DEVELOPMENT IN SERBIA
respondents with no host does not advertise its tourist offer, but rely on oral recommendations of previous guests and internet ads are free. These results point to a weak level of organization in promoting the development of rural regions in Serbia (certificate H2b). Hypothesis H3, which indicate the subject of this study, which is that there is poor integration of agricultural holdings and tourism is confirmed on the basis of results. H4 hypothesis is confirmed, and that is that the owners of properties that provide tourism services see survival in greater integration with the tourism industry.
To facilitate the identification of and information among tourists regarding the level of quality offered, it is necessary homogenization of standards applied in different centres. Therefore, entrepreneurial associations and public authorities should participate actively in establishing common standards, and to promote and coordinate all actions on creating a draft accreditation. The development of entrepreneurial associations and networks lodging defending homogeneous models of quality management can be an element that contributes to the creation of confidence of tourists. Above all, the standards which highlights the difference in quality should take into account the expectations of tourists.
Based on the identified obstacles to the development of rural tourism in Serbia is possible to extract guidelines for future development and in the following way: finding mechanisms to prevent depopulation of rural areas (strengthening infrastructure, raising the attractiveness of the region, the enrichment of the tourist attractions, the diversification of the rural economy), standardization and uniformity within the rural tourism sector (categorization), more and better integration of agriculture and tourism in the planning documents and in practice, greater participation of the owners of rural households, as well as education and awareness of local people about the possibilities of rural tourism (training continuously and not sporadically), preserving the original rural environment, finding better solutions for the protection of monuments of culture in rural areas, find all possible ways to increase the involvement of farms in rural tourism. Staffing, technical and organizational, local governments in Serbia are still not sufficiently trained to be more involved in rural development.
References
1. Andereck, K., Valentine, K., Knopf, R., Vogt, C. (2005): Residents’ perceptions of community tourism impacts. Annals of Tourism Research, Vol. 32, No. 4, pp. 1056-1076.
2. Aguilo, E., Rosello, J. (2005): Host community perceptions: A cluster analysis. Annals of Tourism Research, Vol. 32, No. 4, pp. 925–941.
3. Akis, S., Peristianis, N., Warner, J. (1996): Residents’ attitudes to tourism development: The case of Cyprus. Tourism Management, Vol. 17, No. 7, pp. 481–494.
4. Albacete-Saez, C. A., Fuentes-Fuentes, M. M., Llorens-Montes, F. J. (2007): Service quality measurement in rural accommodation. Annals of Tourism Research, Vol. 34, No. 1, pp. 45-65.
914 EP 2017 (64) 3 (901-918)
Tamara Gajić, Aleksandra Vujko, Mirjana Penić, Marko D. Petrović, Milutin Mrkša
5. Allen, R.L., Hafer, H.R., Long, P.T., & Perdue, R.R. (1993): Rural residents’ attitudes toward recreation and tourism development. Journal of Travel Research, Vol. 31, No. 4, pp. 27–33.
6. Ateljevic, J. (2009): Tourism entrepreneurship and regional development: Example from New Zealand. International Journal of Entrepreneurial Behaviour and Research, Vol.15, No. 3, pp. 282–308.
7. Augustyn, M. M., Seakhoa-King, A. (2004): Is the SERVQUAL scale an adequate measure of quality in leisure, tourism and hospitality? Advances in Hospitality and Leisure, Vol. 1, 3-24.
8. Brady, M. K., Cronin, J. (2001): Some new thoughts on conceptualizing perceived service quality: A hierarchical approach. Journal of Marketing, Vol. 65, No. 3, pp. 34-49.
9. Bramwell, B., Lane, B. (1994): Rural tourism and sustainable rural development. Proceedings from the second international school of rural development. London: Channel View Books.
10. Brandth, B., Haugen, M.S. (2011): Farm diversification into tourism e implications for social identity? J. Rural. Stud. Vol. 27, 35- 44.
11. Brida, J., Osti, L., Barquet, A. (2010): Segmenting resident perceptions towards tourism: A cluster analysis with a multinomial logit model of a mountain community. International Journal of Tourism Research, Vol. 12, No. 5, pp. 591-602
12. Briedenhann, J., Wickens, E. (2004): Tourism routes as a tool for the economic development of rural areas – vibrant hope or impossible dream? Tourism Management, Vol. 25, pp. 71–79.
13. Burton, R.J.F. (2004): Seeing through the ‘good farmer’s’ eyes: towards developing an understanding of the social symbolic value of ‘productivist’ behaviour. Soc. Rural. Vol. 44, pp. 195-215.
14. Canoves, G., Villarino, M., Priestley, G.K., Blanco, A., (2004): Rural tourism in Spain: an analysis of recent evolution. Geoforum, Vol. 35, No. 6, pp. 755–769.
15. Carrillat, F. A., Jaramillo, F., Mulki, J. P. (2007): The validity of the SERVQUAL and SERVPERF scales. A meta-analytic view of 17 years of research across five continents. International Journal of Service Industry Management, Vol. 18, No. 5, pp. 472–490.
16. Cerezo, J.M., Lara de Vicente, F. (2005): El turismo como industria de Espana y de la Union Europea. In G. En Lopez, J.Y. Tomás, & F. Lara de Vicente (Eds.), Turismo sostenible: un enfoque multidisciplinar e internacional, pp. 255–287.
17. Chen, C. F., Chen, P. C. (2010): Resident attitudes toward heritage tourism development. Tourism Geographies, Vol. 12, No. 4, pp. 525–545.
18. Choi, H., Sirakaya, E. (2006): Sustainability indicators for managing community tourism. Tourism Management, Vol. 27, No. 6, pp. 1274-1289.

915EP 2017 (64) 3 (901-918)
SIGNIFICANT INVOLVEMENT OF AGRICULTURAL HOLDINGS IN RURAL TOURISM DEVELOPMENT IN SERBIA
19. Dyer, P., Gursoy, D., Sharma, B., Carter, J. (2007): Structural modelling of resident perceptions of tourism and associated development on the Sunshine Coast, Australia. Tourism Management, Vol. 28, No. 2, pp. 409-422.
20. Gursoy, D., Jurowski, C., Uysal, M. (2002): Resident attitudes: a structural modelling approach. Annals of Tourism Research, Vol. 29, No. 1, pp. 303-317.
21. Gajić, T. (2009): Karakteristike razvoja i uticaja turizma na ukupnu privredu Vojvodine. Ekonomika poljoprivrede, Vol. 56, No. 2, pp. 139-154.
22. Gurung, C., DeCoursey, M. (2000): Too much too fast: Lessons from Nepal’s lost kingdom of mustang. Tourism and development in mountain regions, Vol. 20, pp. 239-253.
23. Hall, D. (2004): Rural tourism development in South-Eastern Europe: transition and the search for sustainability. International Journal of Tourism Research, Vol. 6, pp. 165–176.
24. Hall, C., Jenkins, J. (1998): The Policy Dimensions of rural tourism and recreation. Tourism and Recreation in Rural Areas. Wiley, Chichester, pp. 19–42.
25. Huller, S., Heiny, J., Leonhauser, I. (2017): Linking Agricultural Food production and Rural Tourism in the Kazbegi District – a qualitative study. Annals of agrarian sciences, in press.
26. Iorio, M., Corsale, A. (2010): Rural tourism and livelihood strategies in Romania. Journal of Rural Studies. Vol. 26, No. 2, pp. 152-162.
27. Jafari, J. (1986): A systemic view of sociocultural dimensions of tourism. In President’s commission on American outdoors, pp. 33-50.
28. Jaafar, M., Rasoolimanesh, S., Lonik, K. (2015): Tourism growth and entrepreneurship: Empirical analysis of development of rural highlands. Tourism Man- agement Perspectives. Vol. 14, pp.17-24.
29. Jeong, J.S. (2017): Identifying priority areas for rural housing development using the participatory multi-criteria and contingent valuation methods in Alange reservoir area, Central Extremadura (Spain). Journal of Rural Studies, Vol. 50, pp. 117-128.
30. Kegel, H. (2003): The Significance of Subsistence Farming in Georgia as an Economic and Social Buffer. In Subsistence Agriculture in Central and Eastern Europe: How to Break the Vicious Circle? Institute of Agricultural Development in Central and Eastern Europe, pp. 147-160.
31. Kim, K., Uysal, M., Sirgy, M. (2013): How does tourism in a community impact the quality of life of community residents? Tourism Management. Vol. 36, pp. 527-540.
32. Ko, D., Stewart, W. (2002): A structural equation model of residents’ attitudes for tourism development. Tourism Management, 23, No. 5, pp. 521-530.
33. Komppula, R. (2007): Developing rural tourism in Finland through entrepreneurship. Advances in Tourism Research Series, pp. 123-134.

916 EP 2017 (64) 3 (901-918)
Tamara Gajić, Aleksandra Vujko, Mirjana Penić, Marko D. Petrović, Milutin Mrkša
34. Ladhari, R. (2009): A review of twenty years of SERVQUAL research. International Journal of Quality and Service Sciences. Vol. 1, No. 2, pp. 172–198.
35. Lankford, S. V., Howard, D. R. (1994): Developing a tourism impact attitude scale. Annals of Tourism Research. Vol. 21, No. 1, pp. 121-139.
36. Liu, A. (2006): Tourism in rural areas: Kedah, Malaysia. Tourism Management. Vol. 27, No. 5, pp. 878-889.
37. Long, P., Lane, B. (2000): Rural tourism development. 1999. Trends in Outdoor Recreation, Leisure and Tourism. CABI, Wallingford, pp. 299–308.
38. MacDonald, R., Jolliffe, L. (2003): Cultural rural tourism: evidence from Canada. Annals of Tourism Research, Vol. 30, pp. 307–322.
39. Nunkoo, R., Gursoy, D. (2012): Residents’ support for tourism: An identity perspective. Annals of Tourism Research, Vol. 39, No. 1, pp. 243–268.
40. Perez, S. (2010): El valor estrategico del turismo rural como alternativa sostenible de desarrollo territorial rural. The strategic value of rural tourism as a sustainable alternative for rural territorial development. Agronomia Colombiana. Vol. 28, No. 3, pp. 507–513.
41. Petric, L. (2003): Constraints and possibilities of the rural tourism development with the special stress on the case of Croatia. Paper presented at the ERSA conference papers.
42. Petrović, M. D., Blešić, I., Vujko, A., Gajić, T. (2017): The role of agritourism’s impact on the local community in a transitional society: A report from Serbia. Transylvanian Review of Administrative Sciences. Vol. 50, No. 1, pp. 146-163.
43. Rasoolimanesh, S.M. (2017): Urban vs. rural destinations: Residents’ perceptions, community participation and support for tourism development. Tourism Management. Vol. 60, pp. 147-158.
44. Rebecca Torres, R., Henshall Momsen, J. (2004): Challenges and potential for linking tourism and agriculture to achieve pro-poor tourism objectives, Sociol. Rural. Vol. 4, No. 4, pp. 294-318.
45. Reijonen, H. (2008): Understanding the small business owner: What they really aim at and how this relates to firm performance: A case study in North Karelia, Eastern Finland. Management Research News, Vol. 31, No. 8, pp. 616–629.
46. Rivera, M., Croes, R., Lee, S. H. (2015): Tourism development and happiness: A residents’ perspective. Journal of Destination Marketing and Management, Vol. 5, No. 1, pp. 5–15.
47. Sharpley, R. (2000): Tourism and sustainable development: Exploring the theoretical divide. Journal of Sustainable Tourism, Vol. 8, No. 1, pp. 1–19.
48. Sharpley, R., Jepson, d. (2011): Rural tourism a spiritual experience? Annals of Tourism Research, Vol. 38, pp. 52–71.

917EP 2017 (64) 3 (901-918)
SIGNIFICANT INVOLVEMENT OF AGRICULTURAL HOLDINGS IN RURAL TOURISM DEVELOPMENT IN SERBIA
49. Sharpley, R. (2014): Host perceptions of tourism: A review of the research. Tourism Management, Vol. 42, pp. 37-49.
50. Sinclair, M. G., Gursoy, D., Vieregge, M. (2014): Residents’ perceptions toward tourism development. Journal of Destination Marketing and Management, Vol. 4, pp. 36–45.
51. Vujko, A., Gajić, T. (2014): Opportunities for tourism development and cooperation in the region by improving the quality of supply - The Danube Cycle Route, Case Study. Economic Research, Vol. 27, No. 1, pp. 847-860.
52. Vargas, S.A., Porras-Bueno, N., Mejia, M. D. L. A. (2011): Explaining residents’ attitudes to tourism: Is a universal model possible? Annals of Tourism Research, Vol. 38, No. 2, pp. 460–480.
53. Wild, C., Cooper, C. P., Lockwood, A. (1994): Issues in ecotourism. Progress in Tourism, Recreation and Hospitality Management, Vol. 6, pp. 12–21.
918 EP 2017 (64) 3 (901-918)
Tamara Gajić, Aleksandra Vujko, Mirjana Penić, Marko D. Petrović, Milutin Mrkša
ZNAČAJNIJE UKLJUČIVANJE POLJOPRIVREDNIH GAZDINSTAVA U RURALNI TURISTIČKI RAZVOJ SRBIJE7
Tamara Gajić8, Aleksandra Vujko9, Mirjana Penić10, Marko D. Petrović11, Milutin Mrkša12
RezimePostoji veliki broj poljoprivrednih gazdinstava u Srbiji, koji su opstali s malo kapitala i
radne snage, a danas jednu od prespektiva pronalaze u integraciji s ruralnim turizmom. Razvoj turizma može da podstakne poboljšanje poljoprivredne proizvodnje, preradu i ponudu hrane, kao i uvođenje savremenih standarda koji se teško primenjuju na malim farmama zbog visokih troškova njihove primene. Ruralni turizam u Srbiji nije na zadovoljavajućem nivou razvoja, iako postoje svi preduslovi za intenzivniji razvoj. Zbog nepovoljne političke i ekonomske situacije u Srbiji ranijih godina, ruralni turizam nije naišao na podršku za povoljniji razvoj u odnosu na konkurenciju. Autori su pokušali da istraže stavove domaćina o trenutnom stanju i problemima s kojima se suočavaju u pružanju usluga u ruralnom turizmu. Istraživanje je obuhvatilo 15 opština u Vojvodini, Severozapadnoj i Severoistočnoj Srbiji, odnosno ukupno 46 vlasnika malih farmi. Upotrebom metode testa i upitnika, te obradom u SPSS programu, verzija 19.0, i analizom podataka došli su do potvrde određenih hipoteza od kojih su krenuli u istraživanju.
Ključne reči: ruralni turizam, gazdinstva, Srbija, integracija.
7 Istraživanje je podržalo Ministarstvo prosvete, nauke i tehnološkog razvoja, Republika Srbija (Grant III 47007).
8 Profesor strukovnih studija, dr Tamara Gajić, Visoka poslovna škola strukovnih studija Novi Sad, Ulica Vladimira Perića Valtera br. 4, Novi Sad, Srbija, Telefon: +381 63 565 544, E-mail: [email protected]
9 Dr Aleksandra Vujko, Predavač, Visoka poslovna škola strukovnih studija Novi Sad, Ulica Vladimira Parića Valtera br. 4, Novi Sad, Srbija, Telefon: +381 64 914 26 45, E-mail: [email protected]
10 Dr Mirjana Penić, Predavač, Prirodno-matematički fakultet, Trg Dositeja Obradovica br. 3, Novi Sad, Srbija, E-mail: [email protected].
11 Dr Marko D. Petrović, Naučni saradnik, Geografski institute “Jovan Cvijić”, Srpska akademija nauka i umetnosti (SANU), Ulica Đure Jakšića br. 9, 11000 Beograd, Srbija, E-mail: [email protected].
12 Dr Milutin Mrksa, Predavač, Visoka poslovna škola strukovnih studija u Novom Sadu, Ulica Vladimira Parića Valtera br. 4, Novi Sad, Srbija, E-mail: [email protected].
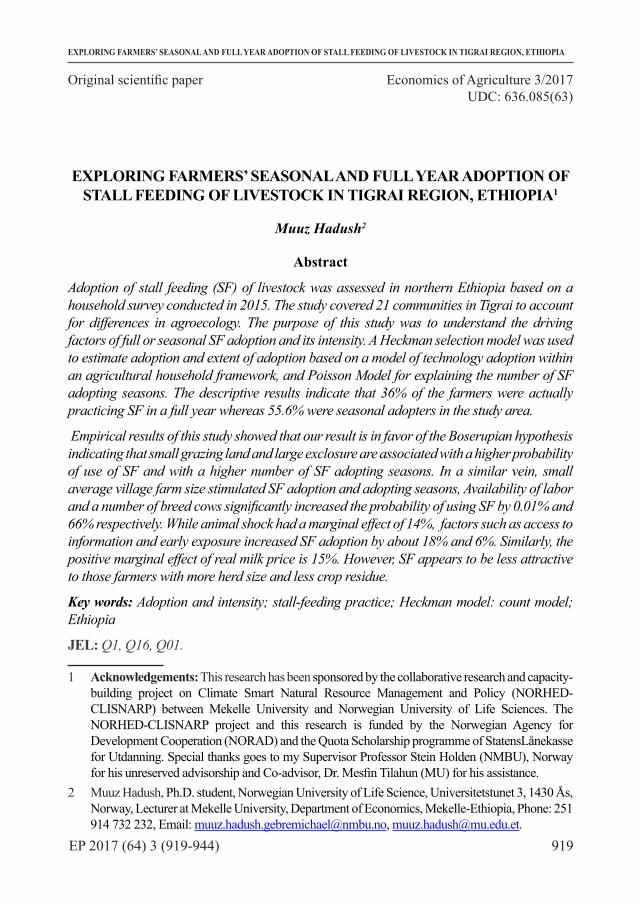
919
Original scientific paper Economics of Agriculture 3/2017UDC: 636.085(63)
EP 2017 (64) 3 (919-944)
EXPLORING FARMERS’ SEASONAL AND FULL YEAR ADOPTION OF STALL FEEDING OF LIVESTOCK IN TIGRAI REGION, ETHIOPIA
EXPLORING FARMERS’ SEASONAL AND FULL YEAR ADOPTION OF STALL FEEDING OF LIVESTOCK IN TIGRAI REGION, ETHIOPIA1
Muuz Hadush2
Abstract
Adoption of stall feeding (SF) of livestock was assessed in northern Ethiopia based on a household survey conducted in 2015. The study covered 21 communities in Tigrai to account for differences in agroecology. The purpose of this study was to understand the driving factors of full or seasonal SF adoption and its intensity. A Heckman selection model was used to estimate adoption and extent of adoption based on a model of technology adoption within an agricultural household framework, and Poisson Model for explaining the number of SF adopting seasons. The descriptive results indicate that 36% of the farmers were actually practicing SF in a full year whereas 55.6% were seasonal adopters in the study area.
Empirical results of this study showed that our result is in favor of the Boserupian hypothesis indicating that small grazing land and large exclosure are associated with a higher probability of use of SF and with a higher number of SF adopting seasons. In a similar vein, small average village farm size stimulated SF adoption and adopting seasons, Availability of labor and a number of breed cows significantly increased the probability of using SF by 0.01% and 66% respectively. While animal shock had a marginal effect of 14%, factors such as access to information and early exposure increased SF adoption by about 18% and 6%. Similarly, the positive marginal effect of real milk price is 15%. However, SF appears to be less attractive to those farmers with more herd size and less crop residue.
Key words: Adoption and intensity; stall-feeding practice; Heckman model: count model; Ethiopia
JEL: Q1, Q16, Q01.
1 Acknowledgements: This research has been sponsored by the collaborative research and capacity-building project on Climate Smart Natural Resource Management and Policy (NORHED-CLISNARP) between Mekelle University and Norwegian University of Life Sciences. The NORHED-CLISNARP project and this research is funded by the Norwegian Agency for Development Cooperation (NORAD) and the Quota Scholarship programme of StatensLånekasse for Utdanning. Special thanks goes to my Supervisor Professor Stein Holden (NMBU), Norway for his unreserved advisorship and Co-advisor, Dr. Mesfin Tilahun (MU) for his assistance.
2 Muuz Hadush, Ph.D. student, Norwegian University of Life Science, Universitetstunet 3, 1430 Ås, Norway, Lecturer at Mekelle University, Department of Economics, Mekelle-Ethiopia, Phone: 251 914 732 232, Email: [email protected], [email protected].
920 EP 2017 (64) 3 (919-944)
Muuz Hadush
Introduction
In most sub-Saharan African (SSA) countries, communal grazing lands are important sources of livestock feed (ILRI, 2000).Overstocking is identified to primarily drive degradation of rangelands, declining of vegetation productivity and eventually livestock productivity, and loss of resilience of the rangeland for droughts (Lal and Stewart, 2010). Indeed, overgrazing is reported to cause about half (49%) of the land degradation in SSA followed by deforestation (27%) (Kirui et al., 2014). The resource loss due to land degradation in the region is huge (Maitima, 2009). The estimated annual costs of land degradation in Ethiopia is 3% of agricultural GDP (Yesuf et al.,2008) The role of agricultural technology is widely recognized as a key means of enhancing productivity (Diao and Nin-Pratt, 2007). However, many of these practices have not been widely adopted by the smallholder farmers (Odame et al., 2013)
Animal nutritionists point out that poor animal feed is the leading factors for low livestock productivity. Whereas the veterinary experts argue that poor animal health as the main constraint (Amudavi et al., 2009). Livestock production, in Ethiopia, is low in productivity in terms of milk and meat production per animal (Negassa et al., 2012). For instance, IFAD (2007) showed that inadequate livestock nutrition and poor feeding practices are the main reasons for low animal production. As a result, the average milk production was estimated to be 1.86 liters/cow per day and the per capita milk consumption was about 19.2 Kg/ year in Ethiopia (FAO, 2009).
Despite natural grazing lands are deficient in terms of nutrition quality and quantity due to drought, cattle farming is still heavily dependent on free grazing in Ethiopia (USAID, 2013). Benin (2006) indicated that increasing populations result in high demand for arable land for food production and settlement for humans, reducing the size of land available for natural grazing. An exclosure is also responsible for shrinking grazing land and grass production (Mekuria et al., 2011) despite the fact that it can provide economic and ecological benefits (Babulo et al.,2009). In addition to feed and water shortage, animal diseases due to free grazing, poor input supply, low technology use and poor marketing have been cited as extra factors constraining livestock performance (Yilma et al., 2011; Gebremedhin et al., 2009).
Improving feed qualities through the use of new technologies such as forage, rotational and stall feeding (SF)3 are suggested as not only economically viable (Garcia et al.,2008; Lenaerts, 2013; Beshir, 2014) but also ecologically sustainable in mitigating feed shortages. Besides, Baltenweck et al.(2007) in Uganda and (Holtland, 2007) in Tanzania reported that zero grazing was more economically and environmentally viable. Staat et al. (2003) complement the profitability of SF in Kenya. Ethiopia has a grand plan to transform its economy into a green economy (FDRE, 2011). A transformation of
3 Full Stall Feeding (FSF) adoption in this paper is defined as the practice of feeding some or all animals in a restricted open homestead land in full year and Seasonal Stall Feeding (SSF) for at least one season of the year. Stall fed cattle are not allowed for free movement unless they are out for watering, ploughing and threshing purpose (Lenaerts, 2013)

921EP 2017 (64) 3 (919-944)
EXPLORING FARMERS’ SEASONAL AND FULL YEAR ADOPTION OF STALL FEEDING OF LIVESTOCK IN TIGRAI REGION, ETHIOPIA
the livestock sector is an important part of this plan which targets to reduce greenhouse gas emissions through increasing livestock productivity. The switch from free grazing (FG) to Stall Feeding (SF)1 is an important part of this transition and was introduced since 2005 (Lenaerts, 2013; Klitzing et al., 2014; Benin, 2006) in the study area. A recent study by Klitzing et al. (2014) found that fodder productivity from SF schemes is higher than from FG schemes, leading to overall livestock productivity.
However, its adoption rate remains below its expectation (Lenaerts, 2013; FAO, 2007; Bishu, 2014). A recent survey result by BoARD (2012) evidenced that 43.10% of the respondents were found to use SF in line with Bishu (2014) whose study revealed that 22.7% of farmers practiced SF in Tigrai region. Similarly, Benin (2006) indicated that adoption of SF practice is 48% in Amhara region while De Cao et al. (2013) found that 33% of the sample farmer exercise zero grazing (ZG) in Harar. While the finding of low levels of adoption is well accepted (Lenaerts, 2013), to our knowledge factors influencing SF adoption decision were neither properly identified nor proper empirical design was followed. This study then investigates the nuts and bolts of achieving such a transition in the highlands of northern Ethiopia.
This study aims to contribute to the understanding of the drivers that determine the adoption and intensity of adoption of SF. Technology adoption has long preoccupied economists concerned with the crop productivity potential in less developed countries (LDCs). Moreover, the general theory on adoption is well developed (Feder et al., 1985; Feder and Umali, 1993).Thus, this study addresses the following research questions: Why some farmers have switched from FG to SF practice while others have not? What are the key determinants that influence farmer’s decision to use and intensify SF? Boserup’s (1965) seminal work indicated that land constraints cause agricultural intensification. With regard to this, Kruseman et al. (2006) and Pender et al. (2006) found positive effects of land shortage on fertilizer use and labor per hectare in Tigrai region. In line to this, our first hypothesis is to test the Boserupian theory that grazing land shortage leads to more SF adoption and SF adoption is associated with the large closed area.
The recent findings from Gunte (2015) revealed that low adoption of improved forage is caused by farmers’ resources scarcity such as labor and farm size. Our hypothesis in line to this is that individuals with more labor and breed cows are likely to adopt SF whereas individuals with more herd size and less crop residue are less likely to adopt SF. We further propose that early exposure to SF and information has a positive effect on farmers’ adoption and intensity. In line with Boserupian hypothesis, our finding suggests that grazing land shortage increased SF adoption and number of SF adopting seasons. We also found that factors such as access to information, literacy rate, and availability of labor, the number of breed cows, animal shock and exposure to SF significantly and positively influenced SF adoption and its intensity. However, SF appears to be less attractive to those farmers with more herd-size and less crop residue, particularly to those that are with a longer distance to animal water and crop-residue sites.

922 EP 2017 (64) 3 (919-944)
Muuz Hadush
Background and Empirical Review of Improved Cattle Feeding Adoption
Free grazing is a dominant form of livestock rearing in Ethiopia. Most of the grazing lands are grazed and trampled by livestock year round with no resting. This causes in soil compaction and land degradation and hence low quantity and quality of feed (Nyssen et al., 2007).The expansion of improved feeding has been suggested by policy makers with the objectives of (1) increasing cattle and fodder productivity; (2) halting land degradation, and (3) generating income. SF or ZG have been widely recommended and was practiced in the highlands of Kenya and Tanzania (Gass and Sumberg, 1993) as well as Ethiopia (Lenaerts, 2013; Klitzing et al., 2014; Bishu, 2014) while its pace of coverage was slower-than-anticipated.
The practice of SF in Uganda was found to be economically and ecologically sustainable (Garcia et al., 2008). A study by Funte et al. (2009) showed that ZG practices are successful in Harar but low in Tigrai and southern regions. De Cao et al. (2013) revealed that ZG is a potentially useful practice against low productivity and limited feed availability. According to Bishu (2014) and Ahmed et al. (2004), SF is believed not only to improve the productivity of animals but also to protect against transmissible diseases; minimize soil erosion, and conserve manure to enrich soils. Benin (2006) who looked at the adoption of SF in Ethiopia indicated that SF is positively influenced by access to credit, a number of breed cows and land distribution.
Similarly, Gebremedhin et al. (2003) and Beshir (2014) showed that household resource endowment, especially land and labor, herd size and distance to road were key factors influencing forage technology adoption in the highlands of Ethiopia while Baltenweck et al. (2007) reported that farming experience and distance to road were significant factors of residue feeding adoption. A recent study of Gunte (2015) forage adopters had more family labor, reside closer to markets and had better access to information compared to non-adopters in Ethiopia.
The finding from Turinawe et al. (2011) in Uganda proved that a number of improved cows had a positive significant relationship with the use of forage technology. Benin (2006) also found that almost 80 percent of the farmers that adopted improved breeds also adopted SF, and multiple regression analysis by Winsten et al. (2000) confirmed that farmers using confinement feeding were more likely to use milk enhancing technologies than using extensive feeding in the USA. This implies that SF performs best when it is complemented by other related technologies and those who have improved cow are likely to adopt SF. Foltz and Lang (2003) in the study of rotational grazing adoption found that rotational grazing adopters have more education and less land holding size in the US.
The positive role of information diffusion about the new technology through media in the adoption of new technologies are also well documented in the literature (Feder and Umali, 1993). Wünscher et al. (2004) noted the adoption rate of improved forage was found to be low, and lack of information about the use hinder adoption in Costa Rica. The social network may also enable farmers to learn about benefits of new practice from their peers, or respond to their peers’ experience so that facilitating the adoption of new practice (Conley and Udry, 2010). Transfer income received from the personal social network may facilitate the adoption
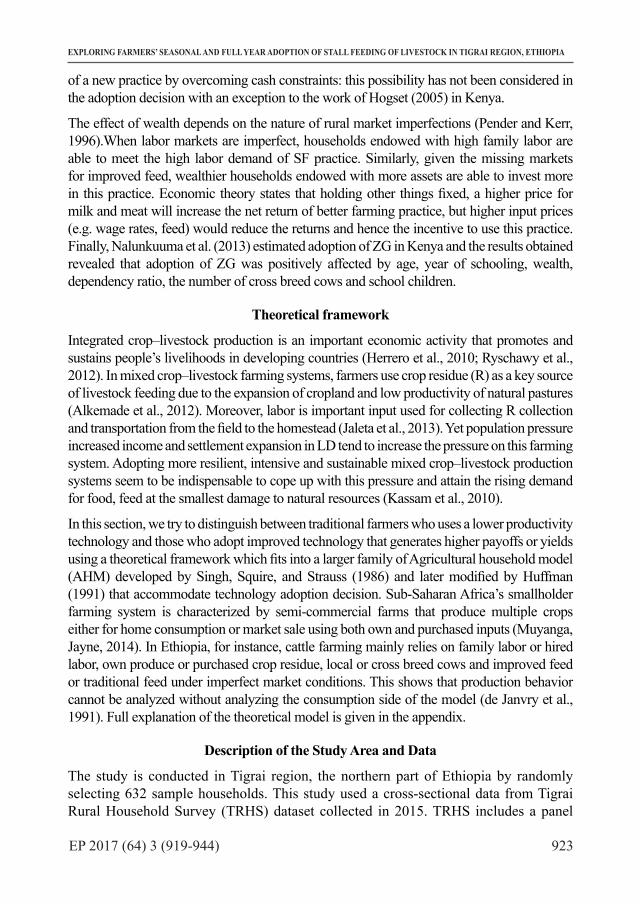
923EP 2017 (64) 3 (919-944)
EXPLORING FARMERS’ SEASONAL AND FULL YEAR ADOPTION OF STALL FEEDING OF LIVESTOCK IN TIGRAI REGION, ETHIOPIA
of a new practice by overcoming cash constraints: this possibility has not been considered in the adoption decision with an exception to the work of Hogset (2005) in Kenya.
The effect of wealth depends on the nature of rural market imperfections (Pender and Kerr, 1996).When labor markets are imperfect, households endowed with high family labor are able to meet the high labor demand of SF practice. Similarly, given the missing markets for improved feed, wealthier households endowed with more assets are able to invest more in this practice. Economic theory states that holding other things fixed, a higher price for milk and meat will increase the net return of better farming practice, but higher input prices (e.g. wage rates, feed) would reduce the returns and hence the incentive to use this practice. Finally, Nalunkuuma et al. (2013) estimated adoption of ZG in Kenya and the results obtained revealed that adoption of ZG was positively affected by age, year of schooling, wealth, dependency ratio, the number of cross breed cows and school children.
Theoretical framework
Integrated crop–livestock production is an important economic activity that promotes and sustains people’s livelihoods in developing countries (Herrero et al., 2010; Ryschawy et al., 2012). In mixed crop–livestock farming systems, farmers use crop residue (R) as a key source of livestock feeding due to the expansion of cropland and low productivity of natural pastures (Alkemade et al., 2012). Moreover, labor is important input used for collecting R collection and transportation from the field to the homestead (Jaleta et al., 2013). Yet population pressure increased income and settlement expansion in LD tend to increase the pressure on this farming system. Adopting more resilient, intensive and sustainable mixed crop–livestock production systems seem to be indispensable to cope up with this pressure and attain the rising demand for food, feed at the smallest damage to natural resources (Kassam et al., 2010).
In this section, we try to distinguish between traditional farmers who uses a lower productivity technology and those who adopt improved technology that generates higher payoffs or yields using a theoretical framework which fits into a larger family of Agricultural household model (AHM) developed by Singh, Squire, and Strauss (1986) and later modified by Huffman (1991) that accommodate technology adoption decision. Sub-Saharan Africa’s smallholder farming system is characterized by semi-commercial farms that produce multiple crops either for home consumption or market sale using both own and purchased inputs (Muyanga, Jayne, 2014). In Ethiopia, for instance, cattle farming mainly relies on family labor or hired labor, own produce or purchased crop residue, local or cross breed cows and improved feed or traditional feed under imperfect market conditions. This shows that production behavior cannot be analyzed without analyzing the consumption side of the model (de Janvry et al., 1991). Full explanation of the theoretical model is given in the appendix.
Description of the Study Area and Data
The study is conducted in Tigrai region, the northern part of Ethiopia by randomly selecting 632 sample households. This study used a cross-sectional data from Tigrai Rural Household Survey (TRHS) dataset collected in 2015. TRHS includes a panel
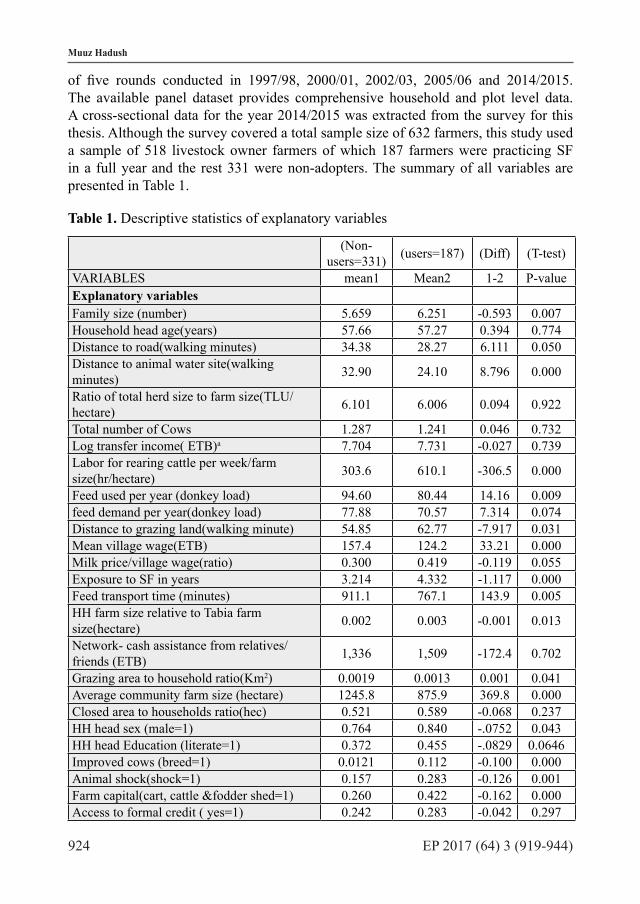
924 EP 2017 (64) 3 (919-944)
Muuz Hadush
of five rounds conducted in 1997/98, 2000/01, 2002/03, 2005/06 and 2014/2015. The available panel dataset provides comprehensive household and plot level data. A cross-sectional data for the year 2014/2015 was extracted from the survey for this thesis. Although the survey covered a total sample size of 632 farmers, this study used a sample of 518 livestock owner farmers of which 187 farmers were practicing SF in a full year and the rest 331 were non-adopters. The summary of all variables are presented in Table 1.
Table 1. Descriptive statistics of explanatory variables
(Non-users=331) (users=187) (Diff) (T-test)
VARIABLES mean1 Mean2 1-2 P-valueExplanatory variablesFamily size (number) 5.659 6.251 -0.593 0.007Household head age(years) 57.66 57.27 0.394 0.774Distance to road(walking minutes) 34.38 28.27 6.111 0.050Distance to animal water site(walking minutes) 32.90 24.10 8.796 0.000
Ratio of total herd size to farm size(TLU/hectare) 6.101 6.006 0.094 0.922
Total number of Cows 1.287 1.241 0.046 0.732Log transfer income( ETB)a 7.704 7.731 -0.027 0.739Labor for rearing cattle per week/farm size(hr/hectare) 303.6 610.1 -306.5 0.000
Feed used per year (donkey load) 94.60 80.44 14.16 0.009feed demand per year(donkey load) 77.88 70.57 7.314 0.074Distance to grazing land(walking minute) 54.85 62.77 -7.917 0.031Mean village wage(ETB) 157.4 124.2 33.21 0.000Milk price/village wage(ratio) 0.300 0.419 -0.119 0.055Exposure to SF in years 3.214 4.332 -1.117 0.000Feed transport time (minutes) 911.1 767.1 143.9 0.005HH farm size relative to Tabia farm size(hectare) 0.002 0.003 -0.001 0.013
Network- cash assistance from relatives/friends (ETB) 1,336 1,509 -172.4 0.702
Grazing area to household ratio(Km2) 0.0019 0.0013 0.001 0.041Average community farm size (hectare) 1245.8 875.9 369.8 0.000Closed area to households ratio(hec) 0.521 0.589 -0.068 0.237HH head sex (male=1) 0.764 0.840 -.0752 0.043HH head Education (literate=1) 0.372 0.455 -.0829 0.0646Improved cows (breed=1) 0.0121 0.112 -0.100 0.000Animal shock(shock=1) 0.157 0.283 -0.126 0.001Farm capital(cart, cattle &fodder shed=1) 0.260 0.422 -0.162 0.000Access to formal credit ( yes=1) 0.242 0.283 -0.042 0.297

925EP 2017 (64) 3 (919-944)
EXPLORING FARMERS’ SEASONAL AND FULL YEAR ADOPTION OF STALL FEEDING OF LIVESTOCK IN TIGRAI REGION, ETHIOPIA
information(TV, radio & mobile=1) 0.136 0.305 -0.168 0.000Dependent variables Full SF adoption (SF in full year round) (0,1) 63.90 36.10 Seasonal adoption (SF at least in one season)(0,1) 44.40 55.60
Share of cattle under SF in full year(ratio) ----- 0.779Share of cattle under SF in season(ratio) ----- 0.631
Source: own compilation, 2016: a cash assistance from relatives/friends plus safety net: 1 $USD 21 Ethiopian Birr (ETB).
Table 1 showed that the percentage of users and non-users in the full year round were 36.10% and 63.9 % with a mean intensity ratio of 0.779. However, farmers practicing SF at least in one season account 55.6 %, whereas those non-users were 44.4% with an intensity ratio of 0.63. The average grazing area is less than 210 ha per 1839 household heads including the total exclosure area of 685 ha. The average grazing to household ratio is 0.0013km2 for users compared to 0.0019 km2 for non-users. One km2 grazing land is available for at least 2506 SF users and serves 3289 non-user farmers. The average village farm size is 875.9 ha for users as compared to 1245.8 ha for non-users. The result also indicated that the mean family size of adopting farmers is 6.3, with an average age of 55.3 years. On average, farmers who adopt SF spend 28.3 and 24 minutes to travel to the nearest road service and animal water site while non-users have more record of walking time. SF users owned a herd size of 6 TLU units with a mean of 1.24 milking cows while those non-users of SF owned about 6.1 TLU units with a mean of 1.29 milking cows.
Farmers using SF had higher mean labor time of 610 hours than the non-users with only 303 hours per week. Farmers using SF also spend 62.3 minutes than non-users with only 54.9 minutes per day to reach free grazing land. SF users, on average, get 1509 ETB as transfer income from friends and/or relatives as a proxy for social network compared to mean of 1336 ETB for non –users. Besides, the average crop residue collecting time for SF users was also smaller (767 min) than non-users (911 min). In relation to the exposure, on average SF users had 4.3 years’ experience than non–users with 3.2 years. Moreover, the two groups are different by farm size relative to village farm size, showing 0.003 ha for users and 0.002ha for non-users.
Among male farmers, 76% are non-adopters and 84% are adopters. SF users had a significantly higher literacy level (46%) than that of non-users (37%). SF users own breed cows, on average 9 times higher than that of non-users. Adopters of SF seem to have higher mean value (28%) in terms of animal shock exposure. Moreover, 20% of the farmers reported to having access to information via radio, TV or mobile, of which 31% of them were found to be SF users.
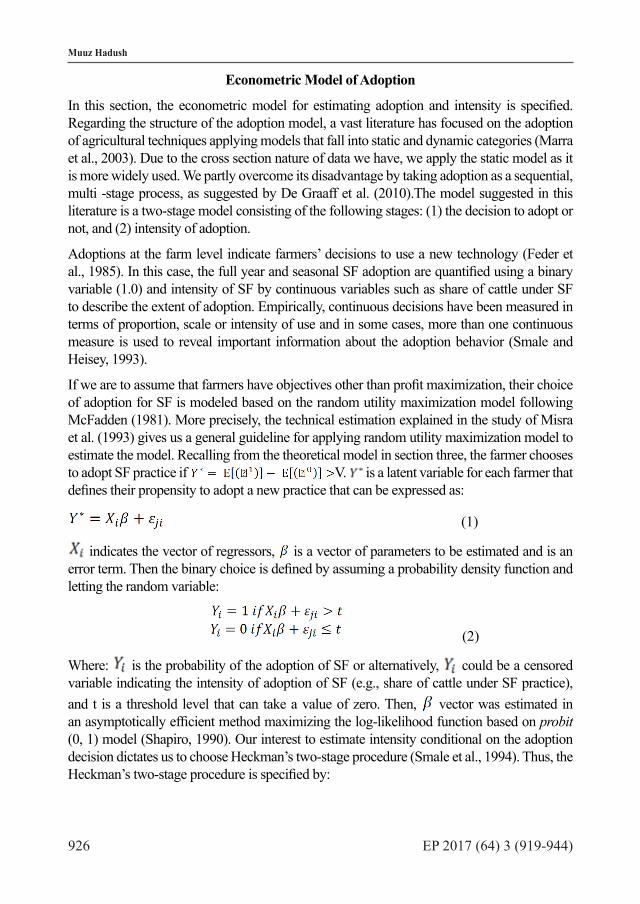
926 EP 2017 (64) 3 (919-944)
Muuz Hadush
Econometric Model of Adoption
In this section, the econometric model for estimating adoption and intensity is specified. Regarding the structure of the adoption model, a vast literature has focused on the adoption of agricultural techniques applying models that fall into static and dynamic categories (Marra et al., 2003). Due to the cross section nature of data we have, we apply the static model as it is more widely used. We partly overcome its disadvantage by taking adoption as a sequential, multi -stage process, as suggested by De Graaff et al. (2010).The model suggested in this literature is a two-stage model consisting of the following stages: (1) the decision to adopt or not, and (2) intensity of adoption.
Adoptions at the farm level indicate farmers’ decisions to use a new technology (Feder et al., 1985). In this case, the full year and seasonal SF adoption are quantified using a binary variable (1.0) and intensity of SF by continuous variables such as share of cattle under SF to describe the extent of adoption. Empirically, continuous decisions have been measured in terms of proportion, scale or intensity of use and in some cases, more than one continuous measure is used to reveal important information about the adoption behavior (Smale and Heisey, 1993).
If we are to assume that farmers have objectives other than profit maximization, their choice of adoption for SF is modeled based on the random utility maximization model following McFadden (1981). More precisely, the technical estimation explained in the study of Misra et al. (1993) gives us a general guideline for applying random utility maximization model to estimate the model. Recalling from the theoretical model in section three, the farmer chooses to adopt SF practice if V. is a latent variable for each farmer that defines their propensity to adopt a new practice that can be expressed as:
(1)
indicates the vector of regressors, is a vector of parameters to be estimated and is an error term. Then the binary choice is defined by assuming a probability density function and letting the random variable:
(2)
Where: is the probability of the adoption of SF or alternatively, could be a censored variable indicating the intensity of adoption of SF (e.g., share of cattle under SF practice), and t is a threshold level that can take a value of zero. Then, vector was estimated in an asymptotically efficient method maximizing the log-likelihood function based on probit (0, 1) model (Shapiro, 1990). Our interest to estimate intensity conditional on the adoption decision dictates us to choose Heckman’s two-stage procedure (Smale et al., 1994). Thus, the Heckman’s two-stage procedure is specified by:
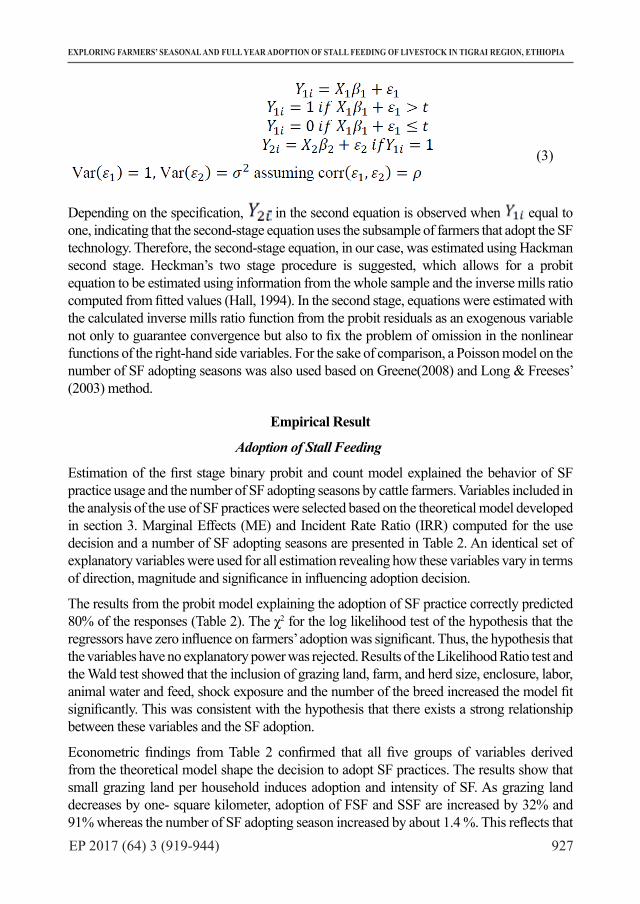
927EP 2017 (64) 3 (919-944)
EXPLORING FARMERS’ SEASONAL AND FULL YEAR ADOPTION OF STALL FEEDING OF LIVESTOCK IN TIGRAI REGION, ETHIOPIA
(3)
Depending on the specification, in the second equation is observed when equal to one, indicating that the second-stage equation uses the subsample of farmers that adopt the SF technology. Therefore, the second-stage equation, in our case, was estimated using Hackman second stage. Heckman’s two stage procedure is suggested, which allows for a probit equation to be estimated using information from the whole sample and the inverse mills ratio computed from fitted values (Hall, 1994). In the second stage, equations were estimated with the calculated inverse mills ratio function from the probit residuals as an exogenous variable not only to guarantee convergence but also to fix the problem of omission in the nonlinear functions of the right-hand side variables. For the sake of comparison, a Poisson model on the number of SF adopting seasons was also used based on Greene(2008) and Long & Freeses’ (2003) method.
Empirical Result
Adoption of Stall Feeding
Estimation of the first stage binary probit and count model explained the behavior of SF practice usage and the number of SF adopting seasons by cattle farmers. Variables included in the analysis of the use of SF practices were selected based on the theoretical model developed in section 3. Marginal Effects (ME) and Incident Rate Ratio (IRR) computed for the use decision and a number of SF adopting seasons are presented in Table 2. An identical set of explanatory variables were used for all estimation revealing how these variables vary in terms of direction, magnitude and significance in influencing adoption decision.
The results from the probit model explaining the adoption of SF practice correctly predicted 80% of the responses (Table 2). The χ2 for the log likelihood test of the hypothesis that the regressors have zero influence on farmers’ adoption was significant. Thus, the hypothesis that the variables have no explanatory power was rejected. Results of the Likelihood Ratio test and the Wald test showed that the inclusion of grazing land, farm, and herd size, enclosure, labor, animal water and feed, shock exposure and the number of the breed increased the model fit significantly. This was consistent with the hypothesis that there exists a strong relationship between these variables and the SF adoption.
Econometric findings from Table 2 confirmed that all five groups of variables derived from the theoretical model shape the decision to adopt SF practices. The results show that small grazing land per household induces adoption and intensity of SF. As grazing land decreases by one- square kilometer, adoption of FSF and SSF are increased by 32% and 91% whereas the number of SF adopting season increased by about 1.4 %. This reflects that

928 EP 2017 (64) 3 (919-944)
Muuz Hadush
smaller grazing is associated with the more intensive use of SF; thereby providing more evidence for the Boserupian theory of population-induced intensification. The findings support the Boserup (1965) hypothesis that population pressure motivates farmers to adopt more intensive cattle farming practices, and are consistent with the findings of Kruseman et al.,(2006) and Benin (2006). Besides, the ratio of the exclosure to the total users appear to be positive factors, causing FSF and SSF adoption to increase by about 15 % and adopting seasons by 29 %. While the ratio of individual farm size to village farm size did not affect the decision to us SF, the average village farm again supports the result of Benin (2006) who found that households that own less land are more likely to apply modern agricultural inputs and use more labor and oxen.
Results from Column (1-4) of Table 2 showed that results in the SSF indicated that possession of milking cow contributes positively to the use of SSF.
Table 2. First stage Heckman Estimation of full year (FSF) and Seasonal (SSF) AdoptionMEb(1) ME(2) Count(3) IRRc(4)
VARIABLES Full Seasonal Seasons of SF Seasons of SF
Closed area to households ratio(hec) 0.133*** 0.152*** 0.256*** 1.291***(0.0383) (0.0443) (0.0593) (0.0765)
HH farm size relative to village farm size(hectare) 0.278 -0.857 -0.336 -0.336
(6.195) (8.124) (6.782) (6.782)Grazing area to household ratio(Km2) -32.22** -90.73*** -98.66*** 1.42e-4***
(12.85) (14.64) (21.78) (3.09e-4)Average community farm size (hectare) -8.70e-05** 5.18e-06 -0.000205*** 0.9997***
(4.23e-05) (4.33e-05) (6.13e-05) (0.0000)
Network- cash assistance from relatives/friends (ETB)
4.38e-06 1.44e-05* 1.18e-05* 1.0000*
(7.13e-06) (8.71e-06) (6.11e-06) (6.11e-06)information(access to Tv, radio &mobile=1) 0.181*** 0.197*** 0.333*** 1.3947***
(0.0649) (0.0580) (0.0790) (0.1101)Total number of milking cows -0.0108 0.0400* 0.0372 1.0379
(0.0196) (0.0219) (0.0256) (0.0266)Distance to animal water site ( minutes) -0.00537*** -0.00391*** -0.00922*** 0.9908***
(0.00138) (0.00137) (0.00206) (0.0020)Improved cows (breed=1) 0.661*** 0.323*** 0.700*** 2.0133***
(0.0636) (0.0660) (0.136) (2.748)Exposure to SF in years 0.0595*** 0.0927*** 0.0746*** 1.0774***
(0.0188) (0.0241) (0.0251) (0.0270)Labor for rearing cattle per week/farm size(hr/ha) 0.000111*** 7.00e-05* 0.000147*** 1.0001***
(3.26e-05) (3.57e-05) (4.18e-05) (0.0000)Family size (number) 0.0238** 0.0208* 0.0397** 1.0405**
(0.0112) (0.0122) (0.0163) (0.0169)Household head age(years) -0.00117 -0.00362* -0.00555** 0.9944**
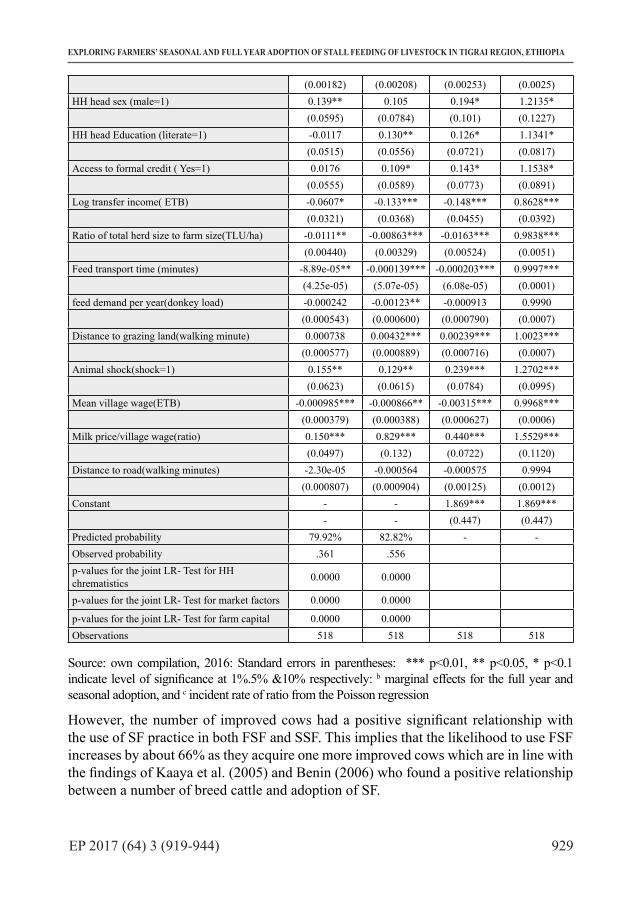
929EP 2017 (64) 3 (919-944)
EXPLORING FARMERS’ SEASONAL AND FULL YEAR ADOPTION OF STALL FEEDING OF LIVESTOCK IN TIGRAI REGION, ETHIOPIA
(0.00182) (0.00208) (0.00253) (0.0025)HH head sex (male=1) 0.139** 0.105 0.194* 1.2135*
(0.0595) (0.0784) (0.101) (0.1227)HH head Education (literate=1) -0.0117 0.130** 0.126* 1.1341*
(0.0515) (0.0556) (0.0721) (0.0817)Access to formal credit ( Yes=1) 0.0176 0.109* 0.143* 1.1538*
(0.0555) (0.0589) (0.0773) (0.0891)Log transfer income( ETB) -0.0607* -0.133*** -0.148*** 0.8628***
(0.0321) (0.0368) (0.0455) (0.0392)Ratio of total herd size to farm size(TLU/ha) -0.0111** -0.00863*** -0.0163*** 0.9838***
(0.00440) (0.00329) (0.00524) (0.0051)Feed transport time (minutes) -8.89e-05** -0.000139*** -0.000203*** 0.9997***
(4.25e-05) (5.07e-05) (6.08e-05) (0.0001)feed demand per year(donkey load) -0.000242 -0.00123** -0.000913 0.9990
(0.000543) (0.000600) (0.000790) (0.0007)Distance to grazing land(walking minute) 0.000738 0.00432*** 0.00239*** 1.0023***
(0.000577) (0.000889) (0.000716) (0.0007)Animal shock(shock=1) 0.155** 0.129** 0.239*** 1.2702***
(0.0623) (0.0615) (0.0784) (0.0995)Mean village wage(ETB) -0.000985*** -0.000866** -0.00315*** 0.9968***
(0.000379) (0.000388) (0.000627) (0.0006)Milk price/village wage(ratio) 0.150*** 0.829*** 0.440*** 1.5529***
(0.0497) (0.132) (0.0722) (0.1120)Distance to road(walking minutes) -2.30e-05 -0.000564 -0.000575 0.9994
(0.000807) (0.000904) (0.00125) (0.0012)Constant - - 1.869*** 1.869***
- - (0.447) (0.447)Predicted probability 79.92% 82.82% - -Observed probability .361 .556p-values for the joint LR- Test for HH chrematistics 0.0000 0.0000
p-values for the joint LR- Test for market factors 0.0000 0.0000
p-values for the joint LR- Test for farm capital 0.0000 0.0000Observations 518 518 518 518
Source: own compilation, 2016: Standard errors in parentheses: *** p<0.01, ** p<0.05, * p<0.1 indicate level of significance at 1%.5% &10% respectively: b marginal effects for the full year and seasonal adoption, and c incident rate of ratio from the Poisson regression
However, the number of improved cows had a positive significant relationship with the use of SF practice in both FSF and SSF. This implies that the likelihood to use FSF increases by about 66% as they acquire one more improved cows which are in line with the findings of Kaaya et al. (2005) and Benin (2006) who found a positive relationship between a number of breed cattle and adoption of SF.
930 EP 2017 (64) 3 (919-944)
Muuz Hadush
Household size significantly increased FSF or SSF adoption as well as SF adopting seasons. Male farmers were more likely to participate; the probability of male farmers adopting was 14% higher than the probability for female farmers in FSF adoption. Our result agreed with the work of (Beshir, 2014; Gunte, 2015)) who found a direct relation between male farmers and forage adoption in Ethiopia. The results of the study conform to the expectations that age is negatively associated with the probability of SSF adoption indicating that younger farmers are more likely to use SF. Shiferaw and Holden (1998) found that there was an inverse relationship between age and soil conservation practice adoption in Ethiopia. This is probably because older farmers are less energetic to manage the activities of SF practice as compared to the more energetic young farmers. Earlier work by Fufa and Hassan (2006) found that age of a farmer reduces the probability of using agricultural technologies.
Education is a significant factor to induce and realize the benefits of a new technology through the ability to acquire information (Musaba, 2010). As anticipated, literacy had a positive significant effect on adoption of SF, implying that educated farmers are about 13% to use SSF and increase adopting seasons by about 13% than their illiterate counterpart in line with Gunte (2015) who found out that literacy had a positive and significant influence on the adoption of forage technology. Results further showed that access to credit had a positive impact on the use of SF, increasing SSF adoption by 11% and SF adopting seasons by 15%. Similar signs are found in the works of (Mugisha et al., 2004; Beshir, 2014) which can be attributed to the fact that some of the investments of inputs need more money.
Transfer income negatively influenced the decision to use FSF and SSF as well as adopting seasons. The possible justification for this result is that transfer income might be used to utilize other inputs such as fertilizer, breed cow, and labor. This is contrary to the findings by Gebremedhin et al. (2003) but consistent with the findings of Beshir (2014), who found that off-farm income negatively affected forage technology adoption. Access to information did have a positive significant effect on the use of SF (18%) and adopting seasons (40%). This is possible where the information is relevant to livestock production in line with the proposition of Feder and Slade (1984) and Gunte (2015) who stated that adopters of improved forages had higher access to a mobile telephone.
Endowments of livestock as an asset may influence the decision to use SF practice through two mechanisms. Ownership of more livestock may discourage SF adoption by increasing the cost of management but at the same time encourage farmers to adopt SF by making cash available from an animal sale to finance this cost. It was expected that herd size relative to farm size has an inverse relationship with adoption, and the result confirms herd size influenced negatively the use of FSF or SSF adoption. This is possible in the study area where farmers with more herd size cannot afford to stall-fed them on the limited homestead grazing land particularly when feed is available on communal lands. Each additional animal is associated with an estimated 1.1% decrease in the use of FSF or SSF and 1.6% decrease in adopting seasons in contrast to the result of Beshir (2014) who found a positive relation between forage adoption and herd size.

931EP 2017 (64) 3 (919-944)
EXPLORING FARMERS’ SEASONAL AND FULL YEAR ADOPTION OF STALL FEEDING OF LIVESTOCK IN TIGRAI REGION, ETHIOPIA
Farmers with higher labor supply relative to farm size were more likely to allocate more cattle to SF, suggesting that SF use imposes an additional labor on farmers. A one hour increase in labor supply increased the adoption of FSF and SSF by 0.01%. The positive relationship agrees with Beshir (2014) and Gunte (2015). As a noticeable finding, results further indicated that social network had the expected positive and significant effect on the probability of SF adoption, showing that farmers with more peers are willing to adopt the practice in favor the results of Hogset (2005) in that transfer income was positively related to adoption in Kenya. This is attributed to the fact that access to informal credit minimizes the problem of liquidity constraint for investments.
The negative and significant relation between feed need and use of SF seem to agree with the expectation, suggesting for every additional donkey load feed demand, the probability of using SSF reduces by 0.1%. This implies that crop residues plays a complementary role for SF and used to fill feed gaps during periods of inadequate crop residues (McIntire and Debrah, 1987) and SF improve the utilization of crop residues and straw even in the presence of abundant crop residues. The negative effect of distance to an animal water source and crop residue on the use of SF supported the hypothesis that long distance and the high cost of transport are negatively associated with the use of SF practice and adopting seasons. The estimated coefficients for distance to an animal water source and transport indicated that the probability of SF adoption is reduced by 0.05% and 0.01% when traveling time gets longer.
It was also observed that longer distance to free grazing lands positively influenced the likelihood of SSF adoption by 0.4 % and a number of adopting seasons by 0.23%. The proximity of farmers to roads is essential for timely input delivery and output disposal resulting in less transport cost. Contrary to the study of Gebremedhin et al. (2003), the coefficient of distance to roads had the expected negative sign but insignificant. The milk price relative to the labor wage rate was positive and significant. The probability of using SF and number of SF adopting seasons also seem to decrease with the village labor wage rate, thus underscoring the crucial role played by market incentives in SF decisions. Among the formal information diffusion variables, exposure to SF seems to be the most important determinant in decisions regarding SF. Farmers who were exposed to SF earlier are more likely to manage their cattle under SF in a full year. Similarly, farmers who experienced an animal shock in the last four years were found to support SF practice in conformity with the hypothesis and to the result Bezabih and Sarr (2010) who indicated that shocks from rainfall variability positively affected the level of crop diversity.
The hypothesized relationships embodied in the decision-making model developed in section 3 were tested jointly, using a likelihood ratio test for both estimations. The probability values showing the level of significance are presented in Table 2. It was initially sought to test whether market imperfections are important in SF decisions with the null hypothesis that consumption and production decisions are separable. A non-separability may result from output and factor market imperfections. A familiar approach used to test for market failures is that of testing the joint significance of household characteristics (age, gender, education, household size) for both estimations.
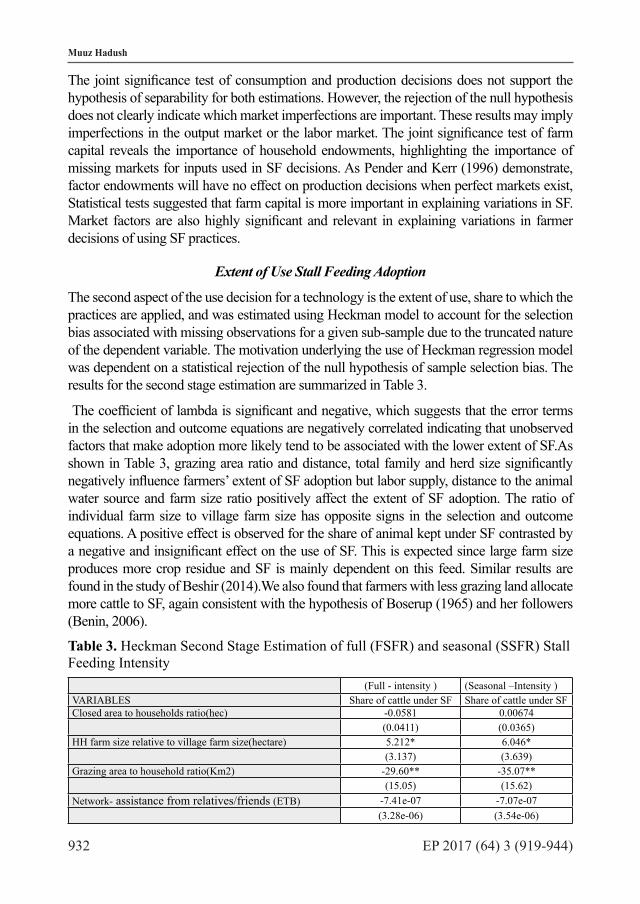
932 EP 2017 (64) 3 (919-944)
Muuz Hadush
The joint significance test of consumption and production decisions does not support the hypothesis of separability for both estimations. However, the rejection of the null hypothesis does not clearly indicate which market imperfections are important. These results may imply imperfections in the output market or the labor market. The joint significance test of farm capital reveals the importance of household endowments, highlighting the importance of missing markets for inputs used in SF decisions. As Pender and Kerr (1996) demonstrate, factor endowments will have no effect on production decisions when perfect markets exist, Statistical tests suggested that farm capital is more important in explaining variations in SF. Market factors are also highly significant and relevant in explaining variations in farmer decisions of using SF practices.
Extent of Use Stall Feeding Adoption
The second aspect of the use decision for a technology is the extent of use, share to which the practices are applied, and was estimated using Heckman model to account for the selection bias associated with missing observations for a given sub-sample due to the truncated nature of the dependent variable. The motivation underlying the use of Heckman regression model was dependent on a statistical rejection of the null hypothesis of sample selection bias. The results for the second stage estimation are summarized in Table 3.
The coefficient of lambda is significant and negative, which suggests that the error terms in the selection and outcome equations are negatively correlated indicating that unobserved factors that make adoption more likely tend to be associated with the lower extent of SF.As shown in Table 3, grazing area ratio and distance, total family and herd size significantly negatively influence farmers’ extent of SF adoption but labor supply, distance to the animal water source and farm size ratio positively affect the extent of SF adoption. The ratio of individual farm size to village farm size has opposite signs in the selection and outcome equations. A positive effect is observed for the share of animal kept under SF contrasted by a negative and insignificant effect on the use of SF. This is expected since large farm size produces more crop residue and SF is mainly dependent on this feed. Similar results are found in the study of Beshir (2014).We also found that farmers with less grazing land allocate more cattle to SF, again consistent with the hypothesis of Boserup (1965) and her followers (Benin, 2006).
Table 3. Heckman Second Stage Estimation of full (FSFR) and seasonal (SSFR) Stall Feeding Intensity
(Full - intensity ) (Seasonal –Intensity )VARIABLES Share of cattle under SF Share of cattle under SFClosed area to households ratio(hec) -0.0581 0.00674
(0.0411) (0.0365)HH farm size relative to village farm size(hectare) 5.212* 6.046*
(3.137) (3.639)Grazing area to household ratio(Km2) -29.60** -35.07**
(15.05) (15.62)Network- assistance from relatives/friends (ETB) -7.41e-07 -7.07e-07
(3.28e-06) (3.54e-06)
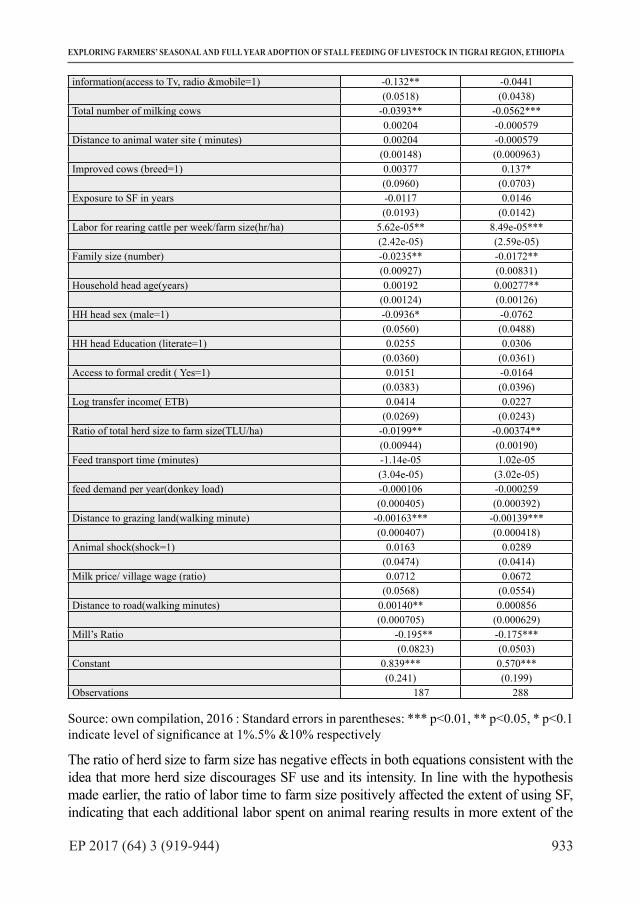
933EP 2017 (64) 3 (919-944)
EXPLORING FARMERS’ SEASONAL AND FULL YEAR ADOPTION OF STALL FEEDING OF LIVESTOCK IN TIGRAI REGION, ETHIOPIA
information(access to Tv, radio &mobile=1) -0.132** -0.0441(0.0518) (0.0438)
Total number of milking cows -0.0393** -0.0562***0.00204 -0.000579
Distance to animal water site ( minutes) 0.00204 -0.000579(0.00148) (0.000963)
Improved cows (breed=1) 0.00377 0.137*(0.0960) (0.0703)
Exposure to SF in years -0.0117 0.0146(0.0193) (0.0142)
Labor for rearing cattle per week/farm size(hr/ha) 5.62e-05** 8.49e-05***(2.42e-05) (2.59e-05)
Family size (number) -0.0235** -0.0172**(0.00927) (0.00831)
Household head age(years) 0.00192 0.00277**(0.00124) (0.00126)
HH head sex (male=1) -0.0936* -0.0762(0.0560) (0.0488)
HH head Education (literate=1) 0.0255 0.0306(0.0360) (0.0361)
Access to formal credit ( Yes=1) 0.0151 -0.0164(0.0383) (0.0396)
Log transfer income( ETB) 0.0414 0.0227(0.0269) (0.0243)
Ratio of total herd size to farm size(TLU/ha) -0.0199** -0.00374**(0.00944) (0.00190)
Feed transport time (minutes) -1.14e-05 1.02e-05(3.04e-05) (3.02e-05)
feed demand per year(donkey load) -0.000106 -0.000259(0.000405) (0.000392)
Distance to grazing land(walking minute) -0.00163*** -0.00139***(0.000407) (0.000418)
Animal shock(shock=1) 0.0163 0.0289(0.0474) (0.0414)
Milk price/ village wage (ratio) 0.0712 0.0672(0.0568) (0.0554)
Distance to road(walking minutes) 0.00140** 0.000856(0.000705) (0.000629)
Mill’s Ratio -0.195** -0.175*** (0.0823) (0.0503)
Constant 0.839*** 0.570***(0.241) (0.199)
Observations 187 288
Source: own compilation, 2016 : Standard errors in parentheses: *** p<0.01, ** p<0.05, * p<0.1 indicate level of significance at 1%.5% &10% respectively
The ratio of herd size to farm size has negative effects in both equations consistent with the idea that more herd size discourages SF use and its intensity. In line with the hypothesis made earlier, the ratio of labor time to farm size positively affected the extent of using SF, indicating that each additional labor spent on animal rearing results in more extent of the

934 EP 2017 (64) 3 (919-944)
Muuz Hadush
practice. Household size negatively influenced the intensity of using SF, showing that more family members may engage in crop production (Beshir, 2014). Sex of the farm household head was negatively related to the intensity of use of FSF or SSF implying that that male farmers allocate less share of cattle under SF as compared to their female counterparts. The justification for this is that female farmers might have more chance to stay at home than their male counterparts. Beshir (2014) found opposite signs for other forage technology adoption in Ethiopia.
The literacy rate of household head is positive but not important in the extent of use of SF. Farmers with the longer distance to the nearest road allocate a larger share of their cattle to SF. Age of the farm household head was positively related to the extent of SF use, except in full year. The justification for this is that older farmers might have gained knowledge and could be explained by the fact that the practices of SF require investment on information to break the information barrier that impedes them from using the practice. These findings are consistent with the findings of Kaliba et al., (1997), whose results indicate that older farmers were more likely to adopt SF and have larger intensive feed gardens in Tanzania.
The lack of statistical importance of distance to crop residue and animal water site in decisions regarding the extent of use of SF implies that the observed partial use of this practice can be explained by factors other than these variables. Although statistical significance is lacking, estimation results also show that farmers with animal shock also use SF practice more extensively than those that are shock free. The length of time that farmers have traveled to free grazing lands had a negative and significant impact on cattle under SF. The possible explanation for this could be as the number of traveling minutes to FG increases, it is not economical to allocate more animal to SF and few to FG especially in seasons where free grazing is ubiquitous, as farmers respond to labor savings.
Summary and Conclusion
Farmers’ adoption of SF and number of SF adopting seasons were assessed in northern Ethiopia in 2015 using a household survey sponsored by NORHED-CLISNARP using 518 randomly selected sample farmers. The Heckman model of SF was used to estimate both discrete data and the continuous stage to account for the extent of adoption. Moreover, a Poisson regression model was applied to explain the variation in the number of SF adopting seasons. While SF has been assumed feasible and applicable in the region, its adoption rate has remained below its expectation. A research on this area is relevant to the literature. The aim of this study was to understand the driving factors of a full year and seasonal SF adoption by farmers and its intensity by developing a model of technology adoption within the framework of a utility maximizing agricultural household model.
The study results indicate that the choice of and demand for SF depend on a host of factors identified from the theoretical model. All factors were statistically significant in either the use of or extent of SF practices, or both, implying that the model appropriately explains the nature of SF process in Ethiopia. The rejection of the null
935EP 2017 (64) 3 (919-944)
EXPLORING FARMERS’ SEASONAL AND FULL YEAR ADOPTION OF STALL FEEDING OF LIVESTOCK IN TIGRAI REGION, ETHIOPIA
hypothesis of separable production and consumption decisions support the use of the non-separable household model to analyze the production decisions of SF. Our evidence showed that population pressure seems to be a driving force for intensifying SF in all seasons, supporting Boserup’s(1965) hypothesis in that less grazing land increased use of SF and adopting seasons. Adoption of SF was also stimulated by the ratio of the closed area probably by shrinking free grazing land and giving extra by-product for animal feed.
The study also shows that SF appears to be attractive to farmers with more milking cows, particularly those that are with improved cows. Wealthier farmers, as measured by the number of herd size, were less likely to adopt and intensify this practice as feeding a large number of cattle increases the cost of its management. The availability of labor is found to be important in determining the use and extent of the practice. While the distance to the animal water site and crop residue reduce the probability to use SF, distance to grazing land, social network and early exposure to SF greatly increased the likelihood of using SF. The significance of education and information confirmed that the awareness level of a farmer influence adoption of SF, suggesting that addressing illiteracy promote adoption. Male farmers were found to practice SF.
Log of transfer income has a negative impact on the use of the practice, as does the total feed demand. Animal shock is significant in influencing the potential for adopting SF. The analysis also reveals that transfer from social networks positively influences decisions regarding the use of SSF. Market-related factors were found to be the most important factors in explaining variations in the use of SF and its extent. While the coefficient of milk price ratio was positive in both the probability and the extent of use of SF, average village wage rate seems to be in the opposite direction causing the probability of SF use to fall during wage rise. While total labor time ratio, farm size ratio and breed cow ownership positively affect the extent of SF adoption, livestock pressure, distance to grazing land and grazing land ratio negatively influences farmers’ extent of SF adoption.
The results of the study have at least three important implications. The first is that cattle SF practice appears to be attractive to the more literate but male households. Thus, policies targeting efficient promotion of the practice are recommended to invest in training and substitute the high quantity herd size with less number of improved cattle. The major implication arising from this study is that efforts to encourage the adoption of SF should be directed towards credit provision, water and road service expansion, for those that have adequate family labor. Information diffusion using demonstration center appear to be justifiable to stimulate and nurture the adoption process. Moreover, better coordination is needed to facilitate the production of complementary feeds and the dissemination of information regarding the market price of an animal product. We enquire for a further research that verifies the link between SF and agricultural productivity.
936 EP 2017 (64) 3 (919-944)
Muuz Hadush
References
1. Ahmed, M. A., Ehui, S., Assefa, Y. (2004): Dairy development in Ethiopia, Intl Food Policy Res Inst.2. Amudavi, D.M., Khan, Z.R., Wanyama, J.M., Midega, C.A.O., Pittchar, J., Hassanali, A., Pickett, J.A. (2009): Evaluation of farmers’ field days as a dissemination tool for Push–Pull technology in Western Kenya, Crop Protection, No. 28, pp. 987–996.3. Babulo, B., Muys, B., Fredu, N., Tollens, E., Nyssen, J., Deckers, J., Mathijs, E. (2009): The economic contribution of forest resource uses to rural livelihoods in Tigray, Northern Ethiopia, Forest Policy and Economics, No. 11, pp. 109–117.4. Baltenweck, I., Mubiru, S., Nanyeenya, W., Njoroge, L., Halberg, N., Romney, D., Staal, S. (2007): Dairy Farming in Uganda: Production Efficiency and Soil Management Strategies under Different Farming Systems, ILRI Research Report 1. International Livestock Research Institute, Nairobi, Kenya.5. Benin, S. (2006): Policies and programs affecting land management practices, input use, and productivity in the highlands of Amhara region Ethiopia, In: Pender, J., Place, F., Ehui, S. (Eds.), Strategies for Sustainable Land Management in the East African Highlands. International Food Policy Research Institute, Washington, DC, pp. 217–256.6. Beshir, H. (2014): Factors affecting the adoption and intensity of use of improved forages in North East Highlands of Ethiopia, American Journal of Experimental Agriculture, Vol. 4, No. 1, pp. 12-27.7. Bezabih, M., Sarr, M. (2012): Risk preferences and environmental uncertainty: Implications for crop diversification decisions in Ethiopia, Environmental and Resource Economics, Vol. 53, No. 4, pp. 483-505.8. BoARD (2012): Effect of Free Grazing on Natural Resource Management, in Tigray Region, Bureau of agriculture Natural resource development protection and utilization core process, Mekelle, Ethiopia.9. Boserup, E. (1965): Conditions of Agricultural Growth, Aldine Publications, Chicago.10. FDRE (2011): Ethiopia’s Climate-Resilient Green Economy, Green Economy Strategy, Addis Ababa: CRGE11. Conley, T. G., Udry, C. R. (2010): Learning about a New Technology: Pineapple in Ghana. American Economic Review, Vol. 100, No. 1, pp. 35-69.12. De Cao, E., van den Berg, M. M., Tile, C. Y., Wondwosen, T. (2013): The effects of zero grazing in Ethiopia, In Proceedings of the CSAE Conference 2013: Economic Development in Africa, pp. 1-15.13. De Janvry, A., Fafchamps, M., Sadoulet, E. (1991): Peasant Household Behaviour with Missing Markets: Some Paradoxes Explained, The Economic Journal, Vol. 101, Issue, 409, pp. 1400-1417.14. De Graaff, J., Kessler, A., Olsen, P. (2010): Farm-level adoption of soil and water

937EP 2017 (64) 3 (919-944)
EXPLORING FARMERS’ SEASONAL AND FULL YEAR ADOPTION OF STALL FEEDING OF LIVESTOCK IN TIGRAI REGION, ETHIOPIA
conservation measures and policy implications in Europe, Land Use Policy No. 27, pp. 1-3.15. Diao, X., Nin-Pratt, A. (2007): Growth options and poverty reduction in Ethiopia —an economy-wide model analysis, Food Policy Vol. 32, No. 2, pp. 205–228.16. Edmeades, S. (2003): Variety Choice and Attribute Trade-Offs Within the Framework of Agricultural Household Models: The Case of Bananas in Uganda, A Ph.D. Dissertation, North Carolina State University.17. FAO (Food and Agriculture Organization of the United Nations) (2009): Production yearbook, FAO, Rome, Italy http://faostat.fao.org/default.aspx.18. Feder, G., Slade, R. (1984): The Acquisition of Information and the Adoption of New Technology, American Journal of Agricultural Economics, Vol. 66, No. 3, pp. 312-320.19. Feder, G., Just, R., Zilberman, D. (1985): Adoption of agricultural innovations in developing countries: a survey, Economic Development and Cultural Change, Vol. 33, pp. 255–298.20. Feder, G., Umali, D. (1993): The Adoption of Agricultural Innovations: A Review, Technological Forecasting and Social Change, No. 43, pp. 215-239.21. Fufa, B. Hassan, R.M. (2006): Determinants of fertilizer use on maize in Eastern Ethiopia: A weighted Endogenous sampling analysis of the extent and intensity of adoption, Agrekon, Vol. 45, No. 1, pp. 38-49.http://dx.doi.org/10.1016/S0169-5150(99)00028-6.22. Foltz, J., Lang, G. (2003): The adoption and impact of management-intensive rotational grazing (MIRG) on Connecticut dairy farms, Renewable agriculture and food Systems, Vol. 20, No. 4, pp. 261–266.23. Fuente, S., Negesse, T., Legesse, G. (2009): Feed Resources and Their Management Systems in Ethiopian Highlands: The Case of Umbulo Whaco Watershed In Southern Ethiopia, Tropical and subtropical agroecosystems, Vol. 12, No. 1, pp. 47-56.24. Gass, G.M., Sumberg J.E. (1993): Intensification of livestock production in Africa: Experience and issues, Draft. Norwich: University of East Anglia.25. Garcia, O., Balikowa, D., Kiconco, D., Ndambi, A., Hemme, T. (2008): Milk Production in Uganda: Dairy Farming Economics and Development Policy Impacts, IGAD LPI, Working Paper No. 09-08.26. Gebremedhin, B., Ahmed, M. M., Ehui, S. K. (2003): Determinants of adoption of improved forage technologies in Crop-livestock mixed systems: Evidence from the highlands of Ethiopia.27. Gebremedhin, B., Hirpa, A., Berhe, K. (2009): Feed marketing in Ethiopia: Results of rapid market appraisal (No. 15). Full text by ILRI.28. Greene, W.H. (2008): Econometric Analysis, 6th ed., New Jersey: Prentice Hall.29. Gunte, K. E. (2015): Understanding factors affecting technology adoption in smallholder livestock production systems in Ethiopia: the role o farm resources and the enabling environment (Doctoral dissertation, Wageningen: Wageningen University).30. Hall, B.H. (1994): Time Series Processor Version 4.3 Reference Manual, TSP
938 EP 2017 (64) 3 (919-944)
Muuz Hadush
International, Palo Alto, CA.31. Hogset, H. (2005): Social Networks and Technology Adoption, Selected Paper, AAEA Annual Meetings, July 2005 Providence, RI.32. Holden, S., Shiferaw, B. (2004): Land degradation, drought and food security in a less favored area in the Ethiopian highlands: a bioeconomic model with market imperfections, Agricultural Economics, Vol. 30, No. 1, pp. 31-49.33. Holtland, G. (2007): The uneasy relationship between science and development, (May).34. IFAD (2007): Livestock and range lands; livestock feeding, URL http://www.ifad.org/lrkm/theme/production/feeding.htm.35. ILRI (International Livestock Research Institute) (2000): Policy for Sustainable Land Management in the Highlands of Ethiopia, May 22-23, 2000. Addis Ababa, Ethiopia. 20p.36. Isham, J. T. (2000): A model of Technology Adoption with Social Capital, A Ph.D. Dissertation, University of Maryland.37. Kaaya, H., Bashaasha, B., Mutetikka, D. (2005): Determinants of utilization of artificial insemination (AI) services among Ugandan dairy farmers, African crop science conference proceedings, No. 7, pp. 561-567.38. Kaliba, A. R., Featherstone, A. M., Norman, D. W. (1997): A stall-feeding management for improved cattle in semi-arid central Tanzania: factors influencing adoption, Agricultural Economics, Vol. 17, No. 2, pp. 133-146.39. Kirui, O. K., Mirzabaev, A. (2014): Economics of land degradation in Eastern Africa (No. 128), ZEF Working Paper Series.40. Klitzing, A., Das, A., Bonzi, M., Barro A., Langkamp, U., Dereje, K., Pale, S., Nayak, S., Gupta, A. (2014): Promoting Best Practice in Agriculture: Examples from Burkina Faso, Ethiopia, India and Europe, Deutsche Welthungerhilfe e.V., Friedrich-Ebert-Straße 1, 53173 Bonn.41. Kruseman, G., Ruben, R., Tesfay, G. (2006): Village stratification for policy analysis: multiple development domains in the Ethiopian highlands of Tigray, In: Pender, J., Place, F., Ehui, S. (Eds.), Strategies for Sustainable Land Management in the East African Highlands. International Food Policy Research Institute, Washington, DC, pp. 81–106.42. Lal, R., Stewart, B. A. (2010): Food security and soil quality, Advances in soil science.43. Lenaerts, L. (2013): Insights into Agency and Social Interactions in Natural Resource Management (Doctoral Dissertation, Wageningen University).44. Long, F. (2003): Regression Models for Categorical Dependent Variables Using Stata, Revised Edition,45. Marra, M., Pannell, D.J., Abadi Ghadim, A. (2003): The economics of risk, uncertainty, and learning in the adoption of new agricultural technologies: Where are we on
939EP 2017 (64) 3 (919-944)
EXPLORING FARMERS’ SEASONAL AND FULL YEAR ADOPTION OF STALL FEEDING OF LIVESTOCK IN TIGRAI REGION, ETHIOPIA
the learning curve? Agricultural Systems Vol. 75, No. 2-3, pp. 215-234.46. McFadden, D. (1981): Econometric models of probabilistic choice. In: Minsk, C.F., McFadden, D. (Eds.), Structural Analysis of Discrete Data with Econometric Applications, MIT Press, Cambridge, MA, pp. 198-272.47. Mcintire, J., Debrah, S. (1987): Forage research in smallholder and pastoral production systems, In: Little, D.A., and Said, A.N. (eds) Proceedings of a workshop held at Ryall’s Hotel, Blantyre, Malawi in September 1986. pp. 118–126. [International Livestock Centre for Africa (ILCA): Addis Ababa, Ethiopia].48. Mekuria, W., Veldkamp, E., Tilahun, M., Olschewski, R. (2011): Economic valuation of land restoration: The case of exclosures established on communal grazing lands in Tigray, Ethiopia, Land Degradation & Development, Vol. 22, No. 3, pp. 334-344.49. Misra, S.K., Carley, D.H., Fletcher, S.M. (1993): Factors influencing southern dairy farmer’s choice of milk handlers, J. Agric Appl. Econ. 25 (July), pp. 197-207.50. Mugisha, J., Ngambeki, D. (1994): Marketing System of the Uganda Banana Industry, African Crop Science Conference Proceedings, No. 1, pp. 384-387.51. Musaba, E.C. (2010): Analysis of factors influencing adoption of cattle management technologies by communal farmers in Northern Namibia, Livestock Research for Rural Development. Volume 22, Article #104. Retrieved December 12, 2015, from http://www.lrrd.org/lrrd22/6/musa22104.htm52. Nalunkuuma, J., Affognon, H., Kingori, S., Salifu, D., Njonge, F. (2013): Adoption of zero grazing and impact on livestock keepers’ knowledge of cattle reproductive parameters in Western Kenya, In African Crop Science Conference Proceedings (Vol. 11, pp. 599-604).53. Negassa, A., Rashid, S., Gebremedhin, B., Kennedy, A. (2012): Chap. 6 “Livestock Production and Marketing” in Food and Agriculture in Ethiopia, Progress and Policy Challenges. Paul Dorosh and Shahidur Rashid Editors. PENN Press.54. Nyssen, J., Descheemaeker, K., Nigussie Haregeweyn, M. H., Deckers, J., Poesen, J. (2007): Lessons learned from 10 years research on soil erosion and soil and water conservation in Tigray, Tigray Livelihood Papers No. 7, Mekelle: Zala-Date Project, Mekelle University, KU Leuven, Relief Society of Tigrai, Africa museum and Tigrai Bureau of Agriculture and Rural Development, 53 p. ISBN 978-90-8826-027-8.55. Pender, J., Kerr, J. (1996): Determinants of farmer’s indigenous soil and water conservation investments in India’s semi-arid tropics, EPTD Discussion Paper No. 17. International Food Policy Research Institute, Washington Dc.56. Pender, J., Place, F., Ehui, S. (2006): Strategies for Sustainable Land Management in the East African Highlands, International Food Policy Research Institute, Washington, DC.57. Odame, H, Kimenye, L, Kabutha, C, Alemu, D., Oduori, L.H. (2013): Why the low adoption of agricultural technologies in Eastern and Central Africa? ASARECA (Association for Strengthening Agricultural Research in Eastern and Central Africa), Entebbe.58. Omamo, S.W., Diao, X., Wood, S., Chamberlin, J., You, L., Benin, S.,Wood-Sichra, U., Tatwangire, A. (2006): Strategic Priorities for Agricultural Development in East and
940 EP 2017 (64) 3 (919-944)
Muuz Hadush
Central Africa, Research Report 150. Washington, DC: International Food Policy Research Institute (IFPRI). 59. Sadoulet, E., De Janvry, A. (1995): Quantitative Development Policy Analysis, The John Hopkins University Press Baltimore and London.60. Shapiro, D. (1990): Farm size, household size and composition and women contribution in agriculture: evidence from Zaire, J.Dev. Studies 27 (October), 1-21.61. Shiferaw, B., Holden, S. (1998): Resource Degradation and Adoption of Land Conservation Technologies in the Ethiopian Highlands: A case Study in Andit Tid, North Shewa, Agricultural Economics, No. 18, pp. 233-247.62. Singh, I., Squire, L., Strauss, J. (1986): Agricultural Household Models. Extension, Applications and Policy, The Johns Hopkins University Press Baltimore, Maryland 21211, USA.63. Smale, M., Heisey, P. W. (1993): Simultaneous Estimation of Seed and Fertilizer Adoption Decisions: An Application to Hybrid Maize in Malawi, Technological Forecasting and Social Change, No. 43, pp. 35-368.64. Smale, M., Just, R.E., Leathers, H.D. (1994): Land allocation in HYV adoption models: an investigation of alternative explanations, Am. J. Agric. Econ. 76 (August), pp. 535-547.65. Staal, S.J., Waithaka, M., Njoroge, L., Mwangi, D.M., Njubi, D., Wokabi, A. (2003): Costs of milk production in Kenya: Estimates from Kiambu, Nakuru and Nyandarua districts, SDP Research and Development, Report No.1Smallholder Dairy (R&D) Project.66. Turinawe, A., Mugisha, J., Kabirizibi, J. (2011): Socio-Economic Evaluation of Improved Forage Technologies in Smallholder Dairy Cattle Farming Systems in Uganda, Journal of Agricultural Science, Vol. 4, No. 3, pp. 163–174. http://doi.org/10.5539/jas.v4n3p163 67. US AID (2013): Climate change and natural resource management, Addis Ababa: USAID. Retrieved from http://www.usaid.gov/ethiopia/environment68. Winston, J. R., Parsons, R.L., Hanson, G.D. (2000): A profitability analysis of dairy feeding systems in the Northeast, Agricultural and resource economics review, No. 29, pp. 220–228.69. Wünscher, T., Schultze-Kraft, R., Peters, M., Rivas, L. (2004): Early adoption of the tropical forage legume Arachis Pintoi in Huetar Norte, Costa Rica, Experimental agriculture, No. 40, pp. 257–268.70. Yesuf, M., Di Falco, S., Deressa, T., Ringler, C., Kohlin, G. (2008): The impact of climate change and adaptation on food production in low-income countries: evidence from the Nile Basin, Ethiopia, Free downloads from IFPRI.71. Yilma, Z., Guernebleich, E., Sebsibe, A., Fombad, R. (2011): A review of the Ethiopian dairy sector, Addis Ababa, Ethiopia: FAO Sub-Regional Office for Eastern Africa (FAO/SFE)
941EP 2017 (64) 3 (919-944)
EXPLORING FARMERS’ SEASONAL AND FULL YEAR ADOPTION OF STALL FEEDING OF LIVESTOCK IN TIGRAI REGION, ETHIOPIA
Appendix
Essentially, farmers face different constraints and so choose among technologies in order to maximize their profit. For simplicity, there are two types of farmers in the model, traditional farmers who use a traditional technology such as free grazing or local cow, and those with an improved technology such as access to stall feeding or breed cow. The use of the improved technology requires extra variable cost for feed including transports (P+Ss) and fixed cost (D) which enhances the productivity of modern farming. By making technology choices, farmers switch from traditional to more modern farming if the payoffs from switching exceed the costs of adopting the new technology. Assuming there is one period with two stages, each farmer independently decides whether to pay the costs and adopt the technology, or remain with the traditional technology. Then in the second stage each farmer determines how much to produce and how much of this output to sell in a market (or to consume domestically).
For simplicity, the household is assumed to derive utility from the consumption of animal products (xm) such as milk and milk product, meat, manure and drought power; other purchased goods (xo), and home time (h). Household utility is affected by a vector of exogenous household characteristics (Λh), such as human capital, age, and household size and village characteristics (Λv) including rainfall and agro ecology location that condition household consumption decisions.
(1)
Where Λh include factors that influence the marginal utilities of the consumption items to reflect his consumption preferences. Maximization of this equation subject to cash income, time and technology constraint gives demand equations for the improved feeding (F) or breed cow and share allocation to these technologies. Households in LDC mainly engages in animal production for home consumption but a surplus may be sold on the market. Variable inputs used in the production of animal (qm) are mainly labor (L), crop residue from straw and green grass from free grazing (R) and improved feed (F) on the number of animals (Ĉ) for given farm (Λf), household (Λh), and village (Λv) characteristic. The production output is assumed to be strictly increasing in variable inputs but at a decreasing rate for a given number of animals (Ĉ), farm characteristics (Λf).However, farmers may produce this output under two alternative practices: Modern farming (fm) and traditional farming (ft).
Modern farming (
fm utilizes labor (L), crop residue R(S) and improved feed (F) such as mixed fodder, residual brew, salt and, bi-products given the number of animals (Cm)allocated to this farm production. The population pressure (S) reduces the availability of R in the farm production by reducing crop and grazing lands (Muyanga, Jayne, 2014) so that the population pressure (S) should be incorporated into the production technology implicitly, not as a shifter of the production function. Feed production R and its use is driven by rise in population and income, which increase demand for animal product
942 EP 2017 (64) 3 (919-944)
Muuz Hadush
and thus the demand for feeds (FAO, 2012b). fm is assumed to be superior to that of ft, however, requires additional resources such as cash income to hire labor or buy and transport the extra feed and construct shelter which causes the farmer to incur some variable and fixed costs (in terms of time or money). Farm output under (fm) may be defined as:
2Traditional farming (ft)
Unlike the modern farming, the traditional farmer under ft uses only labor (L), crop residue R(S) given the number of animals (Ct) allocated to this farm production but does not depend on the improved feed (F). Its equation looks like:
3Total Farming

943EP 2017 (64) 3 (919-944)
EXPLORING FARMERS’ SEASONAL AND FULL YEAR ADOPTION OF STALL FEEDING OF LIVESTOCK IN TIGRAI REGION, ETHIOPIA
944 EP 2017 (64) 3 (919-944)
Muuz Hadush

945
Original scientific paper Economics of Agriculture 3/2017UDC: 330.567.28:637.54/.56(497.11)
EP 2017 (64) 3 (945-956)
FACTORS INFLUENCING MEAT AND FISH CONSUMPTION IN SERBIAN HOUSEHOLDS - EVIDENCE FROM SILC DATABASE
FACTORS INFLUENCING MEAT AND FISH CONSUMPTION IN SERBIAN HOUSEHOLDS - EVIDENCE FROM SILC DATABASE
Mina Kovljenić1, Mirko Savić2
Abstract
Households buy food products, that vary from cheap to expensive, from healthy to unhealthy, from basic to value-added. Beside the nutritional, economic factors have a major and often decisive significance on a households’ ability to afford certain food products. Income, price and housing costs have a significant influence on the purchase of food products. Aim of this paper is to investigate factors influencing the households’ ability to afford meat or fish in a meal every other day (or a vegetarian substitute) using data from conducted Survey on Income and Living Conditions (SILC) in Serbia for the year 2013. This has been achieved by development and implementation of the logistic regression model.
Keywords: household’s food demand, factors, logistic regression
JEL: Q19, D12
Introduction
Today’s world is becoming more global, consumers habits are constantly changing and global companies are selling their products in all parts of the world. Agriculture is under the constant influence of the changes and challenges primarily caused by economic factors, but also by changes in consumer habits, climate change, the rise in prices, market liberalization and other factors.
One of the most dramatic changes in the world food economy, during the past 25 years is the rising role of demand-based factors in determining patterns of prices. Major demographic and economic transitions have shaped, and will continue to shape, global food systems. Two billion people have been added to the planet, over 90% in the developing world and over half of the global population now lives in cities (Naylor, 2016). By 2050 the world’s population will reach 9.1 billion, 34 percent higher than today and nearly all of this population increase will occur in developing countries. Urbanization will accelerate, with about 70 percent of the
1 Mina Kovljenić M.A., Ph.D. Student of Economy, Faculty of Economics Subotica, Segedinski put no. 9-11, 24000 Subotica, Phone: +381 64 544 01 06, E-mail: [email protected]
2 Mirko Savić Ph.D., Full Professor, Department of Business Informatics and Quantitative Methods, Faculty of Economics Subotica, Segedinski put no. 9-11, 24000 Subotica, Phone: +381 24 628 018, +381 21 485 29 10, E-mail: [email protected]
946 EP 2017 (64) 3 (945-956)
Mina Kovljenić, Mirko Savić
world’s population expected to be urban, compared with 49 percent today. In order to feed this more urban and potentially richer population, food production will need to increase by 60 percent from the 2005–07 baseline to 2050 (FAO, 2015).
Demand for food products is determined by the needs and the ability to satisfy them. In addition to the nutritional, economic factors have a major and often decisive significance. Food prices rose sharply between 2006 and 2011, and the issue of feeding the world came to the forefront of the development agenda. Poor consumers cope with rising food prices by switching from preferred to lower-quality staples or by cutting back on relatively expensive sources of calories such as meat, fruit, and vegetables (Traill, Mazzocchi, Shankar, Hallam, 2014).
Demand for food is driven also by income growth. The marginal share of income spent on food declines with countries ranked from low to high per-capita income (Valin et al., 2014). Today, the average household in the European Union spends about 15% of their monthly income on food. This amount halved compared to 1962. A quite different situation in the Republic of Serbia, where almost half of monthly income is allocated to the purchase of food (The European Commission, 2014). The growth in income leads to a change in consumption to a more diverse diet, that includes a larger share of animal protein, fats and oils.
Today consumers buy food products, that vary from cheap to expensive, from healthy to unhealthy, from basic to value-added. Out of these, values and attitudes are important guiding forces in human life in general as well as in the food context (Hauser, Nussbeck, Jonas, 2013). However, consumption is not always an individual phenomenon, but includes social aspects such as shopping for the family, love and sacrifice, shared social cognition and feelings, influences from social norms, social identity, social situations or group influences (Olsen, Grunert, 2010).
The purpose of this paper is to reveal the impact of household income and living conditions on the purchase of food product. The goal is to discover the main factors that affect the demand for food products. Demand is presented through the ability of household to afford meat or fish in a meal every other day (or a vegetarian substitute). Food prices and food affordability (defined here, in broad terms, as the cost of the diet of a household relative to the household’s income) are important determinants of food choices, dietary patterns, nutrition and health (Lee et al., 2013). Through the analysis of demand for food products provides the parameters for explanation of food consumption patterns and probable nutritional changes in the dynamic economic environment. On the basis of data from Survey on Income and Living Conditions (SILC) for the year 2013, we have developed the econometric model which is going to predict the households ability to afford meat or fish in a meal every other day (or a vegetarian substitute), on the basic of socio-economic and other factors.
Literature overview
Agriculture has succeeded so far to respond globally to increased food demand. Food supply has more than tripled since the 1960s and continues to rise everywhere (Valin et al., 2014). Households demand for food products is determined by the needs and the ability to satisfy them.

947EP 2017 (64) 3 (945-956)
FACTORS INFLUENCING MEAT AND FISH CONSUMPTION IN SERBIAN HOUSEHOLDS - EVIDENCE FROM SILC DATABASE
Household spending on food tends to increase as income levels increase, but the proportion of total income devoted to food declines. As incomes rise in lower income countries, their food expenditures grow and consumption patterns appear to seek to catch up to the levels and composition of those of higher income countries (Regmi, Meade, 2013). In low-income countries, expenditure on foods can take up to 62% of income, and in middle-income and high-income countries, people spend on average much less on foods (6–30% of their income) (Gao, 2012). In the middle-income and high-income countries, a similar increase in food prices is likely to have a much smaller impact on consumption.
Demand for food variety rises quickly, as income levels rise. The share of income spent on cereals, fruits and vegetables decreases, while spending on other foods, such as prepared/convenience foods and beverages increases (Herforth, Ahmed, 2015). Income growth generates a shift toward animal products and a larger demand for processed products and food away from home, especially in the transition between low and middle income levels. On the other hand, at higher income levels, demand for luxury goods (including health) becomes more prominent, and consumption of meat and fats is reduced (Traill, Mazzocchi, Shankar, Hallam, 2014).
Except income, price also has a significant influence on the purchase of food products. The increasing real price of food is likely to cause significant changes in diets and nutrient intake. In the poor countries households cope with rising prices by switching to low-quality, cheaper, staple foods, reduction in overall food intake, decrease in the consumption of nutrient rich non-staples, and an increase in the consumption of cheaper, high-calorie but low-nutrient ‘street’ food. Food consumption was most sensitive to changes in prices in low-income countries, with the highest own-price elasticity estimates found for meat, fish and dairy. On the other hand, consumption of cereals, and fats and oils is least sensitive to changes in prices. As calories from cereals make up approximately half of all calories available in low-income countries, an increase in cereal prices would have a bigger impact on diet relative to price increases in other foods (Cornelsen et al., 2015).
High housing costs can also affect the demand for food. Housing costs are among the most significant expense in a household balance. Thus, high housing costs may cause households to reduce non-housing expenditures such as health care, education, food and clothing. The gap between housing expenditures and income in some cases can lead to changes in diet. Housing costs may significantly reduce households’ willingness to spend, affecting households’ disposable income and lowering their standard of living. On the other hand, housing costs can be to some extent mitigated if households are owners rather than renters (Deidda, 2015). Household total expenditure (consumption) is very important phenomenon in many research areas. It is desirable to have information on household total expenditure (consumption), because this information can be used for tracking changes in the distribution of material living standards over time, consumption and saving research, the use of consumption as a conditioning variable in life cycle models and many other uses (Savic, 2007).
Scientific literature in the area of factors affecting the demand for food is very rich, with increasing number of papers, studies and books considering the food demand. In the next
948 EP 2017 (64) 3 (945-956)
Mina Kovljenić, Mirko Savić
section are listed some of the authors who have dealt with investigations of factors that influence the demand for food products.
Vinnari et al. (2010) paper aims to examine changes in household consumption behaviour through an empirical investigation of the decision to consume meat, to not consume meat or to consume only small amounts of meat. The analysis revealed that the decision not to consume meat became prevalent in Finland at the end of the 1970s but the growth rate has somewhat stabilised during recent decades. The gender of the highest earner in the household affects the family meat consumption. As non-meat consumption has become more widespread it has also more clearly become a middle-class phenomenon.
Matz et al. (2015) study investigated the impact of food price changes on food security in urban and rural Ethiopia. The results indicated that increases in cereal prices are generally, but not always, associated with households having a lower number of meals and switching to less preferred foods.
Griffith et al. (2015) documented the changes in the relative prices of different food groups. In the paper they used a demand model to isolate the impact that these changes had on the food purchases of a panel of British households. The results suggest that over time period there was a complex interplay of factors, including changes in prices and preferences, which led to households altering their food purchasing behaviour.
Zhou et al. (2015) paper provides empirical insights about what and how factors affect household fish consumption in China. In the paper they combined Multiple Correspondence Analysis method and Marshallian demand model. Their research reveals that for all households, pork is still a main substitution of fish, and fish consumption differs a lot between provinces. For households with higher dietary knowledge, the authors found that increase of income, the existence of adolescent causes an increase in fish consumption, while illness of household member makes a decrease in fish consumption.
Harttgen et al. (2016) paper analyzed how changes in prices of specific food groups, such as maize prices or prices for staple foods, as well as how negative short-term household level income shocks affect the entitlements to calorie consumption of individuals and how these changes affect overall food poverty. They used household survey data from Malawi. According to their results price shocks for staple foods have a considerable impact on food security with particularly strong effects on poor net food buyers in rural and urban areas.
Roux et al. (2000) study was carried out on 657 people in three different regions of France, and the aim was to identify different “food strategies” among sub-groups of this population, who were faced with financial difficulties. The statistical analysis used was a Correspondence Factorial Analysis. The average food budget was 27%, that was the amount of money the people estimated they spent monthly on food compared with the sum of their disposable income. The results showed, that in absolute terms, the food expenditure of low-income populations remains lower than that of the better-off. The main food groups were consumed less frequently overall than in the general population, notably fresh fruit and vegetables. Consumption of some fresh products like dairy foods and meat were acceptable in terms of

949EP 2017 (64) 3 (945-956)
FACTORS INFLUENCING MEAT AND FISH CONSUMPTION IN SERBIAN HOUSEHOLDS - EVIDENCE FROM SILC DATABASE
healthy eating recommendations.
In the United States Food assistance programs has provided low-income households with the resources to purchase a healthy diet, if they buy the market baskets of food outlined in the Thrifty Food Plan. Stewart and Blisard (2006) study showed that married couples with children and female-headed households with children have spent only 73% and 82%, respectively, and just 43% and 50% for at-home fruits and vegetables. In contrast to the average, food at-home spending by low-income households averages about 86% of the TFP (Thrifty Food Plan) cost of foods versus 118% for the highest income households. While low-income households have spent about (more than) the TFP amount on at-home cereal and bakery goods, they spent just 53% on at-home fruits and vegetables, 70% on at-home meat, poultry, fish, and eggs, and 74% on at-home dairy products.
From the listed literatures, it could be seen that besides income and price, household characteristics and household costs play a important role in decision making of food consumption.
Material and method
Recognizing the importance of households’ demand for food products, quantitative analysis in this paper will focus on building up an econometrics model for predicting households demand for food products in Republic of Serbia.
Quantitative analysis was performed using SILC databases for Republic of Serbia. Main goal of SILC research is to investigate income distribution and social exclusion. The survey was conducted on the territory of the Republic of Serbia in 2013 and in the sample 8008 households took part.
Survey on Income and Living Conditions (SILC) is an annual, sample survey which provides data on income, poverty, social exclusion and living conditions. Social exclusion and housing-condition information is collected at household level. At household level, four domains are covered: basic data, housing, material deprivation and income. The personal level is regrouped into five domains: basic/demographic data, education, health, labour and income.
Determining the factors influencing the demand for food products is essential. Previous studies on demand for food products indicate the existence of a significant correlation between demand for food products on one side and demographic characteristics, educational structures and income distribution on the other. Household expenditures, financial situation of a household, number of household members are just some of the factors that can also affect the demand for food products, and which we analyze in this paper.
The aim of further analysis is to assess the prediction of households’ ability to afford meat or fish in a meal every other day (or a vegetarian substitute) by performing binary logistic regression model.
Logistic regression model represents a statistical method for predicting the outcome of categorical dependent variable based on one or more independent variables that are called
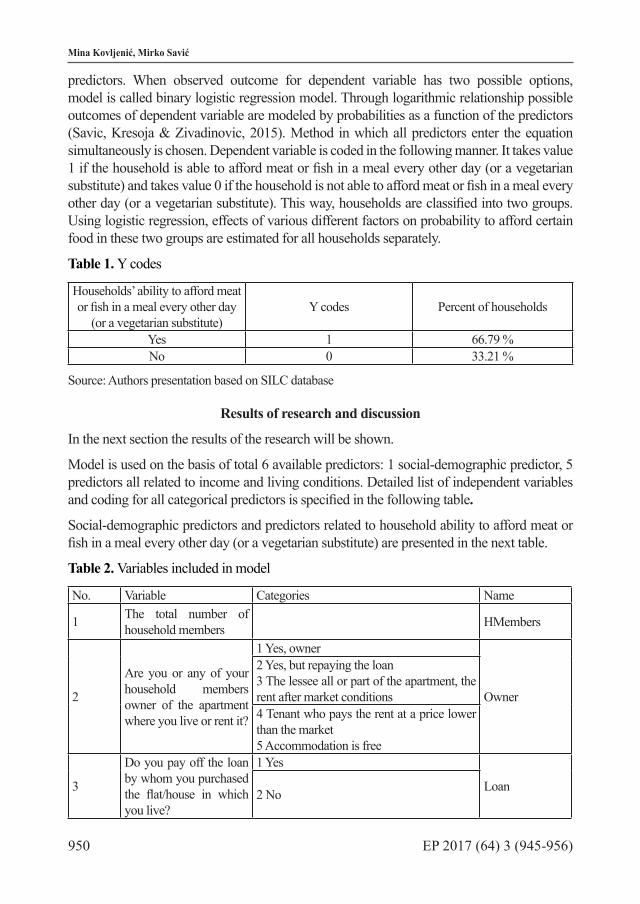
950 EP 2017 (64) 3 (945-956)
Mina Kovljenić, Mirko Savić
predictors. When observed outcome for dependent variable has two possible options, model is called binary logistic regression model. Through logarithmic relationship possible outcomes of dependent variable are modeled by probabilities as a function of the predictors (Savic, Kresoja & Zivadinovic, 2015). Method in which all predictors enter the equation simultaneously is chosen. Dependent variable is coded in the following manner. It takes value 1 if the household is able to afford meat or fish in a meal every other day (or a vegetarian substitute) and takes value 0 if the household is not able to afford meat or fish in a meal every other day (or a vegetarian substitute). This way, households are classified into two groups. Using logistic regression, effects of various different factors on probability to afford certain food in these two groups are estimated for all households separately.
Table 1. Y codes
Households’ ability to afford meat or fish in a meal every other day
(or a vegetarian substitute)Y codes Percent of households
Yes 1 66.79 %No 0 33.21 %
Source: Authors presentation based on SILC database
Results of research and discussion
In the next section the results of the research will be shown.
Model is used on the basis of total 6 available predictors: 1 social-demographic predictor, 5 predictors all related to income and living conditions. Detailed list of independent variables and coding for all categorical predictors is specified in the following table
Social-demographic predictors and predictors related to household ability to afford meat or fish in a meal every other day (or a vegetarian substitute) are presented in the next table.
Table 2. Variables included in model
No. Variable Categories Name
1 The total number of household members HMembers
2
Are you or any of your household members owner of the apartment where you live or rent it?
1 Yes, owner
Owner
2 Yes, but repaying the loan3 The lessee all or part of the apartment, the rent after market conditions4 Tenant who pays the rent at a price lower than the market5 Accommodation is free
3
Do you pay off the loan by whom you purchased the flat/house in which you live?
1 Yes
Loan2 No
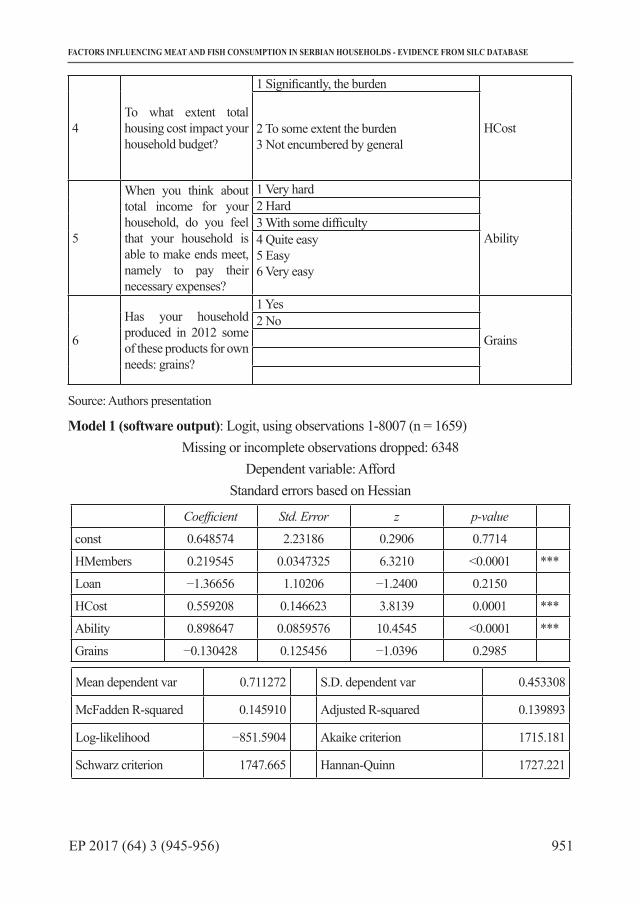
951EP 2017 (64) 3 (945-956)
FACTORS INFLUENCING MEAT AND FISH CONSUMPTION IN SERBIAN HOUSEHOLDS - EVIDENCE FROM SILC DATABASE
4To what extent total housing cost impact your household budget?
1 Significantly, the burden
HCost2 To some extent the burden3 Not encumbered by general
5
When you think about total income for your household, do you feel that your household is able to make ends meet, namely to pay their necessary expenses?
1 Very hard
Ability
2 Hard3 With some difficulty4 Quite easy5 Easy6 Very easy
6
Has your household produced in 2012 some of these products for own needs: grains?
1 Yes
Grains2 No
Source: Authors presentation
Model 1 (software output): Logit, using observations 1-8007 (n = 1659)Missing or incomplete observations dropped: 6348
Dependent variable: AffordStandard errors based on Hessian
Coefficient Std. Error z p-value
const 0.648574 2.23186 0.2906 0.7714
HMembers 0.219545 0.0347325 6.3210 <0.0001 ***
Loan −1.36656 1.10206 −1.2400 0.2150
HCost 0.559208 0.146623 3.8139 0.0001 ***
Ability 0.898647 0.0859576 10.4545 <0.0001 ***
Grains −0.130428 0.125456 −1.0396 0.2985
Mean dependent var 0.711272 S.D. dependent var 0.453308
McFadden R-squared 0.145910 Adjusted R-squared 0.139893
Log-likelihood −851.5904 Akaike criterion 1715.181
Schwarz criterion 1747.665 Hannan-Quinn 1727.221

952 EP 2017 (64) 3 (945-956)
Mina Kovljenić, Mirko Savić
Model 1 (software output): Number of cases ‘correctly predicted’ = 1222 (73.7%)f(beta’x) at mean of independent vars = 0.453
Likelihood ratio test: Chi-square(5) = 290.967 [0.0000]Slope*
0.0400816−0.2494890.1020930.164063
−0.0238118
^Afford = 0.649 + 0.220*HMembers - 1.37*Loan + 0.559*HCost + 0.899*Ability - 0.130*Grains (2.23) (0.0347) (1.10) (0.147) (0.0860) (0.125)n = 1659, R-squared = 0.146 (standard errors in parentheses)
Binary logistic regression model shows that on the households’ ability to afford meat or fish in a meal every other day (or a vegetarian substitute) significant influence have the following variables: number of household members, household expenses and the ability of household to make ends meet, namely to pay their necessary expenses. Households with more members, lower impact of total housing cost on household budget and lower households’ difficulty to pay their necessary expenses are more likely to be able to afford meat or fish in a meal every other day (or a vegetarian substitute). For these independent variables p-value is less than α (0,01), hypothesis Ho is rejected and there is a significant connection between the listed independent variables and the dependent variable.
Variable owner was ejected from the model due to existence of multicollinearity with variable loan.
McFadden coefficient of determination shows that 14.59% of variations in households’ ability to afford meat or fish in a meal every other day (or a vegetarian substitute) is explained by the variations of the independent variables of the model.
Number of correct predicted outcome is 73.7%. Based on Likelihood ratio test the conclusion is that the whole model is statistically significant.
With an increase in the number of household members probability that household will afford meat or fish in a meal every other day (or a vegetarian substitute) increases by 4% on average.
With the decrease of total housing cost impact on household budget probability that household will afford meat or fish in a meal every other day (or a vegetarian substitute) increases by 10.2 % on average.
With the decrease of households’ difficulty to pay their necessary expenses probability that household will afford meat or fish in a meal every other day (or a vegetarian substitute) increases by 16.4% on average.
953EP 2017 (64) 3 (945-956)
FACTORS INFLUENCING MEAT AND FISH CONSUMPTION IN SERBIAN HOUSEHOLDS - EVIDENCE FROM SILC DATABASE
Conclusion
Understanding factors that affect future food demand capacity is an important component of strategic planning to reduce food insecurity. Household expenditures, financial situation of a household, number of household members represent the factors that can affect the demand for food products. The share of income or households consumption expenditure spent on food is often used as an indicator for the relative well-being of a country.
Examination of food demand patterns over time and how these patterns adjust to rising incomes, households costs and changing prices enables better projection of food needs. It provides an insight into the kinds of food households are likely to buy in the future. Also it allows identification of at-risk populations, and improves predictions about how the food industry may be structured to meet the evolving trends in global demand.
On the basis of logistic analysis, we have discovered three statistically significant factors influencing meat and fish consumption. These factors are: number of household members, households’ cost and ability of household to pay necessary expenses. Increase in the number of household members, decrease in the total housing costs and decrease of households’ difficulty to pay their necessary expenses increases the probability that household will afford meat or fish in a meal every other day (or a vegetarian substitute).
The main limitation of the research include problems associated with: objectivity of answers and insufficient coverage of research (not included some important variables such as income of households, price of meat and fish, household spending on food).
In our research only a few variables were taken for analysis, but this is just a start for further and more detailed scientific research. The next step in our research will be expansion of our model with new potential factors like income of households, price of meat and fish, household spending on food and their influence on the meat and fish consumption. Further research could also include personal information such as basic/demographic data, education, health, labour and investigate how these variables influence meat and fish consumption. Deeper processing of these answers, would get results that are not covered in this paper.
Literature
1. Cornelsen, L., Green, R., Turner, R., Dangour, A. D., Shankar, B., Mazzocchi, M., Smith, R. D. (2015): What happens to patterns of food consumption when food prices change? Evidence from a systematic review and meta-analysis of food price elasticities globally. Vol. 24, pp. 1548–1559, Health Economics, Wiley, USA.2. Deidda, M. (2015): Economic Hardship, Housing Cost Burden and Tenure Status:Evidence from EU-SILC, Journal of Family and Economic, Issue 36, pp. 531–556, Springer US, USA.3. FAO (Food and Agriculture Organization) (2015): The State of Agricultural Commodity Markets, (available at: http://www.fao.org/3/a-i5090e.pdf).4. Gao, G. (2012): World food demand. American Journal of Agricultural Economics, Vol. 94, pp. 25–51, Agricultural and Applied Economics Association, Milwaukee.

954 EP 2017 (64) 3 (945-956)
Mina Kovljenić, Mirko Savić
5. Griffith, R., O’Connell, M., Smith, K. (2015): Relative prices, consumer preferences, and the demand for food. Oxford Review of Economic Policy, Vol. 31, No. 1, pp. 116–130, Oxford Academic, Oxford, UK.6. Hauser, M., Nussbeck, F., W., Jonas, K. (2013): The Impact of Food-Related Values on Food Purchase Behavior and the Mediating Role of Attitudes: A Swiss Study. Psychology and Marketing, Vol. 30, No. 9, pp. 765–778, Wiley, USA.7. Harttgen,K., Klasen, S., Rischke, R. (2016): Analyzing nutritional impacts of price and income related shocks in Malawi: Simulating household entitlements to food. Food Policy, Vol. 60, pp. 31–43, Elsevier B.V., Amsterdam, The Netherlands.8. Herforth, A., Ahmed, S. (2015): The food environment, its effects on dietary consumption, and potential for measurement within agriculture-nutrition interventions. Food Security, Vol. 7, Issue 3, pp. 505–520, Springer US, USA.9. Lee, A., Mhurchu, C. N., Sacks, G., Swinburn, B., Snowdon, W., Vandevijvere, S., Hawkes, C., L Abbe, M., Rayner, M., Sanders, D., Barquera, S., Friel, S., Kelly, B., Kumanyika, S. Lobstein, T., Ma, J., Macmullan, J., Mohan, S., Monteiro, C., Neal, B., Walker, C. (2013): Monitoring the price and affordability of foods anddiets globally. Obesity Reviews, pp. 82-95, John Wiley & Sons Ltd, USA.10. Matz, J. A., Kalkuhl, M., Abegaz, G. A. (2015): The short-term impact of price shocks on food security-Evidence from urban and rural Ethiopia. Food Security, Vol. 7, Issue 3, pp. 657–679, Springer US, USA.11. Naylor, R. L. (2016): Oil crops, aquaculture, and the rising role of demand: A fresh perspective on food security. Global Food Security, Vol. 11, pp. 1-9, Elsevier B.V., Amsterdam, The Netherlands.12. Olsen, S. O., Grunert, G. K. (2010): The role of satisfaction, norms and conflict in families’ eating behavior. European Journal of Marketing, Vol. 44 Issue 7/8, pp. 1165 – 1181, Emerald, England.13. Regmi, A., Meade, B. (2013): Demand side drivers of global food security. Global Food Security, Vol. 2, pp. 166–171, Elsevier B.V., Amsterdam, The Netherlands.14. Roux, C., Couedic, P. L., Durand-Gasselin, S. (2000): Consumption patterns and food attitudes of a sample of 657 low-income people in France. Food Policy, Vol. 25, pp. 91–103, Elsevier B.V., England.15. Savić, M. (2007): Questions about household consumption in surveys. Panoeconomicus, Vol. 54, Issue 3, pp. 347-357, Savez ekonomista Vojvodine, Novi Sad, Srbija.16. Savić, M., Kresoja , M., Živadinović, I. (2015): Social Dimension of International Student Mobility in Bosnia and Herzegovina, Montenegro and Serbia. Finding the right path - Higher education financing and social dimension in the Western Balkan countries, University of Belgrade, Beograd, pp. 165-185.17. Stewart, H., Blisard, N. (2006): The Thrifty Food Plan and low-income households in the United States: What food groups are being neglected? Food Policy, Vol. 31, pp. 469–

955EP 2017 (64) 3 (945-956)
FACTORS INFLUENCING MEAT AND FISH CONSUMPTION IN SERBIAN HOUSEHOLDS - EVIDENCE FROM SILC DATABASE
482, Elsevier B.V., England.18. Traill, W. B., Mazzocchi, M., Shankar, B., Hallam, D. (2014): Importance of government policies and other influences in transforming global diets. Nutrition Reviews, Vol. 72, No. 9, pp. 591–604, Wiley, USA.19. The European Commission, Directorate-General for Communication, (2014): The policies of the European Union: Agriculture, (available at: http://europa.eu/pol/pdf/flipbook/hr/agriculture_hr.pdf ). 20. Valin, H., Sands, R. D., Mensbrugghe, D., Nelson, G.,C., Ahammad, H., Blanc, E., Bodirsky, B., Fujimori, S., Hasegawa, T., Havlik, P., Heyhoe, E., Kyle, P.,Croz, D., M., Paltsev, S., Rolinski, S., Tabeau, A., Meijl, H., Lampe, M., Willenbockel, D. (2014): The future of food demand: understanding differences in global economic models. Agricultural Economics, Vol. 45, pp. 51-67, International Association of Agricultural Economists, Wiley, USA.21. Vinnari, M., Mustonen, P., Rasanen, P. (2010): Tracking down trends in non-meat consumption in Finnish households, 1966-2006. British Food Journal, Vol. 112 Issue 8, pp. 836–852, Emerald, England.22. Zhou L., Jin S., Zhang B., Cheng G., Zeng Q., Wang, D. (2015): Determinants of fish consumption by household type in China. British Food Journal, Vol. 117, Issue 4, pp. 1273–1288, Emerald, England.

956 EP 2017 (64) 3 (945-956)
Mina Kovljenić, Mirko Savić
FAKTORI OD UTICAJA NA POTROŠNJU MESA I RIBE U DOMAĆINSTVIMA U SRBIJI – PODACI IZ SILC BAZE PODATAKA
Mina Kovljenić3, Mirko Savić4
Apstrakt
Domaćinstva kupuju prehrambene proizvode, koji varijariju od jeftinih do skupljih, od organskih do neorganskih, od osnovnih do onih sa dodatnom vrednošću. Osim prehrambenih, ekonomski faktori imaju veliki i često odlučujući uticaj na mogućnost domaćinstava da priušte određene prehrambene proizvode. Prihodi, cene i stambeni troškovi imaju značajan uticaj na kupovinu prehrambenih proizvoda. Cilj ovog rada je otkrije faktore koji utiču na sposobnost domaćinstava da priušte meso ili ribu u obroku svaki drugi dan (ili vegetarijansku zamenu) koristeći podatke iz sprovedene Anketa o prihodima i životnim uslovima (SILC) u Srbiji za 2013. godinu. Ovo je postignuto razvojem i implementacijom modela logističke regresije.
Ključne reči: tražnja za hranom u domaćinstvu, faktori, logistička regresija
3 Mina Kovljenić M.A., doktorant ekonomije, Ekonomski fakultet u Subotici, Segedinski put br. 9-11, 24000 Subotica, Telefon: +381 64 544 01 06, E-mail: [email protected]
4 Redovni profesor, dr Mirko Savić, Departman za poslovnu informatiku i kvantitativne metode, Ekonomski fakultet u Subotici, Segedinski put br. 9-11, 24000 Subotica, Telefon: +381 24 628- 018, 021/485-2910, E-mail: [email protected]
957
Original scientific paper Economics of Agriculture 3/2017UDC: 330.341:631.147(4-672 EU)
EP 2017 (64) 3 (957-971)
ANALYSIS OF THE ORGANIC AGRICULTURE LEVEL OF DEVELOPMENT IN THE EUROPEAN UNION COUNTRIES
ANALYSIS OF THE ORGANIC AGRICULTURE LEVEL OF DEVELOPMENT IN THE EUROPEAN UNION COUNTRIES
Bojan Krstić1, Jelena Petrović2, Tanja Stanišić3, Ernad Kahrović4
Summary
The purpose of this paper is to analyse the development of organic agriculture in the member states of the European Union. The aim is ranking the member states of the European Union according to the degree of development of organic agriculture using the proper methodology, or using multi-criteria analysis, in order to determine which member state has made the most significant development of the observed agricultural production. This is realized by using the VIKOR and ENTROPY methods. The research results suggest that there is a difference in the level of development of organic agriculture in the member states of the European Union.Results of regression and correlation analysis indicate significant positive correlation between the levels of development of organic agricultural production and economic growth in the European Union countries. Economic growth is one of the conditions of improving the development of organic agriculture.
Keywords: Organic agriculture, multi-criteria analysis, economic growth
JEL: Q11,Q56, E23.
Introduction
In comparison with other sectors of a country’s economy, agriculture as a whole is a complex system in which the economic principles of production are directly intertwined with its biological and ecological characteristics (Jaklic et al., 2014). The 21st century is featured
1 Bojan Krstić Ph.D., Full Professor, University of Nis, Faculty of Economics, Trg Kralja Aleksandra no. 11, 18000, Nis, Serbia, Phone: +381 64 80 96 208, E-mail: [email protected]
2 Jelena Petrović Ph.D., Associate Professor, University of Nis, Faculty of Mathematics and Science, Visegradska street no. 33, 18000, Nis, Serbia, Phone: +381 63 113 27 68, E-mail: [email protected]
3 Tanja Stanišić Ph.D., Assistant Professor, University of Kragujevac, Faculty of Hotel Management and Tourism in Vrnjačka Banja, Vojvodanska bb, 36210, Vrnjacka Banja, Serbia, Phone: +381 64 49 41 542, E-mail: [email protected]
4 Ernad Kahranović Ph.D., Assistant Professor, State University of Novi Pazar, Department of Economic Sciences, Vuka Karadzica bb, 36300, Novi Pazar, Serbia, Phone: +381 65 290 88 85, E-mail: [email protected]
958 EP 2017 (64) 3 (957-971)
Bojan Krstić, Jelena Petrović, Tanja Stanišić, Ernad Kahrović
by a dominant trend of the conventional agriculture representing “the industrial sector ofgrowing plants and breeding animals”, which is based on the use of chemicals, machinery and genetically modified organisms. The contemporary form of the agriculture production is concentrated on reaching elevated of the output volumes, and reducing the overall hunger of the general population. However, this method of production causes economic, social as well as the environmental problems. The organic agriculture represents a solution that could eliminate such issues.
Agricultural production systems are facing a challenge. There is a rising demand for quality of agricultural products, which in turn will increase the pressure to further intensify agriculture systems, and,at the same time, there is a need to minimize its negative impacts on the environment (Ruschet al., 2015). In the recent years, a number of concepts have emerged that are related to the “environmentally-friendly” agricultural systems and among them the ones dealing with the organic agricultural system (Bruma, 2014). This concept should be viewed as an integral part of sustainable development strategies and as a viable alternative to conventional agriculture (Toader, Roman, 2014).“ All these challenges call for a more sustainable approach to agriculture, offering greater resilience to agriculture” (Te Pas, Rees, 2014).
The organic agriculture represents an ecologically clean, ethical and socially just agricultural production. It represents the integral part of the sustainable development because it employs renewable resources and avoids using mineral fertilizers, genetically modified organisms, pesticides, etc. in agriculture processes. In the long run,the modern agricultural production, and especially the organic production, can contribute to the increase of the soil quality and of biodiversity. Organic agriculture is based on the essential connection between the agriculture and nature, aiming tothe natural biological equilibrium. During the 20th century, several European countries registered an increased presence of the organic agriculture (Germany, Switzerland, Austria, United Kingdom, France). A substantial development of the organic agriculture in the EU and in the rest of the world is due to the increased demand for the organic product and to the increased use of farmlands organic agriculture purposes. Organic agriculture has the potential to influence the protection of the environment and to contribute to the development of rural communities. The area of organic agricultureland, the number of organic produce farmers, and the market specializing in organic food continue to increase in the EU.
This research paper dedicates a particular attention to the analysis of factors related to the development of the organic agriculture on the EU territory, i.e. the EU member states. The main goals of this paper are: a) ranking observed countries in accordance with the level of development of the agricultural production, starting from the organic agriculture development factors; b) identifying the link between the value of the GDP (gross domestic product) and the level of development of the EU member states’ organic agriculture. The analysis presented in this research paper points out the capabilities and the purposes of applying the VIKOR method asa the multi-criteria method in the research of the organic agriculture.

959EP 2017 (64) 3 (957-971)
ANALYSIS OF THE ORGANIC AGRICULTURE LEVEL OF DEVELOPMENT IN THE EUROPEAN UNION COUNTRIES
Literature review
There are many definitions of the organic agriculture, but they are all based on the following principles: health, ecology, equality and sustainability. Accoording to the definition of the organic agriculture that was ratified in 2008 by the General Assembly of the International Federation of Organic Agriculture Movements (IFOAM), organic agriculture is a production system that sustains the health of soils, ecosystems and people (IFOAM, 2008). It relies on ecological processes, biodiversity and cycles adapted to local conditions, rather than the use of inputs with adverse effects. Organic agriculture combines tradition, innovation and science to benefit the shared environment and promote fair relationships and a good quality of life for all involved. Organic agriculture may be considered as a prototype for recycling agriculture (Nowak et al., 2015).
Organic agriculture is also known as the ecological agriculture (Gosling et al., 2006) or biodynamic agriculture (Lampkin, 2002)..Some authors considered organic agriculture and sustainable agriculture synonymous, because they are both based on sustainability of agro-ecological systems. Despite some differences between the different schools of thought, the main aim of organic agriculture can be summarized as to create a sustainable agricultural production system. The term “sustainable” is used in a wide sense, in order to include the environmental, economic and social sustainability (Padel, 2001).
Organic agriculture uses an approach to growing crops and raising livestock that avoids using the synthetic chemicals, hormones, antibiotic agents, genetic engineering, and irradiation (Forman et al., 2012). Lampkin (1994) points out that the aim of organic agriculture is: “to create integrated, humane, environmentally and economically sustainable production systems, which maximize reliance on farm-derived renewable resources and the management of ecological and biological processes and interactions, so as to provide acceptable levels of crop, livestock and human nutrition, protection from pests and disease, and an appropriate return to the human and other resources.”
Although worldwide organic agriculture is constantly gaining ground compared to traditional agriculture, anumber of countries have problems mostly related to the lack of validated information and knowledge, technical support byspecialized agronomists, coordination and organization of the trading network and promoting mechanisms (Karetsos et al., 2007). Globally, Europe continues to be a forerunner in organic agriculture. The positive development is due to a number of reasons, including strong consumer demand, legal protection and requirements for organic production and labelling as set out in the EU and national legislation, as well as the development of the private organic standards and labelling. The EU member states adopted organic standards, i.e. the standards that were officially adopted in the field of the organic agriculture by the International Federation of Organic Agriculture Movements (IFOAM). Some countries that did not adopt these regulations, are applying national standards in the field of agricultural production. Even though the national standards represent a point of reference for the certification systems and provide a definition for organic products, they usually do not foresee the adoption of a national inspection and certification system.
960 EP 2017 (64) 3 (957-971)
Bojan Krstić, Jelena Petrović, Tanja Stanišić, Ernad Kahrović
Policies that encourage organic production should focus on attitudes, technology, and finances (Rozman et al., 2013). In addition, agricultural policy support measures (such as conversion and maintenance payments for organic production) have contributed positively to sectoral development (Sanders et al., 2011). In some countries, more coordinated policy approaches have also been promoted through national and regional organic action plans, which seek to link support measures with growth and expansion.
Research methodology and hypothesis
The information basis for this research is the Eurostat database, as well as data of the Research Institute of Organic Agriculture (FiBL) and the International Foundation for Organic Agriculture (IFOAM), that were presented in the publication „The World of Organic Agriculture: Statistics and Emerging Trends 2016“ (FiBL, IFOAM, 2016).
In this paper, the authors hypothesized the following:
• Even though all the EU member states adopted the organic standards, there is an inequality in the organic agriculture development on the EU level, i.e. between the EU member states;
• The development of the organic agriculture in the EU member states depends on their economic development.
This research paper applies the following methods: the VIKOR method, the ENTROPY method, the correlation analysis method and the regression analysis method. The VIKOR method is used to rank the European Union countries according to the level of the organic agriculturedevelopment. The ENTROPY method is selected to determine the value of weight coefficients, as well as because it is an objective method - it generates the weights of criteria directly out of the criteria values of variables and eliminates the problem of subjectivity and incompetence, or of the lack of the decision maker. The correlation analysis method is used with the aim of determining interdependence between the level of the organic agriculture and the level of the economic growth, while the regression analysis is used in order to examine the effects of the economic growth on the level of development of the organic agriculture in the EU member states.
The VIKOR method was developed for multi-criteria optimization of complex systems and this method determines the compromise ranking list, the compromise solution, and the weight stability intervals for the preference stability of the compromise solution obtained with the initial (given) weights (Opricovic, Tzeng, 2004; Wang, Tzeng, 2012). The essence of the VIKOR method is related to finding the value Qi for each alternative, as well as to selecting the alternative that has the smallest value Qi (i.e. the smallest offset from the “ideal point”). The initial decision matrix represents the starting point in applying the VIKOR method of decision

961EP 2017 (64) 3 (957-971)
ANALYSIS OF THE ORGANIC AGRICULTURE LEVEL OF DEVELOPMENT IN THE EUROPEAN UNION COUNTRIES
(1)
Afterwards, the highest and the lowest values for fj* and f −j respectively are determined for each criteria. The criteria that demands the minimum has the best point at its lowest value while the weakest point is the highest value. Based on the value dij:
(2)
and the weight criteria one can determine the pessimistic solution Si and the expected solution Ri by applying the following formulas:
(3)
These variables, in turn determine the variables S* and S- and R* and defined as:
(4)
On the basis of the variables S*, S_, R* and R
_ one can calculate the variables QSi, QRi
and Qi (a compromise solution) for each alternative.
(5)
The variable Qi unifies the variables QSi and QRi (third ranking list). By selecting the value for v (weight of satisfaction for most of criteria) the influence of the variable QSi or QRi can be favoured in the compromise ranking list Qi (Nikolić et al., 2010). The variable v which represents the weight of criteria of maximizing the group landmark or “the maximum group usefulness” may have the following values 0,25; 0,50 or 0,75 (Opricovic, Tzeng, 2007).
Ranking the alternatives is carried out by sorting the values on the ranking list QS, QR and

962 EP 2017 (64) 3 (957-971)
Bojan Krstić, Jelena Petrović, Tanja Stanišić, Ernad Kahrović
Qi in a descending order. The alternative Ai that has the lowest value on the ranking list Qi (v=0,5) is the best alternative provided that the following conditions have been met:
Condition U1 – condition of „sufficient advantage”
(6)
Where A2 represents the alternative that occupies the second position on the ranking list
Qi(v=0,5), and amounts to: DQ = 1
1−m .
The condition U2 is the condition of the “acceptable sustainability in decision-making”.
The alternative A1 except on the raking list Qi(v=0,5) has to be the best ranked one, that is to have the lowest value on at least one of the following raking lists QS, QR, Qi(v=0,25) and Qi(v=0,75). If A1 does not satisfy the aforementioned conditions, then the compromising solution contains:
1) The alternatives A1 and A2 if the condition U2 hasn’t been satisfied;
2) The alternatives A1, A2,… Am if the condition U1 hasn’t been satisfied, where Am was determined by the relation Q(Am) – Q(A1)< DQ for the maximum m (Opricović, Tzeng, 2007).
The multi-criterion decision-making is related to situations where there is an elevated number of mostly conflicting criteria. In order to make a good decision, it is necessary to specify the alternatives by defining the adequate criteria. The weight coefficients represent the numbers that can be calculated by applying the objective and subjective methods (CRITIC method, the least squares method, AHP method, ENTROPY method, etc.) (Alemi-Ardakani et al., 2016; Solsvik, Jakobsen, 2012; Hazama, Kano, 2015; Yu et al., 2015).
In this research paper, the authors apply ENTROPY method as an objective method to determine the value of the weight coefficients. The ENTROPY method was originally a concept of thermodynamics, which firstly added into the information theory by C.E. Shannon and it is not applied widely in the field of engineering technology, social economy, etc. (Zhang, 2015).
Beginning from the initial decision matrix, we can determine the weight criteria in the following three steps. In the first step the normalization of criteria values of aij variants is carried out, in the following way:
(7)
By applying the above model, we can obtain a normalized decision matrix:

963EP 2017 (64) 3 (957-971)
ANALYSIS OF THE ORGANIC AGRICULTURE LEVEL OF DEVELOPMENT IN THE EUROPEAN UNION COUNTRIES
(8)
In the second step, the entropy value ej is calculated by applying the following model:
(9)
The constant value k which is calculated in the following way allows for all the entropy values to be in-between the interval . In the second step we determine the degree of divergence in relations to the average quantity of information that is contained in each criterion:
(10)
whererepresents the characteristic contrast intensity of the criterion .
In the third step, the final weight of the criterion is obtained by doing a simple additive normalization:
(11)
Research results and discussion
During the determination of weight criteria, we start from the initial decision matrix which is formed based on key indicators of organic agriculture for the EU-28 member states (Table 1). In order to rank the EU-28 member states, we used the following as the key indicators of the development of the organic agriculture: area (ha), area share (%), producers, and processors.
Based on the data from the Table 1, and by applying the models 7, 9, 10 and 11 we determine the values of the coefficients weight . Based on the value of the weight criteria for each criterion of each alternative and by applying the VIKOR method, we carried out the ranking of the EU-28 member states according to the level of development of the organic agriculture (Table 2).
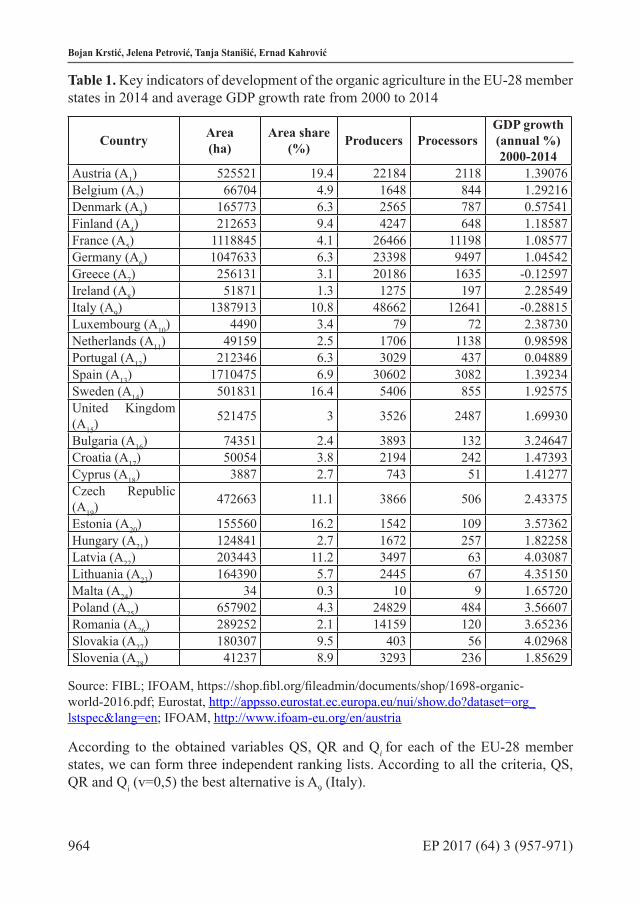
964 EP 2017 (64) 3 (957-971)
Bojan Krstić, Jelena Petrović, Tanja Stanišić, Ernad Kahrović
Table 1. Key indicators of development of the organic agriculture in the EU-28 member states in 2014 and average GDP growth rate from 2000 to 2014
Country Area(ha)
Area share(%) Producers Processors
GDP growth(annual %)2000-2014
Austria (A1) 525521 19.4 22184 2118 1.39076Belgium (A2) 66704 4.9 1648 844 1.29216Denmark (A3) 165773 6.3 2565 787 0.57541Finland (A4) 212653 9.4 4247 648 1.18587France (A5) 1118845 4.1 26466 11198 1.08577Germany (A6) 1047633 6.3 23398 9497 1.04542Greece (A7) 256131 3.1 20186 1635 -0.12597Ireland (A8) 51871 1.3 1275 197 2.28549Italy (A9) 1387913 10.8 48662 12641 -0.28815Luxembourg (A10) 4490 3.4 79 72 2.38730Netherlands (A11) 49159 2.5 1706 1138 0.98598Portugal (A12) 212346 6.3 3029 437 0.04889Spain (A13) 1710475 6.9 30602 3082 1.39234Sweden (A14) 501831 16.4 5406 855 1.92575United Kingdom (A15)
521475 3 3526 2487 1.69930
Bulgaria (A16) 74351 2.4 3893 132 3.24647Croatia (A17) 50054 3.8 2194 242 1.47393Cyprus (A18) 3887 2.7 743 51 1.41277Czech Republic (A19)
472663 11.1 3866 506 2.43375
Estonia (A20) 155560 16.2 1542 109 3.57362Hungary (A21) 124841 2.7 1672 257 1.82258Latvia (A22) 203443 11.2 3497 63 4.03087Lithuania (A23) 164390 5.7 2445 67 4.35150Malta (A24) 34 0.3 10 9 1.65720Poland (A25) 657902 4.3 24829 484 3.56607Romania (A26) 289252 2.1 14159 120 3.65236Slovakia (A27) 180307 9.5 403 56 4.02968Slovenia (A28) 41237 8.9 3293 236 1.85629
Source: FIBL; IFOAM, https://shop.fibl.org/fileadmin/documents/shop/1698-organic-world-2016.pdf; Eurostat, http://appsso.eurostat.ec.europa.eu/nui/show.do?dataset=org_lstspec&lang=en; IFOAM, http://www.ifoam-eu.org/en/austria
According to the obtained variables QS, QR and Qi for each of the EU-28 member states, we can form three independent ranking lists. According to all the criteria, QS, QR and Qi (v=0,5) the best alternative is A9 (Italy).
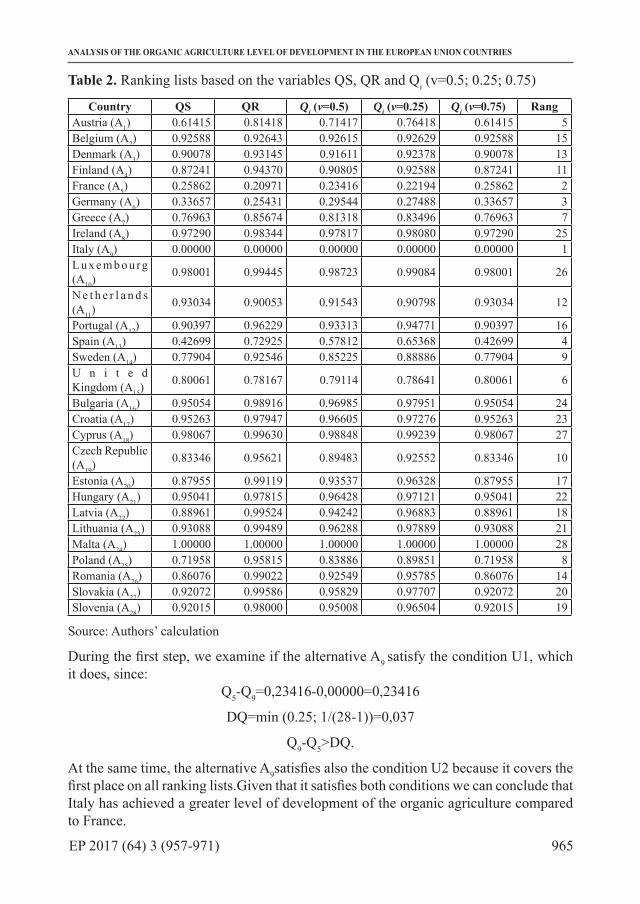
965EP 2017 (64) 3 (957-971)
ANALYSIS OF THE ORGANIC AGRICULTURE LEVEL OF DEVELOPMENT IN THE EUROPEAN UNION COUNTRIES
Table 2. Ranking lists based on the variables QS, QR and Qi (v=0.5; 0.25; 0.75)
Country QS QR Qi (v=0.5) Qi (v=0.25) Qi (v=0.75) RangAustria (A1) 0.61415 0.81418 0.71417 0.76418 0.61415 5Belgium (A2) 0.92588 0.92643 0.92615 0.92629 0.92588 15Denmark (A3) 0.90078 0.93145 0.91611 0.92378 0.90078 13Finland (A4) 0.87241 0.94370 0.90805 0.92588 0.87241 11France (A5) 0.25862 0.20971 0.23416 0.22194 0.25862 2Germany (A6) 0.33657 0.25431 0.29544 0.27488 0.33657 3Greece (A7) 0.76963 0.85674 0.81318 0.83496 0.76963 7Ireland (A8) 0.97290 0.98344 0.97817 0.98080 0.97290 25Italy (A9) 0.00000 0.00000 0.00000 0.00000 0.00000 1L u x e m b o u rg (A10)
0.98001 0.99445 0.98723 0.99084 0.98001 26
N e t h e r l a n d s (A11)
0.93034 0.90053 0.91543 0.90798 0.93034 12
Portugal (A12) 0.90397 0.96229 0.93313 0.94771 0.90397 16Spain (A13) 0.42699 0.72925 0.57812 0.65368 0.42699 4Sweden (A14) 0.77904 0.92546 0.85225 0.88886 0.77904 9U n i t e d Kingdom (A15)
0.80061 0.78167 0.79114 0.78641 0.80061 6
Bulgaria (A16) 0.95054 0.98916 0.96985 0.97951 0.95054 24Croatia (A17) 0.95263 0.97947 0.96605 0.97276 0.95263 23Cyprus (A18) 0.98067 0.99630 0.98848 0.99239 0.98067 27Czech Republic (A19)
0.83346 0.95621 0.89483 0.92552 0.83346 10
Estonia (A20) 0.87955 0.99119 0.93537 0.96328 0.87955 17Hungary (A21) 0.95041 0.97815 0.96428 0.97121 0.95041 22Latvia (A22) 0.88961 0.99524 0.94242 0.96883 0.88961 18Lithuania (A23) 0.93088 0.99489 0.96288 0.97889 0.93088 21Malta (A24) 1.00000 1.00000 1.00000 1.00000 1.00000 28Poland (A25) 0.71958 0.95815 0.83886 0.89851 0.71958 8Romania (A26) 0.86076 0.99022 0.92549 0.95785 0.86076 14Slovakia (A27) 0.92072 0.99586 0.95829 0.97707 0.92072 20Slovenia (A28) 0.92015 0.98000 0.95008 0.96504 0.92015 19
Source: Authors’ calculation
During the first step, we examine if the alternative A9 satisfy the condition U1, which it does, since:
Q5-Q9=0,23416-0,00000=0,23416
DQ=min (0.25; 1/(28-1))=0,037
Q9-Q5>DQ.
At the same time, the alternative A9satisfies also the condition U2 because it covers the first place on all ranking lists.Given that it satisfies both conditions we can conclude that Italy has achieved a greater level of development of the organic agriculture compared to France.

966 EP 2017 (64) 3 (957-971)
Bojan Krstić, Jelena Petrović, Tanja Stanišić, Ernad Kahrović
In the second step, we conduct the analysis of the alternative A5, the second on the ranking list Qi (v=0,5). At first, we test the condition U1 in the following way:
Q6-Q5=0,29544-0,23416>0,037.
The first condition is satisfied, because the second alternative A5 has “sufficient advantage” in relations to the third alternative of the ranking list, A6. The condition U2 has been satisfied successfully because the alternative has a sufficiently stable second place, according to all the criteria QS, QR and Qi (v=0,5; 0,25; 0,75).
During the third step, we conduct the analysis of the alternative A6, the third one on the ranking list Qi (v=0,5).At first, we test the condition U1 in this way:
Q13-Q6=0,57812-0,29544>0,037.
The first condition is satisfied, because the third alternative A6 has the “sufficient advantage” over the fourth alternative on the ranking list A13. Therefore, the top level of development of the organic agriculture has been achieved by Italy, the second place is held by France and the third place is held by Germany. Malta is on the twenty-eighth place, because it achieved the lowest level of development of organic agriculture on the EU-28 territory. Based on this, it can be concluded that the first research hypothesis has been confirmed. That is to say, there is an inequality of development of the organic agriculture between the EU-28 member states.
Table 3. Correlation between the development of the organic agriculture and the economic growth of the EU-28 member states
Qi (v=0.5)
GDP growth(annual %)2000-2014
Qi (v=0.5)Pearson Correlation 1 0.445*
Sig. (2-tailed) 0.018N 28 28
*Correlation is significant at the 0.05 level (2-tailed).Source: Authors’ calculation (SPSS Statistics 22)For the purposes of examining the interdependence between the level of development of the organic agriculture and the level of economic growth in the EU member states, table 3 presents the calculation of the value of the Pearson’s correlation coefficient between the annual growth rates of the GDP during the time period 2000-2014 and the level of development of the organic agriculture which is confirmed by the variable Qi (v=0.5).
Based on the value Sig. (2-tailed), we can conclude that there is a statistically significant correlation between the organic agriculture and the economic growth of the EU-28 member states, because the observed value is less than 0.05. The correlation coefficient value of 0.445 points out to the positive interdependency.
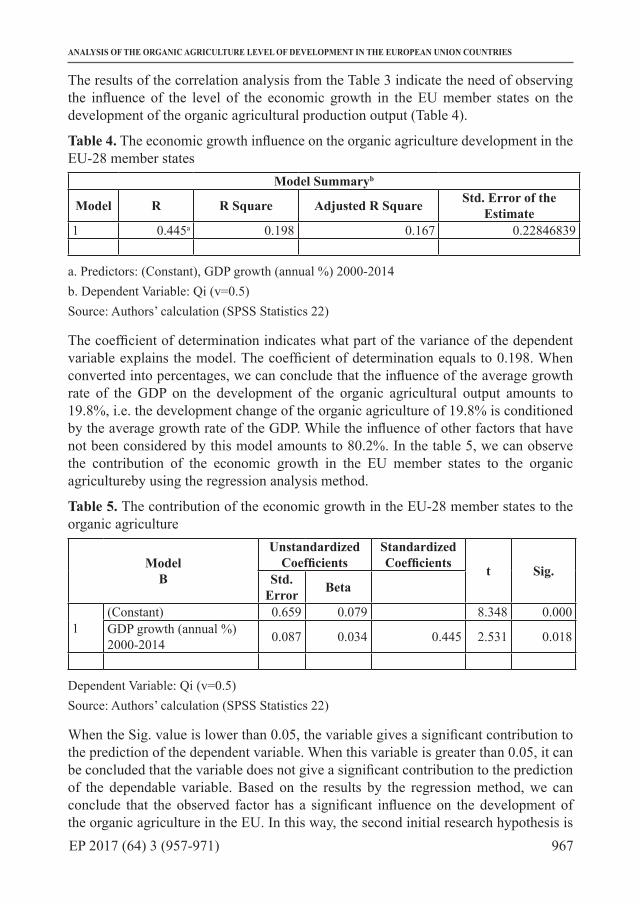
967EP 2017 (64) 3 (957-971)
ANALYSIS OF THE ORGANIC AGRICULTURE LEVEL OF DEVELOPMENT IN THE EUROPEAN UNION COUNTRIES
The results of the correlation analysis from the Table 3 indicate the need of observing the influence of the level of the economic growth in the EU member states on the development of the organic agricultural production output (Table 4).
Table 4. The economic growth influence on the organic agriculture development in the EU-28 member states
Model Summaryb
Model R R Square Adjusted R Square Std. Error of the Estimate
1 0.445a 0.198 0.167 0.22846839
a. Predictors: (Constant), GDP growth (annual %) 2000-2014b. Dependent Variable: Qi (v=0.5)Source: Authors’ calculation (SPSS Statistics 22)
The coefficient of determination indicates what part of the variance of the dependent variable explains the model. The coefficient of determination equals to 0.198. When converted into percentages, we can conclude that the influence of the average growth rate of the GDP on the development of the organic agricultural output amounts to 19.8%, i.e. the development change of the organic agriculture of 19.8% is conditioned by the average growth rate of the GDP. While the influence of other factors that have not been considered by this model amounts to 80.2%. In the table 5, we can observe the contribution of the economic growth in the EU member states to the organic agricultureby using the regression analysis method.
Table 5. The contribution of the economic growth in the EU-28 member states to the organic agriculture
ModelB
Unstandardized Coefficients
Standardized Coefficients t Sig.Std.
Error Beta
1(Constant) 0.659 0.079 8.348 0.000GDP growth (annual %)2000-2014 0.087 0.034 0.445 2.531 0.018
Dependent Variable: Qi (v=0.5)Source: Authors’ calculation (SPSS Statistics 22)
When the Sig. value is lower than 0.05, the variable gives a significant contribution to the prediction of the dependent variable. When this variable is greater than 0.05, it can be concluded that the variable does not give a significant contribution to the prediction of the dependable variable. Based on the results by the regression method, we can conclude that the observed factor has a significant influence on the development of the organic agriculture in the EU. In this way, the second initial research hypothesis is
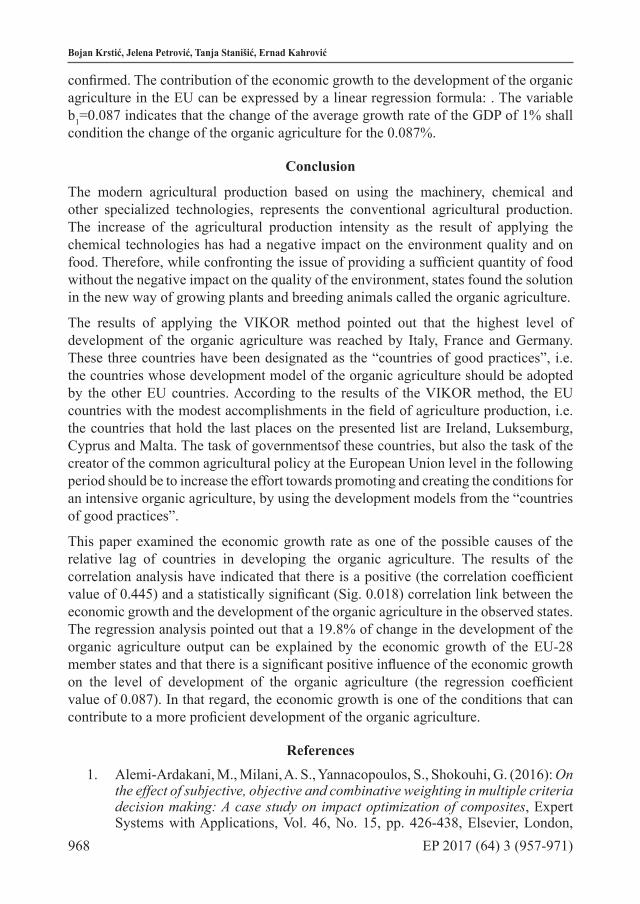
968 EP 2017 (64) 3 (957-971)
Bojan Krstić, Jelena Petrović, Tanja Stanišić, Ernad Kahrović
confirmed. The contribution of the economic growth to the development of the organic agriculture in the EU can be expressed by a linear regression formula: . The variable b1=0.087 indicates that the change of the average growth rate of the GDP of 1% shall condition the change of the organic agriculture for the 0.087%.
Conclusion
The modern agricultural production based on using the machinery, chemical and other specialized technologies, represents the conventional agricultural production. The increase of the agricultural production intensity as the result of applying the chemical technologies has had a negative impact on the environment quality and on food. Therefore, while confronting the issue of providing a sufficient quantity of food without the negative impact on the quality of the environment, states found the solution in the new way of growing plants and breeding animals called the organic agriculture.
The results of applying the VIKOR method pointed out that the highest level of development of the organic agriculture was reached by Italy, France and Germany. These three countries have been designated as the “countries of good practices”, i.e. the countries whose development model of the organic agriculture should be adopted by the other EU countries. According to the results of the VIKOR method, the EU countries with the modest accomplishments in the field of agriculture production, i.e. the countries that hold the last places on the presented list are Ireland, Luksemburg, Cyprus and Malta. The task of governmentsof these countries, but also the task of the creator of the common agricultural policy at the European Union level in the following period should be to increase the effort towards promoting and creating the conditions for an intensive organic agriculture, by using the development models from the “countries of good practices”.
This paper examined the economic growth rate as one of the possible causes of the relative lag of countries in developing the organic agriculture. The results of the correlation analysis have indicated that there is a positive (the correlation coefficient value of 0.445) and a statistically significant (Sig. 0.018) correlation link between the economic growth and the development of the organic agriculture in the observed states. The regression analysis pointed out that a 19.8% of change in the development of the organic agriculture output can be explained by the economic growth of the EU-28 member states and that there is a significant positive influence of the economic growth on the level of development of the organic agriculture (the regression coefficient value of 0.087). In that regard, the economic growth is one of the conditions that can contribute to a more proficient development of the organic agriculture.
References1. Alemi-Ardakani, M., Milani, A. S., Yannacopoulos, S., Shokouhi, G. (2016): On
the effect of subjective, objective and combinative weighting in multiple criteria decision making: A case study on impact optimization of composites, Expert Systems with Applications, Vol. 46, No. 15, pp. 426-438, Elsevier, London,

969EP 2017 (64) 3 (957-971)
ANALYSIS OF THE ORGANIC AGRICULTURE LEVEL OF DEVELOPMENT IN THE EUROPEAN UNION COUNTRIES
United Kingdom.2. Bruma, I. S. (2014): The Evolution Of Organic Agricultural Land Areas In
The Emerging Countries Of The European Union, Agricultural Economics and Rural Development, Vol. 11, No. 2, pp. 167-179, Premier Publisher, Birmingham, United Kingdom.
3. FIBL, IFOAM (2016): The world of organic agriculture: statistics & emerging trends 2016, Switzerland (available at: https://shop.fibl.org/fileadmin/docu-ments/shop/1698-organic-world-2016.pdf)
4. Forman, J., Silverstein, J. (2012): Organic foods: health and environmental advantages and disadvantages, Pediatrics, Vol. 130, No. 5, pp. 1406-1415, American Academy of Pediatrics, Chicago, USA.
5. Gosling, P., Hodge, A., Goodlass, G., Bending, G. D. (2006): Arbuscularmycorrhizal fungi and organic farming. Agriculture, Ecosystems & Environment, Vol. 113, No. 1, pp. 17-35, Elsevier, London, United Kingdom.
6. Hazama, K., Kano, M. (2015): Covariance-based locally weighted partial least squares for high-performance adaptive modeling, Chemometrics and Intelligent Laboratory Systems, No. 146, pp. 55–62, Elsevier BV, Amsterdam, Netherlands.
7. IFOAM (available at: http://www.ifoam-eu.org/en/austria)8. IFOAM (2008): Definition of Organic Agriculture, Switzerland (available at:
http://www.ifoam.bio/en/organic-landmarks/definition-organic-agriculture)9. Jaklic, T., Juvancic, L., Kavcic, S., Debeljak, M. (2014): Complementarity of
socio-economic and emergy evaluation of agricultural production systems: The case of Slovenian dairy sector, Ecological Economics, No. 107, pp. 469-481, Elsevier BV, Amsterdam, Netherlands.
10. Kaminski, M., Ossowski, N. (2014): Stokes problems with random coefficients by the Weighted Least Squares Technique Stochastic Finite Volume Method, Archive of civil and mechanical engineering, Vol. 14, No. 4, pp. 745-756, Elsevier BV, Amsterdam, Netherlands.
11. Karetsos, S., Costopoulou, C., Sideridis, A., Patrikakis, C., Koukouli, M. (2007): Bio@gro–an online multilingual organic agriculture e-services platform, Information Services & Use, Vol. 27, No. 3, pp. 123-132, IOS Press, Amsterdam, Netherlands.
12. Lampkin, N. (2002): Organic Farming, Old Pond Publishing, Ipswich, England.
13. Lampkin, N. (1994): Organic farming: sustainable agriculture in practice, in Lampkin, N., Padel, S. (Eds.), The Economics of Organic Farming, An International Perspective, CABI, Oxford, United Kingdom.
14. Nikolić, M., Radovanović, L., Desnica, E., Pekez, J. (2010): Primena metode VIKOR za izbor strategije održavanja, Tehnička dijagnostika, Vol. 9, No. 4, pp. 25-32, Tehnička dijagnostika, Beograd, Srbija.
15. Nowak, B., Nesme, T., David, C., Pellerin, S. (2015): Nutrient recycling in

970 EP 2017 (64) 3 (957-971)
Bojan Krstić, Jelena Petrović, Tanja Stanišić, Ernad Kahrović
organic farming is related to diversity in farm types at the local level, Agri-culture, Ecosystems & Environment, No. 204, pp. 17-26, Elsevier, London, United Kingdom..
16. Opricovic, S., Tzeng, G. (2007): Extended VIKOR method in comparison with outranking methods, European Journal of Operational Research, Vol. 178, No. 2, pp. 514-529, Elsevier BV, Amsterdam, Netherlands.
17. Opricovic, S., Tzeng, G. (2004): Compromise solution by MCDM methods: A comparative analysis of VIKOR and TOPSIS, European Journal of Operational Research, Vol. 156, No. 2, pp. 445-455, Elviser VB, Amsterdam, Netherlands.
18. Padel, S. (2001): Conversion to organic farming: a typical example of the dif-fusion of an innovation?, Sociologia Ruralis, Vol. 41, No. 1, pp. 40-61, Black-well Publishing Ltd., Oxford, United Kingdom.
19. Rozman, Č., Pažek, K., Kljajić, M., Bavec, M., Turk, J., Bavec, F., Kofjan, D., Škraba, A. (2013): The dynamic simulation of organic farming development scenarios – A case study in Slovenia, Computers and electronics in agriculture, No. 96, pp. 163-172, Elviser VB, Amsterdam, Netherlands.
20. Rusch, A., Delbac, L., Muneret, L., Thiery, D. (2015): Organic farming and host density affect parasitism rates of tortricid moths in vineyards, Agriculture, Ecosystems & Environment, No. 214, pp. 46-53, Elsevier, London, United Kingdom.
21. Sanders, J.,Stolze, M., Padel, S. (2011): Use and efficiency of public support measures addressing organic farming, Thunen-Institute of Farm Economics, Braunschweig, Germany.
22. Solsvik, S., Jakobsen, H. A. (2012): Effects of Jacobi polynomials on the numerical solution of the pellet equationusing the orthogonal collocation. Galerkin, tau and least squares methods, Computers and Chemical Engineering, Vol. 39, No. 6, pp. 1– 21, Pergamon, Oxford, United Kingdom.
23. Te Pas, C. M., Rees, R. M. (2014): Analysis of differences in productivity, prof-itability and soil fertility between organic and conventional cropping systems in the tropics and sub-tropics, Journal of Integrative Agriculture, Vol. 13, No. 10, pp. 2299-2310, Elviser VB, Amsterdam, Netherlands.
24. Toader, M., Roman, GH.V. (2014): Manual de agricultură general, Editura Terra Nostra, Iaşi.
25. Wang, Y. L., Tzeng, G. H. (2012): Brand marketing for creating brand value based on a MCDM model combining DEMATEL with ANP and VIKOR methods, Expert Systems with Applications, Vol. 39, No. 5, pp. 5600-5615, Pergamon, Oxford, United Kingdom.
26. Yu, W., Li, B., Yang, X., Wang, Q. (2015): A development of a rating method and weighting system for green store buildings in China, Renewable Energy, No. 73, pp. 123-129, Pergamon, Oxford, United Kingdom.
27. Zhang, H. (2015): Application on the Entropy method for determination of
971EP 2017 (64) 3 (957-971)
ANALYSIS OF THE ORGANIC AGRICULTURE LEVEL OF DEVELOPMENT IN THE EUROPEAN UNION COUNTRIES
weight of evaluating index in fuzzy mathematics for wine quality assessment, Advance Journal of Food Science and Technology, Vol. 7, No. 3, pp. 195-198, Institute of Food Science & Technology, London, United Kingdom.
ANALIZA RAZVOJA ORGANSKE POLJOPRIVREDNE PROIZVODNJE U ZEMLJAMA EVROPSKE UNIJE
Bojan Krstić5, Jelena Petrović6, Tanja Stanišić7, Ernad Kahrović8
Rezime
Svrha ovog rada je da istraži faktore razvoja organske poljoprivredne proizvodnje u državama članicama Evropske unije. Cilj rada je da se odgovarajućom metodologijom, odnosno primenom višekriterijumske analize izvrši rangiranje država članica Evropske unije prema stepenu razvoja organske poljoprivredne proizvodnje da bi se utvrdilo koja država članica je ostvarila najznačajniji razvoj posmatrane proizvodnje. Istraživanje se realizuje primenom VIKOR i ENTROPY metode. Rezultati istraživanja su pokazali da članice Evopske unije beleže različiti nivo razvoja organske poljoprivrede. Rezultati regresione i korelacione analize su ukazali na to da postoji značajna pozitivna korelaciona veza nivoa razvoja organske poljoprivredne proizvodnje i privrednog rasta u članicama Evropske unije. Privredni rast predstavlja jedan od faktora unapređenja razvoja organske poljoprivredne proizvodnje.
Ključne reči: organska poljoprivreda, višekriterijumska analiza, privredni rast.
5 Redovni professor, dr Bojan Krstić, Univerzitet u Nišu, Ekonomski fakultet,Trg Kralja Aleksandra br. 11, 18000, Niš, Srbija, Telefon: +381 64 80 96 208, E-mail: [email protected]
6 Vanredni professor, dr Jelena Petrović, Univerzitet u Nišu, Prirodno-matematički fakultet, Visegradska ulica br. 33, 18000, Niš, Srbija, Telefon: +381 63 113 27 68, E-mail: [email protected]
7 Docent, dr Tanja Stanišić, Univerzitet u Kragujevcu, Fakultet za hotelijerstvo i turizam u Vrnjačkoj Banji, Vojvodanska ulica bb, 36210 Vrnjačka Banja, Srbija, Telefon: +381 64 49 41 542, E-mail: [email protected]
8 Docent, dr Ernad Kahranović, Državni univerzitet u Novom Pazaru, Departman za ekonomske nauke, Ulica Vuka Karadžica bb, 36300 Novi Pazar, Srbija, Telefon: +381 65 290 88 85, E-mail: [email protected]


973
Original scientific paper Economics of Agriculture 3/2017UDC: 338.3:634.1/.7(497.113)
EP 2017 (64) 3 (973-985)
ECONOMIC INDICATORS OF THE PRODUCTION OF IMPORTANT FRUIT-SPECIFIC SPECIES IN VOJVODINA
ECONOMIC INDICATORS OF THE PRODUCTION OF IMPORTANT FRUIT-SPECIFIC SPECIES IN VOJVODINA1
Mirjana Lukač Bulatović2, Veljko Vukoje3, Dušan Milić4
Summary
The paper discusses the basic economic and production results of important fruit species (apple, pear, peach, sour cherry and plum) on agricultural farms of Vojvodina. The aim of the research is to evaluate the most important parameters of cost-effectiveness of these productions, and propose measures to improve the existing situation. Comparative analysis clearly shows that the most cost-effective is pears production, followed by apple, cherry, peach and plum. Pear production gives the largest coverage margin per unit capacity (1,261,786 din /ha), which is 16.5% better than in apple production (1,083,160 din /ha), or about 7.8 times better in relation to plums production (161,796 din /ha). The highest coefficient of economy (3.19) is, also, recorded in the production of pear (for apples 2.94, cherry 2.27, peach 2.17 and plum 1.44). Further development of fruit production in Vojvodina involves raising intensive farms with quality fruit varieties, firmer vertical linking of producers and processors, ensurement of economic safety of producers in the long run, making of fruit producing regions, etc.
Key words: fruit production, success indicators, profitability, Vojvodina.
JEL: Q19
1 The work is the result of research in the framework of the project “Analysis of production and economic results of business entities in the field of agriculture and food industry of AP Vojvodina”, financed by the Provincial Secretariat for Science and Technological Development, and the research within the project TR31058, 2011-2014, supported by the Ministry of Education, Science and Technology, Republic of Serbia.
2 Mirjana Lukač Bulatović Ph.D., Associate Professor, University of Novi Sad, Faculty of Agriculture, Trg Dositeja Obradovića no. 8, 21000 Novi Sad, Serbia, Phone: +381 63 892 97 21, E-mail: [email protected]; [email protected]
3 Veljko Vukoje Ph.D., Full Professor, University of Novi Sad, Faculty of Agriculture, Trg Dositeja Obradovića no. 8, 21000 Novi Sad, Serbia, Phone: +381 63 836 77 18, E-mail: [email protected]
4 Dušan Milić Ph.D., Full Professor, University of Novi Sad, Faculty of Agriculture, Trg Dositeja Obradovića no. 8, 21000 Novi Sad, Serbia, Phone: +381 63 557 582, E-mail: [email protected]

974 EP 2017 (64) 3 (973-985)
Mirjana Lukač Bulatović, Veljko Vukoje, Dušan Milić
Introduction
The Autonomous Province of Vojvodina (APV) has favorable natural conditions for agricultural production in general, and for the fruit production as a part of it. It is a highly agricultural region of the Republic of Serbia (RS) with very important natural, human and technical and technological resources for further development of agricultural production. The important asset is about 1.65 million hectares of cultivable, high quality land, or about 0.8 ha per capita, which is significantly more than most EU countries. This land by size, structure and basic qualitative properties provides very favorable conditions for development and further improvement of the volume, structure and quality of fruit production.
However, the available potentials for agricultural production in APV have not been sufficiently exploited. The causes are related to the macroeconomic environment that can generally be assessed as being rather unfavorable for the agricultural entities in the last decades. Lack of long-term agricultural and rural development strategies, inadequate measures of protection and stimulation of agricultural production, bad credit and investment policy, lack of own working capital, limited possibilities for obtaining favorable bank loans, difficult access to foreign markets, etc., are just some of the factors that contributed to insufficiently rapid development of agricultural production.
Macroeconomic measures are key in creating preconditions for competitive fruit production. Subsidies have a positive short-term effect, especially in the first years of fruit-growing when the costs are highest and subsidies partially compensate for these costs, so that the producer, besides financial assistance, has some psychological safety in terms of production (Ćejvanović et al., 2005). Subsidies and customs rates are basic macroeconomic measures of incentives and protection of domestic production.
Fruit production can be highly profitable only if the quality of products and fruit growing technologies are in line with market demands. Plantations should be raised with high-quality and productive varieties of those fruit species, which, within the available agroecological conditions of the environment, can achieve optimum production and economic results (Vukoje, Milić, 2009, 2011). According to Keserović (2004), fruit growing is one of the most productive agricultural branches, which exceeds the productivity of others in many ways. Fruit production produces 10-15 times higher production value per hectare than in wheat or corn production. Fruit production per unit area employs about 20 times more labor than wheat production.
However, fruit production requires a much higher investment of all factors of production, especially human labor, the availability of which may appear as a limiting factor. Additionally, plantation raising takes years and requires significant financial resources, so the risks are much higher.
Apple and pear are very intensive from the point of the investment of labor and materials per unit of capacity. According to Mišić (2003), the total costs of raising one hectare of apple trees are as follows: for an extensive planting around 5,000 €; semi-intensive
975EP 2017 (64) 3 (973-985)
ECONOMIC INDICATORS OF THE PRODUCTION OF IMPORTANT FRUIT-SPECIFIC SPECIES IN VOJVODINA
planting for 8,000 € and for modern day planting, with irrigation and drainage, about 15,000 €. Milić et al. (2006) analyze the economic feasibility of investments in raising apple and pear, and find that the investment return period is about 4.4 years in apples and 3.2 years in pear production.
Milić et al. (2001) point out that in the intensive production of plums, walnuts and hazelnuts, very good economic results are achieved, with walnut and lye being more cost-effective compared to plums.
In regular plum production, at an average selling price of 30.50 din/kg and an average production of 20,000 kg/ha, the production value is 610,000 din/ha, or 5,978 €/ha. In the production of plums the total annual costs are 405,684 din/ha (3,976 €/ha). The realized profit calculated as the difference between the value of production and the total costs is 204,316 din/ha (2,002 €/ha). However, it should be noted that the purchase price of plums is very unstable, even very low in some years, which significantly reduces the realized economic effects in this production (Lukač Bulatović, 2014).
Cherry is a promising fruit species whose production is growing in the world and in Serbia also. The area of distribution of sour cherry is broad, because this fruit species does not set specific requirements in terms of ecological conditions. However, in spite of the modest requirements in terms of natural conditions, the production of cherries in Europe, even in the world, is deficient in the market (Milić et al., 2009). Among other things, the issue of harvesting and securing a significant number of workers for harvesting is continually raised.
In order to raise 1 hectare of sour cherries (land preparation costs, planting costs, care costs in the first, second and third year and the costs of raising the fence), it is necessary to invest 507,380 dinars. In the structure of the total costs of raising the sour cherry plant the highest share is the costs of land preparation with the amount of 155,700 din/ha, and a share of 30,7% in total planting costs. After comes the costs of raising the fence with the amount of 123,345 din/ha, the costs of plant care range from 47,760 to 53,440 din/ha (Milić et al., 2009).
Vukoje, Milić (2009) conducted a comparative analysis of the profitability of apple, pear and plum production. According to the same authors, the highest production value (818,250 din/ha) and the highest profit (557,194 din/ha) is realized in pear production, followed by apple, while the least profitable is production of plums. The pears production bears the highest coefficient of economy of production (3.13) and the highest profit rate (68.1%).
Material and Method
The paper discusses the basic production and economic results of important fruit production in the area of AP Vojvodina. The research includes the most common fruit varieties in Vojvodina: apple, pear, peach, cherry and plum. The main aim of the research is to provide reliable estimates of the most important parameters of profitability

976 EP 2017 (64) 3 (973-985)
Mirjana Lukač Bulatović, Veljko Vukoje, Dušan Milić
recorded in these productions, and propose certain measures to improve the existing situation.
Achievement of the set aim requires a comparative analysis of the most important parameters of success in the production of apples, pears, peaches, cherries and plums. The analysis was carried out on the basis of average analytical calculations of these productions, made on the basis of data collected from individual (family) agricultural holdings (AH) for 2015/16. The sample included eight family farms, with representative producers, mostly small and medium-sized households, with an average level of intensity of production selected. The data were collected directly on site with significant assistance from the Advisory Service of AP Vojvodina.
The average analytical calculations are primarily based on the calculation of direct variable costs, output values and coverage margins as the basic result. The coverage margin (gross margin, contribution margin, marginal outcome, net income) is the most significant indicator of business performance, primarily from the aspect of short-term decision-making process (a one-year period or one reproduction cycle in agriculture). In order to fully understand profitability additional success indicators (total costs, profit, full cost price, cost-effectiveness and profitability rate) have been identified.
The method of sensitive analysis analyzes the movement of the achieved result in relation to the change of yield and/or market prices of products by +/- 20%.
In addition, official data from the Statistical Office of the Republic of Serbia (RZS), primarily on the production area, yields and production volume of observed fruit species in the period 2014-2016, were used.
Results
Agricultural holdings (AHs) represent the dominant part of domestic agriculture, both in terms of the basic capacities they have and the value of production they generate. On the territory of APV, there are about 147,500 agricultural farms and in the whole RS about 631,000 thousand AH. Agricultural holdings generate around 77.7% of the total agricultural land of AP Vojvodina, with a pronounced tendency to increase in the last decades.
Difficulties in providing reliable data represent a very serious limiting factor in the implementation of comprehensive agroeconomic analyzes on AH. In Serbia there is no legal obligation for bookkeeping on AH, with the exception of those that are in the VAT system, which is a relatively small number of farms for now. Companies with an annual income of over 8,000,000 dinars become VAT payers and are obliged to keep accounting. In practice, this is mainly reduced to so-called “simple bookkeeping” that is primarily tailored to the needs of tax authorities for monitoring while benefits for AHs are minimal.
The problem is somewhat mitigated by the establishment of the Farm Accounting Data Network system in Serbia. In the Republic of Serbia, the FADN system is operational it

977EP 2017 (64) 3 (973-985)
ECONOMIC INDICATORS OF THE PRODUCTION OF IMPORTANT FRUIT-SPECIFIC SPECIES IN VOJVODINA
functions in practice, but is still in the introduction and learning process so that the data that this system is currently producing is preliminary or unofficial. FADN is a macro system for collecting accounting data from a representative sample of AH, which is primarily directed towards the creation of measures of agrarian policy at the EU and/or Member State level. This system primarily considers AH as a whole, while it is insufficiently engaged in individual production, which is one of its main deficiencies. As a result, FADN does not produce analytical production calculations, which are crucial for the management of AH (Vukoje et al., 2017). However, advisers who are the operational bearers of the FADN system on the field make additional efforts to compile analytical calculations for the needs of the AH that have entered the FADN research sample. It is precisely these calculations of advisers, with the direct collection of data by the authors, which are essential for the compilation of the average analytical calculations of the observed production.
Production area, yield and fruit production
Observed fruit species with average areas (in the fruitfulness) of 13,485 hectares in the period 2014-2016, participate with 83.9% in the total area under fruit in Vojvodina. Apples are in the first place, with an average area of 6,347 ha, ie an average share of 39.5% in the total productive area of APV (table 1). After apples plums occupies (18.5%), peach (9.5%) and sour cherries (9.1%), while the pear occupies an average area of 1.178 ha, or an average share of 7.3% in the total productive areas of APV.
Table 1. Capacities of important fruit species in Vojvodina on average for the period 2014 - 2016
Fruit species
Average production area
(ha) (2014-2016)
Average participation in production
area (%)
Average yields (t/ha) (2014-2016)
Average volume production (t)
(2014-2016)
Average participation
in volume production
(%) Apple 6,347 39.5 25.5 161,993 60.5Pear 1,178 7.3 13.4 15,831 5.9Cherry 1,465 9.1 10.0 14,626 5.4Plum 2,974 18.5 12.8 38,022 14.2Peach 1,521 9.5 14.4 21,857 8.2Total 13,485 83.9 / 252,329 94.2Other fruit species 1 2,579 16.1 / 15,416 5.8
TOTAL 16,064 100 / 267,745 100
Source: Author’s calculation based on official data of the Statistical Office of the Republic of Serbia (2014-2016)
In the past period fruit production in Serbia was characterized by an outdated assortment and semi-intensive and extensive plantings, low level of applied agro-technical measures, unregular and low yields, poor and uneven quality of fruits. In recent years

978 EP 2017 (64) 3 (973-985)
Mirjana Lukač Bulatović, Veljko Vukoje, Dušan Milić
intensive plantations have grown, with modern assortment and high level of production technology. Quality planting material is also produced in domestic nurseries (Nikolić et al., 2012). The number of modern refrigerators for the storage of fruits and new processing plants is continually growing (Keserović, Magazin, 2014).
The biggest changes are introduced into apple cultivation technology. The standard in apple production is rising of highly intensive plantations in a thick assembly with antifactal nets and irrigation systems, with the high quality standard production (Keserović et al., 2007). Such plantings should also be followed by a variety dictated by the market (varieties such as Golden Delicious, Red Delicious and Granny Smith). The yield per hectare in these varieties ranges from 50 to 70 tons, on average, with high investments per unit area (Milić et al., 2009).
For the period 2014-2016 in Vojvodina average yields of analyzed fruit species amounted to: 10.0 t/ha in sour cherry production, 12.8 t/ha in plum production; 13.4 t/ha in pear production, 14.4 t/ha in pear production and 25.5 t/ha in apple production.
Observed fruit species with an average annual production of 252,329 tons (2014-2016) gave 94.2% of the total fruit production in Vojvodina (table 1). The highest volume of production was generated in apples (161.993 t) and plum (38.022 t) which was 74.7% of total fruit production in APV. According to the representation in the total production they are followed by peach (8.2%), pear (5.9%) and cherry (5.4%).
Analysis of economic results
Within the cooperation between the Faculty of Agriculture in Novi Sad - Department of Economics in Agriculture and Agricultural Advisory Service of AP Vojvodina, methodology was defined and software for collecting “production and economic indicators on AH” was developed (Vukoje, Koči, 2007). The model has been actively used within the APV Advisory Service for nearly a decade for the purpose of calculating and analyzing costs and results. The calculations on which the analyzes in this paper are based have been made according to this methodology. On the basis of collected data from AH average calculations were made for the production of apples, pears, peaches, cherries and plums (table 2).
A comparative analysis of the structure of total costs shows the dominant share of labor costs, which is logical and expected in fruit production. The share of labor costs in total variable costs ranges from 22.3% in apple production to 42.7% in the production of plums. Given that these are AH that do not have permanent employees, labor costs are calculated in the net amount, which is, based on the average daily allowance for a particular type of work. Plant protection is also a very important item in the cost structure of all fruit production, and ranges from 13.9% in sour cherries to 29.5% in apples. A significant share of the costs of other materials is evident (from 8.9% in sour cherry production to 15.9% in pear production), which mainly refers to packaging. Mineral fertilizer costs account for 8.9% (pear) to 14.0% (peach) of total costs, while fuel costs ranges from 6.3% to 10.3% of total costs.
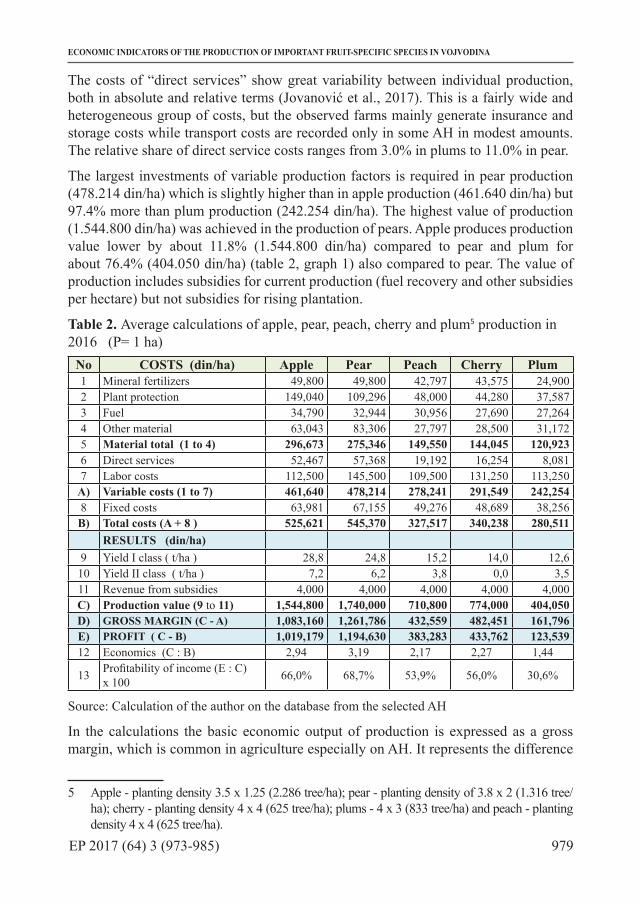
979EP 2017 (64) 3 (973-985)
ECONOMIC INDICATORS OF THE PRODUCTION OF IMPORTANT FRUIT-SPECIFIC SPECIES IN VOJVODINA
The costs of “direct services” show great variability between individual production, both in absolute and relative terms (Jovanović et al., 2017). This is a fairly wide and heterogeneous group of costs, but the observed farms mainly generate insurance and storage costs while transport costs are recorded only in some AH in modest amounts. The relative share of direct service costs ranges from 3.0% in plums to 11.0% in pear.
The largest investments of variable production factors is required in pear production (478.214 din/ha) which is slightly higher than in apple production (461.640 din/ha) but 97.4% more than plum production (242.254 din/ha). The highest value of production (1.544.800 din/ha) was achieved in the production of pears. Apple produces production value lower by about 11.8% (1.544.800 din/ha) compared to pear and plum for about 76.4% (404.050 din/ha) (table 2, graph 1) also compared to pear. The value of production includes subsidies for current production (fuel recovery and other subsidies per hectare) but not subsidies for rising plantation.
Table 2. Average calculations of apple, pear, peach, cherry and plum5 production in 2016 (P= 1 ha)
No COSTS (din/ha) Apple Pear Peach Cherry Plum1 Mineral fertilizers 49,800 49,800 42,797 43,575 24,9002 Plant protection 149,040 109,296 48,000 44,280 37,5873 Fuel 34,790 32,944 30,956 27,690 27,2644 Other material 63,043 83,306 27,797 28,500 31,1725 Material total (1 to 4) 296,673 275,346 149,550 144,045 120,9236 Direct services 52,467 57,368 19,192 16,254 8,0817 Labor costs 112,500 145,500 109,500 131,250 113,250
A) Variable costs (1 to 7) 461,640 478,214 278,241 291,549 242,2548 Fixed costs 63,981 67,155 49,276 48,689 38,256B) Total costs (A + 8 ) 525,621 545,370 327,517 340,238 280,511
RESULTS (din/ha) 9 Yield I class ( t/ha ) 28,8 24,8 15,2 14,0 12,610 Yield II class ( t/ha ) 7,2 6,2 3,8 0,0 3,511 Revenue from subsidies 4,000 4,000 4,000 4,000 4,000C) Production value (9 to 11) 1,544,800 1,740,000 710,800 774,000 404,050D) GROSS MARGIN (C - A) 1,083,160 1,261,786 432,559 482,451 161,796E) PROFIT ( C - B) 1,019,179 1,194,630 383,283 433,762 123,53912 Economics (C : B) 2,94 3,19 2,17 2,27 1,44
13 Profitability of income (E : C) x 100 66,0% 68,7% 53,9% 56,0% 30,6%
Source: Calculation of the author on the database from the selected AH
In the calculations the basic economic output of production is expressed as a gross margin, which is common in agriculture especially on AH. It represents the difference
5 Apple - planting density 3.5 x 1.25 (2.286 tree/ha); pear - planting density of 3.8 x 2 (1.316 tree/ha); cherry - planting density 4 x 4 (625 tree/ha); plums - 4 x 3 (833 tree/ha) and peach - planting density 4 x 4 (625 tree/ha).

980 EP 2017 (64) 3 (973-985)
Mirjana Lukač Bulatović, Veljko Vukoje, Dušan Milić
between the production value and the variable cost. It can be calculated at several levels, i.e. with varying degrees of coverage of variable costs. These calculations mainly cover all direct variable costs including the costs of external production services (insurance, storage, transport, etc.).The gross margin shows how many households earn above the cost of production (Ivkov et al., 2008). Chadwick (2000) emphasizes that the gross margin is not a profit. The total gross margin of all production lines in the holding is the amount from which all fixed costs are deducted in order to calculate the profit at the level of the agricultural holding.The margin of cover is a very useful indicator of the achieved result, primarily from the aspect of short-term decision-making process (up to one year or one reproduction cycle in agriculture). Since fixed costs in the short term are largely unchanged (ie, they can not be avoided to a significant extent), the profitability of individual production can be better viewed on the basis of the margin of coverage than on the basis of profit, since the inaccuracy of the distribution of fixed costs to individual production is avoided (Vukoje, Milić, 2009).Graph 1. The production value and gross margin (in 000 RSD/ha)
Source: Author’s calculation based on own research
Pear production gives the highest gross margin per capacity unit (1,261,786 din/ha), which is about 16.5% better than in apple production (1,083,160 din/ha), or about 7,8 times better in comparison with plum production (161,796 din/ha) (table 2, graph 1).
In the calculations, for reasons of transparency, “fixed costs” are expressed as one position although this is a rather heterogeneous group of costs. These are primarily fixed costs of basic production capacities, ie fixed assets of the holding (depreciation and maintenance of plantation, buildings and equipment, insurance of fixed assets, interest on the acquisition of fixed assets, etc.). In calculating the depreciation of perennial plants the real cost of starting a plantation (without government subsidies) and the average life of exploitation are taken into account. It should be noted that the value of agricultural land does not fall into the value of the plantations on it.

981EP 2017 (64) 3 (973-985)
ECONOMIC INDICATORS OF THE PRODUCTION OF IMPORTANT FRUIT-SPECIFIC SPECIES IN VOJVODINA
The second cost group is consists of overhead expenses of the household (electricity, water, taxes, contributions, heating, telephone, passenger car costs, commissions, fees, intellectual services, possible marketing costs, sales, etc.). These costs are calculated or distributed in proportion to the total variable costs of individual production. These costs represent a relatively significant item in the structure of total costs of individual production (12.6% -5.0%). Without their calculation, a reliable picture of the level of profitability of individual production and of the household as a whole cannot be obtained.
When fixed costs are deducted from the margin of coverage, a final net result in the form of profit and loss is obtained. This result, logically, shows a similar order of profitability of observed production as well as a margin of coverage, but there are some differences, primarily due to the different amount of direct depreciation costs. The highest net profit (1.019.179 din/ha) is also realized in pear production, which is 17.2% better compared to apple production, ie about 9.7 times better compared to plum production (table 2).
The coefficient of profitability (profitability rate, production profitability rate) falls into the group of so-called relative success indicators. Given that they are expressed as a coefficient, or a percentage, they are suitable for spatial and temporal comparison of different production, farms, etc.
The coefficient of economy shows that for each dinar of the costs involved in the production of pear, 3.19 dinars of production value is achieved, which represents a very good relationship (table 2, graph 2). A somewhat smaller but also high coefficient of economy is calculated in the production of apples (2.94). This indicator also shows the relatively high profitability of sour cherry production (2.27) and peach (2.17), ie satisfactory rate of plum production profitability (1.44). Significant differences in the level of profitability between individual productions are noticeable especially between the pear and the plum as the worst (2.21 times).
Graph 2. Coefficients of economy and profitability of income
Source: Calculation of authors based on own research
982 EP 2017 (64) 3 (973-985)
Mirjana Lukač Bulatović, Veljko Vukoje, Dušan Milić
The profit margin or profitability of the income shows the same order of profitability of the observed production as well as the economic efficiency coefficient, which is logical bearing in mind the formula under which it is calculated. In the production of pears, 68.7 RSD is earned on every 100 RSD, which is 2.25 times better than in plum production (30.6%) (table 2, graph 2).
The margin of coverage per unit of capacity (1 ha) and the economic efficiency coefficients, as the two most important indicators rank the observed production in the same way in terms of the level of their profitability. In the first place is pear production immediately behind it is an apple production with an approximate level of profitability, followed by cherry and peach, while the plum is definitely the worst. In practice, it may be that these two criteria do not match more or less in terms of the level of profitability of individual production, which requires additional indicators to be included in the analysis. In this case, such a problem does not exist.
Sensitive analysis measures the sensitivity of the results to varying the key physical and financial parameters of success. It shows the movement of the gross margin of individual production depending on the change in the yield or the selling price of the product. The exposure of individual production to this type of risk agrees with the previously shown level of profitability. Thus, in the production of plums, the financial result becomes negative in reducing yields or market prices by about 41%, while the production of pears is only lost with a decrease in yield or market prices by about 72%. There is therefore no danger of achieving a negative financial result in normal production conditions, even in the plum production as the least profitable production.
Conclusion
The results of the research show a generally high level of profitability of fruit production, but also significant differences between the types of observed production. According to all indicators the production of pears clearly stands out as the most profitable, with the largest gross margin per capacity unit (1.261.786 din/ha) and the highest economic coefficient (3.19). Apples does not lag far behind pears (gross margin 1,083,160 din/ha, economy coefficient 2,94), while plum is the least profitable (gross margin is 161,796 din/ha and the coefficient of economy 1,44).
The production of pears requires the highest investment per unit of capacity (545.370 din/ha), which is 1.9 times more than in the production of plums (280.511 din/ha). In the structure of total costs, the labor costs are dominant (from 22.3% in apple production to 42.7% in the production of plums). Also significant are the costs of plant protection (from 13.9% in cherries to 29.5% in apples), while the costs of mineral fertilizers are considerably lower, ranging from 8.9% in plums to 13.1% in peaches.
In fruit growing multiply higher amount of financial result is achieved per unit of area (ha) than in crop production. Although fruit production requires significantly higher capital and current investments per hectare, there is no dilemma that it is necessary to make constant efforts to increase fruit growing in Vojvodina. To achieve this it is
983EP 2017 (64) 3 (973-985)
ECONOMIC INDICATORS OF THE PRODUCTION OF IMPORTANT FRUIT-SPECIFIC SPECIES IN VOJVODINA
necessary to:
− raise intensive plantations, with those types and varieties of fruits which, according to the yields and quality, can provide higher return on investment;
− establish compulsory insurance of production, while developing new insurance models;
− have strong vertical connection between producers and processors of fruit, which is one of the basic assumptions of long-term supply of the processing industry with the necessary raw materials. High intensive fruit production cannot be achieved without modern industries for their processing;
− establish regions of fruit-growing production, which means the division of the RS into individual regions and, within them, sub-regions suitable for the cultivation of certain types and varieties of fruit;
− undertake a series of measures of agrarian policy in order to stabilize production and supply in the long run, and to ensure the economic safety of the producers.
Reference1. Chadwick, L. (2000): The Farm Management Handbook 2000/2001. 21st
Edition, The Scottish Agricultural College.2. Ćejvanović, F. Franić, R., Rozman, Č. (2005): Transition in Agriculture -
Review on Subsidy and Custom Rates Effects in Apple Production in Bosnia and Herzegovina, Journal of Central European Agriculture Vol. 6, No. 3, pp. 343-352.
3. Janković, S., Gos, S., Jovanović, R., Pusić, M., Todorović, G., Tolimar, N., Anđelić, B., Ivkov, I., Dalton, G. (2007): Poslovanje poljoprivrednih gazdinstava u Srbiji 2006, Institut za primenu nauke u poljoprivredi, Beogad.
4. Jovanović, D., Milenković, N., Damnjanović, R. (2017): Ocenjivanje i predviđanje potreba potrošača, Oditor, Vol. 3, No. 1, pp. 70-79.
5. Ivkov, I., Todorović S., Munćan M. (2008): Bruto marža kao značajan pokazatelj poslovanja poljoprivrednih gazdinstava, Tematski zbornik, Agroekonomska nauka i struka u tranziciji obrazovanja i agroprivrede, Poljoprivredni fakultet, Beograd, pp. 235-244.
6. Keserović, Z. (2004): Savremene tendencije u proizvodnji jabuke i kruške, Zadružni savez Vojvodine, Novi Sad.
7. Keserović, Z., Gvozdenović, D., Magazin, N., Milić, B. (2007): Integral Production of Fruits, Journal of Economics of Agriculture, Vol. 54, No. 2, pp. 149-160.
8. Keserović, Z., Magazin, N. (2014): Fruit growing in Serbia – State and Prospects. Closing Conference, Utilisation of the Census of Agriculture 2012 data in analysing status of agriculture and agricultural policy making in the Republic of Serbia, pp. 192-228.

984 EP 2017 (64) 3 (973-985)
Mirjana Lukač Bulatović, Veljko Vukoje, Dušan Milić
9. Lukač Bulatović, M. (2014): Ekonomska efikasnost proizvodnje i prerade voća, Monografija, Poljoprivredni fakultet, Novi Sad.
10. Lukač Bulatović, M., Rajić, Z., Đoković, J. (2013): Development of Fruit Production and Processing in The Republic of Serbia, Economics of Agriculture, The Balkan Scientific Association of Agrarian Economists, Vol. 60, No. 1, pp. 141 -153.
11. Milić, D., Kalanović Bulatović, B., Trmčić, S. (2009): Menadžment proizvodnje voća i grožđa, Monografija, Poljoprivredni fakultet, Novi Sad.
12. Milić, D., Lukač Bulatović, M., Kukić, Đ. (2006): Ocena ekonomske efekti vnosti podizanja zasada jabučastog voća, Časopis PTEP, Društvo za procesnu tehniku i energetiku u poljoprivredi, Vol. 10, No. 5, pp. 23-29.
13. Milić, D., Prenkić, P., Vlahović, B. (2001): Ekonomski efekti proizvodnje šljive, Tematski zbornik, Međunarodni naučni simpozijum Proizvodnja, prerada i plasman šljive i proizvoda od šljive, Koštunići, pp. 191-197.
14. Nikolić, D., Keserović, Z., Magazin, N., Paunović, S., Miletić, R.; Nikolić, M., Milivojević, J. (2012): Condition and Development Prospects of Fruit growing in Serbia, 14th Serbian Congress of Fruit and Grapevine Producers with International Participation, pp. 3-22.
15. Nott, B. S., Smith, I. (1998): Business Analysis Summary for Fruit Farmers, Michigan State University, Department of Agricultural Economics, Michigan.
16. Statistički godišnjak 2014-2016, Republičkog zavoda za statistiku, (available at: www.stat.gov.rs).
17. Vukoje, V., Koči, I. (2007): Proizvodno-ekonomski pokazatelji na poljoprivrednim gazdinstvima, poglavlje u monografiji „Sistem informacija u poljoprivrednom savetodavstvu Vojvodine”, Poljoprivredni fakultet Novi Sad, pp. 143-196.
18. Vukoje, V., Maletić, D. (2007): Sistem prikupljanja računovodstvenih podataka na poljoprivrednim gazdinstvima uzemljama EU – FADN, Agroekonomika br. 36, Poljoprivredni fakultet Novi Sad, pp. 155-162.
19. Vukoje, V., Milić, D. (2009): Ekonomski efekti u proizvodnji važnijih vrsti voćaka, Časopis Ekonomika poljoprivrede, Vol. 56, No. 3, pp. 377-387.
20. Vukoje, V., Dulić, V., Nikolić Đorić, E. (2017): Analiza proizvodno-ekonomskih rezultata poslovanja privrednih subjekata iz oblasti poljoprivrede i prehrambene industrije AP Vojvodine, Brošura, Poljoprivredni fakultet Novi Sad.
985EP 2017 (64) 3 (973-985)
ECONOMIC INDICATORS OF THE PRODUCTION OF IMPORTANT FRUIT-SPECIFIC SPECIES IN VOJVODINA
EKONOMSKI INDIKATORI PROIZVODNJE VAŽNIJIH VOĆNIH VRSTA U VOJVODINI6
Mirjana Lukač Bulatović7, Veljko Vukoje8, Dušan Milić9
Apstrakt
U radu se razmatraju osnovni proizvodno-ekonomski rezultati važnijih voćarskih proizvodnji (jabuka, kruška, breskva, višnja i šljiva) na poljoprivrednim gazdinstvima Vojvodine. Cilj istraživanja je da ocene najvažniji parametara isplativosti navedenih proizvodnjama, i predlože mere za poboljšanje postojećeg stanja. Komparativna analiza jasno pokazuje da je najisplativija prizvodnja kruške, a potom slede jabuka, višnja, breskva i šljiva. Proizvodnja kruške odbacuje najveću maržu pokrića po jedinici kapaciteta (1.261.786 din/ha), što je za 16,5% bolji rezultat nego u proizvodnji jabuke (1.083.160 din/ha), odnosno za oko 7,8 puta bolje u odnosu na proizvodnju šljive (161.796 din/ha). Najveći koeficijent ekonomičnosti (3,19) takođe beleži izvodnja kruške (jabuka 2,94; višnja 2,27; breskva 2,17 i šljiva 1,44). Dalji razvoj voćarske proizvodnje Vojvodine podrazmeva podizanje intenzivnih zasada sa kvalitenim sortama voća, čvršće vertikalno povezivanje proizvođača i prerađivača, obezbeđivanje ekonomske sigurnost proizvođača na dugi rok, izrada rejonizacije voćarske proizvodnje itd.Ključne reči: voćarska proizvodnja, indikatori uspeha, isplativost, Vojvodina
6 Rad je rezultat istraživanja u okviru projekta ‘’Analiza proizvodno-ekonomskih rezultata poslovanja privrednih subjekata iz oblasti poljoprivrede i prehrambene industrije AP Vojvodine’’, koji finansira Pokrajinski sekretarijat za nauku i tehnološki razvoj APV.
7 Vanredni profesor, dr Mirjana Lukač Bulatović, Univerzitet u Novom Sadu, Poljoprivredni fakultet, Trg Dositeja Obradovića br. 8, 21000 Novi Sad, Srbija, Telefon: +381 63 892 97 21, E-mail: [email protected]; [email protected]
8 Redovni profesor, dr VeljkoVukoje, Univerzitet u Novom Sadu, Poljoprivredni fakultet, Trg Dositeja Obradovića br. 8, 21000 Novi Sad, Srbija, Telefon: +381 63 836 77 18, E-mail: [email protected]
9 Redovni profesor, dr DušanMilić, Univerzitet u Novom Sadu, Poljoprivredni fakultet, Trg Dositeja Obradovića br. 8, 21000 Novi Sad, Srbija, Telefon: +381 63 557 582, E-mail: [email protected]


987
Original scientific paper Economics of Agriculture 3/2017UDC: 366.622:631.147(497.115)
EP 2017 (64) 3 (987-1001)
RESEARCH OF CONSUMERS’ ATTITUDES ON THE ORGANIC FOOD CONSUMPTION IN THE SERBIAN ENCLAVES IN KOSOVO
RESEARCH OF CONSUMERS’ ATTITUDES ON THE ORGANIC FOOD CONSUMPTION IN THE SERBIAN ENCLAVES IN KOSOVO
Goran Maksimović1, Božidar Milošević2, Radomir Jovanović3
Abstract
The organic production in Serbian enclaves in Kosovo has a great potential based on the extensive production mostly in hilly-mountainous areas with rich and convenient environment for the organic production of medicinal plants, fruits, vegetables, wine, honey etc., but it still keeps developing. The enclave can realise a high income, and thereby also an economic basis for the sustainable development of multifunctional agricultural holdings in Serbian enclaves, by the production and sale of organic products on local markets. In this paper, the authors study the consumers’ attitudes on purchase and consumption of organic food in Serbian enclaves in Kosovo. Empirical research was carried out on a spatial sample of 300 respondents, by a personal communication technique using the questionnaire as an instrument of research method. Areas of research are towns: Northern KosovskaMitrovica, Leposavic, ZubinPotok and Gracanica. Goal of the research is to discover the preferences, motives, attitudes and interests of consumers for buying the organic products, based on a defined survey to recognise the basic features of supply and the demand of organic agricultural and food products. After analysing the conducted survey, we have discovered that the organic food market in Serbian enclaves in Kosovo has not been sufficiently developed; it is necessary to expand the range of organic agriculture products and a constant supply is required, better marketing, and better information and education of consumers in order to raise supply to a higher level.
Key words: organic agriculture, organic food consumption.
JEL:Q13, E31, D12
1 Goran Maksimović Ph.D., Associate Professor, University Of Priština, Faculty of Agriculture, Kopaoničkastreet nn, 38219 Lešak, Serbia, Phone: +381 63 419 757, E-mail: [email protected]
2 Božidar Milošević Ph.D., Full Professor, University Of Priština, Faculty of Agriculture, Kopaonička street nn, 38219, Lešak, Serbia, Phone: +381 64 150 5273, E-mail: [email protected]
3 Radomir Jovanović Ph.D., Assistant Professor, University Of Priština, Faculty of Agriculture, Kopaonička street nn, 38219, Lešak, Serbia, Phone: +381 65 561 3940, E-mail: [email protected]

988 EP 2017 (64) 3 (987-1001)
Goran Maksimović, Božidar Milošević, Radomir Jovanović
Introduction
According to FAO (United Nations Organization for Agriculture) and WHO (World Health Organization) definition, the organic production is a system of production management, which promotes the preservation of eco-system by unifying biodiversity, biological cycles with emphasis on a need of methods that exclude the use of inputs for production outside a farm. The organic agricultural production is highlighting the quality and safety avoiding the application of synthetic mineral fertilizers, plant protection agents, growth regulator in livestock breeding and additives for animal feed. The organic production provides a harmonic management of nutrients, and the result is a tasty, healthy-safe organic product of high nutritional value, rich with macro and micro elements and vitamins as well. Hereof a regular consumption of organic products contributes to the preservation and improvement of health and preventing the occurrence of diseases. Organic product is the result of organic production that realises along with the application of agro-technical measures, which eliminate the use of synthetic-chemical agents. The main goal of organic agriculture is the production of high nutritional value food, development of sustainable agriculture along with the eco-system preservation, maintenance and increase of soil fertility, the use of landfill and stable manure or plants of long root in a permanent crop rotation and adding composted dung in soil. It implies maximum use of renewable sources of energy, preservation of agro-ecosystem genetic diversity and the environmental protection, reduction of all kinds of pollution that may be the consequence of agricultural production in order to create the conditions for satisfying the basic life needs of farmers, and gaining some profit (Radoičić,A. 2013) Organic manufacturers manage with 43.7 million hectares. The global organic food market in the year 2014 was achieved the value of 80 milliard USD, while the leading role has USA, Germany, France and China. There were 260000 organic manufacturers in EU in 2014 and about 340000 organic manufacturers in the whole Europe (Meredith and Willer, 2016). The organic food market in European countries and in the world records fast growth; however, it is still under developed in our country. Total areas under the organic production in the Republic of Serbia stretch on area of 15,298.02 ha (Ministry of Agriculture and Environmental Protection, 2016). Total turnover of the organic food sector amounts around 40 million USD. As Willer and Lemoud stated (2016), our country significantly lags behind in comparison with other European countries, with an average expenditure per capita of 5 USD. According to the previous research results, it is obvious that the consumption of organic food per capita in Serbia was significantly lower in comparison to consumption in European countries (Meredith and Willer, 2016; Golijan and Popović, 2016). Reasons for such bad condition in the organic food consumption in Serbia, according to Vehapi (2015) were insufficient information of consumers, poor and monotonous supply of organic food products, poorly developed distribution channels and low personal income of population.

989EP 2017 (64) 3 (987-1001)
RESEARCH OF CONSUMERS’ ATTITUDES ON THE ORGANIC FOOD CONSUMPTION IN THE SERBIAN ENCLAVES IN KOSOVO
Working material and a method of work
In this paper, the authors study the consumers’ attitudes on purchase and consumption of organic food in Serbian enclaves in Kosovo. Empirical research was carried out on a simple sample of 300 respondents, by a personal communication technique, field research, using a survey as an instrument of test method. Test areas are towns: Northern KosovskaMitrovica, Leposavic, ZubinPotok and Gracanica. The research goal is to perceive main features of demand and consumption of the organic agricultural and food products based on the defined survey. The research was done in May and June 2017, and the survey was lasting for 30 days. When designing the survey, there was used the quantitative approach in order to get data on who, in which extent and where buys the organic food, and the quality approach in order to determine the motive for purchasing the organic products. Advantage of the survey reflects in a fact that it can comprise wide area of the respondents; there avoids the influence of an examiner (interviewer) on the respondents’ answers -Vlahović B. (2011). The questionnaire is composed of 26 questions and divided into two parts; the first part refers to general questions: gender, place of living, level of education, and the respondents’ income. The second part of the questionnaire was done in order to discover preferences, motives, attitudes and interests of consumers for the purchase of organic products. The survey results are expressed in tables and charts.
Research results
In the respondents’ structure, according to gender, the female population is more represented (60%), while the male population is represented with 40%. The survey was conductedin towns: Northern KosovskaMitrovica, Leposavic, ZubinPotok and Gracanica, and therefore the survey results show that 51.50% respondents live in urban areas, while 48.50% respondents live in rural or suburban settlements. We have discovered, by analysing the age category of respondents, that the survey has comprised persons older than eighteen years and persons who have their own incomes and the attitude on the organic food significance. The most of respondents is 18-25 years of age (34.50%), and then the respondents of 26-35 years of age (28.50%), 36-45 years of age (15.50%), 46-55 years of age (9.50%) and finally the respondents over 55 years of age (12%). The most of respondents have secondary education (36%), while 26% of respondents have college education, and 22% of respondents have university education, and the least respondents have only elementary education (16%). One third of respondents (33%) have a monthly income in the range from 40,000 to 60,000 RSD, 31.50% of respondents have a monthly income over 60,000 RSD, while 22% of respondents have a monthly income in the range from 20,000 to 40,000 RSD, and the lowest incomes (up to 20,000 RSD) have 13.50% of respondents.

990 EP 2017 (64) 3 (987-1001)
Goran Maksimović, Božidar Milošević, Radomir Jovanović
Table 1. General questions in the surveyRespondents %
GenderMale 120 40%Female 180 60%
Place of livingTown 155 51.5%
Village 145 49.5%
Age
Up to 25 103 34.5%26-35 85 28.5%36-45 47 15.5%46-55 29 9.5%
Over 55 36 12%
Education
Elementary school 48 16%Secondary school 108 36%College education 78 26%University education 66 22%
Total monthly income
Up to 20,000 41 13.50%20,000-40,000 66 22.00%40,000-60,000 99 33.00%Over 60,000 94 31.50%
Source: Authors’s research
The research results show that the most of interviewed respondents (72%) of different sex and age structure and different purchasing power feed in a classic (conventional) way, i.e. in most of cases those are cooked meals; this is expected since this is the area with traditional habits concerning diet. Most of the week 14.50% of interviewed respondents consumes fast food and this population is younger than 35 years. Some other form of diet is consumed by 7% of respondents; a small number of respondents (3.5%) are vegetarians, while 3% of respondents in Serbian enclaves in Kosovo consume macrobiotic food. The obtained answer to the issue about information on the organic food production was positive by all respondents (100%) which mean that they are informed about the organic production. This problem was studied by Vlahovicand associates (2010) and was concluded that 89% of respondents in Novi Sad was informed about the organic agricultural production, while 11% of respondents wasn’t informed. People older than 65 years of age (33%) and the respondents with the lowest education (45%) show the ignorance of these products. According to Renko and Bosnjak research (2009) 83% of respondents in Croatia have heard for organic products. That is a little less in regard tothe survey results, which was conducted in Novi Sad, and the conclusion was that there was progress in consumers’ information and was a good precondition for the development of organic agricultural production and purchase of organic products.
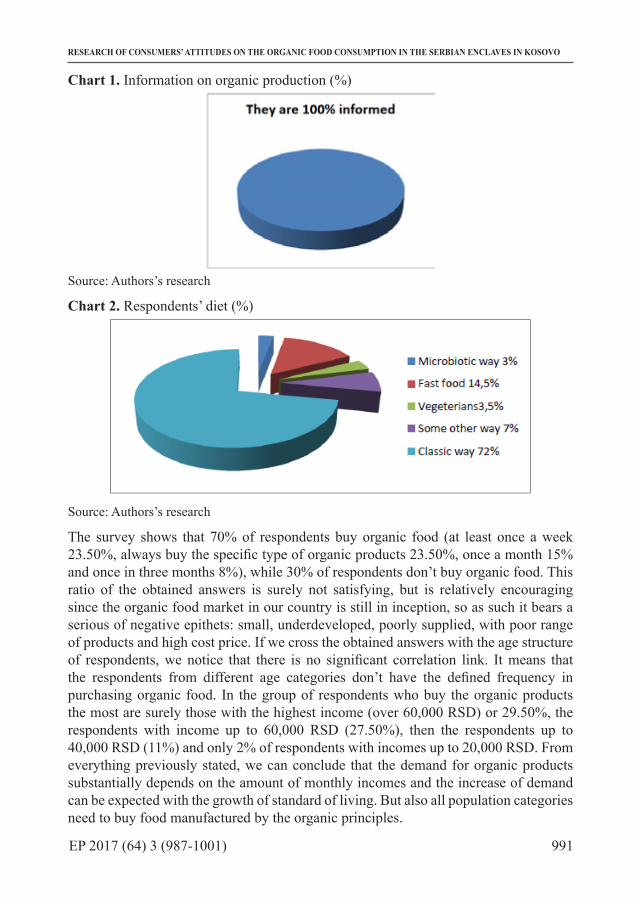
991EP 2017 (64) 3 (987-1001)
RESEARCH OF CONSUMERS’ ATTITUDES ON THE ORGANIC FOOD CONSUMPTION IN THE SERBIAN ENCLAVES IN KOSOVO
Chart 1. Information on organic production (%)
Source: Authors’s research
Chart 2. Respondents’ diet (%)
Source: Authors’s research
The survey shows that 70% of respondents buy organic food (at least once a week 23.50%, always buy the specific type of organic products 23.50%, once a month 15% and once in three months 8%), while 30% of respondents don’t buy organic food. This ratio of the obtained answers is surely not satisfying, but is relatively encouraging since the organic food market in our country is still in inception, so as such it bears a serious of negative epithets: small, underdeveloped, poorly supplied, with poor range of products and high cost price. If we cross the obtained answers with the age structure of respondents, we notice that there is no significant correlation link. It means that the respondents from different age categories don’t have the defined frequency in purchasing organic food. In the group of respondents who buy the organic products the most are surely those with the highest income (over 60,000 RSD) or 29.50%, the respondents with income up to 60,000 RSD (27.50%), then the respondents up to 40,000 RSD (11%) and only 2% of respondents with incomes up to 20,000 RSD. From everything previously stated, we can conclude that the demand for organic products substantially depends on the amount of monthly incomes and the increase of demand can be expected with the growth of standard of living. But also all population categories need to buy food manufactured by the organic principles.

992 EP 2017 (64) 3 (987-1001)
Goran Maksimović, Božidar Milošević, Radomir Jovanović
Chart 3. Purchase of organic products (%). Chart 4: Frequency of the organic products purchase (%)
Source: Authors’s research Source: Authors’s research
As the answer to the question where the organic products should sell, there were respondents who made the combination of two and more answers and the answers were relatively homogenous: supermarkets were in the first place with 21.5%, green markets 21%, small shops in the vicinity 20.5%, and in the fourth place were directly from manufacturers 16%, in some other way 11% of respondents, and in health food stores 10% of respondents.In the structure of total sale of organic agro-food products in the European Union, the highest share in supply (at the level of 31%)hasthegeneral type retail chains. The following sales channels are markets with the share of 22%, and there is also significant the share of specialized health food stores (18%). In the European Union, the consumers of agro-food products (14%) buy them directly from manufacturers, while 15% of organic food is sold via some other sales channels (Vlahović, Puškarić, 2013).
Chart 4. Place of the organic food supply
Source: Authors’s research
With the following question in the survey “What would affect your decision to buy organic food?”, we discovered the main motives to purchase the organic products. In the first place was the answer that the organic products were healthier for diet (50%); 38.5% of respondents were stated that quality was the most important. Only 4.5% of
993EP 2017 (64) 3 (987-1001)
RESEARCH OF CONSUMERS’ ATTITUDES ON THE ORGANIC FOOD CONSUMPTION IN THE SERBIAN ENCLAVES IN KOSOVO
respondents replied that trends in the world are the reason to purchase the organic products, and 4.5% of respondents consider some other motives (curiosity, higher nutritional value, and nutritional supplements) are decisive for purchasing the organic food, while only 2.5% of respondents considers the environment preservation as a crucial factor for making decision on buying the organic food.Series of consumers’ research in the world have discovered that health was the primary motive to buy the organic food, while others, less important factors of motivation referring to the same food category were curiosity, the desire to help in the preservation of the environment, additional nutrition (nutritional supplements/higher nutritional value) and taste (Chakrabarti, Baisya, 2007). According to the research of Chambers and associates (2008), they were discovered that health is an important factor of which depended the total food consumption, especially concerning older people when they opt for a daily diet, while on the other side, they quoted a price as the possible obstacle for purchasing healthy food. Similar to that, according to the obtained results in pan-European research, Lappalainen and his associates (1997) stated the lack of time and price of food as some of the main obstacles for healthy nutrition.
Regarding the asked question on the structure of (potential) purchase of organic products, the authors of the paper and survey discovered which products are most purchased or should be purchased in the field of organic food by the respondents. Several answers were given to this question, so there were the respondents who buy or would buy more than one product. The most of respondents (60.5%) were answered that they would buy all organic products (vegetables, fruits, meat, eggs and milk) according to their purchasing power; 16.5% of respondents would preferably buy organic vegetables; 12% of respondents buy or would buy only organic fruits. Meat, as an organic product, would buy or buy 5.5% of respondents, while only 3% of respondents were interested in purchasing the organic eggs, and 2.5% of respondents were interested in purchasing the organic milk. If we compare these results with foreign researches, the survey analysis (Briz and Al-Hajj, 2004) was shown that Spanish consumers mostly purchase fresh fruits and vegetables (77%). At the same time, the research results of Eves and associates (2004) in Great Britain pointed out that the biggest demand was for fresh vegetables (40%). The issue of domestic organic food market supply was raised in order to perceive the attitudes of the survey participants on the domestic market supply with organic products. Most of respondents (68.5%) consider that the supply of the market is neither sufficient nor good, and 27.5% of respondents consider it sufficient for our conditions, and only 4% think that the market supply with organic products is completely satisfying. The results of previous studies are similar to the survey results. In the survey was raised an issue on the reasons for not consuming the organic products, aiming to recognize the reasons for not buying and not consuming the organic products. All respondents (those who purchase and don’t purchase the organic products) answered this question; the most of respondents (38%) answered that they buy the organic food but not as much as they would like to, for which they mentioned the next reasons: high prices, poor purchasing power and poor supply. Insufficient
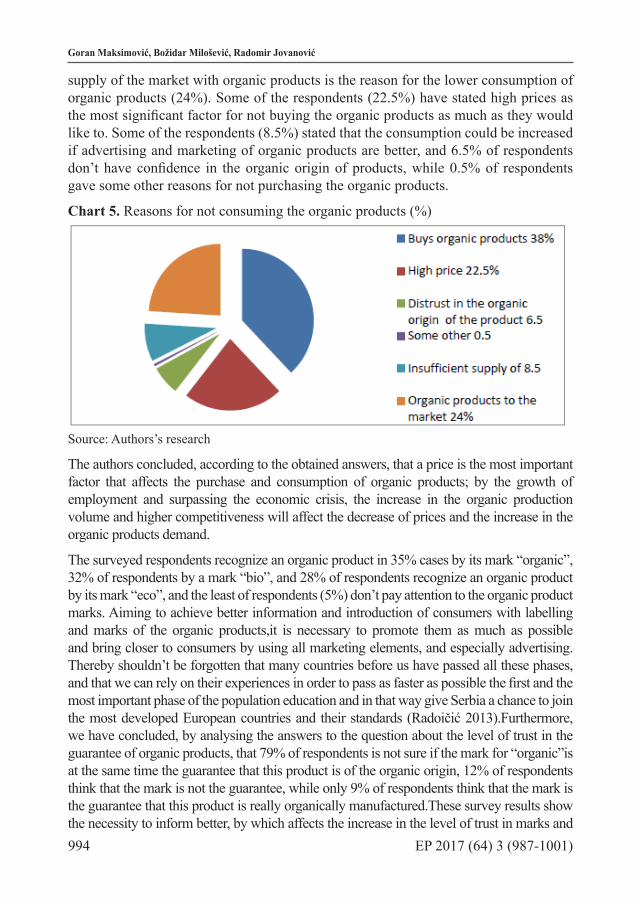
994 EP 2017 (64) 3 (987-1001)
Goran Maksimović, Božidar Milošević, Radomir Jovanović
supply of the market with organic products is the reason for the lower consumption of organic products (24%). Some of the respondents (22.5%) have stated high prices as the most significant factor for not buying the organic products as much as they would like to. Some of the respondents (8.5%) stated that the consumption could be increased if advertising and marketing of organic products are better, and 6.5% of respondents don’t have confidence in the organic origin of products, while 0.5% of respondents gave some other reasons for not purchasing the organic products.
Chart 5. Reasons for not consuming the organic products (%)
Source: Authors’s research
The authors concluded, according to the obtained answers, that a price is the most important factor that affects the purchase and consumption of organic products; by the growth of employment and surpassing the economic crisis, the increase in the organic production volume and higher competitiveness will affect the decrease of prices and the increase in the organic products demand.
The surveyed respondents recognize an organic product in 35% cases by its mark “organic”, 32% of respondents by a mark “bio”, and 28% of respondents recognize an organic product by its mark “eco”, and the least of respondents (5%) don’t pay attention to the organic product marks. Aiming to achieve better information and introduction of consumers with labelling and marks of the organic products,it is necessary to promote them as much as possible and bring closer to consumers by using all marketing elements, and especially advertising. Thereby shouldn’t be forgotten that many countries before us have passed all these phases, and that we can rely on their experiences in order to pass as faster as possible the first and the most important phase of the population education and in that way give Serbia a chance to join the most developed European countries and their standards (Radoičić 2013).Furthermore, we have concluded, by analysing the answers to the question about the level of trust in the guarantee of organic products, that 79% of respondents is not sure if the mark for “organic”is at the same time the guarantee that this product is of the organic origin, 12% of respondents think that the mark is not the guarantee, while only 9% of respondents think that the mark is the guarantee that this product is really organically manufactured.These survey results show the necessity to inform better, by which affects the increase in the level of trust in marks and

995EP 2017 (64) 3 (987-1001)
RESEARCH OF CONSUMERS’ ATTITUDES ON THE ORGANIC FOOD CONSUMPTION IN THE SERBIAN ENCLAVES IN KOSOVO
labels, as the guarantee of organic origin.
Aerset and associates (2004) proved that the distrust in the organic production certificate is common in many countries and it had the negative effects in the organic production. According to the research results of Kovacic and associates (2009) related to Zagreb, only 29% of respondents trusted eco-labels, while 26% of respondents didn’t trust them. Significant number of respondents (30%) trusts only the specific labels, but they don’t know exactly to which ones they trust. This is surely greater trust in regard to the survey carried out in the Serbian enclaves in Kosovo and Metohija.
To the question – on what basis you decide which food is manufactured in a healthy-safe way – 46% of respondents answered that it was according to an appropriate mark on a product, 35% answered that it was according to visual experience or taste, 16% of respondents answered that it was according to the manufacturer’s claim, and only 3% of respondents answered – in some other way (purchase from the established manufacturer, recommendation, geographical origin, etc.).The idea that the state should regulate by law the standardized labelling, which guarantees the organic products origin was most widely differentiated by analysing the obtained answers (94.5%). One percentage of respondents thinks that it is not necessary, while 4.5% of surveyed respondents have no opinion on this.
Organic products are the products manufactured in a strictly controlled production method, legally regulated and called the organic production. The organic products on the market are recognized by a legally regulated mark. Consumers, by purchasing the products with the “organic”mark, can be sure that at least 95% of this product is of the organic origin, and that a product complies with regulations of the inspection, that it is packed in a biodegradable packaging, code and body that carried out the inspection. The certified organic product must be labelled by the mark “organic product”(Vlahovic and associates, 2011). The answers show that the state should more seriously be involved in legal regulations regarding the guarantee of organic products origin. State institutions are the carrier of trust and the only serious guarantor of food’s organic origin. In every moment, the consumer has to be sure that only products of authorised manufacturers are on the market, and these products are under constant supervision of the authorised institutions, which check the quality that is completely harmonized with the international standards.
The first law on the organic production in our country was passed in 2000, and the second was passed in 2006, while the third law on the organic production was come into effect on 1st January 2011, and was adopted by the Serbian Parliament on 5th May 2010 (Official Gazette no. 30/2010). This law and by-laws regulate in detail all issues regarding the organic production methods, control and certification, processing, storing, transport, turnover and labelling the organic products.
Respecting the standard and legally regulated conditions of production, processing, storing, turnover, labelling of organic products etc. isunder the expert supervision of the state administration authorities. The organic product control system in Serbia has been established in the tradition of the control system that is regulated by EU regulations, i.e. the EC Council Regulation no. 834/2007 and the Commission Regulation (EC) no. 889/2008.

996 EP 2017 (64) 3 (987-1001)
Goran Maksimović, Božidar Milošević, Radomir Jovanović
The law aims to:- Get products with confirmed manufacturing procedure,- Sustainable socio-economic rural development,- Consumer protection, putting a label that clearly indicates the way and methods for obtaining organic products,- Protection of natural resources from pollution,- Long-term preservation and increase in soil fertility,- Preservation of biodiversity etc.
The question about the organic products flavour was put in the form of a multiple answer. The aim was to perceive the consumers’ attitudes on the organic products flavour. The survey showed that the respondents’ opinions divided and 52.5% of respondents have no attitude on whether the organic products were tastierin regard to the conventional ones. If 30% of the surveyed respondents have declared themselves as those who don’t buy organic products, then it is understandable a high percentage of the survey participants who don’t have any attitude on this. Studies that were carried out related to the organic and conventional food comparison were based on three essential fields: nutritional value, sensory quality and food safety. According to Boum and Prescott (2002), there are no strong evidences that the organic and conventional food differs in concentration of different nutrients, except in the content of nitrates. According to these same authors, the research that points out to the existence of differences between the organic and conventional fruits and vegetables is inconsistent. Numerous authors who were engaged with this issue (Williams 2002, Magkos and associates, 2006, Brandt and Molgaard, 2001) concluded that there were no sufficient evidences on the higher share of nutrients in the organic manufactured food in regard to the traditionally manufactured food.
On the following question, whether they buy or are ready to buy the organic products, 83.5% of respondents answered with “yes”or are ready to buy the organic products, and they are aware that these products have an effect on their health, as personally as well as on their family health. They stated the next reasons for the quality of organic products: higher nutritional value, more minerals, vitamins and other useful ingredients. Only 16.5% of respondents gave a negative answer to this question, and give as the most common reasons: high price of organic products, current financial situation, distrust habits, insufficient information, etc. Around 70% of respondents gave a positive answer to the question if they are willing to pay more for the product that is surely of the organic origin. At the same time, 15% of respondents are not ready to pay more, and 15% of respondents are not sure if they are ready to pay more for the organic products. According to the previous research of this problem, Vlahovic and associates (2010) concluded that 55% of respondents are ready to pay a higher price to the organic products, and 23% of them are not ready to pay a higher price. 22% of respondents are not sure if they are willing to pay more (don’t have a clear view on this issue). In the conducted survey, we can notice the increase in a number of respondents who are willing to pay a higher price for these products in regard to the mentioned previous research. According
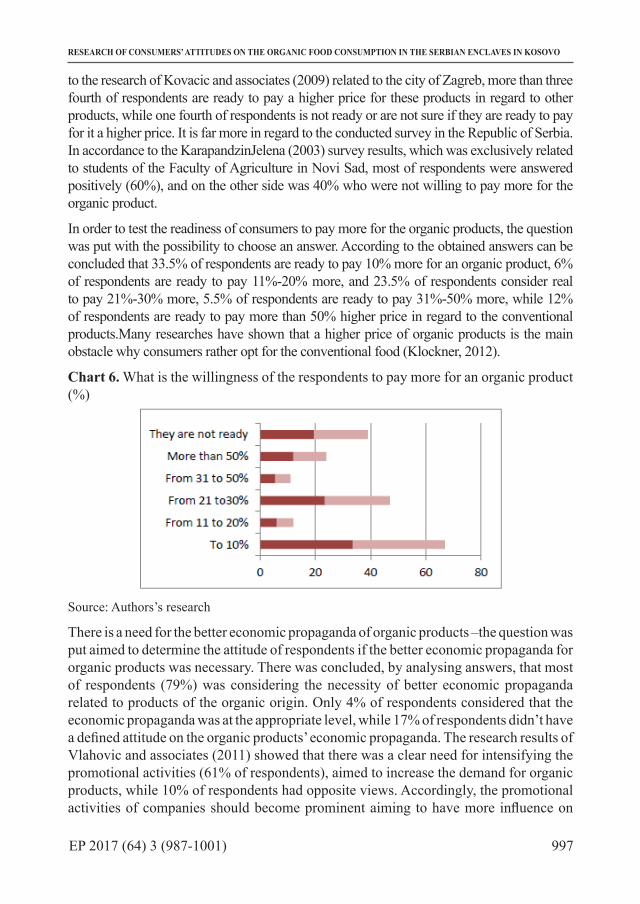
997EP 2017 (64) 3 (987-1001)
RESEARCH OF CONSUMERS’ ATTITUDES ON THE ORGANIC FOOD CONSUMPTION IN THE SERBIAN ENCLAVES IN KOSOVO
to the research of Kovacic and associates (2009) related to the city of Zagreb, more than three fourth of respondents are ready to pay a higher price for these products in regard to other products, while one fourth of respondents is not ready or are not sure if they are ready to pay for it a higher price. It is far more in regard to the conducted survey in the Republic of Serbia. In accordance to the KarapandzinJelena (2003) survey results, which was exclusively related to students of the Faculty of Agriculture in Novi Sad, most of respondents were answered positively (60%), and on the other side was 40% who were not willing to pay more for the organic product.
In order to test the readiness of consumers to pay more for the organic products, the question was put with the possibility to choose an answer. According to the obtained answers can be concluded that 33.5% of respondents are ready to pay 10% more for an organic product, 6% of respondents are ready to pay 11%-20% more, and 23.5% of respondents consider real to pay 21%-30% more, 5.5% of respondents are ready to pay 31%-50% more, while 12% of respondents are ready to pay more than 50% higher price in regard to the conventional products.Many researches have shown that a higher price of organic products is the main obstacle why consumers rather opt for the conventional food (Klockner, 2012).
Chart 6. What is the willingness of the respondents to pay more for an organic product (%)
Source: Authors’s research
There is a need for the better economic propaganda of organic products –the question was put aimed to determine the attitude of respondents if the better economic propaganda for organic products was necessary. There was concluded, by analysing answers, that most of respondents (79%) was considering the necessity of better economic propaganda related to products of the organic origin. Only 4% of respondents considered that the economic propaganda was at the appropriate level, while 17% of respondents didn’t have a defined attitude on the organic products’ economic propaganda. The research results of Vlahovic and associates (2011) showed that there was a clear need for intensifying the promotional activities (61% of respondents), aimed to increase the demand for organic products, while 10% of respondents had opposite views. Accordingly, the promotional activities of companies should become prominent aiming to have more influence on

998 EP 2017 (64) 3 (987-1001)
Goran Maksimović, Božidar Milošević, Radomir Jovanović
the decision of purchasers. When it comes to the most adequate way of informing the potential consumers on organic products, the respondents were mostly (79%) took side of the media propaganda via television, social networks, etc. Promotion at the point of sale is of the highest importance for 17% of respondents, and various catalogues and booklets for 4% of respondents. The answers to this question should specify in which direction the promotional activities should be drafted, i.e. should point out to the best and the most efficient media and instrument in the promotional activities.
The last question in the survey was put if the organic production is important for the environment protection and that is why organic products should be bought and consumed, none of respondents answered that they absolutely disagreed, 4% of respondents disagreed, and 31% of the survey respondents agreed partially. 35.5% of respondents agreed, and 29.5% of respondents agreed completely that the organic production was important for the environment protection. Whether the organic agricultural products are significant for the consumers’ health, we did obtain the following answers: 3% of respondents didn’t agree, 21.5% of respondents did agree partially, 34% did agree, and 41.5% of respondents did agree completely that organic agricultural products were important for the consumers’ health, so this was the reason for their consumption.
In accordance to Hallam (2002) research, the motives for purchasing the organic agriculture products in Great Britain were:improvement of personal health (36%), better taste (31%), “natural”origin of food (25%), avoiding genetic modifications (12%) and the environmental protection (5% of respondents). According to Vlahovic and Puskaric (2013), numerous studies were engaged in comparing nutrition and health values of organic and conventional food. Some studies show that food manufactured organically doesn’t have a higher nutritional value than the conventional one, while other studies show that organic food is superior, especially in respect of a greater content of antioxidants.
Conclusion
There can be concluded the following based on the obtained research results, and based on the survey on the consumption of organic agriculture products:
All 100% of the respondents have heard about the organic food term, while 70% of them have purchased organic products (23.5% once a week, 23.5% of respondents always buy a specific type of organic products, 15% of respondents buy it once a month and 8% of respondents buy it once in three months). The most common reasons for buying the organic products, for 50% of the respondents were that the organic products are healthier for diet in regard to the conventional products, 38.5% of the respondents were stated as the reason the better quality of organic products. The most of the respondents purchase all organic products depending of needs (60.5%), only vegetables 16.5% and fruits 12%. The supply of markets with organic products is not sufficient, as 68.5% of the respondents stated, while 90.5% of the respondents stated that population in Serbian enclaves is not sufficiently informed on the significance of food manufactured in the
999EP 2017 (64) 3 (987-1001)
RESEARCH OF CONSUMERS’ ATTITUDES ON THE ORGANIC FOOD CONSUMPTION IN THE SERBIAN ENCLAVES IN KOSOVO
organic production system. There is inevitable more significant education of consumers regarding the organic production in order to be better informed and to increase demand. The most of the respondents (79%) do not have confidence in labelling of organic food, and that they really guarantee the organic origin of these products, while 94.5% of the respondents think that a state should legally regulate standardized labelling, which guarantees the organic products origin.
Only 70% of the respondents are ready to pay higher price for organic products. The most of the respondents (33.5%) is ready to pay 10% more for organic products, 29.5% of respondents are ready to pay 10-30% more money for purchasing organic products, while 17.5% of respondents are ready to pay more than 30% for them. 75.5% of respondents agreed that food manufactured in organic way is very important for consumers’ health and therefore it should be purchased and consumed.This seems very encouraging, because consumers care about their health, and this should also motivate the organic food manufacturers to increase volume and range of their products. The amount of income significantly limits the readiness of respondents to set aside more money for purchasing the organic agricultural products.
The most of the respondents purchase organic food in super markets (21.5%), green markets (21%), small shops in the vicinity (20.5%), in health food stores (10%), directly from the manufacturer (16%), and in some other way (11%). Retail chains of general type have the highest share in supply (31%) in the structure of total sale of organic agricultural-food products in the European Union. In the USA, one third of consumers purchase in specialized health food stores. Our survey shows an evident decrease in the significance of specialized stores of so called organic food.
Results show under developed awareness of consumers on organic food. The organic food market is still very modest. It is necessary to enlarge the range of products in the organic production and food industry, and have continuous supply and develop an adequate marketing. It is possible to raise consumption at the higher level by good information and education of consumers.
Literature1. Aarset, B., Beckmann, S., Bigne, E., Beveridge, M., Bjorndal, T., Bunting, J., McDonagh, P., Mariojouls, C., Muir, J., Prothero, A., Reisch, L., Smith, A., Tveteras, R., Young, J. (2004): The European consumers“ understanding and perceptions of the „organic“ food regime The case of aquaculture“ British Food Journal Vol. 106, No. 2.2. Bourn, D., Prescott, J. (2002): A Comparison of the Nutritional Value, Sensory Qualities, and Food Safety of Orrganically and Conventionally Produced Foods.Critical Reviews in Food Science and Nutrition Vol.42 I.1.3. Brandt, K., Molgaard, P. J. (2001): Organic agriculture: does it enhance or reduce the nutritional value of plant foods?, Journal of the Science of Food and Agriculture Vol. 81, No. 9.4. Briz, T., Al-Hajj, M. (2004.): Consumer“s attitude regarding organic products:
1000 EP 2017 (64) 3 (987-1001)
Goran Maksimović, Božidar Milošević, Radomir Jovanović
Marketing Trends for Organic Food in the 21 st Century, Series on Computers, and Operations Research, Vol.3, World Scientifi c Publishing Co.,Pte. Ltd.5. Chakrabarti, S., Baisya, R.K, (2007): Purchase Motivations and Attitudes of Organic Food Buyers, Decision, Vol. 34, No. 1.6. Chambers, S., Lobb, A., Butler L.T., Traill, B.W. (2008): The influence of age and gender on food choice: a focus group exploration, International Journal of Consumer Studies, Vol.32, No.4.7. Eves, A., Lumbers, M., Morgan, J. (2004): Factors influencing consumption of organic food, Marketing Trends for Organic Food in the 21st Century, Series on Computers and Operations Research, Vol.3, World Scientific Publishing Co., Pte. Ltd.8. Golijan, J., Popović, A. (2016): Basic characteristics of the organic agriculture market, Fifth International Conference Competitiveness Of Agro-Food And Environmental Economy, Bucharest.9. Hallam, D. (2002): The organic market on EOCD Countries: Past Growth, current status and Future Potential, OECD Workshop on Organic Agriculture, Washington D.C., USA10. Klockner, A. C. (2012): Should I Buy Organic Food? A Psychological Perspective on Purchase Decisions Organic Food and Agriculture,Nwe Trends and Developments in the Social Sciences.11. Kovačić, D.,Mesić, Ž., Pavićević, A. (2009.): Analiza potražnje ekoloških proizvoda na zagrebačkom tržištu, available at: http://s-a.agr.hr/pdf/2009/sa2009_p0218.pdf12. Lappalainem, R., Saba, A., Holm, L., Mykkanen, H., Gibney, M.J., Moles, A. (1997): Difficulties in Trying to Eat Healthier: descriptive analysis of perceived barriers for healthy eating, European Journal of Clinical Nutrition, Vol. 51 (Suppl.2).13. Meredith, S.,Willer, H. (2016):Organic in Europe-prospects and developments.14. Ministarstvo poljoprivrede i zaštite životne sredine, 2016. http://www.dnrl.minpolj.gov.rs/ accessed on: 05.08.2016.15. Radojičić, A. (2013.): Istraživanje stavova potrošača o potrošnji organske hrane u Srbiji, magistraska teza, Poljoprivredni fakultet, Novi Sad.16. Renko, S., Bošnjak, K., (2009): Aktuelno stanje i perspektive budućeg razvoja tržišta ekološke hrane u Hrvatskoj, Ekonomski pregled, Vol. 60,No. 7-8, Zagreb.17. Vehapi, S. (2015):Istraživanje motiva potrošača koji utiču na kupovinu organske hrane u Srbiji, Ekonomske teme, Vol. 53, No. 1, pp. 105-121.18. Vlahović B., Radojević, V., Živanić, I., (2011): Istraživanje stavova potrošača o potrošnji organske hrane u Srbiji, Ekonomika poljoprivrede, Vol. 58, No. 3.19. Vlahović, B., Puškarić, A. (2013): Organska poljoprivreda - šansa za agrobiznis, Grad Novi Sad, uprava za privredu Novi Sad.20. Vlahović B., Tomić, D., Popović, V. (2010): Stanje i perspektive potrošnje proizvoda organske poljoprivrede, Zbornik radova, Četvrti forum o organskoj proizvodnji, Selenča.21. Willer, H., Lernoud, J. (Eds) (2016): The World of Organic Agriculture. Statistics and Emerging Trends 2016, Research Institute of Organic Agriculture (FIBL), Frick, and IFOAM Organics International, Bonn.

1001EP 2017 (64) 3 (987-1001)
RESEARCH OF CONSUMERS’ ATTITUDES ON THE ORGANIC FOOD CONSUMPTION IN THE SERBIAN ENCLAVES IN KOSOVO
22. Williams, M.C.(2002): Nutritional quality of organic food: shades of grey or shades of green?, Proceedings of the Nutrition Society, Vol. 61.23. Zakon o organskoj proizvodnji 2010 (Službeni glasnik RS broj 30-10) „Pravilnik o kontroli i sertifikaciji u organskoj proizvidnji i metodama organske proizvodnje“ Ministarstvo poljoprivrede, trgovine, šumarstva i vodoprivrede, Službeni glasnik Republike Srbije, no. 48-11
ISTRAŽIVANJE STAVOVA POTROŠAČA O ORGANSKOJ HRANI U SRPSKIM ENKLAVAMA NA KOSOVU
Goran Maksimović4, Božidar Milošević5, Radomir Jovanović6
Rezime
Organska proizvodnja u srpskim enklavama na Kosovu ima veliki potencijal na osnovu ekstenzivne proizvodnje većim delom u brdskoplaninskim predelima sa bogatim i prikladnim ambijntom za organsku proizvodnju lekovitog bilja, voća, vina,meda itd, ali je još uvek u ranoj fazi razvoja. Proizvodnjom i plasiranjem organskih proizvoda na lokalnim tržištima enklava može se ostvariti višak prihoda a time i ekonomska osnova za održiv razvoj mulifunkcionalnih poljoprivrednih gazdinstava u srpskim enklavama. U radu autori istražuju stavove potrošača o kupovini i potrošnji organske hrane na Kosovu. Empirisko istraživanje je vršeno na prostom uzorku od 300 ispitanika tehnikom ličnog komuniciranja uz primenu anketnog upitnika kao instrumenta metode ispitivanja. Područje ispitivanja su gradovi: Severna Kosovska Mitrovica, Leposavić, Zubin Potok i Gračanica. Cilj istraživanja jeste da se na bazi definisane ankete sagledaju osnovna obeležja potražnje i potrošnje organskih poljoprivrednih i prehranbenih proizvoda da se dođe do saznanja o preferencijama, motivima, stavovima potrošača za kupovinu organsih proizvoda. Nakon analize urađene ankete došli smo do saznanja da tržište organske hrane u srpskim enklavama na Kosovu još uvek nije u dovoljnoj meri razvijeno. Neophodno je proširiti asortiman proizvoda organske poljoprivrede i neophodna je kontinuirana ponuda, veći marketing i bolja informisanost i edukacija potrošača da bi se potroš nja podigla na viši nivo.
Ključne reči: organska poljoprivreda, potrošnja organske hrane.
4 Vanredni profesor, dr Goran Maksimović, Univerzitet u Prištini, Poljoprivredni fakultet, Kopaonička ulica bb, 38219 Lešak, Srbija, Telefon: +381 63 419 757, E-mail: [email protected]
5 Redovni profesor, dr Božidar Milošević, Univerzitet u Prištini, Poljoprivredni fakultet, Kopaonička ulica bb, 38219 Lešak, Srbija, Telefon: +381 64 150 5273, E-mail: [email protected]
6 Dr Radomir Jovanović, Univerzitet u Prištini, Poljoprivredni fakultet, Kopaonička ulica bb, 38219 Lešak, Srbija, Telefon: +381 65 561 3940, E-mail: [email protected]


1003
Original scientific paper Economics of Agriculture 3/2017UDC: 636.4.083
EP 2017 (64) 3 (1003-1018)
OPTIMAL FLOCK STRUCTURE OF PIG FARM PROVIDING MINIMUM COSTS
OPTIMAL FLOCK STRUCTURE OF PIG FARM PROVIDING MINIMUM COSTS
Ivan Mičić1, Zoran Rajić2, Jelena Živković3, Dragan Orović4, Marko Mičić5,
Ivana Mičić6, Marija Mičić7
Abstract
The study deals with the analysis of production costs, as well as the net area in the production of the herd of organizational structures at the pig farm. The question arises of the optimum production structure in the cooperative household, which is mainly oriented to the production of Pigmeat. In this paper, a concrete model of linear programming for the optimal organizational structure of the herd of pig farms of the net effective area was defined. The research covered the cooperative farm “1.Decembr” in Žitorađa in Toplički district. For 2013, the production technology of agricultural animals was followed, and economic results were analyzed. In the observed period of one year. It was found that there were 28,252 throats on the farm. Total agricultural growth in 2013 amounted to 664,920 kg, in the amount of 781,569.7 €. Total death: piglets on wolves 6,315 throats, stuffed pigs 3,425 throats, 17,150 kg, tooth 928 throats, 40,980 kg, pigs 67 throats 13,930 kg, immature 3 throat 890 kg
Key words: crop rotation, surface area by throat, increment, death, minimum costs
JEL: Q12, Q13
1 Ivan Mičić M.A., Ph.D. student, University in Belgrade, Faculty of Agriculture, Nemanjina street no. 6, 11080 Zemun, Serbia, Phone: +381 11 261 53 15, E-mail: [email protected]
2 Zoran Rajić Ph.D., Full Professor, University in Belgrade, Faculty of Agriculture, Nemanjina street no. 6, 11080 Zemun, Serbia, Phone: +381 11 261 53 15, E-mail:[email protected]
3 Jelena Živković M.A., University in Belgrade, Faculty of Agriculture, Nemanjina street no. 6, 11080 Zemun, Serbia, Phone: +381 63 878 82 51, E-mail:[email protected]
4 Dragan Orović M.A., Ph.D. student, University in Belgrade, Faculty of Agriculture, Nemanjina street no. 6, 11080 Zemun, Serbia, Phone: +381 69870 25 20, E-mail: [email protected]
5 Marko Mičić, graduate economist, University of Niš, Faculty of Economics, Trg Kralja Aleksandra Ujedinitelja no. 11, Niš, Serbia, Phone: +381 63 680 040, E-mail: [email protected]
6 Ivana Mičić M.A, Ph.D. student, University of Niš, Faculty of Economics, Trg Kralja Aleksandra Ujedinitelja no. 11 Niš, Serbia, Phone: +381 63 233 603, E-mail: [email protected]
7 Marija Mičić M.A, Ph.D. student, University of Niš, Faculty of Technology in Leskovac, Bulevar Oslobođenja no. 124, Leskovac, Serbia, Phone: +381 62 867 45 98, E-mail: [email protected]

1004 EP 2017 (64) 3 (1003-1018)
Ivan Mičić, Zoran Rajić, Jelena Živković, Dragan Orović, Marko Mičić, Ivana Mičić, Marija Mičić
Introduction
Regardless of the market-oriented pig production, it is very difficult to provide a detailed insight into the poultry farm’s turnover in pig production, which is the basis of the research in the work and proving its net effective surface area of the main structure in the production process. (Andrić, 1998; Mičić et al., 2016a) find that with the increase in the number of deciduous piglets by sows from 10 to 20 heads of pigs, the price of piglet is reduced by 79.09%, while the costs of sows increase by 11.67% per year. (Džinić et al., 2003; Petrovic et al., 2010; Mičić, 2014) states that the improvement of the genetic basis of pigs is an indispensable prerequisite for achieving the highest intensity in this branch of livestock production.(Petrovićet al., 2010; Vidovic et al.,2012) state that the annual genetic progress for daily gain was 8-11 g, for food conversion between 0.03 and 0.05 kg, as well as 0.35 - 1.00% for meat content in Hemispheres. (Tomović et al., 2005; Mičić et al., 2016b) find that in the foreseeable future, on the basis of previous research and results in practice, there are opinions that the production of freight can be expected to have much better results as well: The framework organizational structure should move within the following limits : Piglets 20-25%, breeding fowls 5-8%, fattening pigs 70-80%, sows 4-8% and non-fennel 0,3-5%.(Radovic, 2002;Rajić, 2003; Mičić et al., 2016b) state that the next space is planned for an individual of certain categories:piglets on cheese 0,4 m2, breeding pig 0,7 m2, pig fodder 1,2 m2, sowers 1,5 m2 and nests 1,8 m2. The costs of certain categories of holding are as follows: for a pig 700 dinars, piglets for breeding (breeding subspecies) 1,800 dinars, pig meat 3,500 dinars, sowers 5,000 dinars and non-salty 4,000 dinars. The same author states that “The specificity of livestock production is conditioned by the fact that in addition to the final line of livestock production (“ final categories “), there are several other categories. There are two possible variants in defining livestock variables. The first implies that each category of livestock represents a separate activity and is expressed by a physical or conditional number of throats, While the second variant predicts that in the model only the final category of a particular livestock is figured, and that the necessary inputs and predicted outputs of the accompanying categories cumulatively point out through the final category. (Živković, Perunović, 2012; Petrovic et al., 2013; Zekić et al., 2013; Mičić et al., 2016a) They conclude that studies related to the economic parameters of pig production are related to costs in the first stage of the production process and the determination of the total costs of individual categories of pigs they hold using the optimal organizational structure of rotation of crops on the farm, which provides minimal costs.
The aim of the research
In proofing and research, a scientific method was first used, whose application allows to explain and predict the relationship between certain relevant inputs and the results of the achieved effects in the production of pigs. In accordance with the strategy of developing the production of fatteners, the aim of the research is to increase the quality of production in pig breeding with the highest number of analyzed and realized

1005EP 2017 (64) 3 (1003-1018)
OPTIMAL FLOCK STRUCTURE OF PIG FARM PROVIDING MINIMUM COSTS
economic parameters, originating from noble pure breeds, which are grown on farms in Serbia. When creating this work, data from multiple sources was used. These are the quantities of production, analysis of pig production for a longer period of time. The analysis of such data alone would not be possible if it was not approved by the farm, and the data were further processed by math-statistical methods.
Material and methods
The research covered the cooperative agricultural farm “1 December” in Žitorađa. The said farm has a closed production cycle that includes the production of fattening pigs. The farm produced 28,829 piglets in 2013. In 2013, 75 persons with appropriate qualifications were employed in the farm. Costs in the production of farm animals on the farm are based on natural indicators determined on the basis of the investigations carried out in 2013. Costs are covered on the basis of the norms of the required space and equipment, approach to the estimation of depreciation costs, on the basis of which the categories of fixed costs are calculated. When determining the surface of a pig, it starts from an independent variable. For conclusions, farm production parameters, costs, increment, total increase and mortality were monitored. The significance of the results of the research in the production of fattening pigs were monitored independently on the farm in 2013.
Results and Discussion
The strategy of pig production, within the scope of research, was analyzed at the farm:- Planting herds on the farm in 2013,- Limitations: Accommodation capacities, organizational structure of herds on the farm,- Criteria Function: Minimum Farm Costs.
In addition to theoretical explanation and application on the general examples, the efficiency of the optimal surface on the case of fattening pigs in 2013 on the farm was also shown. The costs of pig production on the farm are based on natural indicators.
In the cooperative household, the calculation of costs was made in accordance with the production processes. Costs also relate to the process of production, space and equipment that is carried out on the basis of norms.
Plantation of a herd on a pig farm “1.Decenbar “in Zitoradza in 2013For the pig farming on the farm, the price of all products is taken into account. More
information on this is shown in (Tables 1,3,5,7,9 and 11,). The entry status of all categories of pigs for the period from 01.01.to 31.12. 2013.is shown.
Table 2,4,6,8,10 and 12 show the output status of all types of pigs for the period until 31 December 2013.

1006 EP 2017 (64) 3 (1003-1018)
Ivan Mičić, Zoran Rajić, Jelena Živković, Dragan Orović, Marko Mičić, Ivana Mičić, Marija Mičić
Table 1. Input condition
No. categorylivestock
Admission for the period from 01.01. to 31. 12. 2013Balance at the beginningyears Translated all
Who kg from the group Who kg Who kg1 2 3 4 5 7 8 9 101. Prasad Pigs 71322. suckling from breeding sows 6573. Boars from breeding boars 44. pigs 7.132 from weaning piglets 27649 35442
Source: Authors’ calculation based on data from Mičić, 2013
Table 2. Output status
Output for the period until 31 12 2013
Translated slaughtered died Sold Balance at end of year all Growth
in kg23-15a group Who kg Who kg Who kg Who kg kg
14 15 16 17 18 19 20 21 22 23 24prefattening
extracted sows 186 36720 475 107634
fatling 6983 195080 982 40980 18570 1960320 7568internal realization 682 68200
pigs 35442 2354934 3019854 664920
Source: Authors’ calculation based on data from Mičić, 2013
Table 3. Input condition
No.categorylivestock
Admission for the period from 01.01. to 31. 12. 2013Balance at the beginningyears Amount Translated all
Who kg Rsd from the group Who kg Who kg
1 2 3 4 5 6 7 8 9 101. Prasad suckling pigs2. pigs1.1.13. 2858 8574 1243230 Prasad3. Oprihodovano 37642 40500 8574
In total 40500 8574 1243230
Source: Authors’ calculation based on data from Mičić, 2013

1007EP 2017 (64) 3 (1003-1018)
OPTIMAL FLOCK STRUCTURE OF PIG FARM PROVIDING MINIMUM COSTS
Table 4. Output statusOutput for the period until 31 12 2013
Translated slaughtered Died Sold Balance at end of year all Growth
in kg23-15a group Who kg Who kg Who kg Who kg Who kg rsd
12 13 14 15 16 17 18 19 20 21 22 23 24In weaned
piglets 31308 156540 6315 22698300
pigs 31.12.13 2877 8631 1251495
In total 40500 165171 23949795State 1.1.13 40500 8574 1243230 156597
Growth - 156597 22706565
Source: Authors’ calculation based on data from Mičić, 2013
Table 5. Input condition
No.categorylivestock
Admission for the period from 01.01. to 31. 12. 2013Balance at the beginningyears
Balance at the beginningyears
Who Who Who Who1 2 3 4 5 6 7 8 9 10
weaned piglets pigs
1. pigs 1.1.13. 4371 65565 9506925 Прасад
2. Translated piglets 31308 156540 22698300 35679 222105
3. In total 35679 222105 32205225
Source: Authors’ calculation based on data from Mičić, 2013
Table 6. Output statusOutput for the period until 31 12 2013
Translated slaughtered Died Sold Balance at end of year all Growth
in kg23-15a group Who kg Who kg Who kg Who kg Who kg rsd
12 13 14 15 16 17 18 19 20 21 22 23 24Prasad fattening 27649 552980 3425 17125 80182100pigs 31.12.13 4605 73680 10683600In total 35679 643785 90865700State 1.1.13 35679 222105 32205225 421680Growth - 421680 58660475
Source: Authors’ calculation based on data from Mičić, 2013

1008 EP 2017 (64) 3 (1003-1018)
Ivan Mičić, Zoran Rajić, Jelena Živković, Dragan Orović, Marko Mičić, Ivana Mičić, Marija Mičić
Table 7. Input state
No.CategoryLivestock
Entrance for the period from 01.01.2013StanjenaBeginning years Amount Translated Everything
Who kg Rsd from the group Who kg Who kg
1 2 3 4 5 6 7 8 9 10Breeding gilts Pigs
1. Pigs01.01.2013. 560 73920 10718400
2. Translated from the site 682 68200 9889000 1242 142120
3. In total 1242 142120 20607400
Source: Authors’ calculation based on data from Mičić, 2013
Table 8. Output status
Output for the period until 31 12 2013
Translated Slaughtered Died Sold Balance at the end of the year
EverythingAmount
GrowthIn kg23-13a group Who kg Who kg Who kg Who kg Who kg rsd
12 13 14 15 16 17 18 19 20 21 22 23 24Sows 781 117150 16986750
Pigs 31.12.13 461 58335 8458575
In total 1242 175485 25445325Pigs 01.01.13 1242 142120 20607400 33365
Growth - 33365 4837925
Source: Authors’ calculation based on data from Mičić, 2013
Table 9. Input state
No.CategoryLivestock
Entrance for the period from 01.01.2013Stanjena
Beginning years Amount Translated Everything
Who kg Rsd From the group Who kg Who kg
1 2 3 4 5 6 7 8 9 10Breeding sows Pigs
1. Pigs 01.01.13. 1534 268450 389252502. Translated 781 117150 16986750 2315 3856003. In total 2315 385600 55912000
Source: Authors’ calculation based on data from Mičić, 2013

1009EP 2017 (64) 3 (1003-1018)
OPTIMAL FLOCK STRUCTURE OF PIG FARM PROVIDING MINIMUM COSTS
Table 10. Output statusOutput for the period until 31 12 2013
Translated Slaughtered Died Sold Balance at the end of the year
EverythingAmount
GrowthIn kg23-13a group Who kg Who kg Who kg Who kg Who kg rsd
12 13 14 15 16 17 18 19 20 21 22 23 24
Sows 657 144354 20931330
Sows 67 13930 2019850Pigs 31.12.13 1591 278425 40371625
In total 2315 436709 63322805Pigs 01.01.13 2315 385600 55912000 51109
Growth - 51109 7410805
Source: Authors’ calculation based on data from Mičić, 2013
Table 11.Input state
No. CategoryLivestock
Entrance for the period from 01.01.2013Stanjena
Beginning years
Amount Translated Everything
Who kg Rsd From the group Who kg Who kg
1 2 3 4 5 6 7 8 9 10Breeding nerves Pigs
1. Pigs1.1.13. 35 7770 12432002. Purchased nerves 6 771 253704 41 85413. In total 41 8541 1380354
Source: Authors’ calculation based on data from Mičić, 2013
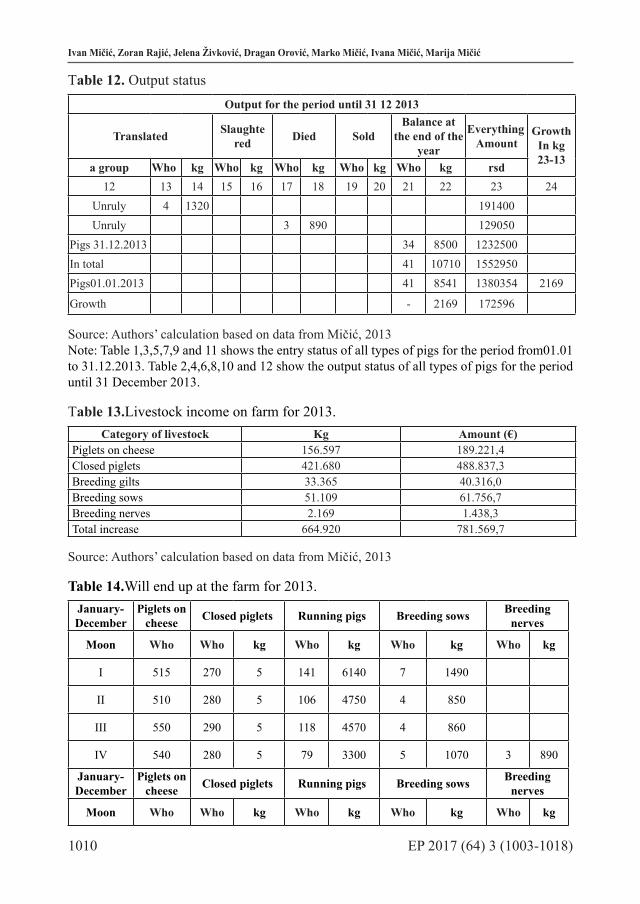
1010 EP 2017 (64) 3 (1003-1018)
Ivan Mičić, Zoran Rajić, Jelena Živković, Dragan Orović, Marko Mičić, Ivana Mičić, Marija Mičić
Тable 12. Output statusOutput for the period until 31 12 2013
Translated Slaughtered Died Sold
Balance at the end of the
year
EverythingAmount
GrowthIn kg23-13a group Who kg Who kg Who kg Who kg Who kg rsd
12 13 14 15 16 17 18 19 20 21 22 23 24Unruly 4 1320 191400Unruly 3 890 129050
Pigs 31.12.2013 34 8500 1232500In total 41 10710 1552950Pigs01.01.2013 41 8541 1380354 2169
Growth - 2169 172596
Source: Authors’ calculation based on data from Mičić, 2013Note: Table 1,3,5,7,9 and 11 shows the entry status of all types of pigs for the period from01.01 to 31.12.2013. Table 2,4,6,8,10 and 12 show the output status of all types of pigs for the period until 31 December 2013.
Тable 13.Livestock income on farm for 2013.Category of livestock Kg Amount (€)
Piglets on cheese 156.597 189.221,4Closed piglets 421.680 488.837,3Breeding gilts 33.365 40.316,0Breeding sows 51.109 61.756,7Breeding nerves 2.169 1.438,3Total increase 664.920 781.569,7
Source: Authors’ calculation based on data from Mičić, 2013
Table 14.Will end up at the farm for 2013.January-December
Piglets on cheese Closed piglets Running pigs Breeding sows Breeding
nerves
Moon Who Who kg Who kg Who kg Who kg
I 515 270 5 141 6140 7 1490
II 510 280 5 106 4750 4 850
III 550 290 5 118 4570 4 860
IV 540 280 5 79 3300 5 1070 3 890
January-December
Piglets on cheese Closed piglets Running pigs Breeding sows Breeding
nerves
Moon Who Who kg Who kg Who kg Who kg
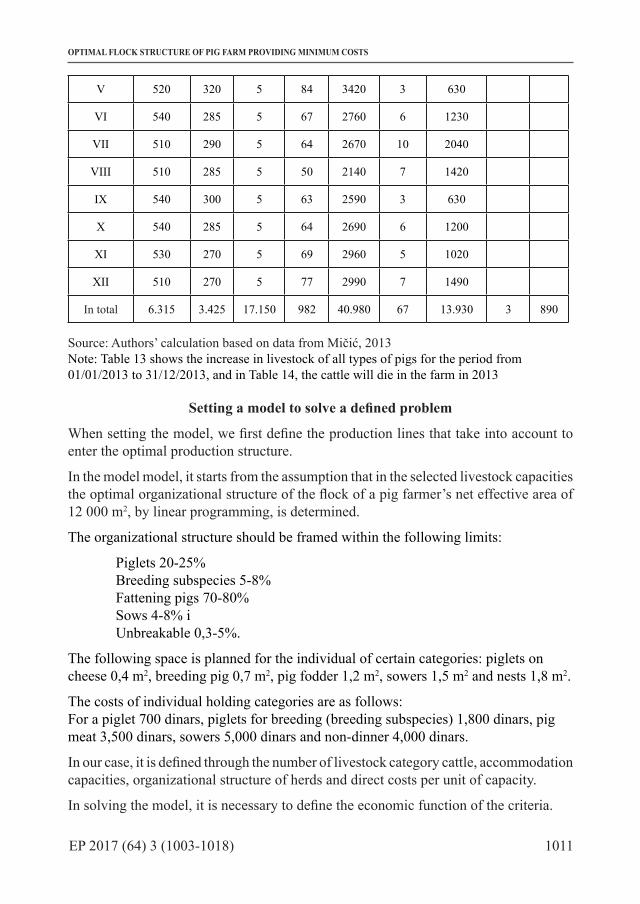
1011EP 2017 (64) 3 (1003-1018)
OPTIMAL FLOCK STRUCTURE OF PIG FARM PROVIDING MINIMUM COSTS
V 520 320 5 84 3420 3 630
VI 540 285 5 67 2760 6 1230
VII 510 290 5 64 2670 10 2040
VIII 510 285 5 50 2140 7 1420
IX 540 300 5 63 2590 3 630
X 540 285 5 64 2690 6 1200
XI 530 270 5 69 2960 5 1020
XII 510 270 5 77 2990 7 1490
In total 6.315 3.425 17.150 982 40.980 67 13.930 3 890
Source: Authors’ calculation based on data from Mičić, 2013Note: Table 13 shows the increase in livestock of all types of pigs for the period from 01/01/2013 to 31/12/2013, and in Table 14, the cattle will die in the farm in 2013
Setting a model to solve a defined problem
When setting the model, we first define the production lines that take into account to enter the optimal production structure.
In the model model, it starts from the assumption that in the selected livestock capacities the optimal organizational structure of the flock of a pig farmer’s net effective area of 12 000 m2, by linear programming, is determined.
The organizational structure should be framed within the following limits:
Piglets 20-25%Breeding subspecies 5-8%Fattening pigs 70-80%Sows 4-8% iUnbreakable 0,3-5%.
The following space is planned for the individual of certain categories: piglets on cheese 0,4 m2, breeding pig 0,7 m2, pig fodder 1,2 m2, sowers 1,5 m2 and nests 1,8 m2.
The costs of individual holding categories are as follows:For a piglet 700 dinars, piglets for breeding (breeding subspecies) 1,800 dinars, pig meat 3,500 dinars, sowers 5,000 dinars and non-dinner 4,000 dinars.
In our case, it is defined through the number of livestock category cattle, accommodation capacities, organizational structure of herds and direct costs per unit of capacity.
In solving the model, it is necessary to define the economic function of the criteria.
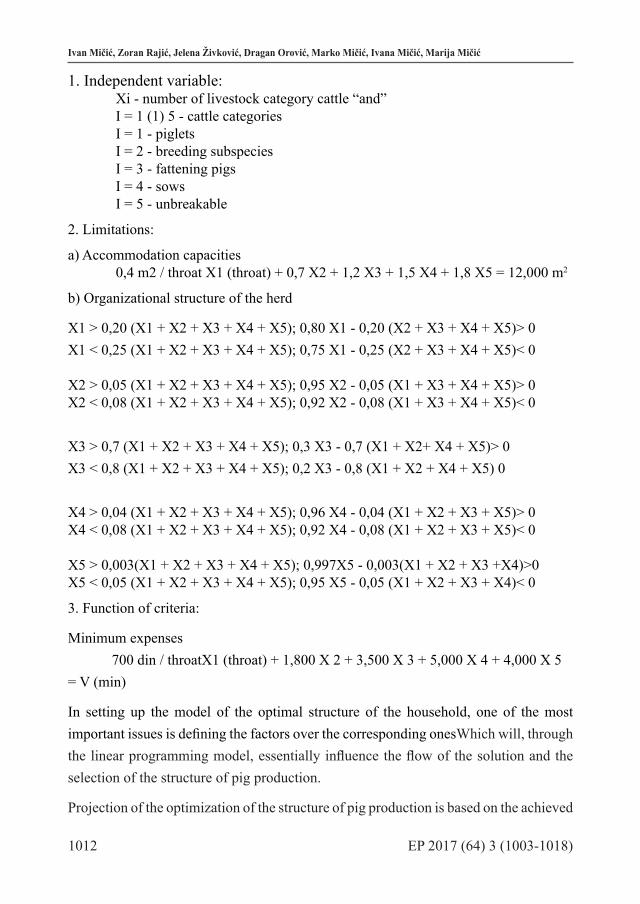
1012 EP 2017 (64) 3 (1003-1018)
Ivan Mičić, Zoran Rajić, Jelena Živković, Dragan Orović, Marko Mičić, Ivana Mičić, Marija Mičić
1. Independent variable:Xi - number of livestock category cattle “and”I = 1 (1) 5 - cattle categoriesI = 1 - pigletsI = 2 - breeding subspeciesI = 3 - fattening pigsI = 4 - sowsI = 5 - unbreakable
2. Limitations:
а) Accommodation capacities0,4 m2 / throat X1 (throat) + 0,7 X2 + 1,2 X3 + 1,5 X4 + 1,8 X5 = 12,000 m2
b) Organizational structure of the herd
X1 > 0,20 (X1 + X2 + X3 + X4 + X5); 0,80 X1 - 0,20 (X2 + X3 + X4 + X5)> 0 X1 < 0,25 (X1 + X2 + X3 + X4 + X5); 0,75 X1 - 0,25 (X2 + X3 + X4 + X5)< 0
X2 > 0,05 (X1 + X2 + X3 + X4 + X5); 0,95 X2 - 0,05 (X1 + X3 + X4 + X5)> 0 X2 < 0,08 (X1 + X2 + X3 + X4 + X5); 0,92 X2 - 0,08 (X1 + X3 + X4 + X5)< 0
X3 > 0,7 (X1 + X2 + X3 + X4 + X5); 0,3 X3 - 0,7 (X1 + X2+ X4 + X5)> 0 X3 < 0,8 (X1 + X2 + X3 + X4 + X5); 0,2 X3 - 0,8 (X1 + X2 + X4 + X5) 0
X4 > 0,04 (X1 + X2 + X3 + X4 + X5); 0,96 X4 - 0,04 (X1 + X2 + X3 + X5)> 0 X4 < 0,08 (X1 + X2 + X3 + X4 + X5); 0,92 X4 - 0,08 (X1 + X2 + X3 + X5)< 0
X5 > 0,003(X1 + X2 + X3 + X4 + X5); 0,997X5 - 0,003(X1 + X2 + X3 +X4)>0 X5 < 0,05 (X1 + X2 + X3 + X4 + X5); 0,95 X5 - 0,05 (X1 + X2 + X3 + X4)< 0
3. Function of criteria:
Minimum expenses 700 din / throatX1 (throat) + 1,800 X 2 + 3,500 X 3 + 5,000 X 4 + 4,000 X 5 = V (min)
In setting up the model of the optimal structure of the household, one of the most important issues is defining the factors over the corresponding onesWhich will, through the linear programming model, essentially influence the flow of the solution and the selection of the structure of pig production.
Projection of the optimization of the structure of pig production is based on the achieved
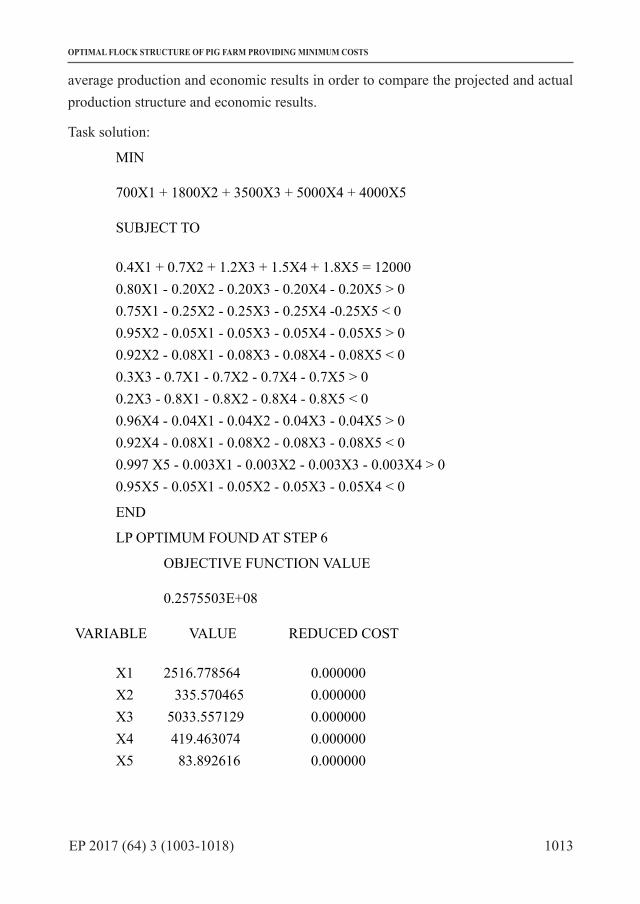
1013EP 2017 (64) 3 (1003-1018)
OPTIMAL FLOCK STRUCTURE OF PIG FARM PROVIDING MINIMUM COSTS
average production and economic results in order to compare the projected and actual production structure and economic results.
Task solution:
MIN
700X1 + 1800X2 + 3500X3 + 5000X4 + 4000X5
SUBJECT TO
0.4X1 + 0.7X2 + 1.2X3 + 1.5X4 + 1.8X5 = 120000.80X1 - 0.20X2 - 0.20X3 - 0.20X4 - 0.20X5 > 00.75X1 - 0.25X2 - 0.25X3 - 0.25X4 -0.25X5 < 00.95X2 - 0.05X1 - 0.05X3 - 0.05X4 - 0.05X5 > 00.92X2 - 0.08X1 - 0.08X3 - 0.08X4 - 0.08X5 < 00.3X3 - 0.7X1 - 0.7X2 - 0.7X4 - 0.7X5 > 00.2X3 - 0.8X1 - 0.8X2 - 0.8X4 - 0.8X5 < 00.96X4 - 0.04X1 - 0.04X2 - 0.04X3 - 0.04X5 > 00.92X4 - 0.08X1 - 0.08X2 - 0.08X3 - 0.08X5 < 00.997 X5 - 0.003X1 - 0.003X2 - 0.003X3 - 0.003X4 > 00.95X5 - 0.05X1 - 0.05X2 - 0.05X3 - 0.05X4 < 0
END
LP OPTIMUM FOUND AT STEP 6
OBJECTIVE FUNCTION VALUE
0.2575503E+08
VARIABLE VALUE REDUCED COST
X1 2516.778564 0.000000 X2 335.570465 0.000000 X3 5033.557129 0.000000 X4 419.463074 0.000000 X5 83.892616 0.000000

1014 EP 2017 (64) 3 (1003-1018)
Ivan Mičić, Zoran Rajić, Jelena Živković, Dragan Orović, Marko Mičić, Ivana Mičić, Marija Mičić
ROW SLACK OR SURPLUS DUAL PRICES
2) 0.000000 -2575.503418 3) 419.463074 0.000000 4) 0.000000 427.348999 5) 83.892616 0.000000 6) 83.892616 0.000000 7) 0.000000 -197.147644 8) 838.926147 0.000000 9) 0.000000 -1424.496704 10) 2516.778564 0.000000 11) 41.946312 0.000000 12) 0.000000 90.604027
RANGES IN WHICH THE BASIS IS UNCHANGED:
OBJ COEFFICIENT RANGES
VARIABLE CURRENT ALLOWABLE ALLOWABLE
COEF INCREASE DECREASE
X1 800.000000 397.347900 300.000000 X2 2000.000000 192.622940 87.096779 X3 4000.000000 2830.000000 150.000000 X4 6000.000000 6714.285645 1486.865234 X5 5000.000000 91.525421 INFINITY
RIGHTHAND SIDE RANGES
ROW CURRENT ALLOWABLE ALLOWABLE
RHS INCREASE DECREASE
2 10000.000000 INFINITY 9999.999023 3 0.000000 419.463074 INFINITY 4 0.000000 84.104294 83.682007 5 0.000000 83.892616 INFINITY 6 0.000000 INFINITY 83.892616
1015EP 2017 (64) 3 (1003-1018)
OPTIMAL FLOCK STRUCTURE OF PIG FARM PROVIDING MINIMUM COSTS
7 0.000000 83.402832 84.388184 8 0.000000 INFINITY 838.926147 9 0.000000 83.194679 84.602364 10 0.000000 INFINITY 2516.778564 11 0.000000 41.946312 INFINITY 12 0.000000 83.056480 42.158520
Conclusion
Based on the analysis of the situation in the production and the optimal organizational structure of the livestock farm, which ensures minimal costs in the amount of 25,755,000 dinars, the following structure of the herd has been achieved: 2.517 heads of pigs, 336 seeds of juvenile breeding, pigs 5.034 heads, 419 sows and nerazoles 84 throats. Total deaths on the farm in 2013 were: pigs on cheese 6,315 heads, 3,425 heads, 17,150 kg pigs, 988 heads, 40,980 kg pigs, 67 seeds, 13,930 kg breeders and 890 kg of unadjusted 3 heads. The total increase in livestock per farm for the first year is 664.920 kg, from 781.569,7 EUR. Another argument in the request for determining the costs of pig production according to the meat share, which was shown in the farm’s research, is that it is best to close the entire production cycle. This is primarily the market for fattening pigs, piglets and pig meat in Serbia in 2013. After the research, a number of very important questions were answered in the paper: the level of costs is not such as to stimulate pig farmers, and the price affects the volume of production. Consumption of pork is cyclically reduced due to relatively high prices and a decline in living standards in the Republic of Serbia. The new scientific findings in pig breeding have come to light, the advantages of this method of training have been examined and scientific contribution has been given to the improvement of the development of pig production, for which Serbia, along with pig breeding tradition, has excellent geographical ecological potentials. As the final conclusion of these studies, pig farms may be recommended to be organized into production groups, co-operatives, clusters or franchisees (franchisees) or franchisees (franchises) to be able to place their products at higher prices. The basis for achieving better production results is a change in the type of production, meals, facilities, mechanization of work processes, farm size, intensity, rational management of costs in farm conditions. Because of their specificity, primarily biological character, each line of agricultural production must be viewed and organized as a complex process composed of a number of elements having one goal, namely achieving as good a result as possible with a lower investment unit. In Serbian swineyard, there is a traditionalism that needs to undergo fundamental changes in order to achieve the desired results. Such results can be achieved only in the case of the establishment of a fully functional closed system of breeding. There is a traditionalism in Serbian swine that needs to go through fundamental changes in order to achieve the desired results. Such results can be achieved only in the case of the establishment of a fully functional closed herd breeding system.

1016 EP 2017 (64) 3 (1003-1018)
Ivan Mičić, Zoran Rajić, Jelena Živković, Dragan Orović, Marko Mičić, Ivana Mičić, Marija Mičić
Literature
1. Andrić, J. (1998): Troškovii kalkulacije u polјoprivrednoj proizvodnji, Polјoprivredni fakultet – Zemun, Beograd; CouncilRegulation (EEC) No 3220/84 of 13 November 1984 determiningthe Community scale forgrading pig carcass, 1984. Official Journal ofthe European Communities No L 301, 20/11/1984, No. 1 – 3.
2. Džinić, N., Petrović, Lj., Tomović, V., Manojlović, D., Timanović, S., Trišić-Ilić, S., Mrdjanov, J. (2003): Uticaj višerasnog ukrštanja i godišnjeg doba na kvalitet polutki i mesa svinja, Savremena poljoprivreda, Vol. 52, No. 3-4, pp. 335-337.
3. Džinić, N., Petrović, Lj.,Tomović, V., Manojlović, D., Timanović, S., Vidanrić, D., Kurjakov, N. (2004): Ocena kvaliteta polutki i mesa svinja rasa veliki švedski ladras. Biotechnology in animal husbandry, Vol. 20, No. 1 1-2, pp. 67-73.
4. Fisher, A.V., Green, D.M., Whittemore, C.T., Wood, J.D., Schofield, C.P. (2003): Growth of carcass components and its relation with conformation in pigs of threetypes, Meat Science, Vol. 65, No. 1, pp. 639-650.
5. Jukna, V., Jukna, C. (2005): The comparable estimation of meat quality of pigsbreeds and their combinations in Lithuania, Biotechnology in Animal Husbandry,Vol. 21, No. 5-6, pp. 175-179.
6. Kosovac, O., Josipović, S., Živković, B., Radović, Č., Marinkov, G., Tomašević,D. (2007): Comparable presentation of carcass and meat quality of differentpig genotypes using modern evaluation methods, . 2nd International Congresson animal husbandry „New perspectives and challenges of sustainable livestockfarming”, Belgrade, Serbia, Biotechnology In Animal Husbandry, Vol. 23, No. 5-6, pp. 291-301.
7. Manojlović, D., Petrović, Lj., Džinić, N., Kurjakov, N. (1999): Kvalitet trupa i mesa svinja – osnova kvaliteta proizvoda, Monografija: Tehnologija proizvodnje i kvalitet konzervi od mesa u komadima, No. 67-90, Tehnološki fakultet u Novom Sadu.
8. Mičić, I. (2014): Strategija razvoja proizvodnje svinjskog mesa i njegova ekonomska opravdanost, magistarska teza, Poljoprivredni fakultet, Univerzitet u Prištini, Srbija.
9. Mičić, I., Urošević, D., Vujić, R., Mičić, I. I., Mičić, M., Mičić, I. M. (2016a): Operating costs of agricultural holdings with equal production possibilities, Economics of Agriculture Belgrade Serbia, Vol. 63, No. 2, pp. 407-428.
10. Mičić, I., Rajić, Z., Živković, D., Nikolić, S., Mičić, I. I., Mičić, I. M. (2016b): Development strategy of economically justified pig meat production from farm to fork: agricultural economic analysis, ZAEM, Association of Agricultural Economists of Republic of Macedonia, AAEM 10TH Intrnational Conference, UDC 338.439.4:637.5’64:303.72 (497.11) pp. 148-155.
11. Petrović, M., Radović, Č., Perunović, N., Radojković, D., Aleksić, S., Stanišić, N., Popovac, N. (2010): Quality traits of carcass sides and meat of moravka and mangalitsa pig breeds, Biotechnology in Animal Husbandry, Vol. 26, pp. 21-27.
1017EP 2017 (64) 3 (1003-1018)
OPTIMAL FLOCK STRUCTURE OF PIG FARM PROVIDING MINIMUM COSTS
12. Petrovic, M. M., Aleksic, S., Petrovic, M. P., Petrovič, M., Pantelic, V., Novakovic, Ž., Ružic Muslic, D. (2013): Potencijali stočarske proizvodnje, Belgrad, Srbia, Biotechnology in Animal Husbandry Vol. 29, No. 1, pp 1-17.
13. Radović, B. (2000): Gajenje svinja, D. P. ‘’Grafika’’, Kruševac. 14. Radović, I. (2002): Primena linearnog programiranja u poljoprivredi, Potez,
Beograd.15. Rahelić, S. (1984): Uzgoj svinje i meso,Školska knjiga, Zagreb.16. Rajić, Z. (2003): Model za optimiranje structure proizvodnje industrijske
proizvodnje klanice, doktorska disertacija, Poljoprivredni fakultet, Univerzitet u Novom Sadu, Srbija.
17. Timanović, S., Vidanić, D., Kurjakov, N. (2003): Ocena kvaliteta polutki i mesa svinja rasa veliki jorkšir i švedski landras, Biotehnologija u stočarstvu Vol. 19, No. 5-6, p. 500.
18. Tomović, V., Petrović, Lj., Džinić, N.,Manojlović, D.,Timanović, S., Trišić-Ilić, S. (2005): Meat yield in primal cuts and sides of pigs determined by partial dissection, International 53rd meat industry conference ‘’New integral approach to meat andproducts safety’’, Vrnjačka banja, I-15, No. 31-34.
19. Vidović, V., Krnjaić, J., Lukač, D., Višnjić, V., Stupar, M. (2012): Growth intensity of the gilts fertile breed pigs in the Nucleus farm, Biotech, Anim. Hus., Vol. 28, No. 4, pp. 787-796.
20. Zekić, V., Okanović, Đ. (2007): Prudence of fatty pigs production, I International Congress: „FOOD TECHNOLOGY, QUALITY AND SAFETY“, XI Symposium NODA: „Technology, quality andsafety in pork production and meat Processing“, Proceedings No. 33-37.
21. Zekić, V., Tomović, V., Milić, D., Vidović, V., Lukač, D. (2013): Ekonomska obeležja proizvodnje svinja rase landras i mangulica, Letopis naučnih radova Poljoprivrednog fakulteta, Vol. 37, No. 1, pp. 191-199.
22. Živković, D., Perunović, M. (2012): Poznavanje mesa, praktikum, Poljoprivredni fakultet, Univerzitet u Beogradu.

1018 EP 2017 (64) 3 (1003-1018)
Ivan Mičić, Zoran Rajić, Jelena Živković, Dragan Orović, Marko Mičić, Ivana Mičić, Marija Mičić
OPTIMALNA STRUKTURA SVINJA NA FARMI SA MINIMALNIM PROIZVODNIM TROŠKOVIMA
Ivan Mičić8, Zoran Rajić9, Jelena Živković10, Dragan Orović11, Marko Mičić12, Ivana Mičić13, Marija Mičić14
Rezime
Studija se bavi analizom obrta stada svinjogojske farme u proizvodnji svinjskog mesa u Srbiji, kao i neto efektivne površine oprimalne organizacione structure tovljenika u farmskim uslovima. Postavlja se pitanje optimalne structure proizvodnje na zadružnom gazdinstvu, koja je uglavnom orijentisano na proizvodnji tovnih svinja. U
radu je definisan i urađen konkretan model linearnog programiranja za optimalnu organizacionu strukturu stada svinjarske farme neto efektivne površin., Istraživanje je obuhvatilo zadružnu farmu „1. Decembr“ u Žitorađi u Topličkom okrugu. Za 2013 godinu praćena je tehnologija proizvodnje tovljenika na farmi, i analizirani su ekonomski rezultati. Tokom jednogodišnjeg posmatranog perioda.Utvrđeno je da je na farmi uzgoj tovljenika bio je 28.252 grla. Ukupni prirast na farmi, u 2013. godini bio je 664.920 kg, u iznosu od 781.569,7 €. Ukupno uginuće: prasadi na sisi 6.315 grla, zalučena prasad 3.425 grla, 17.150 kg, tovnih svinja 928 grla, 40.980 kg, krmače 67 grla 13.930 kg, nerastova 3 grla 890 kg.
Klјučne reči: obrt stada, površine po grlu, prirast, uginuće, minimalni troškovi
8 Mr Ivan Mičić, doktorant, Univerzitet u Beogradu, Poljoprivredni fakultet, Nemanjina ulica br. 6, 11080 Zemun, Srbija, Telefon: +381 62 973 11 58, E-mail: [email protected]
9 Redovni profesor, dr Zoran Rajić, Univerzitet u Beogradu, Poljoprivredni fakultet, Nemanjina ulica br. 6, 11080 Zemun, Srbija, Telefon: +381 11 261 53 15, E-mail: [email protected]
10 Jelena Živković, Master, Univerzitet u Beogradu, Poljoprivredni fakultet, Nemanjina ulica br. 6, 11080 Zemun, Srbija, Telefon: +381 11 261 53 15, E-mail: [email protected]
11 Mr Dragan Orović, doktorant, Univerzitet u Beogradu, Poljoprivredni fakultet, Nemanjina ulica br. 6, 11080 Zemun, Srbija, Telefon: +381 69870 25 20, E-mail: [email protected]
12 Marko Mičić, diplomirani ekonomista, Univerzitet u Nišu, Ekonomski fakultet, Trg Kralja Aleksandra Ujedinitelja br. 11, 18000 Niš, Srbija, Telefon: +381 63 680 040, E-mail: [email protected]
13 Ivana Mičić M.A., doktorand, Univerzitet u Nišu, Ekonomski fakultet, Trg Kralja Aleksandra Ujedinitelja br. 11, 18000 Niš, Srbija, Telefon: +381 63 233 603, E-mail: [email protected]
14 Marija Mičić M.A., doktorant, Univerzitet u Nišu, Tehnološki fakultet u Leskovcu, Bulevar Oslobođenja br. 124, 16000 Leskovac, Srbija, Telefon: +381 62 867 45 98, E-mail: [email protected]
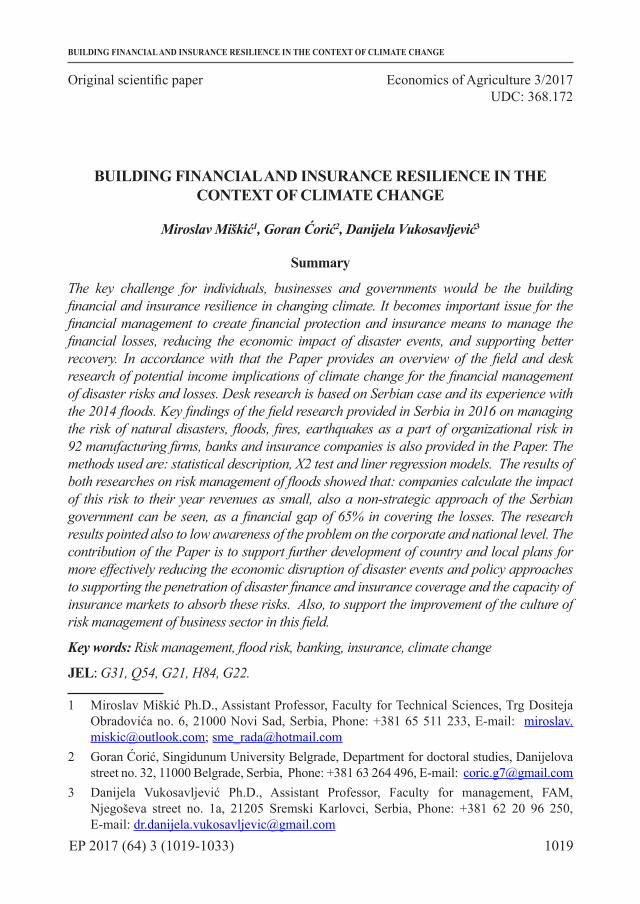
1019
Original scientific paper Economics of Agriculture 3/2017UDC: 368.172
EP 2017 (64) 3 (1019-1033)
BUILDING FINANCIAL AND INSURANCE RESILIENCE IN THE CONTEXT OF CLIMATE CHANGE
BUILDING FINANCIAL AND INSURANCE RESILIENCE IN THE CONTEXT OF CLIMATE CHANGE
Miroslav Miškić1, Goran Ćorić2, Danijela Vukosavljević3
Summary
The key challenge for individuals, businesses and governments would be the building financial and insurance resilience in changing climate. It becomes important issue for the financial management to create financial protection and insurance means to manage the financial losses, reducing the economic impact of disaster events, and supporting better recovery. In accordance with that the Paper provides an overview of the field and desk research of potential income implications of climate change for the financial management of disaster risks and losses. Desk research is based on Serbian case and its experience with the 2014 floods. Key findings of the field research provided in Serbia in 2016 on managing the risk of natural disasters, floods, fires, earthquakes as a part of organizational risk in 92 manufacturing firms, banks and insurance companies is also provided in the Paper. The methods used are: statistical description, X2 test and liner regression models. The results of both researches on risk management of floods showed that: companies calculate the impact of this risk to their year revenues as small, also a non-strategic approach of the Serbian government can be seen, as a financial gap of 65% in covering the losses. The research results pointed also to low awareness of the problem on the corporate and national level. The contribution of the Paper is to support further development of country and local plans for more effectively reducing the economic disruption of disaster events and policy approaches to supporting the penetration of disaster finance and insurance coverage and the capacity of insurance markets to absorb these risks. Also, to support the improvement of the culture of risk management of business sector in this field.
Key words: Risk management, flood risk, banking, insurance, climate change
JEL: G31, Q54, G21, H84, G22.
1 Miroslav Miškić Ph.D., Assistant Professor, Faculty for Technical Sciences, Trg Dositeja Obradovića no. 6, 21000 Novi Sad, Serbia, Phone: +381 65 511 233, E-mail: [email protected]; [email protected]
2 Goran Ćorić, Singidunum University Belgrade, Department for doctoral studies, Danijelova street no. 32, 11000 Belgrade, Serbia, Phone: +381 63 264 496, E-mail: [email protected]
3 Danijela Vukosavljević Ph.D., Assistant Professor, Faculty for management, FAM, Njegoševa street no. 1a, 21205 Sremski Karlovci, Serbia, Phone: +381 62 20 96 250, E-mail: [email protected]
1020 EP 2017 (64) 3 (1019-1033)
Miroslav Miškić, Goran Ćorić, Danijela Vukosavljević
Introduction
Among the key implications of climate change is its expected impact on the severity and frequency of disaster events. Disasters present a broad range of environmental, financial, economic, social, and human impacts with long lasting effects. Through the direct damages they cause to buildings, equipment and infrastructure as well as through indirect consequences such as business interruption, loss of employment and output and decrease tax revenues, besides human suffering. A number of studies have attempted to calculate the possible impacts of climate change on disaster losses for different regions based on specific climate change scenarios. The financial management of these impacts is a key challenge for individuals and governments. Risk management in companies, manufacturing, banking, insurance and risk transfer tools-reinsurance and capital markets – catastrophe bonds, could provide financial protection by providing a means to manage the financial losses, reducing the economic impact of disaster events, and supporting recovery.
Initiatives to improve risk awareness for flood and other disaster insurance coverage cold establish a sufficiently large pool of disaster risks. As losses increase in the context of climate change, governments may also need to examine impediments to the supply of insurance, such as a lack of the necessary data for risk pricing, limited financial and technical capacity in the insurance sector, insufficient management of disaster risks, as- land use planning, protective infrastructure, or limited access to reinsurance coverage, including any significant impediments to accessing international reinsurance markets. Financial support from governments, donors may be necessary to overcome some of these impediments or share some of the risk.The management of these impacts requires careful consideration of options for mitigating the impact of such events, such as measures to reduce exposure, enhance emergency preparedness to minimize disruption and address financial impacts through the use of risk transfer tools. Also insurance can contribute directly to reducing overall losses by encouraging risk reduction with involving the: risk based premiums for insurance coverage and premium discounts for effective risk reduction measures can provide incentives for reducing risks by offsetting the costs of risk reduction measures with lower future premiums for insurance coverage. Risk reduction measures implemented policyholders.
Despite the postured impact of insurance on mitigating the impact of disaster events, a significant insurance gap remains, particularly in developing countries as Serbia is, in terms of the share of the economic losses form disasters that are covered by insurance. Las decade insurance covered approximately 51% of all losses in high income countries, but less than 10% of losses in developing countries what further creates large fiscal exposures to disaster risks given the expectation that governments will compensate uninsured private losses (Melecky, Raddatz, 2011).The insured losses have no statistically significant impact on long term autput, while uninsured losses come with additonal macroeconomic costs, amountin to a cumulative output cost over 10 years of more than 2,5% ( von Peter et al., 2012).
In Southeast Europe, with the support of the World Bank and EU countries have collaborated on the establishment of Europa Re as a means of encouraging the development of local catastrophe insurance markets, building reinsurance capacity, infrastructure services and
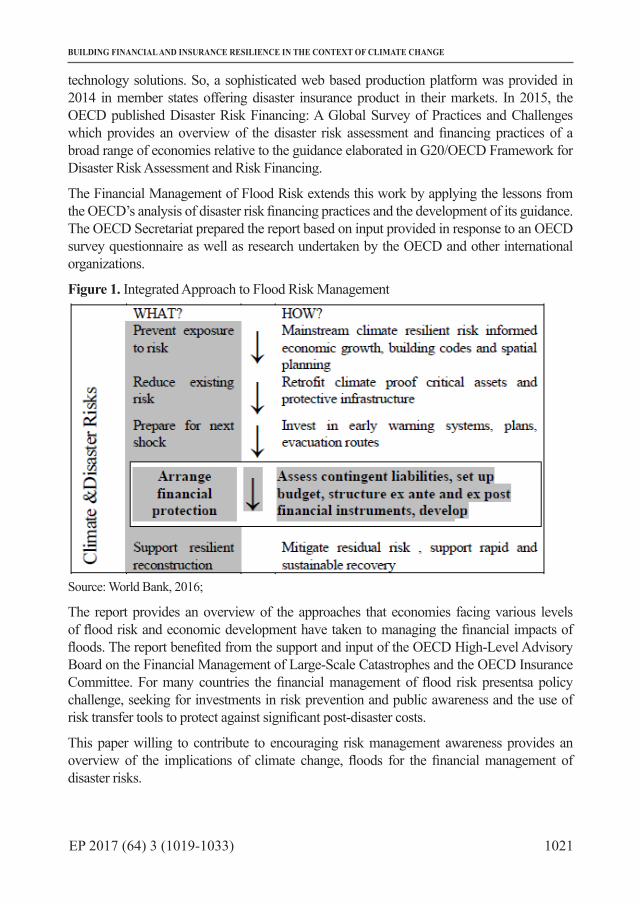
1021EP 2017 (64) 3 (1019-1033)
BUILDING FINANCIAL AND INSURANCE RESILIENCE IN THE CONTEXT OF CLIMATE CHANGE
technology solutions. So, a sophisticated web based production platform was provided in 2014 in member states offering disaster insurance product in their markets. In 2015, the OECD published Disaster Risk Financing: A Global Survey of Practices and Challenges which provides an overview of the disaster risk assessment and financing practices of a broad range of economies relative to the guidance elaborated in G20/OECD Framework for Disaster Risk Assessment and Risk Financing.
The Financial Management of Flood Risk extends this work by applying the lessons from the OECD’s analysis of disaster risk financing practices and the development of its guidance.The OECD Secretariat prepared the report based on input provided in response to an OECD survey questionnaire as well as research undertaken by the OECD and other international organizations.
Figure 1. Integrated Approach to Flood Risk Management
Source: World Bank, 2016;
The report provides an overview of the approaches that economies facing various levels of flood risk and economic development have taken to managing the financial impacts of floods. The report benefited from the support and input of the OECD High-Level Advisory Board on the Financial Management of Large-Scale Catastrophes and the OECD Insurance Committee. For many countries the financial management of flood risk presentsa policy challenge, seeking for investments in risk prevention and public awareness and the use of risk transfer tools to protect against significant post-disaster costs.
This paper willing to contribute to encouraging risk management awareness provides an overview of the implications of climate change, floods for the financial management of disaster risks.
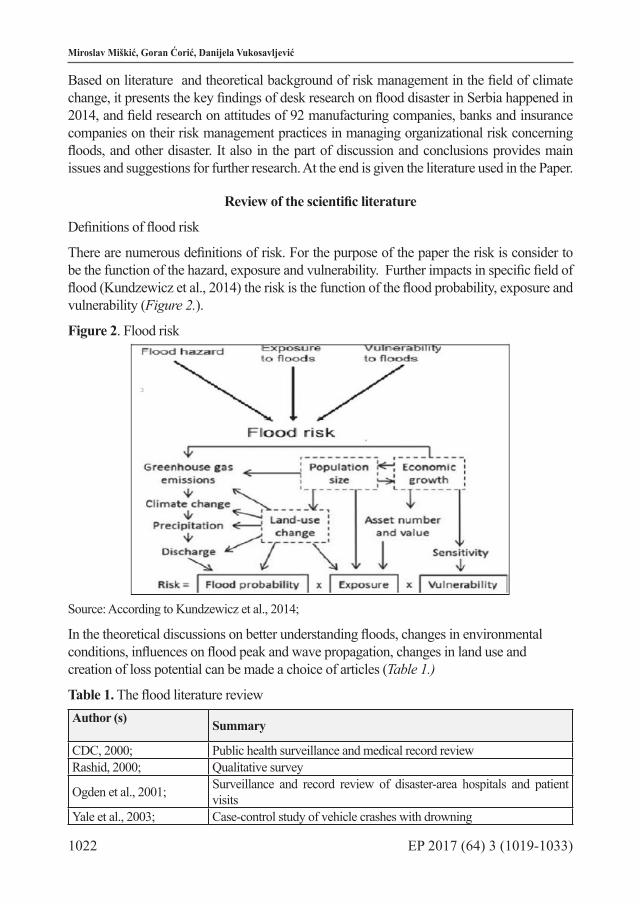
1022 EP 2017 (64) 3 (1019-1033)
Miroslav Miškić, Goran Ćorić, Danijela Vukosavljević
Based on literature and theoretical background of risk management in the field of climate change, it presents the key findings of desk research on flood disaster in Serbia happened in 2014, and field research on attitudes of 92 manufacturing companies, banks and insurance companies on their risk management practices in managing organizational risk concerning floods, and other disaster. It also in the part of discussion and conclusions provides main issues and suggestions for further research. At the end is given the literature used in the Paper.
Review of the scientific literature
Definitions of flood risk
There are numerous definitions of risk. For the purpose of the paper the risk is consider to be the function of the hazard, exposure and vulnerability. Further impacts in specific field of flood (Kundzewicz et al., 2014) the risk is the function of the flood probability, exposure and vulnerability (Figure 2.).
Figure 2. Flood risk
Source: According to Kundzewicz et al., 2014;
In the theoretical discussions on better understanding floods, changes in environmental conditions, influences on flood peak and wave propagation, changes in land use and creation of loss potential can be made a choice of articles (Table 1.)
Table 1. The flood literature reviewAuthor (s) Summary
CDC, 2000; Public health surveillance and medical record reviewRashid, 2000; Qualitative survey
Ogden et al., 2001; Surveillance and record review of disaster-area hospitals and patient visits
Yale et al., 2003; Case-control study of vehicle crashes with drowning

1023EP 2017 (64) 3 (1019-1033)
BUILDING FINANCIAL AND INSURANCE RESILIENCE IN THE CONTEXT OF CLIMATE CHANGE
Author (s) Summary
Cariappa and Khanduri, 2003; Assessment of flood-related illness/injury in care seekers
Baxter, 2005; Descriptive/historical accountGerritsen, 2005; Descriptive review / historical accountBeyhun et al., 2005; Review of the impact of flooding in Turkey from 1970 to 1996Guzzetti et al., 2005; Review of flood in Italy from 1279 to 2002Jonkman and Kelman, 2005;
Examination of the causes and circumstances of 247 flood disaster deaths across 13 flood events in Europe and the US
Jonkman, 2005; Review of mortality from river floods from 1975 to 2002 using the CRED Database
Tarhule, 2005; Review of newspaper accounts of rainfall and rain-induced flooding in the Sahel savanna zone of Niger from 1970 to 2000
Ahern et al., 2005; Review of studies of global flood events and assessment of gaps in knowledge relative to reducing public health impact of flooding
Lastoria et al., 2006 ; Italy,1951 to 2003 review of flood deaths and socioeconomic impacts Llewellyn, 2006 ; Review recent floods eventsPradhan et al., 2007; Household survey in flood affected areasSpencerand Myer, 2007; Descriptive/historical accountSchnitzler et al., 2007; Telephone survey of flood affected householdsJonkman and Vrijling, 2008;
Review of mortality attributed to different flood types and presentation of new method for estimating flood related deaths in low-lying areas
Jonkman et al., 2009; Secondary data analysis of following hurricane KatrinaFitzGerald et al., 2010, Review of flood fatalities in Australia from 1997 to 2008Biswas et al., 2010; Household survey of child injury in flood-affected areasBich et al., 2011; Cross-sectional household survey
Source: Authors;
The most often mentioned types, causes and impacts of floods in the theoretical articles are:
Coastal floods (sea-borne) mostly caused by wind, high water levels which are generated by a superposition of: astronomical tides, wind setup, external surge, surface waves;
Lake floods; River floods (fluvial floods) generated by: long-lasting rainfall with high depth
over a large area, or snowmelt, Infiltration capacity of the soil is exceeded, water converges in the drainage system. Flood wave builds up in the entire system or in principal stream(s). Flooding process: Areas adjacent to the river are affected first. Flooding originates from the river channel. Impact: Flood plains are usually high-value areas, huge loss potential but, flood control/protection/; prevention is possible (dikes, reservoirs) as measures always paying off in the long run.
Flash floods (pluvial, off-plain) are one of the most frequent causes of death from natural hazards;
1024 EP 2017 (64) 3 (1019-1033)
Miroslav Miškić, Goran Ćorić, Danijela Vukosavljević
Urban flooding, with the high percentage of impermeable surfaces, no space for orderly runoff during intense rainfall , high loss potential;
Surface flooding , surface runoff („wild water“);
Mountain floods. Torrent, special type of flash flood with high sediment transport rates, washing off of volcanic ash by intense rain, melting of snow/ice cover during a volcanic eruption, high-viscosity flow, fast , extremely destructive, Sometimes hot, Lahar;
Groundwater/waterlogging floods, rising groundwater table, local or widespread high rainfall in flat areas, relatively slow onset, long lasting , Interruption of GW flow, seepage underneath a dike „Plum rain“ - very long lasting drizzle-type rain soaks the ground from the surface and thereby seals it. In little or moderately permeable underground situations. Highly damaging to crops;
Backup floods. Landslide or glacier backs up a river, sudden break-through when natural dam is overtopped, less frequent than in the past due intensive use of rivers (cooling water);
Break floods. Dam break flood, similar to flash floods/debris flows, extreme depths possible, very few large dams have failed in history, hundreds of small dams fail every year;
GLOF (Glacial Lake Outburst Flood), melting of a glacial icecap during a volcanic eruption;
Subsidence-caused floods. Man-made causes, groundwater load from reduced pumping buildings sediment input. Natural causes: earthquake isostatic sinking.
Methods and materials
Key findings on disaster profile 2014, desk research
Floods in Serbia 2014 affected (Estimates based on the Post Disaster Needs Assessment implemented by the Government of Serbia with the assistance of the WB, UN and EU) 119 municipalities (out of 165) and 22% of total population. More than 30 municipalities sustained extensive damage, 57 lives were lost, and 32,000 families were forced out of their homes. Production of electricity decreased by 25%, due to the flooding of an open-pit coal mine, a key source of lignite-based power generation. The disaster caused a recession in the Serbian economy, GDP fell by 1.8% in 2014 as total disaster effects (damages and losses) were 4.8% of GDP (EUR 1.7 billion). It is estimated that total needs for recovery and reconstruction were EUR 1.35 billion. No adequate system was in place to respond to overwhelming needs in a coordinated fashion, what caused drafting a new set of rules, law and bylaws (Figure 3.)

1025EP 2017 (64) 3 (1019-1033)
BUILDING FINANCIAL AND INSURANCE RESILIENCE IN THE CONTEXT OF CLIMATE CHANGE
Figure 3. Financing of flood relief and reconstruction in 2014
Source: Office for Reconstruction and Flood Relief of Serbia;
Government aid has been concentrated to provision of over 40 million EUR to 20,929 families, 5 million EUR provided to 2006 SMEs as cash grants, aid packages for over 26,000 agricultural households in 29 municipalities affected by floods (saplings, animals, animal feed, equipment), cattle breeders financed from the national budget with full replacement value for almost 5000 farm animals and farmers for 16,000 hectares and reconstruction of energy sector, transport infrastructure, 111 public buildings, 109 projects of local infrastructure (Table 2.)
Table 2. Risk Layering in SerbiaDisaster risk Financing source available Amount of funds available
High-risk layer(major floods, major earthquakes)
Donor assistance Unpredictable an unreliable (2014 the total of €235 million)
Emergency borrowingUnpredictable (€227 million drown from World Bank for 2014 floods emergency recovery)
Medium –risk layer (regional floods, minor earthquakes)
Contingent financing Not currently available ($100 million CAT DDO is in early preparation)

1026 EP 2017 (64) 3 (1019-1033)
Miroslav Miškić, Goran Ćorić, Danijela Vukosavljević
Disaster risk Financing source available Amount of funds available
Low-risk layer ( localized floods, droughts, landslides)
Budget funds: permanent budgetary reserve
€17,00 (originally budgeted, increased one-off by 2014 supplementary budget to approximately €20 million)
Budget funds: compensation for damage caused by the natural disasters
€700,000 (originally budgeted, increased of €1.5 million)
Budget reallocationUnclear (10% of each appropriation available immediately higher if splintery budget is passed)
Catastrophe insurance Very low because of low penetration (€16.9 million paid out for 2014 floods)
Source: Post Disaster Needs Assessment (2015). Ministry of finance of Serbia;
Key Findings on flood risk management, field research
Sampling and methodology
The field research was provided in Serbia in 2016 on the risk management and its importance for companies’ sustainability or development. The research sample make 92 surveyed enterprises, classified according to the type of activity they perform: 54.86% companies from manufacturing and 45.14% from the banking and insurance sector. The first set of questions is related to the basic characteristics of the surveyed firms, b related to the: legal form, level of revenues achieved in 2015 and description of how the risks influenced the level of revenues they achieved in 2015, sustaining or increasing them.
Basic (dependent) variable whose observed values are directly influenced by various risks is the income (revenue) of the company.
All risk factors are considered as separate, independent statistical variables. Thus, based on the observations of the respondents, the companies and banks can accurately, quantitatively express the importance and impact of each individual risk factor on the performance of the company. The second group of questions refers to determining the factors, levels and types of risks companies managed in their risk management function.
Main Hypothesis of the research is, H0: Risk management has a positive impact on the operations of the companies, banks and insurance firms.
In order to check the hypotheses, theoretically based, statistical methods are applied: the basic methods of descriptive statistical analysis of the data under observation, the numerical characteristics of the survey, the mean value and the standard deviation; the statistical testing of the dependence of individual sample variables, where Pearson’s χ2 (Chi-Square) test of the independence of certain characteristics (features, or variables) of the given sample was used.
Here, the χ2 test was used first in a statistical analysis of the structure of the sample itself, and then in determining the (no) dependence between the remaining individual responses within the observed sample. Main hypothesis, H0 assumes that the value of the observed

1027EP 2017 (64) 3 (1019-1033)
BUILDING FINANCIAL AND INSURANCE RESILIENCE IN THE CONTEXT OF CLIMATE CHANGE
variables does not depend on the core business performed by firms, these statistics represent an adequate measure of deviation of empirical and expected frequencies.
Therefore, “small” values are the statistics favorable to the H0 hypothesis, higher values can be the basis of this hypothesis and acceptance of the opposite hypothesis, that is, the assumption that the structure of respondents’ responses directly depends on the type of activity they perform. A multiple regression analysis model was used to check the hypotheses. The basic role of this analysis is the description of the link between one output (dependent) and two or more input (independent) variables.
On the basis of the estimated values of the regression coefficients, the quality of the obtained regression bond was determined, the degree of agreement of the logistic function with the empirically obtained, obscured data. For this purpose, the following were used: the standard error of estimation, the coefficient of determination and Aikike’s information criterion.
Key findings
For the purpose of this paper are given the research results for operational risk management, which covers disaster risk. In Table 3, are provided the characteristics of surveyed enterprises, banks and insurance companies.
Table 3. Characteristics of surveyed enterprises (sample)Description Percentage of
respondents χ2-statistics (P-value)
The business activityProduction 54.86%
16.38 (9.47E-04)Banking and Insurance 45.14%
Legal formPrivate independent company 46.90%
34.29 (1.72E-07)Part of a larger system (bank) 23.01%Public company 8.85%Other 21.24%
Income in 2015 (in €)Less than € 100,000 26.55%
0.805 (0.8483)100,001-500,000 € 27.43%500.001-2.000.000 € 23.89%More than € 2,000,001 22.12%
The impact of the risk on the company’s income in 2015Income Sustainability (with occasional reductions) 71.68%
5.12 (0.0775)Increase revenue 28.32%
Source: Authors;
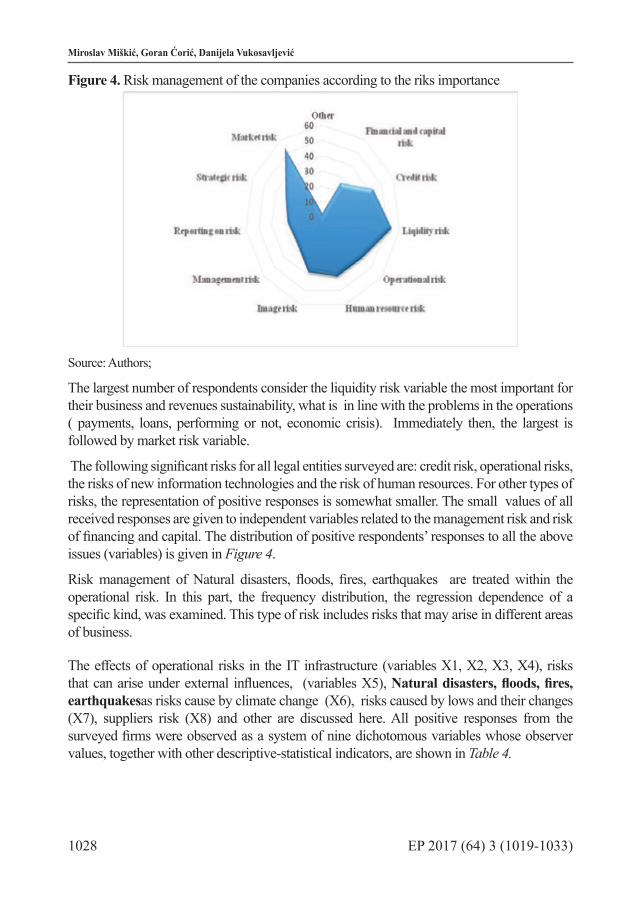
1028 EP 2017 (64) 3 (1019-1033)
Miroslav Miškić, Goran Ćorić, Danijela Vukosavljević
Figure 4. Risk management of the companies according to the riks importance
Source: Authors;
The largest number of respondents consider the liquidity risk variable the most important for their business and revenues sustainability, what is in line with the problems in the operations ( payments, loans, performing or not, economic crisis). Immediately then, the largest is followed by market risk variable.
The following significant risks for all legal entities surveyed are: credit risk, operational risks, the risks of new information technologies and the risk of human resources. For other types of risks, the representation of positive responses is somewhat smaller. The small values of all received responses are given to independent variables related to the management risk and risk of financing and capital. The distribution of positive respondents’ responses to all the above issues (variables) is given in Figure 4.
Risk management of Natural disasters, floods, fires, earthquakes are treated within the operational risk. In this part, the frequency distribution, the regression dependence of a specific kind, was examined. This type of risk includes risks that may arise in different areas of business.
The effects of operational risks in the IT infrastructure (variables X1, X2, X3, X4), risks that can arise under external influences, (variables X5), Natural disasters, floods, fires, earthquakesas risks cause by climate change (X6), risks caused by lows and their changes (X7), suppliers risk (X8) and other are discussed here. All positive responses from the surveyed firms were observed as a system of nine dichotomous variables whose observer values, together with other descriptive-statistical indicators, are shown in Table 4.
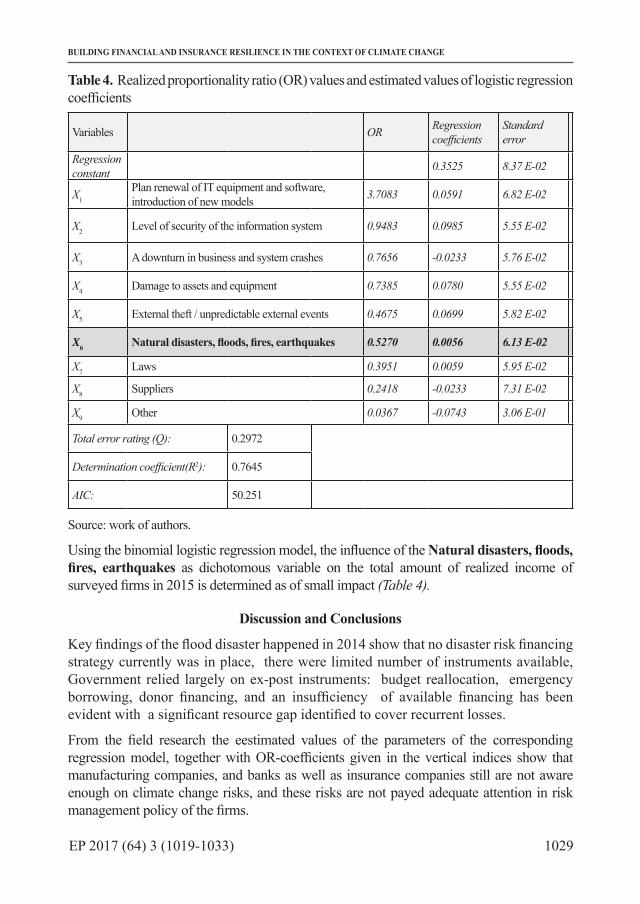
1029EP 2017 (64) 3 (1019-1033)
BUILDING FINANCIAL AND INSURANCE RESILIENCE IN THE CONTEXT OF CLIMATE CHANGE
Table 4. Realized proportionality ratio (OR) values and estimated values of logistic regression coefficients
Variables OR Regression coefficients
Standard error
Regression constant 0.3525 8.37 E-02
X1Plan renewal of IT equipment and software, introduction of new models 3.7083 0.0591 6.82 E-02
X2 Level of security of the information system 0.9483 0.0985 5.55 E-02
X3 A downturn in business and system crashes 0.7656 -0.0233 5.76 E-02
X4 Damage to assets and equipment 0.7385 0.0780 5.55 E-02
X5 External theft / unpredictable external events 0.4675 0.0699 5.82 E-02
X6 Natural disasters, floods, fires, earthquakes 0.5270 0.0056 6.13 E-02
X7 Laws 0.3951 0.0059 5.95 E-02
X8 Suppliers 0.2418 -0.0233 7.31 E-02
X9 Other 0.0367 -0.0743 3.06 E-01
Total error rating (Q): 0.2972
Determination coefficient(R2): 0.7645
AIC: 50.251
Source: work of authors.
Using the binomial logistic regression model, the influence of the Natural disasters, floods, fires, earthquakes as dichotomous variable on the total amount of realized income of surveyed firms in 2015 is determined as of small impact (Table 4).
Discussion and Conclusions
Key findings of the flood disaster happened in 2014 show that no disaster risk financing strategy currently was in place, there were limited number of instruments available, Government relied largely on ex-post instruments: budget reallocation, emergency borrowing, donor financing, and an insufficiency of available financing has been evident with a significant resource gap identified to cover recurrent losses.
From the field research the eestimated values of the parameters of the corresponding regression model, together with OR-coefficients given in the vertical indices show that manufacturing companies, and banks as well as insurance companies still are not aware enough on climate change risks, and these risks are not payed adequate attention in risk management policy of the firms.
1030 EP 2017 (64) 3 (1019-1033)
Miroslav Miškić, Goran Ćorić, Danijela Vukosavljević
So both, institutional-national and companies level of planning, managing and reporting on disaster risk is not on the level that climate change would propose.
Budget system does not allow the accumulation of resources over a multiyear period, cash accounting principle was not function as all the funds were not spent during one year and cannot be used in the next period and accumulated. The lack of fiscal space from ongoing fiscal consolidation efforts pursued by the Government was evident, as well as the high competition for financing resources, difficult to set aside considerable amounts of budgetary resources for contingencies.
It can be concluded that, in a better preparation of a catastrophe an promotion of catastrophe financing and insurance for individuals and activities for boosting private insurance sales under way would be needed, analysis of various budget protection mechanisms (national and local level), and more developed risk management plans and strategies of banking, insurance sector and enterprises on long term, reducing complexity and increasing certainty. Serbia would have to address pervasive underinsurance of disaster risks through communications initiatives and forms of indirect compulsion ( Michel - Kerjan, 2010;) as: encouraging risk awareness, improving policyholder awareness of their level of protection, indirect compulsion for a higher levels of flood insurance purchase at the time of acquisition, flood insurance policies.
General protection against floods following intense local precipitation is not feasible. Instead of quantitative forecasts qualitative warnings would be welcomed. Structural precaution is easily possible for newly constructed buildings, but hardly feasible (and expensive) for existing buildings. Values do increase as the climate change is happening and the risk from flash floods will increase as complex processes and prevention with cooperation is seen as a long term multidisciplinary value chain activity.
References
1. Ahern, M., Kovats, R., Wilkinson, P. (2005): Global health impact of floods: epidemiological evidence. Epidemiologic Reviews, Vol. 27, No. 1, pp. 36-46.
2. Baxter, P. (2005): The east coast big flood, 31 January-1 February 1953: A summary of the human disaster. Philosophical Transactions: Mathematical, Physical and Engineering Sciences (Series A), Vol. 363(1831), pp.1293-1312.
3. Beyhun, N., Altintas, K., Noji, E. (2005): Analysis of registered floods in Turkey. International Journal of Disaster Medicine, Vol. 3, No.1-4, pp. 50-54.
4. Bich, T., Quang, L., Ha, L., Hanh, T., Guha-Sapir, D. (2011): Impacts of flood on health: epidemiologic evidence from Hanoi, Vietnam. Global Health Action, Vol.4, pp. 63-56.
5. Biswas, A., Rahman, A., Mashreky, S. (2010): Unintentional injuries and parental violence against children during flood: a study in rural Bangladesh. Rural and Remote Health, Vol. 10, pp.11-99.
6. Cariappa, M., and Khanduri, P. (2003): Health emergencies in large populations:
1031EP 2017 (64) 3 (1019-1033)
BUILDING FINANCIAL AND INSURANCE RESILIENCE IN THE CONTEXT OF CLIMATE CHANGE
The Orissa experience. Medical Journal of the Armed Forces of India, Vol. 59, No. 4, pp. 286-289.
7. Centers for Disease Control and Prevention (CDC). (2001): Morbidity and Mortality, Weekly Report, Vol. 49, No. 7, pp. 133-135.
8. FitzGerald, G., Du, W., Jamal, A. (2010): Flood fatalities in contemporary Australia (1997-2008). Emergency Medicine Australasia, Vol. 22, pp.80-186.
9. Gerritsen, H. (2005): What happened in 1953? The big flood in the Netherlands in retrospect. Philosophical Transactions: Mathematical, Physical and Engineering Sciences (Series A), Vol. 363(1831) pp.1271-1291.
10. Guzzetti, F., Stark, C., Salvati, P. (2005): Evaluation of flood and landslide risk to the population of Italy. Environmental Management, Vol. 36, No.1, pp.15-36.
11. Jonkman, S., and Kelman, I. (2005): An analysis of the causes and circumstances of flood disaster deaths. Disasters, Vol. 29, No. 1, pp. 75-97.
12. Jonkman, S. (2005): Global perspectives on loss of human life caused by floods. Natural Hazards, Vol. 34, No.2, pp. 151-175.
13. Kundzewicz, Z., Kanae, S., Seneviratne, S. (2014): Flood risk and climate change: global and regional perspectives. Hydrol. SCI Journal, Vol. 59, No. 1, pp. 1-28.
14. Lastoria, B., Simonetti, M., Casaioli, M. (2006): Socio-economic impacts of major floods in Italy from 1951 to 2003. Advances in Geosciences, Vol. 7, pp. 223-229.
15. Jonkman, S., Maaskant, B., Boyd, E. (2009): Loss of life caused by the flooding of New Orleans after Hurrican Katrina: Analysis of the relationship between flood characteristics and mortality. Risk Analysis, Vol. 29, No. 5, pp. 676-698.
16. Jonkman, S., and Vrijling, J. (2008): Loss of life due to floods, Journal of Flood Risk Management, Vol. 1, pp. 43-56.
17. Lllewellyn, M. (2006): Floods and Tsunamis. Surgical clinics of North America, Vol. 86, pp. 557-578.
18. Melecky, M., Raddatz, C. (2011); How do Governments respond after Chatstrophes? Natural disaster shocks and the fiscal stance, Policy research working paper, No.5564, World Bank, Washington, available at: https://blogs.worldbank.org
19. Michel-Kerjan, E. (2010): Catastrophe economics: the national flood insurance program, Journal of economic perspectives, Vol.24, No. 4, pp. 165-186.
20. Ogden, C., Gibbs-Scharf, L., Kohn, M. (2001): Emergency health surveillance after severe flooding in Louisiana, Prehospital and Disaster Medicine, Vol. 16, No. 3, pp.138-144
21. Pradhan, E., West, K., Katz, J. (2007): Risk of flood-related mortality in Nepal. Disasters, Vol. 31, No. 1, pp. 57-70.
22. Rashid, S. (2000): The urban poor in Dhaka city: Their struggles and coping strategies during the floods of 1998. Disasters, 24(3); 240-253.
23. Schnitzler, J., Benzler, J., Altmann, D. (2007): Survey on the population’s needs and
1032 EP 2017 (64) 3 (1019-1033)
Miroslav Miškić, Goran Ćorić, Danijela Vukosavljević
the public health response during floods in Germany. Public Health Management and Practice, Vol. 13, No. 5, pp.461-464.
24. Spencer, J., and Myer, R. (2007): Population and economic overview of Cambria County, Pennsylvania following the 1977 Johnstown flood. Disaster Prevention and Management, Vol. 16, No. 2, pp. 259-264.
25. Tarhule, A. (2005): Damaging rainfall and flooding: The other Sahel hazards. Climatic Change, Vol. 72, No. 3, pp. 355-377.
26. Von Peter, G., von Dahlen, S., Saxsena, S.(2012): Unmitigated disasters? New evidence on the macroeconomic cost of natural catstrophes, BIS working papers, No. 394, Bank for international settlements, available at: www.bis.org
27. Yale, J., Cole, T., Garrison, H. (2003): Motor vehicle-related drowning deaths associated with inland flooding after Hurricane Floyd: A field investigation. Traffic Injury Prevention, Vol. 4, No. 4, pp. 279-284.

1033EP 2017 (64) 3 (1019-1033)
BUILDING FINANCIAL AND INSURANCE RESILIENCE IN THE CONTEXT OF CLIMATE CHANGE
UNAPREĐENJE OTPORNOSTI OSIGURANJA I FINANSIJA U KONTEKSTU KLIMATSKIH PROMENA
Miroslav Miškić4, Goran Ćorić5, Danijela Vukosavljević6
Sažetak
Ključni izazov za pojedince, preduzeća i vlade biće izgradnja finansijske otpornosti i osiguranja od klimatskih promena. Ovo postaje važnim pitanjem za finansijski menadžment da kreira finansijsku zaštitu i sredstva osiguranja za upravljanje finansijskim gubicima, smanjujući ekonomski uticaj prirodnih katastrofa i omogućavajući bolji oporavak od njih. U tom smislu ovaj rad daje pregled rezultata terenskog i desk istraživanja klimatskih promena s aspekta finansijskog upravljanja njihovim potencijalnim uticajem na prihode i gubitke. Desk istraživanje bazira na primeru Srbije i njenim iskustvom u poplavama iz 2014. godine. U radu su prikazani i glavni rezultati terenskog istraživanja sprovedenog u Srbiji 2016. godine u 92 proizvodne firme, banke i osiguravajuća društva o upravljanju rizikom prirodnih nepogoda, poplava, požara i zemljotresa, kao sastavnim delom organizacionog rizika. Korišćene su statističke metode deskripcije, X2 testa i lienearne regresije. Rezultati oba istraživanja o upravljanju rizikom poplava su pokazala da: kompanije kalkulišu mali uticaj ovog rizika na njihove prihode, kao i vidljiv ne strateški pristup srpske vlade kroz nedostatak 65% sredstava u pokrivanju gubitaka od ovog rizika. Istraživanje takođe upućuje na nizak nivo svesti o ovom problem 2014. godine na nacionalnom i korporativnom nivou. Doprinos rada se ogleda u podršci razvoju budućih nacionalnih I lokalnih planova za efikasnije smanjenje prekida ekonomskih aktivnosti zbog prirodnih nepogoda i politici uvođenja finansiranja i osiguranja od nepogoda, povećanja kapaciteta tržištao siguranja da apsorbuje ove rizike, kao i podršci unapređenju kulture upravljanja rizikom u ovoj oblasti.
Ključne reči: Upravljanje rizikom, rizik od poplava, banke, osiguranje,klimatske promene
4 Docent, dr Miroslav Miškić, Univerzitet u Novom Sadu, Fakultet tehničkih nauka, Trg Dositeja Obradovića br. 6, 21000 Novi Sad, Srbija, Telefon: +381 65 511 233, E-mail: [email protected]; [email protected]
5 Mr Goran Ćorić, doktorant, Univerziteta Sigidunum u Beogradu, Ulica Danijelova br. 32, 11000 Beograd, Srbija, Telefron. +381 63 264 496, E-mail: [email protected].
6 Docent, dr Danijela Vukosavljević, Univerzitet Union “Nikola Tesla” u Beogradu, Fakultet za menadžment, Sremski Karlovci, Njegoševa ulica br. 1a, 21205 Sremski Karlovci, Srbija, Telefon: +381 62 209 62 50, E-mail: [email protected].

1035
Original scientific paper Economics of Agriculture 3/2017UDC: 005.5+631]:502
EP 2017 (64) 3 (1035-1047)
AGRICULTURAL ENTREPRENEURSHIP, ENVIRONMENTAL PROTECTION AND INSURANCE
AGRICULTURAL ENTREPRENEURSHIP, ENVIRONMENTAL PROTECTION AND INSURANCE
Vladimir Njegomir1, Ljubo Pejanović2, Zoran Keković3
Summary
Agricultural entrepreneurship is the basis of creativity, innovation, profitability and risk management of agricultural producers. Although the agricultural entrepreneurship is often ignored in Serbia, in the paper we emphasize its importance due to the fact that the contribution of agriculture still has the largest share in gross domestic product. Current 2016 was declared as the year of entrepreneurship in Serbia, which further stressed the importance of studying this problem. As the aim of the research we have determined the need for the study of agricultural entrepreneurship in the context of vulnerability to risks from the environment. In this regard, in the paper we first point to agricultural entrepreneurship and the importance of agriculture production in Serbia and then we point out to the environmental protection, as a form of preventive action for risk reduction, insurance, as a form of financing of insurance claims, and the characteristics of agriculture insurance in Serbia. The main conclusion is that environmental protection and agricultural insurance are complementary mechanisms of risk protection that provide significant support to agricultural entrepreneurship and the development of agricultural production.
Keywords: agriculture, entrepreneurship, climate changes, insurance, Serbia.
JEL: Q01, Q54, G22.
Introduction
Agriculture is economic activity old as human society. Agriculture is an economic activity in which primary product of plant and animal origin is received from exploitation of agricultural land and the cultivation of plants and animals. Those are processed on farms in order to meet
1 Vladimir Njegomir Ph.D., Associate Professor, Faculty of Law and Business Studies dr Lazar Vrkatić, Bulevar oslobođenja br. 76, 21000 Novi Sad, Serbia, Phone: +381 64 139 30 05, E-mail: [email protected]
2 Ljubo Pejanović Ph.D., Associate Professor, Faculty of Law and Business Studies dr Lazar Vrkatić, Bulevar oslobođenja br. 76, 21000 Novi Sad, Serbia, E-mail: [email protected]
3 Zoran Keković Ph.D., Full Professor, University of Belgrade, Faculty of Security Studies, Gospodara Vučića street no. 50, 11040 Belgrade, Serbia, Phone: +381 69 123 02 65, E-mail: [email protected]

1036 EP 2017 (64) 3 (1035-1047)
Vladimir Njegomir, Ljubo Pejanović, Zoran Keković
personal and social needs. The development of human society led to the development of trade and transport so agriculture developed from production for own needs to commodity production. Farms were given the opportunity to supply market with their surplus agricultural products and to trade them for product and services from other economic activities.
Agricultural production is realized in business entities called farms. In Serbia, agricultural producers do not belong to entrepreneurs legally, but essentially they do, because they undertake business activities of agricultural production in order to generate profits.
One of the most significant factors of agricultural specificity is climate. Climatic elements significant for crop production are: air and soil temperature, humidity, cloudly and sunny weather, day length, quantity and distribution of rainfall, number off rainy days, the strength and direction of wind, the length of the winter, vegetation and frost-free period, etc. Periodic weather changes important to plant growth and development are: sudden changes, so-called excesses of the weather, such as frosts during the growing season, high temperatures, strong winds, droughts, floods, hail and similar.
Agricultural production is performed in the open and involves managing of living organisms, plants and animals what makes this production more complex and dependent on weather conditions, pests and diseases. Climatic factors often cause significant damage to agricultural production destroying all the efforts of entrepreneurship in agriculture. The negative impact of the climate is particularly evident in terms of climate change (Njegomir, Pejanovic, 2016).
The purpose of this paper is to determinate the need for the study of agricultural entrepreneurship and its vulnerability to the risks from environment. In this paper we first point on agricultural entrepreneurship and the importance of agriculture in Serbia and then on environmental protection as a form of preventive action to reduce the risk insurance, as a form of financing the result of damage realization and characteristics of agricultural insurance in Serbia.
Methodology and data sources
Our focus in this paper is entrepreneurship in agriculture in the context of environmental changes and posibilities for entrepreneurhip protection.
On the basis of foreign theorethical knowledge and empirical evidence we analyse agricultural entrepreneurship in general and in particular in Serbia. We use statistical analysis for data processing, analysing and presenting.
By using different legal sources we explain why farmers are acually entrepreneurs. We use data from CEFTA and World Bank to emphasise the role of the agriculture and entrepreneurship in agriculture in Serbia by using comparative data for regional countries and countries of the EU and the world.
We explore ecological crisis and environmental protection measures for protectiong
1037EP 2017 (64) 3 (1035-1047)
AGRICULTURAL ENTREPRENEURSHIP, ENVIRONMENTAL PROTECTION AND INSURANCE
agricultural entrepreneurship results. Also, we analyse the role of insurance as a protector of entrepreneurship activities in agricultural production in general and particularly in Serbia. We use data from National bank of Serbia to analyse in detail premium and loosses of crop and livestock insurance in Serbia.
Agricultural entrepreneurship
The first theoretical reference of entrepreneurship is associated to Cantillon who realized that entrepreneurs are individuals who accept risks and allocate resources to make use of available opportunities in order to maximize financial result (Cantillon, 1931). Schumpeter defined entrepreneurship in the context of new product and service development, the development of new production methods, identification of new segments and markets, iindetification of different sources of supply and the development different forms of organization (Schumpeter, 1934). Green Paper of the European Commission defines entrepreneurship as an individual capacity for identification and realization of opportunities in order to produce new value or economic success and it is independent or within the organization (Green Paper (2003).
Entrepreneurship essentially represents the identification of opportunities and the implementation of useful ideas into practice (ACS, 2008; Ireland, Webb, 2007). Etymologically the word “entrepreneur” comes from French word entre, that means “between” and prendre, that means “undertake”. The word was originally used to describe people who “take the risk” between buyers and sellers or who undertake a task such as starting a new venture (Tyszka, et al., 2011). Entrepreneurship requires tasks that can be completed individually or in groups and these tasks usually require creativity, initiative and willingness to take risks.
This confirms that agricultural producers are basically entrepreneurs because they take risks in order to achieve positive business results. Also, agricultural producers individually or as a group with creative thinking and innovations increase their results both in primary agricultural production and expansion of entrepreneurship in multifunctional context (Stefanović, Obradović, Broćić, 2012) or in the context of the further processing of primary agricultural products.
There are other possibilities for entrepreneurial engagement of farmers. According to Lehmann, which is cited in McElwee (2005), the development strategies that actually represent entrepreneurial activities include the following: enlargement of capacity by expansion of land use, enlargement of capacity by expansion of animal production, different use of capacity by change of degree of specialization, enlargement of capacity by services and vertical integration, expansion of the non-agricultural employment, external business and co-operation with other farmers.
Entrepreneurship in agriculture production in Serbia
The average entrepreneur in Serbia is married, the father of one child, and before opening his own company he worked for other at least six years. Mostly he performed a service or some sort of craft activities for the previous employer or in the gray zone, and the third is an experience in agricultural production. In Serbia, agricultural production in post-war period
1038 EP 2017 (64) 3 (1035-1047)
Vladimir Njegomir, Ljubo Pejanović, Zoran Keković
had a dominate share in terms of the population (Birovljev, Tomić, 2009) and there was the greatest number of entrepreneurships in the period of socialism. Agriculture, as the most developed industry in Serbia, was the basic of entrepreneurship we have today.
Entrepreneurship is inseparably connected to agricultural production in Serbia. However, this connection stems from the interpretation of entrepreneurship as a “undertake” of business activities. Unfortunately, in Serbia entrepreneurship in agriculture in terms of combining primary agricultural production and the next phases of processing of primary agricultural products does not exist. Also, often agricultural production is realized only in the form of growing certain crops types that barely allows the return in investments. Entrepreneurship partially occurs in fruit growing, for example in growing hazelnut and raspberry, and also occurs in farming and animal husbandry at the same time.
A partial problem occurred in inadequate treatment of individual agricultural producers in legal meaning. The individual farmer is not an entrepreneur in term of Article 83 of the Company Law (2015) unless otherwise is regulated by a special law. On the other hand, in accordance with Article 31 and Article 32 of the Law on Personal Income Tax (2015) agricultural producer is exempt. According to the interpretation of the Ministry of Finance of the Republic of Serbia (MFRC, 2016), an individual that earns income by performing activities of agriculture and forestry, and income from the sale of agricultural and forest products acquire the status of entrepreneur: 1) by the force of the law - if the payer of value added tax is in accordance with the law of governing value added tax, 2) at its own determination - if a holder of a family agricultural holding listed in the register of agricultural holdings is in accordance with the regulations governing the registration of farms that chose to have the status of entrepreneur.
The Law of Agriculture and Rural Development (2013) give amendments to Company Law in terms of interpretation whether farmers are entrepreneurs or not. In accordance with this Law, the holder of family farm is individual-farmer and entrepreneur that performs agricultural production, and is registered in the Register of agricultural holdings, as bearer of family farm.
We depart from the regulatory definition of entrepreneurs in agriculture and we consider that entrepreneurs are all farmers who produce exclusively for the market. In terms of our research we consolidate farmers and entrepreneurs engaged in agricultural production. Entrepreneur as a legal form of performing economic activities defined by the Company Law should be distinguished from the term entrepreneur or entrepreneurship in general and particularly in agricultural production. The term entrepreneur is much broader and is not linked to a specific legal form of performing economic activities. In developed countries a distinction between the concept of entrepreneurship and legal form have been made in which this legal form is called individual ownership.
As a small entrepreneur, farmer follows the market, price movements and changes and in accordance with the market creates its business policy. Among other things, this means that farmer should grown crops for which there is a shortage on market, but also a great demand. Also, agricultural entrepreneur the same should apply to livestock production.

1039EP 2017 (64) 3 (1035-1047)
AGRICULTURAL ENTREPRENEURSHIP, ENVIRONMENTAL PROTECTION AND INSURANCE
Deregulation in agriculture accompanied by liberalization necessary transforms farmers into small entrepreneurs. In terms of opening our country to the EU market, it is essential that farmers are not just producers but above all entrepreneurs. Entrepreneurial approach to agricultural production in local conditions is essential in order to take advantage offered by the larger market. The basis for the development of an entrepreneurial approach to agricultural producers is awareness of farmers, education, government support and investment, not only in manufacturing but also in the placement and knowledge. The development of an entrepreneurial approach to agriculture is particularly important in Serbia, bearing in mind the economic importance of the agricultural production as well as the potential that can be realized. In this paper, we will show a comparative importance of agriculture in Serbia and region, the European Union and the average of the world.
Agricultural production has enormous social and economic significance in Serbia (see Figure 1). It participates with 10.8%, and if included food industry with 18% in GDP, employs 23% of total employment or 17% of the active population and in export accounted with 23.3% (Petrović, Njegomir, Počuča, 2013). Due to favorable climatic conditions, a relatively large arable land per resident than the average in Europe, signing the free trade agreement CEFTA, proximity to markets and prospective accession to EU membership, agro-industry has great potential for further development.
Figure 1. The importance of agricultural production in Serbia compared to other countries in the region, the European Union and the average in the world, measured by the share of agricultural production in GDP in the period from 2000 to 2014.
Source: WB (2015).

1040 EP 2017 (64) 3 (1035-1047)
Vladimir Njegomir, Ljubo Pejanović, Zoran Keković
The data shown in the chart explicitly point to the fact that agriculture has enormous significance in Serbia in the previous period. At the beginning of observed period the role of agriculture was important but then decreased, but also at the end of period the importance of agricultural production, measured by the contribution of agriculture in gross domestic product is significantly higher than in other countries in the region, except for Macedonia and Montenegro, the average in the European Union or of the average in the world.
Environmental protection as a preventive measure for agricultural entrepreneurship
Concept development and the climate change problem associated with this concept which has negative effects on all areas, especially in the agriculture, is a complex, global, national and international phenomenon to who it is necessary to devote full attention. The current concept of “unsustainable development” is based on the paradigm of profit economy and the dominance of multinational companies. It basically involves environmental pollution. Environmental pollution can stem from many sources such as: chemicals, industrial wastes, radiation substances, dangerous pesticides, insecticides, nuclear waste, plastic products, and many others. Ecological destruction is a side effect of the current paradigm of development. So far, environment considered as free good (the gift of nature) is mercilessly exploited which left and leaves multiple negative consequences. Endangering the environment contributes to further jeopardizing of agricultural production through the impact of the climate change.
Economically ecological crisis is expressed as: (1) environmental degradation due to increased production based on the exploitation of energy resources and raw materials; (2) contamination of water, food and air; (3) due to shorten lifespan, reduction of working capacity and the basic conditions and parameters of lifr quality and(4) endangering natural environmental conditions (holes in the ozone layer, the greenhouse effect due to excessive CO2 emissions, energy and social entropy with the possibility of “heat death” of the planet Earth. Those effects have a negative impact on the performance and sustainability of entrepreneurship in agricultural production. Environmental protection is essential not only to the formal protection of the environment but also as a preventive measure to protect agricultural entrepreneurship.
In order to ensure environmental safety, it is necessary to realize the myriad conditions that are the basis for sustainable development of the environment and ecology and life in it. In order to accurately determine what constitutes a problem of environmental security it is necessary to point out the myriad of questions that structure the problem of ecological life with inevitable concepts such as: environment, ecological security and life in that area. In order to ensure environmental security and the life in the ecosystem, it is inevitable conditional rejection and prohibition of all forms of endangering the ecosystem. Preventive and repressive protection of ecosystems provides the conditions and quality of life on Earth and its ecosystem. The prohibition and elimination of the use and the use of dangerous chemical, biological, radiological and other hazardous substances in agriculture, to provide quality living conditions on the planet. The prohibition and elimination of the use and utilization of dangerous chemical, biological, radiological and

1041EP 2017 (64) 3 (1035-1047)
AGRICULTURAL ENTREPRENEURSHIP, ENVIRONMENTAL PROTECTION AND INSURANCE
other hazardous substances in agriculture provide quality living conditions on the planet. “Therefore, the basic and first-class condition is not to use dangerous resources in order to achieve adequate protection of ecosystems and life in it” (Marković, Pejanović, 2012).
The role of agricultural insurance in the protection of agricultural entrepreneurship
Agricultural insurance is a special type of insurance and it is part of property insurance. Insurance companies in the world and in our country, recognizing the specific nature of agriculture insurance, set up special departments to deal with this type of insurance or the acquisition of this type of insurance is left to specialized agencies.
The key role of insurance in agricultural production and society in general is indirect economic protection of life and property from the effects of natural forces and accidents. Insurance improves agricultural production because it makes entrepreneurial activity of agricultural producers more stable and more certain.
Insurance reduces the uncertainty of agricultural producers and the need to create individual saving accounts or funds, given that the need for cash reserves is reduced (Raulston, et al., 2010). By releasing the need for accumulation of surplus funds, which thanks to insurance can be profitably engaged, insurance further provides support for agricultural development (Njegomir, Pejanović, 2011).
Insurance represents indirect economic protection for destructive effects of natural forces and human activities but also represents a form of security pledge (collateral) that allows agricultural producers easier access to capital trough loans at lower costs. The exclusion of state subsidies for the payment of insurance premiums from the Free Trade Agreement from 1994 by World Trade Organization testifies about importance of agriculture insurance. Condition was that insurance provides financial compensation for the climate and natural disasters (Baez, Wong, 2007).
The analysis of agricultural insurance in Serbia
Taking into account its social and economic importance, insurance protection of agricultural production has special social interest in Serbia. An important place in the measures for the protection and promotion of agriculture takes insurance, in particular insurance:
• Crops, or plant production and
• Domestic and other types of animals.
Insurance is included in the great effort for the promotion and protection of plant production. Compensation covers everything destroyed with occurrence of the insured event fulfilling its important function of the economic protection of agricultural production.
Insurance of domestic animals gives our livestock substantial contribution to maintain the continuity of livestock production. It is equally important for the wider implementation of veterinary and sanitary measures in eliminating the causes that can cause damage and rescuing when the insured event has already occurred.

1042 EP 2017 (64) 3 (1035-1047)
Vladimir Njegomir, Ljubo Pejanović, Zoran Keković
The turning point in the development of the insurance market in Serbia was the adoption of the Insurance Act in 2004 and the allocation of supervisory jurisdiction to National Bank of Serbia. Changes in regulation and supervision of the insurance industry introduced order in the insurance market evidenced by the decline in the number of insurance companies from 38 in June 2004 to 17 at the end of 2006. This law, liberalization and market potential contributed to the arrival of foreign investors (Njegomir, Stojić, 2011). Today, most insurance companies in Serbia and in the region of the former Yugoslavia are majority foreign ownership (Njegomir, Stojić, 2010).
In Serbia, agricultural insurance market traditionally offers products of indemnified character and its application is in the form of crop and animal insurance. The dominant type of insurance in the structure of agriculture insurance premiums is insurance of crops and fruits. Characteristics of crop and animal insurance are almost identical for all insurance companies in Serbia. Also, to a large degree is returned confidence in the institution of insurance is restored to the great extent.
In the observed ten-year period of agriculture insurance development from 2004 to 2014, the premium of crop insurance has manifested a continuous upward trend until 2008, then in 2009 we had a significant drop due to the impact of the global economic crisis that began in IV quarter of 2008 (see table 1). In 2010, there was a slight but positive growth. Also, the end of the observed period is characterized by continued growth in premiums. The entire observed period in the field of crop insurance ends with significantly higher premium compared to 2004. Tendencies in the movement of the total insurance premiums of agriculture are fully consistent with the movement of the premium crop insurance, type of insurance whose share is dominant in the structure of agricultural insurance premiums. When it comes to the animals insurance, there was also an upward trend until 2008 and fall in 2009. In this type of agricultural insurance decline in the total volume of insurance premiums continued in 2010 and 2011. In 2012 was achieved a remarkable growth over 62% compared to the previous year, but already in 2013 there was a decline in the level of premiums and in 2014 there was a slight growth in premiums.

1043EP 2017 (64) 3 (1035-1047)
AGRICULTURAL ENTREPRENEURSHIP, ENVIRONMENTAL PROTECTION AND INSURANCE

1044 EP 2017 (64) 3 (1035-1047)
Vladimir Njegomir, Ljubo Pejanović, Zoran Keković
It is evident that agricultural insurance, a synthesis of crop and animal insurance, represents a negligible portion of the total premium of insurance companies in Serbia. The share of agriculture insurance in total insurance premiums of insurance companies in Serbia at the beginning of the observed period amounted 3.70% at the end 2.95%, while the lowest level of participation reached in 2010, when this share was only 1.48%. These figures imply that there is low demand for insurance, especially if these data are analyzed in combination with data on the number of insurance. However, this data should be considered in the context of the damage based on the share of claims on the agricultural insurance in total insurance losses of insurance companies. These figures are significantly different from the information on the premiums. Share of claims on the agricultural insurance in total claims of insurance companies in Serbia at the beginning of the observed period was 7.57% and 4.66% at the end, except that during the entire period of only five years was below 5%. It is evident that during the observed period, share of agricultural insurance in total insurance is disproportionately high. All this leads to conclusion about insufficient demand for insurance as well as the inevitable consequence of the lack of interest of insurance companies to develop insurance for this segment of its activities due to reduced profitability.
Finally, the loss ratio or technical result as one of the most significant indicators of profitability in the insurance business reflects the fact that, observed on average for all insurance companies in Serbia, agricultural insurance is unprofitable. The loss ratio represents the ratio of relevant damage and relevant retention premium. The relevant retention premium is retention premium realized in the current year increased by the amount of the premium in retention calculated at the end of last year and decreased by the amount of unearned premiums in retention calculated at the end of current year. Relevant claims in retention are total of resolved claims in retention during the current year increased by the amount of outstanding claims in retention at the end of the current year and the reduction of the amount of outstanding clams in retention at the end of previous year and the amount of collected recourse during the current year. Essentially, the loss ratio presents information to what extent the collected premiums were sufficient to cover any damage during given (observed) period. It is desirable that this ratio as low as possible, and if it is over 100% this actually means that the insurance company should pay for damages more than it collected insurance premiums.
The loss ratio in crop insurance theoretically speaking, throughout the period, with the exception of 2010 and 2013, indicated that the insurance companies in Serbia on the basis of this type of insurance achieved a positive result, and had access to certain premium surpluses compared to the damage. However, except for having expenses for claims, insurance companies have operating costs, which are especially high in the domain of agriculture insurance, and the fact that the average value of claim ratio in Europe is in the range from 60% to 70% of insurance premiums, it is clear that a bad claim ratio was made in 4 years and in other years that ratio was at the maximum level of the european average. The best result was achieved in 2012. In the animal insurance situation is significantly worse although throughout the observed period, loss ratio pointed to positive result in the operations of insurance companies in Serbia. Sublimated, the loss ratio in agriculture insurance from insurance companies in Serbia was also inadequate, especially in 2010.

1045EP 2017 (64) 3 (1035-1047)
AGRICULTURAL ENTREPRENEURSHIP, ENVIRONMENTAL PROTECTION AND INSURANCE
Conclusion
The development of an entrepreneurial culture in agricultural production is essential because it is often neglected, not only legally, but also in the practice of agricultural producers. Involvement of agricultural producers not only in primary agricultural production but also in processing of agricultural products as a whole or in a particular level is extremely important for the development of agriculture in Serbia as well as for development of rural areas. Development of agricultural production based on the improved profitability can enable the return of young people to agriculture.
The need for encouraging entrepreneurship is not only important in developing countries such as Serbia but also in the countries of the European Union. Entrepreneurship needs to be nurtured through the different stakeholders, above all, association of farmers, science and government agencies.
Every aspect of entrepreneurial activity is exposed to the effects of risk. In the definition of entrepreneurship provided by the European Commission is cited the risk exposure and the need for a willingness to accept risk. Acceptance of risk is just as important as the entrepreneurial spirit, creativity and innovation and by that it is meant the acceptance of the risk that entrepreneurs-agricultural producers are able to influence.
The risks for agricultural production imposed by climate change include the risks that require intervention. Preventive intervention is possible through the protection of the environment as well as through insurance. Agricultural insurance is the most important mechanism for the protection of entrepreneurial activity in agricultural production. Based on the existence of insurance in term of flood realization that is recorded in Serbia in 2014 and 2016, drought as it was in 2012, as well as precipitation with the hails that destroy crops such raspberry crops destroyed in 2016, entrepreneurial activities of agricultural producers are safer and more certain. Also, thanks to the existence of insurance increases the willingness of agricultural entrepreneurs to undertake business ventures.
Literature
1. Acs, Z.J. (2008): Foundations of High Impact Entrepreneurship. Foundations and Trends in Entrepreneurship, Vol. 4, No. 6, pp. 535-620.
2. Baez, M.S. and Wong, S. (2007): Insurance in emerging markets: sound development; greenfield for agricultural insurance. Sigma No 1/2007, Swiss Re, Zurich.
3. Birovljev, J. and Tomić, R. (2009): Menadžment u agrobiznisu. Ekonomski fakultet, Subotica.
4. Cantillon, R. (1931): Essai sur la nature du commerce en general. Edited and translated by Higgs, H. MacMillan, London.
5. Company Law (2015): Zakon o privrednim društvima, „Official Gazette of the RS”, no. 36/2011, 99/2011, 83/2014 – other Law.
6. Green Paper (2003): Entrepreneurship in Europe. Commission of the European

1046 EP 2017 (64) 3 (1035-1047)
Vladimir Njegomir, Ljubo Pejanović, Zoran Keković
Communities, COM(2003) 27 final, Brussels.7. Ireland, R.D., Webb, J.W. (2007): A Cross-Disciplinary Exploration of Entrepreneurship
Research. Journal of Management, Vol. 33, pp. 891–927.8. Law of Agriculture and Rural Development (2013): Zakon o poljoprivredi i ruralnom
razvoju, „Official Gazette of the RS “, no. 41/2009 and 10/2013 – other law.9. Law on Personal Income Tax (2015): Zakon o porezu na dohodak građana, „Official
Gazette of the RS’’, no. 24/01 , 80/02 – other law, 80/02, 135/04, 62/06, 65/06 - correction, 31/09, 44/09, 18/10, 50/11, 91/11 - US, 93/12, 114/12 - US, 47/13, 48/13 - correction, 108/13, 57/14, 68/14 – other law, 112/15.
10. Marković, S., Pejanović, Lj. (2012): Zaštita životne sredine. Fakultet za pravne i poslovne studije dr Lazar Vrkatić, Novi Sad.
11. McElwee, G. (2005): Developing entrepreneurial skills of farmers: Literature review of entrepreneurship in agriculture. The report pruduced with financial support form the Commmission of the European Community, Brussels.
12. MFRC (2016): Ministarstvo finansija Republike Sribije, http://www.mfin.gov.rs/UserFiles/File/misljenja/2013/Objasnjenje%20vodjenje%20poslovnih%20knjiga(1).pdf (accessed 08.06.2016.)
13. Njegomir, V., Pejanović, R. (2016): Climate change risks, agricultural production, and the role of insurance. Ekonomika poljoprivrede, accepted for publication.
14. Njegomir, V., Pejanović, R. (2011): Importance and current issues in agricultural insurance in Serbia. Contemporary Agriculture, Vol. 60, No. 1-2, pp. 38-45
15. Njegomir, V., Stojić, D. (2010): Determinants of insurance market attractiveness for foreing investments: the case of ex-Yugoslavia. Economic Research, Vol. 23, No. 3, pp. 96-110.
16. Njegomir, V., Stojić, D. (2011): Liberalisation and market concentration impact on performance of the non-life insurance industry: the evidence from Eastern Europe. The Geneva Papers on Risk and Insurance - Issues and Practice, Vol. 36, No. 1, pp. 94-106.
17. Petrović, Z., Njegomir, V., Počuča, S. (2013): Characteristics of agricultural insurance: the case of countries of former Yugoslavia region. Ekonomika poljoprivrede, Vol. 60, No. 4, 2013, pp. 729-745.
18. Raulston, J.M., Richardson, J.W., Outlaw, J.L., Knapek, G.M. (2010): Does Crop Insurance Reduce the Need for Cash Reserves in Savings Accounts? Paper presented at the SAEA Annual Meeting, Orlando, FL.
19. Schumpeter, J A. (1934): The Theory of Economic Development. Harvard University Press, Cambridge, MA.
20. Stefanović, R., Obradović, S., Broćić, Z. (2012): Perspektive i razvojni izazovi preduzetništva u poljoprivredno-prehrambenom sektoru Republike Srbije. Učenje za poduzetništvo, Vol. 2, No. 2, pp. 371-380.
21. Tyszka, T., Cieslie, J. Domurat, A., Macko, A. (2011): Motivation, Self-Efficacy, and
1047EP 2017 (64) 3 (1035-1047)
AGRICULTURAL ENTREPRENEURSHIP, ENVIRONMENTAL PROTECTION AND INSURANCE
Risk Attitudes Among Entrepreneurs During Transition to a Market Economy. Journal of Socio-Economics, Vol. 40, No. 2, pp. 124–131.
22. WB (2015): World bank, http://data.worldbank.org/indicator/NV.AGR.TOTL.ZS/countries (accessed 15.06.2015.)
PREDUZETNIŠTVO U POLJOPRIVREDI, EKOLOŠKA ZAŠTITA I OSIGURANJE
Vladimir Njegomir4, Ljubo Pejanović5, Zoran Keković6
Rezime
Preduzetništvo u poljoprivredi je u osnovi kreativnosti, inovativnosti, profitabilnosti i upravljanja rizicima poljoprivrednih proizvođača. Iako se preduzetništvo u poljoprivredi često zanemaruje u Srbiji, u radu naglašavamo njegov značaj s obzirom na činjenicu da je doprinos poljoprivrede još uvek najveći za bruto domaći proizvod. Tekuća 2016. godina proglašena je za godinom preduzetništva u Srbiji, što je dodatno naglasilo značaj izučavanja ove problematike. Za cilj rada smo odredili potrebu izučavanja preduzetništva u poljoprivredi u kontekstu ugroženosti rizicima iz okruženja. U tom smislu, u radu prvo ukazujemo na preduzetništvo u poljoprivredi i značaj poljoprivredne proizvodnje u Srbiji a potom ukazujemo na ekološku zaštitu, kao oblika preventivnog delovanja na redukciju rizika i osiguranje, kao oblika finansiranja posledica ostvarenja šteta i karakteristike osiguranja poljoprivrede u Srbiji. Osnovni zaključak je da ekološka zaštita i osiguranje poljoprivrede predstavljaju komplementarne mehanizme zaštite od rizika koji pružaju značajnu podršku preduzetništvu u poljoprivredi i razvoju poljoprivredne proizvodnje.
Ključne reči: poljoprivreda, preduzetništvo, klimatske promene, osiguranje, Srbija.
4 Vanredni profesor, dr Vladimir Njegomir, Fakultet za pravne i poslovne studije dr Lazar Vrkatić, Bulevar oslobođenja br. 76, 21000 Novi Sad, Srbija, Telefon: +381 64 139 30 05, E-mail: [email protected]
5 Vanredni profesor, dr Ljubo Pejanović, Fakultet za pravne i poslovne studije dr Lazar Vrkatić, Bulevar oslobođenja br. 76, 21000 Novi Sad, Srbija, E-mail: [email protected]
6 Redovni profesor, dr Zoran Keković, Univerzitet u Beogradu, Fakultet Bezbednosti, Ulica Gospodara Vučića br. 50, 11040 Beograd, Srbija, Telefon: +381 69 123 02 65, E-mail: [email protected]

1049
Original scientific paper Economics of Agriculture 3/2017UDC: 366.622:631.147(497.11)(497.5)
EP 2017 (64) 3 (1049-1064)
CONSUMERS ATTITUDES ON ORGANIC FOOD IN SERBIA AND CROATIA: A COMPARATIVE ANALYSIS
CONSUMERS ATTITUDES ON ORGANIC FOOD IN SERBIA AND CROATIA: A COMPARATIVE ANALYSIS
Nenad Perić1, Andrijana Vasić Nikčević2, Nenad Vujić3
Summary
The aim of this study was to investigate the association between socio-demographic variable and attitudes of respondents from Serbia and Croatia towards organic food. Consumers around the world have a positive attitude towards organic food without particular differences between various socio-demographic variables. However, the level of organic food consumption is low - organic farming covers 1% of agricultural land. High price and low income of respondents represent the basic limiting factors. The economic factor is especially important for the markets of Serbia and Croatia. Also, a lack of information and trust in the organic production and organic certificates constitute part of the decision in purchase. Therefore, manufactures of organic products needs marketing activities to build a recognizable brand and develop trust among consumers. Also, consumers have shown a high degree of self-awareness in making decisions about the purchase of organic products, which makes brand communication at the point of sale very important.
Key words: organic food consumption, consumer’s attitude, decision making processJEL: Q13, M31
Introduction
The concept of organic agriculture can be defined as “an ecological production management system that promotes and enhances biodiversity, biological cycles, and soil biological activity” (Cooley, R. et al, 2012). In other word, in organic agriculture there is an absence of any kind of non-natural growth regulators such as pesticides, genetically modified organism or conventional chemical inputs. Other authors believe that concept of organic agriculture should be define through its goals. Golijanin states that primary concern of organic agriculture is sustainable production of healthy and
1 Nenad Perić Ph.D., Associate Professor, Metropolitan University, Tadeuša Košćuška Street no. 63, 11000 Belgrade, Serbia, Phone: +381 11 20 30 885, E-mail: [email protected]
2 Andrijana Vasić-Nikčević M.Sc., Assistant, Metropolitan University, Tadeuša Košćuška Street No. 63, 11000 Belgrade, Serbia, Phone: +381 11 20 30 885, E-mail: [email protected]
3 Nenad Vujić Ph.D., Science Fellow, Economics Institute, Kralja Milana Street no. 16 Belgrade, Serbia, Phone: +381 11 36 13 417, E-mail: [email protected]
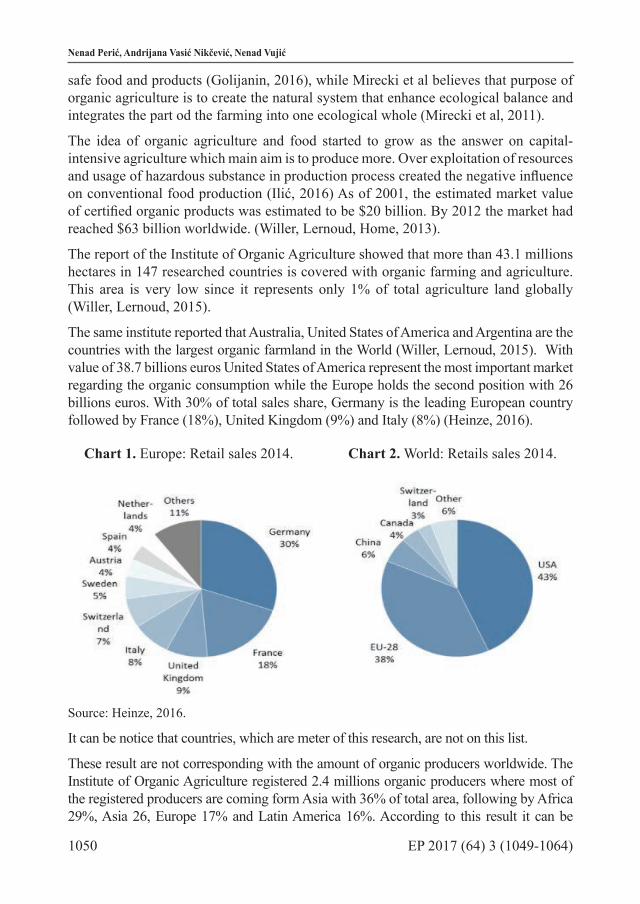
1050 EP 2017 (64) 3 (1049-1064)
Nenad Perić, Andrijana Vasić Nikčević, Nenad Vujić
safe food and products (Golijanin, 2016), while Mirecki et al believes that purpose of organic agriculture is to create the natural system that enhance ecological balance and integrates the part od the farming into one ecological whole (Mirecki et al, 2011).
The idea of organic agriculture and food started to grow as the answer on capital-intensive agriculture which main aim is to produce more. Over exploitation of resources and usage of hazardous substance in production process created the negative influence on conventional food production (Ilić, 2016) As of 2001, the estimated market value of certified organic products was estimated to be $20 billion. By 2012 the market had reached $63 billion worldwide. (Willer, Lernoud, Home, 2013).
The report of the Institute of Organic Agriculture showed that more than 43.1 millions hectares in 147 researched countries is covered with organic farming and agriculture. This area is very low since it represents only 1% of total agriculture land globally (Willer, Lernoud, 2015).
The same institute reported that Australia, United States of America and Argentina are the countries with the largest organic farmland in the World (Willer, Lernoud, 2015). With value of 38.7 billions euros United States of America represent the most important market regarding the organic consumption while the Europe holds the second position with 26 billions euros. With 30% of total sales share, Germany is the leading European country followed by France (18%), United Kingdom (9%) and Italy (8%) (Heinze, 2016).
Chart 1. Europe: Retail sales 2014. Chart 2. World: Retails sales 2014.
Source: Heinze, 2016.
It can be notice that countries, which are meter of this research, are not on this list.
These result are not corresponding with the amount of organic producers worldwide. The Institute of Organic Agriculture registered 2.4 millions organic producers where most of the registered producers are coming form Asia with 36% of total area, following by Africa 29%, Asia 26, Europe 17% and Latin America 16%. According to this result it can be

1051EP 2017 (64) 3 (1049-1064)
CONSUMERS ATTITUDES ON ORGANIC FOOD IN SERBIA AND CROATIA: A COMPARATIVE ANALYSIS
concluded that almost 80% of organic producers are coming from developing countries and emerging markets (Wiler, Lernoud, 2017). Furthermore, in 1999, when this institute started to measure the organic agriculture development, there were only 200.000 organic producers. One of the reasons might be explained through the number of unemployment people in developing countries who see the organic farming as the good opportunity for business development. This paper will also reveal the attitude of the people in Croatia and Serbia about Organic farming potentials.
Organic Market in Serbia and Croatia – Purchase Intention
Total amount of organic agricultural land in Serbia in 2016 was proximally 15,298.02 hectares, which represents the 0.44% of total agriculture land (Simić, 2016). Even though these figures are very low they represent significant growth if we compere this result with research conducted by in 2014 (Willer, Lernound, 2014). According to their results total amount of organic agriculture in Serbia was 9,548 hectares while the value of the organic retail market was nearly 35 millions euros. Compering with the figures in Croatia where 76,000 hectares of land is covered with organic agriculture, organic market in Serbia is still on the beginning (Willer, Lernoud, 2015). Indeed, Table 1. and Table 2. showed that Serbian market is undeveloped compering with the both European and Regional organic markets. However the rise of the organic farming and producers in last decade is noteworthy with 1,281 organic producers (Willer, Lernoud, 2014). The market’s growth of organic food is limited due to insufficient production and offer, so that there is significant market potential (Mitić, Gligorijević, 2012).
Table 1. A comparative overview of the indicators of organic food market development in Serbia and in select developed countries 2014.
Country Area (ha) Share of all agr. land (%)
Producers (no.)
Retail sales (million €) €/person
Serbia 9,548 0.2 1,281 35 (2012) 4.4 (2012) Austria 525,521 19.4 22,184 1,065 127 Denmark 165,773 6.3 2,565 912 162 Germany 1.047,633 6.3 23,398 7,910 97 Italy 1.387,913 10.8 48,662 2,145 35 France 1,118,845 4.1 26,466 4,830 73 United Kingdom 521,475 3 3,526 2,307 36
Sweden 501,831 16.4 5,406 1,402 145 Netherlands 49,159 2.5 1,706 965 57
Source: Willer, Lernoud, 2014, 2016.

1052 EP 2017 (64) 3 (1049-1064)
Nenad Perić, Andrijana Vasić Nikčević, Nenad Vujić
Table 2. A comparative overview of the indicators of organic food market development in Serbia and countries in the Region 2014.
Country Area (ha) Share of all agr. land (%)
P r o d u c e r s (no.)
Retail sales (million €) €/person
Serbia 9,548 0,2 1.281 35 (2012) 4.4 (2012) Romania 289,252 2.1 14,159 80 4 Croatia 50,054 3.8 2,194 99 23 Hungary 124,841 2.7 1,672 25 2 Bulgaria 74,351 2.4 3,893 7 1 Montenegro 3,289 0.6 167 0 0 Bosnia and Herzegovina 353 0.02 24 2 0
Macedonia 3,146 0.3 382 - - Albania 515 0.04 39 - -
Source: Willer, Lernoud, 2014, 2016.
In Table 2. we can also see the average value of organic product consumption per capita in both countries. With 4.4 euros per capita organic consumption in Serbia is very low compering with Croatia. Many authors, (Vlahović et al., 2011; Kalentić et al, 2014; Vehapiju, 2015) believes that reasons for low level of consumption are following: low average income, undeveloped distribution, lack of product variety, inappropriate labeled products and low level of information about importance of organic production among consumers. Truly, the low income tent to be the reason number one for low consumption especially if we compare the average income in Serbia with average income in Croatia; 405 euros and 790 euros respectively. Moreover, Vehapi reveals that 80.9% of consumers in Serbia is willing to pay a 30% higher price for organic food while the only 5.7% of them is willing to pay 100% higher price (Vehapi, 2015). This finding indicates high price elasticity on Serbian market. Similarly, the research conducted in Croatia shows that 61% of examinee describes price as important or most important purchase indicator while 70.0% of the respondents stated they would purchase more organic food if its price were lower (Stipčević, et al, 2011). However, many researches in both countries pointed out that mistrust in concept of organic food represent the main reason for low level of consumption (Zakowska-Biemans, 2011; Vlahović et al, 2011). Vehapi research shows that almost 38% of examinee doubt in the concept of organic food consumption (Vehapi, 2015). The research conducted in Croatia showed that consumers equalize organically grown food with traditionally grown food or “healthy” food (Stipčević, et al, 2011). Similarly, Roitner-Schobesberger et al found that many supermarkets on their shelves do not make a clear differentiation between health food and organic food (Roitner-Schobesberger et al 2008). That is why consumers do not make difference between terms such as: “safe food”, “healthy food”, “pesticide free”, “chemical free” and “high quality food”. As the result, they consider healthy food and organic food as synonyms (Lockie, 2006; Gifford, Bernard, 2011). These data point to the importance of informing about organic food. Lack of knowledge about the concept of organic farming and its benefits affect the level of trust. Additionally, same author believes that distrust of consumers in organic products is
1053EP 2017 (64) 3 (1049-1064)
CONSUMERS ATTITUDES ON ORGANIC FOOD IN SERBIA AND CROATIA: A COMPARATIVE ANALYSIS
associated with their skepticism about certification authorities and organic regulations. Aerset et al. indicate that the lack of confidence in the organic production certificate is present in many countries and has significant negative effects on demand in the purchase of organic products (Aerset et al. 2004).
The rest of this paper will present results that indicate the importance of the media on consumer’s attitudes toward organic consumption.
The Aim of Research
As it was mentioned in the beginning of this article the main aim of this research is to identify the differences among Serbian and Croatian consumers towards organic food consumption. The research investigated the association between socio-demographic variables such as gender, age, employment status, level of education and monthly income. The null hypothesis of this study was related with the general perception toward organic food consumption between Serbian and Croatian consumers.
(H0): Consumers in Croatia are more interested in organic food consumers than consumers in Serbia.
The reason for setting up this hypothesis can be found in results of Willer and Lernound studies (Willer, Lernound 2014, 2015, 2017) research that reveals the significant difference between organic market value between these two markets. Additionally, previous researches show that there is certain level of distrust and misunderstanding among organic food concept. Consumers tent to make no differences between organically grown and traditionally grown food or “healthy” food. Hence, the aim of this research is to examine the importance of media on consumer’s attitude towards organic concept and to prove the validity of the hypotheses H1.
(H1): Media has significant impact on consumers attitudes towards organic food consumption.
Finally, the profile of the consumers is essential for understanding any marketing phenomena. Previous research that examined the attitude of men and women toward organic foods showed that women have a more favorable relationship (which is related to their way of life) to buying and consuming organic foods compared to men, while men tend to pay a higher price for organic food in comparison with women (Shafie, Rennie, 2009) Therefore, this research will define the profile of Serbian and Croatian organic food consumer and examine the validity of hypothesis (H2).
(H2): Woman tends to consume more organic food than men.
Research MethodsThis study used the quantitative methods of research, which was conducted through a questionnaire in which the first part of the issues was related to socio-demographic information about the respondent, while in the second part of research a group of dependent variables was operationalized through the questions with closed answers and statements - Likert assessment scale. The examinees were evaluated to what extent they agree with the claims

1054 EP 2017 (64) 3 (1049-1064)
Nenad Perić, Andrijana Vasić Nikčević, Nenad Vujić
regarding attitudes towards organic food. The research in Serbia involved 260 respondents, of which 124 were male (47.7%) and 136 were female (52.3%) female. The same number of respondents (260) also participated in the research in Croatia, with 93 respondents (35.8%) of male and 167 respondents (64.2%) of women.For data analysis, this research used: a descriptive analysis (percentages, arithmetic mean), the chi-square test, t-test, ANOVA, multiple linear regression and Pearson correlation coefficient. The level of significance was set at p <0.05, and all data were processed in SPSS.
Research Results
The results shows that greatest number of respondents in Serbia (36.9%) said that they do not relay on organic food products in their regular food consumption while the respondents from Croatian sample expressing different views. Better part of the surveyed respondents (44.2%) said that they relay on organic food products in their nutrition. Similarly t-test showed that the subjects are different in respect to the use of organic feed in their nutrition t (518) = 2.08, p <0.05, the results show that respondents of Croatian (3.14) consume organic food more than the respondents from Serbia (2.94). These results were expected and they are consistent with the previous similar studies conducted by Willer and Lernoud in 2014 and 2016. Hence it can be concluded that these result confirmed the null hypothesis H0 according to consumers in Croatia consume more organic product that consumers in Serbia.
However, greater importance for this work represents the results that tell us how consumers are looking for information about organic food. The research observed the influence of media regarding decision-making process. Similarly the great importance is the understanding of the level of trust that consumers have towards a particular source of information. This kind of information will enable marketing professionals to deliver information on organic food more successfully and thus influence the increase in its consumption.
Research result shows that more than half of Serbian respondents (58.4%) do not actively look for information on new organic products. Additionally, 58.5% of respondents believe that information from the media have no influence on their decision to purchase organic food, while 13.8% believe that the requested information have an impact on their decision. Moreover, in the case of testing the level of trust the research showed high level of mistrust towards media and advertising as a source of information. According to research results 57% of Serbian respondents do not trust the information from the media, while 63% od examine do not believe advertising on organic food.
Although the level of consumption of organic food in Croatia is significant, Croatian consumers do not search for information about new organic products suggestively. Similar to the results from the Serbian sample, almost half of the respondents do not actively search for information about organic products (45.8%). On the other hand, more respondents from the Croatian sample believes that media have an impact on the decision-making process (29.6%), while the level of mistrust in the media and a advertising as a source of information is also significant, 45,4% and 49,6% respectively.

1055EP 2017 (64) 3 (1049-1064)
CONSUMERS ATTITUDES ON ORGANIC FOOD IN SERBIA AND CROATIA: A COMPARATIVE ANALYSIS
Using T-Test the research showed interesting result regarding the organic food information search. The T-Test results show that there are significant differences among the respondents in the Serbian sample when it comes to actively seeking information on new organic products. The results showed that subjects older than 65 years (2.75) search more actively information than other groups of respondents, while the respondents younger than 20 years showed low level of interest for new information. (2.00). Even though the older consumers seek for the information about organic food the most, they do not represent prime target audience. This result can be affected with fact that respondent over 65 are retired and they have more free time. The difference was also found in the Croatian sample and the results show that respondents aged between 41 and 50 (3.08) are more active than other groups, The respondents with the lowest interest for the new information are older than 65 (1.50).
When we look at average values of answers on the scale examined the ratio of respondents towards organic food, the results show that respondents from both samples agree with the statement “I believe advertising on organic food” and “I believe the information from the media about organic food” at least.
Table 3 and 4. values from both samples.
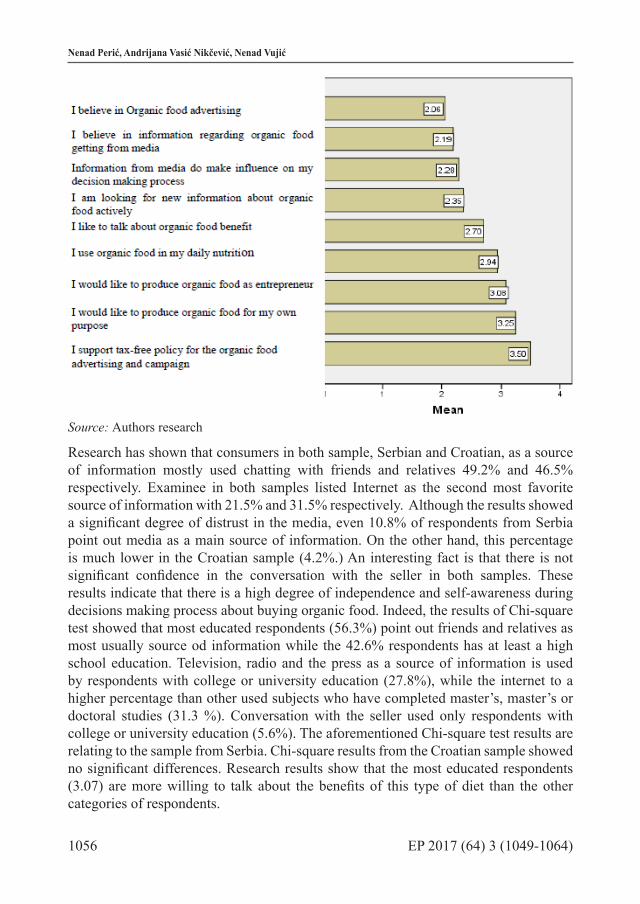
1056 EP 2017 (64) 3 (1049-1064)
Nenad Perić, Andrijana Vasić Nikčević, Nenad Vujić
Source: Authors research
Research has shown that consumers in both sample, Serbian and Croatian, as a source of information mostly used chatting with friends and relatives 49.2% and 46.5% respectively. Examinee in both samples listed Internet as the second most favorite source of information with 21.5% and 31.5% respectively. Although the results showed a significant degree of distrust in the media, even 10.8% of respondents from Serbia point out media as a main source of information. On the other hand, this percentage is much lower in the Croatian sample (4.2%.) An interesting fact is that there is not significant confidence in the conversation with the seller in both samples. These results indicate that there is a high degree of independence and self-awareness during decisions making process about buying organic food. Indeed, the results of Chi-square test showed that most educated respondents (56.3%) point out friends and relatives as most usually source od information while the 42.6% respondents has at least a high school education. Television, radio and the press as a source of information is used by respondents with college or university education (27.8%), while the internet to a higher percentage than other used subjects who have completed master’s, master’s or doctoral studies (31.3 %). Conversation with the seller used only respondents with college or university education (5.6%). The aforementioned Chi-square test results are relating to the sample from Serbia. Chi-square results from the Croatian sample showed no significant differences. Research results show that the most educated respondents (3.07) are more willing to talk about the benefits of this type of diet than the other categories of respondents.
1057EP 2017 (64) 3 (1049-1064)
CONSUMERS ATTITUDES ON ORGANIC FOOD IN SERBIA AND CROATIA: A COMPARATIVE ANALYSIS
Furthermore, research result showed differences in the relation to gender. Men employ chatting with friends and relatives as a source of information more than woman (61.3%). Additionally, 12.9% of male respondents listed television, radio and the press as a source of information compared to 8.8% of female respondents. On the other hand, women increasingly use the Internet 23.5% compared to 19.4% of male respondents. Chatting with sellers, according to the results is reserved for women only, and it does not make any man.
Based on the analysis of the above results, it can be concluded that the research did not prove the existence of hypothesis H1. In other words, research showed that media does not have any significant influence on the decision-making process on the organic food purchase among Serbian and Croatian consumers.
The research has also shown that there are differences between consumer attitudes towards organic food production for both their own needs and for the needs of starting their own business. Almost 65% of the respondents from Croatia would deal with the production of organic foods, while about 53% of the respondents would start their own business with the production of organic foods. These percentages are somewhat smaller in Serbia, where about 47% of respondents would be engaged in the production of organic food for their own needs, while 30% of respondents would consider organic food production as entrepreneurship. Additionally, research identified significant differences between socio-demographic factors between respondents in Serbia. Respondents between the ages of 51 and 65 (3.75) were more likely to deal with the abovementioned production with the aim of starting their own business. On the other hand, retirees and the unemployed respondents between the ages of 41 and 50, to a greater extent than other groups, would deal with the mentioned production for their own needs. There was no significant difference regarding socio-demographic factors in the Croatian sample.
In order to examine the hypothesis H2 the study used the T-Test. The T-test examined whether there was a difference between respondents of different sexes (in Serbian and Croatian samples) in responses to dependent variables in which the ratio of respondents to organic foods was assessed. Following generally accepted opinion that women are more aware of their appearance and therefore about their health, the starting point was that women consume more organic food than men. Unpredictably, T-test in Serbain sample shows that respondents differ in the use of organic food in their own nutrition in favor of man (results show that men consume organic food (3.13) more than women (2.76)), The differences between the respondents in the Serbian sample were also found in the influence of information from the media on the decision of the respondents to purchase organic foods. The results show that the mentioned information has a lesser impact on women (2, 15) than on men (2.43). Furthermore, the test showed that women (2.50) are less likely to talk about the benefits of organic food compering to man (2.93).
In the Croatian sample, the T-test showed that the respondents differ only in agreeing with the claim “I believe in media information on organic foods” (258) = 2.13, p <0.05,
1058 EP 2017 (64) 3 (1049-1064)
Nenad Perić, Andrijana Vasić Nikčević, Nenad Vujić
and the results show that women (2.50) less than men (2.77) believe this information. In other variables there were no statistically significant differences between subjects of different sexes.
At the end of the analysis of research result it can be concluded that research did not prove the hypothesis H2 either. The primary Serbian organic food consumer is mid age or older well-educated family men who seek the information regarding organic food chatting with his friends. The Croatian research did not found any significant differences among sexes. However, typical organic food consumer is between 41 and 50 years old who uses conversation with its friends as a basic means of information.
Conclusion
The presented research was intended to examine whether there are some differences between Serbian and Croatian consumers attitudes when it comes to organic food consumption. Three hypotheses were laid out as starting premise, from which the research proved only null hypothesis H0 that consumers from Croatia have a more positive attitude to organic food conjugation than consumers in Serbia. The other two hypotheses concerning the importance of the media to the decision-making process as well as defining the profile of organic food consumers have not been proven. When it comes to the importance of the media, the research showed an extremely high degree of non-confidence in the media in both samples. Also, as the most common means of informing about new products and benefits of organic food, the respondents of both markets cited conversation with friends and relatives. When it comes to differences between respondents regarding their demographic characteristics, the results show that there are no statistically significant differences in the sample in the Croatian sample. On the other hand, the results in Serbia show that there are statistically significant differences between the respondents and that well educated employed men, in the fifth decade of life, with higher personal income and five member household are most frequently informed about organic food through interviews with friends, colleagues, relatives and the like.
Such results are important for marketing experts because they point to the importance of the point of sale when it comes to informing about organic products. Indeed, in the literature review, we have seen that previous research shows a certain degree of incomprehension of the concept of organic food and a situation in which consumers identify organic foods with healthy foods.
T test and Anova showed that subjects in both samples could differ significantly in terms of their relationship toward organic food. The results in Serbia show interesting fact that men have more positive attitude towards organic food than women. Moreover they consume more organic food products than women in their regular nutrition. When it comes to the decision making process, information from the media has a greater impact on them, and they are willing to talk about the benefits of organic food to grater extent. In the Croatian sample, the T-test showed that the difference between the respondents

1059EP 2017 (64) 3 (1049-1064)
CONSUMERS ATTITUDES ON ORGANIC FOOD IN SERBIA AND CROATIA: A COMPARATIVE ANALYSIS
is only in the claim “I believe in information from the media on organic food”, and the results showed that women less than men believe this information.
These results can also be significant for marketing professionals because most of the communication is about healthy nutrition is directed at women. After this analysis, it can be concluded that communication has to be focus on the men as well.
When it comes to differences in respondents from the spice and Croatian samples, the research showed that respondents differ in terms of the use of organic food in their own diet, and that respondents from Croatia rely on organic food products more than the respondents from Serbia. The results also show that there are differences between the respondents regarding the active search for information on new organic products and that respondents in Serbia, to a lesser extent than the respondents in Croatia, are actively informed about the mentioned.
Significant differences between the respondents are also obtained when it comes to the influence of information from the media on the decision of the respondents on the purchase of organic foods, and the results show that the information to a lesser extent influences respondents in Serbia. Similarly, the research showed that level of trust towards advertising is lower among Serbian consumers. In other variables there were no statistically significant differences between the respondents from the Serbian and Croatian samples.
Table 5. Interconnectedness of dependent variables on the Serbian sample1 2 3 4 5 6 7 8 9
1 1 .650** .475** .422** .254** .691** .326** .377** .396**
2 1 .550** .383** .265** .708** .352** .447** .522**
3 1 .750** .565** .606** .350** .329** .366**
4 1 .838** .551** .121 .161* .244**
5 1 .504** .086 .093 .284**
6 1 .424** .470** .585**
7 1 .225** .292**
8 1 .780**
9 1
Source: Authors research *p<0,05 **p<0,01
Table 6: Interconnectedness of dependent variables on the Croatian sample1 2 3 4 5 6 7 8 9
1 1 .685** .461** .353** .334** .606** .326** .487** .322**2 1 .467** .338** .344** .664** .284** .395** .351**3 1 .669** .611** .497** .255** .256** .328**4 1 .803** .371** .199** .167** .273**5 1 .419** .222** .232** .306**

1060 EP 2017 (64) 3 (1049-1064)
Nenad Perić, Andrijana Vasić Nikčević, Nenad Vujić
6 1 .326** .332** .317**7 1 .222** .250**8 1 .620**9 1
Source: Authors research *p<0,05 **p<0,01
At the end of the paper we can conclude that the biggest difference between consumers in Serbia and Croatia is in the level of trust in the media and organic food advertisements. Based on these results, it can be concluded that the media have a certain degree of influence on consumers in Croatia and that marketing experts can rely on the media in order to affect consumers. On the other hand, consumers in Serbia have very little confidence in advertising and the media in general, why the marketing experts should put emphasis on the point of sale and clear brand communication at the point of sale as well as on the various Internet trough communication (sites, blogs, social networks, etc.). The authors suggest that marketers from both countries should use the study findings to develop specific marketing strategies for positioning, communication, pricing and distribution of organic food brands and products. The study is acknowledged as exploratory and a useful foundation for further research that should be concluded to find broader dependences and specifics.
References
1. Aerset B., Beckmann S., Bigne E., Beveridge M., Bjorndal T., Bunting J., McDonagh P., Mariojouls C., Muir J., Prothero A., Reisch L., Smith A., Tveteras R., Young J. (2004): The European consumers understanding and perceptions of the “organic” food regime The case of aquaculture, British Food Journal, Vol. 106, No. 2, pp. 93-105, Emerald Publishing Limited, Great Britain
2. Aryal, P., Chaudhary, P., Pandit, S., Sharma, G. (2009): Consumers’ willingness to pay for organic products: a case from Kathmandu valley, Journal of Agriculture and Environment, Vol. 10, pp. 15-26, Government of Nepal, Ministry of Agricultural Development, Food Security and Environmental Division, Kathmandu, Nepal, available at: http://www.nepjol.info/index.php/AEJ/issue/view/163
3. Brčić-Stipčević, V., Petljak, K., Guszak, I. (2011): Empirical research of attitudes towards organic food among Croatian consumers, Entrepreneurship and Macroeconomic Management: Refl ections on the World in Turmoil’, March 24-
4. Vol. 2, 2011, pp. 1376-1405, Pula, Croatia5. Brčić-Stipčević (2011): Research in organc food purchase in Croatia, Tržište, Vol.
XXIII, No. 2, pp. 189-207, Zagreb, Croatia, available at: https://www.google.rs/url?sa=t&rct=j&q=&esrc=s&source=web&cd=3&cad=rja&uact=8&ved=0ahUKEwitoOLDxPnUAhXkDZoKHbkRAQ4QFggyMAI&url=http%3A%2F%2Fhrcak.srce.hr%2Ffile%2F117265&usg=AFQjCNExyt0XWAqxwxoyCKaLzcvpvUi-VA
6. Cooley, R. et al (Eds.) (2012): New England Tree Fruit Management Guide, Cornell

1061EP 2017 (64) 3 (1049-1064)
CONSUMERS ATTITUDES ON ORGANIC FOOD IN SERBIA AND CROATIA: A COMPARATIVE ANALYSIS
University, Ithaca., USA, available at: https://ag.umass.edu/fruit/2012-new-england-tree-fruit-management-guide
7. Farah Ayuni Shafie, Denise Renni, (2009): Consumer Perceptions towards Organic Food, 14-15 November 2009, Procedia - Social and Behavioral Sciences, pp. 360-367, Universiti Teknologi MARA, Selangor, Malaysia, available at: http://ac.els-cdn.com/S1877042812031308/1-s2.0-S1877042812031308-main.pdf?_tid=3d200698-630d-11e7-b53d-00000aacb35f&acdnat=1499429597_da60f210c4f21da3d7b629c0a54eec40
8. Golijanin J. (2016): Motives affecting purchasing organic food products, Agroeconomic, Vol. 45. No. 72, pp. 73-81, Poljoprivredni fakultet Univerziteta u Novom Sadu, Novi Sad, Serbia, available at: http://agroekonomika.rs/index.php/2-uncategorised/8-agroekonomika-br-72
9. Gifford, K., Bernard, J., (2010): The effect of information on consumers’ willingness to pay for natural and organic chicken, International Journal of Consumer Studies, Vol. 34, No. 6, pp. 619-626, John Wiley & Sons Ltd, New York, USA, available at: http://onlinelibrary.wiley.com/doi/10.1111/j.1470-6431.2010.00870.x/pdf
10. Heinze, K., (2016): European organic market grew to more than 26 billion euros in 2014, Organic-Market.Info, available at: http://organic-market.info/news-in-brief-and-reports-article/european-organic-market-grew-to-more-than-26-billion-euros-in-2014.html
11. Jensen, D., Denver, S., Zanoli, R. (2011): Actual and potential development of consumer demand on the organic food market in Europe, Vol. 58, No. 3, pp. 79-84, NJAS-Wageningen Journal of Life Sciences, Elsevier, Amsterdam, Holland
12. Ilić I., (2016): Analysis of consumption of organic products in Nišava district, Ekomonika, Vol. 62, No. 2., pp. 167-178, Društvo ekonomista Niš, Niš, Serbia, available at: http://www.ekonomika.org.rs/sr/PDF/ekonomika/2016/Ekonomika-2016-2.pdf
13. Kalentić, M., Stefanović, E., Simić I., Мarz, U. (2015): Organska poljoprivreda u Srbiji 2014, Nacionalna asocijacija za organsku proizvodnju Serbia Organica, Belgrade, Serbia, available at: http://www.kombeg.org.rs/Slike/CeTranIRazvojTehnologija/2015/jun/Organska%20 poljoprivreda%20u%20Srbiji%202014.pdf
14. Kranjac , M., Vapa-Tankosić, J., Knežević, M. (2017): Profile of Organic Food Consumers, Economics of Agriculture, Year 64, No. 2, pp. 497-514, NDAEB, Beograd, Serbia, available at: http://bsaae.bg.ac.rs/images/Ekonomika%20kompletna/2017/EP%202%202017%20lq.pdf
15. Lockie, S., Halpin, D., Gordon, R. (2006): Understanding the market for organic food. In: Kristiansen, P., Taji, A., Reganold, J., editors. Organic Agriculture – A Global Perspective. 1st edition, pp. 245-259, Cabi Publishing, Wallingford, Great Britain
16. March, U., Kalentić, M., Stefanović, E., Simić, I. (2013): Organska poljoprivreda17. u Srbiji 2013, Nacionalna asocijacija za organsku proizvodnju Serbia Organica,
Beograd, Serbia, available at: http://www.serbiaorganica.info/wp-content/

1062 EP 2017 (64) 3 (1049-1064)
Nenad Perić, Andrijana Vasić Nikčević, Nenad Vujić
uploads/2013/01/OPS_FINAL_srb.pdf18. Mitić, S., Gligorijević, M. (2012): Globalni izazovi i perspective marketinga proizvoda
zdrave hrane, Marketing, Vol. 43, No. 3, pp. 205-218, SeMA – Srpsko udruženje za Marketing Ekonomski fakultet u Beogradu, Beograd, Serbia, available at: http://www.sema.rs/repository/download/marketing-vol-43-no-3.pdf
19. Mirecki, N., Wehinger, T & Jaklič, M. (2011): Priručnik za organsku proizvodnju, Biotehnički fakultet Podgorica, Podgorica, Montenegro
20. Roitner-Schobesberger, B. et al, (2008): Consumer perceptions of organic foods in Bangkok, Thailand, Food Policy, Vol. 33, No. 2, pp. 112-121, Elsevier, Amsterdam, Holland, available at: https://www.researchgate.net/publication/4793648_Consumer_Perceptions_of_Organic_Foods_in_Bangkok_Thailand
21. Simić, I. (2016): Organic Agriculture in Serbia at Glance, National Association Serbia Organica, Beograd, Serbia, available at: http://www.tehnologijahrane.com/wp-content/uploads/2016/11/Organic-Agriculture-in-Serbia-At-a-glance-2017.pdf
22. Sylwia Żakowska Biemans, (2011): Polish consumer food choices and beliefs about organic food, Vol. 113, No. 1, pp.122-137, Emerald Publishing Limited, Great Britain
23. Renko, S., Bošnjak, K., (2009): Aktualno stanje i perspektive budućeg razvoja tržišta ekološke hrane u Hrvatskoj, Ekonomski pregled, Vol. 60, No. 7-8, pp. 369-375, Hrvatsko društvo ekonomista, Zagreb, Croatia, available at: http://hrcak.srce.hr/40483
24. Vehapi. S. (2015): Istraživanje motiva potrošača koji utiču na kupovinu organske hrane u Srbiji, Ekonomske teme, Vol. 53, No.1, pp. 105-12, Centar za izdavačku delatnost Ekonomskog fakulteta u Nišu, Niš, Serbia, available at: http://www.economic-themes.com/pdf/et20151_07.pdf
25. Vehapi, S., Dolićanin, E. (2016): Agroeconomic, Consumers Behavior on Organic Food: Evidence from the Republic of Serbia, NDAEB, Year 63, No. 3, pp. 871-891, Beograd, Serbia, available at: http://bsaae.bg.ac.rs/images/Ekonomika%20kompletna/2016/EP%203%202016lq.pdf
26. Vlahović, B. Sojić, S. (2016): Istraživanje stavova potrošača o organskim poljoprivredno-pregrambenim proizvodima i njihovim brendovima, Agroekonomika, Vol. 45, No. 75, pp. 33-46, Poljoprivredni fakultet Univerzitet u Novom Sadu, Novi Sad, Serbia, available at: http://agroekonomika.rs/index.php/2-uncategorised/8-agroekonomika-br-72
27. Vlahović, B., Puškarić, A., Jeločnik, M., (2011): Consumer attitude to Organic Food Consumption in Serbia, Vol. 18, No. 1, pp. 45-52, Petroleum Gas University of Ploiesti Bulletin, Ploiesti, Romania, available at: http://www.upg-bulletin-se.ro/archive/2011-1/6.%20Vlahovic_Puskaric_Jelocnik.pdf
28. Willer, H., Lernoud, J., Kikher, L., (Eds.) (2013): The World of Organic Agriculture: Statistics and Emerging Trends 2013, Research Institute of Organic Agriculture (FiBL), Frick, and International Federation of Organic Agriculture Movements (IFOAM), Bonn, Germany, available at: http://orgprints.org/26322/1/1606-organic-

1063EP 2017 (64) 3 (1049-1064)
CONSUMERS ATTITUDES ON ORGANIC FOOD IN SERBIA AND CROATIA: A COMPARATIVE ANALYSIS
world-2013.pdf29. Willer, H., Lernoud, J. (Eds.) (2014): The World of Organic Agriculture: Statistics
and Emerging Trends 2014, Research Institute of Organic Agriculture (FiBL), Frick, and International Federation of Organic Agriculture Movements (IFOAM), Bonn, Germany, available at: http://orgprints.org/25172/1/willer-lernoud-2014-world-of-organic.pdf
30. Willer, H., Lernoud, J. (Eds.) (2015): The World of Organic Agriculture: Statistics and Emerging Trends 2015, Research Institute of Organic Agriculture (FiBL), Frick, and International Federation of Organic Agriculture Movements (IFOAM), Bonn, Germany, available at: http://www.fibl.org/en/media/media-archive/media-release/article/growth-continues-global-organic-market-at-72-billion-us-dollars-with-43-million-hectares-of-organic.html
31. Willer, H., Lernoud, J. (Eds.) (2017): The World of Organic Agriculture: Statistics and Emerging Trends 2017, Research Institute of Organic Agriculture (FiBL), Frick, and International Federation of Organic Agriculture Movements (IFOAM), Bonn, Germany, available at: http://www.organic-world.net/yearbook/yearbook-2017/key-data.html

1064 EP 2017 (64) 3 (1049-1064)
Nenad Perić, Andrijana Vasić Nikčević, Nenad Vujić
STAVOVI POTROŠAČA O ORGANSKOJ HRANI U SRBIJI I HRVATSKOJ: UPOREDNA ANALIZA
Nenad Perić4, Andrijana Vasić Nikčević5, Nenad Vujić6
Rezime
Cilj rada je istraživanje povezanosti socio-demografske varijable i stavova ispitanika iz Srbije i Hrvatske prema organskoj hrani. Potrošači širom sveta imaju pozitivan stav prema organskoj hrani bez posebnih razlika između različitih socio-demografskih varijabli. Međutim, nivo potrošnje organske hrane je nizak-organska poljoprivreda koja pokriva 1% poljoprivrednog zemljišta. Visoka cena i niska primanja ispitanika predstavljaju osnovne ograničavajuće faktore. Ekonomski faktor je posebno važan za tržišta Srbije i Hrvatske. Takođe, nedostatak informacija i poverenja u organsku proizvodnju i organske sertifikate predstavljaju deo odluke potrošača o kupovini. Prema tome, proizvodima organskih proizvoda potrebna su marketinške aktivnosti za izgradnju prepoznatljivog brenda i razvoj poverenja među potrošačima. Takođe, potrošači su pokazali visok stepen samosvesti u donošenju odluka o kupovini organskih proizvoda, što čini komunikaciju brendom na prodajnom mestu veoma važnom.
Key words: konzumiranje organske hrane, stavovi potrošača, proces donošenja odluka.
4 Vanredni profesor, dr Nenad Perić, Metropolitan Univerzitet, Ulica Tadeuša Košćuška br. 63, 11000 Beograd, Srbija, Telefon: +381 11 20 30 885, E-mail: [email protected]
5 Andrijana Vasić-Nikčević M.Sc., asistent, Metropolitan Univerzitet, Ulica Tadeuša Košćuška br. 63, 11000 Beograd, Srbija, Telefon: +381 11 20 30 885, E-mail:[email protected]
6 Dr Nenad Vujić, viši naučni saradnik, Ekonomski institut, Ulica Kralja Milana br. 16, Beograd, Srbija, Telefon: +381 11 36 13 417, E-mail: [email protected]

1065
Original scientific paper Economics of Agriculture 3/2017UDC: 336.581:338.43
EP 2017 (64) 3 (1065-1080)
FINANCING OF PERMANENT WORKING CAPITAL IN AGRICULTURE
FINANCING OF PERMANENT WORKING CAPITAL IN AGRICULTURE1
Branko Vučković2, Branislav Veselinović3, Maja Drobnjaković4
Summary
In this paper, we attempted to present the problem of establishing adequate structure of financing medium agricultural enterprises and to point out the necessity for permanent working capital in those agricultural enterprises which can’t cover fixed assets, long-term placements and portion of inventories (raw material and spare parts, production in process) with own equity and long-term sources of financing. For the purpose of analysing adequate structure of financing medium agricultural enterprises, we will use one of the most popular methods, such as case study and ratio analysis. Results of the research show that in primary agricultural production, next to standard long-term investment loans and short-term loans for investment in agricultural production, there is a necessity for financing in the permanent working capital which could assist continuity of production process and enable conditions for more profitable business in agriculture. It also should be noted that real and book value on this level of permanent working capital differs substantially.
Key words: agriculture, financing, permanent working capital, permanent inventory, profitability.
JEL: Q12, Q14, G21.
Introduction
Rules of financing represent the norms and standards based on relations between fixed and current assets and own (long-term) and borrowed (long-term, medium-term and short-term) sources of financing in liabilities, which should be respected in terms of establishing stable, lucrative and profitable business operation.
1 This work represents sequel of research based on a PhD thesis ”Financial position and profitability of agricultural enterprises”, which includes period 2009-2013. (Vučković, 2016).
2 Branko Vučković Ph.D., Vojvodjanska Bank NBG Group, Sonje Marinković street no. 1–3, 25000 Sombor, Serbia, Phone: +381 25 465 000, E-mail: [email protected]
3 Branislav Veselinović Ph.D., Full Professor, University Business Academy in Novi Sad, Faculty of Economics and Engineering Management, Cvećarska street no. 2, 21000 Novi Sad, Serbia, Phone: +381 21 400 484, E-mail: [email protected]
4 Maja Drobnjaković M.A., Assistant, University Business Academy in Novi Sad, Faculty of Economics and Engineering Management, Cvećarska street no. 2, 21000 Novi Sad, Serbia, Phone: +381 21 400 484, E-mail: [email protected]

1066 EP 2017 (64) 3 (1065-1080)
Branko Vučković, Branislav Veselinović, Maja Drobnjaković
Source of finance structure is one of the most important parameters which contribute to enterprise’s profitability. There are a number of theories about relations between financial indebtedness and profitability, regarding the activity of given enterprise (agricultural activity, especially primary agricultural production has certain characteristics). Foundation of these theories is based on analysis what optimal financing structure should be and one that provides best results of business which are measured through indicators of profitability, liquidity as well as overall development of the enterprise. Lower the indicator of indebtedness, higher are own sources of financing and it can be presumed that enterprise fulfils the prerequisite for profitable business.
Establishing adequate structure of financing in agricultural enterprise represents quite a complex problem. Horizontal rule of financing (so called balance rule in the narrow sense) observes the relation between fixed assets and long-term sources of financing. When we talk about enterprises in primarily agricultural production, it is necessary to imply on their need for securing certitude, by which we mean financing fixed assets with own capital.
Based on perennial analysis of the agricultural sector, we can deduct general conclusion that agricultural enterprises should rely on long-term sources of financing exclusively in starting years of the investment cycle. Structuring the liabilities of the balance sheet, which is a fundamental task of financial management in one’s enterprise, is partly conditioned by ownership structure and legal form of the enterprise. Based on continuous analysis of the financial state of the enterprise, financial management decides of ways for gathering sources of financing. This kind of analysis should provide ananswer to question whether resources and sources of financing are harmonised by volume and maturity (Veselinović, Vunjak, 2014). Each new financial result changes financial structure of the enterprise, where profit represents a source of increased own sources of financing in liabilities in the balance sheet (increase in group 34 – Retained profit leads to increase in class 3 – Capital). And vice versa, withdrawal of profit by owner(s) or in payment of dividends in stock-companies, leads to a reduction of own sources of financing.
During the assessment of own sources of financing, the principle of security and balance rule in a broader sense implies that, other than fixed assets and a portion of permanent working capital, inventory should also be covered with long-term sources of financing (own equity or long-term loans).
The necessity for a high share of tangible assets in the structure of total assets in the balance sheet (land and equipment), as well as low return on assets rate, consequently affects on increased necessity of agricultural enterprises for investment loans for longer periods of time (approximately 7-10 years).
Literature Review
In a time of increased business sensitivity and emergent of the global crisis, it is of utmost importance to offer significantly favourable credit requirements to agricultural enterprises and in that way stimulate investments in the agricultural business. On the
1067EP 2017 (64) 3 (1065-1080)
FINANCING OF PERMANENT WORKING CAPITAL IN AGRICULTURE
other hand, financial support for agriculture through the agrarian budget is not enough for its sustainability. So, lack of the financial sources is the key factor that limits the effective use of agricultural resources, with the countries in the transition, as well as developed countries. Despite rich tradition and natural resources, agricultural enterprises in Serbia are disabled when it comes to financial investment in new technologies, equipment, knowledge and innovation, and therefore, their competition is seriously impaired, not only in international but the local market as well. Of course, financial mix in the agricultural sector is significantly different from the financial mix in other industries, due to its specific features (Veselinović, Drobnjaković, 2014).
Some researches imply that main factors which influence on the net profit of agricultural enterprises are education, size and typology, specialisation and level of state payments. Key factors which influence on asset turnover ratio in DuPont model are asset’s age and efficiency in the management of different forms of property (Detra, Mishra, 2012). Changes in profitability of agricultural enterprises can be observed as consequences of changes in quality and quantity of production factors, or measurable changes in relative prices (O’Donnell, 2010).
Katchova (2010) analysed the characteristics that agricultural lenders need to consider when evaluating farmers’ loans. She pointed out that older farmers and larger farms are less likely to experience financial stress while hobby farms and livestock farms are more likely to experience financial stress.
Mishra, Moss and Erickson (2009) suggested that government payments impact the profit margin and affect value of farm assets in particular farmland values but not asset turnover ratio.
Petrick and Kloss (2012) concluded that relationship between farm financial indicators and the estimated shadow prices of capital varies considerably across countries and sectors.
Measures of sectoral investment and capital stocks are essential in applied economics research (Daidone, Anriquez, 2011). Butzer, Mundlak and Larson (2010) pointed out that capital is a fundamental component of agricultural production, and that the accumulation of capital is key to growth in agriculture. Unfortunately, cross-country data sets on agricultural fixed capital are rare.
In this research, special attention is focused on the analysis of needs for permanent working resources (fixed inventories) in the scope of selected enterprises and financing of the mentioned. Therefore, permanent working capital represents part of inventories which is permanently kept at a certain level for maintaining continuity of business operations (concept Going Concern). If agricultural enterprises do not possess enough own sources of financing, they can acquire it either through prolongation of obligations to suppliers or bank loans (in the case of agricultural enterprises in Serbia, this is the common case). Loans for permanent working capital with a repayment period of 36-48 months should be a source for financing fixed inventories.
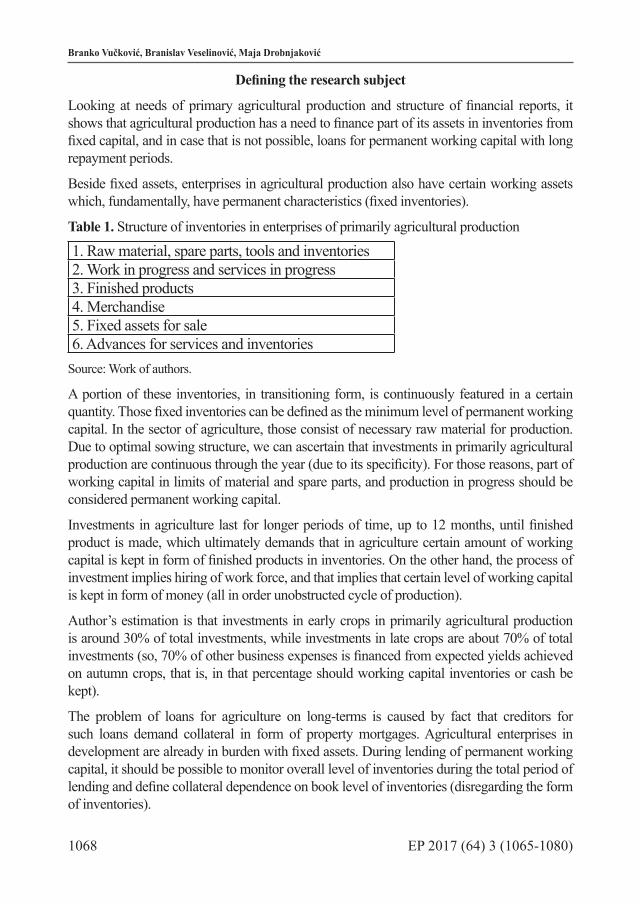
1068 EP 2017 (64) 3 (1065-1080)
Branko Vučković, Branislav Veselinović, Maja Drobnjaković
Defining the research subject
Looking at needs of primary agricultural production and structure of financial reports, it shows that agricultural production has a need to finance part of its assets in inventories from fixed capital, and in case that is not possible, loans for permanent working capital with long repayment periods.
Beside fixed assets, enterprises in agricultural production also have certain working assets which, fundamentally, have permanent characteristics (fixed inventories).
Table 1. Structure of inventories in enterprises of primarily agricultural production
1. Raw material, spare parts, tools and inventories2. Work in progress and services in progress3. Finished products4. Merchandise5. Fixed assets for sale6. Advances for services and inventories
Source: Work of authors.
A portion of these inventories, in transitioning form, is continuously featured in a certain quantity. Those fixed inventories can be defined as the minimum level of permanent working capital. In the sector of agriculture, those consist of necessary raw material for production. Due to optimal sowing structure, we can ascertain that investments in primarily agricultural production are continuous through the year (due to its specificity). For those reasons, part of working capital in limits of material and spare parts, and production in progress should be considered permanent working capital.
Investments in agriculture last for longer periods of time, up to 12 months, until finished product is made, which ultimately demands that in agriculture certain amount of working capital is kept in form of finished products in inventories. On the other hand, the process of investment implies hiring of work force, and that implies that certain level of working capital is kept in form of money (all in order unobstructed cycle of production).
Author’s estimation is that investments in early crops in primarily agricultural production is around 30% of total investments, while investments in late crops are about 70% of total investments (so, 70% of other business expenses is financed from expected yields achieved on autumn crops, that is, in that percentage should working capital inventories or cash be kept).
The problem of loans for agriculture on long-terms is caused by fact that creditors for such loans demand collateral in form of property mortgages. Agricultural enterprises in development are already in burden with fixed assets. During lending of permanent working capital, it should be possible to monitor overall level of inventories during the total period of lending and define collateral dependence on book level of inventories (disregarding the form of inventories).

1069EP 2017 (64) 3 (1065-1080)
FINANCING OF PERMANENT WORKING CAPITAL IN AGRICULTURE
Next to investment loans and loans for permanent working capital, enterprises from primary agricultural production are financed also with short-term loans intended for investing in the production cycle and finished product inventory (in order to wait for the optimal price and achieve best results). Short-term loans for this purpose most commonly have 12-18 months repayment plan and follow entire production process or part of the cycle of asset turnover in enterprises in primary agricultural production.
In the past 7-year period, prices of primary agricultural products have recorded distinct growth, up to 100% in relation to prices in the harvest. The price of wheat in July 2010 was 10.30 RSD, while in December of the same year had reached 25.15 RSD. In August of 2013, the price was 15.00 RSD and in January of 2014 price was 27.50 RSD. The price of corn in year 2013/2014 has in just 90 days (October – January) increased from 12.60 to 24.70 RSD. Soybean has also had high price fluctuation in given period (www.proberza.co.rs). Since 2014, this trend in price growth was less distinctive, but all this has caused growing need for keeping agricultural products until the moment of achieving best market price, as well as prolonging turnover asset cycle in agriculture (in some moments, up to 7 months after finished cycle of production), and during the time of waiting for the best price, new investments in production are necessary for the following year. In that case, permanent working capital is considered fixed inventory which is necessary for enabling continuity of regular production cycle.
Research subject in this paper is the development of intersection of the need for permanent working capital in selected agricultural enterprises which are not in possibility to finance tangible assets, property under construction, long-term investments and a portion of fixed inventory with own capital and long-term loans.
Defining the research goal
The research goal in this paper is to define whether are cycles of agricultural production in alignment with cycles of financial reports compilation of agricultural enterprises, as well as the more accurate find of which portion of inventories in balance sheet can be concerned as permanent working capital and how it is financed.
If an agricultural enterprise can’t finance its fixed assets and portion of inventories with own capital or long-term loans, which is a common situation with agricultural enterprises in Serbia, it should search for a solution in loans for permanent working capital with a repayment period of 36-48 months as a source of financing portion of inventories. More accurately, repayment period can be defined regarding the profitability of the certain enterprise. Agricultural enterprises who did position their fixed assets and their sources of financing should keep the profit for coverage of permanent working asset.
On the other hand, research goal is to question whether agricultural enterprises who do possess enough own capital have, at the same time, need for permanent working capital, while gaining significantly improved profitability in comparison with enterprises who are financed with short-term sources.
1070 EP 2017 (64) 3 (1065-1080)
Branko Vučković, Branislav Veselinović, Maja Drobnjaković
Defining the hypothesis of research
Following is defined general hypothesis:
H0: Financing permanent working capital from own sources and other long-term sources contributes to increased profitability of primary agricultural production enterprises.
Defining the methodology of research
In the scope of this research, we used method of case study and mathematical method, and also experiential (empirical) method. In the scope of the case study, we performed analysis of three agricultural enterprises, PP Ratkovo, Agroplod Stapar and Agrooffice Bački Brestovac (which operates on the territory of Zapadnobački county for the period of 2013-2015). When we talk about quantitative (mathematical) analysis, we applied ratio analysis (calculating liquidity ratio, profitability, indebtedness and efficiency ratio, as well as the ratio of long-term financial stability). Results of ratio analysis were commentated from internal aspect (ascertainment of up, down or stagnation tendencies of business), and from external aspect (in relation to activity in which three observed enterprises operate).
During analysis, we also used parsing and comparison method, as well as analysis of the time series (trend line based on analysis of chronological group data of selected enterprises of primary agricultural production).
Also, we used descriptive method, as well as experiential (empirical) method, during interpretation of given results, recognising specific and isolated cases, and interpreting causes of identified deviations. In this segment of the research, commentating on the specificity of agricultural activity will be of great importance.
In the end, we should mention that in the post time period (since the period of the research) few minor corrections in official financial reports have been made. These corrections are performed in accordance with the International Accounting Standards and Laws of Accounting. However, mentioned corrections of certain positions in balance have not had an impact on this research.
Analysis of the results
This research includes analysis of 3 medium agricultural enterprises which operate on Territory of Zapadnobački County, in the span of 3 years (2013-2015). Enterprises in question belong to large systems which are export-oriented or have a manufacturing industry.
Based on researches so far (Vučković, 2013; 2014; 2016), we came to the conclusion that the most profitable agricultural enterprises in Vojvodina had EBITDA margin above 30%. Also, we’ve reached the conclusion that the most profitable enterprises in finance source structure had 70-88% of own sources of financing (equity). This enables them to have profit in the range of 22-47% in observed period of time (Vučković, 2016).
Based on previous research, we can conclude that in Serbian economy in given time period, extraneous sources of agriculture financing is an extremely expensive category (Vučković,

1071EP 2017 (64) 3 (1065-1080)
FINANCING OF PERMANENT WORKING CAPITAL IN AGRICULTURE
2016). Previous research has also implied that significant part of the primary agricultural production is financed on the burden of the suppliers, which is an extremely expensive source of financing or using loans in commercial banks, which also affects profitability in a negative sense. As one of the conclusions, which imposes once again, is that well-capitalized enterprises can achieve high profitability. On the other hand, worst results are shown in enterprises that use short-term sources of financing (at the burden of the suppliers or using short-term bank loans).
During defining permanent working capital that should be financed from permanent sources we started with two assumptions (first is based on experience and statistics of an expert in agriculture about total investments in the agricultural production of crop plants). In this paper, it is defined that all investments which follow the process of production during one year, and before final sale and payment of finished products, should be considered permanent working capital.
When we talk about raw material and production in progress, author’s estimation is that total expense in wheat is 650 EUR, while permanent working capital is 21% of that amount id est. 135 EUR (beginning phase of investment, which implies usage and dispersal of mineral fertiliser and plowing). In estimations of minimum needs for permanent working capital, we observed necessarily repeated expenses in the same crop during one year, considering that all crops were based on spring sowing.
About corn production, authors estimate that total amount of permanent working capital is around 190 EUR, which is 26% of total expenses, which are 708 EUR per hectare. At the production of sugar beet, authors estimate that amount of permanent working capital is 260 EUR per hectare, which is 23% of total expense in this crop which is 1,130 EUR per hectare.
With soybean production, authors estimate that permanent working capital is at 154 EUR/ha, which is about 28% of total expenses, which is 536 EUR/ha in the production of this crop.
Sunflower production – total expense is 557 EUR/ha, from which we estimate that expense in permanent working capital is 154 EUR/ha (around 27%).
Mentioned above are defined costs of production of crops based on perennial statistics of an expert witness, and authors attempt to define the minimal necessary amount of permanent working capital in each agricultural crop.
The second assumption for determination of the necessary amount of permanent working capital is defined based on annual financial reports. Analysis of total assets and equity and liabilities was performed with the goal of achieving conclusion whether are empiric amounts and book amounts of permanent working capital in these enterprises match. Data extracted from accounting statements of current inventories and investment in agricultural production from annual financial reports are:
1. Material, spare parts, tools and inventories
2. Work in progress and services in progress

1072 EP 2017 (64) 3 (1065-1080)
Branko Vučković, Branislav Veselinović, Maja Drobnjaković
These items represent the part of inventory which is permanently placed in process of production of agricultural products. While one part is in form of uncollected finished product, by the end of the year agricultural enterprises invest once more in material, artificial fertiliser and services of its dispersal and plowing. So, the cycle of production is finished, but the cycle of the working capital is not because the collection of finished products is not carried out at most of the manufacturers who wait for the right moment of sale to achieve most profitable effects. Analysing data from annual financial reports, the share of permanent working capital ranged differently in all three enterprises. PP Ratkovo in the year 2013 had a share of 53% due to intensive investment in sugar beet, while in the year 2015 that share was at 27% due to the fact that dominant crop was wheat.
At enterprise PP Agroplod Stapar (largest part of the production is based on wheat, corn and soy), the share of permanent working capital in total inventory dropped from 32% in the year 2013 to 22% in 2014 and 2015.
Enterprise Agrooffice in 2015 had share of 23% in relation to total inventory, while in previous years, due to significant investments in vegetables that share was far more.
From the group of observed enterprises, we focused on three enterprises with different needs for permanent working capital, away of financing and effects in which own and borrowed sources of financing affect profitability. Special attention is focused on the analysis of the need for permanent working capital in agricultural enterprises which don’t have enough own sources of financing. In practice, that capital is substituted using short-term sources of financing, which however impairs total profitability.
PP Ratkovo is an enterprise which during observed period covers with own capital entire fixed assets, and almost completely working capital. With that structure of finance sourcing, this enterprise in this period achieves gross profit above 50%, and in the last two years of period observed 54%, EBITDA margin at 32-36% in year 2015, while net margin in last year of the observed period is at 24%, which is extraordinary indicator for this activity. In analysed period, the enterprise had no investments, but an entire profit turned into fixed capital. By looking into the structure of sources within this enterprise, it is evident that this enterprise does not show the need for permanent working capital.
Table 2. Analysis of short balance sheet of PP Ratkovo
YEAR 2013 2014 2015FIXED ASSETS 1.113.858 1.080.063 1.040.347WORKING CAPITAL 502.588 578.215 686.291
Inventories 172.825 215.034 260.775material, spare parts, tools and inventories 4.514 5.822 4.954production in progress and service in progress 87.862 78.230 77.415other inventories 80.749 130.982 178.406
Other working capital 329.763 363.181 425.516DEFERED TAX ASSETS 33.873 12.720 5.844

1073EP 2017 (64) 3 (1065-1080)
FINANCING OF PERMANENT WORKING CAPITAL IN AGRICULTURE
YEAR 2013 2014 2015Total assets 1.650.319 1.670.998 1.732.482
EQUITY 1.574.451 1.637.449 1.722.542LONG-TERM PROVISIONS AND LIABILITIES 32.031 6.745 1.879SHORT-TERM LIABILITIES 43.837 26.804 8.061
Total equity and liabilities 1.650.319 1.670.998 1.732.482
Source: Balance sheet of the PP Ratkovo, for the period of 2013-2015.
Graph 1. Analysis of the structure of total assets and total liabilities in PP Ratkovo
Source: Work of authors.
In the last observed year, this enterprise is almost entirely financed from own permanent sources, which have reached the level of 99.4%. In this enterprise, liquidity ratios have also increased substantially from 21 to 85.
Enterprise Agroplod Stapar has, in the observed time period, changed its structure of fixed assets and sources of financing. In the year 2013 fixed assets have been covered with own capital almost entirely. In the next years, the long-term loan has been used for covering a certain amount of deferred tax assets, which can be subsumed under long-term financial investment, as well as inventories which are treated as a minimum level of necessary required inventory for unobstructed production (so-called permanent working capital).
Enterprise Agroplod Stapar has weaker asset source structure from PP Ratkovo because it is in continuous investment, which is shown through fixed asset increase. This enterprise
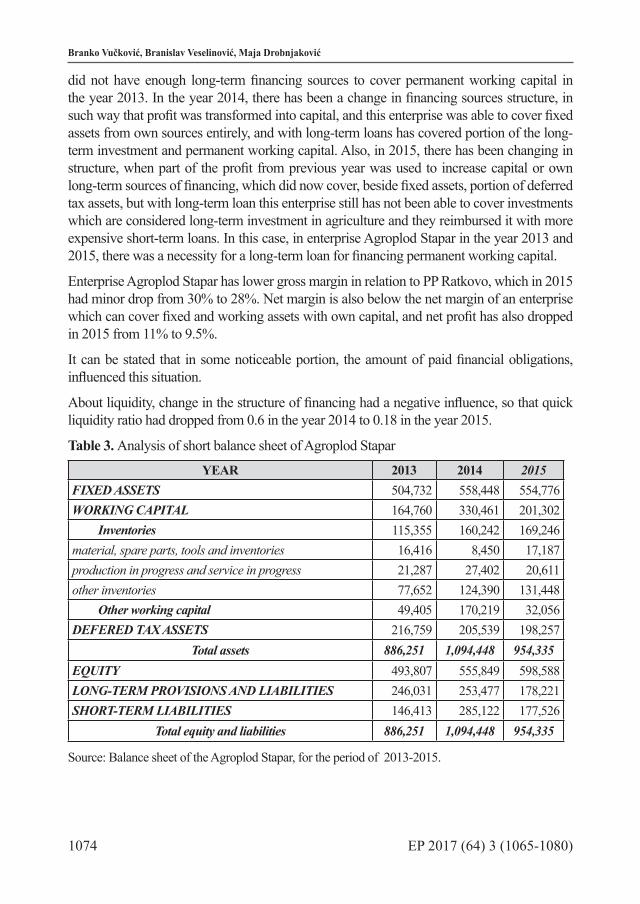
1074 EP 2017 (64) 3 (1065-1080)
Branko Vučković, Branislav Veselinović, Maja Drobnjaković
did not have enough long-term financing sources to cover permanent working capital in the year 2013. In the year 2014, there has been a change in financing sources structure, in such way that profit was transformed into capital, and this enterprise was able to cover fixed assets from own sources entirely, and with long-term loans has covered portion of the long-term investment and permanent working capital. Also, in 2015, there has been changing in structure, when part of the profit from previous year was used to increase capital or own long-term sources of financing, which did now cover, beside fixed assets, portion of deferred tax assets, but with long-term loan this enterprise still has not been able to cover investments which are considered long-term investment in agriculture and they reimbursed it with more expensive short-term loans. In this case, in enterprise Agroplod Stapar in the year 2013 and 2015, there was a necessity for a long-term loan for financing permanent working capital.
Enterprise Agroplod Stapar has lower gross margin in relation to PP Ratkovo, which in 2015 had minor drop from 30% to 28%. Net margin is also below the net margin of an enterprise which can cover fixed and working assets with own capital, and net profit has also dropped in 2015 from 11% to 9.5%.
It can be stated that in some noticeable portion, the amount of paid financial obligations, influenced this situation.
About liquidity, change in the structure of financing had a negative influence, so that quick liquidity ratio had dropped from 0.6 in the year 2014 to 0.18 in the year 2015.
Table 3. Analysis of short balance sheet of Agroplod Stapar
YEAR 2013 2014 2015FIXED ASSETS 504,732 558,448 554,776WORKING CAPITAL 164,760 330,461 201,302
Inventories 115,355 160,242 169,246material, spare parts, tools and inventories 16,416 8,450 17,187production in progress and service in progress 21,287 27,402 20,611other inventories 77,652 124,390 131,448
Other working capital 49,405 170,219 32,056DEFERED TAX ASSETS 216,759 205,539 198,257
Total assets 886,251 1,094,448 954,335EQUITY 493,807 555,849 598,588LONG-TERM PROVISIONS AND LIABILITIES 246,031 253,477 178,221SHORT-TERM LIABILITIES 146,413 285,122 177,526
Total equity and liabilities 886,251 1,094,448 954,335
Source: Balance sheet of the Agroplod Stapar, for the period of 2013-2015.

1075EP 2017 (64) 3 (1065-1080)
FINANCING OF PERMANENT WORKING CAPITAL IN AGRICULTURE
Graph 2. Analysis of asset and liabilities structure of Agroplod Stapar
Source: Work of authors.
Enterprise Agroofice Bački Brestovac had also, during the observed period, closure of perennial investment cycle, which reflects in constant increase of fixed assets with the retain of the working capital on acertain level with the continuous attempt of adjusting the source of financing to asset structure.
In the year 2013 own capital did not cover fixed asset, and huge deficiency of long-term sources was compensated with financing through prolongation of short-term liabilities toward suppliers and through short-term bank loans.
This enterprise, encouraged with high profitability in the year 2013, has begun investment from short-term sources of financing which has further impaired already unfavourable financing source structure. Negative outcomes of this financing structure have continued in the year 2014 and 2015 (extreme decrease in profitability of this enterprise through gross and net profit). In the year 2014, even with a capitalization of achieved profit from the previous year and converting short-term liabilities in long-term liabilities, this enterprise did not manage to cover fixed assets from long-term sources, while entire long-term investment and minimum permanent working capital were covered from short-term sources.
In year 2015, this enterprise had significant discrepancy between working capital and fixed assets (fixed asset was increased during two years for more than a third, and working capital decreased, especially permanent working capital, or work in progress), which has directly influenced in reduction of total income of this enterprise, almost by a third. Even with the reduction of the total income, this enterprise has managed to increase net profit in relation to aprevious year, thanks to savings and larger reduction of other business expenses. This net profit was retained as a permanent source, a portion of retained profit was also turned into

1076 EP 2017 (64) 3 (1065-1080)
Branko Vučković, Branislav Veselinović, Maja Drobnjaković
equity, and an increase of fixed assets in sources was covered with the conversion of short-term borrowed sources into long-term loans toward banks. This trend has affected positively on liquidity ratio of this enterprise so that current liquidity increased from 0,7 to 1, and quick liquidity ratio from 0.18 to 0.28. In the year 2015, the profitability of this enterprise has also recorded a positive trend in relation to a previous year. Gross margin has increased in the year 2015 from 28% to 32%, EBITDA from 9% to 14% and net margin from 4% to 6%.
Thanks to the improvement in financial mix and using own sources of financing and covering permanent working capital with long-term sources it is noticeable that this enterprise has achieved favourable business indicators, but still has not reached more stable structured enterprises.
The somewhat favourable structure of financing was achieved with conversion the portion of short-term loans into long-term, but at the same time has disrupted the structure of relation between fixed assets and working capital (on the expense of the latter), which means that the enterprise has most of the working capital converted into fixed assets.
Table 4. Analysis of short balance sheet of Agrooffice Bački Brestovac
YEAR 2013 2014 2015FIXED ASSETS 698,179 865,977 930,115WORKING CAPITAL 344,938 339,646 333,597
Inventories 239,058 253,481 241,946material, spare parts, tools and inventories 3,052 3,443 19,043production in progress and service in progress 99,861 173,307 38,355other inventories 136,145 76,731 184,548
Other working capital 105,880 86,165 91,651DEFERED TAX ASSETS 95,510 86,104 74,751
Total assets 1,138,627 1,291,727 1,338,463EQUITY 437,025 549,439 615,944LONG-TERM PROVISIONS AND LIABILITIES 169,349 265,867 396,958SHORT-TERM LIABILITIES 532,253 476,421 325,561
Total equity and liabilities 1,138,627 1,291,727 1,338,463
Source: Balance sheet of the Agroofice Bački Brestovac, for the period of 2013-2015.

1077EP 2017 (64) 3 (1065-1080)
FINANCING OF PERMANENT WORKING CAPITAL IN AGRICULTURE
Graph 3. Analysis of asset and liabilities structure of Agrooffice Bački Brestovac
Source: Work of authors.
Our recommendation for this enterprise, to improve profitability and liquidity, is to increase working capital, especially the permanent working capital, and that should be covered with long-term sources of financing.It also should be noted that the financial results of research conducted are higher than typical average in agriculture in Vojvodina. Vukoje and Milić point out that agricultural enterprises in Vojvodina are characterized by very low profitability, less than 5% (2009, p. 164).
Conclusion
Results of the research show that in primary agricultural production, next to standard long-term investment loans and short-term loans for investment in agricultural production, there is a necessity for financing in the permanent working capital which could assist continuity of production process and enable conditions for more profitable business in agriculture.
By using permanent working capital with enterprises which don’t have enough own or borrowed long-term sources it will reduce negative effects of product sale in the uncertain period and commodity retention in medium enterprises of primary agricultural production with large suppliers. Commodity exchange observed so far, usually benefits large manufacturers or traders. Also, it should be noted that small and medium agricultural enterprises use short-term sources under supremely adverse commercial terms.
Our recommendation is that state and other creditors should with more favorable loans for permanent working capital with longer maturity and favorable interest rates with adequate

1078 EP 2017 (64) 3 (1065-1080)
Branko Vučković, Branislav Veselinović, Maja Drobnjaković
collateral provide small and medium enterprises which cannot cover fixed assets, long-term investments and portion of inventories (material, spare part and production in progress) with own capital and long-term obligation, thus help them establish preferable source of financing structure. Based on conducted research, we came to the conclusion that small and medium enterprises which have invested in fixed asset on the burden of working capital have the problem of decreased liquidity and profitability.
Each investment represents in certain measure disruption of existing financial mix, which requires readjustment of sources of financing (this presents a problem especially to agricultural enterprises, due to its specificity). With new structuring, the focus should be that long-term sources of financing can cover fixed assets and long-term investment, and also a portion of working capital which is necessary for continued investment in primary agricultural production.
The method of financing permanent working capital affects the profitability of agricultural enterprises. Based on the research, we concluded that enterprise which covers its permanent working capital from own sources, also achieves better profitability, while in enterprises that don’t have long-term coverage for permanent working asset but instead covers it with borrowed (extraneous) sources, especially short-term sources, this situation reflects negatively on profitability which confirms the general hypothesis.
Bibliography
1. Amarender, R. (2013): Farm profitability and labor use efficiency, Indian Journal of Dryland Agricultural Research Development, Vol. 28, No. 2, pp. 1-21, The Indian Society of Dryland Agriculture, Hyderabad, Andhra Pradesh, India.
2. Babović, J., Veselinović, B. (2010): Agrarna politika EU i prilagođavanje agrara Srbije, Društveni izazovi evropskih integracija – Srbija i uporedna iskustva, Fakultet za pravne i poslovne studije, Novi Sad, Srbija, pp. 195-206.
3. Butzer, R., Mundlak, Y., Larson, D. F. (2010): Measures of fixed capital in agriculture, World Bank Policy Research Working Paper Number 5472, pp. 1-39.
4. Chukwunweike, E. (2014): The impact of liquidity on profitability of some selected companies: the financial statement analysis (FSA) approach, Research Journal of Finance and Accounting, vol. 5, no. 5, pp. 81-90, The International Institute for Science, Technology and Education (IISTE), USA.
5. Daidone, S., Anriquez, D. (2011): An extended cross-country database for agricultural investment and capital, ESA Working Paper No. 11–16, FAO, Rome, pp. 1-67.
6. Detre, D., Mishra, A. (2012): Drivers of agricultural profitability in the USA: an application of the Du Pont expansion method, Agricultural Finance Review, Vol. 72, No. 3, pp. 325-340, Emerald Group Publishing, Bingley, United Kingdom.
7. Katchova, A. (2010): An analysis of the financial performance of beginning farmers, Agricultural and Applied Economics Association, Annual Meeting, Denver, Colorado, pp 1-15.

1079EP 2017 (64) 3 (1065-1080)
FINANCING OF PERMANENT WORKING CAPITAL IN AGRICULTURE
8. Mishra, A., Moss, C., Erickson, K. (2009): Regional differences in agricultural profitability, government payments, and farmland values: implications of DuPont expansion, Agricultural Finance Review, Vol. 69, No. 1, pp. 49-66, Emerald Group Publishing, Bingley, United Kingdom.
9. Obrenović, D., Vukoje, V. (2001): Analiza finansijskog rezultata i finansijskog položaja poljoprivrednih preduzeća Vojvodine, Agroekonomika, No. 29, pp. 46-64.
10. O’Donnell, C. (2010): Measuring and decomposing agricultural productivity and profitability change, Australian Journal of Agricultural and Resource Economics, Vol. 54, No. 4, pp. 527-560, Australian Agricultural and Resource Economics Society Inc, Canberra , Australia.
11. Paraušić, V., Cvijanović, J., Mihailović, B. (2013): Market analysis of clusters in Serbian agribusiness, Ekonomika poljoprivrede, Vol. 60, No. 4, pp. 713-728, Naučno društvo agrarnih ekonomista Balkana, Beograd; Institut za ekonomiku poljoprivrede, Beograd, Akademija ekonomskih nauka, Bukurešt.
12. Petrick, M., Kloss, M. (2012): Drivers of agricultural capital productivity in selected EU member states, Factor Markets Working Paper No. 30, pp. 1-44.
13. Račić, Ž., Barjaktarović, L., Zeremski, A. (2011): Analysis of indebtedness impact on the profitability of successful domestic companies in the financial crisis, Industrija, Vol. 39, No. 3, pp. 45-60, Ekonomski institut, Beograd, Srbija.
14. Veselinović, B., Drobnjaković, M. (2014): Qualitative and quantitative analysis of micro and macro aspects of agricultural finance, Ekonomika poljoprivrede, Vol. 61, No. 3, pp. 771-787, Naučno društvo agrarnih ekonomista Balkana, Beograd; Institut za ekonomiku poljoprivrede, Beograd, Akademija ekonomskih nauka, Bukurešt.
15. Vučković, B. (2013): Uporedna analiza poslovanja preduzeća iz agrarnog sektora, Ekonomija - teorija i praksa, Vol. 6, No. 2, pp. 18-33, Fakultet za ekonomiju i inženjerski menadžment u Novom Sadu, Novi Sad, Srbija.
16. Vučković, B. (2014): Značaj pojedinih indikatora poslovanja određenim grupama analitičara, Ekonomija – teorija i praksa, Vol. 7, No. 1, pp. 19-49, Fakultet za ekonomiju i inženjerski menadžment u Novom Sadu, Novi Sad, Srbija.
17. Vučković, B., Veselinović, B., Drobnjaković, M. (2016): Analysis of profitability of selected agricultural enterprises in the autonomous province of Vojvodina, Republic of Serbia, Actual Problems of Ecomomics, Vol. 176, No. 2, pp. 147-159, National Academy of Management, Kyiv, Ukraine.
18. Vučković, B. (2016): Causes of different profitability of agricultural sector, Ekonomika poljoprivrede, Vol. 63, No. 1, pp. 123–142, Naučno društvo agrarnih ekonomista Balkana, Beograd; Institut za ekonomiku poljoprivrede, Beograd, Akademija ekonomskih nauka, Bukurešt.
19. Vučković, B. (2016): Finansijski položaj i profitabilnost poljoprivrednih preduzeća, Ph.D. dissertation, Faculty of Economics and Engineering Management, University Business Academy in Novi Sad, Novi Sad, Serbia.

1080 EP 2017 (64) 3 (1065-1080)
Branko Vučković, Branislav Veselinović, Maja Drobnjaković
20. Vukoje, V., Milić, D. (2009): The analysis of profitability of agricultural enterprises in Vojvodina (2003-2007), Časopis za procesnu tehniku i energetiku u poljoprivredi, Vol. 13, No. 2, pp. 162-165.
21. Vukoje, V., Zekić, V. (2010): Ekonomski položaj poljprivrednih preduzeća u Vojvodini (2001-2009), Ekonomika poljoprivrede, Vol. 57, No. 3, pp. 411-424, Naučno društvo agrarnih ekonomista Balkana, Beograd; Institut za ekonomiku poljoprivrede, Beograd, Akademija ekonomskih nauka, Bukurešt.
22. Agencija za privredne registre: www.apr.gov.rs 23. Narodna banka Srbije: www.nbs.rs
FINANSIRANJE TRAJNIH OBRTNIH SREDSTAVA U POLJOPRIVREDI5
Branko Vučković6, Branislav Veselinović7, Maja Drobnjaković8
Rezime
U ovom radu izvršen je pokušaj da se predoči problem uspostavljanja adekvatne strukture finansiranja srednjih poljoprivrednih preduzeća i da se ukaže na potrebu za trajnim obrtnim sredstvima u onim poljoprivrednim preduzećima koja sopstvenim kapitalom i dugoročnim izvorima finansiranja ne uspevaju da pokriju stalnu imovinu, dugoročne plasmane i deo zaliha (materijal i rezervni delovi, proizvodnja u toku). U svrhu procene adekvatne strukture finansiranja srednjih poljoprivrednih preduzeća, koristićemo jedan od najpopularnijih metoda, kao što je studija slučaja i racio analiza. Rezultati istraživanja ukazuju na to da su u primarnoj poljoprivrednoj proizvodnji, pored standardnih investicionih dugoročnih kredita i kratkoročnih kredita za ulaganja u poljoprivrednu proizvodnju, neophodna i finansiranja u trajna obrtna sredstva zahvaljujući kojima bi se potpomogao kontinuitet procesa proizvodnje i omogućili uslovi za profitabilnije poslovanje u poljoprivredi. Trebalo bi naglasiti i to da se realna i knjigovodstvena vrednost ovog nivoa trajnih obrtnih sredstava značajno međusobno razlikuju.
Ključne reči: poljoprivreda, finansiranje, trajna obrtna sredstva, trajne zalihe, profitabilnost.
5 Ovaj rad predstavlja nastavak istraživanja baziranog na doktorskoj disertaciji pod nazivom “Finansijski položaj i profitabilnost poljoprivrednih spreduzeća”, koja je obuhvatala period 2009-2013. godine (Vučković, 2016).
6 Dr Branko Vučković, Vojvođanska banka NBG Group, Sombor, Ulica Sonje Marinković br. 1–3, 25000 Sombor, Srbija, Telefon: +381 25 465 000, E-mail: [email protected]
7 Redovni profesor, dr Branislav Veselinović, Univerzitet Privredna akademija, Fakultet za ekonomiju i inženjerski menažment, Cvećarska ulica br. 2, 21000 Novi Sad, Srbija, Telefon: +381 21 400 484, E-mail: [email protected]
8 Maja Drobnjaković M.A., diplomirani ekonomista, asistent, Univerzitet Privredna akademija, Fakultet za ekonomiju i inženjerski menažment, Cvećarska ulica br. 2, 21000 Novi Sad, Srbija, Telefon: +381 21 400 484, E-mail: [email protected]

1081
Economics of Agriculture 3/2017UDC: 28+336.71]:330.322(497.11)
EP 2017 (64) 3 (1081-1100)
ISLAMIC BANKS AND FINANCE AND THE POSSIBILITY OF AGRICULTURAL INVESTMENTS IN THE REPUBLIC OF SERBIA
Review article
ISLAMIC BANKS AND FINANCE AND THE POSSIBILITY OF AGRICULTURAL INVESTMENTS IN THE REPUBLIC OF SERBIA
Bahrija Kačar1, Jasmina Curić2, Selma Ikić3
Summary
Financing the economy and agriculture as well in the Republic of Serbia in recent past present was realized and has been implemented with the financial and credit support of the state, as well as through expensive commercial bank loans and financial leasing. Bearing in mind the productive resources, the importance of agriculture to the national economy and employment of the population, and that the financing of agriculture in the Republic of Serbia, at its current level of development, should be implemented with the support of the state. States should work towards the establishment of specialized agricultural banks and by legislation facilitate the arrival of financial institutions which will place funds at favorable conditions such as the Islamic financial institutions do.
Islamic financial institutions in the placement of funds-loans do not use the loan interest rate which is according to the Islamic beliefs unfair and unacceptable. The theoreticians of Islamic economy see an alternative in the fundamental values and teachings of Islam, the Quran and the Sunnah, which strictly prohibit interest.
Islamic bank can make certain comparative advantages in respect to the other domestic banks. It is in a position to establish a sound business relationship with clients from Muslim countries for the local companies to perform in their markets, as well as with the performance of companies from Muslim countries on the Serbian market. A further advantage of this bank we see in the fact that one of its founders would be the IDB - Islamic Development Bank - the leading development bank of the Muslim world, whose experience in the implementation of development projects in Serbia can be of great benefit. However, the largest Islamic bank has potential in the establishment and development of business
1 Kačar Bahrija Ph.D., Assistant, Department for Economic sciences, State University of Novi Pazar, Vuka Karadžića street nn, 36300 Novi Pazar, Serbia, Phone: +381 62 333 808, E-mail: [email protected]
2 Curić Jasmina Ph.D., Assistant, Department for Chemical - Technological sciences, State University of Novi Pazar, Vuka Karadžića street nn, 36300 Novi Pazar, Serbia, Phone: +381 66 631 52 70, E-mail: [email protected]
3 Ikić Selma M.Sc.,Associate, Office for Local Economic Development, City Administration of Novi Pazar, Stevana Nemanja street no. 2, 36300 Novi Pazar, Serbia, Phone: +381 62 488 740, E-mail: [email protected]
1082 EP 2017 (64) 3 (1081-1100)
Bahrija Kačar, Jasmina Curić, Selma Ikić
relationships and cooperation with a growing number of financial and other institutions whose operations are based on the principles of Shariah.
Key words: Agriculture, agriculture loans, Islamic financial institutions, Islamic banks
JEL: G21, Q10, Q14
Introduction
This paper provides a brief overview of the importance of agriculture in the Republic of Serbia. It provides a brief overview of the ways of agricultural funding from the 80s to the present day. Financing of agriculture, which has been conducted from the primary issue of the National Bank, agrar budget, specialized state financial institutions and financial leasing, has not yielded with the expected planned development of agricultural production.
In order to achieve the planned growth of agricultural production, it is urgent to include the funding of potential financial institutions such as funds of the European Union. Republic of Serbia as a candidate for accession to the European Union is entitled to five components. For financing of multifunctional agriculture the fifth is the most important component. Although Serbia had previously received funding for agriculture from the EU IPA funds, IPARD will bring new opportunities because it is aimed at rural development and provides direct support to farmers.
Another potential financial source of funding for agriculture is through Islamic financial institutions. The paper describes the principles which Islamic financial institutions work on. Islamic banks made the greatest contribution to the development of Islamic institutions . This paper describes the principles and financing of Islamic banks. There are four individual models of Islamic banks financing , within each of the model there have been listed funding methods ie. loans, and what is each model ie. method of financing suitable for. Which of these models are the most suitable bank loans for financing of agricultural production.
Research goal, methodology and date sources
The aim is to present the up-to-date way of financing of agriculture and recommend potential way of financing of agriculture in the Republic of Serbia. For this purpose, the modalities of financing and lending practiced by Islamic financial institutions ie. Islamic banks have been presented. Within the possible ways of funding through Islamic banks, the proposed are the forms of credit that by their characteristics correspond to financing of agriculture.
The paper uses analytical co-empirical methods, the comparative method, as well as a method of research at the table (desk research), through which the domestic and foreign literature dealing with the respective problem have been researched. Analytical co-empirical methods are common for the researches in economic sciences and are based on the analysis of the experiences in the past. In particular, in this work, the forms of financing of agriculture in the Republic of Serbia in the post-war period up to 2016. Years have been analysed. In order to propose potential way of funding through Islamic financial institutions (Klincov et al., 2017), the conclusions of the researches based on the comparative method have been used.

1083EP 2017 (64) 3 (1081-1100)
ISLAMIC BANKS AND FINANCE AND THE POSSIBILITY OF AGRICULTURAL INVESTMENTS IN THE REPUBLIC OF SERBIA
The importance of agriculture in the Republic of Serbia
The most important task of agriculture is to produce food for the people, and at today’s level of development of science and scientific knowledge it can be considered that only agriculture is capable of producing basic foods for human consumption.
Due to the biological nature of agricultural production, natural factors have a significant impact on results in the production. As agricultural production takes place mainly in the open field, the effect of natural factors are largely beyond the reach of human power, and therefore it is not certain that the investments in agriculture will bring the appropriate profits, resulting in fewer investments of capital in agriculture, and therefore the development of entrepreneurship within it takes place slowlier.
Time of production in agriculture is relatively long when compared to the time of production in other sectors, because in crop production it is limited by vegetation cycles, and in livestock production by reproductive cycles. Due to these facts, the turnover of capital in agriculture takes relatively longer than in other industries. Due to that, the same quantity of capital at the same rate of profit, due to the different duration of capital turnover, will make different profits in agriculture, much less than in other industries. Therefore , the capital slowlier penetrates into agriculture. In agriculture, the production time does not coincide with the time of direct labor process, ie, the production time is much longer than the time of operation. Agricultural production is for a certain time under the influence of natural factors, under whose influence the plants go through certain biological, chemical, physical and chemical processes.
Due to such a character of agricultural production in crop production it leads to the seasonality, which is reflected in uneven exploitation of labor and resources during the year. Production cycles in many branches of agriculture are different, which conditions the manners of financing ie credittting of agriculture.
The most important characteristics of agriculture, which determine the specificity of the credit policy are:
- low accumulative capacity of agriculture- biological character of plant and animal production, which causes a slower turnover of capital (funds)- a significant impact of natural factors on the volume of production which results in higher risk investments- lower efficiency of investments in a number of agricultural projects- the existence of multiple forms of ownership of agricultural entities that require different approaches to assessing the creditworthiness of investment funds.Agriculture is a very important economic activity in the Republic of Serbia, which has an economic, social, and political importance. In Serbia, 85% of the territory is considered the rural area which is inhabited by 55% of the total population. Based on the results of the Census of Agriculture in 2012 (National Bureau of Statistics, 2013, Volume I, p. 13) there
1084 EP 2017 (64) 3 (1081-1100)
Bahrija Kačar, Jasmina Curić, Selma Ikić
are 631,552 agricultural households in Serbia that cultivate a total of 3,437,423 hectares of agricultural land. Prevailing in the agricultural household structure are family households, which constitute 99.5% of total, with only 0.5% of farms that are owned by legal entities and entrepreneurs. In the structure of the property, private property accounts for 80% of the total area of agricultural land. The average size of agricultural holdings in the European Union is about 20 acres, and in our country semi-sustainable households prevail, ie. 47% of households use up to two hectares of agricultural land. Small size of the estate hampers the development of competitive production and reduce operating costs, which requires greater funding sources. Also, domestic agricultural production is characterized by low productivity, and thus the price uncompetitiveness, when it is about extensive crop and livestock production. There population in rural areas is rapidly declining . According to the Institute for the Study of the Village, and on the basis of the census of 2011, 1,200 villages in the Republic of Serbia are in the process of extinction. Reasons of “exodus” of the population are rural underdevelopment and lack of jobs, which could be solved by adequate funding of rural development.
In Serbia there is a lack of development and export-import banks that can accompany major clients and provide them with quality and affordable banking services. The lack of developmental financial institutions is one of the serious development barriers. Unregulated markets iof agricultural products cause lower revenues that small and average agricultural producers earn on them, and thus a greater need for external financing sources. The state has an inadequate role in terms of low percentage of allocations from the “state budget” for the agricultural budget. The agricultural policy had the adverse impact on the economic situation and financing of local agriculture which in the late transition period was inconsistent, and without the required continuity and predictability. In the period before the transition and in the first years of the transitional period it had been extremely protectionist. In 2003, the agricultural policy was “turned from protectionist into liberal and rather abruptly, left a devastating negative impact on agriculture, which primarily reflected tin the unresolved problem of financing of this economic activity” (Pejanović, Radovic, 2011, p . 37). Domestic agriculture in the pre-transition period was the victim of price disparities in agri-nutrition and industrial products.
Forms of financing of agriculture in the republic of Serbia
Financing of domestic agriculture until 1994, had been entirely dependent on the state. Financing of Agriculture was conducted from the primary issue of the National Bank, which was performed so that the central bank each year would form a selective credit potential on the basis of which it placed short-term loans to commercial banks. From these sources, commercial banks were granted agricultural loans at the discount rate, which was twice or even five times lower than the interest rates on the financial market. This method of financing has left a negative impact on the domestic financial, monetary and economic system, because of the inadequate system of its control, which had been entrusted to the commercial banks.
The share of primary production in the gross domestic income increased from about 10 percent at the end of the eighties to around 20 percent in 2000. Primary agricultural products represent almost 27 percent of Serbian exports, and employ more than 23 percent

1085EP 2017 (64) 3 (1081-1100)
ISLAMIC BANKS AND FINANCE AND THE POSSIBILITY OF AGRICULTURAL INVESTMENTS IN THE REPUBLIC OF SERBIA
of the workforce. These numbers are, unfortunately, more a reflection of the deep crisis of the industry and the services sector underdevelopment than a proof of the strength of our agriculture. It is still one of the least productive in Europe, with a vaguely defined strengths and many weaknesses. “
Agricultural budget, as one of the sources of financing of agriculture was established by the Decision on the establishment of the agricultural budget which was passed in late 1995, and it became a part of the state budget in 1996. On the proposal of the Ministry of Agriculture, Forestry and Water Management, in accordance with the Law on Budget of the Republic of Serbia, the Government determines the amount of the agricultural budget every year.
Law on Incentives in Agriculture and Rural Development stipulates that the agricultural budget can not be lower than 5% of the budget of the Republic of Serbia, as of 2014 (Law on Incentives in Agriculture and Rural Development, 2013).
Table 1. Agrar budgets of the Republic of Serbia for the period of 1996-2016.
YearTotal budget of Republic of Serbia (in mil. RSD)
Agrar budget of Republic of Serbia (in mil. RSD)
Share of agrar no budget in total budget RS (%)
1996 10,240.2 900.0 8.31997 13,821.0 828.9 6.01998. 16,807.5 975.3 5.81999. 17,640.7 878.2 5.02000 32,702.4 1,823.4 5.62001. 127,339.9 3,940.1 3.12002 177,600.0 7,640.0 4.32003. 271,800.0 10,990.0 4.02004. 329,300.0 20,140.0 6.12005. 432,900.0 18,980.0 4.42006. 505,820.1 27,543.9 5.42007. 595,517.8 26,095.8 4.42008. 695,959.1 32,895.4 4.72009 719,854.1 26,690.4 3.72010. 825,884.9 31,577.9 3.82011. 824,575.9 33,676.0 4.12012 1,018,633.4 40,876.7 4.02013. 1.040.014,3 44.699,5 4,32014. 1.110.121,0 45.427,2 4,12015 1.082.988,2 45.308,2 4,22016 1.085.308,4 40.465,7 3,7
Source: http://www.parlament.gov.rs/upload/documents/3204-15.pdf (Zakon o budžetu republike srbije za 2016. godinu), http://www.parlament.gov.rs/upload/documents/4598-14.pdf (http://www.parlament.gov.rs/upload/documents/3204-15.pdf (Zakon o budžetu republike srbije za 2015. Godinu), Author’s calculation.

1086 EP 2017 (64) 3 (1081-1100)
Bahrija Kačar, Jasmina Curić, Selma Ikić
For the development of agriculture and rural development in the Republic of Serbia, it is necessary to increase the share of agricultural in total state budget in the future, and to provide that incentives and support to rural development have greater share.in the qualitative structure of the agricultural budget .
Through the Ministry of Agriculture and Environment of the Republic of Serbia and specialized state financial institutions, the agriculture loans have been implemented since 2004.This method of crediting of agriculture is realized through commercial banks operating in the Republic of Serbia and the source of loan funds is agrearn budget, with a low interest rate. Only registered households have the right to use the loan funds.
Lending to agriculture with the support of the state is implemented through the Ministry of Agriculture of the Republic of Serbia and the specialized state financial institutions. The support is implemented through commercial banks through short-term and long-term loans with low interest rates and the source of credit is agrar budget.
Specialized state financial institutions have implemented lending to agriculture and rural development with credit portfolio on favorable terms and low interest rates, by that means: the Development Fund of the Republic of Serbia, Fund for Agricultural Development APV, Development Fund APV, and partly by Capital Investment Fund of APV . Guarantee fund for AP Vojvodina has a function to provide to agricultural as well as other companies obtaining of the bank guarantees under favorable conditions.
Commercial banks participated in the placement of their credit resources in the development of agriculture. The credit investments in agriculture did not have a significant share in total loans of commercial banks in the initial period. In the last ten years, there has been a noticeable increased interest in lending to agriculture. The loans that commercial banks granted to agricultural entities in the Republic of Serbia, in the entire previous period, were characterized by: (1) high interest rates; (2) application of the currency clause; (3) unconformity of lending with seasonal nature of the agricultural production; (4) short credit terms ; (5) requirements for the high insurance of the credit; (6) the strict selection of the borrower; (7) the high cost of credit insurance; (8) the absence of or too short grace period; (9) the obligation to pay a one-time loan processing costs; (10) most of the banks interest was calculated on the full amount of the loan, not just on the outstanding amount and (11) failure to show the effective interest rates in credit conditions
Financing of agriculture is done through financial leasing on the basis of the Law on financial leasing, which was adopted in May 2003. Financial leasing is a relatively new but very present way of financing agriculture. Leasing has had a very important role in financing investments in agriculture and, above all, in the procurement of agricultural machinery and equipment.
Financial leasing in the past decade has had a very important role in financing investment in agriculture and, above all, in the procurement of agricultural machinery and equipment. Advantages of financial leasing as a means of financing agriculture are: (a) compliance of repayment to seasonal nature of agricultural production; (B) a simple and fast realization

1087EP 2017 (64) 3 (1081-1100)
ISLAMIC BANKS AND FINANCE AND THE POSSIBILITY OF AGRICULTURAL INVESTMENTS IN THE REPUBLIC OF SERBIA
of the procedures on financial lease contract due to the fact that the leasing companies generally have a business cooperation with suppliers of lease, which results in faster procedures and to a reduction in transaction costs as well;
(C) possibility of leasing used agricultural machinery and equipment; (D) this source is particularly suitable for start-ups, as well as the individual agricultural producers who do not have a “credit history”; (E) it is favorable for agricultural entities that do not have high creditworthiness, but they need a machine of a larger value. In addition to these advantages, disadvantages of leasing as a means of financing agriculture should also be noted The disadvantages are, firstly, related to the additional costs which leasing causes, and that are the costs of insurance of financial leasing object and the costs of value added tax to be paid and the costs of interest calculated on the basis of financial leasing contracts (Vladisavljević et al., 2017).
Potential ways of financing agriculture in Serbia
One of the potential ways of financing agriculture are the Pre-accession funds of the European Union - for financing of multifunctional agriculture the most important component is the fifth, ie IPARD program. The Republic of Serbia is entitled to around 200 million euros per year from pre-accession EU funds, in the period 2014-2020, . Financing of agriculture from the IPARD program, according to the procedure of the European Union, is being implemented on the principle of co-financing. Cofinancing from IPARD fund is carried out: (a)for the measures from the axis 1 of the co-financing is at least 10% and a maximum of 50% to 75%; (B) for the measures of co-financing axis 2 it is at least 25% and a maximum of 55% to 80%; (C) for the measures of the co-financing from the axis 3 it is at least 10% and a maximum of 50% to 75%. Also, IPARD program anticipates that public sector participation may be a maximum of 50%, while the rest of the means should be provided from the private sector. For the implementation of the potential ways of financing agriculture and rural development there is need to accredit appropriate operational structures and solve the problem of pre-financing due to the fact that the funds for projects on the basis of which it is applied for funds from IPARD program are approved by the system of reimbursement.
To ensure pre-financing for projects that will be co-financed from IPARD program and also for financing of the development of: (A) primary agricultural production; (B) multifunctional agriculture; (C) processing agricultural sector based on the entrepreneurship and micro businesses (mini oil plants, slaughterhouses, dairy and alike.), it is necessary to establish agricultural specialized bank.
On the first of March 2012, we have acquired the status of EU candidate.. For the preparation and accreditation it takes 1.5 to two years. So the start of use is expected at the latest by the end of 2013. If we get the first funds for 2012, we could use them until the end of 2015, on the basis of the N + 3 (budget plus next years to pay) .Since at the beginning of 2017 we are much further from IPARD funds than in 2012. year, in the best case scenario we could use the first funds in 2018. So far, 125 million euros in investments from EU have been irreversibly lost.

1088 EP 2017 (64) 3 (1081-1100)
Bahrija Kačar, Jasmina Curić, Selma Ikić
Other potential way of financing agriculture is through Islamic financial institutions ie. Islamic banks. Due to its character, Islamic banking could contribute to filling the said gap.. This would contribute to the development of not only Islamic banking in the Republic of Serbia, but also the overall economic development of the Republic of Serbia.
Principles of financial institutions
In a secular society where the laws are made by the will of individuals or groups of people, and as such are subjects to changes, in Islam laws are enacted or imposed by God (Allah) by the revelation, and therefore eternal and beyond the means of man-intervention and change. A set of unified legal norms that are the basic regulation or the supreme law in Islam is called Sharia.
The Islamic economy is a branch of economic science where the studies have been carried out in the area of the Islamic economic system and its impact on economic changes and decisions.
Basic items of Islam are also the foundations of Islamic economics and are defined by four basic categories of Islam: 1. tawhid (tawhid - God is one and unique). It rejects obedience and humility of man to other people and confirms complete submission of man to God as the sole and absolute ruler of the world. 2. rububijjet (rububiyyah - Divine ditribution of the resources and managing things by their perfection). This is one of the fundamental laws which confirms the divine origin of the resources of the earth with their mutual obligation of equitable distribution. 3. Hilafat (khilifah - role of man as well as the governor of God-Khalifa on earth). It defines a person’s status, role and responsibility. And the fourth category, Tezkije (Tazkiyah - self-purification and growth). Tezkije principle is the basis from which the concept of the total Islamic development has been derived. It helps a man to get rid of its internal pressure and to achieve a high level of freedom and emancipation. The result is falah - material and spiritual progress in this world and the post-mortem world.
The verses relating to economic issues are distributed throughout the Qur’an, while in Sunnah they emerged as a response to current life issues and there are about forty thousand laws, orders, instructions and statements attributed to the Prophet.
Islamic approach to lending recognizes the need for borrowing with interest, but only as a last mean and with strictly defined conditions. One can borrow money with interest only when one is forced by the utter the necessities of life. In this case, the sin falls on the lender, not the borrower. This opinion is based on verses from the Koran pertaining to the prohibition of certain things accurately, but whose use, in extreme cases, however, is permitted.95 “ It is forbidden to you to eat dead meat, and blood, and flesh of swine, and what is slaughtered in someone else’s name , and not in the name of Allah ... and to one who is forced, when hunger strikes , with no inclination to sin, Allah will forgive and be compassionate “(5: 3) 92nd Islamic finance is built on the basis of Islamic learning in which “money by itself can not make money.” Islamic finance, and within them, Islamic banks reject interest rate mechanism and interest as the cost of capital, which represents a significant difference compared to conventional banks that have upon the very interest built

1089EP 2017 (64) 3 (1081-1100)
ISLAMIC BANKS AND FINANCE AND THE POSSIBILITY OF AGRICULTURAL INVESTMENTS IN THE REPUBLIC OF SERBIA
up their core business and development philosophy.
In order to create new value, the money has to be invested, ie. has to be put into operational business activities, whether it is a manufacturing, service or trade. Increase of wealth from business activities will not be “passed” if it is acquired on the basis of monopoly prices, or various other forms of illegal activities such as interest, corruption, blackmail, etc. Islamic finance is built on the fundamental principle of participation in the distribution of profit or loss from business partners.
Islamic banking
Islamic banks have the most important role in the current development of the Islamic financial system and they gave the largest contribution to the financing of economic development of Muslim countries.
The growth of Islamic banks in the last two decades is impressive and there is no doubt that in the future it will continue. The broad base of their clients, the volume of work they perform, as well as constantly raising the level of training of staff is the basis for the belief that it is not a simple and fleeting phenomenon. Credits for the development of modern Islamic financial system in large part can be taken by the theoreticians of Islamic economy. Islamic economics basically seeks to embed the ethical and moral principles of Islam as a religion into economic theory . The benefit of the community is not necessarily subordinate to the welfare of the individual, and it seeks to reconcile these two “interests” and to exclude competitive relationship between them.
Modern Islamic banking is linked to the end of the nineteenth and beginning of the twentieth century. The first Islamic financial institution, as a forerunner of modern Islamic bank was founded in 1963 in Meet-Ghamr Dakahlia province in Egypt.
A strong impetus to the development of Islamic finances was the establishment of the Islamic Development Bank (IDB - Islamic Development Bank) based in Jeddah, Saudi Arabia. In the development of the Islamic financial system, Islamic financial institutions have a crucial role.In the world today, there are over 200 different Islamic financial institutions operating in over 50 countries on all five continents, and particularly in the Middle East, Africa, Southeast Asia, North America and Europe. Beside them, there are a number of non-bank financial institutions: Islamic money market, Islamic mutual funds, Islamic Stock Exchange and Islamic insurance companies operating on the principles of Shariah.
The objectives and principles of the Islamic financial system
Objectives of the Islamic financial system are identical to the goals that traditional financial systems have . They are reflected in the mobilization and allocation of financial resources necessary to fund the development of national and regional economy. The objectives are realized within the financial institution, by the means of financial instruments and mechanisms. The realization of the objectives of Islamic finances significantly differs from conventional financial institutions. Islamic finances are built on the fundamental principle
1090 EP 2017 (64) 3 (1081-1100)
Bahrija Kačar, Jasmina Curić, Selma Ikić
of participation in the distribution of profit or loss, or the principle of risk sharing between business partners. Islamic finances, and within them, and Islamic banks reject interest rate mechanism and interest as the cost of capital, which represents a significant difference compared to conventional banks that have the interest built up in their core business and development philosophy.
One of the fundamental principles of the Islamic economic approach, therefore the Islamic banking is justice or fairness. In addition to this principle, there are the following principles, namely: absolute prohibition of paying or charging of interest in any form; obligation to share the profit or loss; inability to profit without taking risks, this refers to the work and the capital; prohibition of creating a “cash money”, the money represents only an intermediary that helps in the exchange; prohibition of gambling, excessive risk, speculation and uncertainty; prohibition of financing or work with products or activities prohibited in Islam.
The Islamic financial system in general, and Islamic banking in particular, is increasingly contributing to the financing of economic development, becoming a significant participant in global financial markets, but in our country they are not appreciated at all
The principles of Islamic banking
One of the basic principles of Islamic banking is an absolute ban on the use of interest rates in the financial operations of Islamic banks and financial institutions have their business philosophy based on business arrangements that include participation in profit or loss, and other, Sharia allowed, funding models.
The grounds of the Shariah are: Tawhid, Risaleh, Ahiret. Sharia law is not law in the conventional sense of the word. It presents a comprehensive and coherent set of legal rules, derived from God’s revelation, which, through a system of prohibitions and orders regulates the relations in all spheres of human activity. Sharia has four main sources:
Quran - holy book of God or in which there is no doubt, which is the first and most important source of law for all believers-Muslims.
Sunnah - the tradition and customs of the last Prophet of God through words, proverbs, sayings and deeds.
Ijma - consensus among Islamic jurists on a particular legal issue.
Qiyas - analogy as a fourth or a secondary source of Islamic jurisprudence.
Property rights in Islam are considered from different aspects, and they are the one of the topics which the theoreticians of Islamic economy paid a special attention to.True, genuine, real or beneficial owner. In the Qur’an we find a clear answer: “Allah is everything in the heavens and on earth” (2: 284).
The man manages assets with confidence in accordance with the principles of Shariah and is responsible to Allah. The man has an obligation to use revenues acquired on the basis of assets “entrusted” to him in the approved manner and for lawful purposes, and they

1091EP 2017 (64) 3 (1081-1100)
ISLAMIC BANKS AND FINANCE AND THE POSSIBILITY OF AGRICULTURAL INVESTMENTS IN THE REPUBLIC OF SERBIA
should not be used in a way that is forbidden and for the purpose which is not allowed. The man has the right to enjoy the material and sensual pleasures as long as it is within the boundaries of religion and while it does not distract him from thinking about God. The primary economic motivation of man in Islam is expressed through its contribution to maximizing the pleasure of God.
Acceptance of profit as the only measure of quality evaluation of a project, from the point of Islamic economics, is not acceptable. By its nature the profit tends to its magnification and is directed to the segments in which it will likely increase capital the fastest. It often uses exploitation as an instrument of its enlargement and negative effects of these must be neutralized by other categories of Islamic economics. Islam puts certain restrictions on business transactions in the financial market. They can be divided into five basic groups: Prohibited goods, services and activities: Islam prohibits the production, trade, consumption and other activities to certain goods and services that are harmful to the individual and his family, and for society as a whole. Prohibited products, services and activities as alcohol, intoxicants, drugs, pork, earning monopoly profits, corruption and bribery, abuse, pornography, gambling, speculation, fraud, terrorism and other products, services and activities that are prohibited under Shariah.
The prohibition of interest (riba): Islam strictly forbids interest and business interest. “O ye who believe, fear Allah and cancel the rest of the interest, if you are believers.” “If you do not, there you have it, let him know - the war from Allah and His Messenger! And if you repent, another principal possessions your will remain , not making any damage, nor will damaged to be. “(2: 278.279) The goal is to prevent injustice by which the creditor transfers all the risk to the debtor, which is contrary to the fundamental teachings of the Quran ‘ an and the Hadith. “Allah has cursed those who take interest, those who pay, those who write the contract, and those who witnessed the contract.” (Ahmad, Abu Dawud, al-Nesa, Ibn Majah and al-Tirmidhi).
Prohibition of transactions that contain a high degree of uncertainty (gharar): in businesses in which the partners do not have enough knowledge on the subject of buying and selling. The purpose of the prohibition is based on the fact that illegal methods contain elements of fraud, which can lead to misappropriation of another’s property, or conflict and hatred among people.
Prohibited manners of trade: refer to the type of purchase Refers to the buying and selling that implies: paying the price and delivery of goods in the future at prices that are now established (bay-Adien-bidi), or the sale of debt to debt. Permitted ways of buying and selling include: delivery of goods today and pay the price tomorrow, or within three to five days (Bai’e-al-hal), delivery of goods today and pay the price later date (bai ‘muajjal) and paying the price today and the delivery of goods later date (bai ‘as-Salam).
Other prohibited activities: Refer to the question of “final intentions” or “end user” of certain business activities. They will be allowed if the ultimate intention is not prohibited or end user is not debatable. The example can be selling of the land on which the buyer intends to build a factory that will produce prohibited goods, to provide prohibited services or perform
1092 EP 2017 (64) 3 (1081-1100)
Bahrija Kačar, Jasmina Curić, Selma Ikić
prohibited activities or selling products to those who intend to produce alcoholic beverages out of them. Islam does not deny the economic and other inequalities among people. It is natural and inherent in human beings and social systems. In the Qur’an, there is no evidence that seeks to eliminate inequality and to establish order in which everybody would each receive an equal share of economic wealth and Islam recognizes and tolerates a certain income inequality because all men are not equal in character, abilities and social contribution.
Models of financing in Islamic banking
Islamic banking system uses a larger number of financing models and they can be divided into three groups: (1) financial instrument mobilization of bank resources, (2) financing models, and (3) the instruments for the implementation of neutral banking operations.
Neutral banking transactions, item number three and instruments for the implementation of these operations are identical to those in the practice of conventional or traditional banks and are used in accordance with the international banking practice.
In the financial models mobilization of bank resources in Islamic banking, the bank does not pay interest to depositors . It offers depositors the participation in the distribution of profit or loss to be incurred through various banking business operations. The two main sources of funds of Islamic banks are: (1) demand deposits that are directly related to the current payment transaction and savings and (2) deposits for investments, which represent the main source of funding for banks and are intended for the financing of various projects.
1. Debit Accounts (Al-Wadi’ah contract) function the same like demand deposits. Savings Accounts (Al-Wadi’ah contract) are related to savings deposits (savings) of the population. Islamic Bank offers four different ways of depositing funds on these accounts: -acceptance of the deposit on the principles of trust, where the depositor of the bank is asked to give consent for the use of inputs to the account, with a legal obligation to return the deposit and unmandatory participation in the distribution of the realized profit if any, - the admission of saving deposits with the power bank to invest and profit share as a reward to the depositors according to the period and the amount of funds located on the account; -Treatment of savings deposit as qard hasan (a benevolent loan) which means allocationof all cash or non-cash effects to the bank - accepting savings deposits in joint investment accounts and their treatment as investment deposits.
2. Investment account (Profit and Loss Sharing PLS-accounts), that can be opened by individuals or companies for a certain period. The bank, concludes an agreement with depositor on the principles of Al-mudaraba where the bank appears in the role of “entrepreneur”, and depositor in the role of one who provides the necessary capital. The contract determines the amount or proportion of distribution of profit or loss.In this group accounts occur in several forms, namely: Common / General Investment Accounts, Time-bound investment accounts and Indefinite time investment accounts Special investment accounts (Profit and Loss Sharing-PLS accounts) allow depositors to deliberately direct their deposits for financing of specific projects. The bank appears in the role of representative or agent of the investor.
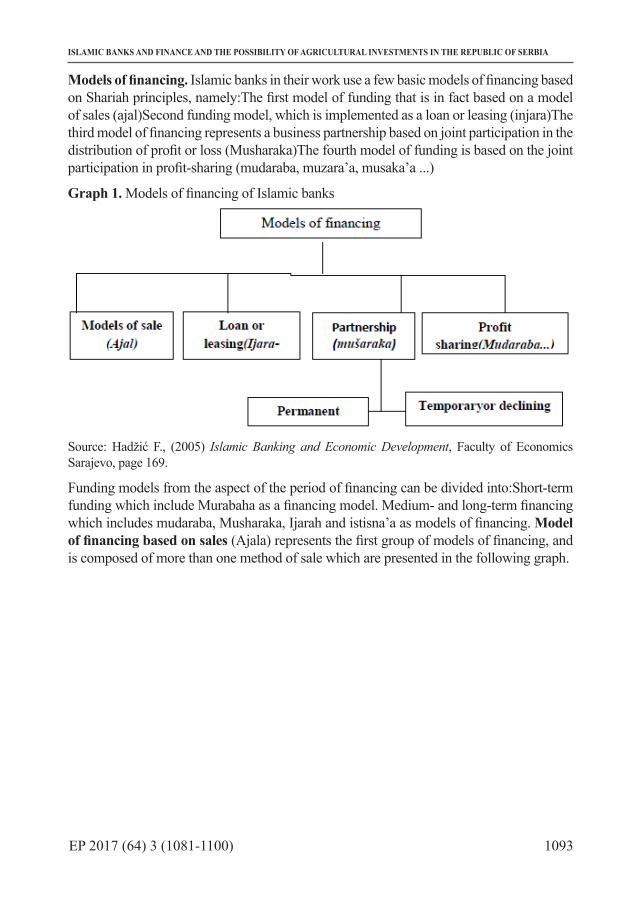
1093EP 2017 (64) 3 (1081-1100)
ISLAMIC BANKS AND FINANCE AND THE POSSIBILITY OF AGRICULTURAL INVESTMENTS IN THE REPUBLIC OF SERBIA
Models of financing. Islamic banks in their work use a few basic models of financing based on Shariah principles, namely:The first model of funding that is in fact based on a model of sales (ajal)Second funding model, which is implemented as a loan or leasing (injara)The third model of financing represents a business partnership based on joint participation in the distribution of profit or loss (Musharaka)The fourth model of funding is based on the joint participation in profit-sharing (mudaraba, muzara’a, musaka’a ...)
Graph 1. Models of financing of Islamic banks
Source: Hadžić F., (2005) Islamic Banking and Economic Development, Faculty of Economics Sarajevo, page 169.
Funding models from the aspect of the period of financing can be divided into:Short-term funding which include Murabaha as a financing model. Medium- and long-term financing which includes mudaraba, Musharaka, Ijarah and istisna’a as models of financing. Model of financing based on sales (Ajala) represents the first group of models of financing, and is composed of more than one method of sale which are presented in the following graph.
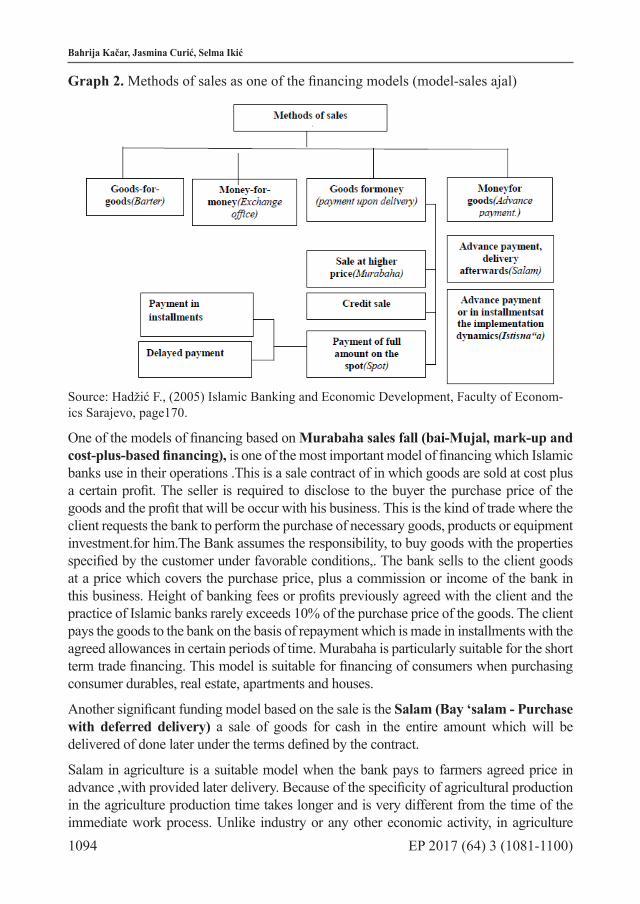
1094 EP 2017 (64) 3 (1081-1100)
Bahrija Kačar, Jasmina Curić, Selma Ikić
Graph 2. Methods of sales as one of the financing models (model-sales ajal)
Source: Hadžić F., (2005) Islamic Banking and Economic Development, Faculty of Econom-ics Sarajevo, page170.
One of the models of financing based on Murabaha sales fall (bai-Mujal, mark-up and cost-plus-based financing), is one of the most important model of financing which Islamic banks use in their operations .This is a sale contract of in which goods are sold at cost plus a certain profit. The seller is required to disclose to the buyer the purchase price of the goods and the profit that will be occur with his business. This is the kind of trade where the client requests the bank to perform the purchase of necessary goods, products or equipment investment.for him.The Bank assumes the responsibility, to buy goods with the properties specified by the customer under favorable conditions,. The bank sells to the client goods at a price which covers the purchase price, plus a commission or income of the bank in this business. Height of banking fees or profits previously agreed with the client and the practice of Islamic banks rarely exceeds 10% of the purchase price of the goods. The client pays the goods to the bank on the basis of repayment which is made in installments with the agreed allowances in certain periods of time. Murabaha is particularly suitable for the short term trade financing. This model is suitable for financing of consumers when purchasing consumer durables, real estate, apartments and houses.
Another significant funding model based on the sale is the Salam (Bay ‘salam - Purchase with deferred delivery) a sale of goods for cash in the entire amount which will be delivered of done later under the terms defined by the contract.
Salam in agriculture is a suitable model when the bank pays to farmers agreed price in advance ,with provided later delivery. Because of the specificity of agricultural production in the agriculture production time takes longer and is very different from the time of the immediate work process. Unlike industry or any other economic activity, in agriculture
1095EP 2017 (64) 3 (1081-1100)
ISLAMIC BANKS AND FINANCE AND THE POSSIBILITY OF AGRICULTURAL INVESTMENTS IN THE REPUBLIC OF SERBIA
there is the biological character of the subject of work, ie base material. Biological character of the subject of work inthe agriculture distinguishes this from other economic activities in the fact that the weight of the base material, plants and animals, increases with the time thrrough their growth and development. Respect of the technological maps involves the use of agro-technical measures in a precise, optimal timeframe. On the other hand, the growth and development of plants and animals is continuing. In perennial crops and in certain lines of livestock production , it is sometimes necessary to wait years or more on the end result ie. the finished product, in regard to the initial investment. This specificity of agriculture, which is also known as seasonality, causes direct economic implications reflected in the slow turnover of capital.
Salam as the model is in use and in construction, trade, financing of industrial production, handicraft production and business activities of small and medium-sized enterprises.
As salam model variant bai-muajjal also appears by which the seller allows the buyer to pay for goods at a projected future price in full or with a calculated repayment. Fixed price can be equal to, higher or lower than spot prices. Bai-salam and muajjal are practically Murabaha financing model derivatives.
Istisna’a (Bay’al-istisna) To implement this model, it is necessary to fulfill two conditions, namely:
- that at the time of concluding the transaction the subject of trade physically does not yet exist and
- it is not necessary to pay the full amount in advance, although the job can be fully paid in advance.
The Islamic Bank may appear in the role of an intermediary between the seller and buyer ny financing business. Also in this case two independent or related istisna’a contracts must be signed.
This funding model is not used in agricultural production, where we use salam contract, but is used for the realization of small (consumer goods, houses, etc.), as well as large projects (schools, hospitals, residential buildings, industrial plants, factories, turnkey projects in the field of high technology, process manufacturing, production of aircraft, ships, infrastructure facilities, etc.).
Models of financing that are realized as a loan or leasing
Ijarah (Ijara - Leasing), is a business relationship in which the bank buys items for future rental and lease and rents them to their clients. This is a classic “leasing” business. During the term of the lease Bank, as owner of the lease, transfers the right to use on the user. During the lease period the user, in addition to the lease,may pay part of the cost of the leasing object. After expiration of the contract equipment is returned to the owner or ownership is transferred to the user, or the user buys the equipment concerned.
Islamic banks differ two types of Ijarah or leasing operations, as follows:

1096 EP 2017 (64) 3 (1081-1100)
Bahrija Kačar, Jasmina Curić, Selma Ikić
-Operating Ijarah type involves the bank purchasing or buy certain assets or equipment that would later lease to interested users. Operating Ijarah work is used for rental property or expensive equipment which, due to high prices, users are not able to buy.
It can be used in industrial equipment, agricultural machinery or production and business facilities.
-Ijara business with purchase (Ijara-wa-iqtina) is similar to the operating-Ijarah financing model, except that in this case property or equipment, after the expiry of the rental period (especially after conclusion of the contract) i sold to the user of the rent..It represents the sale with deferred payment. Property or equipment is purchased per the request of the customer , so that the whole business is burdened with less risk of operating Ijarah transaction. The Bank will calculate into its selling price and a certain level of profit that will be previously agreed with the lessee. This form of Ijarah transaction is used for financing the purchase of real estate, computer and other equipment, machinery and the like. Model poslovnog partnerstva na bazi zajedničkog učešća u podeli profita ili gubitka
Model of business partnership based on joint participation in profit sharing or loss
Musharaka (shirka- partnership; Venture Capital Finance) is a business relationship between a bank and its client for the successful implementation of specific business activities. The bank and the entrepreneur or more of them together participate in financing investment and jointly run the business. This is a kind of “joint venture” - mutual investment. The partnership agreement shall govern the type of business framework in which the work will be completed, its duration and the distribution ratio of profit to be made in a specific business. Distribution of profit or loss will be realized upon completion of the transaction, at the end of the financial year, or in other terms that the partners agree. In the case of loss, it is charged from invested assets, which, after its deduction are returned to each of the partners. Profit which the bank realizes is directed a profit-pool of a bank. If the loss is incurred, the bank will cover it from the same pool-a.There are two basic forms of Musharaka as follows:
Permanent Musharaka(Equity Permanent Partnership) is a permanent share resulting from the bank’s ownership of share in the capital of the joint venture. By the ownership of equity the Bank acquires the controlling rights and participates in the distribution of dividends in accordance with the share in the shareholders’ equity of the company. If the company does not make a profit, it is clear that there is no distribution of dividends, and the reported loss will be covered at the expense of capital.
Temporary or decreasing Musharaka(Diminishing Equity Partnership) is a gradual decrease in the share of the bank or equity partner in the joint venture. The contractual relationship is based on participation in the equity of the company at its inception with an agreed schedule to reduce its participation, ie. Bank transfer ownership to other partners or shareholders. In proportion to its participation realized dividends are awarded to it.Musharaka financing model is especially applicable in agriculture and industry, more often in small and medium-sized enterprises than for large ones.The fourth group is a partnership based on joint participation in profit-sharing (mudaraba, muzara’a, musaka’a ...)
1097EP 2017 (64) 3 (1081-1100)
ISLAMIC BANKS AND FINANCE AND THE POSSIBILITY OF AGRICULTURAL INVESTMENTS IN THE REPUBLIC OF SERBIA
Mudaraba(Al-qirad, Al-muqarada, Profit Sharing, Trust financing), a special business arrangement between the bank (rab-al-maal) and the entrepreneur (mudariba) in which the bank appears only in the role of financier of a joint project without active participation in management and its practical realization.
An entrepreneur is the one who invests the idea, knowledge, labor, capital goods and equipment, and everything else that is necessary for the initiation and implementation of a particular business. The Bank does not enter into the management and implementation of practical work, but when concluding a contract it may, in cooperation with the entrepreneur, define certain terms that contracting parties shall respect. This funding model means that partners share the profits according to previously agreed percentage share. In case of loss, it is always and only borne by the owner of the invested capital (in this case the bank). It looses a part of the invested funds, a mudarib looses own effort, and part of the material and intangible assets. In the case of loss, diligence, professionalism and integrity mudariba are the ones which are evaluated. If these criteria are not met mudarib bank is obliged to compensate the damages. The concept of Musharaka is a model of participation in profit or loss, while muradaba is a model of participation in profit.
Mudaraba found its application in various segments of industrial production, crafts and trade. Because of the high risk which has burdened the operating principles of mudaraba, its implementation has been quite reduced lately.
As a variant mudarabah financing model there appear the two ones that are used in the field of agriculture, and operate on the principles of allocation of yields or of the crops. Thus, there are:
Muzara’a - one party gives or provides the soil (seed, fertilizer and machinery), and other labor and management. After the harvest yield is divided according to the previously agreed sizes.
Musaqah - one party provides the land with planted fruit, and other labor and management. After riping and collecting fruits, the yield is divided according to the previously agreed sizes.
Today, the provision of banking and investment services on the principles of Shariah is implemented in several ways:
• One way is that Islamic banks provide Islamic banking services both in Muslim countries and Western countries markets. They are established as independent banks or branches of Islamic banks and they offer services of Islamic banking or investment to their clients
• Another way is offering Islamic banking services to clients through the Western conventional banks
• The third is that conventional banks in the West open the “Islamic windows” for the provision of Islamic banking services on the financial market in Western countries and in Muslim countries establishing their own offices or independent banks in Muslim countries that operate on the principles of Shariah.

1098 EP 2017 (64) 3 (1081-1100)
Bahrija Kačar, Jasmina Curić, Selma Ikić
Conclusion and recommendations
Today, developing countries including the Republic of Serbia, are facing a serious debt crisis. Thei debt in the last ten years has been more than doubled. The biggest part of the debt problem includes the high cost of its maintenance. Annual interest payables are almost equalized with the obligations of return on equity. New borrowings are mainly directed to settling the old debt.
The Islamic financial system certainly has good prospects and widespread use in the developed economies and with better connection with finance and real economic sectors it will achieve stable growth and economic security of all participants.
Islamic banks with the change the legislation in the European and other countries and in the Republic of Serbia as well will get equal statusl as conventional banks. Then, they will be able to realistically assess their financial instruments based on Sharia versus conventional financial instruments.
Experience of changes in legislation and the work of Islamic banks represent a hybrid between commercial and investment banks. With the development of new financial instruments they will be able to a greater extent to meet the needs of economic and non-economic entities, which will contribute to the minimization of risk and increased interest in investing in these banks. Financing through Islamic banking, where the banks appear as partners both in financing and in the distribution of profit or loss (Musharaka), the distribution of profits (mudaraba) or calculation of the commission, in accordance with the previous agreement and the signed contract. For financing of agriculture because of its specificity significant is a Salam model of financing Islamic banks. In addition of this model funding model known as Ijarah is also significant , where the bank buys an item that it would later lease to its future clients.
References
1. Arnautalić E. (2015): Islamic banking-phenomenon of modern society, available at:http://poslovnisvijet.ba/islamsko-bankarstvo-fenomen-modernog-drustva /(1.4.2016)
2. Bakšić E. (2012): Islamsko Bankarstvo, available at: http://www.zeriislam.com/artikulli.php?id=2452 (02.27.2016)
3. Bozidar, Đ. (2007): When it will we be better, publishers, “Official Gazette”, B92, Blic, The Economist, p. 71-73, 120
4. Hadžić F. (2005): Islamic Banking and Economic Development, Faculty of Economics Sarajevo.
5. Hadžić F. (2016): available at: http://www.bbi.ba/bs/static/islamsko-bankarstvo(02/27/2016)
6. http://www.islamic-banking.com/islamic_banking_principle.aspx7. http://www.islamic-banking.com/profit_and_lose_sharing.aspx

1099EP 2017 (64) 3 (1081-1100)
ISLAMIC BANKS AND FINANCE AND THE POSSIBILITY OF AGRICULTURAL INVESTMENTS IN THE REPUBLIC OF SERBIA
8. http://www.islamic-banking.com/what_is_ibanking.aspx9. Karić, E. (1995): translated, The Qur’an, Bosanska knjiga, Sarajevo.10. Klincov, R., Majstorović, A., Miloradić, J. (2017): Vrednovanje rizika u
finansijskom menadžmentu, Oditor, Vol. 3, No. 1, pp. 114-125.11. Korkut, B. (1992): translated,The Qur’an, printed by order of hadimul-Haramain
King Fahd Ibn Abdul-Aziz Ali King Saud of Saudi Arabia in the Complex Hadım-l-Haramain-S-Šerifejni-l-Melik Fahd for the printing of the Mushaf of Medina Sheriff münevver , münevver Medina, Saudi Arabia, 1412H (1992).
12. Pejanović, R., Radović, G. (2011): Agrarna politika u Republici Srbiji u periodu tranzicije, Ekonomija teorija i praksa, Vol. 4, No. 1, pp. 29-38.
13. Pejanović, R., Radović, G., Tomaš, M., Maksimović, G., Krajinović, G., Jelić, V. (2010): Agricultural budget as a form of financing agriculture in the Republic of Serbia, Contemporary agriculture, Vol. 59, No. 1-2, pp. 206-213.
14. Statistical Office of the Republic of Serbia (2013b): Census of Agriculture 2012, Agriculture in the Republic of Serbia, SORS, Belgrade.
15. Štulanović M., Hadžić F. (2007): Osnovi islamske ekonomije i financija, Islamski pedagoški fakultet u Bihaću.
16. Title of the Law on Incentives in Agriculture and Rural Development, Official Gazette of the Republic of Serbia no. 10/2013.
17. Vladisavljević, V., Knežević, M., Divac, G. (2017): Pravna forma ugovora o finansijskom lizingu, Oditor, Vol. 3, No. 2, pp. 67-77.
18. Vlado, L. (2008): Financijske institucije i tržišta, Zagreb.19. Zamir I., Abbas M. (2009): Islamske financije teorija i praksa, MATE d.o.o.
Zagreb, p. 71-90, p. 164-165.20. Zamir, I., Mirakhor, A. (2009): Introduction to Islamic Finance - Theory and
Practice, Mate doo, Zagreb.
1100 EP 2017 (64) 3 (1081-1100)
Bahrija Kačar, Jasmina Curić, Selma Ikić
ISLAMSKE BANKE I FINASIJSKE INSTITUCIJE I MOGUĆNOST FINANSIRANJA POLJOPRIVREDE U REPUBLICI SRBIJI
Bahrija Kačar4, Jasmina Curić5, Selma Ikić6
Rezime
Finansiranje kakoprivrede tako i poljoprivrede u Republici Srbiji u dosadašnjem i aktuelnom periodurealizovalo i realizuje se uz finansijsku i kreditnu podršku države, kao i putem skupih kreditaposlovnih banaka i finansijskog lizinga. Imajući u vidu proizvodne resurse, značaj poljoprivrede za nacionalnuprivredu i zaposlenost stanovništva, a da finansiranje poljoprivredeu Republici Srbiji, na sadašnjem nivou njene razvijenosti, treba dabude realizovano uz podršku države. Država treba daradi na osnivanje specijalizovanepoljoprivredne banke i zakonskom regulativom omogući dolazak finansijskih institucija koje će plasirati sredstva po povoljnim uslovima kao što su Islamske finansijske institucije.
Islamske finansijske institucije, kod plasmana finansijskih sredstava tj kredita ne koriste kamatu, to je po islamskom učenju nepravedno i neprihvatljivo. Teoretičari Islamske ekonomije vide alternativu u temeljnim vrednostima i učenjima Islama, Kur’anu i Sunnetu, koji strogo zabranjuju kamatu.
Islamska banka može ostvariti i određene komparativne prednosti u odnosu na druge domaće banke. Ona je u poziciji da može uspostaviti kvalitetne poslovne veze sa klijentima iz Muslimanskih zemalja kako kod nastupa domaćih kompanija na njihovim tržištima, tako i kod nastupa kompanija iz Muslimanskih zemalja na tržištu Republike Srbije. Dalju prednost ove banke vidimo i u tome što bi jedan od njenih osnivača i IDB - Islamic Development Bank - vodeća razvojna banka Muslimanskog svijeta čija iskustva u realizaciji razvojnih projekata za Srbiju mogu biti od velike koristi. Ipak, najveći potencijal Islamska banka ima u uspostavljenju i razvoju poslovnih odnosa i saradnje sa sve većim brojem finansijskih i drugih institucija koje svoje poslovanje zasnivaju na principima šerijata.
Ključne reči: Poljoprivreda, kreditiranje poljoprivrede, islamske finansijske institucije, islamske bake
4 Dr Bahrija Kačar, asistent, Departman za ekonomske nauke, Državni univerzitet u Novom Pazaru, Ulica Vuka Karadžića bb, 36300 Novi Pazar, Srbija, Telefon:+381 62 333 808, E-mail: [email protected]
5 Dr Curić Jasmina, asistent, Departman za hemijsko – tehnološke nauke, Državni univerzitet u Novom Pazaru, Ulica Vuka Karadžića bb, 36300 Novi Pazar, Srbija, Telefon: +381 66 631 52 70, E-mail: [email protected]
6 Mr Ikić Selma, saradnik, Odeljenje za lokalni ekonomski razvoj, Gradska uprava Novi Pazar, Ulica Stevana Nemanja br. 2, 36300 Novi Pazar, Srbija, Telefon: +381 62 488 740, E-mail: [email protected]
1101
Economics of Agriculture 3/2017UDC: 519.216:[631+339.56]
EP 2017 (64) 3 (1101-1114)
NONLINEAR STOCHASTIC MODELLING DYNAMIC OF THE AGRICULTURAL PRODUCTS EXCHANGE RATES
Review article
NONLINEAR STOCHASTIC MODELLING DYNAMIC OF THE AGRICULTURAL PRODUCTS EXCHANGE RATES
Aleksandar Damnjanović1, Neđo Danilović2, Erol Mujanović3, Zoran Milojević4
Summary
The aim of this paper is to research some of the most important financial-stochastic models which enable the description of the dynamics of agricultural exchange rates. This dynamics is usually characterized by the properties of nonlinearity, hence the so-called conditional heteroskedastic models are used as the basic models for precise description of its behavior. The basic stochastic properties of these models, as well as the procedures to estimate their parameters, are also studied here. Finally, the conditional heteroskedastic models are applied in fitting of the empirical data: the nominal average cereals exchange rate indexes between the U.S. and the other countries.
Key words: time series, stochastic modeling, agricultural exchange rates.
JEL: Q13, Q14, Q18, M31
Introduction
For success in the business of market entities, it is very important to determine a certain degree of legality in the market, based on the current fluctuations (evolution) of the prices and other financial indexes of some products, as well as predict their future trends. To this aim, all relevant, available information that can be of significance for the movement of these indexes should be collected and also described by the appropriate mathematical model. The time and dynamics are usually taken into account as the basic categories, hence the determination of basic market laws can be made using the theory of probability. More precisely, the time series analysis can be made with the stochastic models, on the basis of which the uncertainty that occurs on the market is interpreted.
1 Aleksandar Damnjanović Ph.D., Associate Professor, The college of academic studies „Dositej“, Trg Nikole Pašića no. 7, 11000 Belgrade, Serbia, Phone: +381 60 032 9000, E-mail: [email protected]
2 Neđo Danilović Ph.D., Full Professor, „John Naisbitt“ University, Bulevar marsala Tolbuhina no. 8, 11070 Belgrade Serbia, Phone: +381 63 241 761, E-mail: [email protected]
3 Erol Mujanović M.Sc., World Bank, Washington, USA, Phone: +381 64 00 28 388, E-mail: [email protected]
4 Mr Zoran Milojević, Lecturer on ECDL standards in Serbia, 34000 Kragujevac, Serbia, Phone: +381 64 11 58 032, E-mail: [email protected]

1102 EP 2017 (64) 3 (1101-1114)
Aleksandar Damnjanović, Neđo Danilović, Erol Mujanović, Zoran Milojević
The aim of this paper is to research the most important financial-stochastic models that can describe various elements of the market of agricultural products, mainly the dynamics of their exchange rates. For this purpose, the new possibilities of the dynamics analysis, primarily related to the stochastic analysis of the financial index dynamics and formation of the appropriate theoretical model, are highlighted (Chavas, Cox, 1997). Apart from the standard methods in agricultural time-series analysis special emphasis is given to their practical application (Hill, Donald, 2003).
Many empirical results confirm the pronounced non-linearity of the financial index dynamics, which is also transmitted to the corresponding financial-stochastic modelling. In this sense, the base of formation of the appropriate models should be looked for in the well-known Autoregressive conditional heteroskedasticity (ARCH) models. These models have made radical changes in the stochastic analysis of financial indexes. The ARCH model as the basic mechanism in the analysis of financial indexes was introduced by Robert Engle (Engle, 1982), giving the very successful analysis of inflationary dynamics in Great Britain in 1982. Later, in 1986, Tim Bollerslev (Bollerslev, 1986) defined the so-called Generalized Autoregressive Conditional Heteroskedastic models (GARCH models) with the ARCH models as a conceptual basis. These models have been further modified and are still in use today (Balakrishnan et al., 2013).
The two mentioned kinds of models were able to explain a number of the properties of financial indexes, primarily, the changes in their volatility (Barndorff, Shephard, 2002). The basic stochastic features of these models are described in this paper. Furthermore, their application in modelling and studying the volatility of monthly data for the average exchange rate of some cereals, such as corn, rice, wheat and soybeans, between the U.S. and 79 other countries, plus the European Union (EU), is also given.
Theoretical background and methodology
As we already mentioned, many results based on the analysis of empirical data indicate the pronounced nonlinearity in the financial index dynamics, which is also transmitted to the corresponding financial-stochastic models. Without going into more detail on different concepts and ways of formally defining the market itself, from a stochastic point of view, the uncertainty which occurs on the market can be described by the probability model in which the dynamics of a financial index is represented by a stochastic process (Franses, Dijk, 2000):
which represents the family of random variables that depend on a discrete time parameter n. The assumption that the time moments n are discrete, is based on the fact that in specific (e.g. stock-exchange) situations, the index S is registered at separate time intervals and, as such, is described in the form of the above-mentioned stochastic time series (Figure 1.). Additionally, we assume that the problem of uncertainty that occurs
in each financial market can be described by the so-called filtration , for
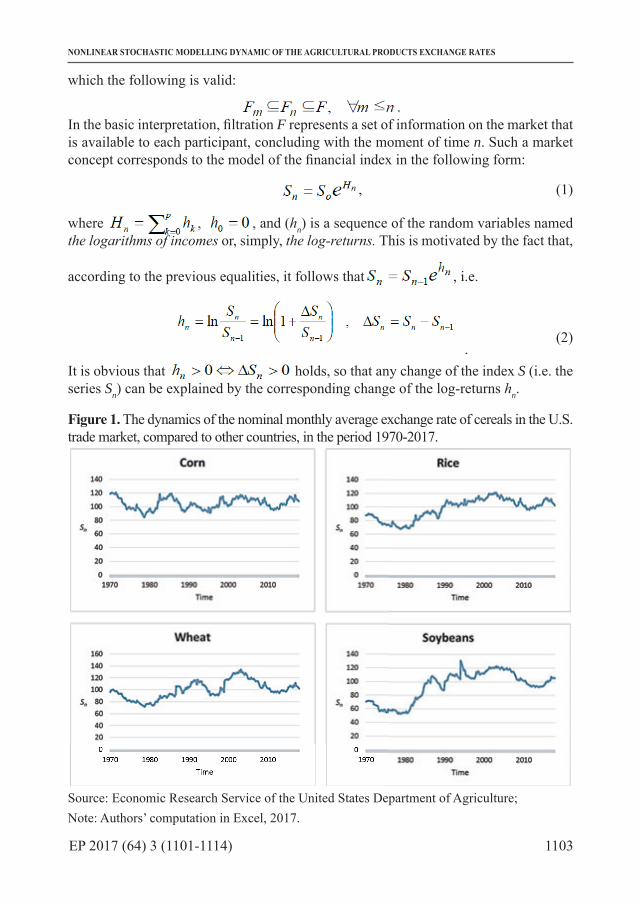
1103EP 2017 (64) 3 (1101-1114)
NONLINEAR STOCHASTIC MODELLING DYNAMIC OF THE AGRICULTURAL PRODUCTS EXCHANGE RATES
which the following is valid:
.In the basic interpretation, filtration F represents a set of information on the market that is available to each participant, concluding with the moment of time n. Such a market concept corresponds to the model of the financial index in the following form:
, (1)
where , and (hn) is a sequence of the random variables named the logarithms of incomes or, simply, the log-returns. This is motivated by the fact that,
according to the previous equalities, it follows that , i.e.
. (2)
It is obvious that holds, so that any change of the index S (i.e. the series Sn) can be explained by the corresponding change of the log-returns hn.
Figure 1. The dynamics of the nominal monthly average exchange rate of cereals in the U.S. trade market, compared to other countries, in the period 1970-2017.
Source: Economic Research Service of the United States Department of Agriculture;Note: Authors’ computation in Excel, 2017.

1104 EP 2017 (64) 3 (1101-1114)
Aleksandar Damnjanović, Neđo Danilović, Erol Mujanović, Zoran Milojević
Thus, the main problem here is to find an adequate model that could describe the distribution of the series (hn) and, therefore completely describes the behaviour and dynamics of the financial index S. For that purpose, we assume that the series (hn) has the conditionally-Gaussian distributional form (Mikosch, 2001):
(3)where ( ) is Fn-1-adaptive series which presents the total volatility, i.e. variability in the dynamics of the series itself. Since each market participant takes into account the values of index S as well as the degree of risk with which it enters into a particular investment, volatility is the basis for calculating this risk. By the Eq. (3), volatility is also defined as a series of random variables and, in that way, expressing its variability in time. On the other hand, (εn) presents a series of Fn-adaptive independent identically distributed (i.i.d.) random variables with the standard Gaussian N(0.1) distribution, popularly called “white noise”. Thus, this series defines fluctuations of the series (hn) that cannot be described by the volatility itself.
Figure 2. The monthly log-returns of the nominal average exchange rate of cereals (U.S. trade market vs. other countries) in the period 1970-2017.
Source: Economic Research Service of the United States Department of Agriculture;Note: Authors’ computation in Excel, 2017.

1105EP 2017 (64) 3 (1101-1114)
NONLINEAR STOCHASTIC MODELLING DYNAMIC OF THE AGRICULTURAL PRODUCTS EXCHANGE RATES
The series (hn) represents the sequence of uncorrelated random variables with a mathematical expectation:
(4)
and dispersion:
. (5)
Thus, it is often used as a stochastic model of the dynamics of empirical financial data (Figure 2). In addition, the observation of the squared series (hn
2) is often needed, which, according to the previous equations, presents an optimal unbiased estimate of the volatile series (σn
2).
In order to express the volatility of financial series in the form of time series of discrete time parameter, (Engle, 1982) introduces, today already historically known, autoregressive models of conditional heteroscedasticity (ARCH models). The base of the ARCH model interpretation defines the Eq. (3) as well as the recurrence relation for determining the volatility series:
(6)
In this way, volatility depends on the previous, known values (hn) and can be explicitly expressed on the basis of them. The ARCH model described by Eqs. (3)-(6) has a unique stationary solution if and only if the characteristic polynomial:
has the roots r1, r2,..., rp which satisfy the condition 1|| <jr , j = 1,…,p or, equivalently,
11
<∑ =
p
j jα . This fact is an important prerequisite for the successful implementation of
the ARCH model based primarily on the estimation of unknown coefficients páá ,,1 . In accordance, the ARCH model can be formed over the corresponding set of real, empirical data, as will be explained in detail in the next section.
The successful applications of the ARCH model led to the creation of new, more complex models that enabled the description of the different effects of the behaviour of financial markets. As a consequence, beside standard ARCH models, today exist many of its general modifications, which are based, more or less, on similar ideas and assumptions. Historically, the first generalization of the ARCH model was introduced by Tim Bollerslev (Bollerslev, 1986), who defined the so-called General ARCH (GARCH) model, with two parameters , 0p q > . In that model, usually labelled as GARCH (p,q), equality is taken (3), but the volatility ( ) is described by a relation:
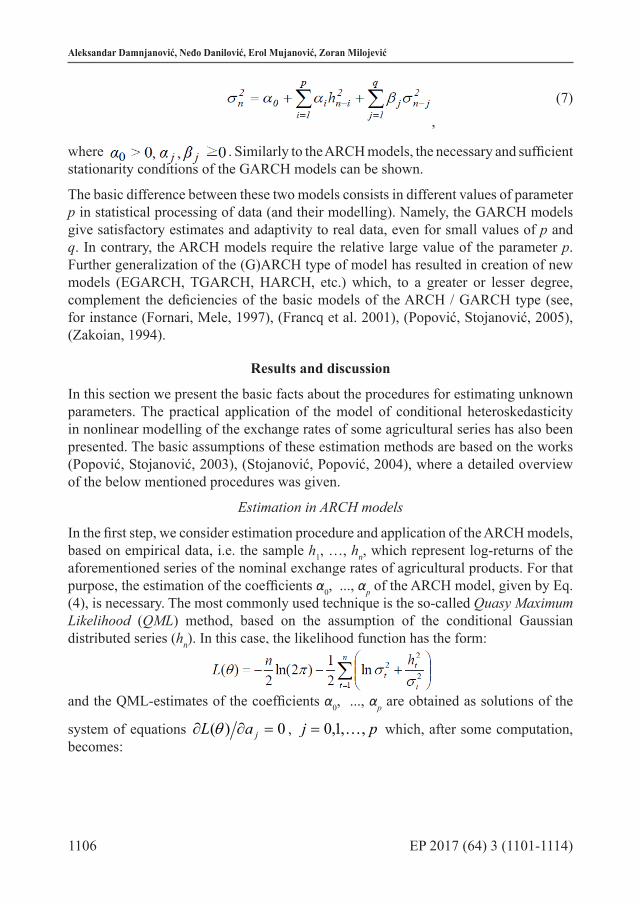
1106 EP 2017 (64) 3 (1101-1114)
Aleksandar Damnjanović, Neđo Danilović, Erol Mujanović, Zoran Milojević
, (7)
where . Similarly to the ARCH models, the necessary and sufficient stationarity conditions of the GARCH models can be shown.
The basic difference between these two models consists in different values of parameter p in statistical processing of data (and their modelling). Namely, the GARCH models give satisfactory estimates and adaptivity to real data, even for small values of p and q. In contrary, the ARCH models require the relative large value of the parameter p. Further generalization of the (G)ARCH type of model has resulted in creation of new models (EGARCH, TGARCH, HARCH, etc.) which, to a greater or lesser degree, complement the deficiencies of the basic models of the ARCH / GARCH type (see, for instance (Fornari, Mele, 1997), (Francq et al. 2001), (Popović, Stojanović, 2005), (Zakoian, 1994).
Results and discussion
In this section we present the basic facts about the procedures for estimating unknown parameters. The practical application of the model of conditional heteroskedasticity in nonlinear modelling of the exchange rates of some agricultural series has also been presented. The basic assumptions of these estimation methods are based on the works (Popović, Stojanović, 2003), (Stojanović, Popović, 2004), where a detailed overview of the below mentioned procedures was given.
Estimation in ARCH models
In the first step, we consider estimation procedure and application of the ARCH models, based on empirical data, i.e. the sample h1, …, hn, which represent log-returns of the aforementioned series of the nominal exchange rates of agricultural products. For that purpose, the estimation of the coefficients α0, ..., αp of the ARCH model, given by Eq. (4), is necessary. The most commonly used technique is the so-called Quasy Maximum Likelihood (QML) method, based on the assumption of the conditional Gaussian distributed series (hn). In this case, the likelihood function has the form:
and the QML-estimates of the coefficients α0, ..., αp are obtained as solutions of the
system of equations 0)( =∂∂ jaL θ , pj ,,1,0 = which, after some computation, becomes:
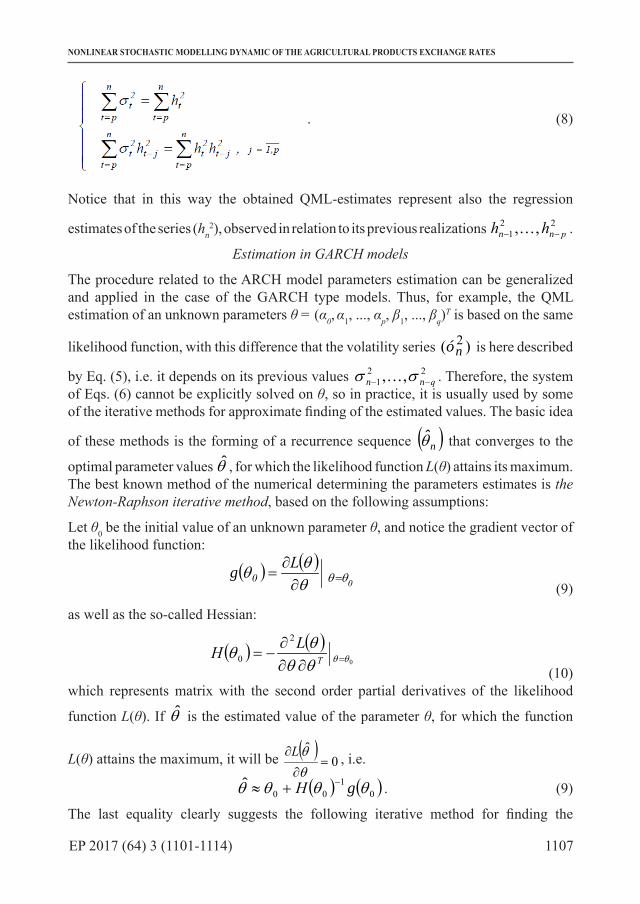
1107EP 2017 (64) 3 (1101-1114)
NONLINEAR STOCHASTIC MODELLING DYNAMIC OF THE AGRICULTURAL PRODUCTS EXCHANGE RATES
. (8)
Notice that in this way the obtained QML-estimates represent also the regression
estimates of the series (hn2), observed in relation to its previous realizations 22
1 ,, pnn hh −− .
Estimation in GARCH models
The procedure related to the ARCH model parameters estimation can be generalized and applied in the case of the GARCH type models. Thus, for example, the QML estimation of an unknown parameters θ = (α0 , α1, ..., αp, β1, ..., βq)
T is based on the same
likelihood function, with this difference that the volatility series )( 2nó is here described
by Eq. (5), i.e. it depends on its previous values 221 ,, qnn −− σσ . Therefore, the system
of Eqs. (6) cannot be explicitly solved on θ, so in practice, it is usually used by some of the iterative methods for approximate finding of the estimated values. The basic idea
of these methods is the forming of a recurrence sequence ( )nθ that converges to the
optimal parameter values θ , for which the likelihood function L(θ) attains its maximum. The best known method of the numerical determining the parameters estimates is the Newton-Raphson iterative method, based on the following assumptions:
Let θ0 be the initial value of an unknown parameter θ, and notice the gradient vector of the likelihood function:
( ) ( )0
Lg 0 θθθθθ =∂
∂=
(9)
as well as the so-called Hessian:
( ) ( )0
2
0 θθθθθθ =∂∂
∂−= T
LH (10)
which represents matrix with the second order partial derivatives of the likelihood
function L(θ). If θ is the estimated value of the parameter θ, for which the function
L(θ) attains the maximum, it will be ( )0
ˆ=
∂
∂
θθL , i.e.
( ) ( )01
00ˆ θθθθ gH −+≈ . (9)
The last equality clearly suggests the following iterative method for finding the

1108 EP 2017 (64) 3 (1101-1114)
Aleksandar Damnjanović, Neđo Danilović, Erol Mujanović, Zoran Milojević
parameters estimates:
( ) ( ) ,2,1,ˆˆˆˆ1
1
11 =+= −
−
−− kgH kkkk θθθθ (10)
for which, under certain conditions, convergence can be shown (detailed proof can be found in [19]). Using the iterative method (10), with certain accuracy, UMV estimates of the GARCH-coefficients are easily obtained. A particular problem here is the selection of the initial values that should allow the beginning of a convergent iteration, which will be furthermore more elaborated.
The application of the models
The described method of the parameters estimation in the ARCH models can be relatively easily applied in practical analysis of the agricultural time series. The following Table 1 shows the estimation results of the log-returns of cereals nominal monthly average exchange rates. Actual data series were observed in the period from 1970 to the first quarter of 2017, based on the data from the Economic Research Service of the United States Department of Agriculture. The sample sizes of these series is N = 576 and the summary statistics of the all of them are presented in the Table 1.
Table 1. The summary statistics of the monthly log-returns (and their squares) of the cereals nominal exchange rate.
Source: Authors’ computation in Excel, 2017.

1109EP 2017 (64) 3 (1101-1114)
NONLINEAR STOCHASTIC MODELLING DYNAMIC OF THE AGRICULTURAL PRODUCTS EXCHANGE RATES
A simple comparison of the shown values can give the explanation why these series can be fitted by the models of ARCH/GARCH type. First of all, these series can be interpreted as martingale differences, because their means and autocorrelations ACF(k) for non-zero lags (k = 1,2,3) are almost zero, i.e. they have no significant autocorrelation. On the other hand, squared series (hn
2) have emphasized ACFs, which are the evidence of volatility clustering. In addition, the existence of clustering, as a feature of grouping data with low or pronounced volatility, indicates high values of kurtosis, also. This results in the emphasis “tails” of the empirical data distributions (a typical such situation is shown in Figure 3).
Figure 3. Empirical distribution (histogram) of the log-returns in comparison with Gaussian distributions.
Source: Authors’ computation in statistical programming language “R”, 2017.
The following two Tables 2 and 3 show the estimated parameters’ values of ARCH (p) model, when p = 1,2,3, as well as GARCH (1,1) model, respectively. In addition, two typical goodness-of-fit statistics: Residual Standard Errors (RSE) and Akaike’s Information Criterion (AIC) have been estimated. Additionally, in the case ARCH-modelling, the estimated values of the Fisher’s F-statistic are computed, along with their estimated p-values (shown in brackets).
According to the values shown in Table 2, it can be easily seen that ARCH-models of different order p have similar characteristics. The estimated values of the goodness-of fit statistics are close to each other, whereby the RSE-scores have a relative small and the AIC-scores pronounced negative values. Thus, ARCH-models can be adequate theoretical models for describing the dynamics of the observed agricultural indexes. Finally, it should be noted that F-statistics have relative pronounced values in the case of exchange rate data of the corn and rice time series. This indicates that there is a significant difference between the variances of the squared series (hn
2), compared to its previous realizations. On the other hand, in the case of wheat and soybeans time series, no significant difference is detected.

1110 EP 2017 (64) 3 (1101-1114)
Aleksandar Damnjanović, Neđo Danilović, Erol Mujanović, Zoran Milojević
Table 2. The estimated values of the ARCH model’s parameters and the goodness-of-fit statistics.
Order of models
Estimated values
Products
Corn Rice Wheat Soybeans
p = 1
α0 1.820E-4 1.475E-4 2.216E-4 2.369E-4α1 3.935E-3 3.640E-3 2.334E-4 4.834E-4
RSE 4.411E-4 4.795E-4 1.505E-3 2.327E-3AIC -7262.1 -7166.0 -5848.3 -5346.4
F-statistic(p-values)
8.311** (4.090E-3)
4.927* (2.683E-2)
3.070E-3 (0.9558)
5.871E-3 (0.9390)
p = 2
α0 1.823E-4 1.468E-4 2.221E-4 2.376E-4α1 3.207E-3 2.961E-3 1.019E-3 2.552E-4α2 2.722E-3 3.157E-3 5.311E-3 1.187E-3
RSE 4.400E-4 4.784E-4 1.504E-3 2.329E-3AIC -7263.8 -7167.5 -5847.9 -5344.4
F-statistic (p-values)
4.949** (2.561E-3)
4.249** (1.473E-2)
0.779 (0.4591)
1.994E-2 (0.9803)
p = 3
α0 1.825E-4 1.460E-4 2.227E-4 2.379E-4α1 3.341E-3 3.070 E-3 9.077 E-4 2.278E-4α2 2.060E-3 2.428E-3 2.428E-3 1.073E-3α3 2.344E-3 3.284E-3 4.511E-3 6.172E-3
RSE 4.394E-4 4.772E-4 5.305E-3 2.331E-3AIC -7264.6 -7169.4 -5847.4 -5342.4
F-statistic (p-values)
6.030** (2.122E-3)
4.131** (6.509E-3)
1.308 (0.3753)
1.632E-2 (0.9972)
Source: Authors’ computation in statistical programming language “R”, 2017.
After that, we estimated coefficients of the GARCH (1,1) model. The previous estimated coefficients of ARCH(1) model (wherein β1=0) were taken as the initial estimates, which were previously determined by the standard QML procedure. The estimated values of GARCH (1.1) model, obtained by using the Newton-Raphson algorithm, for the aforementioned empirical agricultural series of cereals exchange rate indexes, are shown in Table 3. For all of these agricultural empirical data, we have also compared the efficiency of their fitting when the GARCH model was used. Thus, in the same Table 3, the estimated values of RSE and AIC are also presented. Note that, in comparison to ARCH-modelling, the estimated values of the goodness-of-fit statistics are generally less when the GARCH model has been applied, as an appropriate fitting model. Therefore, the GARCH model can be a more adequate theoretical model for fitting these series. This can also be seen in Fig. 4 where the empirical distributions (histograms) of the all observed data series were compared with the theoretical distributions, obtained by fitting with ARCH, as well as with GARCH models. As it can be easily seen, in all of these cases, GARCH modelling provides somewhat better match to the appropriate empirical distributions.

1111EP 2017 (64) 3 (1101-1114)
NONLINEAR STOCHASTIC MODELLING DYNAMIC OF THE AGRICULTURAL PRODUCTS EXCHANGE RATES
Table 3. The estimated values of the GARCH(1,1) model’s parameters, and the goodness-of-fit statistics.
Estimated values
Products
Corn Rice Wheat Soybeans
α0 4.794E-5 3.137E-5 4.519E-5 4.884E-6α1 1.452E-1 1.320E-1 7.098E-1 1.000E-8β1 5.884E-1 6.558E-1 4.219 E-1 9.797E-1
RSE 1.677E-4 1.652E-4 6.001E-5 3.979E-6AIC -7563.2 -8335.4 -71724.3 -6451.5
Source: Authors’ computation in statistical programming language “R”, 2017.
Figure 4. The empirical distributions of the log-returns of cereals nominal exchange rate in comparison with probability density of the fitted conditional heteroskedastic models.
Source: Authors’ computation in statistical programming language “R”, 2017.
1112 EP 2017 (64) 3 (1101-1114)
Aleksandar Damnjanović, Neđo Danilović, Erol Mujanović, Zoran Milojević
Conclusion
In this paper, the conditional heteroskedastic processes were used as stochastic models for the description of the dynamics of the agricultural exchange rate of cereals. Using the aforementioned estimation procedures, the appropriate theoretical models were obtained for which it was formally shown that they can qualitatively fit the empirical data, or their distribution. Of course, the above mentioned estimation procedures, as well as the choice of models themselves, should not be understood as universal. In contemporary statistical analysis of the behaviour of financial (or some other) indexes, in addition to different modifications of the (G)ARCH type models, some other related models are used (see, for instance (Durhan, 2007), (Huang, Fok, 2001), (Kapetanios, Tzavalis, 2010), (Pažun et al., 2016). Similarly, various procedures for estimating unknown coefficients of the corresponding theoretical model can be used (Sangjoon et al., 1998), (Singleton, 2001). In this way, one of the future guidelines in further research would be the application of such or similar models in fitting, i.e. precise description of the behaviour of agricultural time series.
References
1. Barndorff-Nielsen O. E., Shephard, N. (2002): Econometric Analysis of Realized Volatility and its use in Estimating Stochastic Volatility Model, Journal of the Royal Statistical Society: Series B, Vol. 64, pp. 253-280.
2. Balakrishnan, N., Brito, M. R., Quiroz, A. J. (2013): On the goodness-of-fit procedure for normality based on the empirical characteristic function for ranked set sampling data, Metrika, Vol. 76, pp. 161–177.
3. Bollerslev, T. (1986): Generalized Autoregressive Conditional Heteroskedasticity, Journal of Financial Economics, Vol. 31, pp. 307-327.
4. Chavas, J.-P., Cox, T. L. (1997): Production Analysis: A Non-Parametric Time Series Application to U.S. Agriculture, Journal of Agricultural Economics, Vol.48, pp. 330-348.
5. Engle, R. F. (1982): Autoregressive Conditional Heteroscedasticity with Estimates of the Variance of United Kingdom Inflation, Econometrica, Vol. 50, No. 4, pp. 987-1007.
6. Durhan, G.B. (2007): SV mixture models with application to S&P 500 index. Journal of Financial Economics, Vol. 85, No. 3, pp. 822–856.
7. Fornar, Mele, A. (1997): Sign- And Volatility Switching- ARCH Models: Theory and Applications to International Stock Markets, Journal of Applied Econometrics, Vol. 12, pp. 49-65.
8. Francq, C., Roussignol, M., Zakoian, J. M. (2001): Conditional Heteroskedasticity Driven by Hidden Markov Chains, Journal of Time Series Analysis, Vol. 22, No. 2, pp. 197-220.
9. Franses, P. H., Dijk, V. D. (2000): Nonlinear Time Series Models in Empirical

1113EP 2017 (64) 3 (1101-1114)
NONLINEAR STOCHASTIC MODELLING DYNAMIC OF THE AGRICULTURAL PRODUCTS EXCHANGE RATES
Finance, Cambridge University Press. 10. Huang, B.-N., Fok, R.C.W. (2001): Stock Market Integration-An Application of
the Stochastic Permanent Breaks Model, Applied Economics Letters, Vol. 8, No. 11, pp. 725–729.
11. Hill, M. J., Donald, G. E. (2003): Estimating Spatio-Temporal Patterns of Agricultural Productivity in Fragmented Landscapes Using AVHRR NDVI Time Series, Remote Sensing in Environment, Vol.84, No. 3, pp. 367-384.
12. Kapetanios, G., Tzavalis, E. (2010): Modeling structural breaks in economic relationships using large shocks, Journal of Economic Dynamics and Control, Vol. 34, No. 3, pp. 417–436.
13. Mikosch, T. (2001): Modeling Dependence and Tails of Financial Time Series, Laboratory of Actuarial Mathematics, University of Copenhagen.
14. Pažun, B., Langović, Z., Langović-Milićević, A. (2016): Econometric Analysis of Exchange Rate in Serbia and its Influence on Agricultural Sector, Economics of Agriculture, Vol. 43, No. 1, pp. 47-60.
15. Popović, B., Stojanović, V. (2003): Stacionarnost volatilnosti cene u ARCH modelima (in Serbian), Proceedings of the Conference SYM-OP-IS, September 2003, Herceg-Novi, pp. 575-578.
16. Popović, B., Stojanović, V. (2005): Split-ARCH, Pliska Studia Mathematica Bulgarica, Vol. 17, pp. 201-220.
17. Sangjoon, K., Shephard, N., Siddhartha, C. (1998): Stochastic Volatility: Likelihood Inference and Comparison with ARCH Models, Review of Economic Studies, Vol. 65, pp. 361-393.
18. Singleton, K. J. (2001): Estimation of affine asset pricing models using the empirical characteristic function, Journal of Econometrics, Vol. 102, No. 1, pp. 111–141.
19. Stojanović, V., Popović, B. (2004): Iterativni metodi ocene parametara u modelima uslovne heterogenosti (in Serbian), Proceedings of the Conference SYM-OP-IS, September 2004, Fruška Gora, pp. 513-516.
20. Zakoian, J. M. (1994): Threshold Heteroskedastic Models, Journal of Economic Dynamics and Control, Vol. 18, pp. 931-955.
1114 EP 2017 (64) 3 (1101-1114)
Aleksandar Damnjanović, Neđo Danilović, Erol Mujanović, Zoran Milojević
NELINEARNO STOHASTIČKO MODELOVANJE DINAMIKE RAZMENA POLJOPRIVREDNIH PROIZVODA
Aleksandar Damnjanović5, Neđo Danilović6, Erol Mujanović7, Zoran Milojević8
Apstrakt
Cilj ovog rada je istraživanje nekih od najvažnijih finansijsko-stohastičkih modela na osnovu kojih se može opisati dinamika razmene poljoprivrednih proizvoda. Ova dinamika, obično, ima svojstva nelinearnosti, zbog čega su takozvani uslovni heteroskedastički modeli korišćeni kao osnovni modeli koji mogu precizno opisati njeno ponašanje. Osnovna stohastička svojstva ovih modela, kao i procedure za ocenu njihovih parametara su ovde takođe istražena. Konačno, uslovni heteroskedastički modeli su primenjeni u fitovanju empirijskih podataka: nominalnih prosečnih indeksa razmene žitarica između SAD i drugih zemalja.
Ključne reči: vremenske serije, stohastičko modelovanje, razmena poljoprivrednih proizvoda.
5 Vanredni profesor, dr Aleksandar Damnjanović, Visoka škola akademskih studija „Dositej“, Trg Nikole Pašića br. 7, 11000 Beograd, Srbija, Telefon: +381 60 032 9000, E-mail: [email protected]
6 Redovni profesor, dr Neđo Danilović, „John Naisbitt“ Univerzitet, Bulevar maršala Tolbuhina br. 8, 11070 Novi Beograd, Srbija, Telefon: +381 63 241 761, E-mail: [email protected]
7 Mr Erol Mujanović, Svetska Banka, Vašington, USA, Telefon: +381 64 00 28 388, E-mail: [email protected]
8 Mr Zoran Milojević, Predavač na ECDL standardima u Srbiji, 34000 Kragujevac, Srbija, Telefon: +381 64 11 58 032, E-mail: [email protected]

1115
Economics of Agriculture 3/2017UDC: 338.48-44(1-22):[334.732:631.115.8]
EP 2017 (64) 3 (1115-1132)
OPPORTUNITIES TO REVITALISE RURAL TOURISM THROUGH THE OPERATION OF AGRARIAN COOPERATIVES
Review article
OPPORTUNITIES TO REVITALISE RURAL TOURISM THROUGH THE OPERATION OF AGRARIAN COOPERATIVES
Filip Đoković1, Radovan Pejanović2, Miloš Mojsilović3, Jelena Đorđević Boljanović4, Katarina Plećić5
Summary
Agrarian cooperatives are still in a period of transition. Practice shows that it is necessary to reconsider the business activities performed in the sector. Under the 2015 Cooperatives Act, rural tourism was recognised as a business activity, but the legal move has had no practical implications. In order to identify opportunities for the revitalisation of rural tourism, a study has been carried out based on interviews with the general managers of agrarian cooperatives. Their views have been analysed to gauge their awareness of the effects of rural tourism on rural areas arising from the operation of cooperatives, and the potential of human resources to implement the consequent organisational changes. In addition, the potential of agrarian cooperatives has been explored in the context of external surroundings. The results of the research have shown that the general managers view positively the revitalisation of rural tourism as part of the operation of the cooperatives, and that they are aware of the favourable impacts of tourism on rural areas, but that incompetence of the staff in the cooperatives has been a main obstacle to such a development.
Key words: agrarian cooperatives, rural tourism, general managers of cooperatives, revitalisation.
JEL: Q13, Q19, Z32.
1 Fillip Đoković Ph.D., Assistant Professor, Singidunum University, Faculty of Health, Legal and Business Studies, Železnička Street no. 5, Phone: +381 14 292 610, E-mail: [email protected]
2 Radovan Pejanović Ph.D., Full Professor, University of Novi Sad, Agricultural Faculty, Dositeja Obradovica Square no. 8, 21000 Novi Sad, Phone: +381 21 6350 622, E-mail: [email protected]
3 Miloš Mojsilović M.A., Ipsos Strategic Marketing, Gavrila Principa Street No. 8, Phone: +381 11 3284 075, E-mail: [email protected]
4 Jelena Đorđević Boljanović Ph.D., Associate Professor, Singidunum University, Faculty of Business, Kumodraška Street no. 261a, Phone: +381 11 3094 094, E-mail: [email protected]
5 Katarina Plećić M.A., Singidunum University, Faculty of Health, Legal and Business Studies, Železnička Street no. 5, Phone: +381 14 292 610, E-mail: [email protected]
1116 EP 2017 (64) 3 (1115-1132)
Filip Đoković, Radovan Pejanović, Miloš Mojsilović, Jelena Đorđević Boljanović, Katarina Plećić
Introduction
Rural development in high-income countries largely depends on cooperatives. The prosperity of rural communities hinges on a well-organised system within the agrarian cooperative sector. There is always a straightforward strategic dimension to development in a modern business environment, which is why business policies need to be harmonised with the principles of sustainable development.
Agrarian cooperatives, the area of focus in this paper, are the organisations that rest on economic as well as social and cultural values. The economic cornerstone of agrarian cooperatives suggests an entrepreneurial component, a set of actions guided by the sound market principles. (Pejanović, Njegovan, 2011) The social and cultural fundamentals uphold tradition, and support the family as the basic unit of society.
Aside from the agrarian cooperatives, the economic entities that make up the backbone of agricultural growth in Serbia include agricultural companies and individual farms (Njegovan, Pejanović, 2009; Pejanović, 2005). In terms of organisation, an agricultural company does not differ from any other, and can build ties with any business entity.
The interpretation of the basic notion behind the agrarian cooperative is rather complex, because the survival of a cooperative doesn’t depend exclusively on the number of employees and the number of collective members. (Cai et al, 2016; Ziran et al, 2015). The key concerns arise from the sustainability of a connection between household owners and the collective. As things stand right now, the existing organisational and market aspects slow down the growth and development of cooperatives, requiring their repositioning in the stakeholder community, which is the driving force behind rural development. (Pejanović et al, 2013; Richards, Manfredo, 2003).
In the era of neoliberalism, the existing framework within which business policies have been created fails to produce desired results. Serbia’s agrarian cooperatives are rather a consequence of the existing socio-economic system than a stable pillar of national economic growth. On the other hand, agrarian cooperatives in the European Union (EU) generate value, contributing to the economic development of member states as an integral part of a system composed of research institutions, the public and private sectors.
A modern business environment is exposed to complex and radical changes, creating a sense of urgency for organisations to reconsider repeatedly their own resources, goals and strategic guidelines. (Đoković, Kulović 2013) In order to make available the optimal use of the capacity of an organization, resources need to be reallocated as to unveil new ways to adapt to the market. In the context of agrarian cooperatives, the existing activities in their business portfolio do not add sufficient value, and have failed to create a business result. The paper is proceeding from the point that agrarian cooperatives in a process of transition should involve tourism as the business sector allowing them to improve their performance more efficiently and effectively, and to create a competitive advantage.
1117EP 2017 (64) 3 (1115-1132)
OPPORTUNITIES TO REVITALISE RURAL TOURISM THROUGH THE OPERATION OF AGRARIAN COOPERATIVES
Theoretical Framework
A cooperative is a voluntary organisation of individual producers and consumers designed to improve the quality of working conditions. (Pejanović, Njegovan 2011). The purpose of this type of organisation is to curb the fragmentation of agricultural land into small individual farms, with an emphasis on the equality of all participants in the cooperative, whose solidarity supports overall growth and developments.
The survival and development of rural areas rest on cooperatives. Hence the dominance of the economic purpose in building a collective. (Vučković, 1967).The economic principle pertains to market orientation, meaning that the cooperatives need to operate by the principles of productivity, liquidity and solvency. (Đekić, 2005)
The key reason for this type of association is to boost the competitiveness of rural areas and, by extension, individual producers. Without institutional support, that of a cooperative in this case, the individual agricultural producer faces very poor prospects, being exposed to numerous financial and technological risks. The aggregation has many advantages, including the lower cost of equipment, access to technology, education, training and personal development. (Njegovan, 2011; Krstić, 2002; Harris, Fulton 1999; Mihailović, 1998)
Having in mind the modern practice of cooperative action, and a large number of authors exploring the phenomenon of cooperatives, a consensus on the diversification of activities involving a cooperative system seems to be a distant prospect. (Marković, 2013; Pejčić, 2011; Maričić, 2006, Mihailović et al., 2005).
There are different forms of cooperative organisation. Depending on the purpose, cooperatives may be owned by producers, consumers and borrowers. (Pejanović, Njegovan 2011). The most common types are producers cooperatives, common facility cooperatives, cooperative banks and agricultural cooperatives. The purpose of producers cooperatives is to reduce price oscillations, contributing to a more efficient price policy and effective profit management for the members of a cooperative. Cooperative banking revolves around cooperative saving banks, providing loans for the members of cooperatives. Common facility cooperatives allow for the joint use of equipment, allowing for considerable savings in procurement and maintenance. The paper has explored agrarian cooperatives composed of individual farmers, focused on agricultural production and relevant agricultural processes.
The 2015 report Cooperatives Europe Key Figuresanalysed the key cooperative sectors and subsectors. The report included a large number of states and, unfortunately, Serbia is not one of them. Table 1 shows the shares in the total cooperative sector of cooperatives, members and employees of cooperatives, and the annual turnover of all subsectors covered by the report.

1118 EP 2017 (64) 3 (1115-1132)
Filip Đoković, Radovan Pejanović, Miloš Mojsilović, Jelena Đorđević Boljanović, Katarina Plećić
Table 1. Cooperative subsectors, share in the total cooperative sector
Subsector Cooperative Enterprises Members Employees Annual
TurnoverAgriculture 30.36% 6.93% 14.16% 39.34%Banking 2.48% 43.63% 18.18% -Consumption 6.82% 26.99% 12.97% 11.63%Housing 22.19% 8.80% 2.29% 2.51%Industry & Services 36.60% 2.03% 27.53% 9.65%
Insurance 0.01% 12% 0.83% 6.69%Health Care 0.45% 0% 0.06% 0.09%Renewable Energy 0.74% 0.22% 0.02% 0.11%Retail & Wholesale 0.35% 0.06% 23.95% 29.97%
Source: Cooperatives Europe Key Figures, 2015.
The share of the subsector of agriculture in the total number of cooperative enterprises is quite considerable - 30.36%, but the members (6.93%) and employees (14.16%) of cooperatives have lower shares. The annual turnover indicates a rather high share of agriculture in the total turnover (39.34%).
Under the 2015 Serbian Cooperatives Act, agrarian or farmer cooperatives serve different purposes, creating a specific business activity – supply, processing or services. The supply function is the basic one, as it provides cooperative members with raw materials and equipment necessary for agricultural production. The processing function serves the purpose of launching and carrying out a series of activities to make an agricultural product commercial, including the takeovers and buyoffs, processing and advertising the product and the cooperative as a whole.
The service function ties in with the previous two, paving the way to a successful trade in goods and services the cooperative and its members can offer. Special activities within the service function, which the paper deals with, involve services to the farmer households that have decided to add rural tourism to their regular activities.
In the context of agrarian cooperatives, rural tourism deserves more coverage in professional literature. In other words, the existing research has failed to explore the role of the rural tourism in the agrarian collective community.
The Value Chain in an Agrarian Cooperative
Pursuant to the national Cooperatives Act, agrarian cooperatives are market oriented enterprises, which means that the survival of an agrarian cooperative as an enterprise is made conditional on creating and maintaining value for all stakeholders. The so called “value chain” concept has been used to present a complete set of activities an agrarian cooperative performs. The purpose of the value chain is to identify those creating value and justifying the existence and survival of the enterprise. (Porter, 1998).

1119EP 2017 (64) 3 (1115-1132)
OPPORTUNITIES TO REVITALISE RURAL TOURISM THROUGH THE OPERATION OF AGRARIAN COOPERATIVES
The concept of value chains has a broad spectre of applications in tourism, involving tourist destinations, hotel enterprises and tour operators (Mwesiumo, Halpern, 2016; Yilmaz, Bititci, 2006).
The key activities involved in the agrarian cooperative’s value chain are primary and support activities. The primary activities refer to the production processes, delivery operations, services and the presentation of a spot where the income of an agrarian cooperative is created, implying inbound logistics, production, outbound logistics, marketing and sales.
Inbound logistics include arranging storage for production materials, takeovers and buyoffs of goods and raw materials from the cooperatives. The production process involves the conversion of raw materials into a final production. Marketing and sales are to sell a product made by a member of the cooperative, or the cooperative, including promotion, sales operations and a price policy. Finally, the development of rural tourism and education are attached to the previous processes, creating additional value for stakeholders, which in turn defines long-term directions of development for agrarian collectives as enterprises.
Infrastructure, human resource management (HRM) and the development of technology represent cost-generating support activities. The infrastructure behind an agrarian cooperative consists of activities related to the management of material assets, finance, accounting, legal affairs and fiscal liabilities, while the human resources constitute a support activity managing the listed infrastructure.
Procurement is a very important segment of the value chain, which largely affects the total expenditure of an agrarian cooperative. Procurement includes the acquisition of production materials, energy, parts and accessories for agricultural machinery, etc. The development of technology is viewed against a new setting within which the processes included in the primary activities will develop more effectively and efficiently. The results of a value chain is a profit generated after the cost of the primary activities has been covered.
The national legislation allows agrarian cooperatives to perform tourist activities, but the question is if they are prepared to launch and carry out the activities designed to boost rural tourism and rural areas at large. The prerequisites that need to be met coincide with the primary activities preceding those to support the development of rural tourism. That’s why it is very important not to neglect any part of the value chain, and to identify the place tourism deserves in the chain.
The development of rural tourism as a segment of the value chain in agrarian cooperatives would have multiple effects on the rural areas in which the cooperatives operate, as it would integrate all the other activities more closely. Education programmes would support the collective members who have the potential and are interested in adding the tourist component to their work. Moreover, those already involved in rural tourism will be encouraged to improve the quality and expand the range of their services.
1120 EP 2017 (64) 3 (1115-1132)
Filip Đoković, Radovan Pejanović, Miloš Mojsilović, Jelena Đorđević Boljanović, Katarina Plećić
To meet the requirements of rural tourism, the cooperative members need to create a surplus, which they would transform into the household’s assortment of services. The surplus, created as the result of an increasing number of tourists, might motivate the collective members to improve their farm machinery by investing in new equipment. A successful member of the cooperative who has added rural tourism to his business can easily attract new members to the cooperative. The role of rural tourism is, therefore, to start the value chain and tighten the links between the primary and support activities within.
General managers of agrarian cooperatives play a key role in the value chain. It is their knowledge, skills and competence that can merge the potentials of the external surroundings with the needs of a cooperative and its members. Modern business conditions require a constant reconsideration of the purpose of existence and activity, which in the context of agrarian cooperatives involves a decision if a tourist business component is to be integrated into a collective or not, given the long-term development of rural areas.
Methodology
The area of research covered by the paper is the impact the opinions by agrarian cooperatives’ general managers may have on opportunities to revitalise tourism through within the agrarian cooperative business.
The purpose of the paper is to analyse the opinions of the general managers of agrarian cooperatives, in order to find out if tourism can be included in their business portfolios.
The research sample includes 112 general managers of agrarian cooperatives that have the status of active business entities, and a positive financial result. The active businesses aside, the Business Registers Agency reports that an increasing number of agrarian cooperatives have been deleted from the register, entered bankruptcy proceedings or a liquidation process. The reason the authors decided to place an emphasis on the active business status and a positive financial result in the sampling procedure was the assumption that agrarian cooperatives operate in a market and have built the capacity for strategic development and growth.
The paper explores commitment by the general managers to use the organisational structure, human resources and business decisions to integrate rural tourism in the operation of agrarian cooperatives.
Research Instrument
The questionnaire consists of a set of 35 questions, of which 29 include a Likert-type five-point scale to rate the answers (1 – strongly disagree, 2 – disagree, 3- neither agree nor disagree, 4 – agree, 5 – strongly agree). The remaining six questions offer positive and negative response options (yes or no).
Hypotheses:
1121EP 2017 (64) 3 (1115-1132)
OPPORTUNITIES TO REVITALISE RURAL TOURISM THROUGH THE OPERATION OF AGRARIAN COOPERATIVES
H1: The role of tourism in the operation of agrarian cooperatives should be expanded.
H2: General managers are not familiar enough with the effects of tourism on the agrarian cooperative business.
H3: Human resources constitute a serious obstacle to the operation of agrarian cooperatives and long-range business planning.
The research results have been statistically processed, based on recognised statistical methods. Descriptive statistics have been provided (the mode, median and standard deviation). The data processing involved the following statistical analyses:
• Sample Analysis – T test, ANOVA;
• Linear Correlation;
• Factor Analysis – Multivariate Analysis.
These methods have been selected to explain more accurately the problems arising from the revitalisation of rural tourism through the operation of agrarian cooperatives.
Results
Based on the argument that tourism should be revitalised as an area of business within the operation of agrarian cooperatives, a comparison has been made with categorial variables. The research results are presented in tables.
The T-Test showed that the general managers of agrarian cooperatives maintain different views as to strategic frameworks and guidelines:
• Cooperative members’ involvement in tourism (t = -0.66, df = 110, p ≤ 0.51). Since the significance level is greater than 0.05, the conclusion is that the occurrences are not interrelated, proving the null hypothesis.
• Defined vision and mission (t = 3.69, df = 110, p ≤ 0.00). The statistical significance is considerable, as a 95% confidence level has been recorded. The general managers of the agrarian cooperatives that have defined their visions and missions are more positive towards the integration of tourism into the cooperatives’ business trends.
• Cooperative has adopted development strategy (t = 2.27, df = 110, p ≤ 0.03). Just like in the previous case, there is a statistically significant difference, and the null hypothesis is disproved. Namely, the general managers of agrarian cooperatives that have adopted a strategy on development believe that tourism should be integrated in the operation of the collectives.
• Cooperation with similar organisations abroad (t = 2.79, df = 110, p ≤ 0.01). There is a statistically significant difference, which means that the general managers who have initiated cooperation with similar organisations abroad are more inclined to support the integration of tourism in the collectives’ operations.

1122 EP 2017 (64) 3 (1115-1132)
Filip Đoković, Radovan Pejanović, Miloš Mojsilović, Jelena Đorđević Boljanović, Katarina Plećić
• Using the experience of partner organisations abroad (t = 2.66, df = 110, p ≤ 0.01). In this case, too, there is a statistically significant difference, as p ≤ 0.05. The general managers of agrarian cooperatives applying the experience arising from cooperation with partner organisations tend to recognise the importance of tourism in the operation of agrarian cooperatives.
• Professional assistance in the revitalisation of tourism through the functioning of agrarian cooperatives ( t = 2.42, df = 110, p≤ 0.02). A 95% confidence level has been reached, meaning that variables are interrelated. The general managers of the agrarian cooperatives who feel they need professional assistance in the revitalisation of tourism are strong advocates of the idea to make tourism one of the activities of the agrarian cooperative.
Table 2. Differences in terms of strategic orientation and cooperation on the one hand, and the argument that tourism can be revitalised through the operation of agrarian cooperatives (Leven’s and T-Tests used).
Dependent variable
Levene’s test t-test
F Sig. t df Sig. (2-tailed)
Mean Diff.
Std. Error Diff.
Mean Std. Deviation
Std. Error Mean
Cooperative members’ involvement in tourism
0,00 0,98 -0,66 110,00 0,51 -0,12 0,18 3,37 0,98 0,12
Defined vision and mission 3,19 0,08 3,69 110,00 0,00 0,75 0,20 3,59 0,79 0,08
Adopted development strategy
1,34 0,25 2,27 110,00 0,03 0,40 0,18 3,61 0,81 0,11
Cooperation with similar organisations abroad
0,92 0,34 2,79 110,00 0,01 0,52 0,19 3,59 0,91 0,11
Use of the experience of partner organisations abroad
0,41 0,53 2,66 110,00 0,01 0,47 0,18 3,68 0,89 0,13
Professional assistance in the revitalization of tourism, integration into agrarian cooperatives
0,24 0,63 2,42 110,00 0,02 0,57 0,24 3,52 0,88 0,09
Source: Author’s own calculation
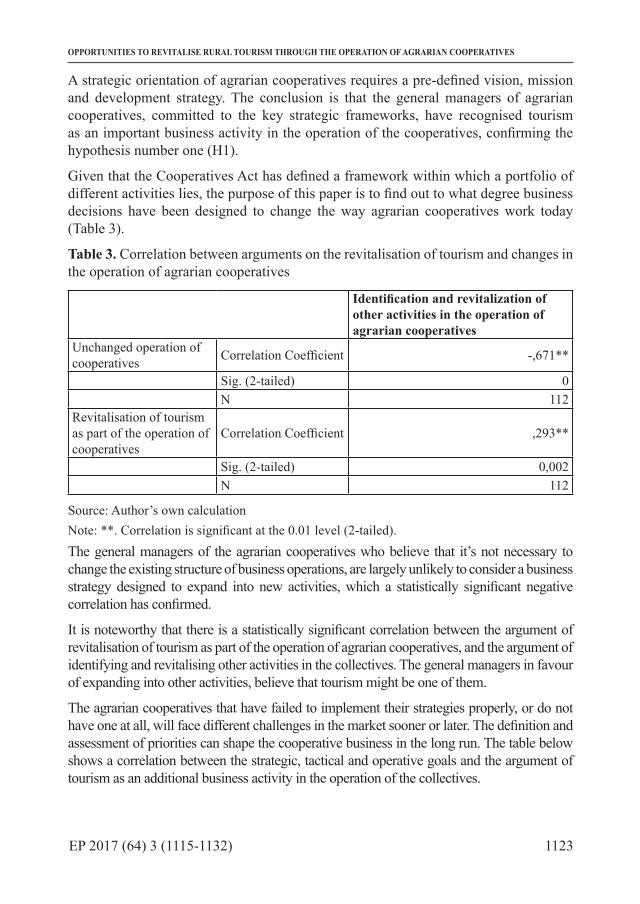
1123EP 2017 (64) 3 (1115-1132)
OPPORTUNITIES TO REVITALISE RURAL TOURISM THROUGH THE OPERATION OF AGRARIAN COOPERATIVES
A strategic orientation of agrarian cooperatives requires a pre-defined vision, mission and development strategy. The conclusion is that the general managers of agrarian cooperatives, committed to the key strategic frameworks, have recognised tourism as an important business activity in the operation of the cooperatives, confirming the hypothesis number one (H1).
Given that the Cooperatives Act has defined a framework within which a portfolio of different activities lies, the purpose of this paper is to find out to what degree business decisions have been designed to change the way agrarian cooperatives work today (Table 3).
Table 3. Correlation between arguments on the revitalisation of tourism and changes in the operation of agrarian cooperatives
Identification and revitalization of other activities in the operation of agrarian cooperatives
Unchanged operation of cooperatives Correlation Coefficient -,671**
Sig. (2-tailed) 0 N 112Revitalisation of tourism as part of the operation of cooperatives
Correlation Coefficient ,293**
Sig. (2-tailed) 0,002 N 112
Source: Author’s own calculationNote: **. Correlation is significant at the 0.01 level (2-tailed).The general managers of the agrarian cooperatives who believe that it’s not necessary to change the existing structure of business operations, are largely unlikely to consider a business strategy designed to expand into new activities, which a statistically significant negative correlation has confirmed.
It is noteworthy that there is a statistically significant correlation between the argument of revitalisation of tourism as part of the operation of agrarian cooperatives, and the argument of identifying and revitalising other activities in the collectives. The general managers in favour of expanding into other activities, believe that tourism might be one of them.
The agrarian cooperatives that have failed to implement their strategies properly, or do not have one at all, will face different challenges in the market sooner or later. The definition and assessment of priorities can shape the cooperative business in the long run. The table below shows a correlation between the strategic, tactical and operative goals and the argument of tourism as an additional business activity in the operation of the collectives.

1124 EP 2017 (64) 3 (1115-1132)
Filip Đoković, Radovan Pejanović, Miloš Mojsilović, Jelena Đorđević Boljanović, Katarina Plećić
Table 4. Correlation between pre-defined goals and the argument of tourism as a revitalised activity in the operation of cooperatives
Item Tourism as an additional activity in the operation of a cooperative.
Expansion of the cooperative’s business activities
Correlation Coefficient ,409**
Sig. (2-tailed) 0N 112
Software business
Correlation Coefficient ,408**
Sig. (2-tailed) 0N 112
Loan repayment
Correlation Coefficient -,188*
Sig. (2-tailed) 0,047N 112
Source: Author’s own calculationNote: **. Correlation is significant at the 0.01 level (2-tailed).
The general managers of the agrarian cooperatives who believe that it’s necessary to expand into new activities confirm that tourism is one of them. When it comes to software business, it is important to underline the affirmative position of the respondents on the integration of tourism. In other words, the respondents are familiar with the importance of information technologies in developing a business and gaining a competitive advantage. A statistically negative correlation has been noted between the argument of tourism and the repayment of loans as a strategic goal, leading to the conclusion that the respondents do not see tourism as an opportunity to find an easier way out of the financial crisis.
Based on factor analysis, (Extraction Method, Principal Component Analysis), three factors have been identified, as shown in the table below. Factor weights have been computed for every variable included in the analysis. The principal component analysis has been used to identify the factors. To test a correlation between the original variables, two statistical tests have been used: Bartlett’s Test of Sphericity (p=0.00) and Kaiser-Meyer-Olkin, which measured 0.75.
Table 5. Matrix assembly
Item Factor1 2 3
Legislation 0.784 Lack of government incentives 0.725 Number of employees 0.697 Unfair competition 0.696 0.364Credit liability 0.632 0.328

1125EP 2017 (64) 3 (1115-1132)
OPPORTUNITIES TO REVITALISE RURAL TOURISM THROUGH THE OPERATION OF AGRARIAN COOPERATIVES
Employee structure 0.592 0.551 Operation of collective alliances 0.441 0.338Education of members and employees 0.767 Employee inefficiency 0.717 Marketing 0.648 Business connection 0.612 0.454Recapitalisation 0.776Distribution of cooperative profit 0.775Relations between cooperative members and subagents 0.414 0.67
Source: Author’s own calculation
Three factors have been identified, explaining 57% of variance, indicating a modest yet sufficient level of variance the paper has focused on. The factors have been isolated to simplify the presentation of the SPSS outputs.
Factor 1, explaining a total of 28% of variance, refers to the problems arising from the national legislation and the role of the state in the operation of agrarian cooperatives.
Table 6. Factor 1Item Factor Weight
Lack of government incentives 0.725Number of employees 0.697Unfair competition 0.696Credit liability 0.632Employee structure 0.592Operation of cooperative alliances 0.441Relationship between cooperative members and subagents 0.414
Source: Author’s own calculation
In the context of Factor 1, individual problems have been detected in relation to government actions and in terms of what a cooperative might expect from the state, including a lack of government incentives and unfair competition.
The problems arising from the competence and efficiency of employees in agrarian cooperatives have merged into the Factor 2.
Table 7. Factor 2Item Factor weight
Education of cooperative members and employees 0.767Inefficiency of employees 0.717Marketing 0.648Business connections 0.612Employee structure 0.551
Source: Author’s own calculation

1126 EP 2017 (64) 3 (1115-1132)
Filip Đoković, Radovan Pejanović, Miloš Mojsilović, Jelena Đorđević Boljanović, Katarina Plećić
Factor 2 explains close to 17% of variance, dominated by the problems related to prospects for the employees and their competences. .
Factor 3 comprises a set of financial challenges affecting the operation and long-term activities of agrarian cooperatives.
Table 8. Factor3Item Factor weight
Business connections 0.454Recapitalisation 0.776Distribution of cooperative profit 0.775Relations between cooperative members and subagents 0.670Unfair competition 0.364Credit liability 0.328Operation of cooperative alliances 0.338
Source: Author’s own calculation
The last factor explains nearly 11% of variance, including mostly financial problems, like recapitalisation, profit distribution methods and the like.
A cross-reference between the three factors and the argument that tourism should be integrated in the operation of agrarian cooperatives unveiled a considerable correlation with Factor 2, as presented in the table below:
Table 9. Correlation between the Factors and the argument that tourism should be revitalised and integrated in the operation of the cooperatives
Item
Tourism as a revitalised activity in the operation of a cooperative
REGR factor score 1 for analysis 3
REGR factor score 2 for analysis 3
REGR factor score 3 for analysis 3
Tourism as a revitalised activity in the operation of a cooperative
Corr. Coeff 1 -,187* ,295** 0.141Sig. (2-tailed) . 0.049 0.002 0.139N 112 112 112 112
REGR factor score 1 for analysis 3
Corr Coeff. -,187* 1 0.026 0.011Sig. (2-tailed) 0.049 . 0.786 0.912N 112 112 112 112
REGR factor score 2 for analysis 3
Corr. Coeff. ,295** 0.026 1 0.037Sig. (2-tailed) 0.002 0.786 . 0.695N 112 112 112 112
REGR factor score 3 for analysis 3
Corr. Coeff. 0.141 0.011 0.037 1Sig. (2-tailed) 0.139 0.912 0.695 .N 112 112 112 112
Source: Author’s own calculationNote: **. Correlation is significant at the 0.01 level (2-tailed).

1127EP 2017 (64) 3 (1115-1132)
OPPORTUNITIES TO REVITALISE RURAL TOURISM THROUGH THE OPERATION OF AGRARIAN COOPERATIVES
The general managers who tend to believe that tourism should be a significant activity in the operation of a cooperative are also aware that the problems in the operation of the collective lie in the domain of human resources, confirming the hypothesis that human resources create major obstacles to the operation of agrarian cooperatives and long-term planning.
Discussion
A model for the operation of agrarian cooperatives in a modern business setting requires a completely new approach, based on a radical reconsideration of their operations and functions. The surroundings, external surroundings in particular, demand quick adaptation to change, which remains a serious challenge for Serbia’s agrarian collectives.
The results of the research have confirmed that value creation has to be based on new sources, included timely in gaining a competitive advantage. The general managers of agrarian collectives prefer different strategies, and are separated into two groups – the re-activists, not involved in strategic planning, and the pro-activists, who have made their strategic orientation a priority.
The pro-activists have a certain vision, mission and development strategy, and are more likely to recognise the importance of tourism in the operation of agrarian cooperatives. On the other hand, the re-activists have no vision, mission and development strategy, and are quite unlikely to change the status of their cooperatives any time soon.
The lack of planning documents with a number of agrarian collectives should be viewed as a source of instability and unsystematic business decisions that can’t be consistent with the cooperative’s goals, as there aren’t any. With those possessing the planning documents, there should be firm insistence that the goals be met, and any deviation evaluated.
The general managers of agrarian cooperatives initiating cooperation with similar organisations have also used the experience arising from the collaboration. This is very important as the general managers are striving to identify a concept acceptable for the existing organisation structure, corresponding with the capacity of their cooperative, and conductive to the use of the new experience. The research results show that they are open to the integration of tourism, and are quite confident about multiplicative effects tourism might have on economy.
The results of the research have also unveiled clear interest in expanding into new activities. It goes without saying that tourism can be one of them, given it heterogeneous nature. The initiation of tourism into the operation of a cooperative may raise the issue of the performance of other activities, constituting the pillars of the collective business.
Modern business implies an integral approach to management, based on information technologies. Research shows that the general managers of cooperatives in favour of the integration of tourism into their operation attach more importance to software business, and see it as part of a solution to their problems. The results make it clear that software owned by an agrarian cooperative facilitates its operations, unifying the business processes from the procurement of raw materials, through accounting to creating financial reports.

1128 EP 2017 (64) 3 (1115-1132)
Filip Đoković, Radovan Pejanović, Miloš Mojsilović, Jelena Đorđević Boljanović, Katarina Plećić
Even though a group of the general managers of agrarian corporations are clearly proactive, their enthusiasm is often curbed by factors in the external surroundings, including, above all, restrictions in the national legislation and the ambivalence of the state as to the fundamental criteria to define a business setting for the collectives. There’s a clear lack of appropriate government incentives to facilitate the procurement of raw materials, machinery, etc.
The European Union (EU) has provided for a more transparent system of incentives, making the end-product competitive and in line with the standards of quality (Pejаnović et al, 2016; Mataga et al, 2013).The EU model is quite different from Serbia’s though, the latter offering a subsidizing model that can hardly meet the needs of the cooperatives (Ševarlić, Nikolić, 2012). The research results have confirmed the problem of subsidies, which cannot remove the fundamental barriers to a viable operation of the collectives, but address operative problems only.
In order to achieve the goals corresponding with the cooperative’s vision and mission, it is necessary that the employees possess certain knowledge and skills. The results show, however, that there’s pronounced incompetence in human resources, lacking potential to meet the new market demands, in this case, the inclusion of tourism into the operation of the cooperatives. The general managers are completely aware of the limitations, and are prepared to educate the staff.
In the era of knowledge economy, the definition of intellectual capital, which involves the knowledge, skills, experience and creativity of the employees, goes beyond traditional interpretations of capital, which is why it deserves special attention from the general managers.
The results confirmed the dominance of financial problems in the functioning of the cooperatives, but they are a mere consequence of the problems arising from the incompetence of cooperatives’ employees, poor infrastructure and the requirements of doing business. A group of the general managers agreed that tourism can be the driving force behind initiating re-engineering as a strategic management concept. Neither the role of the state nor finances are as much of the problem for those who feel that tourism can be a new activity as the organisation structure, skills, education and efficiency of the employees are.
Conclusion
Research papers have confirmed that agrarian cooperatives have been facing a series of structural problems that have curbed their growth and development, including restrictive legislation, market instability and the questionable competiveness of agricultural products (Simonović, 2014; Pejanović, Njegovan, 2011; Paraušić, Cvijanović, 2014).
The survey involving the general managers of agrarian cooperatives produced a general conclusion that they were quite positive towards the revitalisation of tourism and its initiation into the cooperatives, which confirmed the first hypothesis. The research
1129EP 2017 (64) 3 (1115-1132)
OPPORTUNITIES TO REVITALISE RURAL TOURISM THROUGH THE OPERATION OF AGRARIAN COOPERATIVES
results have also showed that a dominant positive stance on tourism goes hand in hand with their increasing awareness of multiplicative effects of tourism on the economic trends in rural areas, disproving the hypothesis number two.
On the other hand, a move to revitalise tourism and integrate it into the operation of agrarian cooperatives may be a serious challenge, as the general managers of the cooperatives have cautioned that human resources and the incompetence of employees might be a stumbling block in the process, proving the third hypothesis. It is safe to say that the direction in which the cooperatives should develop has been established, but that it calls for re-engineering as a strategic management concept, in order to create conditions for a competitive business activity.
The limitations of this paper include an under-researched sample and the circumstances surrounding the study, including the transition of the cooperative sector.
The research presented in this paper sheds new light on just one of many approaches to the management of agrarian cooperatives, and their potential to reconsider their operations and analyse many other factors and circumstances involving in making timely business choices.
The positions of the general managers of agrarian cooperatives have been researched repeatedly over the past few years. One of the key reasons for the growing interest is that the general managers, integrated in the management structure, are the generators of change and new values in their organisations. Fully aware of the limitations of the study and a specific social and economic national context, we believe it is important to continue the research to pave the way to a proper setting for the next strategic steps in the cooperative sector and agriculture in general. The Republic of Serbia’s clear commitment to joining the EU makes the theme all the more relevant.
Literature
1. Cai, R., Ma, W., Su, Y. (2016): Effects of member size and selective incentives of agricultural cooperatives on product quality. British Food Journal Vol. 118, no. 4, pp. 858 – 870.
2. Đekić, S. (2005): Agrarni menadžment (978-86-85099-96-0). Ekonomski fakultet u Nišu, Niš.
3. Đoković, F., Kulović, Dž. (2013): Strategijsko odlučivanje u hotelijerstvu, Socioeconomica. Vol.2, No.4, pp. 288 – 300.
4. Harris, A., Fulton, M. (1999): Farm machinery cooperation in Saskatchewan and Quebec. Centre for Cooperatives, University of Saskatchewan, Saskatoon.
5. Krstić, V. (2002): Neke prednosti zadružnog organizovanja u našim uslovima privređivanja. Ekonomika, Vol. 48, No 4-5, pp 106-110.
6. Li, Z., Jacobs, K., Artz, G. (2015) The cooperative capital constraint revisited. Agricultural Finance Review, Vol. 75, No. 2, pp. 253 – 266.

1130 EP 2017 (64) 3 (1115-1132)
Filip Đoković, Radovan Pejanović, Miloš Mojsilović, Jelena Đorđević Boljanović, Katarina Plećić
7. Maričić, B. (2006): Zadrugarstvo u vremenu tranzicije: neostvarene incijative(86-84153-65-0). Naučna KMD, Beograd.
8. Marković, Ž. (2013): Putevi i stranputice Srbije: samoupravljanje, tranzicija, zadrugarstvo (978-86-6021-069-4). Naučna KMD, Beograd.
9. Mataga, Ž., Papeš, D., Petak, A. (2009): Poljoprivredne zadruge u zemljama Europske Unije, Sociologija i prostor: časopis za istraživanje prostornoga i sociokulturnog razvitka, Vol.43, No.1, pp. 215-277.
10. Mihailović, L., Pejčić, H., Marković, K. (2005): Zemljoradničko zadrugarstvo između teorije i prakse. Sven, Niš.
11. Mihailović, L. (1998): Neki savremeni pogledi na zadrugarstvo i ruralni razvoj. Ekonomika poljoprivrede, Vol. 45, No. 1-2, pp 23-34.
12. Mwesiumo, D., Halpern, N. (2016): Interfirm conflicts in tourism value chains, Tourism Review, Vol. 71, No. 4, pp. 259 – 271.
13. Njegovan, Z. (2011): Agrarno ili zadružno pitanje – prilog za razumevanje zadrugarstva u Republici Srbiji. Ekonomika preduzeća, Vol. 59, No. 5-6, pp 297-307.
14. Njegovan, Z., Pejanović, R. (2009): Ruralna regionalizacija Vojvodine (978-86-7728-075-8). Poljoprivredni fakultet Univerziteta u Novom Sadu, Novi Sad.
15. Paraušić, V., Cvijanović, D. (2014): Kokurentnost agroprivrede Srbije - klasteri u funkciji održive regionalne konkurentnosti (978-86-6269-034-0). Institut za ekonomiku poljoprivrede, Beograd.
16. Pejanović, R. (2005): Agrarne zadruge kao preduzetničke organizacije, Ekonomski vidici, Društvo ekonomista Beograda,Vol. 10, No. 1, pp. 45-55.
17. Pejanović, R. (2015): Predgovor za knjigu: Zadrugarstvo u Srbiji, Hesperia, Beograd, str. 9 – 12.
18. Pejanović, R., Glavaš-Trbić, D., Tomaš-Simin, M. (2013): O uzrocima krize poljoprivrede Republike Srbije. Ekonomika poljoprivrede, Vol. 60, No. 2, pp. 253-264.
19. Pejanović, R., Njegovan, Z. (2011): Ruralni razvoj i lokalno-ekonomski razvoj AP Vojvodine. Poljoprivredni fakultet Univerziteta u Novom Sadu, Novi Sad., pp 115-132.
20. Pejčić, H. (2011): Ekonomika poljoprivrede (978-86-7746-277-2). 4th ed., Sven, Niš.
21. Pejnović, D., Radeljak Kaufmann, P., Lukić, A. (2016): Development and Contemporary Characteristics of Agricultural Cooperatives in the Area of Croatia. Hrvatski geografski glasnik, Vol. 78, No. 2, pp. 5-48.
22. Porter, M. (1998): On Competition (0-684-84146-0). Harvard Business School Press, Harvard.

1131EP 2017 (64) 3 (1115-1132)
OPPORTUNITIES TO REVITALISE RURAL TOURISM THROUGH THE OPERATION OF AGRARIAN COOPERATIVES
23. Richards, T., Manfredo, M. (2003): Post-merger performance of agricultural cooperatives. Agricultural Finance Review, Vol. 63, No. 2, pp. 175 – 192.
24. Simonović, Z. (2014): Upravljanje agrarom Srbije u tranziciji (978-86-6269-037-1). Institut za ekonomiku poljoprivrede, Beograd.
25. Ševarlić, M., Nikolić, M. (2012): Stavovi direktora zadruga i zadrugara o zemljoradničkom zadrugarstvu u Srbiji (978-86-86087-32-4). Društvo agrarnih ekonomista Srbije, Beograd.
26. Vučković, M. (1957): Zadrugarstvo. Zadružna štampa, Zagreb.27. Yılmaz, Z., Bititci, U. (2006): Performance measurement in tourism: a value
chain model, International Journal of Contemporary Hospitality Management, Vol. 18, No. 4, pp. 341 – 349.
28. Zakon o zadrugama (“Official Gazette of the RS” no. 112/2015).
1132 EP 2017 (64) 3 (1115-1132)
Filip Đoković, Radovan Pejanović, Miloš Mojsilović, Jelena Đorđević Boljanović, Katarina Plećić
MOGUĆNOSTI REVITALIZACIJE RURALNOG TURIZMA U FUNKCIONISANJU AGRARNIH ZADRUGA
Filip Đoković6, Radovan Pejanović7, Miloš Mojsilović8, Jelena Đorđević Boljanović9, Katarina Plećić10
Rezime
Agrarne zadruge se nalaze još uvek u tranzicionom periodu. Dosadašnja praksa je pokazala da je potrebno preispitati delatnosti koje u njima funkcionišu. Prema Zakonu o zadrugama iz 2015. godine, ruralni turizam je prepoznat kao delatnost ali se u praksi to u većoj meri nije ispunilo. Kako bi se utvrdilo u kojoj meri postoje mogućnosti za revitalizaciju ruralnog turizma, sprovedeno je istraživanje među direktorima agrarnih zadruga. Analizirani su stavovi direktora u pogledu njihovog znanja o efektima ruralnog turizma na ruralna područja kroz delovanje zadruga i mogućnostima ljudskih resursa za sprovođenje organizacionih promena izazvanim revitalizacijom turizma. Takođe, analizirani su potencijali agrarnih zadruga u kontekstu eksternog okruženja. Rezultati istraživanja su pokazali da su direktori pozitivno ocenili revitalizaciju ruralnog turizma u poslovanju zadruga i da znaju za povoljne efekte turizma na ruralna područja, ali da je za realizaciju tih aktivnosti prepreka nekompetentnost zaposlenih u zadrugama.
Ključne reči: agrarne zadruge, ruralni turizam, direktori zadruga, revitalizacija.
6 Docent, dr Fillip Đoković, Univerzitet Singidunum, Fakultet zdravstvenih, pavnih i poslovnih studija, Železnička ulica br. 5, Telefon: +381 14 292 610, E-mail: [email protected]
7 Redovni profesor, dr Radovan Pejanović, Univerzitet u Novom Sadu, Poljoprivredni fakultet, Ulica Dositeja Obradovica br. 8, 21000 Novi Sad, Telefon: +381 21 6350 622, E-mail: [email protected]
8 Miloš Mojsilović, M.A., Ipsos Strategic Marketing, Ulica Gavrila Principa br. 8, Telefon: +381 11 3284 075, E-mail: [email protected]
9 Vanredni profesor, dr Jelena Đorđević Boljanović, Univerzitet Singidunum, Poslovni fakultet, Kumodraška ulica br. 261a, Telefon: +381 11 3094 094, E-mail: [email protected]
10 Katarina Plećić M.A., doktorant turizma, Univerzitet Singidunum, Fakultet zdravstvenih, pavnih i poslovnih studija, Železnička ulica br. 5, Telefon: +381 14 292 610: +381 14 292 610, E-mail: [email protected]
1133
Economics of Agriculture 3/2017UDC: 338.43(439)
EP 2017 (64) 3 (1133-1145)
THE IMPACT OF TRANSITION ON AGRICULTURE AND RURAL AREAS IN HUNGARY
Review article
THE IMPACT OF TRANSITION ON AGRICULTURE AND RURAL AREAS IN HUNGARY1
Aleksandar Jazić2, Miloš Jončić3
Abstract
In this paper authors are dealing with the link between processes of transition, liberalization, decentralization and influence of these processes in agriculture and rural areas in Hungary. After the collapse of Warsaw Pact, Hungary entered the process of transition. Some important steps that were made in accordance with this process were territorial decentralisation and market liberalization. In parallel with the process of transition also was the process of privatization. It changed the structure of agricultural farms in the sense that they become too weak to survive in the market. Market liberalization has been the especially negative for agriculture and rural areas. However, in the meantime Hungary joined the European Union. It can be expected in the future that Hungary will stabilize the development of agriculture and rural areas if implements measures in accordance with guidelines that are precondition for using European funds intended for this purpose.
Key words: transition, privatisation, agriculture, rural development, European Union.
JEL: Q120, O130
Introduction
After the collapse of the Warsaw Pact, Poland, Czech Republic, Slovakia and Hungary entered the transition process which, among other things, demanded decentralization of these countries, in order to resolve emerging issues. The aim of these countries, among
1 This paper has been realized within the project “Serbia in the contemporary international relations: Strategic directions of development and firming the position of Serbia in the international integrative processes – foreign policy, international economic, legal and security aspects” of the Ministry of Education, Science and Technological Development of the Republic of Serbia, evidential number 179029, for the period 2011-2014.
2 Jazić Aleksandar Ph.D., Research Fellow, Institute of International Politics and Economics, Makedonska street no. 25, 11000 Belgrade, Serbia, Phone: +381 69 411 39 81, E-mail: [email protected]
3 Jončić Miloš M.A., Research Associate, Institute of International Politics and Economics, Makedonska street no. 25, 11000 Belgrade, Serbia, Phone: +381 64 985 95 99, E-mail: [email protected]

1134 EP 2017 (64) 3 (1133-1145)
Aleksandar Jazić, Miloš Jončić
other things, was to create an organization of local government that can respond to specific challenges, primarily economic, and provide better quality of life to citizens. A serious approach to the problem of the organization of local authorities and insisting on their economic stability has helped these countries to move closer to developed western countries. The result of this approach was the accession of these countries to the European Union (EU). Regional initiatives, at least when it comes to the Visegrad Group, aiming to provide equal development of all member states, which means economic investment in all units of local government, particularly in municipalities, regardless of Member State they belong. Тhe original jurisdiction of the municipalities have a direct impact on the faster, more efficient and easier solving problems in their territory because they can act autonomously.
Cooperation between the countries of the Visegrad Group enable them to cope easier with problems that are emerged during the process of transition and liberalization. The emergence of these problems were especially felt at the local level, because the necessary changes were a major challenge for countries that have just rejected the old form of state organization.
The process of transition and liberalization, as well as a commitment to joining the EU, has been influencing the countries of the Visegrad Group to look up to the models of organization of local self-government that exist in Western Europe. It’s also caused some problems, especially in the sector of the economy, because it was necessary to enter strongly in the reform of the economic system. The greatest pressure in this process was felt by municipalities and rural areas, because it was necessary to allocate substantial funds for their modernization. Also, in rural areas it was necessary to farmers quickly adapt to new modes of production, which is especially in the beginning had a major negative impact.
The Formation of the Visegrad Group
The Visegrad Group was founded in 1991 in Visegrad, by Poland, Czechoslovakia and Hungary. Following the dissolution of Czechoslovakia into Czech Republic and Slovakia, the Visegrad Group evolved into the Visegrad Four, also known as V4 (The Visegrad Group, 2017). The formation of the Visegrad Group represented the best way to unite the efforts of the countries located in the same area, with common economic and foreign policy goals. It should be emphasized that all the countries had their individual reasons for joining in and saw the purpose of this regional initiative in a different way. The Hungary’s approach to the Visegrad Group as a form of a process, rather than as a political body, has prepared this country to, besides its membership in this regional initiative, use memberships in other initiatives or organisations, such as, for example, the Central European Initiative (CEI), in order to facilitate its path towards the EU (Kolankiewicz, 1994).

1135EP 2017 (64) 3 (1133-1145)
THE IMPACT OF TRANSITION ON AGRICULTURE AND RURAL AREAS IN HUNGARY
The Aims of the Formation of the Visegrad Group
Following the end of the Cold War and the collapse of the Warsaw Pact, a long path of transformation of their political and economic systems stood before Poland, Czech Republic, Slovakia and Hungary. These countries had the task to join the world market and emerge as a competitor to the developed Western European economies. The development of the economic system demanded changes in the domain of political system. Creation of unique and stable form of cooperation enabled them to join efforts in order to achieve their common goals.
The Visegrad Declaration of 1991, whose unofficial title was The Declaration on Cooperation between the Czech and Slovak Federal Republic, the Republic of Poland and the Republic of Hungary in Striving for European Integration, defined the common goals of this initiative’s member countries. Among others, very important goal was to establish market economy and create a new social order (The Visegrad Group, 1991).
After the collapse of the economic system that existed in the time of communism and the beginning of the economic reconstruction in the Visegrad Group countries, there has been an unequal regional development and change in the organisation of enterprises (Dingsdale, 1999). These are some of the reasons due to which economic relations with the EU were amongst the most important for the Visegrad Group. This is why the opening of the Western European markets for products from Visegrad Group states was the most important. Second, understanding of economic demands the Visegrad Group members should meet in order to ensure successful application for full membership in the EU had important place (Richter, 1996).
The Beginning of the Decentralization Process in Hungary
The debate on the reform of the local self-government system in Hungary, which began officially in 1987, lasted for a several years. This contributed to the fact that the reform of local self-government in Hungary was better prepared and more comprehensive than in any other Visegrad Group country. In the initial post-communist period, economic component of the reforms were characteristic for this country. Self-government at a local and regional level in Hungary was introduced almost simultaneously (Illner, 1998).
The reform of the local self-government system in Hungary after the collapse of the Warsaw Pact had two phases, and was based on the democratic principles and the European Charter of Local Self-Government. The first phase began with passing the Law on Local Self-Government in 1990 (LXV 1990). This created legal conditions for democratization and reform of the political system. The new Constitution guaranteed to the local self-government the rights and defined the basic territorial units in Hungary, namely settlements, municipalities and towns. Local authorities existed on each of the aforementioned levels.
By the 1994, due to new legislations regarding decentralization and local authorities, a two-tier local self-government was established, consisting of municipalities and
1136 EP 2017 (64) 3 (1133-1145)
Aleksandar Jazić, Miloš Jončić
counties. Local authorities were given greater powers, which was an important step towards decentralization. The most significant change was the establishment of counties as a middle level of authority with directly elected bodies, with extended powers. County government is also called regional (Stančetić, 2012). What is typical for Hungary is that it pays great attention to municipalities, which at the same time applies to the settlements and village households at their territory (Soos, 2002).
The Economic System During and After the Transition Process
The then new Government of Hungary was committed to the reforms aimed at transforming the then economic system into a market economy based on private ownership. Backbone of these reforms was the restrictive monetary policy. Instead of the so-called shock reforms, Hungary chose a policy of gradual change. Monetary and fiscal policies were at the centre of new provisions referring to the planned transformation. One of the goals of fiscal policy was to achieve a balanced budget, which was to contribute to prevention of inflation. In order to achieve this, the state subsidies and investments were reduced, while the taxes were increased. Despite the implemented measures, the budget of Hungary was still in deficit, mostly due to an increase in the number of unemployed persons and servicing of internal and external debt. The Hungarian Government has opted for a gradual achievement of convertibility of the local currency, making it possible to slowly and moderately adjust the exchange rate in accordance with the needs of the economy. Such exchange rate policy prevented inflation growth and made the outflow of capital from the country difficult (Adam, 1995).
The reform strategy consisted of short, medium, and long-term components. The goal of the long-term reforms was to join the EU. The medium-term reform policy consisted of microeconomics and structural changes. The short-term reforms implied the implementation of traditional measures in the macroeconomic sector. The most important areas in which macroeconomic reforms were implemented were privatization, industry policy and labour and capital markets. Many enterprises have managed to survive in the transition process; however, there was a possibility of them facing liquidity issues in new economic relations. On the other hand, some enterprises have been unable to engage in market competition, but have still survived the transition due to substantial subsidies they received from the state in the past (Hare, et al., 1992).
Mass privatization has never been implemented in Hungary, unlike in other former socialist countries. Nevertheless, there was a free distribution of state property, aimed at establishing a stable middle class in the society. There were several methods for free distribution of state property, restitution being the most significant. Some privatization methods were used to sell the state property under favourable conditions. For example, there was the so-called “stable loan”, which was used only for the purchase of state property directly from the government privatization agency. Employees were able to buy shares of the company in which they worked, but it was allowed that they exceed 10%. Over time it became perfectly clear that the main obstacle to privatization was the lack of serious investment opportunities (Voszka, 1999).
1137EP 2017 (64) 3 (1133-1145)
THE IMPACT OF TRANSITION ON AGRICULTURE AND RURAL AREAS IN HUNGARY
Hungarian agriculture prior and after fall of Warsaw Pact – period of transition
Prior to the political and economic transition, agriculture was Hungary’s most successful industry. It produced 17% of GDP which includes the processing, trade and other industrial activities of the large farms. Also, there is the same percentage of labour force in agriculture. The share of food exports was 22% of total exports. These proportions have decreased and the current figures are now 3.3%, 4.7% and 7%, respectively. The fall of these shares can be attributed partly to the shrinkage of agricultural production, and partly to the growth of other sectors of economy.
Between 1989 and 2007, agricultural production fell by 25%. Gross agricultural production in 2007 was 31% lower than in 1989. Animal farming has also been struggling, being at a mere 58% of its pre-transition level. The major decrease took place at the beginning of transition period. Same situation was with animal production which fell to 63% and the crop production to 70% counting pre-transition period. Since then, crop production did rise because higher production of cereals, but animal production continue negative trend. The other gainful activities of farms today count only 2.5% of all farm produce. The agricultural trade balance was always positive in Hungary. Although it remains positive, the agricultural surplus has diminished. Prior to the transition, livestock and animal products accounted for about 50% of total agricultural exports, and fresh and processed horticultural products about 25%. Today, cereals make the greatest part of agricultural exports. Also, share of unprocessed produce in total export is higher for 20%.
Causes of above descripted decline can be divided on external and internal. The major external causes are: (1) collapse of the USSR market, (2) decline of production on those farms which were connected to the USSR market, (3) downfall of living standard, (4) import competition, (5) reduction of state subsidies and (6) increase in consumption and price of energy. The major internal causes of the decline are: (1) turning to more extensive production, mainly to grain production, by many farms because bad financial situation they were in, (2) bankruptcy of a large number of agricultural enterprises and (3) confusion caused by the privatization of agriculture.
Regarding process of privatization in agriculture, it could be said that in Hungary key role played political factors. In Hungary, process of land restitution becomes main form of privatization in agricultural sector. Hungary was characteristic in this sense because there was some sort of mixed privatization. Process of privatization was realized through restitution, compensation bonds, small redistribution of land for employees of state farms and members of production cooperatives.
At the beginning of the transition, the Hungarian Smallholders’ Party decided to get back old system of smallholder agriculture which was dominant before Second World War. The goal was to support individual farming like in the West which would, in the political sense, bring that Party more voters. That was very bad decision for agricultural development because it produced millions of scattered parcels of land, where many of them have no financial capacities to introduce mechanization, so cultivation of land
1138 EP 2017 (64) 3 (1133-1145)
Aleksandar Jazić, Miloš Jončić
was not efficient. Thousands of new owners which emerged have no capacities to work on the land. The result was that this new owners did not engage in agriculture and they rented their land to the corporate farms and individual farmers. On the wider scale, this led to more expensive agricultural products. This complication of privatization process resulted in the decline of agricultural sector (Burger, 2009).
Measures and target of agriculture policies and programmes
Key bodies in the area of agriculture in Hungary are The Ministry of Agriculture and Rural Development (MoARD) and the Ministry of Environment and Water (MoEW). MoARD is the government institution which is primarily responsible for agriculture and rural development. These two ministries are conducting policies which goal is to ensure agricultural development and food security.
The main purposes of the measures within policies and programmes to achieve food security and sustainable agriculture are: (1) finding production pattern for each specific area, (2) promoting extensive cultures, like grassland and forage crops, on environmentally sensitive areas, and (3) enhancing the concious farming respecting environment protection and forcing sustainable landscape use. These measures also have purpose to support the continuation of agricultural activities in less favoured areas, as well as to ensure stability of already stable rural communities.
Payments in agricultural sector have significant role in sustainable development of agriculture and future development of this sector. Payments have main purpose to: (1) support the sustainable development of rural areas, (2) preserve and improve environmental conditions, (3) reduce pressure on environment during the cultivation of land, (4) ensure environmental protection services and (5) promote agricultural practice on the basis of sustainable use of natural resources. Second, but not less important targets, refer to the relationship that exists between agriculture and environmental protection. More precisely, agricultural activities should be conducted in accordance with the preservation of biodiversity and protection of nature (United Nations, 2017).
Agricultural peasant farms and large scale farms and population
In 2010 there were 576 790 agricultural peasant farms and large scale farms in Hungary. During the period from 2000 to 2010 about 390 000 farms, or 40.3%, ceased their activities. This tendency was found to be widespread among the all member states of the EU. Also, about 1.5 million people were working on the farms in 2003, whereas only 1.1 million were left in 2010. Positive fact is that agricultural labor force represents 27% of the active population in 2010 which is one of the highest in the EU.
Important indicator of polarization in the area of agriculture is connected with size of peasant farms and large scale farms and share of population which owns them. Hungarian population of agricultural peasant farms and large scale farms is dominated by two size classes in 2010. First are small farms with less than 2 ha of agricultural

1139EP 2017 (64) 3 (1133-1145)
THE IMPACT OF TRANSITION ON AGRICULTURE AND RURAL AREAS IN HUNGARY
area. Second are farms with 50 ha or more of agricultural land. First class of farms covers only 3% of agricultural land. Farms with 50 ha of agricultural land or more represented a marginal 2% of the population of farms but were found to account for 75% of the country’s agricultural land.
From 2007 to 2010 calculation shows by summing up the standard output per hectare of crop and per head of livestock of the farms that there is an increase by 12.5%. The highest growth, around 44.2%, was recorded by farms with an economic size of 100 000 euros to 249 999. Value of these farms increased from 377 million euros in 2007 to 544 million in 2010. Agricultural peasant farms and large scale farms with 500 000 euros or more of standard output, which are the biggest ones, was the most important because they produced 43% of the Hungarian standard output in 2010. This output was higher for 3.8% than in 2007. In Hungary there are four most common types of peasant farms and large scale farms. They are: (1) farms specialized in poultry; (2) those that deals with various crops and livestock combined, (3) farms specialized in cereal, oilseed and protein crops and (4) farms dedicated to various granivores combined.
A livestock unit represents very important part of Hungarian agricultural capacities. In 2010, 381 650 peasant farms and large scale farms were keeping about 2.5 million livestock units. Poultry were the most important animal production, counting 976 100 livestock units, which is 39% of the Hungarian farm animal population. From 2000 record shows visible decline in pigs breeding which dropped by 37%. In spite this negative trend they were the second most important production animal in 2010. To be precise, they counted 793 240 livestock units, which is 32% of the country total. Cattle accounted for 21 % of the livestock units, but if we take in account they value of 525 410 livestock units it is visible decrease of 18% since 2000. During the period between 2000 and 2010 farms with livestock almost halved, but they still stand on the 66.2% of the Hungarian population of farms in 2010 (Eurostat, 2012).
The impact of European Union accession
Before political and economic transition and during the era of communism Hungarian agriculture and food industry had no marketing problems. Hungarian agricultural products were wanted in the member countries of the Council for Mutual Economic Assistance (COMECON). What is also very important, half of Hungarian exports were even competitive in Western Europe.
When Hungary joined EU, about 40 000 farms occupied the 50% of all agricultural land. Other 50% was cultivated by over 700 000 individual farms and households. In this other 50%, from 100 000 to 110 000 were commercial farms producing exclusively for market sale, while the rest of farms were mainly producing for personal consumption with occasionally appearance at local markets. Tiny farms and households produced abundant livestock and orchard products without any market coordination. Problem was that privatisation resulted in often incoherent production structure which often led to rapid decline in domestic food processing and retailing. Another problem was

1140 EP 2017 (64) 3 (1133-1145)
Aleksandar Jazić, Miloš Jončić
market liberalization were multinational companies had capacities for strong influence which bring to domestic holding strong challenges. For example, between 2004 and 2006, over 200 000 livestock farmers abandoned production. Total changes in agricultural structure and functioning that privatization and market liberalization bring cost Hungary losing its East European markets. Because of appearance of multinational companies, domestic producers suffered great losses in the domestic market. Hungary for a short period of time became a net importer of dairy products, fruit, and pork. This destabilized agricultural and food trade balance and fallen from almost 1.6 billion euros in 2001 to below 1 billion euros in 2006.
The selection process, as a result of privatization and market liberalization, was harsh, unexpected and resulted in loss in market share. Another reasons for this loss was lack of cooperation between agriculture stakeholders and inability of farmers to adapt to the new conditions.
There is no doubt that single market in the EU will still have mayor influence on agricultural sector in Hungary. These trends are already visible and during the time they will become stronger. Key factor in these trends will be the globalisation process which will further accelerate both supply and demand. Across Europe distribution networks will further concentrate food processing. Hungarian agriculture sector, especially commercial farms, had to increase scale of production and tighten mutual cooperation (Udovecz et al., 2008).
New strategy targets of Hungarian agricultural policy and support from European Union funds
The system of investment and development supports in agricultural sector must be converted. First goal is to support competitiveness of agriculture and food processing. Second goal is to ensure retention and make positive ground for extention of the markets. Main focus of these activities is on innovations, development, high quality production, energy and cost saving, environment protection and animal welfare. Technical and technological renewal is basis for increase of competitiveness. Development programs in mentioned areas of agriculture must be harmonized with the strong encourage on competitiveness. It is important that this strategy cover all the measures in general.
High priority of development is incitement of livestock keeping, but with the respect of environmental load. Supporting environmental protection and the new production processes could be essential in the strengthening of competitiveness and the enhanced quality of products.
Support for infrastructural projects is related to the development and modernization of agriculture through promotion of activities that will keep safe and protect water, forests and soil. One of the activities in this sense is to promote the establishment of forest schools and forest information centres. Regarding development of rural areas and employment policy, putting more effort in the development of the horticulture sector have high significance.

1141EP 2017 (64) 3 (1133-1145)
THE IMPACT OF TRANSITION ON AGRICULTURE AND RURAL AREAS IN HUNGARY
It is great chance that crop market tensions increase and change in production and market structure is important in order to keep profit amount of producers and other possibilities for making this profit higher. Crop production for energy purposes is one of the market methods to achieve this. Another possibility for keeping profit on this level is production cereals for energy purposes. This is possible because farms in Hungary are already producing cereals for human consumption and livestock feeding. Only problem here is need for adjustment of production structure. This activity could have further benefits in the sense of making strong basis for developing adequate capacities for the production and utilisation of renewable energy sources.
Opportunities that exist on the market can be best exploited if effort is put to harmonize and strengthen the cooperation between farmers, processors and traders. Farmers must be encouraged to unite their capacities in the form of appearing jointly in the market. Easier and efficient achieving of this form of cooperation could be realized if producer organization is established.
Agricultural producers and forest holders have on their exposal services of different nature that could help them. More specifically, there are advisory, information and farm management services (Čavlin et al., 2017). It seems that agricultural producers and forest holders are not using these services or too rarely. That is why more effort must be put in motivation of mentioned subjects to frequently use these services. There is need in Hungary for further education of farmers and other professionals working in agricultural sector. So, it should be organized variety of trainings regarding environmental issues, spreading economic and legal knowledge animal welfare, alternative energy resources, getting to know with new forms of farm management and improvement of skills in forestry (The Government of Hungary, 2011).
European Commission, on 10 August 2015, adopted The Rural Development Programme (RDP) for Hungary. In RDP Hungarian priorities for using 4.2 billion of euros were defined. This amount of money is allocated for the period from 2014 to 2020. Main focus of priorities which were defined in RDP is on ecosystem safety, social inclusion promotion and reduction of poverty. Also, strong focus is put on economic development in rural areas, promoting food chain organisations and risk management in agriculture. Very important is expectation that Hungary’s RDP will contribute to better services to 68% of the rural population.
In this moment, Hungary is still considered as a rural country because 66.3% of its territory is classified as rural and only 0.6% is considered urban. Other 33.1% of territory is defined as intermediate. Regarding the population, about 46% lives in rural areas. In rural areas 57% is agricultural land and forestry covers 21% of the total territory. Hungarian agricultural sector is atypical if compared with average that exist in other EU member states because arable farming in Hungary makes 81% of all agricultural land and low grassland which counts 14.2%. Significant factor for agricultural growth in Hungary are agro-ecological conditions. The contribution of agricultural production to GDP is around 4%, but the total share of overall agricultural industry in GDP is
1142 EP 2017 (64) 3 (1133-1145)
Aleksandar Jazić, Miloš Jončić
around 15%. For local economy, especially in rural areas, agriculture and food industry is very important factor of development.
There are some problems in Hungarian agriculture if compared with average in the level of EU. First problem is average farm size in Hungary which is 8.1 ha and this is much below the EU average. Concrete example is that in Hungary farm of less than 5 ha make up 87% of the total number of farms. Another problem is average age of farmers which is 56 years of age. This information requires as soon as possible generational renewal of the agricultural population. Employment in rural areas is low. On the other hand, unemployment rate in rural areas for young people is especially high if compared with the national average.
To solve all the above mentioned and described problems, the Hungarian RDP will finance activities in all six priorities regarding sustainable rural development. These are: (1) Knowledge transfer and innovation in agriculture, forestry and rural areas, (2) The competitiveness of the agriculture and forestry, (3) Organization of the food chain, including food processing and marketing, animal welfare and risk management, (4) Service the ecosystem in agriculture and forestry, (5) Caring for clime and climate change, and (6) Social inclusion and rural development (European Commission, 2015).
Conclusion
Visegrad Group States have passed a long way since the dissolution of the Warsaw Pact. A set of circumstances in international relations during the last decade of past century demanded a fundamental transformation of their political, economic and social system. Four countries are most tasks, namely those related to the organization of society and the state apparatus, successfully conducted. One of the most important aspects of the reform of the state system was decentralization. When we take into account the lack of specific experience, we can say that the creation of a strategy for decentralization and its successful implementation was not an easy process. Members of the Visegrad Group have reached an agreement regarding the realization of the most important common goal, which is to join the EU. That is why it was important that decentralization result in concrete change and operation in practice, and not just exist as a formal process. Still, there is an existing need for economic empowerment and the inflow of significant government subsidies to municipalities and rural areas.
Hungary is the only country which during the Warsaw Pact managed to implement some reforms in system of local government, which was advantage in the coming stages of entering modern standards in this area. However, this solid basis, as seen in the work, did not isolated rural areas in Hungary from the negative impact of the transition process and liberalization.
The disintegration of the Warsaw Pact forced the Visegrad group countries to start the process of building the capacities of local authorities, where they had an important place in rural areas. This is especially important for Hungary, which is predominantly an agricultural country. It can be concluded that the most important place in this process
1143EP 2017 (64) 3 (1133-1145)
THE IMPACT OF TRANSITION ON AGRICULTURE AND RURAL AREAS IN HUNGARY
had delegated powers to local authorities and the right to independently dispose of their property. These powers are directly related to the economic prosperity and improving living conditions in rural areas in Hungary. In this regard, financial autonomy of local governments is key factor, because it enables regular income to the local budget. Independently investment in rural areas is guarantee for the development of all economic segments of the rural areas and their modernization.
1. Adam, J. (1995): The Transition to a Market Economy in Hungary, Europe-Asia Studies, Vol. 47, No. 6, pp. 989-993.
2. Burger, A. (2009): The Situation of Hungarian Agriculture, Institute of Economics of the Hungarian Academy of Sciences, Paper Presented at International Scientific Conference, Vilnius, Lithuania, pp. 2-4.
3. Čavlin, M., Žugić, R., Prebiračević, V. (2017): Karakter planiranja kao funkcija menadžmenta, Oditor, Vol. 3, No. 1, pp. 102-113.
4. Dingsdale, A. (1999): New Geographies of Post -Socialist Europe, The Geographical Journal, The Changing Meaning of Place in Post-Socialist Eastern Europe: Commodification, Perception and Environment, Vol. 165, No. 2, p. 148.
5. European Commission (2015): Factsheet on 2014-2020 Rural Development Programme for Hungary, (available at: http://ec.europa.eu/agriculture/sites/agriculture/files/rural-development-2014-2020/country-files/hu/factsheet-hungary_en.pdf)
6. Eurostat (2012): Agricultural census in Hungary, (available at: http://ec.europa.eu/eurostat/statistics-explained/index.php/Agricultural_census_in_Hungary)
7. Hamilton, F. E. I. (1999): Transformation and Space in Central and Eastern Europe, The Geographical Journal, The Changing Meaning of Place in Post-Socialist Eastern Europe: Commodification, Perception and Environment, Vol. 165, No. 2, p. 136.
8. Hare, P., Revesz, T., Aven, P., Oblath, G., Sinn, H-W. (1992): Hungary’s Transition to the Market: The Case against a ‘Big-Bang’, Economic Policy, Vol. 7, No. 14, pp. 245-252.
9. Illner, M. (1998): Territorial Decentralization: An Obstacle to Democratic Reform in Central and Eastern Europe?, in: Jonathan D. Kimball (ed.), The Transfer of Power: Decentralization in Central and Eastern Europe, Local Government and Public Service Reform Initiative, Budapest, p. 17; pp. 22-23.
10. Kolankiewicz, G. (1994): Consensus and Competition in the Eastern Enlargement of the European Union, International Affairs (Royal Institute of International Affairs 1944-), Vol. 70, No. 3, pp. 483-485.
11. Richter, S. (1996): The Visegrád Group Countries’ Expectations vis-à-vis Western Europe, Russian & East European Finance and Trade, Vol. 32, Issue 1, p. 7.
12. Soos, G. (2002): Local Government Reforms and the Capacity for Local Governance in Hungary, Paper presented at the Joint International Conference Reforming local
Literature
1144 EP 2017 (64) 3 (1133-1145)
Aleksandar Jazić, Miloš Jončić
government: closing the gap between democracy and efficiency, organized by the IPSA Research Committee 05 and the DVPW Workgroup Local government studies, Stuttgart, p. 3.
13. Stančetić, V. (2012): Reforma upravljanja u savremenoj državi: razvojni i demokratski potencijali decentralizovane države (ISBN 978-86-519-1239-2), Official Gazette, Belgrade, pp. 119-120.
14. The Government of Hungary (2011): „New Hungary” Rural Development Programme 2007-2013, Version 7, Budapest, pp. 113-116.
15. The Visegrad Group (1991): Visegrad Declaration 1991, (available at: http://www.visegradgroup.eu/documents/visegrad-declarations/visegrad-declaration-110412)
16. The Visegrad Group (2017): History of Visegrad Group, (available at: http://www.visegradgroup.eu/about/history)
17. The World Bank (2012): GDP per capita (current US$), (available at: http://data.worldbank.org/indicator/NY.GDP.PCAP.CD?locations=HU)
18. Udovecz, G., Jozsef, P., Potori, N. (2008): New challenges for Hungarian agriculture, Studies in Agricultural Economics, No. 108. pp. 19-32.
19. United Nations (2017): Sustainable Development Knowledge Platform, Hungary, Documents and Reports 2008/2009, (available at: http://www.un.org/esa/agenda21/natlinfo/countr/hungary/agriculture.pdf)
20. Voszka, E. (1999): Privatization in Hungary: Results and Open Issues, Economic Reform Today, No. 2, pp. 12-15.

1145EP 2017 (64) 3 (1133-1145)
THE IMPACT OF TRANSITION ON AGRICULTURE AND RURAL AREAS IN HUNGARY
TRANZICIJA U MAĐARSKOJ I UTICAJ NA POLJOPRIVREDU I RURALNE OBLASTI4
Aleksandar Jazić5, Miloš Jončić6
Sažetak
U ovom radu autori se bave vezom između procesa tranzicije, liberalizacije, decentralizacije i uticaja ovih procesa na oblast poljoprivrede i ruralna područja u Mađarskoj. Nakon raspada Varšavskog pakta, Mađarska ušla u proces tranzicije. Neki važni koraci koji su načinjeni u skladu sa ovim procesom su decentralizacija teritorije i liberalizacija tržišta. Paralelno sa procesom tranzicije takođe se odvijao proces privatizacije. To je promenilo strukturu poljoprivrednih gazdinstava u smislu da su oni postanli suviše slabi da opstanu na tržištu. Liberalizacija tržišta je bila posebno negativna za poljoprivredu i ruralna područja. Međutim, u međuvremenu je Mađarska ušla u Evropsku uniju. Može se očekivati da će u budućnosti Mađarska stabilizovati razvoj poljoprivrede i ruralnih područja ako sprovede mere u skladu sa smernicama koje su preduslov za korišćenje evropskih fondova namenjenih za tu svrhu.
Ključne reči: tranzicija, privatizacija, poljoprivreda, ruralni razvoj, Evropska unija.
4 Rad predstavlja deo naučnog projekta „Srbija u savremenim međunarodnim odnosima: Strateški pravci razvoja i učvršćivanja položaja Srbije u međunarodnim integrativnim procesima – spoljnopolitički, međunarodni ekonomski, pravni i bezbednosni aspekti”, finansiranog od strane Ministarstva nauke i tehnološkog razvoja Vlade Republike Srbije (evidencioni broj: 179029), a realizuje se u Institutu za međunarodnu politiku i privredu u periodu od 2011. do 2014. godine.
5 Dr Aleksandar Jazić, naučni saradnik, Institut za međunarodnu politiku i privredu, Makedonska ulica br. 25, 11000 Beograd, Srbija, Telefon: +381 69 411 39 81, E-mail: [email protected]
6 Mr Miloš Jončić, istraživač saradnik, Institut za međunarodnu politiku i privredu, Makedonska ulica br. 25, 11000 Beograd, Srbija, Telefon: +381 64 985 95 99, E-mail: [email protected]


1147
Economics of Agriculture 3/2017UDC: 631.11:657.15(497.11)
EP 2017 (64) 3 (1147-1159)
IMPORTANCE OF FEEDBACK INFORMATION FROM FARM ACCOUNTANCY DATA NETWORK OF THE REPUBLIC OF SERBIA
Review article
IMPORTANCE OF FEEDBACK INFORMATION FROM FARM ACCOUNTANCY DATA NETWORK OF THE REPUBLIC OF SERBIA1
Vlado Kovačević2, Mirjana Bojčevski3, Biljana Chroneos Krasavac4
Abstract
The objective of this paper is the analysis of the feedback information from the Farm accountancy data network (FADN) in the Serbia.
The objective of FADN is to ensure the compulsory annual reports to the European Commission, as well as for the analytics and development of a national agro-sector. The significance for the national agro-sector is primarily by providing feedback information to domestic farmers.
Analyses in this paper were determined the need and possibility for inclusion in FADN feedback form indicators of gross margin for every production line, which can be calculated from already existing data. The importance of gross margin as an indicator of profitability is significant from the perspective of farmers.
Key words: FADN, feedback information, agricultural household, agricultural policy, farm income.
JEL: Q12, Q18
Introduction
Farm Accountancy Data Network (FADN) is based on the collecting annually production, economic and financial data from a sample of farms, classified into groups according to
1 This paper is a result of the project III – 46006: Sustainable agriculture and rural development in terms of the Republic of Serbia strategic goals realization within the Danube Region, financed by the Ministry of Education, Science and Technological Development of the Republic of Serbia.
2 Vlado Kovačević Ph.D., Assistant Researcher, Institute Agricultural Economics, Volgina Street no. 15, 11000 Belgrade, Serbia, Phone: +381 64 658 15 19, E-mail: [email protected]
3 Mirjana Bojčevski M.A., Senior Adviser, Ministry of Agriculture and Enviromental Protection, Nemanjina Street no. 22-26, 11000 Belgrade, Serbia, Phone: +381 64 330 20 05, E-mail: [email protected]
4 Biljana Chroneos Krasavac Ph.D., Assistant Professor, University of Belgrade, Faculty of Economics, Kamenička Street no. 6, 11000 Belgrade, Serbia, Phone: +381 11 302 11 86, E-mail: [email protected]

1148 EP 2017 (64) 3 (1147-1159)
Vlado Kovačević, Mirjana Bojčevski, Biljana Chroneos Krasavac
the criteria of economic farm size, type, or the type of agricultural production and regional affiliation (Ranogajec et al., 2014).
The Farm Accountancy Data Network (FADN or EU - FADN) is an instrument, launched in 1965., for evaluating the incomes and business operation of agricultural holdings and the impacts of the Common Agricultural Policy (CAP) viewed from the EU level. To do this it uses data contributed by national farm accounts surveys in each Member State in the form of completed “Farm Returns”. Member States receive a standard fee from the Commission for each duly completed “Farm Return”, within certain rules established by the FADN legislation. The current legal base is Council Regulation (EC) No 1217/2009 (Bradley, Hill, 2015).
The prevailing held view is that accounting information can improve farm management (financial leverage ,forecasting, farm viability), providing that the employed accounting reports are consistent with agro-economic data and sustainable-logic plans, are also consonant with CAP and Ministry’s Agriculture Policy. So the option of uniform approach with harmonized statistics in Agriculture sector, seem to be prime principle for the farm community (Vazakidis et al., 2010).
FADN provides detailed financial economic information at farm level on more than 80,000 farms in Europe. The data are collected in a systematic way on an annual basis and the information collected for each sample farm contains more than 1,000 variables. FADN contains harmonised farm-level data across Europe: the data elements to be provided to the European Commission (EC) and bookkeeping principles (such as depreciation) are the same in all countries (Vrolijk et al., 2016). Within its field of observation, FADN provides data which are representative in terms of region, economic size and type of farming and which also cover the vast majority of agricultural production (Bradley, Hill, 2016).
Derived from national surveys, the FADN is the only source of microeconomic data that is harmonized, i.e. the bookkeeping principles are the same in all countries. Holdings are selected to take part in the survey on the basis of sampling plans established at the level of each region in the Union. The survey is based on sample farms participating in FADN survey, only those which due to their size are considered commercial. The applied methodology aims to provide representative data along three dimensions: region, economic size and type of farming (Pitulice, Gorgan, 2013). While the European Commission is the primary user of analyses based on FADN data, the aggregated data can be found in the Standard Results database (Regulation (EC) No 1166/2008). The aim of the network is to gather accountancy data from farms for the determination of incomes and business analysis of agricultural holdings (Marongiu et al., 2012). FADN sample represent a population of about 5,000,000 farms in the EU, which covers approximately 90% of the total utilized agricultural area (UAA) and account for about 90% of the total agricultural production (Vasiljevic et al., 2016).
FADN data are of great significance for different types of users, including institutions such as: creators of agricultural and rural policy (Ministry and the Provincial Secretariat), regional authorities, educational and science-research institutions, agricultural extension and professional services and farmers.

1149EP 2017 (64) 3 (1147-1159)
IMPORTANCE OF FEEDBACK INFORMATION FROM FARM ACCOUNTANCY DATA NETWORK OF THE REPUBLIC OF SERBIA
The success of the FADN research depends a lot on the motivation of farmers who are involved in sample. If this neglects, farmers will consider the FADN research as an unnecessary extra work, since they don’t keep the financial record on agricultural activities.
Primary motive of farmer is to ensure successful farm business, i.e. to realize the economy (make higher total income with fewer costs), profitability (make more profit with less assets employed) and productivity (manufacture a certain amount of products with less labour expenditure).
Providing feedback information to farmers is not obliged in the FADN research. It means that there is no requested from the European Union to provide and analyse any feedback information to the farmers. However, it is considered as an integral part of good practice of FADN research that the feedback information is provided and analysed to the farmers.
FADN in Serbia has started in 2012, with increasing number of agricultural holdings in sample. The sample in the 2016. comprised 1,200 holdings, while a necessary number of holdings for the full representativeness are around 2,000.
The Republic of Serbia has chosen to collect FADN data via the agricultural advisory services.
The FADN system in Serbia anticipates that extension officers visit farmers four times per year:
• In January/February, in order to start collecting data for a new year (at this meeting, the accounting reports for the previous year conclude and open new accounting reports for the following year);
• In April, to keep track of data record for the first quarter;
• In July, to keep track of data record for the second quarter and provide feedback information on business of an agricultural holding in the previous year, as well as advices for the improvement of agricultural holding business in future;
• In October, to keep track of data record for the third quarter and preparations for the next year.
Feedback information on farm business provides indicators of productivity and competitiveness. There are numerous benefits for farmers from the FADN feedback information, and the most important among them are:
• Better review and monitoring of business at the level of entire holding;
• Better planning through regular book keeping practice;
• Comparing the production results with the results of other farms in the region, and also comparing the results with other producers who are engaged in the same type of production;
• Finding more efficient models of production and establishing business contacts with other farmers, due to comparison, but also the improvement in the field of trading with some agricultural products/materials;

1150 EP 2017 (64) 3 (1147-1159)
Vlado Kovačević, Mirjana Bojčevski, Biljana Chroneos Krasavac
• Contact with data collectors (consultants), who will provide useful information and advices, not only related to the FADN system;
• Facilitated application for public structural funds (state funds, IPARD, etc.).
Methodology and data sources
This paper continues the research regarding the FADN development, role and the impact of feedback information.
Aim of this paper is to determine importance of FADN feedback information for farmers, FADN system development and policy makers. Second aim is to recommend based on analysis results steps toward improvement of FADN feedback form in Serbia.
Methodology used in this paper:
• Desk research method;• Literature review;• Interview with relevant experts,• Method of analysis and synthesis.
The paper is based on different data sources. The first group includes three types of documents, i.e. academic papers, all legal acts covering this field in Serbia from the beginning of coop movement and finally, official documents and reports of EU and the other international organizations. The second sources are the empirical data. The empirical data were collected through structural interviews of key stakeholders involved in FADN Serbia. There were several sessions involving researchers in discussion process based on the list of questions prepared in advance, targeted to the main FADN feedback information form. The content of the answers and responses collected through this process were analysed in order to extract the key factors that shaped the development of FADN feedback information. Who was interviewed?:
• Farmers;• Creators of agrarian policy – Ministry of Agriculture and Environmental Protection of
the Republic of Serbia;• Professional public – scientific institutions engaged in the scientific fields of agriculture
and agrarian economy.Third source of information was Serbia FADN database and EU FADN database, where all existing data, which were collected in the FADN system, were analysed. The possibility of their use for the purpose of obtaining new useful indicators was analysed as well. The special significance for FADN in Serbia is the development of FADN feedback information, based on already existing data, since FADN system in Serbia has developing, and additional inclusion of new data in collecting requirements for additional changes of forms, FADN software and training of agricultural consultants, which would place a strain on the system in the development phase.
1151EP 2017 (64) 3 (1147-1159)
IMPORTANCE OF FEEDBACK INFORMATION FROM FARM ACCOUNTANCY DATA NETWORK OF THE REPUBLIC OF SERBIA
Results and discussion
The role and significance of feedback information of FADN system for farmers in Serbia are analysed in this paper. The FADN feedback information serves as a „diagnostic“ tool for farmers, in order to assess where a farm currently is and in which fields of business has better/worse results in regard to an average of all farmers in the same production line. For example, an agricultural holding can conclude based on FADN feedback form that it buys inputs 10% more expensive than the average, which is the signal to pay attention to lowering of input prices, etc.
Dissemination of data can be at the level of: EU, national level and locally, at the farm.
Dissemination of data at the EU level is regular distribution of FADN data based on the standard results that generate according to validated summary FADN forms of accounting data for agricultural holdings, checked by the European Commission (FADN, 2016). Standard results are the set of statistical data, calculated in accordance to forms of agricultural holdings accounting data, which the European Commission periodically prepares and publishes. They are available in public database and describe in detail the economic situation of farmers by different groups the European Union-wide (Bojcevski et al., 2016).
Annual reports and statistical data on economic-financial situation in agricultural sector and analyses on user’s request create at the national level. These reports can be useful for farmers who are not involved in FADN sample and who can compare their holding’s business results with the average of groups in the same line production. In order to create benchmarks for individual agricultural holdings, as well as more specific analyses for the needs of ministry and the agricultural extension service, there should be possible to provide the statistical data for agricultural holdings with more detailed/specific definition of production type. Such statistical data should respect the confidentiality of data, and show results only if there are at least five agricultural holdings in the group (Bojcevski et al., 2015).
Dissemination at the local level implies the creation of feedback information for farmers as an additional motivation to take part in the FADN system. The feedback information is an integral part of implementing the FADN research in the Republic of Serbia, because ones assessed that farmers need the additional motivation for keeping in detail record, and in many case, they kept this record only due to a special relation with a consultant. Analyses and tracking of all activities within the FADN research help farmers in making higher profits. These data provide information necessary for making right business decisions, such as determination of business results in a holding, determination of ownership rights, providing data for the control of planned activities and analyses of all activities aiming to improve business (Vasiljevic et al., 2012).
The FADN feedback form, provides to the farmers involved in the FADN research, is of special importance for the Republic of Serbia, since farmers who take part in FADN do not get any additional financial compensations. The only benefit they receive from being a part of FADN research is primarily in the feedback form and possibility to analyse their business and improve it based on this feedback form.
Furthermore, farmers from agricultural extension officers, who collect FADN data in

1152 EP 2017 (64) 3 (1147-1159)
Vlado Kovačević, Mirjana Bojčevski, Biljana Chroneos Krasavac
holdings, are well trained and obliged to help farmers in interpretation and analysis of feedback information.
Presenting the business results of an agricultural holding (overview of feedback information for farmers) requires the presentation of the group of business result indicators. Indicators, which will be included in the feedback information (integral part of FADN database), defines a working group of participants in the FADN system, according to experience and requirement of consultants and farmers.
The feedback form for farmers ensures the multi-level review of business results of an agricultural holding:
• General indicators;• Yield;• Balance sheet;• Financial indicators;• Additional indicators.
General indicators show data for invested labour expressed in annual working units (AWU), total utilized agricultural area in ha, and average number of heads of cattle.
Yields can be expressed for the most significant crops and permanent cropping, and also milking capacity per cow during the year.
Balance sheet at the end of the year shows total working capital and fixed assets, total liabilities (long-term and short-term credits) and capital net value at the end of the year. The FADN-system is the most detailed and best possible statistics for studying the level of farm income and its development in different EU-countries (Poppe, 2004).
Financial indicators shown through total production value, total specific costs, total overhead costs of agricultural holding, total subsidies and taxes (excluding tax on investments), and gross income of agricultural holding. The feedback information shows amortization, net added value of agricultural holding, total external factors and net income of a holding (legal entity) (or income of family agricultural holding, if it is about the individual agricultural holdings). Net income is expressed by hectare, without subsidies per hectare and per working hour of unpaid labour (Bogicevic et al., 2016).
Additional indicators are shown through gross investments in fixed assets per ha of used agricultural land, debt-equity ratio, coefficient of economy and ratio of current assets to current liabilities. Very important indicators for producers, which get in the feedback information, are gross margin of plant production and products, gross margin of livestock production and products, and gross margin of other activities, products and services.
All indicators derived from FADN feedback form can be in function of economic prosperity of household (Diazabakana et al., 2014).
At the Scheme 1. is presented rational for calculation of main financial indicators.
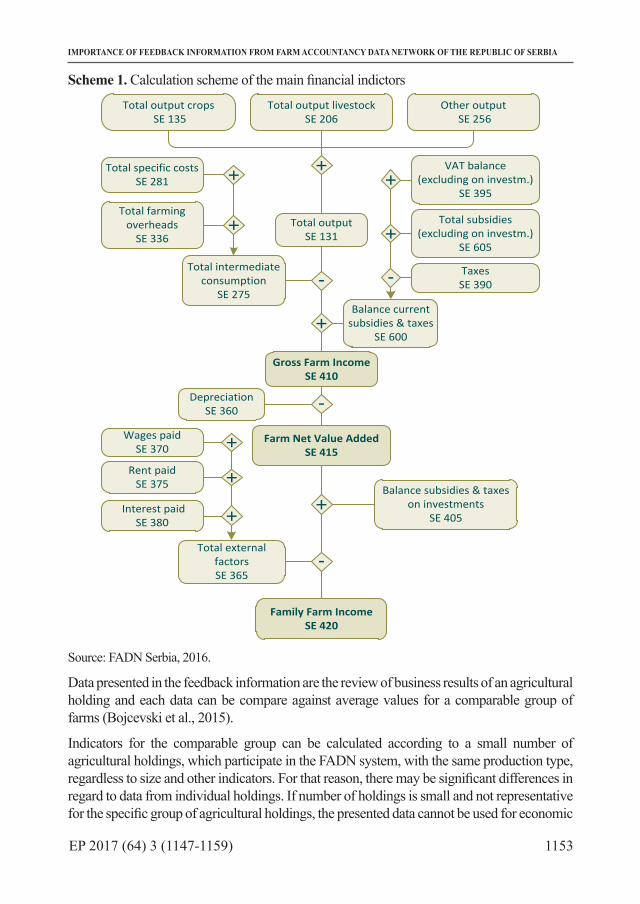
1153EP 2017 (64) 3 (1147-1159)
IMPORTANCE OF FEEDBACK INFORMATION FROM FARM ACCOUNTANCY DATA NETWORK OF THE REPUBLIC OF SERBIA
Scheme 1. Calculation scheme of the main financial indictors
Total output crops SE 135
Total output livestockSE 206
Other output SE 256
Total specific costsSE 281
Total farming overheads
SE 336Total output
SE 131
VAT balance (excluding on investm.)
SE 395
Total subsidies (excluding on investm.)
SE 605
TaxesSE 390
Balance current subsidies & taxes
SE 600
Total intermediate consumption
SE 275
Gross Farm IncomeSE 410
DepreciationSE 360
Rent paidSE 375
Wages paidSE 370
Interest paidSE 380
Balance subsidies & taxes on investments
SE 405
Total external factorsSE 365
Family Farm IncomeSE 420
Farm Net Value AddedSE 415
+
-
+
+
+
+
-
+
-
+
-
+
+
+
Source: FADN Serbia, 2016.
Data presented in the feedback information are the review of business results of an agricultural holding and each data can be compare against average values for a comparable group of farms (Bojcevski et al., 2015).
Indicators for the comparable group can be calculated according to a small number of agricultural holdings, which participate in the FADN system, with the same production type, regardless to size and other indicators. For that reason, there may be significant differences in regard to data from individual holdings. If number of holdings is small and not representative for the specific group of agricultural holdings, the presented data cannot be used for economic

1154 EP 2017 (64) 3 (1147-1159)
Vlado Kovačević, Mirjana Bojčevski, Biljana Chroneos Krasavac
analyses or a status evaluation of agricultural sector in whole. It is necessary to verify in a statement that data from individual agricultural holdings are confidential and won’t be used for tax purposes, but they are meant only for the purpose of FADN system of the Republic of Serbia.
The provided feedback information for an agricultural holding should be summarized on three pages, with clearly defined significant indicators, comparative results of an agricultural holding and average group for the same production line, as well as charts which show concretely the obtained results.
Farmers, who are engaged in FADN sample, receiving the feedback information. Extension officer help them in interpreting the obtained results.
Farmers, who are not engaged in FADN sample, can use FADN reports directly, with exception that they make by their own the business results of their holdings, based on which compare with the average result for the same production line.
At the Figure 1. is presented one of the potential uses of FADN indicators (calculation of structure of total output, including subsidies, excluding on investments which can be uses in analytical purpose).
Figure 1. Structure of total output (including subsidies, excluding on investments)
Crop production
31%
Livestock production
39%
Other production
16%
Subsidies (excluding on investments)
14%
Group average
Source: FADN Serbia, 2016.
The FADN system in Serbia requires signing a Statement on Data5 when creating the feedback information, which implies mutual responsibility of the system participants. It means that the obtained results and data used in this analysis are collected at agricultural holdings by the FADN methodology, and they base on information obtained from farmers. They can base on systematically kept record and/or evaluation of a farmer. The results, obtained based on the accounting register, ensure better assessment of economic position of agricultural holding. Presented data in the feedback information represent the evaluation of business results of an agricultural holding, as well as the average values for the comparative group of agricultural
5 Statement of a holder/manager of agricultural holding and a person responsible for collecting data on the obtained business results of agricultural holding.
1155EP 2017 (64) 3 (1147-1159)
IMPORTANCE OF FEEDBACK INFORMATION FROM FARM ACCOUNTANCY DATA NETWORK OF THE REPUBLIC OF SERBIA
holdings which take part in the FADN system for the current year6.
FADN feedback can serve to Serbian farmers to compare their business with other EU colleagues’ businesses.
Analysis of a FADN questionnaire with data that already were collected, as well as the analysis of farmers’ and the agrarian policy creators’ needs led to the conclusion that the inclusion of gross margin indicators would be of great significance for FADN feedback information in Serbia.
Financial indicator, gross margin, is very important for farmers, who strive to make as higher as possible total gross margin, i.e. that the proportion of production lines with the highest gross margin would be higher in its production structure (Vuckovic, 2016). From the aspect of agricultural households, development of calculations based on gross margin is simple, transparent and easy to apply model for the analysis of sustainability of adopted production technology and achieved production results (Subić et al., 2015).
For the agrarian policy creator, this indicator is significant, while it shows profitability of individual lines of agricultural production. Gross margin indicator uses for many years for measuring the efficiency of an extension professional service, so the mentioned indicator within FADN could serve the same purpose at the regional and republic level.
The equation is as follows: PROFIT = GROSS MARGIN – FIXED COSTS
When creating the gross margin indicators, it is necessary to allocate general expenses, which are not related just to one production line, to every line of production present in a holding7. Using this approach and already existing data and distribution of general costs doesn’t require any changes in the current way of collecting data (Milojević, 2017), but all calculations are made on existing data, which is advantageous, especially in the initial phases of the FADN system development, when the system is ahead of numerous obligations.
This procedure of costs allocation to part which charges a household and part which charges a holding, as a production unit, doesn’t appear exclusively within the general expenses group, but also in other places.
The following costs count among the general expenses by the FADN methodology (EC, 2015):
• Current maintenance of soil meliorations and maintenance of soil meliorations and facilities;
• Costs of electrical energy, heating fuel, water;
• Insurance costs, taxes and contribution costs;
6 Comparative analyses of the specific groups of agricultural holdings are not possible to calculate, due to a small number.
7 This approach has its imperfections in possible deviations in costs allocation „according to the key “in regard to real costs allocation.

1156 EP 2017 (64) 3 (1147-1159)
Vlado Kovačević, Mirjana Bojčevski, Biljana Chroneos Krasavac
• Rent costs;
• Costs of interests and other financial compensations (reimbursement);
• Other general expenses (such as the costs of accounting services, office supplies, phone costs, subscription fees, etc.).
Introduction of the gross margin indicators would contribute to FADN improvement in Serbia, through the analysis of production line profitability at farm level.
Based on the conducted analyses, recommendation can be drawn to enter into FADN software a direct calculation of gross margin in coming years, by direct monitoring of costs related to individual production lines. This will increase a size and complexity of collecting data, but also will increase the accuracy of calculating the gross margin. The general expenses wouldn’t allocate „according to the key“, but according to costs which were directly fixed by the questionnaire.
Conclusion
Every member-country is obliged to collect and submit data to the EU Commission within the FADN system, but besides, every country has at its disposal the upgrade of the FADN system and using the additional reports for national needs. Creation and distribution of the FADN feedback information is not regulated by the general EU regulatory rules, so every country can adjust this segment to their own needs.
It is very important for countries which don’t pay financial compensation to producers involved in the FADN sample, to provide the FADN feedback information in high-quality, since the feedback information and possibility for business improvement of a holding, based on the feedback information, is a basic motive for farmers to be included in the FADN sample in Serbia. Therefore, the development of FADN feedback information has a greater significance for functioning of FADN system in relation to some other EU countries.
According to the FADN feedback information, farmers could analyse farm business, comparing some business segments with the group average of producers in the same production line.
Within the research was concluded that there is the possibility to introduce the financial indicator - gross margin in the FADN feedback form. This indicator is very important for farmers, who strive to make as higher as possible total gross margin, i.e. proportion of production lines with the highest gross margin would be higher in its production structure. For the agrarian policy creator, this indicator is significant, while it shows profitability of individual lines of agricultural production. Gross margin indicator uses for many years for measuring the efficiency of an extension professional service, so the mentioned indicator within FADN could serve the same purpose at the regional and republic level.
Besides the development of indicators in a feedback form, the accuracy of collected data is necessary for the high-quality feedback information and other FADN reports. Daily record keeping is crucial, and it will be only possible if farmers are properly motivated for carrying
1157EP 2017 (64) 3 (1147-1159)
IMPORTANCE OF FEEDBACK INFORMATION FROM FARM ACCOUNTANCY DATA NETWORK OF THE REPUBLIC OF SERBIA
out the FADN research, as a direct advantage in managing an agricultural holding (farm management).
FADN workshops should be planned at least once a year for all farmers, who are involved in the FADN research. The best time for these meetings is at the end of winter, or period from January to mid-March, when farmers have the least farm (field) work. It is good to mix these meetings with the presentation of subsidies by the ministry, since farmers will get an impression that they get additional advantages in regard to other producers who don’t take part in the FADN research. It is important to emphasize at these meetings that the confidentiality of collected data will be protected and not used for tax purposes. Farmers must get some kind of a certificate from the FADN system, because many of them are still afraid of taxation and therefore give inaccurate data. There has to be explained that the data analysis will be possible only at the overall level of at least five farmers, the rules on data confidentiality will be clear and strict and data will be used only for the purposes of the FADN research (in accordance with the European Union regulation related to FADN).
The recommendation is to introduce the direct research of general expenses of individual production lines due to the FADN feedback information significance in Serbia in coming years, by which the suggested existing methodology of gross margin calculation through the general expenses allocation to individual production lines, by using „the key“ for allocation, would be replaced with more precise direct allocation.
It is inevitable to research and improve the FADN system in Serbia continuously through the development of national indicators, which will be useful for the national agro-sector.
References
1. Bogicevic, J., Domanovic, V., Krstic, B. (2016): The role of financial and non-financial performance indicators in enterprise sustainability evaluation, Ekonomika, Vol. 62, No. 3, pp. 69-79.
2. Bojcevski, M., Kovacevic, V., Subic, J. (2015): Importance of a farm accountancy data networks (FADN) for agricultural sector in Serbia, Proceedings of abstracts, 2nd international symposium for agriculture and food ISAF 2015, Faculty of Agricultural Sciences and Food, Skopje, October 2015, Ohrid, Republic of Macedonia, p. 48
3. Bojcevski, M., Kovacevic, V., Subic, J. (2016): Roll of a farm accountancy data networks (FADN) in agricultural sector in Serbia, Ekonomika, vol. 62, no. 3, pp. 69-79.
4. Bradley, D., Hill, B. (2015): Cost of and good practices for FADN data collection, report no. EUR 2015.4546 EN, European Commission, Directorate-General for Agriculture and Rural Development, Brussels, Belgium, p. 179, available at: www.ceasc.com/Images/Content/Cost%20of%20and%20good%20practice%20in%20FADN%20data%20collection-%20Final%20report.pdf
5. Bradley, D., Hill, B. (2016): Comparative analysis of the FADN data collection systems in EU-28, Proceedings, 90th Annual Conference of the Agricultural Economics Society, University of Warwick, Coventry, England, April 2016, pp. 1-18, available at: http://

1158 EP 2017 (64) 3 (1147-1159)
Vlado Kovačević, Mirjana Bojčevski, Biljana Chroneos Krasavac
ageconsearch.umn.edu/bitstream/236324/2/Berkeley_Hill_Hill_Bradley_AES2016_FINAL.pdf
6. Diazabakana, A., Latruffe, L., Bockstaller, C., Desjeux, Y., Finn, J., Kelly, E., Ryan, M., Uthes, S. (2014): A review of farm level indicators of sustainability with a focus on CAP and FADN, FLINT Project results, University of Wageningen, the Netherlands, p. 101, available at: http://www.flint-fp7.eu/downloads/reports/FLINT%20WP1%20_D1_2.pdf
7. EC (2015): Commission Implementing Regulation (EU) 2015/220 of 3 February 2015 laying down rules for the application of Council Regulation (EC) No 1217/2009 setting up a network for the collection of accountancy data on the incomes and business operation of agricultural holdings in the European Union, European Commission, Brussels, Belgium, available at: http://publications.europa.eu/en/publication-detail/-/publication/8c2f2ba4-b80b-11e4-b3fe-01aa75ed71a1/language-en
8. FADN (2016): FADN agriculture overview, EU Commission web portal, Brussels, Belgium, available at: http://ec.europa.eu/agriculture/rica/, accessed on: February 2016.
9. FADN Serbia (2016): Farm return 2015, Ministry of Agriculture and Environmental protection of the Republic of Serbia, Belgrade, available at: http://www.fadn.rs/web/wp-content/uploads/2016/08/FADN-Serbia_Farm_Return2015.pdf, accessed: December 2016.
10. Marongiu, S., Cesaro, L., Florian, D., Tarasconi, L. (2012): The use of FADN accounting system to measure the profitability of forestry sector, Italian Journal of Forest and Mountain Environments, Vol. 67, No. 3, pp. 253-261.
11. Milojević, I. (2017): Računovodstveni informacioni sistem i informacije u sistemu odbrane, Oditor, Vol. 3, No. 2, pp. 54-66.
12. Pitulice, I. C., Gorgan, C., (2013): The use of statistical information for financial reporting purposes – the case of FADN, Annales Universitatis Apulensis Series Oeconomica, Vol. 15, No. 1, pp. 67-80.
13. Poppe, K. J. (2004): Income issues in farm households and the role of the FADN, Report no. 8.04.03, Pacioli 12, Agricultural Economics Research Institute (LEI), Hague, the Netherland, p. 99, available at: http://library.wur.nl/WebQuery/wurpubs/fulltext/89881
14. Ranogajec, L., Deže, J., Tolić, S. (2014): FADN as an indicator of the success of agricultural production, Journal of Hygienic Engineering and Design, Vol. 9, pp. 80-84.
15. Subić, J., Jeločnik, M., Zubović, J. (2015): Primena navodnjavanja kao agrotehničke mere - analiza marže pokrića u proizvodnji kukuruza, Ecologica, Vol. 22, No. 78, pp. 245-251.
16. Vasiljevic, Z., Kovacevic, V., Stankovic, S. (2016): Farm accountancy data network as a tool for measuring efficiency of applied new technologies in agriculture, Thematic proceedings, 152nd EAAE Seminar, SAAE, Belgrade, September 2016, Novi Sad, Serbia, pp. 138-152.
17. Vasiljevic, Z., Zaric, V., Ivkov, I. (2012): Recording of accountancy data at the family farms in Serbia, Thematic proceedings, 3rd International Scientific Symposium Agrosym - Jahorina 2012, Faculty of Agriculture, Srpsko Sarajevo, Jahorina, BiH, November 2012, pp. 599-604.
1159EP 2017 (64) 3 (1147-1159)
IMPORTANCE OF FEEDBACK INFORMATION FROM FARM ACCOUNTANCY DATA NETWORK OF THE REPUBLIC OF SERBIA
18. Vazakidis, A., Stergios, A., Laskaridou, E. (2010): The Importance of information through accounting practice in agricultural sector-European data network, Journal of Social Sciences, Vol. 6, No. 2, pp. 221-228.../../Toshiba/Downloads/SSRN-id1829426.pdf
19. Vrolijk, H., Poppe, K., Keszthelyi, S. (2016): Collecting sustainability data in different organisational settings of the European farm accountancy data network, Studies in Agricultural Economics, Vol. 118, pp.138-144.
20. Vuckovic, B. (2016): Causes of different profitability of agricultural sector, Economics of Agriculture, Vol. 63, No. 1, pp. 123-143.
ZNAČAJ POVRATNE INFORMACIJE SISTEMA RAČUNOVODSTVENIH PODATAKA NA POLJOPRIVREDNIM
GAZDINSTVIMA REPUBLIKE SRBIJE
Vlado Kovačević8, Mirjana Bojčevski9, Biljana Chroneos Krasavac10
Sažetak
Cilj rada je analiza značaja i davanje preporuka za unapređenje povratne informacije Sistema računovodstvenih podataka na poljoprivrednim gazdinstvima (FADN) Republike Srbije.
Svrha FADN-a je obezbeđenje godišnjih obaveznih izveštaja prema Evropskoj Komisiji, kao i upotreba u svrhu analitike i razvoja nacionalnog agrosektora. Značaj za nacionalni agrosektor je pre svega u delu obezbeđenja povratne informacije domaćim poljoprivrednicima kojima ovakvi izveštaji omogućavaju da uporede rezultate svoga poslovanja sa rezultatima grupnog proseka za istu liniju proizvodnje.
Analizom u okviru rada utvrdila se potreba i mogućnost uključivanja u FADN formular sa povratnom informacijom, indikatora bruto marže za svaku liniju proizvodnje. Bruto marža se može izračunati iz već postojećih podataka u okviru FADN-a. Značaj bruto marže kao pokazatelja profitabilnosti je velika iz ugla poljoprivrednika koji se na osnovu ovog pokazatelja mogu odlučiti za profitabilniju liniju proizvodnje i pratiti profitabilnost svoje proizvodnje.
Ključne reči: FADN, povratna informacija, poljoprivredno gazdinstvo, agrarna politika, prihod poljoprivrednog gazdinstva.
8 Dr Vlado Kovačević, Naučni saradnik, Institt za ekonomiku poljoprivrede, Volgina ulica br. 15, 11000 Beograd, Srbija, Telefon: +381 64 658 15 19, E-mail: [email protected]
9 Mr Mirjana Bojčevski, Viši savetnik, Ministarstvo poljoprivrede i zaštite životne sredine Republike Srbije, Nemanjina ulica br. 22-26, 11000 Beograd, Srbija, Telefon: +381 64 330 20 05, E-mail: [email protected]
10 Vanredni profesor, dr Biljana Chroneos Krasavac, Univerzitet u Beogradu, Ekonomski fakultet, Kamenička ulica br. 6, 11000 Beograd, Srbija, Telefon: +381 11 302 11 86, E-mail: [email protected]


1161
Economics of Agriculture 3/2017UDC: 343.222+347.5]:502
EP 2017 (64) 3 (1161-1176)
CRIMINAL AND CIVIL LIABILITY FOR ENVIRONMENTAL DAMAGE
Review article
CRIMINAL AND CIVIL LIABILITY FOR ENVIRONMENTAL DAMAGE
Dalibor Krstinić1, Nenad Bingulac2, Joko Dragojlović3
Summary
Environment is the existential right of man. The protection of the environment, seen in relation to other issues, is almost at the top of the priority, and hence the necessity and urgency to establish a legal regulation is recognized.The issue of environmental liability can be considered from multiple angles, while the focus of this research will be directed to criminal and civil liability.Criminal law enforces the protection of society from crime, so that the most favorable protection of the environment is achieved in this way.Civil law protection of the environment is not regulated directly by specific regulations, but it is foreseen by legislative instruments in the area of compensation of damages, such as the Law on Obligations, the Law on the Basis of Property Relations and others. It is due to the prominent goal of this research through the methodological and theoretical framework to analyze the criminal and civil liability of the environment due to environmental damage. By using the method of analysis we will address the most important issues of relevance to research, while the normative method will be used to illustrate legislation regulating the study of matter at the international level, at the level of the European Union and in the positive legislation of the Republic of Serbia.Comparative method will be used to summarize the results obtained.
Key words: Criminal liability, civil liability, environmental liability
JEL: K14, K15, K32, K33, Q15, Q58.
1 Dalibor Krstinić, LL.M.Teaching assistant and Ph.D. student, University of Business Academy, Faculty of law for commerce and judiciary, Geri Karolja Street no. 1, 21000 Novi Sad, Republic of Serbia, Phone:+381 64 139 43 16, E-mail: [email protected].
2 Nenad Bingulac Ph.D., Assistant professor, University of Business Academy, Faculty of law for commerce and judiciary, Geri Karolja Street no. 1, 21000 Novi Sad, Republic of Serbia, Phone: +381 69 520 22 55, E-mail: [email protected].
3 Joko Dragojlović Ph.D., Assistant professor, University of Business Academy, Faculty of law for commerce and judiciary, Geri Karolja Street no. 1, 21000 Novi Sad, Republic of Serbia, Phone: +381 64 942 99 36, E-mail: [email protected].

1162 EP 2017 (64) 3 (1161-1176)
Dalibor Krstinić, Nenad Bingulac, Joko Dragojlović
Introduction
It is not necessary to emphasize the significance and importance of environmental protection, although it has not been achieved at the level that we have “somewhere” drawn on the basis of existential and cultural standards and the development of social consciousness.
Legislative prediction of protection in preventive and repressive terms continues to be the default form of establishing an adequate and moderate human behavior.
The protection of the environment, the international community, and therefore the Republic of Serbia, through the ratification of international documents (most importantly, the Council of Europe’s Convention on the Protection of the Environment from November 4, 1998), took a number of measures in order to protect it.Under the term of living and working environment we consider everything that surrounds us, such as climate, air, water, land, plant and animal life, housing and industrial areas, as well as direct and indirect links with production and life activities (Bingulac, Matijašević , 2013).The Law on Environmental Protection (Official Gazette of the Republic of Serbia, No. 43/11) defines the environment as “a set of natural and created values whose complex interrelationships make the environment, that is, the space and living conditions”.
Environmental protection is the existential right of man and is a necessary condition for the survival of mankind.If this is an “indicator”, the Republic of Serbia has primarily within the Constitution (Official Gazette of the Republic of Serbia, No. 98/06) in the second part, which guarantees human and minority rights and freedoms, Article 74, prescribed the right to a healthy environment.It is envisaged that everyone has the right to a healthy environment and to timely and complete notification of its condition, as well as the obligation to protect, preserve and improve the environment.
Criminal law enforces the protection of society from crime, as the most effective measure and measure of ultima ratio in suppressing illicit behavior, so the protection of the environment is best achieved by criminal protection. Depending on whether illegal behavior is t only or predominantly attacking or endangering the environment, in theory, according to individual authors (Jovasevic, 2012 and Joksic, 2012), the following are distinguished:
1. Basic, primary,realor purely ecological crimes or environmental crimes in the narrow sense (the acts prescribed in the twenty-fourth chapter of the Criminal Code (Official Gazette of the Republic of Serbia, No. 85/2005, 88/2005 - also, 107/2005 - Isc., 72/2009, 111/2009, 121/2012, 104/2013, 108/2014 and 94/2016);
2. Second, secondary, inaccurate or relative environmental crimes or environmental crimes in the broader sense (crimes that are found in other chapters of the Criminal Code, for example, Criminal offenses against human health, acts against general security, etc.)
3. Secondary supplemental environmental crimes that are not prescribed in the Criminal Code, but are prescribed in special, subsidiary, auxiliary or supplementary criminal legislation, that is, in other laws in the field of environmental law.
1163EP 2017 (64) 3 (1161-1176)
CRIMINAL AND CIVIL LIABILITY FOR ENVIRONMENTAL DAMAGE
Civil law protection through sanctions directed against the debtor as a mechanism of coercion against a who causes damage,with the aim of achieving and bringing theproperty or other personal non-material goods to the state in which they were before threat or disturbation (Nikolić, 2007).
There are several qualifications of civil law sanctions.They are grouped on the basis of their function.When it comes to protection of the environment, it is important to divide these sanctions into preventive sanctions, natural restitution and compensatory and reparatory sanctions.The objective of preventive sanctions, which can be assumed, is to eliminate potential hazards, ie to prevent activities that are causing harassment or the danger that harm might occurre (Nikolić, 2007).
Civil law protection of the environment is not regulated directly by concrete regulations, but it is provided for by legislative instruments in the field of compensation of damages, for example, In the Law on Obligations, the property relations, which are foreseen in the The Law on foundations of property Law relationsand other.
In support of the aforementioned, we state that the Law on Obligations (Official Gazette of SFRY, No. 29/78, 39/85, 45/89 - USJ Decision and 57/89, Official Gazette of FRY, No. 31/93 and Official Gazette SCG, No. 1/2003 - Constitutional Charter) stipulates in Article 156 that the elimination of the danger of damage, or in an direct way is legally envisaged as an obligatory legal instrument for environmental protection. Some authors, this legal instrument alaso call ecological lawsuit when viewed in this sense (Petrušić, 2003).
In the aforementioned law and article, the legislator foresaw that in order to eliminate the risk of damage, there must be a “substantial damage” that is assessed separately in each of the specific cases.
According to the same author, when this question is viewed from an environmental point of view, it is of importance the question of liability for damage arising in the performance of a beneficial activitie, or for an activity for which there is a license of the competent authority(Petrušić, 2003).Authors who have dealt more specifically with this specific issue criticize the existing legal solution and emphasizey that they are insufficiently determined and that there are possibilities of abuse in practice, precisely because of the possibility of a very broad interpretation of the definition of a general-purpose activity.Then, the damage caused by the performance of beneficial activitie relates to damage that affects only individuals, and therefore the exercise of the request depends solely on the will of that individual or person.In addition to the above, the same authors submit an opinion about the once-again lack of this provision, which refers to the “reduced efficiency of some legal claims due to insurmountable process barriers “.The reason is that the duty of the plaintiff is to specify the measures in the lawsuit that the defendent should take in order to eliminate or prevent the occurrence of damage, which requires a significant level of expertise and training of prosecutors in the field of environmental protection, which in practice does not usually exist, as a consequence of the possibility of defining these measures (Petrušić, 2003).
1164 EP 2017 (64) 3 (1161-1176)
Dalibor Krstinić, Nenad Bingulac, Joko Dragojlović
On the basis of what has been said so far, one can see the complexity and specificity of criminal and civil liability in terms of environmental damage, which requires that some questions that have already been raised try to provide answers or at least suggestions for overcoming the existing situation, but also to launch another very important issues that are directly related to protection against environmental damage.
The significance of this research is that in a concise manner, with the equal representation of the criminal and civil law aspects of environmental protection, the legal protection of the environment in domestic legislation will be considered, but the almost absolute influence of the international legislative foundation of this protection can not be ignored, which is not only important, but also the necessity for the current process of European integration of Serbia, has more immeasurable significance precisely for the protection of our environment from the perspective of the citizen and man.
Methodology
The aim of the paper is to analyze, through the methodological-theoretical framework, the responsibility for endangering the environment from the criminal-law and civil-law aspect in positive legislation.The method of analysis will explain the concepts related to the environmental responsibility of the environment.Also, using the same method, the basic concepts related to the field of criminal and civil law responsibility for environmental damage will be brought to the fore, and in this way the importance of this issue will be noticed not only from the legal aspect, but also from the existential aspect of the modern man.The normative method will produce an overview of legislation that regulates issues of criminal and civil law liability due to environmental damage at the level of the European Union and the Republic of Serbia.Applying the same method will also point to the most important legal regulations of relevance in this area, as well as the most important legislative provisions that regulate the issue of accountability due to environmental threats from the criminal and civil law aspect, both in Serbia and in the European Union.In addition to the aforementioned methods that we will use, a comparative method is also required. The comparative method will indicate the similarities and differences in the legislative regulations applied in Serbia and the European Union, while the results that they produce will be compared and analyzed, and the same will be done with the positive and negative sides of the various legal solutions.
International and European legislative basis in terms of environmental responsibility.
The member states of the Council of Europe signed the European Convention for the Protection of Human Rights and Freedoms in Rome in 1950.In this document, the right to a healthy environment or the right to life to such an environment is not recognized as a fundamental human right.
By understanding the importance of environmental protection began the gradual
1165EP 2017 (64) 3 (1161-1176)
CRIMINAL AND CIVIL LIABILITY FOR ENVIRONMENTAL DAMAGE
development of this right in the international sense. At its meeting in June 2003, the Assembly of the Council of Europe adopted Recommendation 1614 (Assembly Recommendation 1614-2003).This recommendation urges the Governments of the member states of the Council of Europe to ensure adequate protection of life, health, private and family life, physical integrity and free use of property.Articles 2, 3 and 8 of the European Convention for the Protection of Human Rights and Freedoms, as well as the Protocols thereto, are also binding on this.
By adopting this recommendation, Article 9 stipulates that the governments of the member states of the Council of Europe recognize the “human right to a healthy, sustainable and decent environment” and, therefore, create a legislative basis in domestic legislation, starting with constitutional guarantees.
It is necessary to mention that the term “the right to a healthy environment” was introduced by theStockholm decleration from 1972 (Declaration of the United Nations Conference on the Human Environment).
Of particular importance is the European Court of Human Rights.This court resolves disputes by referring to many conventions that provide for and guarantee human rights and freedoms, in particular those relating to the right to life, the right to a fair and public hearing within a reasonable time before an independent and impartial tribunal, the right to a private and family life , the right to freedom of expression, the right to the free enjoyment of property.Then, as defined by the individual slots, the European Court of Human Rights provides protection of the rights to a healthy environment by “establishing a violation of applicable national regulations in the field of environmental protection which violates fundamental human rights and freedoms guaranteed by the European Convention for the Protection of Human Rights and Freedom (Drenovak-Ivanović, Đorđević, 2013).
As already mentioned, the European Court of Human Rights refers to many other conventions, therefore it is also necessary to mention the Convention on the Conservation of European Wildlife and Natural Habitats.This Convention was signed in 1979 in the Swiss city of Bern, and is therefore it is more famous as the Bern Convention, and came into force in 1982.At the end of 2007, Serbia passed the Law on the Confirmation of the Convention on the Conservation of Wild Fauna and Flora and Natural Habitats.The aim of the Convention is to establish standards for: conservation of wild plant and animal species and their natural habitats, especially those species and habitats for which conservation requires co-operation between states; enhancing cooperation between the state members of the Convention in the field of nature protection; and special protection of endangered and sensitive plant and animal species.
To a certain extent the Convention on Civil Liability for Damage Resulting from Activities Dangerous to the Environment, ETS No. 150, although the clear reason for her mentioning is in her name, especially during this research, her specificity is in a completely different view. The Convention on Civil Liability for Damage Resulting from Activities Dangerous to the Environmentwas finalized and signed for in 1993 in
1166 EP 2017 (64) 3 (1161-1176)
Dalibor Krstinić, Nenad Bingulac, Joko Dragojlović
the Swiss city of Lugano, and it is more famouse bt that. Given its commitment and the need to achieve close cooperation among the countries, it is open for signing also for non-member states of the Council of Europe.The Convention has not yet entered into force, because it has not been ratified by the member states of the Council of Europe.
With this Convention, it was planned not only to define certain concepts of interest, but also to ensure that, as a result of the damage which terminologically includes: the violation of people or the loss of human life, the damage to the property of people, with the exclusion of damage caused to the factory or property managed by the holder of life-threatening activities, provide for the compensation of the damage mentioned, as well as the compensation for damage caused by the damage to the quality of the environment and the compensation for the damage directly caused to persons or their property.The convention also provided for compensation for lost profits, but also the costs arising from the taking of measures necessary for preventing the effects of damage and restoring the environment to the state before the damage occurred.
Liability for damage compensation is determined by the rules of objective liability, as foreseen in the Convention itself in Article 10. More precisely, the carrier of activities that can be hazardous to the environment is responsible for the occurrence of the damage, regardless of guilt, because its responsibility arises from its competence to carry out this dangerous activity.The possibility of excluding objective liability is provided for in Article 8, in a way that it will not exist if it is proved that the damage was caused as a result of the activities of a third party intended to inflict damages and which were succeeded in that intention, even though all necessary security measures were in place.
Its auite interesting is the fact that the Convention on the Protection of Environment through Criminal Law, CETS No.172/98had the same destiny asaThe Convention on Civil Liability for Damage Resulting from Activities Dangerous to the Environment.
The Convention on Criminal Law Protection was prepared for ratification in 1998.The Convention aimed to include measures of prevention and measures of an administrative nature in order to prevent the occurrence of environmental damage through the application of criminal law protection.Certain standards have been envisaged: the need to take certain measures and activities at the national level with the obligation to conduct a common criminal policy in order to protect the environment; the need to protect the life and health of people, flora and fauna, as well as natural resources, firmost through measures of prevention, but also by the application of criminal law measures, as the ultimate means of protection; And the necessity to prescribe violation of the principles of environmental protection as a criminal offense subject to appropriate sanctions and to strengthen international cooperation in the field of prosecution and punishment of environmental offenders, as is foreseen in the preamble of this Convention.
So far we have been talking about about the “domain” of the Council of Europe and environmental protection, while the attention to the United Nations domain and environmental protection will be given below.

1167EP 2017 (64) 3 (1161-1176)
CRIMINAL AND CIVIL LIABILITY FOR ENVIRONMENTAL DAMAGE
The United Nations Charter was signed in 1945.The most important documents that have been adopted are the Universal Declaration of Human Rights from 1948, the 1966 Covenant on Civil and Political Rights and the 1966 Pact on Economic, Social and Cultural Rights.
The specificity of these documents is that although they present very important documents in the broadest sense, they do not foresee or define the right to a healthy environment.In other words, based on these documents, United Nations competence on environmental protection is not envisaged.
Decleration, which was the first to handle some of the major environmental issues, is the 1972 Stockholm Declaration of the United Nations Conference on the Human Environment. In addition to the aforementioned importance of this Decleration for the establishment of terms - environmental protection, the principle has been introduced that a person has the fundamental right to freedom, equality and appropriate living conditions in an environment of such quality that enables dignified life and well-being and has a unique responsibility for the protection and promotion Environment for present and future generations.
Following the adoption of the said Decleration and encouraged by it, the United Nations General Assembly adopted Resolution 2997 which established the United Nations Environment Program - UNEP, all in order to encourage developing countries to adopt legislative measures of the importance to protection against climate change, achieving efficient use of resources, reducing the danger to human health from ecological incidents and natural disasters, achieving a comprehensive environmental protection, ie protecting water, soil and air and promoting the conservation and sustainable use of natural values.
The Rio Conference on Environment and Development from 1992 established the basic principles of civil protection of basic ecological values, but also the precautionary principle, all based on the recommendations of the Brundland Commission.The Conference has adopted in addition to the Declaration on Environment and Development, the United Nations Framework Convention on Climate Change and the Convention on Biological Diversity, as well as Agenda 21 (Drenovak-Ivanović, Đorđević, 2013).
The declaration stipulates, among other things, that countries that exploit natural resources must respect the environmental policy.The convention has 27 basic principles, and for the needs of conciseness and importance for this research, we will point out only to few of them.
Principle 13 deals with the issue of compensation for damage to victims of environmental damage in a manner that: “Member States should adopt national laws relating to liability and compensation to victims of pollution and other environmental damage.Member States should also cooperate without delay and decisively in the adoption of future international regulations relating to liability and compensation, when activities within their legal competence or control cause environmental effects in areas outside their jurisdiction. “
1168 EP 2017 (64) 3 (1161-1176)
Dalibor Krstinić, Nenad Bingulac, Joko Dragojlović
Principle 15, the Declaration introduces the precautionary principle in environmental protection in such a way that if there is a reasonable scientific suspicion that there may be a threat, measures that prevent the exposure of people and the nature of harmful activities can be taken.
Principle 16, the “polluter pays” principle is introduced, which is now one of the basic principles of environmental protection.This principle obliges the State party that, in the event of damage to the environment, the polluter should bear all the costs that caused the pollution, but without disturbing the interests of international trade.
Some authors who have dealt with this issue point out that the issue of environmental damage at the European Union level has been taken into consideration in the 1970s, within the framework of the issue of waste management and product quality control, but also the responsibility of airline companies in the case accident.These regulations only regulate certain aspects of compensation for damage relating to compensation for damages suffered by a particular person or, possibly, compensation for actual damages, but the general standards of environmental damage compensation aren’t regulated by those regulations. (Drenovak-Ivanović, Đorđević,Važić, 2015).
Considering that an unwanted case has to happen in order to encourage any future prevention, there was no other practice here, it was about polluting the Rhine River, bypassing toxic chemicals into the river, which caused water pollution and the flow of the river going through four countries, and the consequences in addition to the aforementioned were also that the fish population was destroyed as well as the flora and fauna that inhabited the banks of the river. In legal terms, criminal proceedings had been taken against the responsible persons in the company, while on the other hand the issue of compensation for damage was imposed.Specificity is that the claims for damages were filed in Switzerland, Germany, France and the Netherlands, but an settlement was reached and hence no judicial position was created, as a legal basis for future similar cases(Drenovak-Ivanović, Đorđević,Važić, 2015).
Based on this legal gap in a certain sense, at the level of the European Union, the European Commission has submitted a proposal for a future policy in addressing similar cases.In its Green Paper on Remedying Environmental Damage, the view is that environmental damage compensation must be regulated in accordance with general principles of civil law, but it is necessary to create a special legal regime due to the complexity of this issue by applying the “ polluter pays principle “ and the principle of prevention.The European Parliament expressed its opinion on such future legal framework, as evidenced by Directive 2004/35 / EC of the European Council and the European Parliament on liability for environmental damage.
Article 3 of the Directive provides that natural personsand legal entity can not be invoked, on the basis of it, compensation for damage to their life and health or property, caused by environmental damage or imminent danger, while in the Preamble to the Directive provides that individuals affected by or likely to be affected by environmental damage, in accordance with Directive 2004/35 / EC, have the right to request the

1169EP 2017 (64) 3 (1161-1176)
CRIMINAL AND CIVIL LIABILITY FOR ENVIRONMENTAL DAMAGE
competent authority to apply appropriate protection measures.
A particularly important Directive, not only for this research, but also for the environmental protection itself, which should be mentioned is Directive 2008/99 / EZ.This directive has emerged, as some authors point out, as the “answer” of EU Member States to an increase in the number of offenses against the environment, as well as due to the greater consequences of these acts involving the territories of several states. The same authors conclude that based on the analysis of the system of sanctions for these crimes, the ineffectiveness of criminal legislation in the field of environmental protection was noticed (Drenovak-Ivanović, Đorđević,Važić, 2015).As already mentioned, environmental pollution often has consequences for several countries and that the most common offenses are international companies, it is quite reasonable that there is a need for this international environmental protection and in this way.
The Directive does not foresee criminal acts or sanctions.It is left to national legislations to regulate independently. The Directive envisages standards of criminal-law protection of the environment.
More precise review of the frequency of the commited of criminal offenses from this group has shown, as stated by some research, that there are a number of cases where the perpetrators of criminal offenses are legal individuals, most often in the field of illegal trade in protected species, illegal trade in substances that may have a negative Ozone layer impact, trade of rare tropical tree species, illegal waste removal, etc. (Drenovak-Ivanović, Đorđević,Važić, 2015). The Directive hasenvisaged in Article 6 that natural personswill also be prosecuted for criminal offenses related to environmental protection, even for those acts for which the liability of a legal individualhas been established.
Criminal liability due to environmental damage
The criminal liability of environmental damage is based on the Criminal Code of the Republic of Serbia (Official Gazette of the Republic of Serbia, No. 85/2005, 88/2005 - ispr., 107/2005 - ispr., 72/2009, 111/2009, 121/2012, 104 / 2013, 108/2014 and 94/2016). The legislator grouped criminal offenses against environmental threats in a separate chapter of the Criminal Code, Chapter 24, under the same name.
The legislator foresaw 18 criminal offenses. They can be further systematized in the following way (Dragojlović, Bingulac2015):
- the general group of criminal acts against the environment (environmental pollution Article 260 of the CC, non-implementation of environmental protection measures Article 261 of the CC, illegal construction and commissioning of facilities and installations that pollute the environment Article 262 of the CC, Damage to facilities and devices for environmental protection Article 263 of the CC, environmental damage Article 264 of the CC, destruction, damage and removal of protected natural heritage from country of origin Article 265 of the CC, violation of the right to information on the state of the environment Article 268 of the CC),
1170 EP 2017 (64) 3 (1161-1176)
Dalibor Krstinić, Nenad Bingulac, Joko Dragojlović
- criminal acts related to hazardous substances (introduction of hazardous substances into Serbia and unauthorized processing, disposal and storage of hazardous substances, Article 266 of the CC, unauthorized construction of nuclear installations, Article 267 of the CC),
- criminal offenses against plant and animal life (killing and torture of animals Article 269 of the CC, transfer of infectious diseases in animals and plants Article 270 CC, misleading provision of veterinary assistance Article 271 of the CC, production of harmful substances for the treatment of animals Article 272. CC, pollution of food and water for feeding or feeding of animals Article 273 of CC, destruction of forests Article 274 of CC, forest theft Article 275 CC),
- hunting and fishing offenses (illegal hunting Article 276 of the CC, illegal fishing Article 277 of the CC).
A protective object for this group of crimes is precisely the protection of the environment and the right of man to a healthy and preserved environment.The aforementioned protective object for almost all of these criminal offenses stems from the title of the offense, in the sense, they contain the term “environment”, while there are those who do not, which undoubtedly implies their indirect protection.
In addition to the criminal offenses so far mentioned, it is necessary to mention several more criminal offenses that may have environmental consequences, although the legislator did not classify them in the aforementioned group, which in no way makes them less significant.They are: pollution of drinking water and food Article 258 of the CC, serious actions against human health Article 259 of the CC, causing a general danger Article 278 of the CC, damage to dams and waterworks facilities Article 282 CC and serious offenses against general security Article 288 of the CC.
It is especially important to point out the following legislator prescribed that a perpetrator could be punished for attempting a criminal offense if this is foreseen by a specific criminal offense in material terms, in principle, Article 30 stipulates that if a person starts the commission of a criminal offense with intent, but fails to complete it, he shall be punished for attempting a criminal offense for which a punishment of imprisonment of five years or more can be imposed by law.
From the group of criminal acts against the environment, in two parts, the legislator foresaw the criminal responsibility for the attempt to destroy, damage, take abroad and bring in Serbia a protected natural asset as well as criminal act of forest theft. For both these acts, a fine and/or imprisonment of up to three years is foreseen, which indicates, having in mind the previously mentioned attempts at material loss, the importance of protecting the environment, as well as the interest of the legislator and the society in combating these crimes and, accordingly, responsibilities of responsible, but of course, preventive character of environmental protection.
At the end of this part of the research, it is necessary to point out that when determining criminal responsibility based on subjective responsibility, the adoption of the Law on
1171EP 2017 (64) 3 (1161-1176)
CRIMINAL AND CIVIL LIABILITY FOR ENVIRONMENTAL DAMAGE
the Liability of legal individuals for criminal offenses (Official Gazette of the Republic of Serbia, No. 97/2008).Domestic criminal legislation stipulates that the liability of a legal individual is based on the guilt of the responsible person, or that the responsible person, by the commission of a criminal offense, bases his own responsibility and responsibility of the legal individual on whose behalf he committed the criminal offense.It follows from this that, as some authors point out, in this way, double criminal responsibility, ie responsibility of the responsible person and legal entity, even though only one has done the work (Rakočević, 2011).On the basis of statistical indicators, the same authors come to the conclusion that the commission of a criminal offense in favor of a legal entity for this criminal act is mainly related to the avoidance of costs related to the construction, installation, regular maintenance and putting into operation of facilities and plants whose function is environmental protection of matter which arise in the process of production or other human activity.In other words, most often these works are carried out with the intention to realize the property gain for a legal entity (Rakočević, 2011).
Civil law liability due to environmental damage
In domestic legislation, the issue of environmental damage is most often regulated through civil law, or as a form of compensation to which the general rules of civil law apply (Drenovak-Ivanović, 2014).
In the introductory review of this research we have pointed out to the constitutional framework for environmental protection in the Republic of Serbia, which has its substantive legal form through the real legal obligatory legal character.Within the framework of civil law regulations, the issue of property protection of the environment is not directly regulated, but this is achieved through other legal instruments, that is, through the instruments of protection of property legal character and obligatory legal character.
The basic law by which the legislator prescribes environmental protection is precisely the Law on Environmental Protection (Official Gazette of RS, No. 135/2004, 36/2009, 36/2009 - other law, 72/2009 - other law, 43/2011 - US Decisions and 14/2016).Law defines the environment as a set of natural and created values whose complex interrelationships make up the environment, that is, the space and living conditions.
When it comes to liability, the Law “keeps the institute “ that the polluter pays, while in the case of civil liability for the consequences of pollution, this issue is regulated by Articles 103 to 108.It is precisely in Article 103 that a polluter thats causes pollution of the environment, by act or doing or not doing enough as provided for in Article 104, is liable for the damage incurred by the principle of strict liability, in an emergency procedure before a court.Then, Article 107 legislator foresaw that anyone who suffered damage as a right to compensation, while in the absence of any persons having the said right, the Republic of Serbia holds that right.When it comes to polluters, the legislator foresaw solidarity in the event that more polluters are responsible for the damage when

1172 EP 2017 (64) 3 (1161-1176)
Dalibor Krstinić, Nenad Bingulac, Joko Dragojlović
their individual shares can not be accurately determined.
The legislator foresaw the proceedings before the court for compensation of damages as an urgent procedure, which sufficiently speaks in itself about the significance of this issue.
It is necessary to point also to Article 108 of the Law on Environmental Protection, which provides for the proper implementation of the law, and in such a way that the issues of liability for damage to the environment are not regulated by the Law on Environmental Protection but by the general rules of the Law on Obligatory Relationships.
Law on Obligations (Official Gazette SFRY, No. 29/78, 39/85, 45/89 - USJ Decision and 57/89, Official Gazette of FRY, No. 31/93 and Official Gazette of SCG, No. 1/2003 - Constitutional Charter) provides for the elimination of the danger of damage in Article 156.
The legislator has foreseen that, on the basis of the said article, anyone may require the other to remove a source of danger from which a substantial damage to him or an unspecified number of persons can occure, and to refrain from the activity resulting in harassment or danger of damage if the occurrence of harassment or damage can not be prevented by appropriate measures.Then, at the request of the interested person, the court will order appropriate measures to prevent the occurrence of damage or harassment, or to eliminate the source of danger, at the expense of the source of danger, if he does not do so.In cases where damages arise in the performance of a commonly used activity for which the license of the competent authority is obtained, only compensation for damages exceeding normal limits may be required, but in this case it may be required to take socially justified measures to prevent the occurrence of damage or to reduce it.
It is also important to point out the Law on the Basis of Ownership Relations (Official Gazette SFRY, No. 6/80 and 36/90, “Official Gazette of FRY”, No. 29/96 and “Official Gazette of the Republic of Serbia”, No. 115/2005 andother law), which has a bearing on the responsibility of pollution and environmental protection.
The legislature envisaged in Article 5 that the owner of the real estate is obliged to refrain from taking action when using the real estate and to eliminate the causes that stem from his immovable property, which makes it difficult to use other real estate –transmission of smoke, unpleasant smells, heat, soot,tremor, noise, wastewater discharges, etc. - exceeding the measures that are customary in view of the nature and purpose of the immovable property and the occasional circumstances, or which causes significant damage.
As can be seen, the legislator is here “directed” towards one or a smaller number of pollutants, but also to the damage itself and the causes of lesser intensity.
The special significance of this law is by individual authors because it plays a key role in filing an environmental complaint when “environmental risk” has already appeared, which is not a wider effect, and when it comes to more subjects (Salma, 2014).
The realization of civil protection of the environment and determination of responsibility shall be carried out in such a way that the holder of a legal duty, on its own initiative

1173EP 2017 (64) 3 (1161-1176)
CRIMINAL AND CIVIL LIABILITY FOR ENVIRONMENTAL DAMAGE
or on the basis of a request for a title deed, fulfills its duty starting with the removal of sources of pollution, taking preventive measures, etc.In cases of non-compliance with the legal obligation in full or in the foreseen manner, the titular law may protect its subject right before the court.
Conclusion
From the overall research, it can be clearly seen that criminal and civil liability in terms of environmental damage can not be solely and exclusively regarded as a matter or as a problem of only one state.The normative analysis led to the conclusion that the harmonization of national legislation with international and European regulations has been significantly effected, all in order to achieve minimum common standards not only in the field of environmental protection, but also in determining responsibility for the occurrence of pollution.
Compared to where there is a common liability for damages, the multi-step specificity arises from the liability of the pollutant for damage to the environment.It is reflected in legal responsibility, but also in potentially responsible persons and their obligations.Responsibility can be observed through harmful consequences arising from a particular pollution.This liability, in legal terms, coincides with the usual procedural actions for any damages in the area of legal liability, and it is based on criminal or misdemeanor liability, but also on civil liability, because liability is based on guilt.Then, when it comes to damage that has environmental consequences (damage to the environment), then the polluter has responsibility irrespective of his fault, that is, it is about objective liability.Some authors further specify this to indicate that with the objective liability of the pollutant, it is not necessary for the activity or thing that produces pollution to be dangerous, because a legal or physical person who, by his act or omission, leads to environmental pollution,and it there there foreseen that “polluter pays” and not that “pollutant responds”(Stojanović, Zindović, 2015).The issue of criminal and civil liability is not only important for the issues mentioned above. Establishing this responsibility has a much wider impact, and for example, it is necessary to indicate the necessity of determining liability for insurance reasons (Jovičić,Jeremić, i Jovanović, 2017).
Analyzing and studying the legislation related to the issues that have been addressed in this research, it follows that legal regulations related to criminal and civil liability due to environmental damage are conceived on known international legal instruments and legislation of the European Union, in particular Directive 2004/35.
Based on the findings of this research, it can be concluded that since the basic goal of criminal and civil liability is due to environmental damage, in addition to unquestionable repression in preventive character, in terms of protection and in terms of compensation for damage and return of endangered environment to the state before the occurrence of harmful events, it must be emphasized that all of these legal principles are aimed at finding the most effective legal measures in terms of prevention and accountability due to environmental damage.

1174 EP 2017 (64) 3 (1161-1176)
Dalibor Krstinić, Nenad Bingulac, Joko Dragojlović
Literature
1. Bingulac, N., Matijašević, J. (2013): Integrated License in Regulations on Environmental protection of Serbia“, XVII International Eco-conference®, 25st-28th Septemer 2013, Proceedings ,,Environmental protection of urban and suburban settlements“, Ekological movement of Novi Sad, Novi Sad, pp. 547-548
2. Convention on Civil Liability for Damage Resulting from Activities Dangerous to the Environment, ETS No. 150/93, 1993.
3. Convention on the Conservation of European Wildlife and Natural Habitats, ETS No. 104/79, 1979.
4. Convention on the Protection of Environment through Criminal Law, CETS No. 172/98, 1998.
5. Declaration of the United Nations Conference on the Human Environment, From Report of the United Nations Conference on the Human Environment, Stockholm, 1972.
6. Directive 2004/35/CE of the European Parliament and of the Council of 21 April 2004 on environmental liability with regard to the prevention and remedying of environmental damage, 2004.
7. Directive 2008/99/EC of the European Parliament and of the Council of 19 November 2008 on the protection of the environment through criminal law, 2004.
8. Dragojlović, J., Bingulac, N. (2015):The use of criminal law for the protection of the environment in the Republic of Serbia, XIX International Eco-conference® and XI Eco-conference®, 23st-25th September 2015, Novi Sad, Proceedings:“Environmental protection of urban and suburban settlements“, Ekological movement of Novi Sad, Novi Sad, pp. 341-350
9. Drenovak-Ivanović, M. (2014):Odgovornost za štetu u životnoj sredini: uporedni modeli i pravci noveliranja zakonodavstva Srbije, Pravni život, pp. 450-464, Udruženje pravnika Srbije,Belgrad, Serbia
10. Drenovak-Ivanović, M., Đorđević, S. (2013):Praktikum o pravu na pravnu zaštitu u pitanjima životne sredine u upravnom postupku i upravnom sporu, Ministarstvo energetike, razvoja i zaštite životne sredine, Misija OEBS-a u Srbiji, Belgrad, Serbia
11. Drenovak-Ivanović, M., Đorđević, S., Važić, S. (2015): Pravni instrumenti ekološke zaštite – građanskopravna i krivičnopravna zaštita, OEBS/Ministarstvo poljoprivrede i zaštite životne sredine, Belgrade, Serbia
12. Green Paper on remedying environmental damage. COM (93) 47 final, 14 May 1993.
13. Joksić, I.(2012): Krivičnopravna zaštita životne sredine u zakonodavstvu i praksi, Ekologija i pravo, pp. 20-33, Institut za uporedno pravo, Pravni fakultet Univerziteta Union u Beogradu,Belgrad, Serbia
14. Jovašević, D. (2012): Zaštita životne sredine u sporednom krivičnom pravu

1175EP 2017 (64) 3 (1161-1176)
CRIMINAL AND CIVIL LIABILITY FOR ENVIRONMENTAL DAMAGE
Republike Srbije, Evropsko zakonodavstvo, Vol. 11, No. 41/12, pp. 331-332, Institut za međunarodnu politiku i privredu, Belgrad, Serbia
15. Jovičić, D., Jeremić, Lj., Jovanović, Z. (2017): Financing agribusiness: insurance coverage as protection against credit risk of warehouse receipt collateral, Economics of Agriculture, The Balkan Scientific Association of Agrarian Economists, Belgrade, Institute of Agricultural Economics, Belgrade, (Serbia), Academy of Economic Studies, Bucharest (Romania), Vol. 64, No. 2, pp. 467-481, Belgrad, Serbia
16. Krivični zakonik , Official Gazette of RS, no. 85/2005, 88/2005 - ed., 107/2005 - ed., 72/2009, 111/2009, 121/2012, 104/2013, 108/2014 and 94/2016, 2016.
17. Nikolić, D. (2007):Uvod u sistem građanskog prava, Pravni fakultet u Novom Sadu, Novi Sad, Serbia
18. Parliamentary Assembly Recommendation 1614, Reply adopted by the Committee of Ministers on 21 January 2004 at the 869th meeting of the Ministers’ Deputies, 2003.
19. Petrušić, N. (2003):Građanskopravni instrumenti ekološke zaštite u domaćem pravu,Proceedings presented at an international scientific conference held at the Law Faculty in Nis 21-22. May 2003, within the national project “Civil codification”, Pravni fakultetu Nišu, Centar za publikacije, Nišpp. 339-363
20. Rakočević, P. (2011):Krivičnopravna odgovornost zbog zagađenja životne sredine, Glasnik advokatske komore Vojvodine, Časopis za pravnu teoriju i praksu, LXXXIII, vol. 71, no 4,pp.199-216, Advokatska komora Vojvodine, Novi Sad, Serbia
21. Salma, M. (2014):Preventivna tužba za otklanjanje izvora opasnosti od štete u svetlu održivog razvoja, Zbornik radova Pravnog fakulteta, Vol. 48, No. 4, pp. 131-145, Faculty of Law Novi Sad, Novi Sad, Serbia
22. Stojanović, P., Zindović, I (2015):Pravna odgovornost za razvoj i zaštitu životne sredine, Anali Pravnog fakulteta u Beogradu, Vol. 63, No. 1, pp. 41-57, Faculty of Law Belgrade, Belgrad, Serbia
23. United Nations Environment Programm, established by General Assembly resolution 2997 (XXVII) of 15 December 1972.
24. Ustav Republike Srbije, Official Gazette of RS, no. 98/06, 2006.25. Zakon o oblikacionim odnosima, Official Gazette of SFRJ, no. 29/78, 39/85, 45/89
–des. USJ and 57/89, Official Gazette of SRJ, no. 31/93 andOfficial Gazette SCG, no. 1/2003 – Us., 2003.
26. Zakon o odgovornosti pravnih lica za krivična dela, Official Gazette of RS, no. 97/2008, 2008.
27. Zakon o osnovama svojinskopravnih odnosa, Official Gazette of SFRJ, no. 6/80 and 36/90, Official Gazette of SRJ, no. 29/96 and Official Gazette of RS, no. 115/2005 –otherlaw, 2005.
28. Zakon o zaštiti životne sredine, Official Gazette of RS, no. 135/2004, 36/2009,

1176 EP 2017 (64) 3 (1161-1176)
Dalibor Krstinić, Nenad Bingulac, Joko Dragojlović
36/2009 - other law, 72/2009 - other law, 43/2011 - US and 14/2016, 2016.29. Zakon o zaštiti životne sredine, Official Gazette of RS, no. 43/11, 2011.
KRIVIČNOPRAVNA I GRAĐANSKOPRAVNA ODGOVORNOST USLED UGROŽAVANJA ŽIVOTNE SREDINE
Dalibor Krstinić4, Nenad Bingulac5, Joko Dragojlović6
Summary
Životna sredina je egzistencijalno pravo čoveka. Zaštita životne sredine, posmatrano u odnosu na druga pitanja, od skoro se nalazi na vrhu prioriteta, te stoga je i prepoznata nužnost ali i urgentnost uspostavljanja pravne regulative. Pitanje odgovornosti usled ugrožavanja životne sredine može se posmatrati iz više uglova, dok će fokus ovog istraživanja biti usmeren ka krivičnopravnoj i građanskopravnoj odgovornosti. Krivičnopravnim zakonodavstvom se ostvaruje zaštita društva od kriminaliteta, pa se tako i najsvrishodnija zaštita životne sredine u ovom smislu, ostvaruje upravo na pomenuti način. Građanskopravna zaštita životne sredine ne reguliše se direktno konkretnim propisima, već se ona predviđa zakonodavnim instrumetima u oblasti naknade šteta, kao što su Zakon o obligacionim odnosima, Zakonu o osnovama svojinsko pravnih odnosa i dr. Usled istaknutog cilj ovog istraživanja je da se kroz metodološko-teorijski okvir analizira krivičnopravna i građanskopravna odgovornost usled ugrožavanja životne sredine. Metodom analize razmotriće se najznačajnija pitanja za istraživanje, dok će se normativni metod koristiti za prikaz legislativa koje regulišu proučavanu materiju na međunarodnom nivou, na nivou Evropske unije i u pozitivnom zakonodavstvu Republike Srbije. Komparativnim metodom sumiraće se proizašli rezultati.
Ključne reči: krivičnopravna odgovornost, građanskopravna odgovornost, odgovornost usled ugrožavanja životne sredine
4 Dalibor Krstinić M.Sc., asistent i doktorant, Univerzitet Privredna akademija, Pravni fakultet za privredu i pravosuđe u Novom Sadu, Ulica Geri Karolja br. 1, 21000 Novi Sad, Srbija, Telefon: +381 64 139 43 16, E-mail: [email protected].
5 Docent, dr Nenad Bingulac, Univerzitet Privredna akademija, Pravni fakultet za privredu i pravosuđe u Novom Sadu, Ulica Geri Karolja br. 1, 21000 Novi Sad, Srbija, Telefon: +381 69 520 22 55, E-mail: [email protected].
6 Docent, dr Joko Dragojlović, Univerzitet Privredna akademija, Pravni fakultet za privredu i pravosuđe u Novom Sadu, Ulica Geri Karolja br. 1, 21000 Novi Sad, Srbija, Telefon: +381 64 942 99 36, E-mail: [email protected].
1177
Economics of Agriculture 3/2017UDC: 339.33:633/637
EP 2017 (64) 3 (1177-1190)
THE IMPORTANCE OF THE WHOLESALE MARKETS FOR TRADE IN AGRICULTURAL PRODUCTS
Review article
THE IMPORTANCE OF THE WHOLESALE MARKETS FOR TRADE IN AGRICULTURAL PRODUCTS1
Boris Kuzman2, Nedeljko Prdić3, Zoran Dobraš4
Summary
The main objective of this research is based on the importance of wholesale markets as special market institutions in trade in agro-industrial products. Based on communication knowledge about the retail market operations (wholesale gross markets), on the domestic market, as well as the importance given to wholesale markets in the developed countries from the aspect of trade, it is concluded that even domestic trade can increase selling these type of products at wholesale markets. The subject of research of this paper is concept of building wholesale markets as a substitute for retail trade (quantitative or wholesale gross markets) for agro-industrial products. This paper aims to achieve such a level of knowledge that will enable making quality decisions starting fromthe interests of businesses, traders and customers (consumers).
Key words: market, trade, agro-industrial products, wholesale markets, wholesale
JEL: Q13, M31
Introduction
Distribution of agricultural products must be adapted to the changes in the market environment. The importance of the market for agricultural products as a part of the overall product market takes a special place due to the specific nature of the production process in agriculture. The significance of the wholesale market is reflected in various activities related to the distribution and sale of agricultural products. The paper aims to emphasize the importance of the market for agricultural products for the development of the overall product market, which will
1 Paper is part of project III 46006 - Sustainable agriculture and rural development in function of achieving strategic goals of Republic of Serbia within Danube region, funded by Ministry of Education, Science and Technical Development of Republic of Serbia. Project period 2011-2015.
2 Boris Kuzman Ph.D., Research Associate, Institute of Agricultural Economics, Volgina Street no. 15, 11060 Belgrade, Serbia, E-mail: [email protected]
3 Nedeljko Prdić Ph.D., JKP Tržnica, Novi Sad, Đorđa Servickog street no. 2a/6, Novi Sad, Serbia, Phone: 063/500-818, E-mail: [email protected]
4 Zoran Dobraš M.Sc., Association of Dystrophy and Related Diseases of Republika Srpska, Banja Luka, Republika Srpska, Phone: +387 65 523 600; E-mail: [email protected]
1178 EP 2017 (64) 3 (1177-1190)
Boris Kuzman, Nedeljko Prdić, Zoran Dobraš
influence the selection of an adequate development strategy. Namely, in the market conditions of wholesale market operations, specialized market institutions in the commodity market represented the places which enable the meeting of a large number of buyers and sellers in one place in the wholesale trade of agricultural products. Wholesale markets are such markets and public systems that use closed and open spaces of city infrastructure. The problem that the research aims to resolve is determining the place and role of the wholesale market in the distribution of agricultural products, which will be reflected in the increase in trade in agricultural products and total income in the agro-industry.
When it comes to the importance of the wholesale market as a distribution channel, their role is becoming more and more important in the development of the market, but also their competitiveness in relation to various types of market centers must have a clearly profiled strategy of competitive advantage (Prdić, 2016).
This should also be the goal of Belgrade’s wholesale market: attracting a large number of existing supermarkets, hypermarkets and discount centers to supply their needs in the field of fruits and vegetables, first and foremost, but also fresh meat, fish, etc. They should perform the sales at the Belgrade wholesale market (Lovreta, 2008).
The Wholesale Market is a special market institution that organizes wholesale trade through the regulation, maintenance and issuance of specialized space for displaying and selling fruits, vegetables and other agricultural and food products, other consumer goods, as well as the provision of accompanying services, and in particular the storage of goods, its processing, packaging and other services related to handling and transportation (Law on Trade of the Republic of Serbia).
Over 500 wholesalers operate at Belgrade’s wholesale market. The wholesale market has a total of 866 outlets (on an area of 7ha) on the plateau and 6300 m2 of business and warehouse space (20 shops, 3 malls, 73 tents and 52 warehouses) (veletržnica.co.rs, 2017).
Nowadays, when awareness of the importance of nutrition and, therefore, the importance of arable land is growing, it is necessary to pay particular attention to the problem of the lack of funds in the context of agrarian production(Vojnović et al., 2017).
Competitive advantage on the market through superior value delivered to consumers is something that will last for a while. There are some indications that companies are moving in that direction. This change must be managed. This orientation will require that many companies that intend to follow it should reassess the organisational culture, organizational structure and management skills(Milisavljević, 2010).
The development program of our company, in accordance with the city’s urban plan, is in the process of searching for the best solution for moving this market to an appropriate location, which will, with its surface, access roads and infrastructure, correspond to the generally recognized standards (www.nstržnica.co.rs).
From the point of view of the object and purpose of the research it is necessary to point out that “gross quantitative markets” are inadequate, unregulated, infra-
1179EP 2017 (64) 3 (1177-1190)
THE IMPORTANCE OF THE WHOLESALE MARKETS FOR TRADE IN AGRICULTURAL PRODUCTS
structurally undeveloped and they are surpassed places for wholesale trade in agro-industrial products. The aim is to prove that, at the national level, it is necessary to adopt a strategy for the development of wholesale markets as trade and public facilities that can provide conditions for higher consumption of fruits and vegetables, increase domestic production and development of the agro-industry sector, lower consumer prices and seasonal fluctuations with good infrastructure equipment as well efficient management system.
Methods and assumptions of research
The need to explore the effectiveness of wholesale trade in agro-industrial products is set as the basic element of the market position of these enterprises. The subject of research and control of the effects achieved is based on assumptions based on predetermined goals with what has been achieved as an integral element of trade, rates of return on investment, as well as the interests of customers and end-users of consumers. During the research for the purposes of this paper, among other methods, a comparative method of marketing research was used, which is a combination of historical methods and marketing research methods. The historical method implies our own knowledge, as well as a review of literature in the field of trade that discuss these oldest forms of trade. The method of marketing research involves the use of a questionnaire based on the subjects, objectives and assumptions of the research. Specific methods are analysis and synthesis, quantitative methods of statistical data processing, as well as methods of logical reasoning. Based on the goals of the research, the hypotheses on which the paper is based are defined, and they will enable the conducted research to make appropriate conclusions and recommendations. The hypotheses of the research are set as follows:
H1: Wholesale markets will enable the increase in trade volume
H2: Wholesale markets lead to an increase in overall economic effects
H3: The wholesale market is a special market institution that has positive effects on buyers of agro-industrial products
Modern approach involves the use of wholesale markets as a special form of trade in order to achieve the goals of the company in the market, the greater volume of trade, the quality of the service provided as a competitive advantage in order to satisfy the interests of customers and end-users. As with other special market institutions, it is not possible to accurately determine the effects of the wholesale market regarding the size and extent of trade, due to the influence of other trading companies. On the basis of communication knowledge about the state of retail trade (gross quantitative markets), necessary research of these forms of trade has been carried out in our country, with special emphasis on JKP Tržnica Novi Sad (Kvantaška pijaca retail market). It is possible with “certain assumptions” to make a measurement of the effects of the wholesale market on the increased volume of trade, as well as the overall effects of the investment in the construction of the wholesale market.
1180 EP 2017 (64) 3 (1177-1190)
Boris Kuzman, Nedeljko Prdić, Zoran Dobraš
Importance of wholesale markets for the development of trade in market-developed countries
With the development of trade, the role and importance of wholesale markets has grown from the point of view of the development of competitive forms of trade, as well as from the point of view of the “urban” centers, like supplying large cities by fruits and vegetables as well as other products from the agro-industrial sector. By the end of the century, national and regional wholesale markets became the focal point for the distribution of (primarily) fruits and vegetables, but also cereals, cheese, dairy products meat, meat products, and other products important for certain countries and regions that have a special place in production, for instance, livestock, fish, dairy products, milk, flowers and consumer goods that can generally have a commercial as well as historical significance for the sale of products of a particular region.
With rapid urban growth in many parts of the world, wholesale markets will continue to play a vital role in channeling a wide range of products to urban consumers, despite the adoption of new techniques, such as the direct supply of supermarkets by farmers. Investments in the infrastructure of the wholesale markets will undoubtedly be increased over the years to come, but wholesale markets will not be a financial burden for governments, whether local or national. If they are well managed, they can be led professionally, and bring strong stimulus to the modernization of the food market as a whole(Ifoam,2014).
Bearing in mind that previous research has dealt with the comparative advantages of individual countries or groups of countries in relation to their position in the World Trade, the author introduces a new approach that follows the comparative advantages between the two countries, particularly in the specific market, as well as amongst competitors in the same market(Kuzman et al., 2016).
The total volume in the product market is 26 million tons a year, which is approximately 40% of Europe’s fruit and vegetables (24 million tons a year), 10% of fish and fish products in Europe (1 million tons per year) and 2% of meat and meat supply to products in Europe (1 million tons per year) (Wuwm, 2016).
The development of trade, city infrastructure, competitive markets, wholesale markets, and development strategies are focused on the main transport roads at the edge of cities, for efficient transportation, avoiding traffic congestion, pollution and noise, as well as creating conditions for competitive advantage over other distribution centres. When it comes to wholesale markets as distribution centers, their role and significance in the future would increase in terms of taking over the role of auction and brokerage institutions so that they become central markets that can organize sales both directly and through their own warehouses and other specialized facilities With the aim of performing significant trade through other distribution centers. The significant role of wholesale markets in the marketing sense is also the position of the “brand” of the wholesale market as a recognizable channel of sales, promotion of goods, but also of public importance for the city in its center, as tourist, historical and other potentials that can contribute to the recognition and increase of trade in the region, and other major markets.

1181EP 2017 (64) 3 (1177-1190)
THE IMPORTANCE OF THE WHOLESALE MARKETS FOR TRADE IN AGRICULTURAL PRODUCTS
Research results
The aim of the research was to collect general data in terms of ownership and business, as well as the time of sales of products on the Kvantaška pijaca market. The largest number of sellers is engaged in trade in fruits and vegetables and other agricultural products (Praća et al., 2017). The period of lease for utilization the slot at the Kvantaška pijaca market is for a longer period ranging from 1 year to 23 years. But it can be noted that this period is on average somewhat over 15 years. When it comes to business performance in the previous year, the company operated with a loss: 8% of the companies, the company covered costs but did not make a profit: 50% of the companies, the company operated successfully and made a profit: 20% of the companies. 22% of respondents did not answer the questions asked.
When it comes to exploring specific (special) attitudes, the results are as follows: the length of cooperation with the most important customers: 50% of respondents have cooperated for more than 5 years, 30% of respondents have cooperated from 5-10 years and 20% have cooperated for more than 10 years. When asked if you are creating a customer database, 40% of the respondents are keeping it and 60% do not keep a customer database. As the most important form of rewarding the most important customers when it comes to individual customers, 80% of respondents think that the price reduction is the most important rewarding instrument, and 20% think it is the deferred payment. When it comes to companies, 60% think that quality of goods is the most important instrument, and 40% give a rebate on the purchased quantity of products.
As the most important instruments for controlling the operations of the surveyed companies, based on the questionnaire, the following are listed:
• Sales volume 1.7 • Profit 2.8 • Market share 2.9 • Liquidity 2.5 • Marketing Costs (Sales Promotion) 2.1

1182 EP 2017 (64) 3 (1177-1190)
Boris Kuzman, Nedeljko Prdić, Zoran Dobraš
Graph1.The most important instruments of business control(ranked 1-5; 1 as the most important)
Source: Results of the survey conducted for the purposes of this paper at the Kvantaška pijaca Market in Novi Sad
Regarding the attitude of respondents about the terms of trade in the Kvantaška pijaca market, 40% answered positively, and 60% had a negative attitude towards the terms of sale. As the three biggest disadvantages for successful trade, the majority of the surveyedthink that these are, in the following order: 1. Lack of funds, 2. Infrastructure and market conditions of business, 3. Competition and lack of customers. When asked whether it is necessary to build a modern market facility - the type of wholesale market, 80% gave a positive answer, while 20% of them considered that it was not necessary to build such a facility. To the specific question which locations would you choose to build a wholesale market, the responses were, outside the city near the roads, Najlon pijaca (Novi Sad Nylon market) or near the Najlon pijaca market, near the motorway, at the current location. It should be noted that this question cannot give a more precise answer due to the lack of knowledge of real infrastructure, market and other conditions that are necessary for the construction of modern large-scale wholesale markets.
To the specific question of whether you would rent space in a new facility in the wholesale market, 40% of respondents did not want to make a statement, while 78% of respondents who gave the answer would rent a business space or other space, while 22% would not rent space at a new location. Asked if they would rent more space than the current occupancy, 33% answered affirmatively, and 67% were satisfied with the present space for sale.
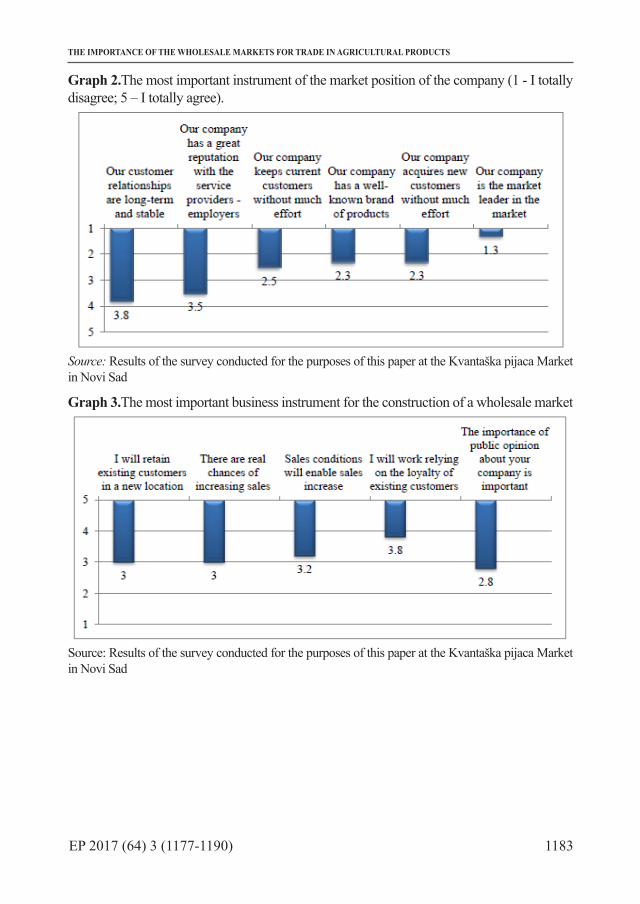
1183EP 2017 (64) 3 (1177-1190)
THE IMPORTANCE OF THE WHOLESALE MARKETS FOR TRADE IN AGRICULTURAL PRODUCTS
Graph 2.The most important instrument of the market position of the company (1 - I totally disagree; 5 – I totally agree).
Source: Results of the survey conducted for the purposes of this paper at the Kvantaška pijaca Market in Novi Sad
Graph 3.The most important business instrument for the construction of a wholesale market
Source: Results of the survey conducted for the purposes of this paper at the Kvantaška pijaca Market in Novi Sad

1184 EP 2017 (64) 3 (1177-1190)
Boris Kuzman, Nedeljko Prdić, Zoran Dobraš
Graph 4.The attitudes of the respondents when it comes to construction and the level of services of the wholesale market
Source: Results of the survey conducted for the purposes of this paper at the Kvantaška pijaca Market in Novi Sad.
Graph 5.Seller’s views on product quality
Source: Results of the survey conducted for the purposes of this paper at the Kvantaška pijaca Market in Novi Sad.
The construction of the wholesale market has real economic indicators as a public infrastructure object of urban and regional importance, as well as due to the constant interest of buyers for this type of trade, regardless of the increased presence of competing companies (Milanović et al., 2017).
Based on the conducted research, the development of trade in agro-industrial products through wholesale markets has real chances for the development of the agro-industrial complex. The conclusion is that the increased interest of tenants, customers and consumers provides a reliable basis for achieving the prerequisite for increasing of their needs, which are achieved
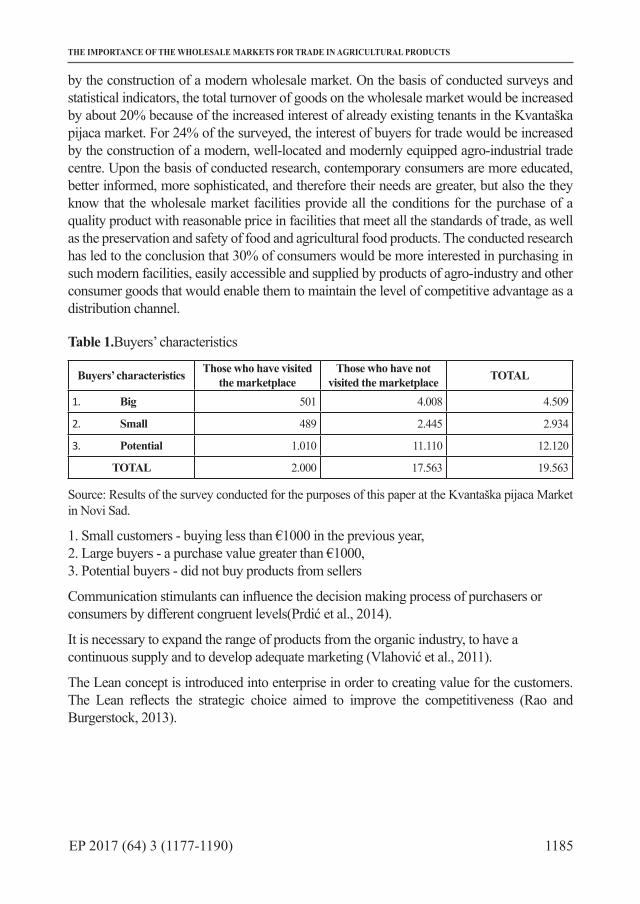
1185EP 2017 (64) 3 (1177-1190)
THE IMPORTANCE OF THE WHOLESALE MARKETS FOR TRADE IN AGRICULTURAL PRODUCTS
by the construction of a modern wholesale market. On the basis of conducted surveys and statistical indicators, the total turnover of goods on the wholesale market would be increased by about 20% because of the increased interest of already existing tenants in the Kvantaška pijaca market. For 24% of the surveyed, the interest of buyers for trade would be increased by the construction of a modern, well-located and modernly equipped agro-industrial trade centre. Upon the basis of conducted research, contemporary consumers are more educated, better informed, more sophisticated, and therefore their needs are greater, but also the they know that the wholesale market facilities provide all the conditions for the purchase of a quality product with reasonable price in facilities that meet all the standards of trade, as well as the preservation and safety of food and agricultural food products. The conducted research has led to the conclusion that 30% of consumers would be more interested in purchasing in such modern facilities, easily accessible and supplied by products of agro-industry and other consumer goods that would enable them to maintain the level of competitive advantage as a distribution channel.
Table 1.Buyers’ characteristics
Buyers’ characteristics Those who have visited the marketplace
Those who have not visited the marketplace TOTAL
1. Big 501 4.008 4.509
2. Small 489 2.445 2.934
3. Potential 1.010 11.110 12.120
TOTAL 2.000 17.563 19.563
Source: Results of the survey conducted for the purposes of this paper at the Kvantaška pijaca Market in Novi Sad.
1. Small customers - buying less than €1000 in the previous year, 2. Large buyers - a purchase value greater than €1000, 3. Potential buyers - did not buy products from sellers
Communication stimulants can influence the decision making process of purchasers or consumers by different congruent levels(Prdić et al., 2014).
It is necessary to expand the range of products from the organic industry, to have a continuous supply and to develop adequate marketing (Vlahović et al., 2011).
The Lean concept is introduced into enterprise in order to creating value for the customers. The Lean reflects the strategic choice aimed to improve the competitiveness (Rao and Burgerstock, 2013).

1186 EP 2017 (64) 3 (1177-1190)
Boris Kuzman, Nedeljko Prdić, Zoran Dobraš
Table 2.Plans for purchase on the built wholesale market
Arithmetic mean* Standard errorSmall customersHave visited the wholesale market (seller) 2.78 (n=180) 0.21
Have not visited the wholesale market (seller) 2.9 (n=172) 0.17
Big customersHave visited the wholesale market (seller) 2.87 (n =170) 0.15
Have not visited the wholesale market (seller) 3.05 ( n =160) 0.20
Potential buyersHave visited the wholesale market (seller) 5.0 (n =199) 0.10
Have not visited the wholesale market (seller) 5.0 (n =200) 0.10
*1 – no plans; 5 – very defined plans, n= number of buyersSource: Results of the survey conducted for the purposes of this paper at the Kvantaška pijaca Market in Novi Sad.
After positive views on the construction of the wholesale market, the survey was performed amongst the customers (visitors) who visited the Kvantaška pijaca Market, as well as amongst potential buyers who have not visited the point of sale in order to determine the impact of the wholesale market on the awareness of the existence of products and the interests of potential customers for the product. The research needs to determine the degree of awareness for the construction of the wholesale market and the interest in the products of the company. In this case it is necessary to apply a ranking scale from 1 to 5 where 1 represents the low interest (no purchasing intentions), while 5 is a very high interest for enterprise products (high purchasing intentions).
Results and discussion
The aim of the research is to show the state of the so-called wholesale trade markets in a systematic way with a special emphasis on the Kvantaška pijaca market owned by JPK Tržnica Novi Sad, which refers to the improvement of the processes and activities in the agrarian industry and the companies that provide services in the agricultural complex, which takes place through their comparison with the same or similar processes, which are happening in our country and throughout the world, which are objectively considered to be better, whether they are direct or indirect competitors.
Benchmarking against best identified practices, if suitably adopted and adapted, can generate a company considerable profit of performance within a very short time (Maire et al., 2005).
Speaking of hypotheses of the research, we conclude:

1187EP 2017 (64) 3 (1177-1190)
THE IMPORTANCE OF THE WHOLESALE MARKETS FOR TRADE IN AGRICULTURAL PRODUCTS
H1: Wholesale markets lead to an increase in trade volume. The results of the qualitative research of the sellers at the Kvantaška pijaca Market show that the increase in the volume of trade is the most important factor of success, which in their opinion can be achieved and increased by the construction of a modern wholesale market, which will, along with the accompanying facilities, satisfy the interest of the sellers in the form of increasing profits, market share and other marketing instruments that will lead to an increase in sales. This hypothesis is confirmed by the views of domestic and foreign experts in the field of agro-industry, as well as the significance of the wholesale markets in the world in the development of the agro-industrial complex.
H2: Wholesale markets lead to an increase in overall economic effects. It was worthy to point out the importance of the development of these markets and public institutions and their importance to the overall economic and public infrastructure functions. It should be emphasized that the common interest of the city and the JKP Tržnica public company, which plans to build such a centre in a well-chosen economic and infrastructural location, coincides with the attitudes of the sellers who confirmed that such a centre would be of great importance for their businesses. When added to the fact that the customer and consumer attitudes are identical, as well as the knowledge that throughout the world the “wholesale markets” are considered some of the most important infra-structural facilities, the overall economic effects for the wholesale markets, sellers, customers and the wider social interests in the agro-industry is enormous.
H3: Wholesale market is a special market institution that has positive effects on buyers of agro-industrial products. The aim of the research was to confirm the hypothesis that, by the construction of a wholesale market, they will improve their processes and work, set new standards of work in the provision of services, which will contribute to better meeting of the demands of customers and will create a new value that will contribute that the wholesale market itself will excel out of competition. A special study of customer attitudes for the purposes of this paper found that they were very important in terms of purchasing and that their purchasing intentions of both permanent and potential buyers at the wholesale market were very pronounced and provided a realistic basis for building the wholesale market and associated services. They would increase their interest in shopping that would be enabled by sellers through the product quality, acceptable price, payment terms and other marketing instruments that would have potentially positive effects on buyers of agro-industrial products.
The market information system provides daily, updated data on the situation in various sectors of Serbian agriculture and may provide relevant data on market potentials and competition. To the question whether STIPS helps you make decisions in your business through a survey on the site or not, a response was provided by a 1361 visitors at the website. (Employer). The results were: that helps me a lot 45%, it helps me 34%, it does not help me 21%. (STIPS)
The Target costs are defined as the difference between the anticipated price and required return. In practice, target profit often is driven by medium term corporate profit plans, which reflect the returns demanded by the financial markets (Woods et al., 2012)
1188 EP 2017 (64) 3 (1177-1190)
Boris Kuzman, Nedeljko Prdić, Zoran Dobraš
Conclusion
The aim of the research was to prove that the construction of the modern wholesale centre in Novi Sad would lead to an increase in trade in agro-industrial products, a replacement for the so-called quantitative markets (retail trade markets or gross sale markets), which are considered the informal places of wholesale trade in agro-industrial products. The significance of the wholesale market for agro-industrial products, based on the conducted research, is considered as an intended approach to the improvement of the process of trade and service activities. Their importance gives a realistic picture of the development of agro-industrial complexes, comparing them with large distribution chains and trade centres. It can be objectively and justifiably concluded that wholesale markets are considered the best places of trade for fruits and vegetables and other agricultural food products, as well as places for greater development of trade through auctions and stock exchanges and also as facilities for storing, packaging, maintaining products in modern cooling systems, for their sales and transportation. Therefore, the paper wishes to point out the importance of the wholesale market for agricultural food products, and the construction of modern facilities within the national trade strategy in the agro industrial complex. This paper would like to point out that the today’s retail markets, are outdated, inadequate and unproductive centers of trade, and must be changed by the construction of a wholesale market, as a place with better trading conditions. Research conducted at the “Kvantaška pijaca Market” in Novi Sad has shown that the sellers want new standards in trade, in order to satisfy the interests of customers, but also expect a new additional value that will certainly result from the transition of trade to the wholesale market. The goal is, of course, achieving better conditions of trade in wholesale markets that can contribute to the increase of trade in terms of volume, quality, price for the buyer in relation to the competition. In essence, the conclusion is that trade in the wholesale market is a clear indicator of national, regional and city determination for the increase of their share in terms of satisfying the interests of the lessors, buyers, consumers and the city, which will, with the construction of the wholesale markets receive modern infrastructure centres with a wide range of mutual interests of economic and other institutions.
References
1. JKP Tržnica (available at: www.nstrznica.co.rs/kvantaška pijaca)2. Kuzman, B., Stegić, M., Subić, J. (2016): Market oriented approach of revealed
comparative advantage in international trade, Ekonomika poljoprivrede, Beograd, Vol, 63, No. 1, pp 247-260.
3. Lovreta,S. (2008):Strategija i politika razvoja trgovine Republike Srbije, Ekonomski fakultet, Beograd, NICEF, p. 245.
4. Maire, J.L., Bronet, V., Pillet, M. (2005): A typology of „best practices“ for a benchmarking process, Benchmarking: An International Journal, Vol. 12, No. 1, pp. 45-60, Emerald Group Publishing Limited, Bingley, UK.
5. Milanović, N., Andžić, S., Butulija, M. (2017): Struktura kapitala kao determinanta vrednosti preduzeća, Oditor, Vol. 3, No. 1, pp. 80-90.

1189EP 2017 (64) 3 (1177-1190)
THE IMPORTANCE OF THE WHOLESALE MARKETS FOR TRADE IN AGRICULTURAL PRODUCTS
6. Milisavljević, M. (2010): Strategijski marketing, Ekonomski fakultet, Beograd,NICEF, p. 32.
7. Praća, N., Paspalj, M., Paspalj, D. (2017): Ekonomska analiza uticaja savremene poljoprivrede na održivi razvoj, Oditor, Vol. 3, No. 1, pp. 37-51.
8. Prdić, N. (2016): Konkurentska prednost veletržnice kao kanala distribucije. Agroekonomika, Poljoprivredni fakultet univerziteta u Novom Sadu, No. 72, pp. 51-63.
9. Prdić, N., Kuzman, B., Barjaktarović, M. (2014):Practical research results of a successful company’s appearance at the fair, Ekonomika Poljoprivrede, Beograd, Vol, 61, No. 4, pp. 903-914.
10. Rao, M., Bargerstock, A. (2013): Do Lean Implementation Initiatives Have Adequate Accounting Support? Do Debate of Duality, Managment Accounting Quarterly,Institute of Managment Accounting,Vol. 14, No. 4, pp. 12-21
11. Sistem tržišnih informacija poljoprivrede Srbije, Beograd, stipsvminpolj.gov.rs12. The International Federation of Organic Agriculture Movements (IFOAM); (available
at: www.ifoam.org), 13. Veletržnica Beograd, Belgrade wholesale market, (available at: www.veletrznica.co.rs);14. Vlahović, B., Radojević, V., Živanić, I. (2011): Istraživanje stavova potrošača o
potrošnji organske hrane u Srbiji, Ekonomika Poljoprivrede, Beograd, Vol, 58, No. 3, pp 443-455.
15. Vojnović, Ž., Zelenović, V., Cvijanović, D. (2017): Program of state support to agricultural crediting, Ekonomika Poljoprivrede, Beograd, Vol. 64, No. 1, pp. 339-358.
16. Woods, M., Taylorb, L., Cheng Ge Fangc, G. (2012): Electromicy: A case study of economic value added costing, Management Accounting Research, Elsevier Science Ltd., Vol. 23, No. 4, pp. 261-277.
17. WUWM (World Union of Wholesale Markets), Promoting wholesale and retail markets word-wide, accessed October, 2016.
18. Zakon o trgovini Republike Srbije (available at: www.mtt.gov.rs/download/1(2)/zakon_o_trgovini.pdf)
1190 EP 2017 (64) 3 (1177-1190)
Boris Kuzman, Nedeljko Prdić, Zoran Dobraš
ZNAČAJ VELETRŽNICE ZA TRGOVINU AGROINDUSTRIJSKIM PROIZVODIMA
Sažetak
Osnovni cilj istraživanja zasniva se na značaju koje veletržnice kao posebne tržišne institucije imaju u trgovini agroindustrijskim proizvodima. Na osnovu komunikacijskih saznanja o poslovanju tržnica na malo (kvantaške pijace), na domaćem tržištu, kao i značaja koji se u razvijenim zemljama pridaje veletržnicama sa aspekta trgovine, dolazi se do zaključka da i domaća trgovina, razvojem veletržnica (trgovina na veliko) može povećati prodaju ovih proizvoda. Predmet istraživanja ovog rada jeste koncept izgradnje veletržnica kao zamene za trgovinu na malo (kvantaške pijace) agroindustrijskim proizvodima. Radom se želi postići takav nivo saznanja koji će omogućiti donošenje kvalitetnih odluka polazeći odinteresa preduzeća, trgovaca i kupaca (potrošača).
Ključne reči:tržište, trgovina, agroindustrijski proizvodi, veletržnica

1191
Economics of Agriculture 3/2017UDC: 347.77:631.527(497.11)
EP 2017 (64) 3 (1191-1204)
LEGAL PROTECTION OF NEW PLANT VARIETIES IN THE REPUBLIC OF SERBIA
Review article
LEGAL PROTECTION OF NEW PLANT VARIETIES IN THE REPUBLIC OF SERBIA
Nadežda Ljubojev1, Marijana Dukić Mijatović2, Željko Vojinović3
Abstract
The protection of new plant varieties as a form of intellectual property is generally accepted. It is a sui generis legal protection which, in the framework of industrial property rights, creates new, distinctive, stable and homogeneous plant varieties, marked with a variety label, but there is also a tendency of patent protection in the world. The basic features of this legal protection are exclusivity and autonomy in relation to the legal regime established for the placing of planting material in commercial traffic. The aim of this paper is to examine the legal implications and to answer certain issues concerning the protection of intellectual property in this area. The historical-legal and normative-legal method for the consideration of the historical development of the legal protection of plant breeders and the analysis of positive law in this area in the Republic of Serbia were used in the framework of the harmonization of rights with international law and the law of the European Union.
Key words: protection, plant varieties, sui generis, patent law, Republic of Serbia.
JEL: Q17, K11
Introduction
Providing sufficient amounts of food is an effort whose biological, economic and social significance are manifested at all levels of human existence, starting from an individual, over families and other social groups to the social community as a whole, regardless of geographical area and at all times.Considering the number of population and reducing of
1 Nadezda Ljubojev Ph.D., Associate Professor, University of Novi Sad, Technical Faculty “Mihajlo Pupin”, Đure Đaković street nn, 23000 Zrenjanin, Republic of Serbia, Phone: +381 23 550 520, E-mail: [email protected].
2 Marijana Dukić-Mijatović Ph.D., Full Professor, University of Business Academy, Law Faculty of Economics and Justice, Novi Sad, and University Novi Sad, Faculty of Economy in Subotica, Segedinski put no. 9-11 24000 Subotica, Republic of Serbia, Phone: +38163542093, E-mail: [email protected]
3 ŽeljkoVojinović Ph.D., Assistant professor, University Novi Sad, Faculty of Economy in Subotica, Segedinski put no. 9-11 24000 Subotica, Republic of Serbia, Phone: +381 64 883 26 00, E-mail: [email protected].
1192 EP 2017 (64) 3 (1191-1204)
Nadežda Ljubojev, Marijana Dukić Mijatović, Željko Vojinović
arable land dueto pollution, construction, and so on, this is becoming increasingly important technological, economic legal and social-political issue. In this regard, the aim of this paper is to consider legal protection for creators of new, and more resistant plants in the Republic of Serbia (RS). The basic methods of work are historical-legal and normative-legal. The historical development of the egal protection of plant breeders is analyzed, as well as the positive law in this area.
Ever since human has been dealing with agriculture, he has tried to reach new abounding and resistant plant varieties.With the advancement of science and technology and increased level of knowledge, a large number of new plant varieties has been created. In theory, plant variety is defined “as a group of herbaceous plants of common origin, which are different from related plants after their hereditary characteristics impotent for the needs of forestry, horticulture and agriculture” (Marković, 1997a). Creation of new plant varieties is a long and complex process which entails great effort, knowledge and financial investments. For the creating of new plant varieties there are needed scientific knowledge in the fields of genetics, plant breeding, molecular biology biometrics, as well as the extensive experience and overall intellectual knowledge of the creators of new plant varieties (Veselinović et al., 2014).
For centuries, man has created new plant varieties. Plant varieties are produced by plant breeding4 which can be performed by classical methods and genetic engineering, which creates the desired properties of living organisms at the genes level. The once produced plant variety needs to be maintained. Due to the risk of degeneration of self-spreading plant varieties, the purity and health of generative reproductive material (seeds) must be constantly monitored. Maintenance of this type of plant varieties is done by periodic repetition of the key stages for the cultivation of the variety as well as permanent selection. Varieties of plants that are cross-fertilized are not capable of self-reproduction. This is why a breeder needs to maintain inbreeding line year after year and repeat the hybridization process (Ljubojev, Varga, 2012). This means that “plant varieties are maintained as the variety does not exist in cases where it is not possible to obtain a second, nth generation of plants characterized by varietal-specific properties (Marković, 2000).
Inclusion into international and regional economic flows is not possible without regulating the issue of protection of all forms of intellectual property. At the Sixth Intergovernmental Conference in Luxemburg, in June 2017, within the framework of the accession of negotiations with the European Union (EU), the RS opened Chapter 7 on the protection of intellectual property. The platform for negotiations of the opening of this chapter includes “the harmonization of legislation with EU legislation which does not only imply the amendment and implementation of laws, but also the implementation involving judicial protection.”5
4 Breeding, which is being performed increasingly intensively, with the application of new technologies, shortens an average age of the variety used, especially in vegetable plant species and ornamental one-year herbs. The number of varieties reported rapidly increases, while the average lifespan decreases (Milošević, 2012)
5 “EurActiv RS”, www.euractiv.rs/pregovori-sa-eu/10930-priprema-se-pregovaraka-platforma-za-poglavlje-7.

1193EP 2017 (64) 3 (1191-1204)
LEGAL PROTECTION OF NEW PLANT VARIETIES IN THE REPUBLIC OF SERBIA
Protection regime for plant breeders in the framework of intellectual property rights
Accelerated growth in agricultural production is the result of an increasing number of inventions and new achievements in science. In theory, the reason for the approach to the creation of plant is that “new plant varieties, with higher yields, improved quality or better resistance to pests or diseases can increase productivity and product quality in agriculture, horticulture and forestry” (Idris, 2003). For millenniums, humanity passed through the process of selecting plants to create populations that fit its needs (Milošević, 2012). However, as already mentioned, the creating of new plant varieties requires significant investment in the form of knowledge, labor and material resources. It also requires time and the creating of plant variety is a long-standing process that can last for more than a decade. It usually takes more than ten years to use a new plant variety to compensate for the cost of its creating and its legal protection (Veselinović, Milošević, 2012). However, once created, the plant variety (depending on the type) can be reproduced immediately, (Bently, Sherman, 2004) which deprives the breeder of the variety of the opportunity to recover the investment and to benefit from the use and disposal of the created plant variety. In order to prevent the unauthorized reproduction of the plant variety and its placing on the market, the plant breeder must be provided with legal protection. In this way they are stimulated to intensify the work on the creation of new plant varieties, which directly stimulates the development of agriculture and improves the production of food and raw materials. The state’s interest is to encourage breeders to intellectual creativity in the field of the emergence of new better varieties. Producers of plant varieties as a general matter must have the same rights to exclude unauthorized use for making, using, offering for sale and selling or importing for those purposes as do other inventors (Lesser, 2004). The aim of legal protection of new plant varieties is promoting the development of improved plant varieties for the benefit of farmers, growers and consumers. However, if it is used without an permit, the overall multidisciplinary results are questionable. It should also be noted that the use of a protected variety for non-commercial and scientific research purposes, including use for breeding new varieties, is not required by the holder of the rights.
The production of new plant varieties is highly desirable. Namely, as the creating of a plant variety is an intellectual creative work, it is quite certain that the notion of a plant variety is “logical abstraction in relation to the plant species that make up the variety. Herbal individuals concretize the variety, that is, they represent corpus mechanicum of the breed (Marković, 2000).Thus, the plant variety appears as a guide to the process of creating herbal individuals with specific characteristics for the purpose of improving agriculture, horticulture and forestry. However, the fact that a plant variety is an intellectual property which can be applied in agriculture is not sufficient to establish protection for the creator of the plant breed by the right on industrial property. Not only the right to industrial property, but also the right to intellectual property; not all commercially usable products of human spirit are protected, but only those explicitly enumerated in the sources of intellectual property rights, that is, based on the principle of taxonomy (numerus clausus). According to the Article 27 of the Convention on Trade-Related Aspects of Intellectual Property Rights from 1995 (TRIPS), Member States are required to provide protection of plant varieties, whether by patients,
1194 EP 2017 (64) 3 (1191-1204)
Nadežda Ljubojev, Marijana Dukić Mijatović, Željko Vojinović
by appropriate sui generis system, or by their combination, which makes the condition for establishment of protection of creators of herbal species within the rights of industrial property fulfilled. Therefore, TRIPS recognizes the specificity of the protection of plant varieties. In view of the above, it can be concluded that in the legal theory it is not disputed that creation of new varieties of agricultural plants “undoubtedly belongs to the field of industrial property” (Gajinov, 1996). However, the area of industrial property is broad and complex, so that, legally, it is possible to observe several legal regimes of legal protection for the creators of new plant varieties.
Legal and historical development
The first institutions involved in controlling and improving the quality of reproductive plant material were founded in the 19th century. Until the beginning of the 20th century, the activities within these institutions were outside the state control, and the production and trade of seed and planting material were completely free. Over time, governments recognized the importance of the work of the institutions to provide enough food for the population, as well as for the development of agriculture and the economy in general. Therefore, production and trade in reproductive material began to be regulated by the law. In legal theory, it is considered that the meaning of these legal regulations, which exists today in all the countries of the world, is to ensure that in market traffic and use for the purpose of sowing and planting, only the reproduction material found on the basis of the previous mandatory control is found as good and suitable for local climatic, land and other conditions. (Marković, 2000). The breeders whose plant varieties met the legally determined cond0ntegral part of our law, since the Law on the Recognition of a European Patent was adopted. Although in the EU new plants cannot be protected by the patent itself, there are exceptions. A plant that has a specific gene (unlike its entire genome) is not included in the definition of a plant variety, and can therefore be protected by a patent. Likewise, genetically modified plants can be patented in the EU, unless they are limited to a particular plant variety but represent a larger group of plants.European Directive 98/44/EC considers plant cells as microbiological products, and as a result, they can be patented.
The International Convention for the protection of new varieties of plants
Due to the great economic significance of the creation of new plant varieties and the impossibility of their patenting, a sui generis protection system was created, which is not a patent protection, but a form of legal protection. Actually, in the late fifties of the last century it was certain that there were no conditions for the protection of plant species to be institutionalized in the patent protection system. Therefore, at the initiative of French government, in 1957, there was started diplomatic and expert work on the drafting of an international convention, which would regulate protection of a new plant variety. The
1195EP 2017 (64) 3 (1191-1204)
LEGAL PROTECTION OF NEW PLANT VARIETIES IN THE REPUBLIC OF SERBIA
International Union for the Protection of New Varieties of Plants (UPOV)6 was established by the International Convention for the Protection of New Varieties of Plants (“UPOV Convention”). The UPOV Convention was adopted on December 2, 1961, by a Diplomatic Conference held in Paris, and revised in 1972, 1978, and 1991.7 The UPOV Convention itself was amended in 1978 “in a way that allowed the US to come within its fold” (Cornish, Llewelyn, 2003), and then again in 1991. According to the UPOV Convention, the plant variety is designated as “a plant grouping within a single botanical taxon of the lowest rank”, but this group, regardless of whether the conditions for granting the rights of breeders are fully met, can: a) be determined by research characteristics that are the result of a genotype or a combination of genotypes; b) be differentiated from any other group of plants by expressing at least one of the above characteristics; and c) be considered a unit with regards that its ability to reproduce is unchanged (Chapter I Definitions, Art. 1 Paragraph 1 (vi)). In order to obtain legal protection under the UPOV Convention, the plant variety must be: new, distinct, uniform, stable and marked with the appropriate name.”A separate application must be filed to receive protection in each member country” (Jondle, 1989). According to Art.6, p. 1, the Law on the Ratification of an International Convention on the protection of new plant varieties, the variety is considered new if, on the day of application for the Protection of the Breeder’s Rights, the reproductive or harvested material of that variety has not been sold or otherwise disposed of by the breeder or with his consent for the use of the given variety: a) in the territory of the Contracting Party to which a request for protection has been lodged for a period longer than one year before that date, and b) in the territory outside the territory of the Contracting Party to which the request for protection has been lodged for a period longer than four years before the application was submitted, and in the case of woody species and vines, over a period longer than six years before the specified date. Regarding the other conditions of legal protection of the plant variety, UPOV has developed a methodology- so-called DUS test (Distinctness, Uniformity, Stability test). (Marković, 1997b). A plant variety is distinct if it is “clearly distinguishable from any other variety whose existence is a matter of common knowledge at the time of the filing of the application” (UPOV, Art. 7). Distinctiveness may arise through visible differences in outward appearance, such as height, size of leaves, leaf color. It may also arise through physiological differences associated with the variety’s particular chemical or biological structure, such as resistance to disease or ability to withstand certain conditions (Bentley, Sherman, 2004) (such as cold, drought or so). A variety is uniform “if subject to the variation that may be expected from the particular features
6 UPOV is an intergovernmental organization in the UN system, within the World Intellectual Property Organization (WIPO), based in Geneva. As a supreme body, the UPOV Council consists of representatives of all members of the UPOV, and each member state has one vote in the UPOV Council. The Acronym of the French Union name - Union internationale pour la protection des obtentions vegetales - UPOV - is its internationally accepted mark.
7 The UPOV Convention came into force on August 10, 1968, having been ratified by the United Kingdom, the Netherlands and Germany. The UPOV Convention has been revised on November 10, 1972, on October 23, 1978, and on March 19, 1991, in order to reflect technological developments in plant breeding and experience acquired with the application of the UPOV Convention.http://www.upov.int/upovlex/en/conventions/1991/w_up910_.html#_1.
1196 EP 2017 (64) 3 (1191-1204)
Nadežda Ljubojev, Marijana Dukić Mijatović, Željko Vojinović
of its propagation, it is sufficiently uniform in its relevant characteristics.” (UPOV Art. 8) “This means that nearly all examples of the variety must bear the characteristics that make the plant distinct” (Bentley, Sherman, 2004). It does not mean that all plants in a variety are exactly alike genetically (Bliss, 1989). Uniformity is reached when the proportion of deviation in a breeding procedure has been reduced to a point beyond which it would be unreasonable to expect further experimentation” (Cornish, Llewelyn, 2003). A plant variety is stable if its relevant characteristics remain unchanged after repeated propagation or, in the case of a particular cycle of propagation, at the end of each such cycle (UPOV, Art. 9). “The aim of testing stability is to determine that subsequent generations of the plant are not throwing up noticeably more deviation” (Cornish, Llewelyn, 2003). By recognized rights, the titularies get entitled to: production or reproduction of plant variety, reprocessing, offering for sale, sale or other type of marketing, export, import, storage for any of the aforesaid purposes.
UPOV Convention stipulates the subject of protection, the conditions of protection and the duration of protection. It also performed “the emancipation of the right of varietal protection from the influence of national regulations on the control of the production and trade of reproductive material of plant varieties” (Marković, 2000). As we pointed out, the UPOV Convention has established the right of varietal protection as a sui generis industrial property right. It is precisely this sui generis system that relates to Article 27 of the TRIPS Agreement. Therefore, although the plant variety is excluded from patent protection, it is protected by the sui generis of the right plant variety (in accordance with UPOV) or a combination of UPOV sui generis plant protection and patent protection system.8 Most countries select pure plant breeders’ right option (Lesser, 2004). However, the plant variety as a group of herbal individuals is excluded from patent protection, but it is therefore possible to patent inventions related to the genome of plants, plant organs or plant parts (Brush, 1996). This means that products of the plant or their reproductive material (seeds, roots, seedlings, etc.) can be patented, but those in which the plant variety is not specified, as well as the inventions of products related to other botanical material (e.g. cell lines, modified cells, genes, etc.) that cannot be regenerated in the plant (Marković, 1997). Accordingly, the invention of all plant material which is not characterized by the belonging of a plant variety can be protected by a patent. In this respect, the exclusion from patent protection does not include those inventions of the biotechnological procedure relating to the plant (or animal), if the technical feasibility of the invention is not limited to a particular plant variety (or animal race). This practically means that the patent application will not be rejected in cases where the plant variety is
8 As an example, In USA, where in addition to the patent for plant varieties propagated by vegetative pathway (the so-called plant-patent), the Plant Protection Law of 1970 established a system of varietal protection, although patent protection of plant varieties in the USA cannot be said to be a classic patent. It is only nominally a patent, because in terms of content, according to the patent for the plant, in terms of content the titulary has narrower rights than the holder of a classic patent for inventions (Barton, 1993).

1197EP 2017 (64) 3 (1191-1204)
LEGAL PROTECTION OF NEW PLANT VARIETIES IN THE REPUBLIC OF SERBIA
not explicitly specified in the patent application9 (Wilson, 2005), as well as when more than one plant variety is covered by the patent application (Bentley, Sherman, 2004).10Our legislator took over the patent protection model from the UPOV Convention. EPC has similar provisions. In theory, it is considered that “our legislator, in one instance, deviates from the sui generis protection of new plant varieties and establishes patent protection”. Actually, the Law on the Protection of Plant Breeders in Article 31 provides for a mandatory license, in the event that the carrier of rights of breeders refuses to grant other persons the right to use the protected plant variety or poses unjustified conditions for such a transfer. As the license and license agreement is a legal institute of patent law, it is evident that our legislator has “crossed “the border” of sui generis protection” (Veselinović, Milošević, 2013).
The emergence of modern technologies, especially biotechnology, puts many challenges ahead of the legislator in the normative regulation of the protection of these rights. Apart from domestic legislation, it is a significant source of rights in this field and ratified international treaties for the Republic of Serbia.
The procedure to exercise right to plant breed in the Republic of Serbia
For many years, RS has achieved the best results in the placement of intellectual property in the world by creating new varieties of agricultural plants. In this sense, Gajinov states that in the Scientific Institute of Field and Vegetable Crops in Novi Sad, the largest scientific institution in the field of biotechnological sciences in our country, since its establishment in 1938, more than 600 new varieties of agricultural plants have been created. By planting seeds of protected plant species created at the Institute, an economic effect has been achieved, which is measured by hundreds of millions of US dollars. Over 1000 new plant varieties have been created and recognized in the RS (Gajinov, 1996). Therefore, legal regulation of this area in our law was necessary, both from the point of view of our breeders, and on the legal safety of foreign breeders, who would like to place their varieties on our market. This certainly applies to our agricultural producers, seed companies, plant breeders, state institutions and the state as a whole. Sui generis legal protection of plant breeders is provided both at international and national level. It has already been said that at the international level legal protection of plant breeders is ensured by the UPOV Convention, although the importance of TRIPS from 1995 should not be ignored. At the beginning of 2013, RS became the 71st UPOV member. As a necessary prerequisite, the RS fully harmonized its legislation and the system of protection of the rights of plant breeders with the UPOV Convention by adoption of the Law on the Protection of Plant Breeders (2009) (LPBPV), the Law on the Confirmation of the Convention on the Protection of New Plant Varieties (2010) and Law on Amendments to the Law on the Protection of Plant Breeders (2011). It is a sui generis legal protection
9 For example, the patent application for the grant of a patent for Triticummonococcum (wheat variety) will be rejected, while the invention of the technology applicable to the whole genus Triticum will not be considered an invention in respect of which patent protection is excluded, and in this case the patent claim will be acceptable.
10 The authors refer to the case of Novartis/Transgenic Plant, T 1054/96 [1999] EPOR 123, 137 (TBA).

1198 EP 2017 (64) 3 (1191-1204)
Nadežda Ljubojev, Marijana Dukić Mijatović, Željko Vojinović
that, under industrial property rights, creates new, distinctive, stable and homogeneous plant varieties marked with a variety label.The basic features of this legal protection are exclusivity, temporality and autonomy in relation to the legal regime established for the placing of planting material in commercial traffic.
By joining the UPOV, Member States have the opportunity to participate and use the experiences of other countries through UPOV membership, to intensify cooperation between Member States for the examination of plant varieties, where one member country accepts the results of the examination of varieties of other member states as the basis for granting of breeding right. In this way, the costs of functioning of the protection system are reduced, and the breeders are allowed to protect their varieties in other countries at lower costs and in that way realize the possibility of wider placement of their seed and planting material on the foreign market. Membership in UPOV should have an impact on all entities in this area, as well as on the state as a whole, in terms of regulating the issue of protection of intellectual property in all spheres.” Membership should contribute to increasing the market competitiveness of domestic products on the world market, using a large number of new protected varieties, which are characterized by better production and technological properties, higher yields, more resistant to diseases and pests, which will enable better plant production.11
The most significant source of legal regulation of this field in Serbia is the Law on Protection of Breeders of Plant Varieties, (LPBPV). An integral part of the Serbian legal system is also the UPOV Convention, passed by UPOV, ratified by the RS in 2010, as well as the International Treaty on Plant and Genetic Resources for Food and Agriculture, ratified in the 2013.This is the normative protection in this domain of intellectual property, while the issue of the implementation of the adopted laws remains. The Regulation of the European Council (REC) created a system for the protection of plant varieties as one and only form of industrial property rights for new plant varieties in the EU, managed by The Community Plant Variety Office – CPVO. CPVO seat is in Angers, France. EU Member States have a unique system of legal protection of plant varieties by Council Regulation (EC) No. 2100 from 1994 on the communal law of varietal protection. The Community Protection System managed by the CPVO provides added value so that breeders can receive return on investment in the EU territory. To date, the highest number of requests relates to ornamental species (about 60%), followed by agricultural species (± 20%) and fruits and vegetables (± 20%). Each year more than 2800 requests are examined, making this system the most comprehensive system of its kind in the world. Requests are generally accepted from EU countries. Approximately 20% of the requests come from countries outside the EU.12
Historically, in our country the procedure for the recognition of new plant varieties was prescribed by the Law on Recognition of newly established, approval of introduction into the
11 Views on the official website of the Ministry of Agriculture.12 The Community Plant Variety Office – CPVO. “Protectionof new plant varieties in Europe, http://
cpvo.europa.eu/sites/default/files/documents/brochures/Brochure_HR.pdf.

1199EP 2017 (64) 3 (1191-1204)
LEGAL PROTECTION OF NEW PLANT VARIETIES IN THE REPUBLIC OF SERBIA
production of foreign and protection of varieties of agricultural and forest plants.13 The 1980 Law was not harmonized with the UPOV Convention, the TRIPS and the EU regulations, and in 1998 the Law on the Recognition of Agricultural and Forestry Varieties and the Law on the Protection of Varieties of Agricultural and Forestry Plants were adopted in 2000.14 The separation of the two legal matters that were made by the adoption of these laws was completely justified because the control of production and trade of reproductive material and varietal protection yields different interests and therefore the conditions for recognition from one and protection of the plant variety on the other hand do not have to coincide (Ljubojev, Varga, 2012). The law on protection of the rights of plant breeders from 2010, as amended in 2011, is a positive law on the basis of which sui generis legal protection is provided for the new plant variety.
Protected plant variety is that plant variety that is protected under the provisions of the law that regulates the protection of the new plant variety sui generis with the right on industrial property. Plant variety rights arise as a result of a process of registration (Bently, Sherman, 2004). The legal protection of the plant variety is provided by the ministry competent for agriculture in legal proceedings. The procedure is initiated at the request of the plant breeder, or his authorized representative. Upon receipt of the request, it is approached to examine the fulfillment of formal conditions for the recognition of rights.In the framework of the examination of the regularity of the Request, it is particularly examined whether the conditions for the entry of the application for the exercise of the breeder’s rights and the proposed variety name into the Registry of Requests, and in particular whether the conditions for the adoption of the proposal for the variety’s name have been fulfilled. The conditions for registering the request and the proposed variety name in the Register of Requests are fulfilled if the submitted documentation is complete and if it is made in accordance with the law. However, if not, the Ministry will, with a statement of the reasons, invite the breeder or his authorized representative to remedy the deficiencies within 30 days from the date of receipt of the notice. If the deficiencies are not timely removed, the Minister will reject the request with a conclusion. Upon registration of the request in the Register of Requests, it is checked whether the conditions for the recognition of the variety’s name have been fulfilled. After the proposal of the variety name is accepted, it is accessed by substantive examination of the request. The fulfillment of material conditions for the recognition of the rights of plant breeders is determined by a solution. The solution is based on the results of the examination
13 The characteristic of this law was the condition of varietal protection by the prior acknowledgment of the new domestic variety, ie the approval for introduction into the production of a foreign variety. It was only by enrolling the plant variety in the register of recognized varieties for domestic, that is, in the register - for foreign varieties, at the request of the authorized person, the right of varietal protection could be obtained under the additional condition that it is possible to undoubtedly carry out the identification of the variety whose legal protection is required.
14 In the meantime, this area has been normatively expanded by the adoption of the Law on Reproductive Material of Forest Trees, (Official Gazette of RS, No. 135, 2004), the Law on Fruit, Vine and Honey Planting Material, (Official Gazette of RS, No. 18, 2000) And the Law on Seeds (Official Gazette of the Republic of Serbia, No. 45, 2005).
1200 EP 2017 (64) 3 (1191-1204)
Nadežda Ljubojev, Marijana Dukić Mijatović, Željko Vojinović
and the proposal of the Expert Council.Until a decision is made, any person who believes that the variety is not new, different, uniform and stable, or that the breeder does not belong to the breeder’s right, may, from the date of publication of the application for the grant of the plant variety breeder’s right, file an objection to the entry of the application into the Registry of Requests. The complaint can also be submitted in relation to the proposed variety name. The complaint is submitted within three months from the date of publication of the proposal for the variety name.This objection must be provided to the applicant for an answer. The deadline for reply is 30 days and within that period the applicant may also propose another name for the variety, either on their own initiative or at the request of the Ministry. It must be acted according to the order of the Ministry, otherwise the request is rejected with the conclusion.The variety for which the breeder is granted the right of plant breeders to be registered shall be entered in the Register of protected plant species at the Ministry of Agriculture, and the list of protected plant varieties with data shall be published in the “Official Gazette of the Republic of Serbia”. The right of the breeder to the protected plant variety lasts for 25 years, and for potatoes, vineyards, woody fruits and other trees 30 years from the date of recognition of the right, which is the day of issuing a decision on the approval of the breeder’s request (Article 23, paragraph 1). The holder of the breeder’s right may transfer his right of breeder in respect of a protected variety, in whole or in part, by contract to another person. This contract is mandatory in writing. The right of the breeder can also be transferred to another person on the basis of the license agreement. Civic and legal protection of the breeder’s rights is provided with two lawsuits: a lawsuit for violation of the breeder’s rights and a lawsuit for determining the rights of breeders.
Sui generis protection of plant varieties is our legal framework for exercising intellectual property in this area, although there are tendencies in the world to protect right with a patent. The protection of plant varieties as intellectual property has a special significance for our agriculture because the multi-year multidisciplinary work for the creation of a new plant variety can be successfully completed only when the creators get the status of the breeder. The international agreement on plant genetic resources for food and agriculture, “which Serbia adopted, has also endangered the breeder’s rights in Serbia”, because although there is a normative framework in the RS for the protection of new plant varieties, the largest number of plant varieties in our country are not protected as intellectual property (Veselinović et al. 2014). On the other hand, the Agreement provides the possibility for individuals and legal entities from other signatory countries to use the new plant varieties of our breeders. Since plant varieties are not protected, there is a possibility of endangering the breeder’s rights.

1201EP 2017 (64) 3 (1191-1204)
LEGAL PROTECTION OF NEW PLANT VARIETIES IN THE REPUBLIC OF SERBIA
Also, the breeder’s rights may be limited by a “farmers’ privilege”.15 It is therefore of great importance for our breeders to protect as many plant varieties as possible in the coming period, so that the varieties would not be unauthorizedly used or protected from illegal holders.
Conclusion
The right of industrial property ensures an extremely high degree of legal protection that owners of not all, but only those intellectual creations applicable in performing commercial (and agricultural) activities that are considered as industrial property, can enjoy. In this sense, the connection of plant varieties and (field) economic activity is not difficult to notice. The precondition concerning the intellectual character is fulfilled because the plant varieties are considered materialization of the intellectual, ie, biotechnological work on the creation of a plant variety. Given that fruit and seed material is res in commercio, this precondition is fulfilled. According to TRIPS, it is explicitly stipulated that the Member States (WTO) are obliged to provide patent, sui generis, or combined legal protection to the producers of plant varieties, and in terms of the possibility of protecting holders of plant varieties, the precondition of a formal nature is therefore fulfilled. Accordingly, all the preconditions for the property interests of plant breeders to be protected are protected within the framework of industrial property rights, but not by the patent law. A new plant variety cannot be portrayed as an invention of the patent law. The main reason is that herbal individuals belonging to the plant variety cannot naturally reproduce so that without the intervention of a man during the unlimited number of reproduction cycles they retain the characteristics of the variety. This means that the instruction on the creation of a plant variety is not sufficient for the average agricultural engineer to create a given plant variety. No legal protection under the rights of the trademark or under the rules on the suppression of unfair competition is inappropriate because it is subsidiary to the system of legal control of the marketing of seed and propagating material. The protection of property interests of plant varieties producers in relation to competitors and the protection of the public interest in providing planting materials that meet the prescribed quality and health standards are two, by their very nature, different objectives, and unique legal regulation cannot be adequate. The provision of the sui generis legal protection of plant breeders is generally accepted as a way of regulation that can be achieved at this moment within the framework of industrial property law. Sui generis system of legal protection of holders of new plant varieties in our law implies not only special sources of rights, but also organizational peculiarity, since the tasks of application of the laws within this specific biotechnological legal matter are entrusted to the Ministry of Agriculture, and not to the patent, that is, to the office for intellectual property. However, there is a need for
15 The “Farmers privilege” is a legal option for a farmer to re-use the seed of a protected variety, although it is protected as an intellectual property. LPBPV as well as the UPOV Convention creates a privilege or legal exception” (Veselinović, Milosević, 2013). In theory, it is considered: “Farmer is allowed to do something beyond the basic rules of protection of the variety as an intellectual property. However, the UPOV Convention guarantees certain exclusive rights to planting material, so farmers are often forced to commit to the contract not to use seeds produced on their property for seeding the following year” (Šarac, 2006). The same author believes that “farmers are hindered from using ‘farmer’s privileges’ this way”.
1202 EP 2017 (64) 3 (1191-1204)
Nadežda Ljubojev, Marijana Dukić Mijatović, Željko Vojinović
adequate legal protection of plant varieties, bearing in mind the fact that our breeders have so far managed to protect less than 1% of plant varieties as intellectual property. While the protection of plant varieties in developed countries is almost absolute.
Literature
1. Bainbridge, D. (2007): Intellectual Property, Pearson Education Limited, Harlow.2. Barton, J. H. (1993): Adapting the Intellectual Property System to New Technologies
in: Intellectual Property Rights in Science and Technology, National Academy Press Washington, pp. 256-283.
3. Bentle, L., Sherman, B. (2004): Intellectual Property Law, Oxford University Press, Oxford and New York.
4. Bliss, F. A. (1989): Plant Breeding, Crop Cultivars and the Nature of Genetic Variability, in: Intellectual Property Rights Associated with Plants, Madison: Crop Science Society of America, American Society of Agronomy. Soil Sci. Soc. Am. pp. 69-89.
5. Brush, S. B. (1996): Whose Knowledge, Whose Genes, Whose Rights? in: Valuing Local Knowledge: Indigenous People and Intellectual Property Rights, Island Press Washington. pp. 1-21.
6. Cornish W., Llewelyn, D. (2003): Intellectual Property: Patents, Copyright, Trade Marks, and Allied Rights, Sweet & Maxwell, London, United Kingdom.
7. Council Regulation No. 2100/94 on Communitary Plant Variety Rights (1994), OJL 132, 2. 11. 1994., available at: www.wipo.int/edocs/lexdocs/laws/en/ee/ee119en.pdf.
8. Directive 98/44/EC of the European Parlament and of the Council of 6 July 1998 on the legal protection of biotechnological inventions, Official Journal of the European Communities L 213/13, available at: http://eur-lex.europa.eu/legal content/HR/TXT/?uri=CELEX%3A31998L0044)
9. Fowler, C., (2000): The Plant Patent Act of 1930: A Sociological History of its Creation. 10. Gajinov, T. (1996): Pravni režim intlektualne svojine u stvaranju novih sorti poljoprivrednog
bilja - kritički osvrt na neka rešenja u legislativi, Pravni život, No. 11, pp. 881-890.11. Hayman, E. A. (1962): Botanical Plant Patent Law, 11 Clev.-Marshall L. Rev. 430.12. Idris, K. (2003): Intelektualna svojina - moćno sredstvo ekonomskog rasta, AŠ delo,
Beograd.13. Jondle, R. J. (1989): Overview and Status of Plant Proprietary Rights in: Intellectual
Property Rights Associated with Plants, pp. 5-15.Crop Science Society of America, Inc. American Society of Agronomy, Inc and Soil Science Society of America Madison.
14. Jovanović, S. (Zavod za intelektualnu svojinu R. Srbije) (2000): Zaštita intelektualne svojine u oblasti biotehnologije, u: Izbor objavljenih radova stručnjaka Zavoda 1920 -2000, No. 1, Beograd, Srbija, 157-173.
15. Lesser, W. (2004): An Economic Approach to Identifying an ‘Effective Sui Generis System’ for Plant Variety Protection under TRIPs in: Agriculture and Intellectual Property Rights:

1203EP 2017 (64) 3 (1191-1204)
LEGAL PROTECTION OF NEW PLANT VARIETIES IN THE REPUBLIC OF SERBIA
Economic, Institutional and Implementation Issues in Biotechnology, CABI Publishing Oxon, pp. 53-76.
16. Ljubojev, N., Varga, S. (2013): The Legal Protection of New Plant Varieties, African Jornal of Agricultural Research, Vol. 8, No. 16, pp. 1333-1339.
17. Marković, S. (1997a): Patentno pravo, Nomos, Beograd, Srbija.18. Marković, S. (1997b): Harmonizacija jugoslovenskog prava sortne zaštite sa evropskom i
drugom međunarodnom regulativom, Pravni život , No. 11, pp. 753-764.19. Marković, S. (Zavod za intelektualnu svojinu R. Srbije) (2000): Intelektualna svojina na
biljnim sortama, Teslic M (ed) Izbor objavljenih radova stručnjaka Zavoda 1920-2000, No. 2, Beograd, Srbija. p. 79-101.
20. Međunarodna konvencija o zaštiti novih biljnih sorti (1961), UPOV, Pariz 1961, Ženeva 1972, 1978, 1991, Zakon o potvrđivanju međunarodne konvencije o zaštiti novih biljnih sorti, Službeni glasnik Republike Srbije, Međunarodni ugovori, No. 19, 2010.
21. Međunarodni ugovor o biljnim genetičkim resursima za hranu i poljoprivredu, Službeni glasnik Republike Srbije, Međunarodni ugovori, No. 1, 2013.
22. Milošević, M. (2012): Zaštita biljne sorte kao intelektualne svojine, Semenarska asocijacija Srbije, Novi Sad, Srbija.
23. Šarac, J. (2006): Specifičnosti zaštite prava intelektualne svojine u oblasti biotehnologija, Singidunum revija, Univerzitet Singidunum, Belgrade, Serbia, Vol. 8, No. 1, p. 355.
24. Veselinović, J., Milošević, M., Počuča, S., (2014): International Treaty on Plant Genetic Resources for Food and Agriculture as a Basis for Limiting Intellectual Property, Economics of Agricuture, IAE, Belgrade, Vol. 61, No. 1, pp. 211-223.
25. Verona, A. (1997): Zaštita izuma, Informator, Zagreb.26. Williams, S. B. Jr, Weber, K, A. (1989): Intellectual Property Protection and Plants, in:
Intellectual Property Rights Associated with Plants, pp. 91-107, Crop Science Society of America, American Society of Agronomy, Soil Science Society of America, Madison.
27. Wilson, C. (2005): Intellectual Property Law in a Nutshell, Sweet & Maxwell,London, United Kigdom.
28. Zakon o priznavanju novostvorenih, odobravanju uvođenja u proizvodnju stranih i zaštiti sorti poljoprivrednog i šumskog bilja. Službeni list SFRJ, No. 38, 1980 and No. 82, 1990.
29. Zakon o zaštiti sorti poljoprivrednog i šumskog bilja, Službeni list SRJ, No. 28, 2000 and Službeni glasnik Republike Srbije, No. 101, 2005.
30. Zakon o zaštiti prava oplemenjivača biljnih sorti, Službeni glasnik Republike Srbije No. 41, 2009 and No. 88, 2011.

1204 EP 2017 (64) 3 (1191-1204)
Nadežda Ljubojev, Marijana Dukić Mijatović, Željko Vojinović
PRAVNA ZAŠTITA NOVIH BILJNIH SORTI U REPUBLICI SRBIJI
Nadežda Ljubojev16, Marijana Dukić Mijatović17, Željko Vojinović18
Apstrakt
Opšte prihvaćena je zaštita novih biljnih sorti kao oblik intelektualne svojine. Radi se o sui generis pravnoj zaštiti koju u okviru prava industrijske svojine ostvaruju stvaraoci novih, distinktivnih, stabilnih i homogenih biljnih sorti, označenih sortnom oznakom, ali u svetu postoji tendencija patentne zaštite. Osnovne odlike ove pravne zaštite su isključivost i samostalnost u odnosu na pravni režim ustanovljen za stavljanje sadnog materijala u privredni promet. Cilj ovog rada je da sagleda pravne posledice i da odgovore na pojedina pitanja koja se tiču zaštite intelektualne svojine u ovoj oblasti. Korišćene su istorijsko-pravna i normativno-pravna metoda za razmatranje istorijskog razvoja pravne zaštite oplemenjivača biljaka i analize pozitivnog prava u ovoj oblasti u Republici Srbiji u okviru harmonizacije prava sa međunarodnim pravom i pravom Evropske unije.
Ključne reči: zaštita, biljne sorte, sui generis, patentno pravo, Republika Srbija.
16 Vanredni profesor, dr Nadezda Ljubojev, Univerzitet u Novom Sadu, Tehnički fakultet “Mihajlo Pupin”, Ulica Đure Đakovića bb, 23000 Zrenjanin, Republika Srbija, Telefon: +381 23 55 0520, E-mail: [email protected]
17 Redovni profesor, dr Marijana Dukić-Mijatović, Univerzitet Privredna akademija, Pravni fakultet za ekonomiju i pravosuđe, Novi Sad, 21000 i Univerzitet u Novom Sadu, Ekonomski fakultet u Subotici, Segedinski put br. 9-11 24000 Subotica, Republika Srbija, Telefon: +381 63 542 093, E-mail: [email protected]
18 Docent, dr ŽeljkoVojinović, Univerzitet u Novom Sadu, Ekonomski fakultet u Subotici, Segedinski put br. 9-11 24000 Subotica, Republika Srbija, Telefon: +381 64 883 26 00, E-mail: [email protected].
1205
Economics of Agriculture 3/2017UDC: 340:334.73
EP 2017 (64) 3 (1205-1218)
THE LEGAL NATURE AND THE FRAMEWORK FOR COOPERATIVE ACTIVITIES
Review article
THE LEGAL NATURE AND THE FRAMEWORK FOR COOPERATIVE ACTIVITIES
Miodrag Mićović1
Summary
The subject of the paper are issues related to the legal nature of cooperatives and legal framework for the cooperative activities. When it comes to the legal nature of the cooperatives, newly enacted rules have not made substantial changes with regard to the previously applicable classical concept of cooperatives. Along with that, legal framework for cooperatives is consisted of certain special rules, which differ from the rules that apply for companies, such as: number of founders of the cooperative; persons who may be members of the cooperative; activity; basic capital; the right to vote, quorum and decision-making; profit distribution.
The aim of this paper is to highlight the role of cooperatives in the stabilization of the economy, as well as to point out the need to amend the rules contained in the Law on Cooperatives in accordance with the latest developments of the cooperative organization. The legal analysis has shown that it is necessary to: alter the attitude of the cooperative as a form of organization of natural persons; relativize the effect of the principle of one cooperative member - one vote, self-help and identity in order to strengthen the market functions of the cooperatives. The analysis of the co-operative rules and conclusions are drawn out using the comparative legal method.
Key words: cooperative, cooperative member, voting right, principles, investor members
JEL: Q19.
1 Miodrag Mićović Ph.D., Full Professor, University of Kragujevac, Faculty of Law, Jovana Cvijića Street no. 1, 34000 Kragujevac, Serbia, Phone: +381 34 306 530, E-mail: [email protected].
1206 EP 2017 (64) 3 (1205-1218)
Miodrag Mićović
Introduction
The cooperatives exist approximately for two hundred years.2 They operate in different social (economical) fields and have a longer life expectancy than profit (business) societies. Almost half of the world population provides the funds thanks to the cooperatives.3 In the world, there are three times more members of the cooperatives than the shareholders, while in the fast growing states of the BRIC group, there are four times more members of the cooperatives than the shareholders.4
2 The first cooperative in Serbia was founded in 1846 in Backi Petrovac. In 1895 the Association of Serbian agricultural cooperatives was established, that participated in the founding of the International Cooperative Alliance, London, 1895. Railway savings-loan cooperative was established in 1891 (seven years after putting into traffic the first railway; it had over 100,000 cooperative members, and employed around 100 workers), in order to help railway workers overcoming material difficulties, and the first agricultural-loan cooperative was founded 1894 in the village Vranovo, near Smederevo, in order to protect poor farmers from usurers and commercial speculators (Popović, V., 2012; Predlog Zakona o zadrugama; Izveštaj o zadrugama i zadrugarstvu).
3 In the European Union, 246,000 registered cooperatives employ 4.8 million people and have 144 million members of cooperatives, which means that every third citizen of the EU is a member of some cooperative. In the US, every fourth citizen is a member of some cooperative, the largest energy companies are cooperatives (Izveštaj o zadrugama i zadrugarstvu).
4 Cooperatives are particularly prominent in several sectors. Agricultural cooperatives in Europe have a total of 60% of market share in the area of processing and marketing of agricultural products and around 50% shares in the procurement of raw materials. In the US, cooperatives have a 28% of the market share in the processing and marketing of agricultural products and 26% in the procurement of raw materials. Worldwide there are about 53 000 credit cooperatives and credit unions. In Europe there are about 4,200 credit cooperative banks with 63,000 branches. These cooperative banks have 50 million members (about 10% of the European population), 181 million clients, 780 000 employees, 5.65 billion Euros assets and average market share of about 20%. In the European retail sector 3200 consumer cooperatives employ 400 000 people, have 29 million members, 36,000 sales outlets and 73 billion Euros turnover. When we talk about the service sector, the presence of cooperatives is particularly significant in the US, where nearly 1,000 cooperatives control 40% of the national electricity distribution system, covering 75% of the territory of the United States and providing services to 37 million members and their households. Cooperatives play a leading role in supplying drinking water in Argentina and Bolivia, where a large urban cooperative supplies water to some 700 000 beneficiaries. Workers are organized into cooperatives in various industrial branches. In Italy there are over 25 000 workers’ cooperatives. In Spain, between 1998 and 2008 was established about 14 000 new cooperatives, of which 75% are the working cooperatives. The sectoral distribution of workers’ cooperatives varies from country to country. In France, there are many workers’ cooperatives in production and construction, and only a small number in the service sector. In Uruguay, on the other hand a small number of cooperatives is present in the area of production, while a large number of cooperatives is present in the field of transport and services. According to the International Federation of cooperative mutual insurance, cooperatives, in 2008, in the global insurance market had a share of 25%, of which 44% in Germany, 39% in France, 38% in Japan, 30% in the US and Canada (Borzaga, Galera, 2012).

1207EP 2017 (64) 3 (1205-1218)
THE LEGAL NATURE AND THE FRAMEWORK FOR COOPERATIVE ACTIVITIES
The cooperatives play a key role in the stabilization of the economy, particularly in the sectors marked with a high degree of insecurity and price instability, such as the sector of agriculture and finances. Cooperative banks in Europe, as well as the credit unions in the US, represent a factor of the stabilization of the banking system.5 Since the establishment, the cooperatives constantly adapt to circumstances6 (new cooperative forms emerge), appearing as a significant factor in solving problems of local community or different user groups (Borzaga, Galera, 2012). In times of crisis, cooperatives solve the employment and business issues7 in a more efficient way than commercial companies (Borzaga, Galera, 2012; Izveštaj o zadrugama i zadrugarstvu).
Cooperatives have certain drawbacks reflected in limited access to sources of capital in the capital market, due to which the cooperatives are oriented on their own resources or on loans (Jurić, 2006). Therefore in the last two decades, a cooperative law undergone reforms,8 in order to, in accordance with the principle of freedom of entrepreneurship, ensure that cooperatives have the equal position in relation to the other economic entities (Izveštaj o zadrugama i zadrugarstvu) as well as to provide additional options for the collection of their own capital (Avsec, 2009). The reforms are characterized by a tendency of diminishing differences between the cooperatives and the companies, in
5 In Serbia since 2005, the establishment of savings and loan cooperatives is prohibited, but at the same time the largest cooperative banks in the world (Credit Agricole Bank, as the largest global cooperative system, and Raiffeisen Bank, the oldest cooperative bank in Europe and the world) have permission to operate (Izveštaj o zadrugama i zadrugarstvu).
6 In theory of the cooperative movement, more than one model of cooperative organization stands out, among which three particularly influenced the cooperative movement in our region, namely: Rochdale model (developed in England after the strike of weavers in 1843, which enabled free entry and exit from the cooperative, equality of cooperative members, regardless of the amount of registered shares), Raiffeisen model (developed in Germany in 1848, at the time of the great famine, in order to provide opportunities to poor class society to be supplied with basic groceries; in 1854 the first credit union was founded, where cooperative members had joint and unlimited liability, while a surplus of income were entered into a cooperative reserve fund), Schulze-Delic model (developed in Germany in 1849, excludes state aid, allowing the division’s reserve fund, attracting capital through the remuneration, limited liability of cooperative members) (Izveštaj o zadrugama i zadrugarstvu).
7 According to the opinion of the certain authors, cooperatives were created as a response of workers to poor working conditions, increased unemployment and poverty, as an alternative to the capitalist economic system (Morel, 2014).
8 UN Resolution 64/136 on cooperatives encourages the governments to consider the legal aspects of regulating the activities of cooperatives in order to increase the growth and sustainability of cooperatives (in the socio-economic environment that is rapidly changing), through the provision of equal opportunities for cooperatives relative to other business and social enterprises, including tax reliefs and access to financial services and markets (Izveštaj o zadrugama i zadrugarstvu).
1208 EP 2017 (64) 3 (1205-1218)
Miodrag Mićović
favor of the latter model.9
In a comparative law, there has been visible a different approach to the issues related to cooperatives and the system of cooperative societies, in one group of countries these issues are regulated under the Code (trade - Czech Republic, Slovakia or civil - Italy); in the second group of countries the cooperative issues are regulated under the Law on Cooperatives of general character (Greece, Portugal, Bulgaria, Croatia, Slovenia, Bosnia and Herzegovina); in the third group more specific cooperative laws are adopted (Austria, Germany, France, Spain).10 In Republic of Serbia, this matter is regulated by a single law, the Law on Cooperatives (LOC), in accordance with the recommendations of the International Cooperative Alliance.
For the reformed cooperative law, the rules contained in Regulation EU 1435/03 of July 22, 2003 on the Statute of the European Cooperative Society have a special significance, as well as the American Uniform Limited Cooperative Association Act (ULCAA), which was passed in 2007. The legal analysis of the abovementioned rules as well as the rules contained in LOC will be conducted using the comparative legal method in combination with inductive and deductive research method. Special focus in this paper will be placed to issues related to the legal status and legal nature of the cooperatives, as well as those which define the legal framework, set limits in terms of organization, investment, management, business object.11 The legal analysis of these issues is aiming to determine which national rules governing cooperatives should be amended or defined de lege ferenda, in order to bring Serbian regulations on cooperatives into line with the latest cooperative developments worldwide.
The legal nature of cooperatives
The question of the legal nature of cooperatives is one of the fundamental questions that legal theory tried to give an answer to. Cooperatives are determined as a form of a company or as a sui generis association (Vitez, 1998). Due to the reform of the coop-erative sector, this issue becomes current again.
In order to be able to give an answer to this question, one needs to take into consideration the rules governing cooperative values and principles. These rules are defined by the International Cooperative Alliance in 1995 and implemented in
9 There is an attitude that tendencies of ‘compensation’ of all forms of business organizations should be stopped, that they are contrary to the aims of the cooperative organization, which is why in some countries (Sweden) it is not accepted that its members acquire the status of persons who do not use the services of the cooperative (Hagen, 2002; Avsec, 2009).
10 There are 14 different laws gоverning coopertatives in Spain (Ibánez, 2011).11 Statistically observed, the system of cooperative societies in Serbia is in a difficult position.
The number of active cooperatives is stagnant (there are about 2200), with the largest number of agricultural cooperatives (65%), which absorb the largest number of employees (of 4707 employees, 80.6% is employed in these cooperatives), and approximately 120,000 citizens of Serbia are members of some of the cooperatives (Predlog Zakona o zadrugama).

1209EP 2017 (64) 3 (1205-1218)
THE LEGAL NATURE AND THE FRAMEWORK FOR COOPERATIVE ACTIVITIES
our and some international legal acts.12 According to the LOC, the cooperatives are based on the values of self-help (characterized by the congruence of the cooperative members and service beneficiaries, members of the cooperative are not only investors of capital and administrators, but also the beneficiaries of cooperative services in the broadest sense of the word: as suppliers, customers, employees, etc) (Avsec, 2009), self-responsibility, democracy, equality, fairness and solidarity (Art. 4, par. 2). For the realization of cooperative values, establishment and operation of cooperatives are important principles that include: voluntary and open membership (cooperatives are open to all persons who can use its services); democratic member management and control (every member of the cooperative shall have equal right in the management and control of the business, according to the principle of one member - one vote); economic cooperation of members (cooperative members contribute to the capital and therefore have the right to surplus distribution); autonomy and independence (in relations with the state and other organizations); education, training and information; collaboration with other cooperatives; care of the community (cooperatives are committed to sustainable development in accordance with policies approved by the members) (Art. 4, par. 3). If aforementioned principles are taken into account (primarily the principle of identity, coincidence of service beneficiaries and members of the cooperative, the principle of cooperation openness, the principle of democratic control of cooperative operations by its members),13 together with the main objective of the cooperative organization (meeting the needs of its members and not profit-making) (Timčić, 2016), it could be said that cooperatives, by their nature, are sui generis associations. They can not be organized as a company, nor can they join or merge with the company or other legal entity that is not cooperative or take the form of the company or other legal entity (Art. 5 par. 2 LOC).
However, the above mentioned assertion, about the legal nature of the cooperative, is not in accordance with the reformed cooperative rules, which are mainly encountered in the EU Regulation 1435/03 (Fici, 2013), aiming to bring closer the rules governing cooperatives with the respective ones applicable to companies.14 The Regulation contains provisions which deviate from the conventional principles and rules of the cooperative law. Firstly, unlike the LOC, according to which the member of a cooperative society can only be a person who either operates through the cooperative, uses its services or in any other way directly participates in achieving objectives for which the cooperative was established (Art. 3), Regulation (Art. 14 par. 2) contains deviation from the principle of identity, because the status of a cooperative member can also have an entity who invests capital (thus acquires certain property and management rights in the
12 For example, Art. 2. of Croatian LOC, Art. 6. Uniform Act on Cooperatives, enacted by OHADA, December 15, 2010.
13 These principles are different from those which are characteristic for the operation of other business entities
14 In France, the debate about the legal nature of cooperatives is ad acta since 1947 and adoption of the respective rules according to which cooperatives are considered as a form of commercial companies (Ripert, Roblot, 1998).

1210 EP 2017 (64) 3 (1205-1218)
Miodrag Mićović
cooperative) without any intention to use the goods or services of the cooperative (the so-called members non-beneficiaries or members investors).15 Second, the principle of open membership is basically limited. According to the applicable the rules of LOC, the status of members of the cooperative is acquired if the competent authority accepts the request for membership (if the request is not accepted, it may be appealed to the general meeting) (Art. 25). And, when it comes to members investors, they can acquire that status only if the general meeting accepts the request (not appealable) (Art. 14, par. 2 of the Regulation). It means that the cooperative is more closed than it is an open form of organization. Third, the rule that the cooperative is managed by its members, in accordance with the principle of “one member - one vote” (Art. 33 LOC), basically applies to the reformed rules. However, the Regulation contains exemptions from this principle, providing that: a) statute may determine that a member is entitled to a certain number of votes, determined according to his participation in the activities of the cooperative, and such attribution can not exceed five votes per member or 30% of the total voting rights; b) in the case of cooperatives engaged in financial affairs or insurance activities, the granted right to vote can not exceed five votes per member or 20% of total voting rights; v) non-user (investor) members can not have together more than 25% of the total voting rights;16 g) the participation of employees’ representatives in the general meetings or in the section or sectorial meetings, provided that the employees’ representatives do not together control more than 15 % of total voting rights (Art. 59).
In addition to the rules that fundamentally change the classic cooperative principles,17 in the Regulation, the guidelines encountered at numerous places suggest that cooperatives
15 In theory is expressed an attitude that even in the case of capital investment by persons who do not use the services of the cooperative, aim and purpose of the cooperative organization must be preserved, which is reflected in the maximum satisfaction of the needs of its members. This further means that the investor members may not have a decisive influence on the management in order not to come into a position to hinder the realization of benefits for beneficiary members (the so-called cooperative members) (Nilsson, 1999).
16 In France, investor members can not together own more than 35% of votes. Similarly, in Italy, investor members can not have more than a third of the votes (Avsec, 2009).
17 In an effort to encourage reform of the cooperative sector, the European Commission in its Communication on the promotion of cooperatives - Brussels, 23.2.2004, COM(2004)18 - recommends to the Member States to base its legislation on cooperative values and principles, but at the same time to take into account the needs of the cooperatives for market competition with other business entities. In this regard, in theory it was attempted to come up with an answer to the question what is the essence of cooperatives, that is to say, of which principles it can be receded, and that it still can be talked about the cooperative (Avsec, 2009).
1211EP 2017 (64) 3 (1205-1218)
THE LEGAL NATURE AND THE FRAMEWORK FOR COOPERATIVE ACTIVITIES
are nothing but a kind of company18 to which apply the rules that also apply to joint stock companies.19 Thus, Preamble to the Regulation indicates that companies of all types should allow operations at the Community level (item 2). Or, that the regulations governing joint stock company apply to the cooperative in terms of: the appointment of experts and the valuation role (Art. 4, par. 6); publication of the registered data and documents (Art. 11 par. 5); issues relating to the status change of the merger - the draft of the contract, the publication of the draft of the contract, a report by independent experts, control of the legality of the merger, the announcement of completion of the merger (Art. 20, 22, 24, 26, 28, 29, 30, 32).
Based on these findings, it can be said that the reformed cooperative has a nature sui generis of the company to which the rules governing joint stock companies or limited liability companies apply on issues that are not regulated by the cooperative regulations.20
The legal framework for the organization and business activities of cooperativesCooperatives as a sui generis entity are characterized by certain specific rules which differentiate them from the companies. These rules form the special legal framework for their establishment and operation. Among those rules, out of particular importance for the existence of cooperatives as separate legal entities, are the rules that define: a) the number of the founders of the cooperative; b) membership in a cooperative; v) activity; g) the share capital; d) the right to vote, quorum and decision-making; f) profit distribution.
A) In contrast to companies that may be established by one or more founders, rules on cooperatives require higher number of founders, which is particularly noticeable in
18 In the OHADA Uniform Act there are not provisions about which rules apply to the regulation of matters not regulated by cooperative rules, whereas the art. 21 provides that, depending on the activities performed by the cooperatives have a civil or commercial character, from which it could be concluded that when they have a commercial character, if necessary, the provisions of the law regulating the status of companies shall apply.
19 In Art. 13. LOC it is determined that on issues that are not regulated by law, provisions of the law governing the legal status of limited liability companies apply (in Art. 34, par. 2 stipulates that on the responsibility of members of the authorities of the cooperative to the cooperative apply the provisions of the law that regulate the position of the companies, in the part regulating specific functions to the society, unless this law provides otherwise). The Croatian LOC (Art. 24, 29, 44) determines that the relevant provisions of the Companies Act apply to be the responsibility of the members, that is to say, on the process of merger, acquisition, division and liquidation apply provisions governing joint stock companies.
20 In Italy, depending on the number of members and the amount of assets, there is the possibility that the statute shall only determine which rules apply to the cooperative. If the cooperative has more than 20 members, and assets not exceeding one million euros, then the statute may provide that on the cooperative apply the provisions governing limited liability companies (if the above criteria are exceeded, then the rules governing joint stock companies apply) (Avsec, 2009).
1212 EP 2017 (64) 3 (1205-1218)
Miodrag Mićović
the former rules.21 In order to facilitate the establishment of cooperatives, especially farmers in the villages where there has been a substantial decline in the number of inhabitants, according to the applicable LOC, the minimum number of founders is reduced to five, except that this number can not consist of people who live in the same household with the founder (Art. 15).22
B) According to the LOC, cooperative is a special form of organization of natural persons (Art. 2) and consequently the status of its members can only have the natural (not legal) person (Art. 3). These guidelines differ from the regular, according to which cooperatives are not any particular form of organization of natural persons, which means that there are no obstacles to the founders of the cooperative to appear as natural and legal entities.23 In addition, the denial of legal entities to acquire the status of member cooperatives, the cooperatives are held in a subordinate position in relation to companies contrary to the above mentioned recommendations on the need to provide to the cooperatives additional opportunities to raise capital and provide the same conditions for business, that the other economic entities have (Timčić, 2016).
By the applicable cooperative rules, not only that the circle of its members is limited, according to the type of subjects, but also according to the principle of identity, the effects of which are kept in absolute terms, it is provided that the status of the cooperatives among natural persons can only have those who are service beneficiaries of the cooperative (the so-called cooperative members), but not those who would like to invest the capital in the cooperative, as set out in the EU Regulation 1435/03.
Potential cooperative members can become members of the cooperative if they fulfil additional requirements in terms of: entry of the lowest amount of capital (if the cooperative members invest a share in cooperative)24; activities of the cooperative and their personalities; admission (making decision by the competent authority, which has been discussed above). In principle, the cooperative rules (statute) determine the minimum value of each share (it can be also determined by the law),25 which does not
21 According to the previously valid LOC, a housing cooperative could establish at least 30, and other cooperative types (except the students) at least ten natural persons (Art. 9).
22 According to the LOC of Croatian Republic for the establishment of the cooperative there should be at least seven founders (Art. 6, p. 1). The EU Regulation provides that the cooperative may set up five or more natural persons, provided that it can be established by two or more legal entities (art. 2). The OHADA Uniform Act has no explicit provisions on the number of founders, provided that the concept of cooperative (cooperative is an independent group ....- Art. 4) may conclude that there should be several founders.
23 In this respect: Art. 6 par. 2. LOC of Croatian Republic; Art. 2. оf the Regulation; Art. 7. of the OHADA Act.
24 If the cooperatives are established without the shares of its members, funds for the establishment and operation are provided from the membership fees (Art. 22, par. 1).
25 LOC of Croatian Republic contains a provision according to which the share can not be less than 1,000 kunas, with the fact that the Parliament has the right to determine the share (Art. 31 par. 3).
1213EP 2017 (64) 3 (1205-1218)
THE LEGAL NATURE AND THE FRAMEWORK FOR COOPERATIVE ACTIVITIES
have to be identical (Art. 20, par. 5 and 8 LOC).26 As far as the conditions relating to the activity and personality, in order to prevent fictitious cooperatives, it is determined in the LOC that the acquisition of the status of the cooperative members: in agricultural cooperative it is necessary that the entity is engaged in business activity determined by the cooperative; in the student-youth cooperative it is necessary that the entity is not younger than 15 years nor older than 30 years (Art. 23, par. 4 and 5).
C) In contrast to, for example, the OHADA Act which stipulates that the cooperatives can perform activities in all areas of human activity (Art. 5), the LOC stipulates that cooperatives can carry out lawful activities (Art. 9 par. 1), i.e., that can perform activities that are not prohibited by the law (Art. 11, par. 14). Since the deposit and credit transactions may be performed only by banks (Art. 5 of the Law on Banks), the cooperatives can not perform savings-loan transactions, which is the reason why in the LOC, unlike the previously applicable LOC (Art. 3, par. 3), the savings and loan cooperatives are not mentioned (Timčić, 2016).
D) The minimum share capital of the cooperative, founded with the shares of its members, is 100 dinars (Art. 20, par. 4 LOC).27 This solution is in line with the attitude that the rules governing limited liability companies apply to the cooperatives, which is the reason why the same minimum capital required for the cooperatives is also required for the establishment of these companies.
In order to preserve the sense of cooperative organization and the cooperative rule that service beneficiaries have control of management, in cases where it is allowed that the so-called non-beneficiaries have the status of cooperative member, two legal mechanisms are used, one of which is a limited right of investors to participate in the share capital (the other is limited right to vote). In this regard, the Spanish cooperative legislation primarily allowed investor members to participate in the share capital up to 33% of the share sums of cooperating members, and then share amounts up to 45% of all deposits (Avsec, 2009).
E) In accordance with the classic cooperative principle “one cooperative member - one
26 LOC contains a solution that is similar to that of the Regulation which determine that the nominal value of the share is determined by the statute, that the cooperative may issue different types of shares that give different rights in terms of share of the profit (shares that give the same rights make the same share type) (Art. 4. par. 1-3).
27 Concerning the minimum capital there are two solutions: in some jurisdictions it is left to the cooperatives in the statute to determine a minimum amount of share capital (Spain, US Uniform Law on Cooperative Associations), while in others the minimum amount of capital is determined by the relevant regulations. Thus, according to Regulation EU the minimum share capital amounts EUR 30,000 (Art. 3, par. 2), in Belgium, 18,550 euros, 50,000 Czech crowns (Avsec, 2009).

1214 EP 2017 (64) 3 (1205-1218)
Miodrag Mićović
vote”, the LOC provides that cooperative members have equal voting rights (Art. 33)28 and that the decisions are made by a majority votes of the present members, except in cases when it is stipulated that decisions are taken by qualified majority (Art. 35 and 36). However, the effect of this principle is not absolute anymore, deviations are possible (the aforementioned Art. 59 of the EU Regulation) that is to say, as a rule, they are required when the cooperative has investor members. In this regard, different solutions were adopted. Under the ULCAA, each investor member has one vote if it is not otherwise specified by rules. This means that they can have more votes, but also that they do not have to have the right to vote at all. In Wisconsin it is determined that the voting power of cooperating members must not be reduced to less than 51% of the votes of all members. In Italy, investor members can not individually have more than five votes, and all together they can have one third of the votes at the general meeting of the cooperative. In Spain, the investor members can have up to 30% of the total number of votes (Avsec, p. 99, 105, 106, 116).
In addition to limitations on the number of votes of investor members, in order to ensure management control by the cooperating members, specific conditions are determined regarding quorum and decision-making. In order to prevent out-voting of the beneficiary members by investor members, the EU Regulation 1435/03 indicates that the statute should determine the specific requirements for a quorum regarding beneficiary members (Art. 61). Or, the ULCAA does not define a quorum (unless it is otherwise determined by the cooperative rules, quorum requirement is met, regardless of the number of the present members), but gives particular weight to the cooperating members providing that: 1) the total number of votes shall not be less than the majority of the total number of votes (cooperating members and investor members); 2) and that the decision is considered adopted if it has the majority of votes of all members and the majority of beneficiaries (the system of double majority) (Avsec, 2009).
F) In accordance with the principle of economic participation of members (Art. 4, par. 3, item. 3 LOC) in the business and development of the cooperative, the cooperative members participate29 in the distribution of profits in proportion to their share in the cooperative and the value of the turnover carried out through the cooperative, having covered losses from the previous period and the input of resources in the funds for different purposes (reserve fund, cooperative fund, used for investment or the capital
28 Similar provision is also contained in the other legal sources: in OHADA Act states that every member has one vote regardless of the amount of their participation in the cooperative share capital (Art. 102). Or the EU Regulation stipulates that each member has right to one vote regardless of the number of shares it holds (Art. 59, par. 1).
29 Statute (cooperative rules) may prohibit any surplus distribution (Art. 67, par. 3 of the EU Regulation). In this sense, the Croatian LOC stipulates that in the cases when cooperative activity is performed solely for the purpose of meeting the needs of their members (social, consumer, housing cooperative), when it has not been established with the aim of gaining surplus or when it is funded from the membership fees (non-profit organization), surplus is transferred to the next year after covering deficits (Art. 38).

1215EP 2017 (64) 3 (1205-1218)
THE LEGAL NATURE AND THE FRAMEWORK FOR COOPERATIVE ACTIVITIES
increase), if they are educated (art. 59 LOC).30
According to the EU Regulation 1435/03, the legal reserve fund (in Serbian law this fund is optional) is equal to the share capital and the amount entered to it may not be less than 15% of the surplus for the financial year after deduction of any losses carried over (Art. 65). Given that under the EU Regulation members of the cooperative may also be investor members, it is stipulated that the balance of the surplus after deduction of the allocation to the legal reserve, of any sums paid out in dividends31 and of any losses carried over, with the addition of any surpluses carried over and of any sums drawn from the reserves, shall constitute the profits available for distribution (Art. 67, par. 1). The Regulation does not explicitly specify whether the entire surplus can be shared (including the one that arises from conducting business with non-members) or just the one arising from business operations of the cooperative with its members, nor is determined the ratio in which they can participate in the distribution of surplus of beneficiary and investor members. On that occasion, the ULCAA stipulates that the share of beneficiary members in profits can not be reduced to less than 50%.32
Conclusion
For organizations such as cooperatives, that set up the beneficiaries of their services at the center of their activities, and which can overcome crisis periods in a more efficient manner in comparison to companies, it should be expected that cooperatives become the preferred organizational form of association of interested parties in the future. Consequently, legal acts of many countries emphasize the need to improve cooperative business and bring it in line with the operation of other legal entities. In this regard, the ongoing reforms of the cooperative sector, primarily under the influence of the EU Regulation 1435/03 and the ULCAA, are basically directed towards the corporatisation of the cooperatives, by reducing the difference between the cooperatives and the companies, with notable resistances in respect of such reforms in some jurisdictions.
Serbian cooperative legislation, apart from minor changes (amount of share capital, unequal shares, the application of the rules governing limited liability companies),
30 Unlike our LOC, cooperative rules of the Republic of Croatia specify that after deduction of any losses, at least 20% of surplus is directed for the development of cooperatives and at least 5% for the legal reserves, until the reserves reach the total amount of the member’s shares (Art. 37 par. 2).
31 In Italy, investor members may, in accordance with the statute of the cooperative, receive part of the profits at the rate of two per cent higher than the rate for dividends that cooperative may pay to the user members. In the US state of Delaware to user members may receive dividends at the rate of up to six percent, and to the investor members at a rate of up to 12% (Asvec, 2009).
32 In the US state of Wisconsin profits distributed to beneficiaries may not be less than 51%, provided that this percentage can be reduced up to 30% on the basis of the founding act or statute, with the approval of cooperating members. In the US state of Wyoming proportion of beneficiaries in total profit must not be lower than 15% (Asvec, 2009).

1216 EP 2017 (64) 3 (1205-1218)
Miodrag Mićović
essentially remains on the positions of the previously applicable, classic cooperative concept. For the purpose of approaching and harmonization with the modern trends of the cooperative organization, but also in favour of the preservation of the cooperative as a specific form of organization, it is necessary: to alter the attitude of the cooperative as a form of organization of natural persons; relativize the effect of the principle of one cooperative member - one vote, self-help and identity in order to strengthen the market functions of the cooperative; to protect the purpose of the cooperative organization to the maximum, and that is the satisfaction of the interests of the cooperative beneficiary members. In the case of changing the structure of its members, the conflict of interest between cooperating members and investor members must be taken into account (the first are primarily interested for more favorable business conditions, and the other in greater benefits), in order to achieve the maximum interest of both groups for the successful operation of cooperatives.
Literature
1. American Uniform Limited Cooperative Association Act (ULCAA), (available at: http://www.uniformlaws.org/shared/docs/limited%20cooperative%20association/ulcaa_final_07.pdf).
2. Avsec, F. (2009): Članstvo korisnika i investitora u zadruzi: uporedni pregled uređenja u evropskom privrednom prostoru i SAD, Strani pravni život, vol. 53, no. 2, pp. 85-126, Institut za uporedno pravo, Beograd, Srbija.
3. Borzaga, C., Galera, G. (2012): Promovisanje zadruga u stvaranju boljeg sveta, (available at: http://www.euricse.eu/wp-content/uploads/2015/03/venice_croa-tian_3.0_0.pdf).
4. Communication from the Commission to the Council and the European Parliament, the European Economic and Social Committee and the Committee of Regions on the promotion of co-operative societies in Europe [COM(2004)18], Brussels, 23/02/2004 (available at: http://eur-lex.europa.eu/legal-content/EN/TXT/?uri=CELEX:52004DC0018).
5. Fici, A. (2013): Pan-European Cooperative Law: Where Do We Stand?, Euro-pean Research Institute on Cooperative and Social Enterprises, Working Paper, no. 47, pp. 1-12, Trento, Italy, (available at: http://www.euricse.eu/wp-content/uploads/2015/03/1358347724_n2285.pdf).
6. Jurić, D. (2006): Europska zadruga, Pravo i porezi, vol. 15, no. 6, pp. 58-67, RRIF, Zagreb, Hrvatska.
7. Hagen, H. (2002): Aktuelne tendencije u uporednom zadružnom pravu, Pravo, teorija i praksa, vol. 19, no. 9, pp. 48-61, Univerzitet Privredna akademija, Pravni fakultet za privredu i pravosuđe, Novi Sad, Srbija.
8. Ibánez, I.E. (2011): Law Applicable to the European Cooperative Society: spe-cial reference to the european cooperative established in Spain, European Com-pany and Financial Law Review, vol. 8, no. 1, pp. 30–46, De Gruyter, Berlin, Germany.

1217EP 2017 (64) 3 (1205-1218)
THE LEGAL NATURE AND THE FRAMEWORK FOR COOPERATIVE ACTIVITIES
9. Izveštaj o zadrugama i zadrugarstvu, (available at: http://www.uciteljneznalica.org/upload/ebook/928_Izve%C5%A1taj%20o%20zadrugarstvu.pdf).
10. Morel, S. (2014): Valorisation de l’histoire et du patrimoine des coop´eratives agricoles : L’exemple de la Loire, Saint-Etienne, (available at: https://tel.archives-ouvertes.fr/tel-00993464/document).
11. Nilsson, J. (1999): Cooperative Organisational Models as Reflections of the Bu-siness Environments, The Finnish Journal of Business Economics, vol. 48, no. 4, pp. 449-470, Association for Business Administration, Finland, (available at: http://lta.hse.fi/1999/4/lta_1999_04_a6.pdf).
12. OHADA Uniform Act, (available at: http://www.ohadalegis.com/AUDSC2014.htm).
13. Popović, V. (2012): Zadrugarstvo i njegov značaj za razvoj privrede Republike Srpske, Pravo i privreda, no. 4-6, pp. 97-106.
14. Predlog Zakona o zadrugama, (available at: http://paragraf.rs/dnevne-vesti/211215/211215-vest31.html).
15. Regulation EU 1435/03 of July 22, 2003 on the Statute of the European Cooperative Society, Official Journal EU, no. 207/03.
16. Ripert, G., Roblot, R. (1998): Traite de droit commercial, t. 1, L.G.D.J, Paris, France.
17. Timčić, A. (2016): Normativna određenja i ograničenja uslužnih delatnosti za-druga u Republici Srbiji, Zbornik: Usluge i uslužna pravila, Kragujevac, Pravni fakultet Univerziteta u Kragujevcu, Srbija, pp. 161-168.
18. Vitez, M. (1998): Zadruga i naše privredno pravo, Pravo, teorija i praksa, vol. 15, no. 5-6, pp. 21-31, Univerzitet Privredna akademija, Pravni fakultet za privredu i pravosuđe, Novi Sad, Srbija.
19. Zakon o zadrugama, Sl. glasnik RS, no. 112/15.20. Zakon o bankama, Sl. glasnik RS, no. 107/2005, 91/2010 and 14/2015.21. Zakon o zadrugama Republike Hrvatske, Narodne novine, no. 34/11, 125/13,
76/14.22. Zakon o trgovačkim društvima Republike Hrvatske, Narodne novine, no. 111/93,
34/99, 121/99, 52/00, 118/03, 107/07, 146/08, 137/09, 125/11, 152/11, 111/12, 68/13, 110/15.
1218 EP 2017 (64) 3 (1205-1218)
Miodrag Mićović
PRAVNA PRIRODA I OKVIR ZA POSLOVANJE ZADRUGA
Miodrag Mićović33
Rezime
U radu je najpre ukazano na značaj koji zadruge imaju za stabilnost privrednog ambijenta, a zatim je izvršena uporednopravna analiza pitanja vezanih za pravni položaj zadruga i onih kojima se definiše pravni okvir za organizaciono i poslovno delovanje zadruga. Kada se radi o pravnom položaju zadruga, novodonetim pravilima nisu izvršene suštinske promene u odnosu na ranije važeći klasični koncept zadruge kao sui generis udruženja. Što se tiče pravnog okvira zadružnog delovanja, njega karakterišu određene posebnosti (pravila) po kojima se zadruge razlikuju od privrednih društava, a to su: broj osnivača zadruge; lica koja mogu da budu zadrugari; delatnost; osnovni kapital; pravo glasa, kvorum i donošenje odluka; raspodela dobiti.
Ključne reči: zadruga, zadrugar, pravo glasa, principi, članovi investitori
33 Redovni profesor, dr Miodrag Mićović, Univerzitet u Kragujevcu, Pravni fakultet, Ulica Jovana Cvijića br. 1, 34000 Kragujevac, Srbija, Telefon: +381 34 306 530, E-mail: [email protected].

1219
Economics of Agriculture 3/2017UDC: 338.1:636(4-672EU)
EP 2017 (64) 3 (1219-1230)
ECONOMIC EFFICIENCY OF EXTENSIVE LIVESTOCK PRODUCTION IN THE EUROPEAN UNION
Review article
ECONOMIC EFFICIENCY OF EXTENSIVE LIVESTOCK PRODUCTION IN THE EUROPEAN UNION1
Lana Nastic2, Todor Markovic3, Sanjin Ivanovic4
Summary
Various types of extensive livestock production are present worldwide, primarily in regions where natural resources such as pastures and meadows could be used. Extensive livestock production is common in the EU, as well. Therefore the goal of this research was to establish economic efficiency of extensive livestock production types and to compare their efficiency with some intensive livestock production types. In order to achieve that goal FADN (Farm Accountancy Data Network) methodology was used. Source of information was FADN database as well as appropriate sector analysis and publications of European commission. It has been determined that sheep and goat production is competitive with intensive production types (dairy and granivores – pigs and poultry). Cattle production (other than dairy production) proved to be economically inefficient due to low output level.
Key words: extensive livestock farming, FADN, productivity, return on assets
JEL: Q12
Introduction
Comparing to intensive form of livestock production, extensive livestock production has a lot of advantages, but the main one is its sustainability. Extensive livestock
1 Paper is a part of the research at the project no. III 46006 - Sustainable agriculture and rural development in the function of accomplishment of strategic goals of the Republic of Serbia within the Danube region, and project TR-31051 - Improvement of biotechnological procedures as a function of rational utilization of energy, agricultural products productivity and quality increase, financed by the Ministry of Education, Science and Technological Development of the Republic of Serbia, for the project period 2011-2014.
2 Lana Nastic M.A., Researcher Assistant, Institute of Agricultural Economics, Volgina Street no. 15, 11060 Belgrade, Republic of Srbija, Phone: +381 11 69 72 852, E-mail: [email protected].
3 Todor Markovic Ph.D., Associate Professor, University of Novi Sad, Trg Dositeja Obradovica no. 8, Novi Sad, Republic of Serbia, Phone: +381 21 48 53 500, E-mail: [email protected]
4 Sanjin Ivanovic Ph.D., Associate Professor, University of Belgrade, Faculty of Agriculture, Nemanjina Street no. 6, 11080 Zemun, Republic of Srbija, Phone: +381 11 44 13 426, E-mail: [email protected].
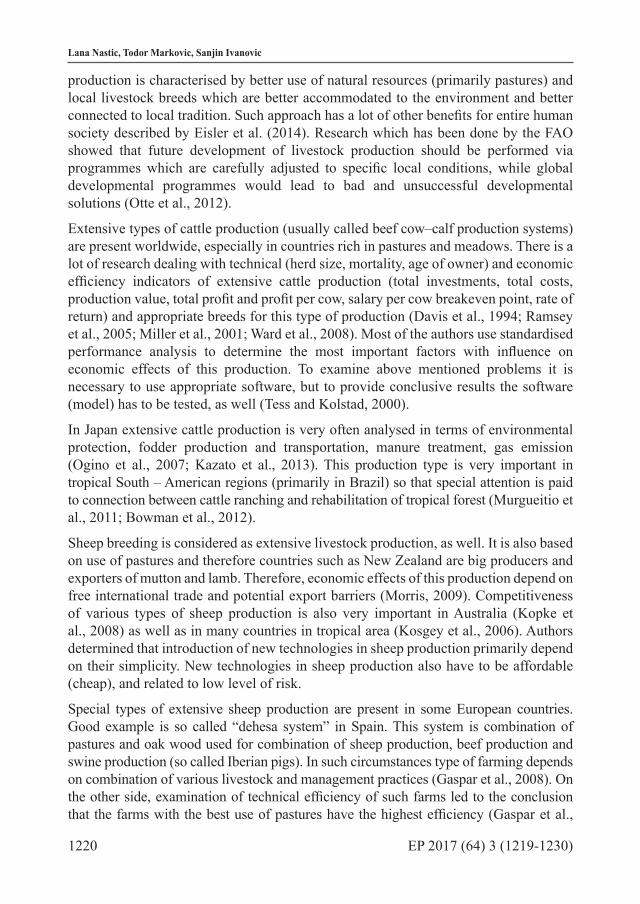
1220 EP 2017 (64) 3 (1219-1230)
Lana Nastic, Todor Markovic, Sanjin Ivanovic
production is characterised by better use of natural resources (primarily pastures) and local livestock breeds which are better accommodated to the environment and better connected to local tradition. Such approach has a lot of other benefits for entire human society described by Eisler et al. (2014). Research which has been done by the FAO showed that future development of livestock production should be performed via programmes which are carefully adjusted to specific local conditions, while global developmental programmes would lead to bad and unsuccessful developmental solutions (Otte et al., 2012).
Extensive types of cattle production (usually called beef cow–calf production systems) are present worldwide, especially in countries rich in pastures and meadows. There is a lot of research dealing with technical (herd size, mortality, age of owner) and economic efficiency indicators of extensive cattle production (total investments, total costs, production value, total profit and profit per cow, salary per cow breakeven point, rate of return) and appropriate breeds for this type of production (Davis et al., 1994; Ramsey et al., 2005; Miller et al., 2001; Ward et al., 2008). Most of the authors use standardised performance analysis to determine the most important factors with influence on economic effects of this production. To examine above mentioned problems it is necessary to use appropriate software, but to provide conclusive results the software (model) has to be tested, as well (Tess and Kolstad, 2000).
In Japan extensive cattle production is very often analysed in terms of environmental protection, fodder production and transportation, manure treatment, gas emission (Ogino et al., 2007; Kazato et al., 2013). This production type is very important in tropical South – American regions (primarily in Brazil) so that special attention is paid to connection between cattle ranching and rehabilitation of tropical forest (Murgueitio et al., 2011; Bowman et al., 2012).
Sheep breeding is considered as extensive livestock production, as well. It is also based on use of pastures and therefore countries such as New Zealand are big producers and exporters of mutton and lamb. Therefore, economic effects of this production depend on free international trade and potential export barriers (Morris, 2009). Competitiveness of various types of sheep production is also very important in Australia (Kopke et al., 2008) as well as in many countries in tropical area (Kosgey et al., 2006). Authors determined that introduction of new technologies in sheep production primarily depend on their simplicity. New technologies in sheep production also have to be affordable (cheap), and related to low level of risk.
Special types of extensive sheep production are present in some European countries. Good example is so called “dehesa system” in Spain. This system is combination of pastures and oak wood used for combination of sheep production, beef production and swine production (so called Iberian pigs). In such circumstances type of farming depends on combination of various livestock and management practices (Gaspar et al., 2008). On the other side, examination of technical efficiency of such farms led to the conclusion that the farms with the best use of pastures have the highest efficiency (Gaspar et al.,

1221EP 2017 (64) 3 (1219-1230)
ECONOMIC EFFICIENCY OF EXTENSIVE LIVESTOCK PRODUCTION IN THE EUROPEAN UNION
2009). Dehesa system is not the only extensive sheep production system in Spain. There are some other production systems which combine sheep and goat production and use of pastures, primarily in north – west region of Spain. According to the results of the research (Jauregui et al., 2007) there are various management strategies for these pastures (they are used only by sheep, only by goats, or by some combination of sheep and goats).
In the most developed countries of the European Union (for example in the United Kingdom) a lot of attention is paid to animal welfare in sheep production. Authors stated (Stott et al., 2005) that intensification of production led to increased competitiveness, but at the same time decreased animal welfare. On the other side, improvement of animal welfare has negative influence on profit in sheep production. But another author examined similar problem in Australia and reached completely opposite conclusion (Kingwell, 2002). Having in mind animal welfare, an author (Hemsworth, 2003) suggests certain tests and education for workers who work in direct contact with animal in order to reduce stress for animals and to increase their productivity. Increase of animal welfare is related to increased engagement of farm managers during some crucial stages of production process, for example in disease control (Goddard et al., 2006).
Goat production is by definition extensive and exists primarily in poor and developing countries. In the EU goat production is primarily directed towards milk production. The most important EU countries regarding number of goats (and volume of goat milk production) are Spain, France and Greece (Aziz, 2010), while the highest number of goats is present in Greece (Kitsopanidis, 2002). Number of goats increases in Australia, while number of sheep at the same time decreases (Clarke and Ronning, 2013). The reason for this phenomenon is export of goat meat from Australia to the United States (Febrianno and Siahaan, 2012). On the other hand, the EU countries import sheep and goat meat mostly from New Zealand. Due to high demand, goat meat production has been increasing in the United States, as well. The main area for goat meat is south-east of the US because of its arid climate and sufficient quantities of appropriate fodder (Qushim et al., 2016).
The importance of livestock production could be seen from Table 1. representing number of such farms in the EU and their number in FADN sample.
Table 1. Number of holdings in the EU by type of farming in 2012
Types of farming Farms represented Sample farmsSum Sum
Field crops 1 120 030 23 820Horticulture 185 840 5 146Wine 278 840 4 456Other permanent crops 688 340 6 649Milk 605 080 14 121Grazing livestock 807 400 11 368Granivores 170 050 5 785

1222 EP 2017 (64) 3 (1219-1230)
Lana Nastic, Todor Markovic, Sanjin Ivanovic
Mixed (crops and livestock) 1 063 780 11 951Total groups 4 919 360 83 296
Source: European Commission (2015): EU Farm Economics Overview based on 2012 FADN data.
There are 807,400 farms in the EU dealing with grazing livestock (sheep and goat production type and cattle production type – cattle other than dairy cows). Beside there are 605,080 farms engaged in milk production and 170,050 farms in type – granivores. It is evident that farms which have grazing livestock production type (extensive production) outnumber farms with intensive livestock production (milk and granivores).
The goal of this paper is comparison of various economic efficiency indicators among extensive livestock production (sheep and goat production, cattle production) and intensive types of livestock production (dairy and granivores – pigs and poultry). On the basis of the analysis it will be possible to determine whether extensive livestock production types are competitive with the intensive ones.
Material and methods
In order to analyse economic effectiveness of extensive livestock farms in the European Union data from FADN database (based on Commission Regulation (EC) No. 868/2008), which provide large number of various analyses, are primarily used. Besides, it is possible to follow absolute, as well as relative indicators of economic effectiveness (total output/total input, farm net income/total assets, farm net value added/AWU). FADN is a unique accountancy methodology for all agricultural producers in the European Union and it is organised by adequate European Commission regulations. Last available data in FADN database refer to 2013. Data from following years have not been published yet.
The research also relies on sector analysis published by the European Commission which is also based on FADN data. Sector analysis covers four year period (from 2010 to 2013) and four production types (sheep and goat, cattle, dairy, granivores).
Results and discussion
One of the most important indicators of economic effectiveness of production (Graph 1.) is total output/total input (productivity). This indicator, as well as other indicators used in this research, gives an opportunity to compare farms of different sizes and production types. During entire observed period productivity of cattle production (type of cattle production which is not primarily based on milk production) is the lowest and constantly under 1 (total output is lower than total input). On the other side, productivity of sheep and goat production is very high (the highest of all observed production types in 2010 and 2011) and competitive to productivity of dairy and granivores.

1223EP 2017 (64) 3 (1219-1230)
ECONOMIC EFFICIENCY OF EXTENSIVE LIVESTOCK PRODUCTION IN THE EUROPEAN UNION
Graph 1. Productivity of various livestock production types
Source: http://ec.europa.eu/agriculture/rica/database/database_en.cfm and authors’ calculation
At the same time it is necessary to have in mind that sheep and goat farms are the smallest farms regarding volume of total output and total input. For example, total output of sheep and goat farms ranges from 31,000 and 33,000 EUR while total output of granivores ranges from 236,000 to 238,000 EUR (Table 2.).
Table 2. Total output of various livestock production types
Sheep and goat Cattle Dairy Granivores
2010 31,000 49,900 97,400 236,200
2011 33,400 53,100 110,100 253,300
2012 33,700 57,100 104,300 279,800
2013 33,600 59,200 105,500 278,600
Source: http://ec.europa.eu/agriculture/rica/database/database_en.cfm
Sheep and goat production type has even better results concerning return on assets (farm net income/total assets) comparing to other livestock production types (Graph 2.). Contrary to that in most of the observed years return on assets is the lowest in cattle production (under 4%).

1224 EP 2017 (64) 3 (1219-1230)
Lana Nastic, Todor Markovic, Sanjin Ivanovic
Graph 2. Return on assets of various livestock production types
Source: http://ec.europa.eu/agriculture/rica/database/database_en.cfm and authors’ calculation
The reason for so high return on equity in sheep and goat production are primarily very small total assets in this production (Table 3.).
Table 3. Total assets of various livestock production types
Sheep and goat Cattle Dairy Granivores
2010 188,900 427,600 471,900 607,400
2011 193,000 423,800 496,700 614,000
2012 193,000 425,400 468,600 626,000
2013 196,900 438,900 453,800 640,500
Source: http://ec.europa.eu/agriculture/rica/database/database_en.cfm
Productivity and ROA (return on assets) indicator lead to a conclusion that small family farms oriented towards sheep and goat production are very economically efficient comparing to much bigger dairy farms, pig farms and poultry farms. On the other hand extensive cattle farming is not economically efficient. So, one type of extensive production is very economically acceptable (sheep and goat) while the other one (cattle) is not. The question is - what is the reason for unfavourable results of cattle production?
If dairy and cattle productions are compared, it is obvious that value of their total assets is very similar (in 2013 it is approximately 250,000 EUR) which means that the reason for low ROA indicator for cattle production is very small farm net income (FNI). Return on assets measures the effectiveness of a farm’s assets in generating revenue. According to European Commission (2015) report low ROA means that farms “invested a high amount of capital into their production, while simultaneously receiving
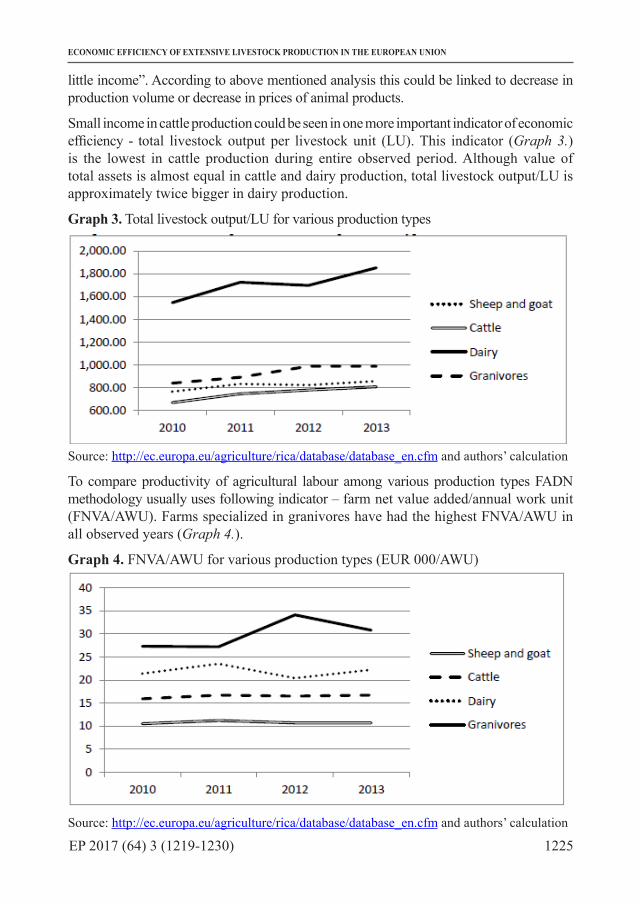
1225EP 2017 (64) 3 (1219-1230)
ECONOMIC EFFICIENCY OF EXTENSIVE LIVESTOCK PRODUCTION IN THE EUROPEAN UNION
little income”. According to above mentioned analysis this could be linked to decrease in production volume or decrease in prices of animal products.
Small income in cattle production could be seen in one more important indicator of economic efficiency - total livestock output per livestock unit (LU). This indicator (Graph 3.) is the lowest in cattle production during entire observed period. Although value of total assets is almost equal in cattle and dairy production, total livestock output/LU is approximately twice bigger in dairy production.
Graph 3. Total livestock output/LU for various production types
Source: http://ec.europa.eu/agriculture/rica/database/database_en.cfm and authors’ calculation
To compare productivity of agricultural labour among various production types FADN methodology usually uses following indicator – farm net value added/annual work unit (FNVA/AWU). Farms specialized in granivores have had the highest FNVA/AWU in all observed years (Graph 4.).
Graph 4. FNVA/AWU for various production types (EUR 000/AWU)
Source: http://ec.europa.eu/agriculture/rica/database/database_en.cfm and authors’ calculation
1226 EP 2017 (64) 3 (1219-1230)
Lana Nastic, Todor Markovic, Sanjin Ivanovic
As expected, the biggest farms with intensive production (granivores) had the highest FNVA per average work unit. Small farms with extensive production (low investments in fixed assets) have the lowest productivity of agricultural labour.
Conclusion
This paper analysed two types of extensive livestock production and compared them to two types of intensive livestock production. As it was expected, extensive production types had the lowest productivity of agricultural labour. In terms of other indicators (productivity, return on assets) extensive types of livestock production (sheep and goat compared to cattle) had different values of above mentioned indicators. Small sheep and goat farms are very competitive with big farms which have intensive production (dairy and granivores). On the other hand cattle farms have smaller output than input. This is primarily caused by discrepancy between levels of invested capital and total output.
Research results referring to the EU are significant for the agriculture of the Republic of Serbia as well. They indicate the need to analyse cattle production in Serbia more thoroughly because this production type has not been developed enough yet. Farmers who plan to become involved in cattle production in Serbia (other than dairy production) have to be aware of the necessity to keep investments in this production at a very low level. Otherwise, there is high probability that cattle production in Serbia will not be economically efficient. On the other hand, successfulness of small sheep and goat farms in the EU indicates that they could be competitive to large scale dairy and granivores operation. Having this in mind, it might be expected that small sheep and goat farms in Serbia will be competitive to other types of livestock production in the future.
Literature
1. Aziz M. A. (2010): Present status of the world goat populations and their pro-ductivity. Lohmann Information, ISSN 1617-2906, Volume 45, No. 2, Oct. 2010, pp. 42-52. (available at: http://lohmann-information.de/content/l_i_45_artikel17.pdf).
2. Bowman, M.S., Soares-Filho, B. S., Merry, F. D., Nepstad, D. C., Rodrigues, H., Almeidа, O. T. (2012): Persistence of cattle ranching in the Brazilian Amazon: A spatial analysis of the rationale for beef production. Land Use Policy, ISSN 0264-8377, Volume 29, Issue 3, July 2012, doi: 10.1016/j.landusepol.2011.09.009, pp. 558–568. (available at: http://www.sciencedirect.com/science/article/pii/S0264837711001037).
3. Clarke, M., Ronning, D. (2013): Goat meat industry RD&E strategy – 2012 benefit cost analysis. Meat & Livestock Australia Limited. ISBN 9781741919929. (available at: https://www.mla.com.au/CustomControls/PaymentGateway/ViewFile.aspx?ZRx-8U1iEOwSwUaIBSZT+Ts1iGZaDWRPpRHMppRRjrLxlghY50lUq4Ekmoqk3kNLh3EYMKKAfsht7d1Tnt3BqiA==).
1227EP 2017 (64) 3 (1219-1230)
ECONOMIC EFFICIENCY OF EXTENSIVE LIVESTOCK PRODUCTION IN THE EUROPEAN UNION
4. European Commission (2015): EU Farm Economics Overview based on 2012 FADN data. (available at: http://ec.europa.eu/agriculture/rica/pdf/EU_FEO_FADN_2013_final_web.pdf).
5. Commission Regulation (EC) No. 868/2008 of 3 September 2008 on the farm return to be used for determining the incomes of agricultural holdings and analyz-ing the business operation of such holdings. (available at: file:///D:/Admin/Down-loads/03%20Reglament868-2008-FarmReturn%20(2).pdf).
6. Davis, K., C; Tess, M. W., Kress, D. D., Doornbos, D. E., Anderson, D. C. (1994): Life cycle evaluation of five biological types of beef cattle in a cow-calf range production system: II. Biological and economic performance, Journal of animal science, ISSN 0021-8812, Volume 72, No. 10, doi:/1994.72102591x, pp. 2591-2598. (available at: https://dl.sciencesocieties.org/publications/jas/abstracts/72/10/2591?access=0&view=pdf).
7. Eisler, M. C., Lee, M. R., Tarlton, J. F., Martin, G. B., Beddington, J., Dungait, J. A., Greathead, H., Liu, J., Mathew, S., Miller, H., Misselbrook, T., Murray, P., Vinod, K. V., Saun V. R., Winter, M. (2014): Agriculture: Steps to sustainable livestock. Nature, Volume 507, Issue 7490, Nature, ISSN 0028-0836, pp. 32-34. (available at: http://www.nature.com/polopoly_fs/1.14796!/menu/main/topCol-umns/topLeftColumn/pdf/507032a.pdf).
8. Febrianno, E., Siahaan, U. (2012): Investment Analysis on Goat and Sheep Fattening Project Based on the New Food Fermentation Farming Method (3F Method). The In-donesian Journal of Business Administration. ISSN 2252-3464, Volume 1, No. 9, pp. 613-621. (available at: http://journal.sbm.itb.ac.id/index.php/IJBA/article/view/445).
9. Farm economy focus by sector “Farms Specialized in Sheep and Goats in the EU” Based on FADN data up to 2013. European Commission. (available at: https://ec.europa.eu/agriculture/sites/agriculture/files/agriculture/sheep-goat_en.pdf).
10. Farm economy focus by sector “Farms Specialized in Cattle in the EU” Based on FADN data up to 2013. European Commission. (available at: https://ec.europa.eu/agriculture/sites/agriculture/files/agriculture/cattle_en.pdf)
11. Farm economy focus by sector “Dairy Farms in the EU” Based on FADN data up to 2013. European Commission. (available at: https://ec.europa.eu/agriculture/sites/agriculture/files/agriculture/dairy_en.pdf)
12. Farm economy focus by sector “Farms Specialized in Granivores in the EU” Based on FADN data up to 2013. European Commission. (available at: https://ec.europa.eu/agriculture/sites/agriculture/files/agriculture/granivores_en.pdf).
13. Gaspar, P., Escribano, M., Mesias, F. J., de Ledesma, A. R., Pulido, F. (2008): Sheep farms in the Spanish rangelands (dehesas): Typologies according to livestock man-agement and economic indicators. Small Ruminant Research, ISSN 0921-4488, Volume 74, Issues 1–3, doi:10.1016/j.smallrumres.2007.03.013, pp. 52-63. (avail-
1228 EP 2017 (64) 3 (1219-1230)
Lana Nastic, Todor Markovic, Sanjin Ivanovic
able at: http://www.sciencedirect.com/science/article/pii/S0921448807000971).
14. Gaspar, P., Mesias, F. J., Escribano, M., Pulido, F. (2009): Assessing the tech-nical efficiency of extensive livestock farming systems in Extremadura, Spain. Livestock Science, ISSN 1871-1413, Volume 121, Issue 1, doi:10.1016/j.livs-ci.2008.05.012, pp. 7-14. (available at: http://www.sciencedirect.com/science/article/pii/S1871141308001558).
15. Goddard, P., Waterhouse, T., Dwyer, C., Stott, A. (2006): The perception of the welfare of sheep in extensive systems. Small Ruminant Research, ISSN 0921-4488, Volume 62, No. 3, doi:10.1016/j.smallrumres.2005.08.016, pp. 215-225. (available at: http://www.sciencedirect.com/science/article/pii/S0921448805003482).
16. Hemsworth, P. H. (2003): Human–animal interactions in livestock production. Applied Animal Behaviour Science, ISSN: 0168-1591, Volume 81, Issue 3, doi:10.1016/S0168-1591(02)00280-0, pp. 185-198. (available at: http://www.sci-encedirect.com/science/article/pii/S0168159102002800).
17. Jauregui, B.M., Celaya, R., Garcia, U., Osoro, K. (2007): Vegetation dynamics in burnt heather-gorse shrublands under different grazing managements with sheep and goats. Agroforestry Systems, ISSN 0167-4366, Volume 70, Issue 1, DOI 10.1007/s10457-007-9045-x, pp. 103–111. (available at: https://link.springer.com/article/10.1007/s10457-007-9045-x).
18. Kopke, E., Young, J., Kingwell, R. (2008): The relative profitability and envi-ronmental impacts of different sheep systems in a Mediterranean environment. Agricultural Systems, ISSN: 0308-521X, Volume 96, Issues 1–3, March 2008, doi:10.1016/j.agsy.2007.06.003, pp. 85–94. (available at: http://www.sciencedi-rect.com/science/article/pii/S0308521X07000807).
19. Kitsopanidis, G.I. (2002): Economics of goat farming in Greece. NEW MEDIT N. ISSN 1594-5685, Volume 1, Issue 3, pp. 48–53. (available at: http://www.iamb.it/share/img_new_medit_articoli/210_48kitsopanidis.pdf).
20. Kingwell, R. (2002). Sheep animal welfare in a low rainfall Mediterranean envi-ronment: a profitable investment?. Agricultural Systems, ISSN 0308-521X, Vol-ume 74, Issue 2, doi:10.1016/S0308-521X(01)00086-5, pp. 221-240. (available at: http://www.sciencedirect.com/science/article/pii/S0308521X01000865).
21. Kosgey, I. S., Baker, R. L., Udo, H. M. J., Van Arendonk, J. A. M. (2006): Success-es and failures of small ruminant breeding programmes in the tropics: a review. Small Ruminant Research, ISSN 0921-4488, Volume 61, Issue 1, doi:10.1016/j.smallrumres.2005.01.003, pp. 13-28. (available at: http://www.sciencedirect.com/science/article/pii/S0921448805000258).
22. Miller, A. J., Faulkner, D. B., Knipe, R. K., Strohbehn, D. R., Parrett, D. F., Berger L. L. (2001): Critical Control Points for Profitability in the Cow-Calf Enterprise. Profes-sional Animal Scientist, December 2001 vol. 17 no. 4, pp. 295-302. (available at: http://

1229EP 2017 (64) 3 (1219-1230)
ECONOMIC EFFICIENCY OF EXTENSIVE LIVESTOCK PRODUCTION IN THE EUROPEAN UNION
www.sciencedirect.com/science/article/pii/S1080744615316430).
23. Morris, S. T. (2009): Economics of sheep production. Small ruminant research, ISSN 0921-4488, Volume 86, Issues 1-3, doi:10.1016/j.smallrumres.2009.09.019, pp. 59-62. (available at: http://www.sciencedirect.com/science/article/pii/S0921448809001771).
24. Murgueitio, E., Calle, Z., Uribe, F., Calle, A., Solorio, B. (2011): Native trees and shrubs for the productive rehabilitation of tropical cattle ranching lands. Forest Ecology and Management, ISSN 0378-1127, Volume 261, Issue 10, doi:10.1016/j.foreco.2010.09.027, pp. 1654–1663. (available at: http://www.sciencedirect.com/science/article/pii/S0378112710005591).
25. Ogino, A., Orito, H., Shimada, K., Hirooka, H. (2007): Evaluating environmen-tal impacts of the Japanese beef cow–calf system by the life cycle assessment method. Animal Science Journal, ISSN 1740-0929, Volume 78, Issue 4, DOI: 10.1111/j.1740-0929.2007.00457.x, pp. 424-432. (available at: http://onlineli-brary.wiley.com/doi/10.1111/j.1740-0929.2007.00457.x/full).
26. Ramsey, R., Doye, D., Ward, C., McGrann, J., Falconer, L., Bevers, S. (2005): Factors Affecting Beef Cow-Herd Costs, Production, and Profits. Journal of Ag-ricultural and Applied Economics, EISSN 2056-7405, Volume 37, Issue 1, pp. 91-99. (available at: https://www.researchgate.net/publication/23944827_Fac-tors_Affecting_Beef_Cow-Herd_Costs_Production_and_Profits).
27. Otte J., Costales, A., Dijkman, J., Pica-Ciamarra, U., Robinson, T., Ahuja, V., Ly, C., Roland-Holst D. (2012): Livestock sector development for poverty reduc-tion: an economic and policy perspective – Livestock’s many virtues. FAO, Rome, ISBN 978-92-5-107242-4. (available at: http://www.fao.org/docrep/015/i2744e/i2744e00.pdf).
28. Qushim, B., Gillespie, J., McMillin (2016): Meat Goat Enterprise Efficiency Analysis in the Southeastern United States. Journal of Agricultural and Applied Economics, EISSN 2056-7405, Volume 48, Issue 1, DOI: 10.1017/aae.2016.1, pp. 52–72. (available at: https://www.cambridge.org/core/services/aop-cambridge-core/content/view/S1074070816000018).
29. Tess, M.W., Kolstad B.W. (2000): Simulation of cow-calf production systems in a range environment: II. Model evaluation. Journal of Animal Science, ISSN 0021-8812, Volume 78, Number 5, doi:/2000.7851170x, pp. 1170-1180. (available at: https://dl.sciencesocieties.org/publications/jas/abstracts/78/5/1170?access=0&view=pdf).
30. Stott, A. W., Milne, C. E., Goddard, P. J., Waterhouse, A. (2005): Projected ef-fect of alternative management strategies on profit and animal welfare in exten-sive sheep production systems in Great Britain. Livestock Production Science, ISSN 1871-1413, Volume 97, Issues 2-3, doi:10.1016/j.livprodsci.2005.04.002,

1230 EP 2017 (64) 3 (1219-1230)
Lana Nastic, Todor Markovic, Sanjin Ivanovic
pp. 161-171. (available at: http://www.sciencedirect.com/science/article/pii/S030162260500103X).
31. Ward, C. E., Vestal, M. K., Doye, D. G., Lalman, D. L. (2008): Factors Affecting Adoption of Cow-Calf Production Practices in Oklahoma. Journal of Agricultural and Applied Economics, EISSN 2056-7405, Volume 40, Issue 3, pp. 851–863. (available at: http://ageconsearch.umn.edu/bitstream/47263/2/jaae-40-03-851.pdf).
EKONOMSKA EFEKTIVNOST EKSTENZIVNE STOČARSKE PROIZVODNJE U EVROPSKOJ UNIJI
Lana Nastić5, Todor Marković6, Sanjin Ivanović7
Apstrakt
Različiti tipovi ekstenzivne stočarske proizvodnje su prisutni svuda u svetu, prvenstveno u regionima gde se mogu koristiti prirodni resursi, kao što su pašnjaci i livade. Ekstenzivna stočarska proizvodnja je takođe široko rasprostranjena i u Evropskoj uniji. Zbog toga je cilj ovog istraživanja bio da se utvrdi ekonomska efektivnost različitih tipova ekstenzivne stočarske proizvodnje i da se uporedi sa efektivošću intenzivne stočarske proizvodnje. Da bi se taj cilj ostvario korišćena je FADN (Farm Accountancy Data Network) metodologija. Izvori podataka su bili FADN baza podataka Evroske unije, kao i odgovarajuće sektorske analize i publikacije Evropske komisije. Utvrđeno je da je ovčarska i kozarska proizvodnja konkurentna sa intenzivnim tipovima stočarske proizvodnje (proizvodnja mleka i nepreživari – svinje i živina). Utvrđeno je da govedarska proizvodnja (koja se ne odnosi na proizvodnju mleka) nije ekonomski efikasna usled niskog nivoa outputa koji ostvaruje.
Ključne reči: ekstenzivna stočarska proizvodnja, FADN, produktivnost, rentabilnost
5 Lana Nastić, istraživač saradnik, Institut za ekonomiku poljoprivrede, Volgina ulica br. 15, 11060 Beograd, Republika Srbija, Telefon: +381 11 69 72 852, E-mail: [email protected].
6 Vanredni profesor, dr Todor Marković, Univerzitet u Novom Sadu, Poljoprivredni fakultet, Trg Dositeja Obradovića br. 8, 21000 Novi Sad, Republika Srbija, Telefon: +381 21 48 53 500, E-mail: [email protected]
7 Vanredni profesor, dr Sanjin Ivanović, Univerzitet u Beogradu, Poljoprivredni fakultet, Nemanjina ulica br. 6, 11080 Zemun, Republika Srbija, Telefon: +381 11 44 13 426, E-mail: [email protected].

1231
Economics of Agriculture 3/2017UDC: 658.21:664.69(497.113)
EP 2017 (64) 3 (1231-1248)
SITE SELECTION OF THE CONSTRUCTION OF THE SYSTEM FOR THE PRODUCTION OF PASTA IN AP VOJVODINA
Review article
SITE SELECTION OF THE CONSTRUCTION OF THE SYSTEM FOR THE PRODUCTION OF PASTA IN AP VOJVODINA
Goran Paunovic1, Dragan Solesa2, Marko Ivanis3
Summary
In the growing race for the market share, companies geographically position their production and office buildings according to the new business rules. In order for the company to survive in the market, it is necessary to maximize the profit, minimize the costs, maintain a good quality of the product and constantly improve it. The choice of location is one of the vital decisions in the process of building of a production system, although the selection of the location is a problem related to certain time sections in the life of a given production system, the need for research on the effect locations have is stable in time.
The aim of the research is the methodological approach to the selection criteria of broader and narrower location for the construction of the production system for pastry production in Vojvodina as an area which has a rich base in raw material. The Agricultural and food industry as branches of industry have a long time tradition as well as a great potential in strengthening economic performances of the Economy of Vojvodina. Evaluation criteria and their use in the model of dimensional analysis will allow a good selection of a good location for the construction of the business systems for the production of pastry.
Key words: business location, broader location, narrower location.
JEL: D92, L23, Q51
1 Goran Paunović M.Sc., University Business Academy in Novi Sad, Faculty of Economics and Engineering Management in Novi Sad, Cvecarska Street no. 2, 21 000 Novi Sad, Serbia, Phone: +381 21 400 484, E-mail: [email protected]
2 Dragan Solesa Ph.D., Full Professor, University Business Academy in Novi Sad, Faculty of Economics and Engineering Management in Novi Sad, Cvecarska Street no. 2, 21 000 Novi Sad, Serbia, Phone: +381 21 400 484, E-mail: [email protected]
3 Marko Ivanis Ph.D., Associate Professor, University Business Academy in Novi Sad, Faculty of Economics and Engineering Management in Novi Sad, Cvecarska Street no. 2, 21 000 Novi Sad, Serbia, Phone: +381 21 400 484, E-mail: [email protected]
1232 EP 2017 (64) 3 (1231-1248)
Goran Paunovic, Dragan Solesa, Marko Ivanis
Introduction
Agriculture of Vojvodina reached its zenith during the 1980s. During the ‘90s, there was a decline in agricultural production according to all indicators, and the early 21st century brought slight recovery from the developmental collapse of the ‘90s (Novkovic, Mutavdzic, 2009-2010). The future development of agriculture of Vojvodina can be directed towards the restoration of positive production and economic results of the ‘80s but such an investment into the development of conventional agriculture will progress very slowly (Executive Council of AP Vojvodina, 2006). Vojvodina covers 35 percent of agricultural land of Serbia and the share of agricultural population in the total population of Vojvodina is under 11percent. Grains, with 66 percent, are the most common group of crops on arable land in Vojvodina (Novkovic, Mutavdzic, 2009-2010). Although the agro-industrial sector of Vojvodina makes 40 percent of the total industrial production in Vojvodina, a significant part of agricultural products is exported in the raw state, not processed in plants. Apart from the natural comparative advantages with respect to other areas of the Republic of Serbia and neighboring countries, one of the main characteristics of Vojvodina is that it has a long tradition in the agricultural and food industry and has a professional and educated workforce. The subject of the research is based on an analysis of advantages, i.e. advantages in the choice of location4 for the construction of a production system for pastry production in the territory of Vojvodina. Natural factors such as: the characteristics of the relief, natural wealth, availability of raw materials, energy and water resources, soil fertility, and the overall ecological and climatic conditions are the advantages that characterize this area. Man-made resources, such as the development of large networks and community infrastructure, the quality of the overall developmental foundation such as: structure of urban economy, industrial tradition, educational structure of workforce, development of educational-information system, the level of general culture, the level of organization of urban space, differ among some municipalities in the territory of Vojvodina, and such factors will be taken into consideration in the case study. Natural location factors determine the total locational capacity (potential) and man-made resources determine the optimal scope of utilization of the given natural resource in each stage of the development process. Economic and overall social development have led to the situation where man-made resources gradually outweigh the natural comparative resources. When choosing a location for pastry production, attention was primarily paid to the minimizing of production costs. The complexity of the analysis of the simultaneous effect of several factors implies that when choosing a location other factors of importance are also analysed. The main inputs in pastry production process are wheat and water. Pastry is a product obtained by mixing and shaping wheat semolina or flour with water (plain
4 For a good choice of location, three main components of the scientific method are applied. By applying the general approach through certain scientific findings in this field, the methodological approach to selecting the criteria of broader and narrower location, methods and research techniques to analyse the criteria, we will provide an evaluation of influencing factors of importance for the choice of location.
1233EP 2017 (64) 3 (1231-1248)
SITE SELECTION OF THE CONSTRUCTION OF THE SYSTEM FOR THE PRODUCTION OF PASTA IN AP VOJVODINA
pastry) or mixing and shaping of basic raw materials with the use of additional raw material (modified pastry) (Official Gazzette of RS 43/2013). In terms of quality, the water used in the production of pastry needs to meet the requirements prescribed for drinking water. For these reasons, the locations that do not meet the requirements for drinking water quality have to be eliminated regardless of the attractiveness of other factors. Pastry is not seasonal goods, so the sales are uniform throughout the year. In Serbia, pastry is used by as much as 88 percent of consumers and the percentage of users is generally stable.
Location Theory
The strategic importance of logistics is increasing and companies need efficient logistical support to achieve competitive advantage. The decision on the selection of the optimal location has a significant impact on customer service and logistics costs. The choice of location is a complex process in which to consider multiple, tangible and intangible criteria. However, many of the current methods of supporting the process of cost-orientation (Korpela, Tuominen, 1996).
Selection of industrial sites is a strategic decision that involves several criteria: technical, economic, social, environmental and political. Deciding that the site requires appropriate instruments to enable data collection, storage, analysis, fusion and knowledge management to solve this complex problem (Rikalovic et al., 2015).
Capello (2011), includes the location as an economic resource and an independent factor of production, generator of static and dynamic advantages for companies.
Perceptions in the location theory have changed under the influence of many factors. Technological development, the increasing mobility of production factors and socio-economic changes have influenced the rapid change of the priority criteria scale. The emergence of the location theory is linked to Alfred Weber, who, in his research of the optimal location in terms of industrial facilities, in addition to the difference in transportation costs and labor costs, introduced agglomerative-deglomerative factors in the analysis (Weber, 1909). Agglomerative factors encourage the concentration of the industry, due to the possibility of technical improvements in terms of specialization of machines and plants and the establishment of cooperation among participants within the same branch. Deglomerative factors lead to the decentralization of industrial facilities, due to the high cost of leasing the larger areas of land. For this reason, Weber introduced the scheme of concentric circles that indicate points with equal transportation costs. In order for these circles of locational indifference to mark boundaries between the zones of equal locational advantages, which he calls isodapanes, where the greatest locational advantages (i.e. the lowest costs of location) are in the center of such a scheme, Weber also included other locational factors which may substitute transportation costs with possible savings on other locational factors. The change in the point of view caused by the development of industrialization and its interdependence with the development of tertiary services has caused the market to be perceived as a field bordered by concentric

1234 EP 2017 (64) 3 (1231-1248)
Goran Paunovic, Dragan Solesa, Marko Ivanis
circles of locational indifference around the points which are suitable for the location of industrial facilities. The intertwining of these markets for different products leads to the analysis of economic regions or surrounding areas of the “central places”, which is subsequently developed in the theory of regional development (Milicevic, 1990).
Results indicate that the choice of location means a simple decision-making process and to provide a starting point towards a systematic dissection of the process (Chung-Hui et al., 2008).
Location of Production Systems
The complexity of the business system structure and the relationship with the surrounding area, changes in market demands, conditions for the provision of inputs, features of the production program, economic conditions, labor conditions, waste matter and other influences determine the location of new production systems, whereas the changes to the production programs, characteristics of the work process, frequency of technological changes and the effect of disorders necessitate an adjustment of the location of the existing production systems (Zelenovic, 2012). The process of location selection is determined by identifying the influential factors of objective and subjective character, which are different in intensity and direction of the action, their evaluation and selection of an optimal location. For the choice of the broader and narrower location we will apply dimensional analysis model based on the relationship between the two measurable locations.
Wm
mL
L
W
L
L
W
L
L
W
L
L
L
L
OO
OO
OO
OO
VVR
××
×
×
==
2
1
3
32
1
2
22
1
1
2
1
2
1 ...
Where if R < 1, the location L1 represents a better solution, i.e. if R > 1, the location L2 represents a better solution. The quality of location’s favorability grade depends on the quality of data which determine the values (Oi) and the degree of goodness of the value of the relative importance – wi factor’s effect (Zelenovic, 2012).
Case study - overview of methodological research procedure
The procedure of location selection takes place in five steps: problem identification through a choice of a favorable location in terms of stability and development of production, identification of influential factors in the choice of a broader and narrower location, evaluation of influential factors, such as subjective and objective effects, as well as the critical effects which condition a certain solution, evaluation of the relative importance of influential factors, where the least important factor has the lowest value and the choice of location.

1235EP 2017 (64) 3 (1231-1248)
SITE SELECTION OF THE CONSTRUCTION OF THE SYSTEM FOR THE PRODUCTION OF PASTA IN AP VOJVODINA
Places in the area of broader location
The choice of a broader location for the construction of a production system for pastry production is in the territory of Vojvodina, which is a region rich in raw material. This phase of research involves “library work” through the use of tertiary sources, “field work” in the sense of using local data5 and the production of a preliminary draft of research through the analysis of the factors, their evaluation, and assessment of the relative importance which will enable the analysis of the location selection by using the dimensional model. The Municipality of Titel and the Municipality of Vrbas will be considered for the broader location.
Figure 1. Representation of the Municipality of Vrbas
Source: Directorate for Construction of Vrbas
A favorable geographic and transport position enables the Municipality of Vrbas to become a significant center of the central Bačka. Vrbas is at the crossroads of major routes for different modes of transport, thus connecting it with other parts of Vojvodina. An abundance of natural resources and a favorable climate form the basis for the development of agriculture and food industry, which has a long tradition in the Municipality of Vrbas.
The Municipality of Vrbas has an educated and motivated workforce, with a strong entrepreneurial potential. The development of the infrastructure, the financial sector and public institutions classify Vrbas as one of the most important centers in Serbia. Pollution of the Great Bačka Canal is one of the major weaknesses of the municipality, which in addition to the impact on the environment, prevents the development of river
5 By using local data, Official Gazzettes of the municipalities, the special plan etc.
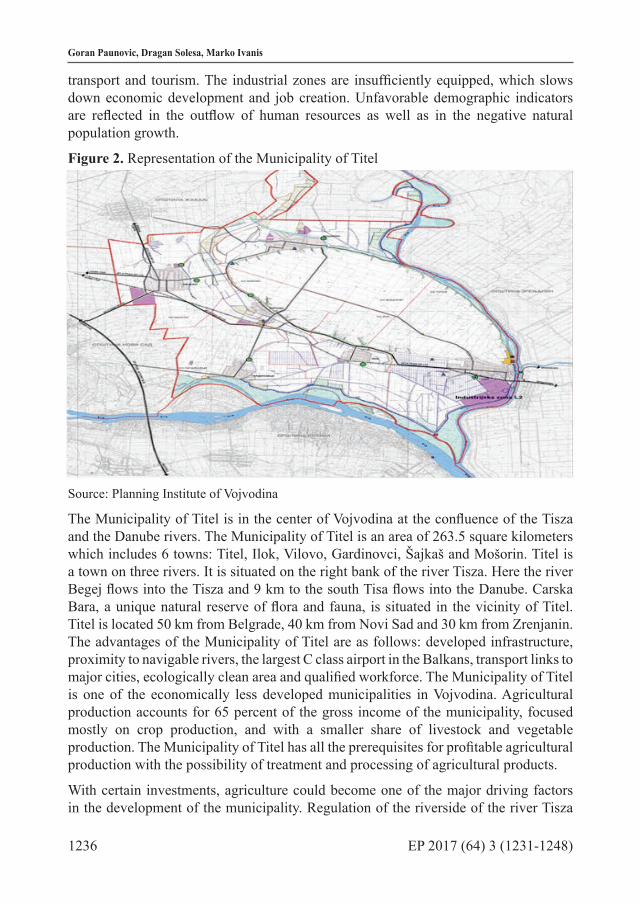
1236 EP 2017 (64) 3 (1231-1248)
Goran Paunovic, Dragan Solesa, Marko Ivanis
transport and tourism. The industrial zones are insufficiently equipped, which slows down economic development and job creation. Unfavorable demographic indicators are reflected in the outflow of human resources as well as in the negative natural population growth.
Figure 2. Representation of the Municipality of Titel
Source: Planning Institute of Vojvodina
The Municipality of Titel is in the center of Vojvodina at the confluence of the Tisza and the Danube rivers. The Municipality of Titel is an area of 263.5 square kilometers which includes 6 towns: Titel, Ilok, Vilovo, Gardinovci, Šajkaš and Mošorin. Titel is a town on three rivers. It is situated on the right bank of the river Tisza. Here the river Begej flows into the Tisza and 9 km to the south Tisa flows into the Danube. Carska Bara, a unique natural reserve of flora and fauna, is situated in the vicinity of Titel. Titel is located 50 km from Belgrade, 40 km from Novi Sad and 30 km from Zrenjanin. The advantages of the Municipality of Titel are as follows: developed infrastructure, proximity to navigable rivers, the largest C class airport in the Balkans, transport links to major cities, ecologically clean area and qualified workforce. The Municipality of Titel is one of the economically less developed municipalities in Vojvodina. Agricultural production accounts for 65 percent of the gross income of the municipality, focused mostly on crop production, and with a smaller share of livestock and vegetable production. The Municipality of Titel has all the prerequisites for profitable agricultural production with the possibility of treatment and processing of agricultural products.
With certain investments, agriculture could become one of the major driving factors in the development of the municipality. Regulation of the riverside of the river Tisza

1237EP 2017 (64) 3 (1231-1248)
SITE SELECTION OF THE CONSTRUCTION OF THE SYSTEM FOR THE PRODUCTION OF PASTA IN AP VOJVODINA
in Titel is being planned, where a cargo port Luka Titel will be built according to the project solution. The industrial zones, covering the area of about 300 ha, can be found on several locations and are connected with roads, railway and navigable rivers with large centers such as Belgrade, Novi Sad and Zrenjanin. The free industrial zone at the site of block 65 covers the area of 50 ha and is equipped with complete infrastructure.
Choosing a place in the broader location
Broader location as an area that meets the basic requirements for the construction and development of a production system is conditioned by the characteristics of the production program. The municipalities of Vrbas and Titel will be considered as the broader location for the construction of a business system for the production of pastry in Vojvodina because these municipalities have a developed agricultural production. Among the range of significant factors for the choice of a broader location the following factors are distinguished:
• Source location is important since wheat is the main raw material for pastry production. The price of wheat depends on the yield and the demand in the world market and it is currently between 17-18 dinars per kilogram. Both locations are situated in a favorable area, so this factor will not be discussed.
• Social stability and legal certainty is a significant factor in the selection of a location on the international level. Presuming that the investor opted for the area of the broader location, this factor will not be discussed.
• Destination location is determined by the structure of a consumer network, terms and time of delivery and high transportation costs. The price of pastry per kilogram ranges from 100 to 400 dinars. During storage and transport there is no need for specific storage conditions since it does not belong to perishable goods. Based on the parameters such as small transport costs and a high price of the product, the destination location is not of great significance, but from the standpoint of access to major roads - terms and time of delivery, this factor is of importance. One of the characteristics of the Municipality of Titel is that the II category public road no.110 connects all the towns and villages with the center of the Municipality of Titel and the surrounding area. This area is located near the highway. However, a segment of the II category public road no. 122 has not been built, on the section from Šajkaš to the highway even though it represents a very important road that reduces the trajectory of movement of all vehicles which would use the II category public road no.122 (Planning Institute of Vojvodina, 2005).
• With regard to the development of the road network, Vrbas is at the top level in the area of Vojvodina. There is the E-70 highway, the I category public road (arterial) as well as the union of the II category public roads (regional roads) which enable good communication with the surrounding area (Planning Institute of Vojvodina, 2005).

1238 EP 2017 (64) 3 (1231-1248)
Goran Paunovic, Dragan Solesa, Marko Ivanis
• Availability of traffic (destination location) for the location L1 is not a factor of importance because this area has a constructed road infrastructure. It is an important factor for the location L2 because of the underdeveloped road network.
• W6= 3. According to the detailed regulation plan, the location L1 has a very good road network, so the value of the subjective factor is 1. For the location L2, the factor is of higher importance because a segment of the II category public road, which would connect it to the highway, has not been built, so the value of the subjective factor is 4.
• Energy, water and fuel are of a great importance for the choice of the location of the production system for pastry production since drinking water is used in the production process. For the location L1 this factor is of minor importance because centralized urban water supply systems are developed and water is of good quality. For the location of L2 this factor is important due to the reasons connected to the exploitation of water from artesian aquifers. The water from these aquifers contains a higher quantity of humic substances (mostly yellow) and often with illegal quantity of some microelements (arsenic) (Strategy of water supply and water protection in the AP of Vojvodina, 2009).
• W=5. For the location L1, the factor is of minor importance because of the good water quality so the value of the subjective factor is 2. For the location L2, the factor is of higher importance because of the poor quality of water, so the value of the subjective factor is 4.
• Participants in the working processes have an impact on the choice of location. Both locations are characterized by high unemployment. Decrease in the number of employees has caused the fall of GDP, which is 1.7% per annum in the Municipality of Vrbas. For these reasons, the Municipality of Vrbas has adopted the Action Plan for Employment (Official Gazette of the Municipality of Vrbas No.1 / 2014). The same situation is the case with the Municipality of Titel, which is one of the economically underdeveloped municipalities in Vojvodina. Due to the high rate of unemployment in both municipalities, the factor will not be discussed.
Table 1. Tabular representation of the municipalities of Vrbas and Titel
Number of inhabitants
Monthly net income
Number of the employed
Number of theunemployed
Unemployment rate
Monthly gross income
Municipality of Vrbas 41950 324 9258 7606 44% 451
6 W- relative importance for “determining the relative importance of the factors is in the range from 1 to 10, where the critical factor receives the importance of 10, and the least important factor, the value of 1”.
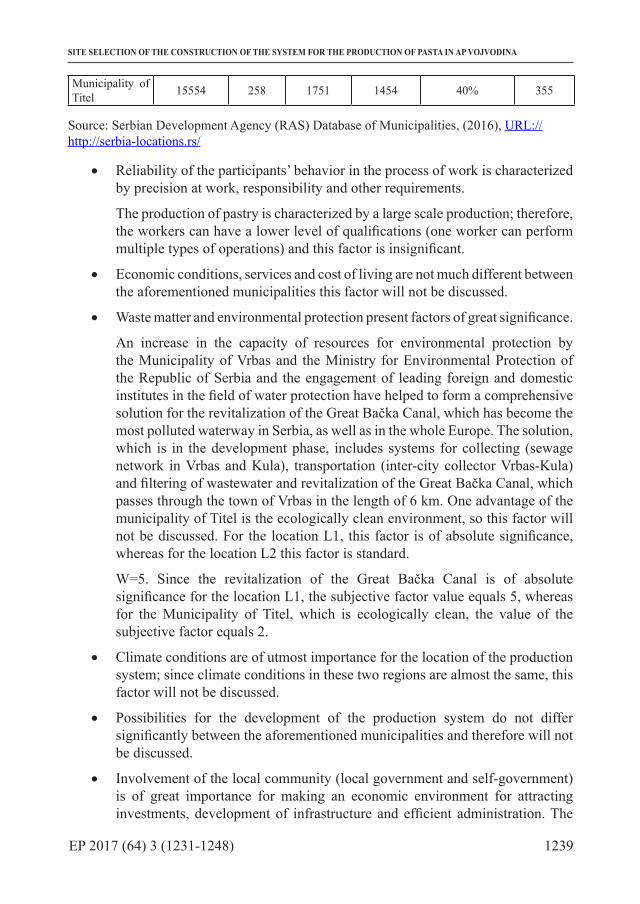
1239EP 2017 (64) 3 (1231-1248)
SITE SELECTION OF THE CONSTRUCTION OF THE SYSTEM FOR THE PRODUCTION OF PASTA IN AP VOJVODINA
Municipality of Titel 15554 258 1751 1454 40% 355
Source: Serbian Development Agency (RAS) Database of Municipalities, (2016), URL://http://serbia-locations.rs/
• Reliability of the participants’ behavior in the process of work is characterized by precision at work, responsibility and other requirements.
The production of pastry is characterized by a large scale production; therefore, the workers can have a lower level of qualifications (one worker can perform multiple types of operations) and this factor is insignificant.
• Economic conditions, services and cost of living are not much different between the aforementioned municipalities this factor will not be discussed.
• Waste matter and environmental protection present factors of great significance.
An increase in the capacity of resources for environmental protection by the Municipality of Vrbas and the Ministry for Environmental Protection of the Republic of Serbia and the engagement of leading foreign and domestic institutes in the field of water protection have helped to form a comprehensive solution for the revitalization of the Great Bačka Canal, which has become the most polluted waterway in Serbia, as well as in the whole Europe. The solution, which is in the development phase, includes systems for collecting (sewage network in Vrbas and Kula), transportation (inter-city collector Vrbas-Kula) and filtering of wastewater and revitalization of the Great Bačka Canal, which passes through the town of Vrbas in the length of 6 km. One advantage of the municipality of Titel is the ecologically clean environment, so this factor will not be discussed. For the location L1, this factor is of absolute significance, whereas for the location L2 this factor is standard.
W=5. Since the revitalization of the Great Bačka Canal is of absolute significance for the location L1, the subjective factor value equals 5, whereas for the Municipality of Titel, which is ecologically clean, the value of the subjective factor equals 2.
• Climate conditions are of utmost importance for the location of the production system; since climate conditions in these two regions are almost the same, this factor will not be discussed.
• Possibilities for the development of the production system do not differ significantly between the aforementioned municipalities and therefore will not be discussed.
• Involvement of the local community (local government and self-government) is of great importance for making an economic environment for attracting investments, development of infrastructure and efficient administration. The
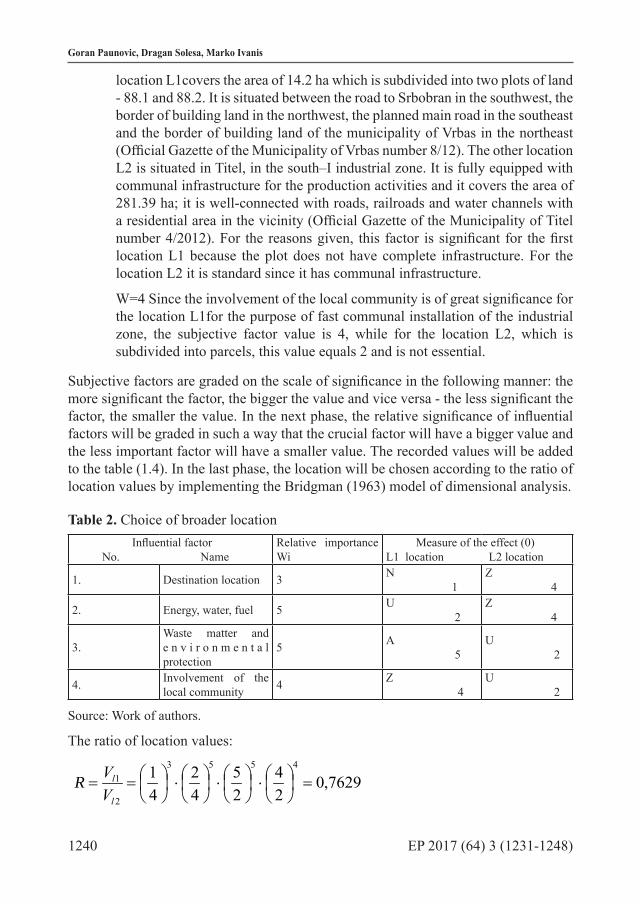
1240 EP 2017 (64) 3 (1231-1248)
Goran Paunovic, Dragan Solesa, Marko Ivanis
location L1covers the area of 14.2 ha which is subdivided into two plots of land - 88.1 and 88.2. It is situated between the road to Srbobran in the southwest, the border of building land in the northwest, the planned main road in the southeast and the border of building land of the municipality of Vrbas in the northeast (Official Gazette of the Municipality of Vrbas number 8/12). The other location L2 is situated in Titel, in the south–I industrial zone. It is fully equipped with communal infrastructure for the production activities and it covers the area of 281.39 ha; it is well-connected with roads, railroads and water channels with a residential area in the vicinity (Official Gazette of the Municipality of Titel number 4/2012). For the reasons given, this factor is significant for the first location L1 because the plot does not have complete infrastructure. For the location L2 it is standard since it has communal infrastructure.
W=4 Since the involvement of the local community is of great significance for the location L1for the purpose of fast communal installation of the industrial zone, the subjective factor value is 4, while for the location L2, which is subdivided into parcels, this value equals 2 and is not essential.
Subjective factors are graded on the scale of significance in the following manner: the more significant the factor, the bigger the value and vice versa - the less significant the factor, the smaller the value. In the next phase, the relative significance of influential factors will be graded in such a way that the crucial factor will have a bigger value and the less important factor will have a smaller value. The recorded values will be added to the table (1.4). In the last phase, the location will be chosen according to the ratio of location values by implementing the Bridgman (1963) model of dimensional analysis.
Table 2. Choice of broader location Influential factor No. Name
Relative importance Wi
Measure of the effect (0)L1 location L2 location
1. Destination location 3 N 1
Z 4
2. Energy, water, fuel 5 U 2
Z 4
3.Waste matter and e n v i r o n m e n t a l protection
5 A 5
U 2
4. Involvement of the local community 4 Z
4U 2
Source: Work of authors.
The ratio of location values:
7629,024
25
42
41 4553
2
1 =
⋅
⋅
⋅
==
l
l
VVR

1241EP 2017 (64) 3 (1231-1248)
SITE SELECTION OF THE CONSTRUCTION OF THE SYSTEM FOR THE PRODUCTION OF PASTA IN AP VOJVODINA
From which we conclude that location L1 presents a more favorable solution according to given conditions.
The results of the study of factors which influence the choice of broader location
The locations L1 and L2 have their advantages. The location L1has a better road access according to the urban development scheme, the possibilities for expansion are favorable and the quality of water is better than on the location L2 which presents an important parameter since the production of pastry requires good water quality. The location L2 has cheaper building land as well as complete communal infrastructure. Having evaluated the effects for the choice of broader location, the location L1 is found to be more favorable for the construction of the pastry production system, which gives us a good foundation to further analyze the factors for the selection of a more precise location - the exact place for the construction of the production system on the territory of the Municipality of Vrbas.
The selection of a more precise location for the construction of the pastry production system in the Municipality of Vrbas
The precise location is a place on the territory of the broader location which meets the requirements for the process of work and alleviates limitations posed by the environment (Zelenovic, 2012).
Figure 3. Location L1
Source: Directorate for Construction of Vrbas
1242 EP 2017 (64) 3 (1231-1248)
Goran Paunovic, Dragan Solesa, Marko Ivanis
The first location (L1) covers the area of 14.2 ha and it includes the block 88 which is divided into two plots, 88.1 and 88.2. It is situated between the Srbobran road in the southwest, the border of building land in the northwest, planned main road in the southeast and the border of construction land of the Vrbas town in the northeast. The plan includes routes, directions of networks for water supply, and the reserved building land for public purpose, corridors of networks for water supply which will include the future network according to the plan. Until the planned waterworks have been built, in specific cases the need for water supply in the area planned for other purposes can be fulfilled by excavating water wells on the users’ parcels. In the area included in the plan, there is no sewage network for draining waste and atmospheric water. A separating type of sewage network should be considered for these blocks to collect fecal waste water on one channel and atmospheric water in the other channel. The block 88 would be supplied with electrical energy from a new RP 20kV source ‘Srbobran Road’. The plan has been developed for the 20kV cable line to be set on public land which will provide power supply for blocks 88 and 96. The construction of heating system was not planned. The consumers’ requirements for heating energy will be satisfied by a distributive natural gas system or using other, individual sources of energy depending on the required capacity. This area will be completely integrated into Vrbas telecommunication system (Directorate for Construction Vrbas, 2012).
Figure 4. Location
Source: Google Earth

1243EP 2017 (64) 3 (1231-1248)
SITE SELECTION OF THE CONSTRUCTION OF THE SYSTEM FOR THE PRODUCTION OF PASTA IN AP VOJVODINA
The second location (L2) covers the area of 0.75 ha and is situated in the settlement at the end of Ivana Milutinovića Street in the 4th Industrial zone, along the road to Novi Sad. The price of land is 1200 dinars per square meter. The plot has water, electricity and telephone installations. The disadvantage of this parcel is the fact that it is located in the residential area7.
• The size of the area is of great importance for the selection of location for the production system. The location L2 is situated on the area of 7500 square meters which is insufficient for a large scale production; if we take Danubius for example, its facilities cover the area of 10520 square meters, not counting the silos with 6800t capacity. The Indonesian Company “IndoAdriatic Industry” spans over the 5 ha parcel and is in the process of building of the production system. The location L1 is in the area of two sub-plots 88.1 and 88.2 with the total of 14.2 ha which, apart from the establishment of the working units, provides the possibilities for expansion, as well as for the construction of other facilities such as for sports and recreation, green areas and the like8. This factor is insignificant for the location L1 for the given reasons, while it is significant for location L2 because of the aforementioned limitations.
W=4 The location L1spans over a large area so this factor is of smaller importance which makes the subjective factor value 1. The location L2 does not include the area which would provide a possibility for expansion of production systems and potential additional facilities so the subjective factor value here is 5.
• Residential zones are determined by the distance between the residential area and the location of the production system. Since both locations are in the direct vicinity of the residential zone, this factor will not be discussed.
• Available communication is of great importance for the selection of exact location from the perspective of distance of the given location from available communication as well as the possibility for the construction of an industrial railroad. The location L1 is situated between the Srbobran road in the southwest, the border of building land in the northwest, the planned main road in the southeast and the border of building land of the Vrbas town in the northeast. Because of its favorable position and good connections this factor is standard. The location L2 is situated near the road to Novi Sad in the residential area, so this factor is necessary since the residential area is not a suitable place for a large scale industrial production.
W=3 The location L1 is well connected with main roads and it is not situated in a residential area so this factor is less important and the subjective factor
7 http://www.gohome.rs/nekretnine+vrbas 8 Construction of the production system can be on one of the two sub-plots or a part of the
subplot (88.1, 88.2), depending on the size of the production facility.
1244 EP 2017 (64) 3 (1231-1248)
Goran Paunovic, Dragan Solesa, Marko Ivanis
value is 2. The location L2 is situated in the vicinity of the road to Novi Sad in a residential area so this factor is more important and the subjective factor value is 3.
• The climate is very important for the selection of the location for the production system. The direction and intensity of air currents must be studied in detail, especially for the production systems which cause pollution to the environment. Therefore, this factor could be important. For the location L1, this factor is standard since it is situated outside the residential area. For the location L2, this factor is necessary because this plot is in a residential area.
W=3 The location L1 is situated outside the residential area so the subjective factor value is 2. For the location L2, the subjective factor value is 3 because the parcel is located in the residential area.
• Price of land is important for the choice of both locations. This factor will be expressed in financial units by comparing the available size of the plot L2 with the given price per square meter. “The recommendation is that the proportion of the built production and supporting area is 30 to 40 percent of the total area, so there is the possibility of expanding the system” (Vranjes et al., 2002).
L19: 7500m2 x 1,010.20 din = 7,576,500.00 din
L210: 7500m2 x 1,200.00 din = 9,000,000.00 din
W=1 This factor is equal because the difference in price is approximate to equipping the L1 plot.
• Noise and radiation present specific factors for the selection of the location for the production system. For the location L1, this factor is standard because it is situated in the industrial zone while for the location L2 it is significant because it is situated in a residential area.
W=3 The location L1is situated in the industrial zone where other production systems which produce noise can also be found so this factor is not significant and the subjective factor value is 2.
The location L2 is situated in a residential area where this factor is of bigger significance and the subjective factor value here is 4.
• Underground water and availability of services present factors of significance; these factors will not be discussed since they are equal at both locations.
For the purpose of selection of the location for the construction of the production system, all significant factors which affect the quality of choice have been taken
9 Price of land for location L1 published in the Official Gazette of the Municipality of Vrbas No. 9/14
10 Price of land for location L2, http://www.gohome.rs/nekretnine+vrbas

1245EP 2017 (64) 3 (1231-1248)
SITE SELECTION OF THE CONSTRUCTION OF THE SYSTEM FOR THE PRODUCTION OF PASTA IN AP VOJVODINA
into account. The influential factors such as residential areas, underground water and availability of services have not been evaluated since they are equal on both locations. Significant factors for the quality of choice such as area size, availability of communication, the climate, price of land, noise and radiation have been considered and evaluated. The values of these significant factors are given in the (Fig. 7) table. Financial value of the price of facility is equal assuming the fact that the investor is aware of the size and capacity of production, so the cost of construction on both locations would be the same.
Table 3. Choice of a narrower locationSignificant factorNo. Name
R e l a t i v e significance Wi
Measure of the effect (O)L1 location L2 location
1. Price of land(din) 1 7,576,500 9,000,000
2. Price of facility(din) 1 126,000,000 126,000,000
3. The climate(points) 3
U 2
P 3
4.A v a i l a b l e c o m m u n i c a t i o n s (points) 3
U 2
P 3
5. Noise and radiation(points) 3
U 2
Z 4
6. Area size(points) 4
N 1
A 5
Source: Work of authors
Location-value ratio
00001478,051
42
32
32
000.000.126000.000.126
000.000.9500.576.7 433311
2
1 =
⋅
⋅
⋅
⋅
⋅
==
l
l
VVR
Which concludes that the location L1is more favorable for the given conditions.
The results of the study of factors which affect the selection of the exact location
Despite the unfinished communal infrastructure, the location L1 presents a more favorable solution than the L2 location because it is situated in the industrial zone which provides the possibility for expansion of production capacity, it has a better road access according to the town planning scheme, the noise has no significant effect since the location is outside the residential area. Along with fast and efficient municipal administration, this location presents a long-term and quality solution.
1246 EP 2017 (64) 3 (1231-1248)
Goran Paunovic, Dragan Solesa, Marko Ivanis
Conclusion
The territory of the AP of Vojvodina, apart from its favorable geographic location, abounds in diverse regional structures and resources which provide good conditions for economic development and high standard of living. Favorable natural conditions and constructed economic capacities are not evenly distributed in all areas. As a result, conditions for future economic development are not equal. In the process of planning, arrangement and use of space, the activities should be especially directed towards valorization of natural resources in less developed areas and making a better economic and social infrastructure in order to compensate for regional differences in economic development. One of the main characteristics of the area is the fact that the economy is not synchronized with European and international norms, with industrial products which are not competitive enough, as well as a high deficiency in the trade balance. Unequal development has caused the demographic drain of rural areas and high polarization. For the industrial and economic development in general, it is necessary to raise the competitiveness, which means that the idea of cheap and underqualified labor and natural resources as bases for development must be reconsidered and abandoned. The development must be based on technological revitalization, competitive production with fully integrated sophisticated technological solutions. The studies of factors which affect the choice of a narrower location are related to certain chronological analyses of the production system. The elements relevant to the process of selecting the location for the production system have been determined based on a systematically oriented approach. The complexity of structures of business system and the relations with the environment, changes in market demand, conditions of procurement of input values, characteristics of the production program, economic conditions, work conditions, waste matter and other factors present the parameters which have been taken into account in the research in order to select the location for the production system. Having analyzed the areas of the municipalities of Vrbas and Titel as well as the specific features of these two locations, the conclusion has been reached that the Municipality of Vrbas presents a more favorable solution because of its good traffic infrastructure as well as water quality, which is a significant factor since drinking water is used in the production process. Possibility for expansion, as well as noise and radiation as factors have influenced the choice of the narrower location to be block 88 which is subdivided into two plots , 88.1and 88.2. Objective and subjective factors, their evaluation on the basis of data quality and their implementation in the dimensional analysis model have helped to make a good proper selection of the location for the construction of the production system on the territory of the AP of Vojvodina.
Literature
1. Bridgman, P.W. (1963): Dimensional Analysis, Connecticut, Yale University Press, New Haven and London.
2. Capello, R. (2011): Location, regional growth and local development theories. Aestimum, Vol. 58, pp. 1-25.
1247EP 2017 (64) 3 (1231-1248)
SITE SELECTION OF THE CONSTRUCTION OF THE SYSTEM FOR THE PRODUCTION OF PASTA IN AP VOJVODINA
3. Chung-Hui Y., Priyanka B., Ernst H., Lily Y. J., Yuh-Nung J. (2008): Drosophila egg-laying site selection as a system to study simple decision-making processes, Science, Vol. 319 Issue 5870, pp. 1679-1683.
4. Direkcija za izgradnju Vrbasa (2012): Plan detaljne regulacije radne zone u Vrbasu u blokovima 88, 89, 96, 97, 98, Vrbas. (available at: http://www.vrbas.net/e-uprava-vrbas/službenilist)
5. Izvršno veće AP Vojvodine (2006): Program privrednog razvoja AP Vojvodine-novelirana ex post analiza privrede AP Vojvodine, Novi Sad, (available at: http://vojvodina-rra.rs/studije-analize.html)
6. JP Zavod za urbanizam Vojvodine (2005): Strategija razvoja i kategorizacije putne mreže u Vojvodini, Novi Sad, (available at: http://www.zavurbvo.co.rs/doc./studije/)
7. JP Zavod za urbanizam Vojvodine (2008): Prostorni plan opštine Titel, Službeni list 17/08, Novi Sad, (available at: http://www.zavurbvo.co.rs/prostorni.php)
8. Korpela, J., Tuominen, M. (1996): A decision aid in warehouse site selection, International Journal of Production Economics, Vol. 45, Issues 1–3, pp. 169-180.
9. Milićević, G. (1990): Urbana ekonomika, Ekonomski fakultet, Beograd. 10. Nekretnine Vrbas, (available at:
http://www.gohome.rs/nekretnine+vrbas) 11. Novković, N., Mutavdžić, B. (2009-2010): Konkurentnost poljoprivrede Vojvodine,
CESS, Novi Sad. 12. Pokrajinski sekretarijat za nauku i tehnološki razvoj (2009): Strategija vodosnabdevanja
i zaštite voda u AP Vojvodini, (available at:http://www.ekovrb.vojvodina.gov.rs/)
13. Pravilnik o kvalitetu žita, mlinskih i pekarskih proizvoda, testenina i brzo smrznutih testa (2013): Official Gazette of the RS 43/2013, Beograd, (available at: http://www.tehnologijahrane.com/pravilnik/pravilnik-kvalitetu-ita-01)
14. Ras baza opština (2016), (available at: http://serbia-location.rs/) 15. Rikalovic, A., Cosic, I., Labati, R. D., Piuri, V. (2015): A Comprehensive Method for
Industrial Site Selection: The Macro-Location Analysis. IEEE Systems Journal.16. Official Gazette of municipality of Titel, 4/2012. (available at: http://www.opstinatitel.rs)17. Official Gazette of municipality of Vrbas, 8/12, 9/12, 9/14, (available at:
http://www.vrbas.net/e-uprava-vrbas/službenilist) 18. Univerzitet u Novom Sadu, Prirodno matematički fakultet, departman za hemiju,
(2009): Strategija vodosnabdevanja i zaštite voda u AP Vojvodini, (available at: www.ekovrb.vojvodina.gov.rs/)
19. Vranješ, B., Jerbić, B., Kunica, Z. (2002): Projektiranje proizvodnih sustava, Školska knjiga, Zagreb.
1248 EP 2017 (64) 3 (1231-1248)
Goran Paunovic, Dragan Solesa, Marko Ivanis
20. Zelenović, D. (2012): Projektovanje proizvodnih sistema, Fakultet tehničkih nauka, Novi Sad.
21. Weber, A. (1990): Ueber der Standort der Industrien, Tübingen, J.C.B. Mohr (Paul Siebeck).
IZBOR LOKACIJE ZA IZGRADNJU POSLOVNOG SISTEMA ZA PROIZVODNJU TESTENINA U AP VOJVODINI
Goran Paunovic11, Dragan Solesa12, Marko Ivanis13
Rezime
U sve većoj trci za tržišnim udelom kompanije, preduzeća svoje proizvodne i poslovne objekte geografski pozicioniraju poštujući nova pravila poslovanja. Da bi kompanija opstala na tržištu, potrebno je da maksimizira profit, minimizira troškove i zadrži dobar kvalitet i konstantno ga unapređuje. Izbor lokacije predstavlja jednu od vitalnih odluka u procesu izgradnje proizvodnog sistema, iako je problem izbora lokacije vezan za određene vremenske preseke u životu datog proizvodnog sistema, potreba istraživanja uticaja lokacije stalna je u vremenu.
Cilj istraživačkog rada je u metodološkom pristupu izbora kriterijuma šire i uže lokacije za izgradnju proizvodnog sistema za proizvodnju testenina na teritoriji Vojvodine kao područja bogate sirovinske baze. Poljoprivredna i prehrambrena industrija su privredne grane sa dugom tradicijom, izuzetnim potencijalom u jačanju ekonomskih performasi privrede Vojvodine. Vrednovanje kriterijuma i njihova primena u modelu dimenzione analize omogućiće dobar odabir lokacije za izgradnju poslovnog sistema za proizvodnju testenina.
Ključne reči: lokacija preduzeća, šira lokacija, uža lokacija.
11 Goran Paunović M.Sc., Univerzitet Privredna akademija u Novom Sadu, Fakultet za ekonomiju i inženjerski menadžment u Novom Sadu, Cvećarska ulica br. 2, 21 000 Novi Sad, Srbija, Telefon: +381 21 400 484, E-Mail: [email protected]
12 Redovni profesor, dr Dragan Solesa, Univerzitet Privredna akademija u Novom Sadu, Fakultet za ekonomiju i inženjerski menadžment u Novom Sadu, Cvećarska ulica br. 2, 21 000 Novi Sad, Srbija, Telefon: +381 21 400 484, E-mail: [email protected]
13 Vanredni profesor, dr Marko Ivaniš, Univerzitet Privredna akademija u Novom Sadu, Fakultet za ekonomiju i inženjerski menadžment u Novom Sadu, Cvećarska ulica br. 2, 21 000 Novi Sad, Srbija, Telefon: +381 21 400 484, E-mail: [email protected]

1249
Economics of Agriculture 3/2017UDC: 502.3:613.15]:332.14(497.11)
EP 2017 (64) 3 (1249-1262)
CORRELATION BETWEEN THE AIR QUALITY INDEX SAQI_11 AND SUSTAINABLE RURAL DEVELOPMENT IN THE REPUBLIC OF SERBIA
Review article
CORRELATION BETWEEN THE AIR QUALITY INDEX SAQI_11 AND SUSTAINABLE RURAL DEVELOPMENT IN THE REPUBLIC OF
SERBIA
Milan Počuča1, Jelena Matijasevic - Obradovic2, Bojana Draskovic3
Abstract
The air quality, in general, has an important impact on the development of rural areas, and sustainable rural development. Air quality is a very important parameter both for sustainable rural development and for life on earth in general. In this context, it is interesting to analyze the correlation between sustainable rural development and the state of air quality dependent on the amount of pollutant concentration, expressed by the air quality index SAQI_11. The main attention in the research was focused on the analysis of the numerical values of pollutants concentrations, for the period of averaging - 24h and the calendar year, in accordance with the classes of the Air Quality Index SAQI_11, and the analysis of the air quality trend by zones and agglomerations for the period 2012-2015. Conclusions on air quality, SAQI_11 air quality index classes, and on correlation with sustainable rural development were carried out for agglomerations “Novi Sad”, “Belgrade”, “Pančevo”, “Smederevo”, “Bor”, “Kosjerić”, “Uziče” and “Niš “.
Key words: air quality, SAQI_11, pollutants, sustainable rural development.
JEL: Q01, Q15, Q56, O13, O18
Introduction
The concept of sustainable rural development began to be applied in the eighties of the last century. On its basis, it is interactively connected and conditioned by the trend of reducing the poverty of underdeveloped regions on the world level.
According to some authors, rural poverty, not developmental disparities, conditions the necessity of rural development policy. These authors see rural underdevelopment as the basic factor of total underdevelopment of less developed countries (Bogdanov, 2007). As
1 Milan Počuča Ph.D., Full professor, Faculty of Law for Commerce and Judiciary in Novi Sad, Geri Karolja Street no. 1, 21000Novi Sad, Serbia, E-mail: [email protected]
2 Jelena Matijašević-Obradović Ph.D., Associate professor, Faculty of Law for Commerce and Judiciary in Novi Sad, Geri Karolja Street no. 1, 21000Novi Sad, Serbia, E-mail: [email protected]
3 Bojana Drašković Ph.D., Assistant professor, Faculty for construction menagement, Cara Dušana Street no. 62-64, Belgrade, Serbia, E-mail: [email protected]

1250 EP 2017 (64) 3 (1249-1262)
Milan Počuča, Jelena Matijasevic - Obradovic, Bojana Draskovic
part of the promotion of sustainable agriculture and rural development, emphasis is placed primarily on environment, rural development, communication in development, education, local population (local participants), science and technology (Simonović, 2008).
Rural development was created as a response to problems related to intra and inter regional inequalities in the level of economic development and served as a (appropriate) concept for more complex valorisation of the development potentials of rural areas (Bogdanov, 2003). Bearing in mind that as many as 75% of the world’s poor live in rural areas and more than one third of rural areas are in arid and semiarid regions (Chaudhry, Gupta, 2010), it can certainly be assumed that “by introducing new non-agricultural activities (especially rural tourism), additional income can be created which will enable improvement of the quality of life and stopping the demographic decline in rural areas” (Popesku, 2008). Also, rural tourism is expected to act as one of the tools for sustainable rural development (Ivolga, 2014).
Rural areas in Serbia occupy about 85% of the territory inhabited by more than half of the total population (55%), with a population density of 63 inhabitants per square kilometre (according to the OECD, the area of up to 150 inhabitants per km2 is considered rural). Most of the country’s natural resources (agricultural land, forests, water) with rich ecosystems and biodiversity are located in rural areas. According to the Strategy of Agriculture and Rural Development of the Republic of Serbia for the period 2014-2024. (Official Gazette of the Republic of Serbia, No. 85/2014), the positive shift made in organic production, wine production, products with geographical origin and agro tourism in previous years are emphasized.
Rural development on its basis includes the agrarian, but also the non-agrarian sector in rural areas, thus encompassing every vital component of the development of rural areas (economic, environmental, social, cultural, demographic, etc.). According to Bogdanov, the need for rural politics, equally in the developed and underdeveloped countries, stems from the different nature of the impact and intensity of poverty in rural and urban areas, which causes consequences in terms of degradation of the natural environment and negative economic and social implications on the metropolitan areas (Bogdanov, 2007). Generally, air quality has an important impact on development of rural areas, as well as on sustainable rural development. In this context, it is interesting to analyze the correlation between sustainable rural development and the state of air quality dependent on the amount of pollutant concentration, expressed by the air quality index SAQI_11.
Accordingly, in the work, following the relevant theoretical views, within the research work, attention will be focused on key issues in the field of air quality impacts caused by the concentration of pollutants in sustainable rural development. The main attention in the research will be focused on the analysis of numerical values of pollutants concentrations, for the period of averaging - 24h and the calendar year, according to the classes of the Air Quality Index SAQI_11, and on the analysis of the air quality trend by zones and agglomerations for the period 2012-2015.

1251EP 2017 (64) 3 (1249-1262)
CORRELATION BETWEEN THE AIR QUALITY INDEX SAQI_11 AND SUSTAINABLE RURAL DEVELOPMENT IN THE REPUBLIC OF SERBIA
Literature review
One of the important features of modern society is focus on sustainable development (Šimkova, 2007). Sustainability can simply be described as continuing to improve human wellbeing, whilst not undermining the natural resource base on which future generations will have to depend (Adinyira, Oteng-Seifah, Adjei-Kumi, 2007). Sustainable development, as a modern development concept which harmonizes the social, economic and ecological interests of present and future generations, is very applicable in rural areas, which is confirmed both in theory and in practice, especially in developed countries (Ristić, 2013).
Rural tourism and agrotourism could lead a new relationship between environment, work and free time, in terms of sustainability of rural areas (Perotto, 1993; Fagioli, Diotallevi, Ciani, 2014). On the one hand tourism has a great impact on the development of rural areas, and on the other hand, the importance of tourism is reflected in the creation of markets for agricultural products, given that they are important inputs for hotels and restaurants (Ćirić, Počuča, Raičević, 2014). Ruralni turizam, as an essential factor in the revitalization and diversification of rural economy (Ristić, Vujičić, Leković, 2016), is based on the principles of sustainability and includes a range of activities and services that the rural population organize precisely on the basis of the elements which characterize these rural areas (Đorđević-Milošević, Milovanović, 2012). But, surely, agriculture, as the primary industry in rural areas, is the major (and often the only one) source of employment and income for rural people (Erokhin, 2014). Hence, rural development is considered as a complex mesh of networks in which resources are mobilized and in which the control of the process consists of interplay between local and external forces (Lowe, Murdoch, Ward, 1995; Papić, Bogdanov, 2015).
Rural areas are marked by a number of physical and socio-economic features including: low density of population and development, landscape predominated by open green spaces, “surface” economic activity mainly of agricultural and forestry functions, lifestyle of residents predetermined by affiliation to a small social group and identify and appearance of the population deeply rooted in distinctive peasant culture (Chmielinski, Chmielewska, 2015). Rural areas in Serbia are highly diverse in terms of natural endowments, economic, social and population characteristics. Diversity of rural areas is driven by natural resource endowments, cultural and historical heritage, as well as economic, social and demographic patterns (Papić, Bogdanov, 2015). Rural areas are usually associated with farmlands and farms, as well as a place to stay for a summer holiday or to go to for a weekend trip (Chmielinski, Chmielewska, 2015). Nowadays, predominant opinion is that a rural region represents a territorial unit with one or more small/middle-sized towns surrounded by a large area of open space, with a relatively low population density and regional economic structure, which reflects the situation of a certain labour market (Bogdanov, Stojanovic, 2006).
From its beginnings in economics and ecological thinking, sustainability has become a planning concept and has been widely applied in rural development (Adinyira et al., 2007). Most rural research and practice in Europe focus on endogenous relations (multi-functional agriculture, rural entrepreneurs, improved living conditions in rural areas, local amenities etc.) as the way of securing development or just a pleasant life for the actual inhabitants (Just,
1252 EP 2017 (64) 3 (1249-1262)
Milan Počuča, Jelena Matijasevic - Obradovic, Bojana Draskovic
2007). Rural sustainability is best attained through well-planned and properly implemented initiatives that address the social, physical and economic facets of the environment in an integrated and participatory approach (Sandham, Van Der Walt, 2004). Obviously, living and working in rural areas has always been connected with specific material and symbolical relations to nature (Molders, 2013; Milbourne, 2003; Castree, Braun, 2006). Popesku states that sustainable rural development includes the following principles: environmental, social, cultural and economic (Popesku, 2011). In other words, sustainable rural development means respect for the natural diversity of a destination (environmental principle), protection of the cultural diversity of the local community, and discouragement of the forms of tourism that contribute to social problems (social principles), the development of tourism characteristic for a particular area, and promotion of the unique characteristic of culture and the heritage of the area (cultural principles), stimulation of the employment of the local population, the prevention of the disappearance of the traditional vocations, as well as the promotion of the use and sale of local food products.
Simply put, rural development is about implementing a political, economic and social project attuned to a collective vision of the future of rural regions (Yves, 2005). So, according to Kačar, Curić, Ikić (2016), rural, and particularly local, development could be observed through the regional economy prism as well as from a point of view of multidiscipline rural studies, and not only trough basic economic development theories. It can be concluded that the sustainable development of rural tourism must be economically justified while preserving the natural, social and cultural characteristics of the tourist destination.Namely, the versatile rural development implies demographic reconstruction, the use of available resources for the production of healthy food, the development of non-agricultural activities, urbanization in terms of infrastructure development, education, culture and preservation of the ecological environment. Especially important is the concept of development of farm, small and medium enterprises, agro-production and agro-processing, rural tourism, service provision activities of business cooperatives and advisory services (Veselinović, Ignjatijević, 2013).
Methodology and data sources used
The subject of the analysis in the work is the key issues in the field of air quality impacts caused by the concentration of pollutants in sustainable rural development. The main attention in the research will be focused on analyzing the numerical values of concentrations of pollutants, for the period of averaging - 24h and the calendar year, according to the classes of the Air Quality Index SAQI_11.In the theoretical part of the work, the method of theoretical analysis of contents was primarily applied with the basic methods of concretization and specialization, while statistical and analytical-deductive methods were used in the research part, as well as the method of quantitative data analysis.
The survey is based on the official statistics of the Statistical Office of the Republic of Serbia and the Environmental Protection Agency of the Ministry of Agriculture and Environmental Protection.
1253EP 2017 (64) 3 (1249-1262)
CORRELATION BETWEEN THE AIR QUALITY INDEX SAQI_11 AND SUSTAINABLE RURAL DEVELOPMENT IN THE REPUBLIC OF SERBIA
Research results and discussion
In the context of previously stated attitudes, it can be said that sustainable development actually implies an integral view of the life and work of a modern person, while the indicators of sustainable development in general indicate the link between the economy, ecology and society of a particular community. According to Veljković, the essence of the concept of sustainable development is interaction between development and the environment and the mutual conditionality and complementarity of developmental and environmental protection policies that respect the laws of ecological systems (Veljković, 2017). Air quality is a very important parameter for both humans and the whole living world on earth. The air quality indicators are as follows: air temperature, direction and intensity of air currents, baseline level of ozone, nitrogen dioxide level, level, structure and size of fine particles, benzene level, level of other chemical substances, changes of stratospheric ozone and increase in ultraviolet radiation (Kokić Arsić, Milivojević, Savović, 2009). According to the National Strategy for Sustainable Development (Official Gazette of RS, No. 57/2008), the quality of ambient air in urban areas is conditioned by the emissions of SO2, NOx, SO, soot, powder, organic and inorganic materials derived from thermal power stations, industry, traffic, combustion in individual boiler rooms, etc. Large polluters are thermal power stations in Obrenovac, Kolubara and Kostolac, refineries in Pančevo and Novi Sad, chemical industry and metallurgical complexes located in Pančevo, Kruševac, Šabac, Bor and Smederevo. As a result of the concentration of petrochemical and refinery complexes and nitrogen, there is cumulative air pollution in Pančevo. The quality of air in urban areas is conditioned by the increase in the number of motor vehicles and industrial production, as well as the type and number of sources of pollution. Much air pollution comes from the use of gasoline with the addition of lead and diesel with a high sulphur percentage.
The effect of the greenhouse is related to the increase of CO2 and methane in the atmosphere, and the biggest polluters by sectors are: energy, agriculture, transport, industry (industrial processes), waste, changes in the use of land and forest - logging (Kokić Arsić et al., 2009).
In accordance with the Article 5 of the Law on Air Protection (Official Gazette of RS, No. 36/2009 and 10/2013), the Decree on the Determination of Zones and Agglomerations (Official Gazette of the Republic of Serbia, No. 58/11 and 98/12) on the territory of the Republic of Serbia have been determined three zones and eight agglomerations (Popović et al., 2016; Popović et al., 2015; Popović et al., 2014; Popović et al., 2013) : Zone: 1.) The “Serbia” zone, which includes the territory of the Republic of Serbia except the territory of the autonomous provinces, the city of Belgrade, the city of Niš, the city of Užice, the city of Smederevo, the municipality of Kosjerić and the municipality of Bor; 2.) “Vojvodina” zone, which includes the territory of the Autonomous Province of Vojvodina, except the territory of the cities of Novi Sad and Pančevo; 3.) The “Kosovo and Metohija” zone, which includes the territory of the Autonomous Province of Kosovo and Metohija. Agglomerations: 1.) Agglomeration “Belgrade” (territory of the city of Belgrade); 2.) Agglomeration “Novi Sad” (territory of the city of Novi Sad); 3.) Agglomeration “Niš” (the territory of the city of Niš); 4.) Agglomeration “Bor” (territory of Bor municipality); 5.) Agglomeration “Uzice” (territory of the city of Uzice); 6.) Agglomeration Kosjerić (territory of Kosjerić Municipality); 7.)
1254 EP 2017 (64) 3 (1249-1262)
Milan Počuča, Jelena Matijasevic - Obradovic, Bojana Draskovic
Agglomeration “Smederevo” (the territory of the city of Smederevo); 8.) Agglomeration “Pančevo” (the territory of the town of Pančevo).
The assessment of air quality, based on the measured concentrations of pollutants in the air, is carried out using the criteria for the assessment of air quality, in accordance with the Regulation on the conditions for monitoring and air quality requirements (Službeni glasnik RS, br, 11/2010, 75/2010 i 63/2013) (Popović et al., 2016).
In accordance with Article 3 of the Regulation on conditions for monitoring and air quality requirements (hereinafter: the Regulation), air quality requirements are, inter alia: The limit values of the level of pollutants in the air; The upper and lower limits for assessing the level of pollutants in the air; The limits of tolerance and tolerant values; Concentrations dangerous to human health; Critical levels of pollutants in the air, etc. Article 7 of the Regulation, regulates that the level of air pollution is monitored by measuring the concentrations for sulfur dioxide, nitrogen dioxide and nitrogen oxides, suspended particles (PM10, PM2.5), lead, benzene, carbon monoxide, terrestrial ozone, arsenic, cadmium, Nickel and benzo (a) pyrene in the air by instruments for automatic measurement and / or sampling and their analysis. Air quality monitoring is also carried out at basic rural locations outside the direct impact of significant sources of air pollution to provide at least minimum information on the total mass concentration and the chemical composition of suspended particles (PM2.5) based on the annual average (Article 9 of the Regulation). Boundary and tolerant values are the basis for: 1) air quality assessment; 2) division of zones and agglomerations into categories based on the level of air pollution; 3) air quality management (Article 15, paragraph 4 of the Regulation). Quality monitoring is carried out for the purpose of: activating protective measures in critical situations, assessing hazards for human health, assessing hazards for other elements of the environment, obtaining basic data for spatial planning, examining specific complaints of citizens (Kokić Arsić et al., 2009). The value interval of the concentration of pollutants from clean air to the limit value is a wide interval. Therefore, information that a concentration of pollutants is below the limit value is not always sufficiently precise (Jović, Knežević, Marić-Tanasković, Dimić, Cvetković, 2011). For a wider circle of users and the interested public, the option of a relative assessment, based on legal regulations, is more appropriate, which will characterize the state of air quality, depending on the amount of concentration of pollutants. For this type of assessment, the air quality index is applied (Jović et al., 2011). Therefore, in order to carry out the assessment of air quality, the air quality index is defined, defined by harmonization of EU domestic regulations in this field.
Since there is no uniquely defined AQI in EU regulations, the Air Quality Index SAQI_11 is defined in the Environmental Protection Agency. In the index of SAQI_11, part of the “AQI” designation is the usual indication for the air quality index, “S” denotes the national, Serbian version, and “11” indicates the year when the index is defined (Jović et al., 2011). The air quality index SAQI_11 has five classes depending on the concentration of certain pollutants, as follows (Jović et al., 2011): (1) when the presence of pollutants is not detected or when the concentration of the pollutant is lower than the lower Assessment boundaries - the air is clean - excellent; 2.) When the value of the concentration of the pollutant is bigger than the concentration which represents the lower limit of the assessment or less than the concentration

1255EP 2017 (64) 3 (1249-1262)
CORRELATION BETWEEN THE AIR QUALITY INDEX SAQI_11 AND SUSTAINABLE RURAL DEVELOPMENT IN THE REPUBLIC OF SERBIA
which represents the upper limit of the assessment - the air is good; 3.) When the value of the concentration of the pollutant is greater than the concentration which represents the upper limit of the assessment but is not higher than the limit value - the air is acceptable; 4.) When the concentration of the pollutant is greater than the limit value, but not higher than the tolerant value - the air is contaminated; 5.) When the concentration of the pollutant is greater than the tolerant value - the air is very polluted.
The first two classes cover the range to half the limit value expressed in μg / m3, the third from half to the total value of the limit value, and the values in the fourth and fifth classes are characterized by polluted air, in accordance with the provisions of the Law on Air Protection, and according to the level of air pollution. Quantitative values of concentrations of pollutants, in μg / m3, for the period of averaging 24h and the calendar year, according to the classes of the Air Quality Index SAQI_11, are given in the table below.
Table 1. Quantitative values of concentrations of pollutants for the period of averaging 24h and the calendar year, by classes of the Air Quality Index SAQI_11
Aver
agin
g pe
riod
Pollu
ting
subs
tance
s
Lim
it va
lue,
μg
/m3
Toler
ant v
alue,
μg
/m3
EXC
ELLE
NT
GO
OD
AC
CEP
TABL
E
POLL
UTE
D
VER
Y
POLL
UTE
D
24 h
SO2 125 0.0 - 50.0 50.1 – 75.0 75.1 – 125.0 125.1 - 187.5 > 187.5
NO2 85 125 0.0 - 42.5 42.6 – 60.0 60.1 – 85.0 85.1 – 125.0 > 125.0
PM10 50 75 0.0 – 25.0 25.1 – 35.0 35.1 – 50.0 50.1 – 75.0 > 75.0
CO 5000 10000 0.0 - 2500 2501 – 3500 3501 – 5000 5001 – 10000 > 10000O3-8h max. 120 0.0 - 60.0 60.1 – 85.0 85.1 – 120.0 120.1 – 180.0 > 180.0
soot 50 0.0 – 25.0 25.1 – 35.0 35.1 – 50.0 50.1 – 75.0 > 75.0
Calen
dar y
ear SO2 50 0.0 – 30.0 30.1 – 40.0 40.1 – 50.0 50.1 – 75.0 > 75.0
NO2 40 60 0.0 – 26.0 26.1 – 32.0 32.1 – 40.0 40.1 – 60.0 > 60.0
PM10 40 48 0.0 – 20.0 20.1 – 28.0 38.1 – 40.0 40.1 – 48.0 > 48.0CO 3000 0.0 – 1500 1501 – 2100 2101 – 3000 3001 – 4500 > 4500soot 50 0.0 – 25.0 25.1 – 35.0 35.1 – 50.0 50.1 – 75.0 > 75.1
Source: Jović et al., 2011; Popović et al., 2016; Popović et al., 2015; Popović et al., 2014; Popović et al., 2013; Jović et al., 2012.
In accordance with the provisions of the Law on Air Protection, and according to the level of pollution, based on the prescribed limit and tolerance values, based on the results of the measurements, the following air quality categories (Popović et al., 2016; Popović et al., 2015; Popović et al., 2014; Popović et al., 2013): 1.) The first category - pure or slightly polluted air where the limit values of the level for any pollutant are not exceeded; 2.) second category -

1256 EP 2017 (64) 3 (1249-1262)
Milan Počuča, Jelena Matijasevic - Obradovic, Bojana Draskovic
moderately polluted air where the level limit values for one or more pollutants are exceeded, but tolerant values for one pollutant are not exceeded; 3.) Third category - excessively polluted air where tolerant values for one or more pollutants are exceeded.
According to Jović et al. (2011), the purpose of the existence of the Air Quality Index SAQI_11, in a situation where there are legally defined categories of air quality, is that it enables the interested public to understand the state of air quality more easily and provides more information on values less than the limit values measured in μg/M3.
Table 2. Trend of air quality by zones and agglomerations for the period 2012-2015 Years
PopulationCategories of air quality
2012 2013 2014 2015
ZON
ES
The Republic of Serbia 2,818,693 I I I ICity of Kragujevac 179,417 II III
City of Valjevo 90,312 III III III IIIVojvodina 1,386,830 I I I ICity of Sremska Mitrovica 79,940 II III
AG
LOM
ERAT
ION
S
Novi Sad 341,625 I I I IIBeograd 1,659,440 III III II IIIPančevo 123,414 III I I IIISmederevo 108,209 III III IIIBor 48,615 III III III IIIKosjerić 12,090 III II IUžice 78,040 II III III IIINiš 260,237 II I I
Source: Popović et al., 2016; Popović et al., 2015; Popović et al., 2014; Popović et al., 2013.
As stated above, the Air Quality Index SAQI_11 should not be in conflict with legal provisions defining air quality categories. The first three classes of the Air Quality Index SAQI_11, “Excellent”, “Good” and “Acceptable” are within the first category of air quality - pure or slightly polluted air.
The classes “Polluted” and “Highly polluted” virtually coincide with the second and third category of air quality (Jović et al., 2011). Table 1 shows shaded interpolated values. In determining class boundaries by interpolation, practically when interpolating the upper and lower bounds of pollution for pollutants for which they are not prescribed by the Regulation, the distribution pattern of those pollutants for which these parameters are determined by the Regulation is monitored. Soot is a contaminating matter whose monitoring is provided for purpose-based measurements, so it is specially marked. The SAQI_11 Air Quality Class Classes are also suitable for estimating daily values of concentrations of pollutants (Jović et al., 2011; Popović et al., 2016; Popović et al., 2015; Popović et al., 2014; Popović et al., 2013; Jović et al., 2012). For the assessment of air quality trends by zones and agglomerations for the period 2012-2015 Years, the Air Quality Index SAQI_11 is used for structural assessment of air quality in agglomerations. It determines the frequency of air quality classes based on the average daily values of concentrations of various pollutants (Popović et al., 2016; Popović et
1257EP 2017 (64) 3 (1249-1262)
CORRELATION BETWEEN THE AIR QUALITY INDEX SAQI_11 AND SUSTAINABLE RURAL DEVELOPMENT IN THE REPUBLIC OF SERBIA
al., 2015; Popović et al., 2014; Popović et al., 2013; Jović et al., 2012).
By analyzing the data from Table 2, the following conclusions can be made. In the agglomeration “Novi Sad”, the air is from 2012-2014. In year 2015, it was clean or slightly polluted air, while in 2015 it was switched to the second category by pollution (moderately polluted), which indicates the trend of growth of suspended particles in the last year, and, according to the concentration of polluting substances, the transition to the IV class of the Air Quality Index SAQI_11.
In the agglomeration “Belgrade”, the air was excessively polluted in 2012, 2013 and 2015, and according to the concentration of pollutants, it was in the V class of the Air Quality Index SAQI_11, and only in 2014 it was moderately polluted (and according to the concentration of pollutants Matter was in the IV class of the Air Quality Index SAQI_11), which indicates the trend of reducing the growth of suspended particles during 2014.
In the „Pancevo“ agglomeration, the air was polluted in 2012 and 2015, and according to the concentration of pollutants belonged to the V Class of Air Quality Index SAQI_11, while in 2013 and 2014 it was clean or slightly polluted, indicating a trend Significant reduction in the growth of suspended particles during the above two years.
In the “Smederevo” agglomeration, the air was over-polluted from 2012 to 2014 and according to the concentration of pollutants belonged to the V Classification of the Air Quality Index SAQI_11, while in 2015 this agglomeration was not assessed.
In the “Bor” agglomeration, the air was over-polluted in all four years analyzed, and according to the concentration of pollutants belonged to the V Classification of the Air Quality Index SAQI_11, which indicates the trend of continuous emission and concentration of suspended particles in this area.
In the Kosjeric agglomeration, air pollution was excessively polluted in 2012, and according to the concentration of pollutants belonged to the SAQI_11 Air Quality Class V, it was moderately polluted in 2013 and belonged to the IV class of the Air Quality Index SAQI_11, while in 2014, Air was clean or slightly polluted, indicating a trend of decreasing the growth of suspended particles. In 2015, the agglomeration “Kosjerić” was not evaluated.
In the Uglice agglomeration, the air was moderately polluted in 2012, and according to the concentration of pollutants belonged to the IV class of the Air Quality Index SAQI_11, while in the period 2013-2015. Year was over-polluted, and it ranked in the V class of the Air Quality Index SAQI_11, which points to the trend of increasing the growth of suspended particles in this area.
In the agglomeration Nis, the air was moderately polluted in 2012, and according to the concentration of pollutants belonged to the IV class of the Air Quality Index SAQI_11, while in 2013 and 2014 it was clean or slightly polluted, indicating the trend of decrease in growth Suspended particles in this area. In 2015, the agglomeration “Nis” has not been evaluated.

1258 EP 2017 (64) 3 (1249-1262)
Milan Počuča, Jelena Matijasevic - Obradovic, Bojana Draskovic
Conclusion
Sustainable rural development basically depends on the practical application of the combination of the concept of multifunctional agriculture and the development of other economic activities in accordance with the available natural and human resources, the overall improvement of living conditions, as well as the socioeconomic position of villages and rural communities (Đorđević-Milošević, Milovanović, 2012). Certainly, air quality is a very important parameter for the development of certain regions in Serbia, and sustainable rural development as a whole.
If the presented data for eight agglomerations in Serbia classified into three categories according to the level of air pollution and considering the air quality index SAQI_11, the following conclusions can be made: 1.) the agglomeration “Novi Sad” can be classified in the group of areas With predominantly pure or slightly polluted air (only in 2015 air quality was transferred to the IV class of the Air Quality Index SAQI_11), which, ecologically, is a significant potential for sustainable rural development in this area; 2.) agglomerations “Pančevo”, “Kosjerić” and “Niš” can be classified in the group of areas with mostly moderately polluted air (in the agglomeration “Pančevo”, the air in 2012 and 2015 belonged to the Air Quality Class V SAQI_11; In the agglomeration “Kosjerić”, the air was only in 2012. in the air quality class V SAQI_11; in 2013, it belonged to the IV class of the Air Quality Index SAQI_11; in the agglomeration “Nis”, the air in 2012 belonged to the IV class of the Index Air quality SAQI_11), which is, ecologically speaking, a solid potential for sustainable rural development in these areas, with the tendency of additional investments and improvements in further rural development; 3.) agglomerations “Smederevo”, “Bor”, “Belgrade” and “Uzice” can be classified in the group of areas with predominantly excessively polluted air (in agglomeration “Bor”, the air was in the class V of theAir Quality Index SAQI_11, in the agglomeration “Smederevo”, the air from 2012 to 2014 belonged to the V Air Quality Class V SAQI_11; in the agglomeration “Belgrade”, the air in 2012, 2013 and 2015 belonged to the V Classification of Air Quality Index SAQI_11, While in the agglomeration of “Užice”, the air in 2012 belonged to the IV class of the Air Quality Index SAQI_11, while in the period 2013-2015 it belonged to the V Classification of the Air Quality Index SAQI_11), which, ecologically speaking, is not an adequate stimulation for a sustainable rural development in these areas, and it is necessary to reduce the emission of pollutants, which will enable better ecological potential in further sustainable rural development.
Literature
1. Adinyira, E., Oteng-Seifah, S., Adjei-Kumi, T. (2007): Sustainability Assessment of Rural Development: A Review of Methodologies, In Book - Sustainable rural development: What is the role of the agri-food sector?, Vol. 39, pp. 18-27, Leibniz Institute of Agricultural Development in Central and Eastern Europe (IAMO), Halle (Saale), Germany.
1. Bogdanov, N. (2003): Rural development - EU policy, situation and perspectives in Serbia, Proceedings from the conference - Agriculture and rural development in European integration, Belgrade, The Republic of Serbia, pp. 82-91.

1259EP 2017 (64) 3 (1249-1262)
CORRELATION BETWEEN THE AIR QUALITY INDEX SAQI_11 AND SUSTAINABLE RURAL DEVELOPMENT IN THE REPUBLIC OF SERBIA
2. Bogdanov N., Stojanović, Z. (2006): The methodology of rural determination and identification of rural Serbia, In Book - Agriculture and rural development of Serbia in transition period, pp. 47-70, DAES, Belgrade, The Republic of Serbia.
3. Bogdanov, N. (2007): Small rural households in Serbia and rural non-agricultural economy, UNDP, Belgrade, The Republic of Serbia.
4. Castree, N., Braun, B. (2006): Constructing rural natures, In Book - Handbook of Rural Studies, pp. 161-17, Sage Publications, London, United Kingdom.
5. Chaudhry, P., Gupta, R. K. (2010): Urban greenery and its sustainable extension strategies in hot arid region of India, International Journal of Sustainable Society, Vol. 2, No. 2, pp. 146-155, Inderscience Publishers, Olney, Bucks, United Kingdom.
2. Chmielinski, P., Chmielewska, B. (2015): Social changes in rural areas: incomes and expenditures of rural households, Economics of Agriculture, Vol. 62, No. 4, pp. 907-920, Institute of Agricultural Economics, Belgrade, The Republic of Serbia.
6. Ćirić, M., Počuča. M., Raičević, V. (2014): Level of customer orientation and customer protection in hotels in Serbia, Economics of Agriculture, Vol. 61, No. 1, pp. 25-39, Institute of Agricultural Economics, Belgrade, The Republic of Serbia.
7. Đorđević Milošević S., Milovanović J. (2012): Održivi turizam u funkciji ruralnog razvoja - Mala poljoprivredna gazdinstva i ruralni turizam u Srbiji, Fakultet za primenjenu ekologiju Futura Univerziteta Singidunum, Beograd, Republika Srbija; Agroznanje, Vršac, Republika Srbija; FAO, Budimpešta, Republika Mađarska.
8. Erokhin, V. (2014): Approaches to sustainable rural development in a predominantly non-rural region, Economics of Agriculture, Vol. 61, No. 2, pp. 291-306, Institute of Agricultural Economics, Belgrade, The Republic of Serbia.
9. Fagioli, F. F., Diotallevi, F., Ciani, A. (2014): Strengthening the sustainability of rural areas: the role of rural tourism and agritourism, Rivista di Economia Agraria, Vol. 69, No. 2-3, pp. 155-169, Firenze University Press, Firenze, Italia.
10. Ivolga, A. (2014). Overview of contemporary issues of sustainable rural development in Russia in terms of existing differences between regions, Economics of Agriculture, Vol. 61, No. 2, pp. 331-345, Institute of Agricultural Economics, Belgrade, The Republic of Serbia.
11. Yves, L. (2005): Presidential address – Rural development in Europe: A research frontier for agricultural economists, European Review of Agricultural Economics, Vol. 32, No. 3, pp. 301-317, Oxford University Press and the European Agricultural and Applied Economics Publications Foundation, The Netherlands.
3. Jović, B., Knežević, J., Marić-Tanasković, L., Dimić, B., Cvetković, I. (2011): Annual report on the air quality condition in the Republic of Serbia for 2010, Environmental Protection Agency, Ministry of Agriculture and Environmental Protection, Belgrade, The Republic of Serbia.
4. Jović, B., Marić-Tanasković, L., Knežević, J., Dimić, B. (2012): Annual report on the air quality condition in the Republic of Serbia for 2011, Environmental Protection Agency,

1260 EP 2017 (64) 3 (1249-1262)
Milan Počuča, Jelena Matijasevic - Obradovic, Bojana Draskovic
Ministry of Agriculture and Environmental Protection, Belgrade, The Republic of Serbia.12. Just, F. (2007): Rural-Urban Interlinkages and Regional Development, In Book -
Sustainable rural development: What is the role of the agri-food sector?, Vol. 39, pp. 3-17, Leibniz Institute of Agricultural Development in Central and Eastern Europe (IAMO), Halle (Saale), Germany.
5. Kačar, B., Curić, J., Ikić, S. (2016): Local economic development in theories of regional economies and rural studies, Economics of Agriculture, Vol. 63, No. 1, pp. 231-246, Institute of Agricultural Economics, Belgrade, The Republic of Serbia.
6. Kokić Arsić, A., Milivojević, J., Savović, I. (2009): Uticaj kvaliteta vazduha na zdravlje i kvalitet života ljudi, Proceedings from conference - Festival kvaliteta 2009 – 4. Nacionalna konferencija o kvalitetu života, Kragujevac, The Republic of Serbia, pp. 150-153.
13. Lowe, P., Murdoch, J., Ward, N. (1995): Networks in rural development beyond exogenous and endogenous models, In Book - Beyond modernization: The impact of endogenous rural development, Van Gorcum, Assen, Netherlands, Vol. 1, pp. 87-106.
14. Milbourne, P. (2003): Nature – society – rurality: making critical connections, Sociologia Ruralis, Vol. 43, No. 3, pp. 193-196, European Society for Rural Sociology, USA.
15. Molders, T. (2013): Multifunctional Agricultural Policies: Pathways towards Sustainable Rural Development?, International Journal of Sociology of Agriculture and Food, Vol. 21, No. 1, pp. 97-114, Research Committee of Sociology of Agriculture and Food, UK.
16. Nacionalna Strategija održivog razvoja, Službeni glasnik, Republika Srbija, no. 57/2008. 17. Papić, R., Bogdanov, N. (2015): Rural Development Policy – a perspective of local
actors in Serbia, Economics of Agriculture, Vol. 62, No. 4, pp. 1079-1093, Institute of Agricultural Economics, Belgrade, The Republic of Serbia.
18. Perotto P.G. (1993): Il paradosso dell’economia; Manuale di rivoluzione cultural, Franco Angeli, Milano, Italia.
19. Popesku, J. (2008): Održivi turizam, u Brošuri - Ruralni razvoj i ruralni turizam, pp. 9-13, Agromreža, Novi Sad, Republika Srbija.
7. Popesku, J. (2011): Sustainable development of rural tourism, Taiex, Chamber of Commerce, Belgrade, The Republic of Serbia, (available at: http://www.kombeg.org.rs/Slike/UdrTurizam/2011/novembar/TAIEX/Prezentacije/Beograd.pdf).
20. Popović, T., Knežević, J., Jović, B., Marić-Tanasković, L., Dimić, B. (2016): Annual report on the air quality condition in the Republic of Serbia for 2015, Environmental Protection Agency, Ministry of Agriculture and Environmental Protection, Belgrade, The Republic of Serbia.
21. Popović, T., Jović, B., Marić-Tanasković, L., Knežević, J., Dimić, B. (2015): Annual report on the air quality condition in the Republic of Serbia for 2014, Environmental Protection Agency, Ministry of Agriculture and Environmental Protection, Belgrade, The Republic of Serbia.
22. Popović, T., Jović, B., Marić-Tanasković, L., Knežević, J., Mitrović Josipović, M., Dimić, B. (2014): Annual report on the air quality condition in the Republic of Serbia
1261EP 2017 (64) 3 (1249-1262)
CORRELATION BETWEEN THE AIR QUALITY INDEX SAQI_11 AND SUSTAINABLE RURAL DEVELOPMENT IN THE REPUBLIC OF SERBIA
for 2013, Environmental Protection Agency, Ministry of Agriculture and Environmental Protection, Belgrade, The Republic of Serbia.
23. Popović, T., Jović, B., Marić-Tanasković, L., Knežević, J., Đorđević, D., Dimić, B. (2013): Annual report on the air quality condition in the Republic of Serbia for 2012, Environmental Protection Agency, Ministry of Agriculture and Environmental Protection, Belgrade, The Republic of Serbia.
24. Ristić, L. (2013): Strategijsko upravljanje održivim ruralnim razvojem u Republici Srbiji, Ekonomski horizonti, Vol. 15, No. 3, pp. 229-243, Ekonomski fakultet Univerziteta u Kragujevcu, Kragujevac, Republika Srbija.
25. Ristić, L., Vujičić, M., Leković, M. (2016): Tourism as a factor of Ssustainable Development of rural areas belonging to Rudnička Morava, Economics of Agriculture, Vol. 63, No. 2, pp. 665-680, Institute of Agricultural Economics, Belgrade, The Republic of Serbia.
26. Sandham, L. A, Van Der Walt, A. J. (2004): Social aspects of sustainable rural development – A case study of Lepelfontein, South African Geographical Journal, Vol. 86, No. 2, pp. 68-75, Society of South African Geographers and Taylor & Francis, United Kingdom.
27. Simonović, D. (2008): Održiva poljoprivreda i ruralni razvoj, u Brošuri - Ruralni razvoj i ruralni turizam, p. 2-9, Agromreža, Novi Sad, Republika Srbija.
28. Strategija poljoprivrede i ruralnog razvoja Republike Srbije za period 2014-2024. godine, “Službeni glasnik RS”, no. 85/2014.
29. Šimkova, E. (2007): Strategic approaches to rural tourism and sustainable development of rural areas, Agricultural Economics, Vol. 53, No. 6, pp. 263-270, Czech Academy of Agricultural Sciences, Czech Republic.
30. Uredba o određivanju zona i aglomeracija, Službeni glasnik, Republika Srbija, no. 58/11 i 98/12.
31. Uredba o uslovima za monitoring i zahtevima kvaliteta vazduha, Službeni glasnik, Republika Srbija, br, 11/2010, 75/2010 i 63/2013.
32. Veselinović, J., Ignjatijević, S. (2013): Pravni okvir i ekonomske mere za unapređenje agroturizma, Zbornik radova sa konferencije - Planska i normativna zaštita prostora i životne sredine, Subotica - Palić, Republika Srbija, pp. 145-150.
33. Veljković, N. (2017): Indikatori održivog razvoja: Srbija i svet, Agencija za zaštitu životne sredine, Republika Srbija, (dostupno na: http://indicator.sepa.gov.rs/o-indikatori).
34. Zakon o zaštiti vazduha, Official Gazette of RS, no. 36/2009 and 10/2013.

1262 EP 2017 (64) 3 (1249-1262)
Milan Počuča, Jelena Matijasevic - Obradovic, Bojana Draskovic
KORELACIJA INDEKSA KVALITETA VAZDUHA SAQI_11 I ODRŽIVOG RURALNOG RAZVOJA U REPUBLICI SRBIJI
Milan Počuča4, Jelena Matijašević – Obradović5, Bojana Drašković6
Apstrakt
Bitan uticaj na razvoj ruralnih područja, te održivi ruralni razvoj uopšte ima kvalitet vazduha. Kvalitet vazduha je vrlo važan parametar kako za održivi ruralni razvoj, tako i za život na zemlji uopšte. U tom kontekstu zanimljivo je analizirati korelaciju održivog ruralnog razvoja i stanja kvaliteta vazduha zavisnog od iznosa koncentracije zagađujućih materija, izraženog indeksom kvaliteta vazduha SAQI_11. Osnovna pažnja u istraživanju usmerena je na analizu numeričkih vrednosti koncentracija zagađujućih materija, za period usrednjavanja – 24h i kalendarsku godinu, po klasama Indeksa kvaliteta vazduha SAQI_11, te na analizu trenda kvaliteta vazduha po zonama i aglomeracijama za period 2012.-2015. godina. Zaključci o kvalitetu vazduha, klasama Indeksa kvaliteta vazduha SAQI_11, te korelaciji sa održivim ruralnim razvojem izvedeni su za aglomeracije „Novi Sad“, „Beograd“, „Pančevo“, Smederevo“, „Bor“, „Kosjerić“, „Užice“ i „Niš“.
Ključne reči: kvalitet vazduha, SAQI_11, zagađujuće materije, održivi ruralni razvoj.
4 Redovni profesor, dr Milan Počuča, Pravni fakultet za privredu i pravosuđe u Novom Sadu, Ulica Geri Karolja br. 1, Novi Sad, Srbija, E-mail: [email protected].
5 Vanredni profesor, dr Jelena Matijašević-Obradović, Pravni fakultet za privredu i pravosuđe u Novom Sadu, Ulica Geri Karolja br. 1, Novi Sad, Srbija, E-mail: [email protected].
6 Docent, dr Bojana Drašković, Fakultet za graditeljski menadžment, Ulica Cara Dušana br. 62-64, Beograd, Srbija, E-mail: [email protected].
1263
Economics of Agriculture 3/2017UDC: 005.334:640.4
EP 2017 (64) 3 (1263-1276)
RISK MANAGEMENT OF ALLERGENIC FOOD INGREDIENTS IN HOSPITALITY
Review article
RISK MANAGEMENT OF ALLERGENIC FOOD INGREDIENTS IN HOSPITALITY1
Jovanka Popov-Raljić2, Milica Aleksić3, Vesna Janković4, Ivana Blešić5, Milan Ivkov6
Summary
Food allergens have appeared in the last two decades as a concealed form of threat which significantly endangers public health, and their labelling on food products, drinks, and non pre-packed gastro-products is clearly defined with legal regulations.
In practice, the chemical risk management is faced with several unexpected problems. Some of them are declarations or statements about allergenic ingredients, where a nutritional allergen that the food contains is labelled with an unusual name, or similar products from different manufacturers where one is safe and the other contains allergens.
A hospitality facility which deals with production and distribution of unpackaged foods should, in addition to a developed HACCP concept and standardized recipes for food preparation, prepare a detailed, precise, and clearly defined plan for management of chemical risks.
Key words: Allergenic food ingredients, risk management, hospitality, food safety
JEL: I18, L66, Q18
1 This paper is a part of the short-term project of the Province – Vojvodina, Novi Sad, named: Agricultural, food and gastro-products in the function of tourism development in Vojvodina directed to authentic and healthy and safe food, under the number: 142-451-2669/2017.
2 Jovanka Popov-Raljić Ph.D., Full Professor, University of Novi Sad, Faculty of Science, Department of Geography, Tourism and Hotel Management, Trg Dositeja Obradovića 3. 21000 Novi Sad, Serbia, Phone: +381 21 485 2884, E-mail: [email protected]
3 Milica Aleksić, M.A., Assistant, University of Novi Sad, Faculty of Science, Department of Geography, Tourism and Hotel Management, Trg Dositeja Obradovića no. 3. 21000 Novi Sad, Serbia, Phone: +381 21 485 2884, E-mail: [email protected]
4 Vesna Janković Ph.D., Institute of Meat Hygiene and Technology (INMES), Department of Microbiological and Molecular - Biological Research, Kacanskog street no. 13, Belgrade, Serbia, Phone: +381 11 26 50 655, E-mail: [email protected]
5 Ivana Blešić Ph.D., Associate Professor, University of Novi Sad, Faculty of Science, Department of Geography, Tourism and Hotel Management, Trg Dositeja Obradovića no. 3. 21000 Novi Sad, Serbia, Phone: +381 21 485 2884, E-mail: [email protected]
6 Milan Ivkov Ph.D., University of Novi Sad, Faculty of Science, Department of Geography, Tourism and Hotel Management, Trg Dositeja Obradovića no. 3. 21000 Novi Sad, Serbia, Phone: +381 21 485 2842, E-mail: [email protected]
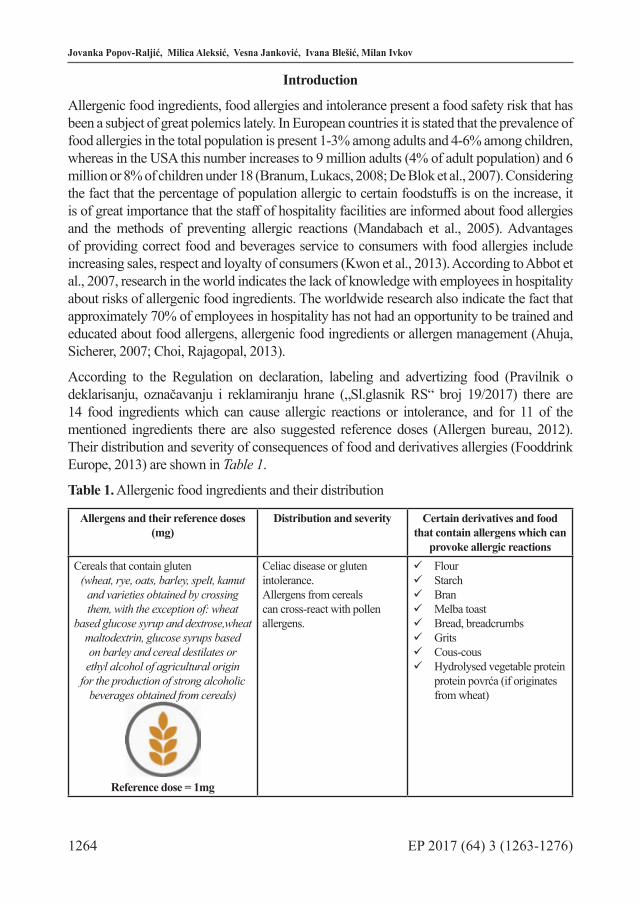
1264 EP 2017 (64) 3 (1263-1276)
Jovanka Popov-Raljić, Milica Aleksić, Vesna Janković, Ivana Blešić, Milan Ivkov
Introduction
Allergenic food ingredients, food allergies and intolerance present a food safety risk that has been a subject of great polemics lately. In European countries it is stated that the prevalence of food allergies in the total population is present 1-3% among adults and 4-6% among children, whereas in the USA this number increases to 9 million adults (4% of adult population) and 6 million or 8% of children under 18 (Branum, Lukacs, 2008; De Blok et al., 2007). Considering the fact that the percentage of population allergic to certain foodstuffs is on the increase, it is of great importance that the staff of hospitality facilities are informed about food allergies and the methods of preventing allergic reactions (Mandabach et al., 2005). Advantages of providing correct food and beverages service to consumers with food allergies include increasing sales, respect and loyalty of consumers (Kwon et al., 2013). According to Abbot et al., 2007, research in the world indicates the lack of knowledge with employees in hospitality about risks of allergenic food ingredients. The worldwide research also indicate the fact that approximately 70% of employees in hospitality has not had an opportunity to be trained and educated about food allergens, allergenic food ingredients or allergen management (Ahuja, Sicherer, 2007; Choi, Rajagopal, 2013).
According to the Regulation on declaration, labeling and advertizing food (Pravilnik о deklarisanju, označavanju i reklamiranju hrane („Sl.glasnik RS“ broj 19/2017) there are 14 food ingredients which can cause allergic reactions or intolerance, and for 11 of the mentioned ingredients there are also suggested reference doses (Allergen bureau, 2012). Their distribution and severity of consequences of food and derivatives allergies (Fooddrink Europe, 2013) are shown in Table 1.
Table 1. Allergenic food ingredients and their distribution
Allergens and their reference doses (mg)
Distribution and severity Certain derivatives and food that contain allergens which can
provoke allergic reactionsCereals that contain gluten
(wheat, rye, oats, barley, spelt, kamut and varieties obtained by crossing them, with the exception of: wheat
based glucose syrup and dextrose,wheat maltodextrin, glucose syrups based on barley and cereal destilates or ethyl alcohol of agricultural origin
for the production of strong alcoholic beverages obtained from cereals)beverages obtained from cereals)
Reference dose = 1mg
Celiac disease or gluten intolerance.Allergens from cereals can cross-react with pollen allergens.
FlourStarchBranMelba toastBread, breadcrumbsGritsCous-cousHydrolysed vegetable protein
protein povrća (if originates from wheat)

1265EP 2017 (64) 3 (1263-1276)
RISK MANAGEMENT OF ALLERGENIC FOOD INGREDIENTS IN HOSPITALITY
Eggs and egg productsEggs and egg products
Reference dose = 0,03 mg
Egg allergy is common with children, but more than a half of children outgrow this allergy by their third year of age. Some individuals may experience anaphylactic reactions
Powdered eggs, dried eggs or pasteurized eggs
AlbuminEgg glazeMayonnaise*Note: Lysozyme (produced from eggs), which is used in wines, and albuminhave small chances of causing a reaction.However, when lysozyme is used for other purposes, it can cause unwanted reactions.
Milk and dairy products including lactoseExcept: whey used to produce destilates or ethyl alcohol of agricultural origin
for strong alcoholic beverages, lactitol.for strong alcoholic beverages, lactitol.
Reference dose = 0,1 mg
Allergy to cow’s milk is the most common allergy with younger children and it is present with 2-7% babies under one year of age. About 87% of children grow out of this allergy by their third year of age.There is a large degree of cross-reactivity between cow’s milk and milk of other mammals, such as sheep, goats or buffalo.
WheyCaseinMilk powderLactoseButter, cheese, creams,
yoghurt
Allergens and their reference doses (mg)
Distribution and severity Certain derivatives and food that contain allergens which can
provoke allergic reactions
Crustaceans (crabs) and their productsCrustaceans (crabs) and their products
Reference dose = 1 mg
Allergy to crabs is very common. People who are sensitive can react to different kinds of crustaceans.Crustaceans often cause severe reactions, and some people may react to vapour produced during cooking.
Gastro-products made of crustaceans
SaladsDippingsClear and thick soups
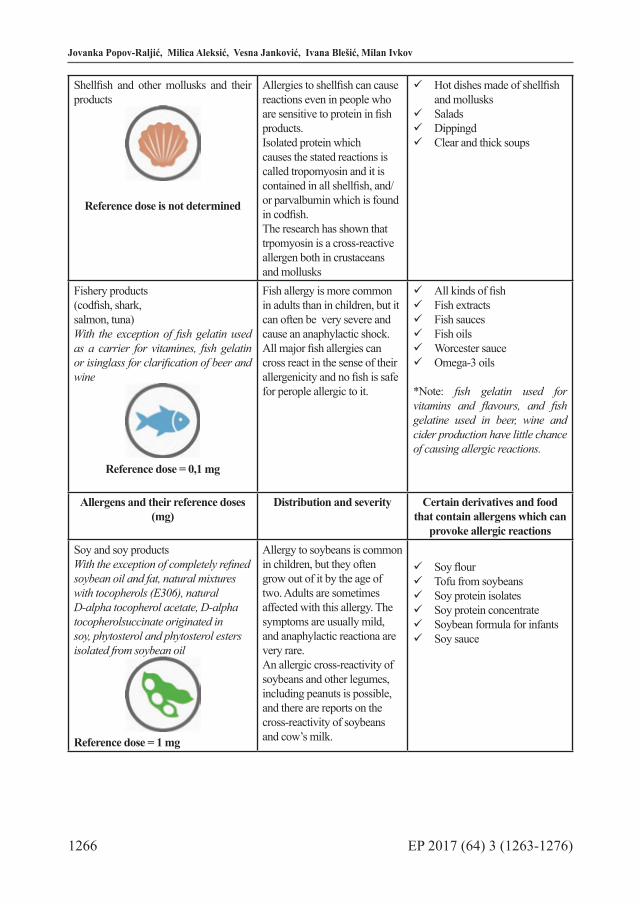
1266 EP 2017 (64) 3 (1263-1276)
Jovanka Popov-Raljić, Milica Aleksić, Vesna Janković, Ivana Blešić, Milan Ivkov
Shellfish and other mollusks and their products
Reference dose is not determined
Allergies to shellfish can cause reactions even in people who are sensitive to protein in fish products.Isolated protein which causes the stated reactions is called tropomyosin and it is contained in all shellfish, and/or parvalbumin which is found in codfish.The research has shown that trpomyosin is a cross-reactive allergen both in crustaceans and mollusks
Hot dishes made of shellfish and mollusks
SaladsDippingdClear and thick soups
Fishery products(codfish, shark, salmon, tuna)With the exception of fish gelatin used as a carrier for vitamines, fish gelatin or isinglass for clarification of beer and wine
Reference dose = 0,1 mg
Fish allergy is more common in adults than in children, but it can often be very severe and cause an anaphylactic shock.All major fish allergies can cross react in the sense of their allergenicity and no fish is safe for perople allergic to it.
All kinds of fishFish extractsFish saucesFish oilsWorcester sauceOmega-3 oils
*Note: fish gelatin used for vitamins and flavours, and fish gelatine used in beer, wine and cider production have little chance of causing allergic reactions.
Allergens and their reference doses (mg)
Distribution and severity Certain derivatives and food that contain allergens which can
provoke allergic reactionsSoy and soy productsWith the exception of completely refined soybean oil and fat, natural mixtures with tocopherols (E306), natural D-alpha tocopherol acetate, D-alpha tocopherolsuccinate originated in soy, phytosterol and phytosterol esters isolated from soybean oilisolated from soybean oil
Reference dose = 1 mg
Allergy to soybeans is common in children, but they often grow out of it by the age of two. Adults are sometimes affected with this allergy. The symptoms are usually mild, and anaphylactic reactiona are very rare.An allergic cross-reactivity of soybeans and other legumes, including peanuts is possible, and there are reports on the cross-reactivity of soybeans and cow’s milk.
Soy flourTofu from soybeansSoy protein isolatesSoy protein concentrateSoybean formula for infantsSoy sauce
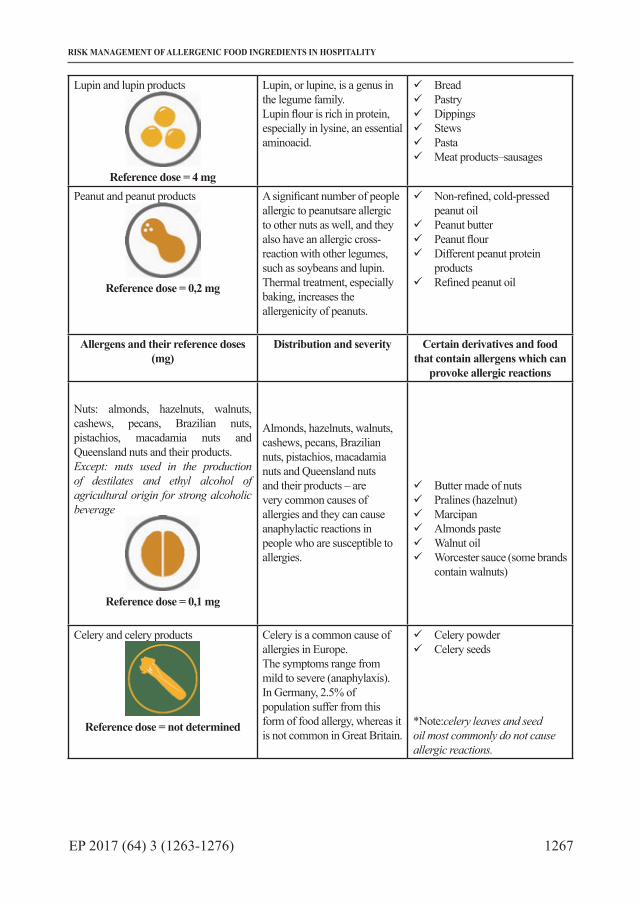
1267EP 2017 (64) 3 (1263-1276)
RISK MANAGEMENT OF ALLERGENIC FOOD INGREDIENTS IN HOSPITALITY
Lupin and lupin productsLupin and lupin products
Reference dose = 4 mg
Lupin, or lupine, is a genus in the legume family.Lupin flour is rich in protein, especially in lysine, an essential aminoacid.
BreadPastryDippingsStewsPastaMeat products–sausages
Peanut and peanut productsPeanut and peanut products
Reference dose = 0,2 mg
A significant number of people allergic to peanutsare allergic to other nuts as well, and they also have an allergic cross-reaction with other legumes, such as soybeans and lupin.Thermal treatment, especially baking, increases the allergenicity of peanuts.
Non-refined, cold-pressed peanut oil
Peanut butterPeanut flourDifferent peanut protein
productsRefined peanut oil
Allergens and their reference doses (mg)
Distribution and severity Certain derivatives and food that contain allergens which can
provoke allergic reactions
Nuts: almonds, hazelnuts, walnuts, cashews, pecans, Brazilian nuts, pistachios, macadamia nuts and Queensland nuts and their products.Except: nuts used in the production of destilates and ethyl alcohol of agricultural origin for strong alcoholic beverage
Reference dose = 0,1 mg
Almonds, hazelnuts, walnuts, cashews, pecans, Brazilian nuts, pistachios, macadamia nuts and Queensland nuts and their products – are very common causes of allergies and they can cause anaphylactic reactions in people who are susceptible to allergies.
Butter made of nutsPralines (hazelnut)MarcipanAlmonds pasteWalnut oilWorcester sauce (some brands
contain walnuts)
Celery and celery products
Reference dose = not determined
Celery is a common cause of allergies in Europe.The symptoms range from mild to severe (anaphylaxis).In Germany, 2.5% of population suffer from this form of food allergy, whereas it is not common in Great Britain.
Celery powderCelery seeds
*Note:celery leaves and seed oil most commonly do not cause allergic reactions.
1268 EP 2017 (64) 3 (1263-1276)
Jovanka Popov-Raljić, Milica Aleksić, Vesna Janković, Ivana Blešić, Milan Ivkov
Mustard and mustard productsMustard and mustard products
Reference dose = 0,05 mg
Mustard allergy is not common in Great Britain, however, it is common in France, where severe reactions, incuding anaphylaxix, have been reported.
Mustard pasteMustard seedMustard leavesMustard flourMustard powder
*Note: mustard oil and mustard seed oil most commonly do not cause allergic reactions.
Allergens and their reference doses (mg)
Distribution and severity Certain derivatives and food that contain allergens which can
provoke allergic reactionsSesame seed and sesame productsSesame seed and sesame products
Reference dose = 0,2 mg
Sesame allergy is most pronounced among inhabitants of Israel, and it is increasingly common in Great Britain as well and it can cause severe reactions including anaphylaxis.There is a cross-reactivity between nuts and sesame seeds.
Sesame seedSesame oilSesame pasteTahiniHummusHalvah
Sulfur – dioxide and sulfites
*over 10mg/kg or 10 mg/l expressed as SO2
Supplements of sulfites in wines are associated with causing asthmatic reaction in sensitive individuals, most commonly people who suffer from asthma.Symptoms can be severe with a minority of people suffering from asthma.
E220 sulfur dioxideE221 sodiumsulfiteE222 sodium bisulfiteE223 sodium metabisulfiteE224 potassium metabisulfiteE226 calcium sulfiteE227 calcium bisulfiteE228 potassium bisulfite
Sulfur dioxide and sulfites are used as preservatives – dried fruit and vegetables, non-alcoholic beverages, fruit juices, fermented beverages such as wine, beer, ciders, sausages and burgers.
Source: Authors’ presentation according to the Regulation on declaration, labeling and advertizing food (Pravilnik о deklarisanju, označavanju i reklamiranju hrane („Sl.glasnik RS“ broj 19/2017), Allergen bureau, 2012. and Fooddrink Europe, 2013.
Besides 14 common nutritive allergens which must be labeled, consumers often complain on allergies and intolerances to other types of food such as honey, tomato, kiwi, oranges, rice, apples and others (Zurzolo et al., 2012).
Management of food allergens
Application of basic principles of food safety management in hospitality grounded on understanding of nutritive allergies and food production processed leads to the development

1269EP 2017 (64) 3 (1263-1276)
RISK MANAGEMENT OF ALLERGENIC FOOD INGREDIENTS IN HOSPITALITY
of a system which can support production of food which contains and does not contain a certain allergen in conditions where the risk for a consumer is reduced to a minimum (Alldrick, 2006). The modern approach to food safety management in hospitality is most often based on a need to prevent a risk and reduce it to an acceptable level, before it actually appears in practice. Allergies and intolerances to food ingredients which are contained in gastro-products are one of the safety risks which are widely considered in food industry. The general opinion is that in case of allergenic food ingredients it is not realistic to talk about the possibilities of zero risk (Kroes et al., 2000; Madsen et al., 2012), which is why it is extremely important to set standards in hospitality which will reduce this risk to a minimum. Precisely defined and consistent standards related to allergen safety management lead to a consistent and sustainable safety management in food industry (Hattersley et al., 2014) but also in the production of gastro-products in hospitality facilities. Allergenic food ingredients can pose a risk in two situations, when they directly enter the organism individually or as ingredients of a gastro-product or with a cross-contamination of non-allergenic foodstuffs with the allergenic ones during the food production process (Madsen et al., 2009).The illustrative image (Picture 1.) shows the basic critical elements in estimating and management of allergenic risks (Fooddrink Europe, 2013).
Picture 1. Critical elements in estimating and management of allergenic risks in hospitality
Source: Modified according to Fooddrink Europe, 2013.
People – the communication of risks or the process of exchanging information between the interested parties about the nature, intensity and importance of risk control is extremely important for the food safety system, because how we understand the risk affects the
1270 EP 2017 (64) 3 (1263-1276)
Jovanka Popov-Raljić, Milica Aleksić, Vesna Janković, Ivana Blešić, Milan Ivkov
perception of specific risks (allergenic food ingredients) of an individual or a group.Knowledge and behaviour of management and employees and their perception of the importance of allergenic food ingredientsof risk management have a significant effect on the outcomes of allergenic reactions in hospitality facilities (Lee, Sozen, 2016). Concretely, employees in hospitality facilities have a critical role in reducing the unwanted effects of allergenic food ingredients and their job requires specialized knowledge based on HACCP principles in risk management and implementation of safety protocols of allergens management (Aleksić, Popov-Raljić, 2015; Dupuis et al., 2016).
A supply chain – the control of allergens in a supply chain requires close connection and good communication with suppliers with clearly defined needs and requirements. A food distributor and supplier must be confidential, constant and consistent, with determined standards and developed professional awareness of potential risks which can be caused by mistaking a product of similar packaging and different suppliers. Examples of good production practice are questionnaires about being acquainted with health and safety risks and taken measured during the food distribution filled by suppliers during the application process, regardless having a well elaborated HACCP plan.
Handling raw materials – reception and storage of food ingredientsmust be a strictly controlled part of the food safety system. Although common procedures referring to security and sustainability of health and safety quality of food largely secure this potential risk, it is necessary to additionally control declarations and keep records of risky raw materials, products and half-products (Popov-Raljić, Blešić, 2016).
A design and equipment of production plants and hospitality kitchens – the production area, professional equipment and tools are besides the human factor one of the most common causes of cross-contamination of food in a hospitality facility. It is desirable that production parts of a facility have a physically separated area for the production of gastro-products which are labeled as safe for health / without allergens. In case there are not such conditions, it is required that the HACCP plan precisely defines procedures for cleaning and sanitation of equipment and tools used directly in the process of allergen-free gastro-products, as well as the methods of serving this type of product.
Production – a traditional way of food safety control, under the jurisdiction of state inspection authorities, was oriented to short-term goals of consumers, which is why the responsibility is nowadays transferred to the producer who must at any time document that a product is of a high quality and safe for consumer health (Popov-Raljić, 2013). The basic step is including the proscribed allergens in the HACCP plan of the production process as chemical risks in order to reduce the cross-contamination risk to a minimum, determine the plan of correct maintenance and cleaning work rooms and elements and determine the rules for storing foodstuffs that contain allergens. These procedures must especially cover the part of the production process of a product reconstruction or recycling where the foodstuffs which have been processed into half-products are after a while processed into a final product. The second step of providing production protocols is a standardization of production and their records within standardized product descriptions / recipes for food preparation in a hospitality facility. With the product
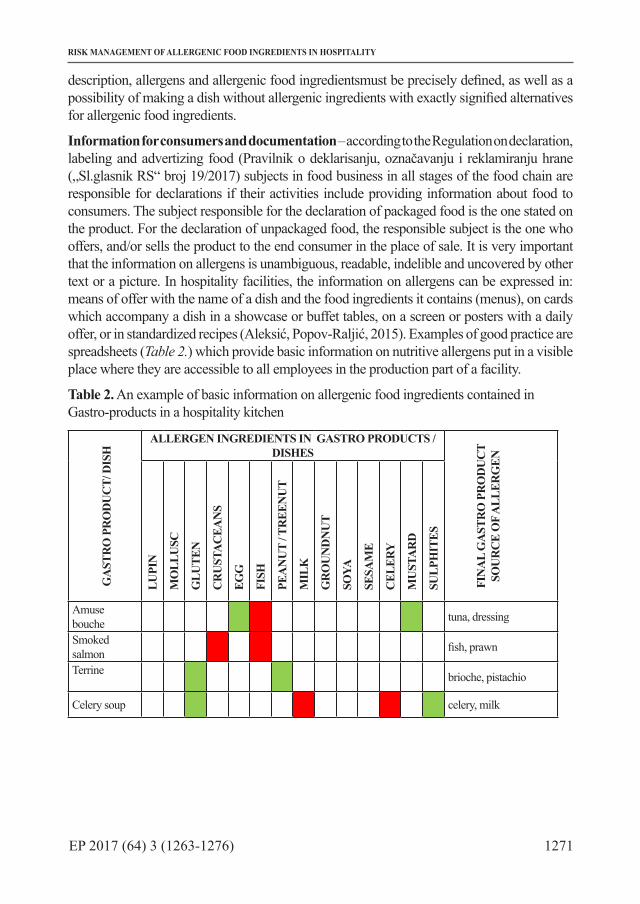
1271EP 2017 (64) 3 (1263-1276)
RISK MANAGEMENT OF ALLERGENIC FOOD INGREDIENTS IN HOSPITALITY
description, allergens and allergenic food ingredientsmust be precisely defined, as well as a possibility of making a dish without allergenic ingredients with exactly signified alternatives for allergenic food ingredients.
Information for consumers and documentation – according to the Regulation on declaration, labeling and advertizing food (Pravilnik о deklarisanju, označavanju i reklamiranju hrane („Sl.glasnik RS“ broj 19/2017) subjects in food business in all stages of the food chain are responsible for declarations if their activities include providing information about food to consumers. The subject responsible for the declaration of packaged food is the one stated on the product. For the declaration of unpackaged food, the responsible subject is the one who offers, and/or sells the product to the end consumer in the place of sale. It is very important that the information on allergens is unambiguous, readable, indelible and uncovered by other text or a picture. In hospitality facilities, the information on allergens can be expressed in: means of offer with the name of a dish and the food ingredients it contains (menus), on cards which accompany a dish in a showcase or buffet tables, on a screen or posters with a daily offer, or in standardized recipes (Aleksić, Popov-Raljić, 2015). Examples of good practice are spreadsheets (Table 2.) which provide basic information on nutritive allergens put in a visible place where they are accessible to all employees in the production part of a facility.
Table 2. An example of basic information on allergenic food ingredients contained inGastro-products in a hospitality kitchen
GA
STR
O P
RO
DU
CT/
DIS
H
ALLERGEN INGREDIENTS IN GASTRO PRODUCTS / DISHES
FIN
AL
GA
STR
O P
RO
DU
CT
SOU
RC
E O
F A
LLER
GEN
LUPI
N
MO
LLU
SC
GLU
TEN
CR
UST
AC
EAN
S
EGG
FISH
PEA
NU
T / T
REE
NU
T
MIL
K
GR
OU
ND
NU
T
SOYA
SESA
ME
CEL
ERY
MU
STA
RD
SULP
HIT
ES
Amuse bouche tuna, dressing
Smoked salmon fish, prawn
Terrine brioche, pistachio
Celery soup celery, milk

1272 EP 2017 (64) 3 (1263-1276)
Jovanka Popov-Raljić, Milica Aleksić, Vesna Janković, Ivana Blešić, Milan Ivkov
GA
STR
O P
RO
DU
CT/
DIS
H
ALLERGEN INGREDIENTS INGASTRO PRODUCTS / DISHES
FIN
AL
GA
STR
O P
RO
DU
CT
SOU
RC
E O
F A
LLER
GEN
LUPI
N
MO
LLU
SC
GLU
TEN
CR
UST
AC
EAN
S
EGG
FISH
PEA
NU
T / T
REE
NU
T
MIL
K
GR
OU
ND
NU
T
SOYA
SESA
ME
CEL
ERY
MU
STA
RD
SULP
HIT
ES
Sorbet popping candy, sorbet
Beef potato puree, wine sauce
Turbut fish, caviar, sauce
Venison puree, sauce, dauphinoise
Ricotta ravioli
Pudding pudding
Creme brulee brulee, biscuit
Petit fours additive / filling and topping
CAN BE SERVED WITHOUT AN ALLERGENCHECK WITH THE GUESTCONTAINS AN ALLERGEN
Source: Authors
The development of new gastronomic products and their changes – when introducing a new gastro-product/dish, it is necessary to consider whether an allergenic ingredient has a major role or whether it can be substituted, and if so, it should be stated what it can be substituted with.
The importance and goals of implementing new knowledge in the field of allergenic food ingredientsrisk management
In the field of allergenic food ingredients risk management in the food industry and hospitality, the irrational opinion of zero risk tolerance prevails, which imposes complete avoidance of any food ingredients which can be a potential allergen (Allen et al., 2014). The risk of cross-contamination with allergens in the production process exists even with the efforts of food producers to act in compliance with all requests of application of good hygienic practice principles. The predictive modeling in the allergenic food ingredients risk management is significantly made difficult because of badly defined way of labeling foodstuffs where the zero tolerance of risk of allergens imposes on the food producers to use the term “it may
1273EP 2017 (64) 3 (1263-1276)
RISK MANAGEMENT OF ALLERGENIC FOOD INGREDIENTS IN HOSPITALITY
contain” when labeling food products. According to Zurzolo et al., 2013, about 65% of food ingredients which are daily used in nutrition in Australia are labeled with a preventive phrase “it may contain”. This form of labeling misleads the consumers with a food allergy problem as well as caterers who are obliged to make their gastro-product in compliance with legal regulations and needs of consumers. The need for establishing a reliable system of food declaration, labeling and advertizing caused the necessary step of science such as determining an eliciting dose / ED of allergenic food ingredientswhich can vary depending on individual predispositions and geographic determinants. For the reason of consumers’ safety, the lowest doses determined by a research of a group of scientists in Allergen bureau VITAL in Australia are taken as starting eliciting doses of protein in allergenic foodstuffs. The program VITAL 2.0 (Allergen bureau, 2012) determined the reference doses of the overall intake of allergenic proteins (table 1.) and the action network of the level of risk of allergenic food ingredients is determined and it represents a ratio of reference doses and reference quantities of food intake / a gastro-product serving size for one meal.
*Reference dose – is a total quantity of a protein from an allergenic foodstuff which only the most sensitive portion of the allergic population reacts to (1-5%).
*Reference quantity of intake – the total quantity of a consumed gastro-product
By determining reference doses, an effective foundation of communication within allergenic foodstuffs risk management was established, which has enabled a detailed identification, characterization and significantly facilitated risk management, pondering and choice, that is, a detailed risk analysis.
Conclusion
Basic characteristics of nutritive allergens (a large number of food ingredients containing allergens, a minimal quantity which causes a reaction, a wide range of symptoms, and a small number of people suffering from food allergies) represent a great challenge for food manufacturers in the process of making a safety management plan. Safety management of nutritive allergens has to be directed to careful risk analyses in every segment of food production and sales chain in hospitality. The guidelines that point to a potential risk must be ensured so that nutritive allergens are clearly and precisely defined or that they are not present in quantities which can jeopardize the health of consumers. They must follow all segments of food production and sales chain in a hospitality facility, from the design, through the origin of a food ingredient, declaration and labeling in the means of supply to the safe consummation of food and established responsibility.
Allergenic food ingredients and gastro-products which contain them are distinguished by specific characteristics compared to other health and safety risks. They can be controlled and reduced to a minimum with the application of developed methodologies within the context of
1274 EP 2017 (64) 3 (1263-1276)
Jovanka Popov-Raljić, Milica Aleksić, Vesna Janković, Ivana Blešić, Milan Ivkov
other risks. The key foundation of the management of allergen safety is good communication between consumers and employees, employees and suppliers and interpersonal communication in a hospitality facility. Nevertheless, risks which are not controlled by allergen management are undeclared or wrongly declared allergens and undetermined allergies. Allergens in food ingredients which are not correctly labeled or which are pointed out in a less recognizable manner can cause significant failures in the safety management system. Another risky point which is almost impossible to avoid is an allergic reaction which has occurred for the first time. These situations require that there is a person in a hospitality facility who is trained to recognize such symptoms and react correctly and timely.
The factor which is the most difficult to control and which can significantly endanger the food safety system is a human factor. Therefore, one of the primary tasks of a hospitality facility management is providing appropriate trainings and education with the aim of raising awareness in employees of risks which can be caused by allergenic food ingredients and gastro-products.
Literature1. Abbot, M., Byrd-Bredbenner, C., Grasso, D. (2007): Know before you serve: developing
a food-allergy fact sheet, Cornell Hotel Restaurant Administration Quarterly, No. 48, pp. 274–283.
2. Ahuja, R., Sicherer, H. (2007): Food allergy management from the perspective of restaurant and food establishment personnel, Annals of Allergy, Asthma and Immunology, No. 98, pp. 344–348.
3. Alldrick, J. (2006): Managing allergy issues, Anherm Netherlands: The World of food ingredients, (October/November), pp. 64-65.
4. Allen, K.J., Remington, B.C., Baumert, J.L., Crevel, R.W.R., Houben, G.F., Brooke-Taylor, S., Kruizinga, A.G., Taylor, S.L. (2014): Allergen reference doses for precautionary labeling (VITAL 2.0): clinical implications, Journal of Allergy and Clinical Immunology, Vol. 133, No.1, pp. 156-164.
5. Aleksić M., Popov-Raljić J. (2015): Alergeni kao hemijski rizici u sistemu bezbednosti hrane i njihovo označavanje, Hotellink, Visoka hotelijerska škola, Beograd, Srbija.
6. Allergen bureau (2012): Informing the food industry VITAL 2.0 – what you need to know. Allergen bureau Australia and New Zealand.
7. Branum, M., Lukacs, S. (2008): Food Allergy Among US Children: Trends in Prevalence and Hospitalizations, National Center for Health Statistics, Hyattsville, MD.
8. Choi, H., Rajagopal, L. (2013): Food allergy knowledge, attitudes, practices, and training of foodservice workers at a university foodservice operation in the Midwestern United States, Food Control, No. 31, pp. 474–481.
9. De Blok, M., Vlieg-Boerstra, J., Oude Elberink, G., Duiverman, J., Galvin, A., Hourihane, B., Cornelisse-Vermaat, R., Frewer, L., Mills, C., Dubois, E. (2007): A framework for measuring thesocial impact of food allergy across Europe: a EuroPrevall state of the art paper, Allergy, No. 62, pp. 733–737.
10. Dupuis, R., Meisel, Z., Grande, D., Strupp, E., Kounaves, S., Graves, A., Frasso, R.,
1275EP 2017 (64) 3 (1263-1276)
RISK MANAGEMENT OF ALLERGENIC FOOD INGREDIENTS IN HOSPITALITY
Cannuscio, C. (2016): Food allergy management among restaurant workers in a large U.S. city, Food Control, No. 63, pp. 147-157.
11. Fooddrink Europe (2013): Guidance on Food Allergen Management for Food Manufacturers.
12. Hattersley, S., Ward, R., Baka, A., Crevel, R. (2014): Advances in the risk management of unintended presence of allergenic foods in manufactured food products – An overview, Food and Chemical Toxicology, No. 67, pp. 255-261.
13. Kroes, R., Galli, C., Munro, I., Schilter, B., Tran, L., Walker Würtzen, G. (2000): Threshold of toxicological concern for chemical substances present in the diet:a practical tool for assessing the need for toxicity testing, Food Chemical Toxicology, No. 38, pp. 255–312.
14. Kwon, J., Sauer, L., Wen, H., Bisges, E., Myers, L. (2013): Dining experiences ofcustomers with food allergies, In: Poster Presented at the Food and NutritionConference and Expo (FNCE), Houston, Texas.
15. Lee, Y.M., Sozen, E. (2016): Food allergy knowledge and training among restaurant employees, International Journal of Hospitality Management, No.57, pp. 52-59.
16. Madsen, B., Hattersley, S. Buck, J., Gendel, M., Houben, G., Hourihane, J., Mackie, A., Mills, N., Norhede, P., Taylor, S., Crevel, R. (2009): Approaches to risk assessment in food allergy: Report from a workshop ‘‘developing a framework for assessing the risk from allergenic foods”, Food and Chemical Toxicology, No. 47, pp. 480–489.
17. Madsen, B., Hattersley, S., Allen, J., Beyer, K., Chan, H., Godefroy, B., Hodgson, R., Mills, N., Munoz-Furlong, A., Schnadt, S., Ward, R., Wickman, M., Crevel R. (2012): Can we define a tolerable level of risk in food allergy? Report from aEuroPrevall/UK Food Standards Agency workshop, Clinical and Experimental Allergy, No. 42, pp. 30–37.
18. Mandabach, H., Ellsworth, A., Vanleeuwen, M., Blanch, G., Waters, L. (2005): Restaurant managers’ knowledge of food allergies: a comparison of differencesby chain or independent affiliation, type of service and size. Science Technology , Vol. 4, No. 2–3, pp. 63–77.
19. Popov-Raljić J. (2013): Senzorna analiza hrane i pića, Univerzitet u Novom Sadu, Prirodno-matematički fakultet, Departman za geografiju, turizam i hotelijerstvo, Novi Sad, Srbija.
20. Popov-Raljić, J., Blešić, I. (2016): Bezbednost hrane - primena HACCP sistema u ugostiteljstvu i hotelijerstvu, Univerzitet u Novom Sadu, Prirodno-matematički fakultet, Departman za geografiju, turizam i hotelijerstvo, Novi Sad, Srbija.
21. Pravilnik о deklarisanju, označavanju i reklamiranju hrane („Sl.glasnik RS“ broj 19/2017).
22. Zurzolo, A., Mathai, L., Koplin, J., Allen, J. (2012): Hidden allergens in foods and implications for labelling and clinical care of food allergic patients, Curr Allergy Asthma Report , No.12, pp. 292-296.
23. Zurzolo, G., Koplin, J., Mathai, M., Taylor, S., Tey, D., Allen, K. (2013): Foods with precautionary allergen labeling in Australia rarely contain detectable allergen. Clinical Communications, No. 4, pp. 401-403.

1276 EP 2017 (64) 3 (1263-1276)
Jovanka Popov-Raljić, Milica Aleksić, Vesna Janković, Ivana Blešić, Milan Ivkov
UPRAVLJANJE RIZICIMA ALERGENIH NAMIRNICA U UGOSTITELJSTVU7
Jovanka Popov-Raljić8, Milica Aleksić9, Vesna Janković10, Ivana Blešić11, Milan Ivkov12
Rezime
Nutritivni alergeni pojavili su se u poslednje dve decenije kao prikriven oblik pretnje koja bitno ugrožava javno zdravlje a njihovo označavanje i deklarisanje na prehrambenim proizvodima, piću i neupakovanim gastronomskim proizvodima jasno je definisano zakonskim regulativama.
U praksi menadžment hemijskih rizika suočen je sa više neočekivanih problema. Neki od njih su: hrana na čijoj je deklaraciji ili izjavi o alergnskim sastojcima, nutritivni alergen označen neuobičajenim imenom ili slični proizvodi različitih proizvođača od kojih jedan bezbedan a drugi sadrži alergen.
Ugostiteljski objekat koji se bavi proizvodnjom i distribucijom neupakovane hrane trebalo bi da osim razvijenog HACCP koncepta i standardizovanih receptura za pripremu hrane obezbedi detaljan, precizan i jasno definisan plan menadžmenta hemijskim rizicima.
Ključne reči: Alergene namirnice, menadžment rizicima, ugostiteljstvo, bezbednost hrane
7 Ovaj rad je dеo kratkoročnog projekta Pokrajine Vojvodine, Novi Sad, pod nazivom: Poljoprivredni, prehrambeni i gastro proizvodi u funkciji razvoja turizma u Vojvodini usmereni na autentičnu, zdravu i bezbednu hranu pod brojem: 142-451-2669/2017.
8 Redovni professor, dr Jovanka Popov-Raljić, Univerzitet u Novom Sadu, Prirodno-matematički fakultet, Departman za geografiju, turizam i hotelijerstvo, Trg Dositeja Obradovića br. 3. 21000 Novi Sad, Srbija, Telefon: +381 21 485 2884 E-mail: [email protected]
9 Milica Aleksić M.A., Asistent, Univerzitet u Novom Sadu, Prirodno-matematički fakultet, Departman za geografiju, turizam i hotelijerstvo, Trg Dositeja Obradovića br. 3. 21000 Novi Sad, Srbija, Telefon: +381 21 485 2884, E-mail: [email protected]
10 Vesna Janković, Institut za higijenu i tehnologiju mesa (INMES), Odsek za mikrobiološka i molekularno-biološka istraživanja, Ulica Kacanskog br. 13, Beograd, Srbija, Telefon: +381 11 26 50 655, E-mail: [email protected]
11 Vanredni profesor, dr Ivana Blešić, Univerzitet u Novom Sadu, Prirodno-matematički fakultet, Departman za geografiju, turizam i hotelijerstvo, Trg Dositeja Obradovića br. 3. 21000 Novi Sad, Srbija, Telefon: +381 21 485 2884, E-mail: [email protected]
12 Dr Milan Ivkov, Univerzitet u Novom Sadu, Prirodno-matematički fakultet, departman za geografiju, turizam i hotelijerstvo, Trg Dositeja Obradovića br. 3. 21000 Novi Sad, Srbija Telefon: +381 21 485 2842, E-mail: [email protected]

1277
Economics of Agriculture 3/2017UDC: 005.35:[658.8+641]
EP 2017 (64) 3 (1277-1295)
SOCIAL RESPONSIBILITY IN MARKETING OF THE FOOD INDUSTRY AND ITS DISTRIBUTORS
Review article
SOCIAL RESPONSIBILITY IN MARKETING OF THE FOOD INDUSTRY AND ITS DISTRIBUTORS1
Tanja M. Vujović2, Sonja M. Vujović3, Miloš Lj. Pavlović4
Abstract
The paper analyzes the contemporary consumer’s mentality (materialistic concept of consumption), which is greatly encouraged by numerous propaganda messages that are spread through various media. Human eating habits have been rapidly changing under the influence of media and other propaganda. People eat food of dubious quality, that is only in function of making larger profit without worrying about the health of people and other possible problems that can arise. In the focus of the research are food products advertisements that were broadcasted on the three most watched TV stations with national coverage in the Republic of Serbia. By analyzing the structure and slogans of most advertised food products, the authors came to the conclusion that the media are in direct function of food producers and distributers. Media and marketing, therefore, have great influence on consumption of unhealthy food, and it is in direct relationship with large profits of food producers and distributers. In such constellation of relations only the consumers are at loss.
Key words: marketing, social responsibility, food industry, food distributors, unhealthy food, profit.
JEL: L66, N50, M31, M37, Q13
Introduction
In order to increase profitability, the agricultural production increasingly begins to take the characteristics of industrial production. Over the time, it has become highly specialized,
1 This paper is the result of research within the project III 47023: “Kosovo and Metohija between national identi-ty and European integration”, funded by the Ministry of Education, Science and Tehnlogical Development of the Republic of Serbia.
2 Таnja Vujović Ph.D., Associate Professor, University of Pristina, Faculty of Economics, Kolasinska street no. 156, 38220 Kosovska Mitrovica, Serbia, Phone: +381 65 999 14 04, E-mail: [email protected]
3 Sonja Vujović Ph.D., Assistant Professor, University of Pristina, Faculty of Economics, Kolasinska street no. 156, 38220 Kosovska Mitrovica, Serbia, Phone: +381 66 140 461, E-mail: [email protected]
4 Miloš Pavlović Ph.D., Professor, Belgrade Business School – Higher education institution for applied studies, Kraljice Marije street no. 73, 11000 Belgrade, Serbia, Phone: + 381 64 277 94 21, E-mail: [email protected]

1278 EP 2017 (64) 3 (1277-1295)
Tanja M. Vujović, Sonja M. Vujović, Miloš Lj. Pavlović
relies on monocultures, involves intensive processing of large areas by modern agricultural machinery and the intensive use of industrial inputs (fertilizers, pesticides, animal foofdstuff, veterinary drugs and compositions...). There are also created new highly productive species and breeds. All that is mentioned is in direct function of yield increasing. However, intensive agriculture, in the long term, causes various disturbances in the biological balance of agro-accelerates the destruction of the structure, and consequently the quality and fertility of the soil and leads to progressive destruction of biodiversity. Longer treatment with artificial fertilizers which are, except the basic plant nutrients (nitrogen, phosphorus and potassium) and micronutrients (Fe, Mn, Zn, Co, B, Mo), also consisted of heavy metals (lead, zinc, arsenic, and cadmium). It leads to accumulation of mentioned substances in the soil (soil degradation), penetration into ground water flows, high concentration in the air by evaporation etc. In Germany, the emission of nitrogen gas in the atmosphere is extremely high. 60% of that emission comes from agriculture. The German government is trying to solve this situation by introducing stricter regulations and encouraging changes in agricultural production methods. On the other hand, Denmark has set a target to convert agricultural output in 100% organic and biodynamic, by the end of 2020 (Ilić, Krstić, Jovanović, 2017). In addition to the above mentioned negative effects, the incorrect and uncontrolled use of agrochemicals causes increased concentration of toxic and undesirable compounds in the plants, or any part of it which can be further used in human nutrition.This is bringing out the question of food health safety.
In addition, the food industry engaged in processing health and safety debatable agricultural products is, thanks to the technological processes of modernization and innovation, constantly expanding its product range and launching to market new food products thanks to the technological processes modernization and innovation. In this way, the industry has introduced a “new fashion” in human diet. As a result of these changes in the daily human diet there are products that contain increasing amounts of undesirable substances. Such substances are various additives, emulsifiers, preservatives, etc. A few decades ago, mentioned substances, could not even be imagined as an integral part of a human daily menu. Of course, such diet has resulted in the emergence of new diseases that are plaguing modern human.
The seriousness of this issue is supported by the fact that many poisons are legitimately involved in the food chain of the population. Rulebook on quality of animal feedstuff (last modified on February, 2014, by the Minister of Agriculture, Forestry and Water Management) specifies “maximum permitted levels “of „undesirable components”, i.e. toxins, such as arsenic, cadmium, fluorine, lead, mercury, nitrates, melamine and others that can be found in 1 kg of feedstuff. For example, The Rulebook is allowing the presence of arsenic (2-100 mg), cadmium (1-30 mg), fluorine (0.5-3,000 mg), lead (5-400 mg), mercury (0.1-0.5 mg). There is no need for much intelligence to realize that these toxins that are allowed to be found in animal feedstuff, can also be found in milk and dairy products, meat, eggs and other food products that contain ingredients of animal origin. The risk for human health can be understood if we know that arsenic, for example, is disrupting tissue oxygenation, impairing blood and blood-forming organs, liver, kidneys and heart, acting paralytic on the smooth muscle of blood vessels, damages the lining of the airways and eyes, has a carcinogenic effect

1279EP 2017 (64) 3 (1277-1295)
SOCIAL RESPONSIBILITY IN MARKETING OF THE FOOD INDUSTRY AND ITS DISTRIBUTORS
etc. Cadmium causes damage to the kidney, liver, bone, blood and blood-forming organs, causes irritation of mucous membranes of the airways and of the eye and causing lung cancer and prostate cancer. Mercury causes nausea, and vomiting, bloody diarrhea, heart failure, intestinal perforation, kidney damage, and damage to the nervous system, that is manifested through the loss of sensitivity in the fingers, tongue and around the mouth, impaired speech, swallowing and writing, visual field constriction and impairment, emotional instability, loss of concentration and memory, depression, hallucinations and even suicidal tendencies (Aranđelović, Jovanović, 2009)
Bearing all this in mind, there is a question about social responsibility primarily of the state and the legislator. They are, under the pressure of lobbyists and special interest groups, extending the value of allowed presence in food of some dangerous substances. There is also a question about social responsibility of farmers, food producers and distributors of food. All of them, although aware of negative treatment in primary food production, processing and distribution, sell and promote food to wide population of people. In this way, they stimulate the demand for such food affecting changes in eating habits, all to the detriment of consumers.
Methodology
This paper will present the authors understanding of current condition in society, considering food industry, food distributors and influence of marketing in a food production process and diet habits of the population, with a special focus on the Republic of Serbia. For the purpose of this paper, the authors analyzed TV advertisements of food products on the exact date for 24 hours on 3 most watched TV stations with national frequency (RTS1, PRVA TV, PINK). A specification of emitted advertisements for focused period will be shown in table, sorted by the producer, distributor, food product and slogan. That data, will be analyzed and sorted by the criterias such as most advertised or most interesting slogan, mostly broadcasted etc. According to that research, appropriate conclusions will be made.
Some issues about the food as a concept and phenomenon
According to the definition given by European Parliament and Council, „Food (or ‘foodstuff’) means any substance or product, whether processed, partially processed or unprocessed, intended to be, or reasonably expected to be ingested by humans. ‘Food’ includes drink, chewing gum and any substance, including water, intentionally incorporated into the food during its manufacture, preparation or treatment. It also includes drinking water “(Regulation (EC) No 178/2002). In a slightly altered form there is similar definition of „food“ in a „Law of food safety of Republic of Serbia“ (Službeni glasnik, 41/2009). In addition to this definition of food in both of mentioned documents also can be found definitions of terms such as “food business”, “food business operator”, “risk”, “risk analysis“, “risk management”, etc. In the literature that deals with food, there is more and more frequently in use the term “functional food”, which is defined as the food that “apart from the usual nutritional effects, has a beneficial effect on one or more targeted functions of the body, in a manner that is relevant or to improve the state of health and of well-being and / or to reduce the risk of disease” (Scientific Concepts of Functional Foods in Europe Consensus Document, 1999). The most

1280 EP 2017 (64) 3 (1277-1295)
Tanja M. Vujović, Sonja M. Vujović, Miloš Lj. Pavlović
important purpose of the functional food, therefore, is not to satisfy the hunger, or to ensure essentialnutrients to human body, but to prevent disease, and to improve physical and mental condition of human (Jašić, 2010).
Food has several important functions in the body, such as structural, control-protective and energy. However, modern human is also experiencing food as a pleasure that engages all the senses, as the mystical world of smells, tastes and the possibility of taste seduction and as a “feast for the eyes”. Nowadays, using food it become possible to express cultural identity and promote the dominant philosophy of a nation. Food alsobecomes an indicator of social status and symbol of religious, ethnic, generational and gender qualification, a reflection of lifestyle, part of important life events and emotional states, a matter of tradition, fashion, prestige, fashions etc.
Modern civilization and the neoliberal concept of economic development, food, as a means of survival and social and cultural phenomenon, has turned even in a lucrative business. As a result, food has received some other dimensions that had not been peculiar. Thus, food, among other things, has become an object of marketing, legislation, professional discussions about healthy diet, a key factor for geopolitical power, as well as the subject of international declarations, conventions and strategies.
Maybe more interesting role of food in modern period is as a factor of geopolitical power. Food production was one of freest human activities in period while it was produced on the basis of seed which has been passed from generation to generation. With the advent of the first hybrids that give higher yields than its natural counterpart, farmers, if wanted high-yield seeds, each year had to appear as a customer. Because of that, the production of seeds gradually passed from the hands of farmers, to the hands of corporations. In the beginning, corporations dealing with seeds were in state ownership, and after, thanks to the process of privatization and deregulation of this business activity, private sector has been involved in it. It has become very interesting for MNCs. A similar thing happened with the production of agrochemicals, fertilizers and agricultural machinery. In the last 40 years, drastic changes have been made in ownership of companies dealing with seed, food crops and other agricultural inputs for food production. There has been incredible augmentation of capital, in way that majorities of global companies, engaged in the production and sale of agricultural inputs, have become property of several major MNCs, as can be seen in Graphic 1.
Most current fusion in this sector is the acquisition of Monsanto (American company for the production of genetically modified foods) made by Bayer (German pharmaceutical giant). Acquisition occurred in September 2016, when Monsanto’s shareholders accepted the offer of $ 128 per share given by Bayer. It was 22 % more than their current value on the New York Stock Exchange. Whole transaction was worth $ 66 billion. This business combination has created the world’s largest producer of seeds, pesticides and genetically modified crops with intentions to become the market leader in Europe, Asia and the US. It is practically got the role of a monopolist in world food production given that it will have a share in one-third of the world’s markets. After these acquisitions, there are still a few major global “players” in the industry of seeds and crops, which also intend to merge (US

1281EP 2017 (64) 3 (1277-1295)
SOCIAL RESPONSIBILITY IN MARKETING OF THE FOOD INDUSTRY AND ITS DISTRIBUTORS
conglomerate DuPont plans to invest $ 130 billion in merging with DowChemicalCompany while ChinaNationalChemicalCorporation offered $ 43 billion to buy Swiss agribusiness company Syngenta) (https://www.rt.com/business/359275-bayer-buys-monsanto/ Bayer confirms Monsanto takeover with $66bn bid). All this has the effect of narrowing the freedom of individual producers and the creation of their dependence on large MNCs.
This dependence is not kept at the level of individual producers, but also reflects on the entire food industry, and is globally transmitted to the relations between the countries. Countries that had the potential to invest their capital in research and development of new sorts of seed, more efficient agrochemicals, fertilizers and agricultural machinery have become superior to those countries that could not develop their own production. Those countries have become dependent on imports of these factors of production. Thus, industrial agriculture, which is based on non-renewable seeds and which, in addition, is chemically intensive, capital-intensive and intensive in terms of fossil fuel consumption, reduced food independence of countries importing these agricultural inputs. A country which alone can not provide enough food for its nation, consequently is loosing its positions and facing with the problem of dependency which itself generates a number of geopolitical issues and opens the door to effect the determination of the geopolitical objectives and priorities, in the final, leads to some kind of colonial slavery.
Graph 1. Three Firm Market Concentration: 2013
Source: http://www.etcgroup.org/sites/www.etcgroup.org/files/files/etcgroup_agmergers_22oct2015.pptx_.pdf
Marketing and its social responsibility – some conceptual and theoretical issues
Accelerated industrialization of the late XIX and early XX century led to the emergence of new products and technological processes, which had created problems for consumers. The

1282 EP 2017 (64) 3 (1277-1295)
Tanja M. Vujović, Sonja M. Vujović, Miloš Lj. Pavlović
essence of problems lies in fact that customers were not able to protect themselves from suspicious quality products that have flooded the market (for example: excessive amounts of sugar in soft drinks, the use of nitrates as preservatives in the food industry, etc.). Consumer Dissatisfaction of consumers was particularly pronounced in 30s of the last century, during the global economic crisis, because of the enormous price rising. That trend was stopped during the World War II, but in 60s again started to be actual. After a series of scandals, most notably those related to the drug named Thalidomide but also for the automotive industry, the consumer movement named Consumerism, began its development. It was some kind of social response to the immoral and irresponsible behavior of producers. Consumerism is a movement with numerous activities of individuals, organized groups, government agencies and institutions, as well as those companies in order to protect the rights of consumers. At the same time, a concept of corporate social responsibility began to develop. Its development was a result of a public debate on the operations of large corporations, the working conditions in them and their impact on the natural and social environment and key purpose of the business and its responsibilities arising from that purpose.
The term “social responsibility” for the first appeared in 1953 in the publication of Howard Bowen “Social responsibility of businessman”. He tried to answer the question what level of responsibility to the society is reasonably to expect from a businessperson? Answering that question, Bowen took the view that the managers in their organization in the process of decision making, must take in consideration, except business goals, also the values of society and the environment in which they operate, and that they should “implement those policies bring those decisions and implement those actions in order to achieve social goals and benefits” (Bowd, 2003).
Peter Drucker, the guru of management, even though he stressed that the main goal of the company, and therefore management, is making a profit, he pointed that in addition, for the company it is very important to consider the impact of each business activity on society. Regarding this, Drucker also pointed that “the organization of the society of knowledge takes care of the society, within the limits of its competence, without compromising its business abilities” (Drucker, 1995).
According to the World Business Council for sustainable development, corporate social responsibility is a “firm commitment to promote sustainable economic development, and to improve the life quality, cooperates with employees, their families, local communities and society in at all” (Dahlsrud, 2008). This definition includes the economic aspect, since it talks about economic development, which should be sustainable, but also the social aspect, because it works to improve the quality of life of its stakeholders (employees with families, local community, society).
Within the European Union, for the first time CSR is being promoted as one of the new business policies in 2001 through the adoption of the Green Paper by the European Commission, in which the CSR is defined as, concept whereby companies integrate social and environmental concerns in their business operations and in relations with stakeholders, on a voluntary basis” (EC, 2001). The European Commission in October 2011 modified its definition of CSR,
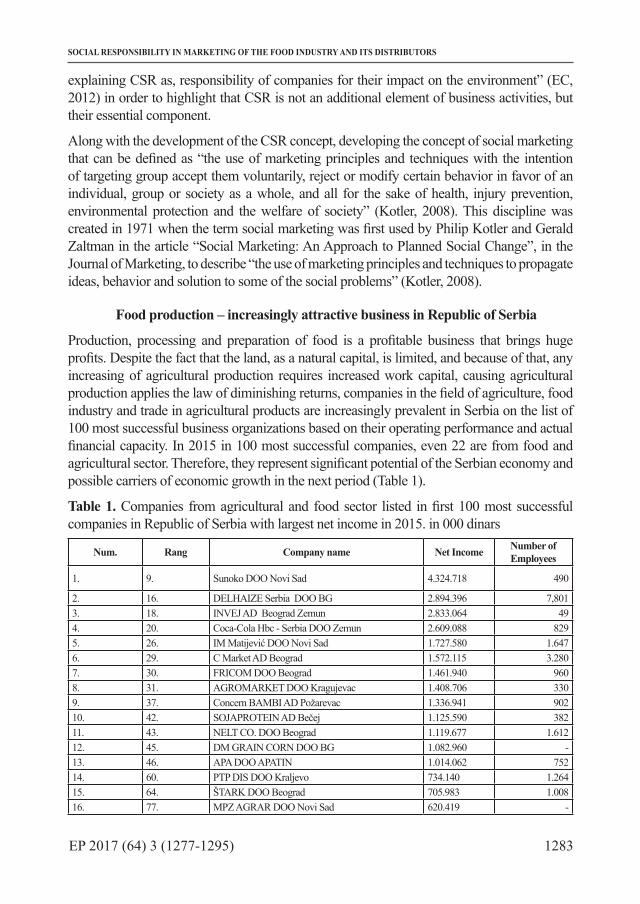
1283EP 2017 (64) 3 (1277-1295)
SOCIAL RESPONSIBILITY IN MARKETING OF THE FOOD INDUSTRY AND ITS DISTRIBUTORS
explaining CSR as, responsibility of companies for their impact on the environment” (EC, 2012) in order to highlight that CSR is not an additional element of business activities, but their essential component.
Along with the development of the CSR concept, developing the concept of social marketing that can be defined as “the use of marketing principles and techniques with the intention of targeting group accept them voluntarily, reject or modify certain behavior in favor of an individual, group or society as a whole, and all for the sake of health, injury prevention, environmental protection and the welfare of society” (Kotler, 2008). This discipline was created in 1971 when the term social marketing was first used by Philip Kotler and Gerald Zaltman in the article “Social Marketing: An Approach to Planned Social Change”, in the Journal of Marketing, to describe “the use of marketing principles and techniques to propagate ideas, behavior and solution to some of the social problems” (Kotler, 2008).
Food production – increasingly attractive business in Republic of Serbia
Production, processing and preparation of food is a profitable business that brings huge profits. Despite the fact that the land, as a natural capital, is limited, and because of that, any increasing of agricultural production requires increased work capital, causing agricultural production applies the law of diminishing returns, companies in the field of agriculture, food industry and trade in agricultural products are increasingly prevalent in Serbia on the list of 100 most successful business organizations based on their operating performance and actual financial capacity. In 2015 in 100 most successful companies, even 22 are from food and agricultural sector. Therefore, they represent significant potential of the Serbian economy and possible carriers of economic growth in the next period (Table 1).
Table 1. Companies from agricultural and food sector listed in first 100 most successful companies in Republic of Serbia with largest net income in 2015. in 000 dinars
Num. Rang Company name Net Income Number of Employees
1. 9. Sunoko DОО Novi Sad 4.324.718 490
2. 16. DELHAIZE Serbia DOO BG 2.894.396 7,8013. 18. INVEJ AD Beograd Zemun 2.833.064 494. 20. Coca-Cola Hbc - Serbia DOO Zemun 2.609.088 8295. 26. IM Matijević DOO Novi Sad 1.727.580 1.6476. 29. C Market AD Beograd 1.572.115 3.2807. 30. FRICOM DOO Beograd 1.461.940 9608. 31. AGROMARKET DOO Kragujevac 1.408.706 3309. 37. Concern BAMBI AD Požarevac 1.336.941 90210. 42. SOJAPROTEIN AD Bečej 1.125.590 38211. 43. NELT CO. DOO Beograd 1.119.677 1.61212. 45. DM GRAIN CORN DOO BG 1.082.960 -13. 46. APA DOO APATIN 1.014.062 75214. 60. PTP DIS DOO Kraljevo 734.140 1.26415. 64. ŠTARK DOO Beograd 705.983 1.00816. 77. MPZ AGRAR DOO Novi Sad 620.419 -
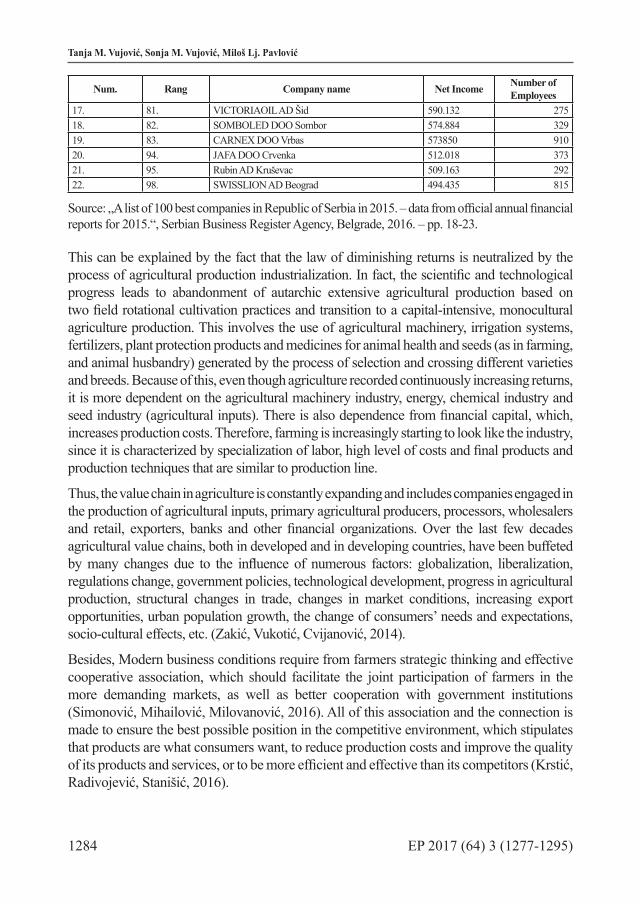
1284 EP 2017 (64) 3 (1277-1295)
Tanja M. Vujović, Sonja M. Vujović, Miloš Lj. Pavlović
Num. Rang Company name Net Income Number of Employees
17. 81. VICTORIAOIL AD Šid 590.132 27518. 82. SOMBOLED DOO Sombor 574.884 32919. 83. CARNEX DOO Vrbas 573850 91020. 94. JAFA DOO Crvenka 512.018 37321. 95. Rubin AD Kruševac 509.163 29222. 98. SWISSLION AD Beograd 494.435 815
Source: „A list of 100 best companies in Republic of Serbia in 2015. – data from official annual financial reports for 2015.“, Serbian Business Register Agency, Belgrade, 2016. – pp. 18-23.
This can be explained by the fact that the law of diminishing returns is neutralized by the process of agricultural production industrialization. In fact, the scientific and technological progress leads to abandonment of autarchic extensive agricultural production based on two field rotational cultivation practices and transition to a capital-intensive, monocultural agriculture production. This involves the use of agricultural machinery, irrigation systems, fertilizers, plant protection products and medicines for animal health and seeds (as in farming, and animal husbandry) generated by the process of selection and crossing different varieties and breeds. Because of this, even though agriculture recorded continuously increasing returns, it is more dependent on the agricultural machinery industry, energy, chemical industry and seed industry (agricultural inputs). There is also dependence from financial capital, which, increases production costs. Therefore, farming is increasingly starting to look like the industry, since it is characterized by specialization of labor, high level of costs and final products and production techniques that are similar to production line.
Thus, the value chain in agriculture is constantly expanding and includes companies engaged in the production of agricultural inputs, primary agricultural producers, processors, wholesalers and retail, exporters, banks and other financial organizations. Over the last few decades agricultural value chains, both in developed and in developing countries, have been buffeted by many changes due to the influence of numerous factors: globalization, liberalization, regulations change, government policies, technological development, progress in agricultural production, structural changes in trade, changes in market conditions, increasing export opportunities, urban population growth, the change of consumers’ needs and expectations, socio-cultural effects, etc. (Zakić, Vukotić, Cvijanović, 2014).
Besides, Modern business conditions require from farmers strategic thinking and effective cooperative association, which should facilitate the joint participation of farmers in the more demanding markets, as well as better cooperation with government institutions (Simonović, Mihailović, Milovanović, 2016). All of this association and the connection is made to ensure the best possible position in the competitive environment, which stipulates that products are what consumers want, to reduce production costs and improve the quality of its products and services, or to be more efficient and effective than its competitors (Krstić, Radivojević, Stanišić, 2016).

1285EP 2017 (64) 3 (1277-1295)
SOCIAL RESPONSIBILITY IN MARKETING OF THE FOOD INDUSTRY AND ITS DISTRIBUTORS
In addition, described method of agricultural production has bad influence on the soil - which is compacted and whose biological equilibrium is disturbed, leading to the appearance of resistant insect mutants and other pests and weeds which require a greater amount of the additional pesticide, all of which, ultimately, leads to the complete devastation of the land. Likewise, industrial animal production, which implies huge mechanized farms where animals are grown up, and even several thousands - of cattle, pigs, poultry under controlled conditions, results in the pollution of the soil, the air, surface and ground waters. All this leads to an increase in external costs – environmental costs. That cost is not included in produced units cost because they appear latter and become social or external costs.
Because of this, the interests of big capital invested in agricultural production (which began to dominate over the land and labor as primary factors of production) does not stop at the farm, but spread in the direction of financial institutions, agro-processing sector, segment of food trade and transport, up to the impact of government intervention and the intervention of supranational institutions. Thus, agricultural products, instead of being placed to the consumers in its elemental form, become inputs of processing and food sector, which have provided the “added value” in terms of adding work - because it is the only work in a position to produce surplus value, and profit. Therefore, agricultural products become “food products”, “enriched” with “permitted amounts” of undesirable substances in the form of additives, emulsifiers, preservatives and other additives, which role is to improve the color, taste, durability and structure of the newly formed food.
Diet habits, diseases and causes of death in Serbia
Choosing the type of ingredients used in the diet, the incidence and frequency of meals during the day and preparation of food, in a word, eating habits, due to the fact that it is constantly repeated throughout life, certainly are the factors that most affect human health. Canadian doctor and Professor William Osler (lived in late XIX and early XX century) was saying that 90% of illness, except infections and accidents, are closely related to the lack of basic nutrients in the diet and that savings in healthy food today means payment of medical services in later stages of life. (available at: http://ezinearticles.com/?) Nutrition is willing and conscious act, but to a large extent depends on several different factors, such as culture and traditions, the influence of family and social environment, the food availability and accessibility, etc. It is very important also because of the fact that inadequate diet increases the risk of malnutrition and obesity, which is leading to various health disorders.
Research on health condition, eating habits, lifestyle and other factors that affect the health of residents in Republic of Serbia was conducted by the Ministry of Health of the Republic of Serbia. The results of the research were analyzed by the Institute of Public Health of Serbia “Dr Milan Jovanovic Batut” for three periods in 2000, 2006, and 2013. According to the results of these studies, every fifth resident of adults (19.7%) do not think about health when choosing a food. About the connectivity of nutrition and health are thinking residents of Vojvodina (23.8%), suburban settlements (22.8%), men (26.3%), lower educated (23.6%) and the poorest residents (25,7%). Yet it is encouraging that almost half the population of Serbia (49.1%) due to health reasons have changed at least something in the diet in the year
1286 EP 2017 (64) 3 (1277-1295)
Tanja M. Vujović, Sonja M. Vujović, Miloš Lj. Pavlović
preceding the survey. Thus, one in five (21.1%) reduced the intake of fat, 14.1% of the fat is changed, which are used as food, 15.7% reduced the intake of salt, 15.1% sugar intake and 8.2% reduced weight with diet (Ministarstvo zdravlja Republike Srbije i Institut za javno zdravlje Srbije „Milan Jovanović Batut”, 2014).
In Serbia in 2013 a habit to have breakfast every day had 78.1% of the population, at least one cup of milk and / or dairy products daily consumed 51.7% of the population in the diet is still mostly used white bread (60.1% ), 25.9% of the population used the animal fats for the preparation of meals, every eleventh resident said that put extra salt on food (9.1%), at least twice a week, fish is on the menu had only 12.5% of the population every other citizen of Serbia is insufficient or never consumed fruits (54.4%) and vegetables (fresh, frozen, conserved soup or freshmade juices) on a daily basis had consumed 57.1% of the population. On the basis of the measured values of a body mass index (BMI) was 40.4% was fed normally the population, and more than half (56.3%) were overweight, or predgojazno (35.1%) and obese (21.2%), and 3.2% of the population was undernourished.
More than half of the population of Serbia (51.8%) smoked once in their lifetime, of which 81.7% of the population belonged to the category of daily smokers. What is particularly worrying being the fact that the 26% of population aged 15-24 are smokers. Another bad habit of our population is consuming alcohol and it is often a part of some customs, tradition or culture. In 2013, 53.9% of the population has consumed alcohol at least once, but there are 4.7% of population that consume alcohols every day. The population of young people between 15 and 19 years, 53% had consumed alcohol.
Concerning physical activity, as key determinants of energy balance and the control of body weight, and the factors which reduces the risk of contracting cardio and cerebra-vascular disease, diabetes, cancer, breast cancer and colon cancer, depression and the like., Research has shown that as much as 43, 6% of the population during their work (which comprises paid and unpaid work, family care, studying or learning) is sitting or standing. Daily bike riding for at least 10 minutes is practiced by 10.4% of the population, a fitness, sports or recreation at least three times a week is practiced by 8.8% of the population, and intense physical activity aimed at strengthening the muscles, at least three times a week is practiced by only 4.8% of the population of Serbia.
According to the same Research, as a result of mentioned dietary habits and low physical activity chronic non-communicable diseases for decades are dominant in our country. Thus, the largest population (31%) suffer from high blood pressure, the deformity of the spine, or other chronic problem with back (19.1%), elevated blood lipids (12.9%) and deformity of the door or other problem with chronic cervical spine (12.3%), coronary heart disease or anginupektoris (10.2%), degenerative joint disease-arthrosis (9.3%), allergy (8.8%), diabetes (7.6%), depression (6.3%) and kidney problems (5.6%).
The most common causes of death in 2015, include: diseases of the circulatory system 52.7% (men 47.8% and women 57.6%) tumors 20.6% (23.5% men and 17.5% women) diseases of the respiratory system 5.3% (6.1% of men and 4.5% of female), diseases of the digestive system 3.2% (3.5% men and 2.9% women), mental disorders and behavioral disorders 1.4%
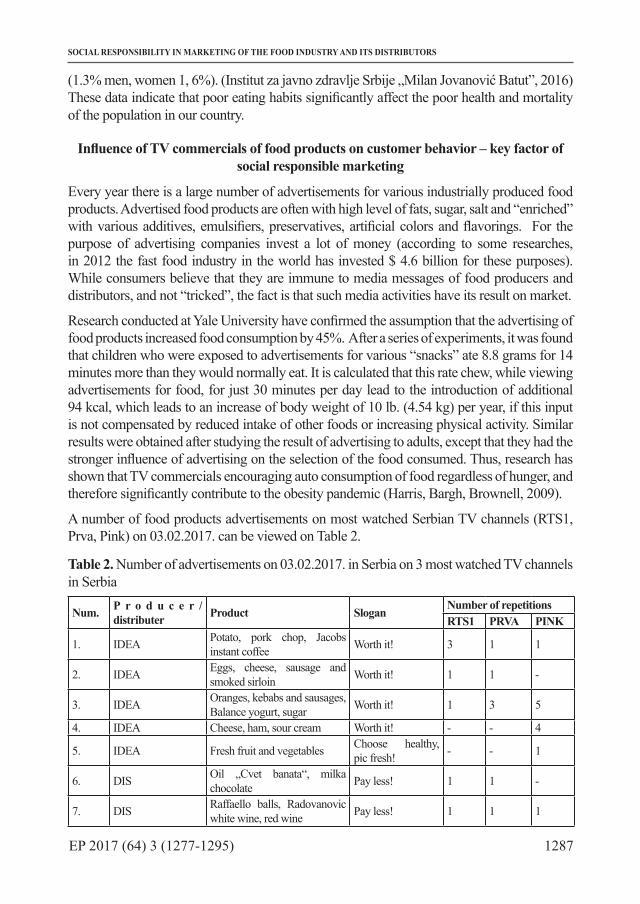
1287EP 2017 (64) 3 (1277-1295)
SOCIAL RESPONSIBILITY IN MARKETING OF THE FOOD INDUSTRY AND ITS DISTRIBUTORS
(1.3% men, women 1, 6%). (Institut za javno zdravlje Srbije „Milan Jovanović Batut”, 2016) These data indicate that poor eating habits significantly affect the poor health and mortality of the population in our country.
Influence of TV commercials of food products on customer behavior – key factor of social responsible marketing
Every year there is a large number of advertisements for various industrially produced food products. Advertised food products are often with high level of fats, sugar, salt and “enriched” with various additives, emulsifiers, preservatives, artificial colors and flavorings. For the purpose of advertising companies invest a lot of money (according to some researches, in 2012 the fast food industry in the world has invested $ 4.6 billion for these purposes). While consumers believe that they are immune to media messages of food producers and distributors, and not “tricked”, the fact is that such media activities have its result on market.
Research conducted at Yale University have confirmed the assumption that the advertising of food products increased food consumption by 45%. After a series of experiments, it was found that children who were exposed to advertisements for various “snacks” ate 8.8 grams for 14 minutes more than they would normally eat. It is calculated that this rate chew, while viewing advertisements for food, for just 30 minutes per day lead to the introduction of additional 94 kcal, which leads to an increase of body weight of 10 lb. (4.54 kg) per year, if this input is not compensated by reduced intake of other foods or increasing physical activity. Similar results were obtained after studying the result of advertising to adults, except that they had the stronger influence of advertising on the selection of the food consumed. Thus, research has shown that TV commercials encouraging auto consumption of food regardless of hunger, and therefore significantly contribute to the obesity pandemic (Harris, Bargh, Brownell, 2009).
A number of food products advertisements on most watched Serbian TV channels (RTS1, Prva, Pink) on 03.02.2017. can be viewed on Table 2.
Table 2. Number of advertisements on 03.02.2017. in Serbia on 3 most watched TV channels in Serbia
Num. P r o d u c e r /distributer Product Slogan Number of repetitions
RTS1 PRVA PINK
1. IDEA Potato, pork chop, Jacobs instant coffee Worth it! 3 1 1
2. IDEA Eggs, cheese, sausage and smoked sirloin Worth it! 1 1 -
3. IDEA Oranges, kebabs and sausages, Balance yogurt, sugar Worth it! 1 3 5
4. IDEA Cheese, ham, sour cream Worth it! - - 4
5. IDEA Fresh fruit and vegetables Choose healthy, pic fresh! - - 1
6. DIS Oil „Cvet banata“, milka chocolate Pay less! 1 1 -
7. DIS Raffaello balls, Radovanovic white wine, red wine Pay less! 1 1 1
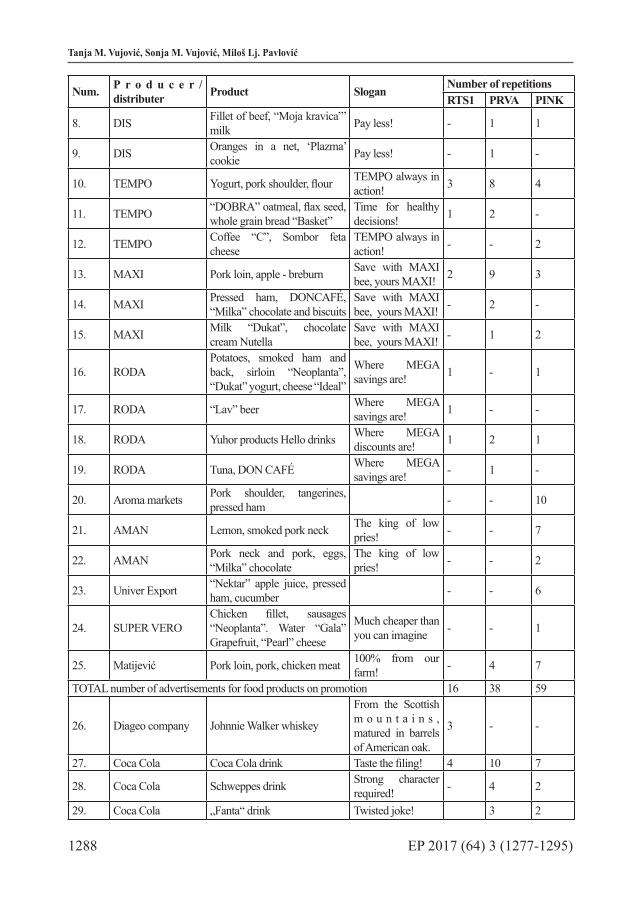
1288 EP 2017 (64) 3 (1277-1295)
Tanja M. Vujović, Sonja M. Vujović, Miloš Lj. Pavlović
Num. P r o d u c e r /distributer Product Slogan Number of repetitions
RTS1 PRVA PINK
8. DIS Fillet of beef, “Moja kravica”’ milk Pay less! - 1 1
9. DIS Oranges in a net, ‘Plazma’ cookie Pay less! - 1 -
10. TEMPO Yogurt, pork shoulder, flour TEMPO always in action! 3 8 4
11. TEMPO “DOBRA” oatmeal, flax seed, whole grain bread “Basket”
Time for healthy decisions! 1 2 -
12. TEMPO Coffee “C”, Sombor feta cheese
TEMPO always in action! - - 2
13. MAXI Pork loin, apple - breburn Save with MAXI bee, yours MAXI! 2 9 3
14. MAXI Pressed ham, DONCAFÉ, “Milka” chocolate and biscuits
Save with MAXI bee, yours MAXI! - 2 -
15. MAXI Milk “Dukat”, chocolate cream Nutella
Save with MAXI bee, yours MAXI! - 1 2
16. RODAPotatoes, smoked ham and back, sirloin “Neoplanta”, “Dukat” yogurt, cheese “Ideal”
Where MEGA savings are! 1 - 1
17. RODA “Lav” beer Where MEGA savings are! 1 - -
18. RODA Yuhor products Hello drinks Where MEGA discounts are! 1 2 1
19. RODA Tuna, DON CAFÉ Where MEGA savings are! - 1 -
20. Aroma markets Pork shoulder, tangerines, pressed ham - - 10
21. AMAN Lemon, smoked pork neck The king of low pries! - - 7
22. AMAN Pork neck and pork, eggs, “Milka” chocolate
The king of low pries! - - 2
23. Univer Export “Nektar” apple juice, pressed ham, cucumber - - 6
24. SUPER VEROChicken fillet, sausages “Neoplanta”. Water “Gala” Grapefruit, “Pearl” cheese
Much cheaper than you can imagine - - 1
25. Matijević Pork loin, pork, chicken meat 100% from our farm! - 4 7
TOTAL number of advertisements for food products on promotion 16 38 59
26. Diageo company Johnnie Walker whiskey
From the Scottish m o u n t a i n s , matured in barrels of American oak.
3 - -
27. Coca Cola Coca Сola drink Taste the filing! 4 10 7
28. Coca Cola Schweppes drink Strong character required! - 4 2
29. Coca Cola „Fanta“ drink Twisted joke! 3 2
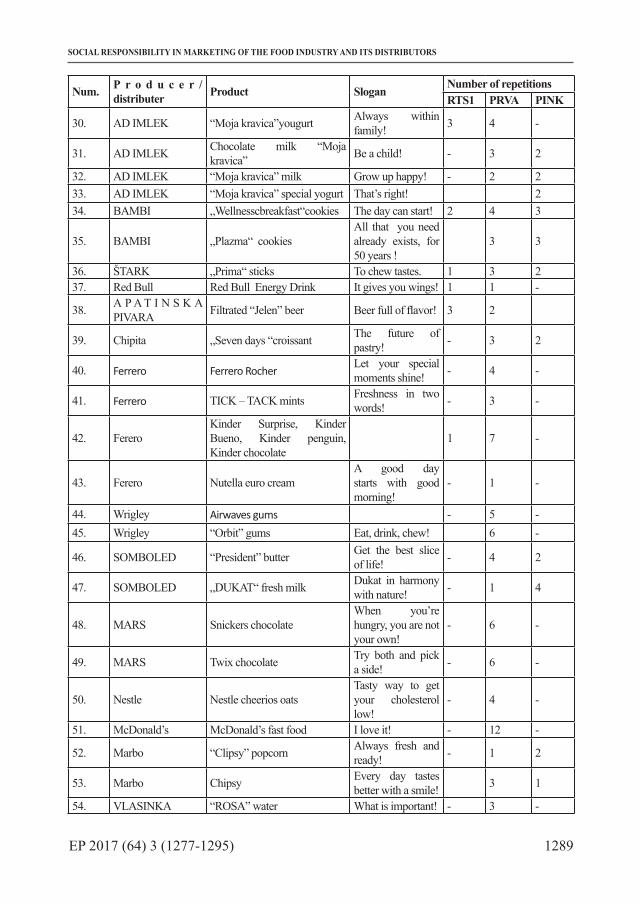
1289EP 2017 (64) 3 (1277-1295)
SOCIAL RESPONSIBILITY IN MARKETING OF THE FOOD INDUSTRY AND ITS DISTRIBUTORS
Num. P r o d u c e r /distributer Product Slogan Number of repetitions
RTS1 PRVA PINK
30. AD IMLEK “Moja kravica”yougurt Always within family! 3 4 -
31. AD IMLEK Chocolate milk “Moja kravica” Be a child! - 3 2
32. AD IMLEK “Moja kravica” milk Grow up happy! - 2 233. AD IMLEK “Moja kravica” special yogurt That’s right! 234. BAMBI „Wellnessсbreakfast“cookies The day can start! 2 4 3
35. BAMBI „Plazma“ cookiesAll that you need already exists, for 50 years !
3 3
36. ŠTARK „Prima“ sticks To chew tastes. 1 3 237. Red Bull Red Bull Energy Drink It gives you wings! 1 1 -
38. A P A T I N S K A PIVARA Filtrated “Jelen” beer Beer full of flavor! 3 2
39. Chipita „Seven days “croissant The future of pastry! - 3 2
40. Ferrero Ferrero RocherLet your special moments shine! - 4 -
41. Ferrero TICK – TACK mints Freshness in two words! - 3 -
42. FereroKinder Surprise, Kinder Bueno, Kinder penguin, Kinder chocolate
1 7 -
43. Ferero Nutella euro creamA good day starts with good morning!
- 1 -
44. Wrigley Airwaves gums - 5 -45. Wrigley “Orbit” gums Eat, drink, chew! 6 -
46. SOMBOLED “President” butter Get the best slice of life! - 4 2
47. SOMBOLED „DUKAT“ fresh milk Dukat in harmony with nature! - 1 4
48. МАRS Snickers chocolateWhen you’re hungry, you are not your own!
- 6 -
49. МАRS Twix chocolate Try both and pick a side! - 6 -
50. Nestle Nestle cheerios oatsTasty way to get your cholesterol low!
- 4 -
51. McDonald’s McDonald’s fast food I love it! - 12 -
52. Marbo “Clipsy” popcorn Always fresh and ready! - 1 2
53. Marbo Chipsy Every day tastes better with a smile! 3 1
54. VLASINKA “ROSA” water What is important! - 3 -

1290 EP 2017 (64) 3 (1277-1295)
Tanja M. Vujović, Sonja M. Vujović, Miloš Lj. Pavlović
Num. P r o d u c e r /distributer Product Slogan Number of repetitions
RTS1 PRVA PINK
55. PIONIR DOO “VITANOVA” cookies A healthy, natural and tasty! - - 39
56. PIONIR DOO “Kidy” chocolate You should like KIDY! - - 2
57. PIONIR DOO “Medeno srce” cakes Share the love! - - 3
58. Kraft foods „Milka“ pralines Little things mean love! - - 7
59. Kraft foods “Milka” chocolate
Tenderness comes from within!One chocolate – three experience!
- - 33
60. Swisslion “Banat” chocolates - - 3
61. Swisslion Euro cream “Swisslion” We grow up together! - - 3
62. Kutil DOO “Jaffa” juices Everyone win with JAFFA juices! - - 3
63. Vino Župa “LaVita” juices A joy of life! - - 364. Nectar DOO “Nectar” juices It’s not the same! - - 1
65. Knežević trade “Oki-boki” flips Always good company - - 1
Total number of advertisments: 33 132 166
Source: Table has made according to the advertisement program on 3 most watched TV stations in Republic of Serbia (RTS1, Prva, Pink)
As you can see from the table 2 on the day 03.02.2017. in the period from 00 to 24 on the RTS1 shows a total of 33 advertising of foodstuffs, the PRVA television 132 commercials and Pink 166 commercials. Out of this number on advertisements for various food products (fresh meat, meat products, cheese, milk, sweets, flour, sugar, coffee, beer and soft drinks) that are in large retail chains (IDEAS, MAXI -it DIS, RODI et al.), sold at special prices in the RTS 1 accounted for 48.5% of ad (16), at the first 28.8% (38 ad) and on Pink 35.5% or a total of 59 advertisements. So, depending on which program the day followed, viewers had the opportunity to 16, 38 or 59 times to hear the message “worth it!”, “You’ll pay less”, “Save with the MAXI-bee”, “Where is the mega savings “, “ king of low prices” or to view flushed auntie who busily pushing carts through the tempo hypermarket and hails to her also busy daughter: ‘tempo Zorica, turn up the tempo” to arrive on time to buy all of those products while there are still discount prices.
On that Friday, the most advertised were Pionirs “Vita nova” cookies with the slogan “A healthy, natural and tasty!” and “Here for 100 years, all that connects pioneer products is love” - as many as 39 times, to which are advertised and a pioneer of products such Kidy chocolate (Kidy should you like it!) - 2 times, and “Medeno srce” (“Share love”) - 3 times. Vitanova biscuit is marketed as a” healthy natural and tasty “, although in itself, among other things, comprises an antioxidant sodium metabisulfite (E223), whose side effects may be bad for digestive tract, destroys the vitamin B1 and B12 and causes allergic reactions in

1291EP 2017 (64) 3 (1277-1295)
SOCIAL RESPONSIBILITY IN MARKETING OF THE FOOD INDUSTRY AND ITS DISTRIBUTORS
asthmatics and designated as the substance used, and should be avoided. Furthermore, the biscuit contains a raising agent, ammonium hydrogen carbonate (E503), sodium hydrogen carbonate (E500), disodium diphosphate (E450), which can cause irritations, and the hard to digest (Janković, 2002).
Considering a number of broadcasts following advertisements were present: drinks CocaCola (CocaCola, Schweppes, Fanta) with the slogans: “Taste the filing!” Requires a lot of character! “” Creepy cool!”, which are repeated for 17 times on PRVA TV, 11 on PINK TV and 14 times on RTS. After them there are advertisements of Ferrero (praline Ferrero Rocher, Kinder sweets, Tic-tac mints, Nutella chocolate cream), which are broadcasted for 15 times on PRVA TV, with the advertising slogan “Let your special moments shine!”, which follows Ferrero Rocher praline and slogans “Leave it to the pleasure”, “the most beautiful moments of our lives”, “Discover the penguin in you”, “Barbie figurines which are easy to combine “addressed to the youngest, because they follow the Kinder line of products created specifically for children. Products by Kraft Foods Company (Milka chocolate and a variety of Milka chocolate) advertised on TV Pink 13 times with the slogan “Small things mean love?” “Tenderness comes from inside “and “One chocolate three experience!”. Right after them, according to the number of repeats, there are McDonald’s products, which are with the slogan “I love it!” broadcasted 12 times on the PRVA TV, different MARS’s chocolates, PRVA TV -12 times Wrigley’s Orbit chewing gum and Airwaves - 11 times, Imlek dairy products ode – PRVA TV 9 and 6 times on PINK TV, etc., etc. Throughout the day aired only one advertisement of fresh fruits and vegetables that can be bought in IDEA with the slogan “Choose healthy, “Pick fresh” on Pink TV.
In addition to the advertisement of the food product on all three channels have been broadcast total 170 ads (for RTS1 - 3 ad, PRVA TV - 55 and PINK TV - 112) for various compositions calming bowel, reducing pain, strengthening bone, reduce blood sugar, increased potency, enhance immunity, reduce stress, relieve the airways. One gets the impression that the consumption of foods advertised inevitably leads to health problems.
According to what have been said, we can make a conclusion that most frequently advertised are unhealthy foods that are edible, but the ongoing production process lose their nutritional properties (sweets, soft drinks, fast food, snacks, etc.). If you pay attention to the slogans that accompanied the advertisements it can be seen that they are mainly focused on the emotions of the moment and the ongoing (“It must be like it”, “Share the Love”, “Little things mean love”). Their goal is to encourage and inspire, to create a spectacle and illusion, they are designed primarily for deeper, unconscious layers of the personality, creating a state of light trance or confusion, weakening consumers will and adherence to the spoken and unspoken commands in advertising material. In addition, a large number of advertisements placed emphasis on saving when purchasing products at fantastic prices and slogans that accompany them encourage immediate action.
In the opinion of many dealing with irritating commercials, it can be concluded that people are generally annoyed by the fact that advertisements for various kinder chocolates intended for children always show unrealistically nice tidy house and
1292 EP 2017 (64) 3 (1277-1295)
Tanja M. Vujović, Sonja M. Vujović, Miloš Lj. Pavlović
cheerful parents, which are almost impossible to find in everyday life. Advertisements for CocaCola resentment is what creates the impression that the consumption of Coca Cola sufficient condition to achieve a happy life full of love and endless entertainment, and advertisements for Milka chocolate showMilka cow sometimes as a cow and sometimes as a bull which at urban children creates confusion, and at those from rural areas provokes derision. Advertisements for SevenDays croassaint and “Clipsy” popcorn resentment to deceive consumers presenting them as fresh pastry or just made popcorn, which is, of course, far from the truth.
Conclusion
The modern world, which is driven by the logic of profit and whose development is based on the concept of neoliberal capitalism, took a primary properties from food, especially if it is perceived as a “functional food” - properties that affect the improvement of the state of health and well-being and / or to reduce risk of the diseases, a property that has food as a social interaction (the cause for the assembly), or a form of identity (national, gender, religious et al.), and turned it into a means for the accumulation of a profit, as well as in the means for the acquisition of geo-political power. As the huge amount of capital invested in both primary agricultural production and the food industry, it is necessary to provide a market for the thus obtained food products, to return the invested capital and ensure profits, and marketing given the task of food turned into a thing prestige and an indicator of social status and stock, a thing of fashion and fashions... With a large capital investment in the promotion of food products, marketing has managed to impose a new way of diet habits of modern human, which had as consequences more or less unhealthy foods in their daily menu.
By analyzing the advertising content that relates to food products which are broadcasted on the three most watched Serbian TVs, it can be concluded that consumers are “bombed” daily with a large number of commercial confectionery products (various sweets and snacks), carbonated soft drinks, fast food - that is, mainly products that are harmful to human health. All these signs are a real visual spectacle that accompanies the messages that they are directed to the emotions, and those customers into the world of imagination and fantasy. As the feeling after the material consumption of the product can never create that satisfaction how they created fantasy that the consumer has while watching the ad, this leads to frustration and dissatisfaction, which becomes a real driving force for further consumption to advertising content, and food products continued pursuit of pleasure. Thus, the modern human unwittingly drawn into a vicious circle and constantly moving between illusion and dissatisfaction, and becomes deeply unhappy, due to impaired physical and mental health, acquired excess weight, and the fact that it can not achieve the illusion of pleasure. Because all of mentioned, greater attention should be paid to increasing media education of consumers, but also insist on respect for ethics, morality and promotion of greater social responsibility of food producers, in order to create conditions for achieving sustainable development.

1293EP 2017 (64) 3 (1277-1295)
SOCIAL RESPONSIBILITY IN MARKETING OF THE FOOD INDUSTRY AND ITS DISTRIBUTORS
Literature
1. Agencija za privredne registre (2016): Sto naj... privrednih društava u Republici Srbiji u 2015. godini - podaci iz redovnih godišnjih finansijskih izveštaja za 2015. godinu, Beograd, Srbija
2. Aranđelović, M., Jovanović, J. (2009): Medicina rada, Medicinski fakultet, Univerzitet u Nišu, Niš, Srbija
3. Bayer confirms Monsanto takeover with $66bn bid, (available at: https://www.rt.com/business/359275-bayer-buys-monsanto/)
4. Bowd. R. (2003): CSR – A Schools Approach to an inclusive Definition: Setting the Scene for Future Public Relations and Communications Research, Centre for Corporate and Public Affairs, Manchester Metropolitan University, UK; available at http://www.cipr.co.uk/groups/special/csrnetwork/special16e_3.htm
5. Commission of The European Communities (2001): Green paper: Promoting a European Framework for Corporate Sociate Responsibility, DOC/01/9, Brussels, Belgium
6. Dahlsrud, A. (2008): How Corporate Social Responsibility is Defined: An Analysis of 37 Definitions, Corporate Social Responsibility and Environmental Management, vol. 15, Issue January/February, pp. 1-13, John Wiley & Sons Ltd and ERP Environment, New York, USA
7. Drucker, P. (1995): Postkapitalističko društvo, Grmeč, Privredni pregled Beograd, Srbija
8. Euro Commerce (2012): A renewed EU strategy 2011-14 for Corporate Social Responsibility, Brussels, Belgium
9. European Parliament, Council of Europe (2002): Regulation (EC) No 178/2002 of the European Parliament and of the Council, Official Journal of the European Communities, Brussels, Belgium.
10. Harris, J., Bargh, J., Brownell K. (2009): Priming Effects of Television Food Advertising on Eating Behavior, Health Psychology, vol. 28, No: 4, pp. 404-413, American Psychological Association, Washington DC, USA
11. Ilić, I., Krstić, B., Jovanović, S. (2017): Environmental Performances of Agriculture in The European Union Countries, Economics of Agriculture vol. LXIV, no. 1, pp. 41-57, Institut za ekonomiku poljoprivrede, Beograd, Srbija
12. Institut za javno zdravlje Srbije ,,Dr Milan Jovanović Batut” (2016): Zdravstveno-statistički godišnjak Republike Srbije 2015., Beograd, Srbija,
13. Janković, S. (2002): Aditivi, Medicus, Vol. 3, No. 1, pp. 45-56. Medicinski fakultet, Univerzitet u Kragujevcu, Kragujevac, Srbija
14. Jašić, M. (2010): Uvod u biološki aktivne komponente hrane, Tehnološki fakultet, Univerzitet u Tuzli, Tuzla, Bosna i Hercegovina
15. Kotler, Ph., Roberto, N., Li, M. (2008): Socijalni marketing, Clio, Beograd, Srbija
1294 EP 2017 (64) 3 (1277-1295)
Tanja M. Vujović, Sonja M. Vujović, Miloš Lj. Pavlović
16. Krstić, B., Radivojević, V., Stanišić, T. (2016): Measuring And Analysis Of Competition Intensity In The Sugar Market In Serbia, Economics of Agriculture, Vol. 63, No. 2, pp. 389-407, Institut za ekonomiku poljoprivrede, Beograd, Srbija
17. Ministarstvo zdravlja Republike Srbije, Institut za javno zdravlje Srbije „Milan Jovanović Batut” (2014): Rezultati istraživanja zdravlja stanovnišva Srbije - 2013. godina, Beograd, Srbija
20. Simonović, Z., Mihailović, B., Milovanović, Z. (2016): Cooperatives And Farmers Association As A Model Of Entrepreneurship In Serbian Agriculture Regarding The Case Of Nisava District, Economics of Agriculture, vol. LXIII, no. 2, pg. (699-712), Institut za ekonomiku poljoprivrede, Beograd, Srbija
22. Zakić, N., Vukotić, S., Cvijanović, D. (2016): Organisational Models In Agriculture With Special Reference To Small Farmers, Economics of Agriculture vol. LXI, no. 1, pp. 225-236, Institut za ekonomiku poljoprivrede, Beograd, Srbija
23. Službeni glasnik Republike Srbije, br. 41/2009: Zakon o bezbednosti hrane

1295EP 2017 (64) 3 (1277-1295)
SOCIAL RESPONSIBILITY IN MARKETING OF THE FOOD INDUSTRY AND ITS DISTRIBUTORS
DRUŠTVENA ODGOVORNOST U MARKETINGU PROIZVOĐAČA HRANE I NJENIH DISTRIBUTERA5
Tanja M. Vujović6, Sonja M. Vujović7, Miloš Lj. Pavlović8
Apstrakt
U radu je analiziran savremeni potrošački mentalitet (materijalistički koncept potrošnje,) koji se u velikoj meri podstiče brojnim propagandnim porukama koje se šire putem raznih medija. Ljudske navike u ishrani se, pod uticajem medija i druge propagande, brzo menjaju. Ljudi jedu hranu sumnjivog kvaliteta, koja je samo u funkciji stvaranja većeg profita bez brige o zdravlju stanovništva i drugim problemima koji se mogu pojaviti. U fokusu su se našle reklame prehrambenih proizvoda koje su se emitovale na tri najgledanije televizije sa nacionalnom frekvencijom u Republici Srbiji. Analizom strukture najreklamiranijih proizvoda i slogana koji su ih pratili, autori su došli do zaključka da su mediji u funkciji proizvođača industrijski proizvedene hrane i da oni u velikoj meri podstiču tražnju za nezdravim namirnicama zahvaljujući čemu ogromne profite ostvarujui mediji i proizvođači hrane i farmaceutska industrija. U ovakvoj konstelaciji međusobnih odnosa jedino je potrošač na gubitku.
Ključne reči: marketing, društvena odgovornost, hrana, proizvođači hrane, distributeri hrane, nezdrava hrana, profit.
5 Rad je rezultat naučno-istraživačkog rada u okviru projekta III 47023 “Kosovo i Metohija između nacionalnog identiteta i evrointegracija” koji finansira Ministarstvo prosvete, nauke i tehnološkog razvoja Republike Srbije.
6 Vanredni profesor, dr Таnja Vujović, Univerzitet u Prištini, Ekonomski fakultet, Kolašinska ulica br. 156, Kosovska Mitrovica, Srbija, Telefon: +381 65 999 14 04, E-mail: [email protected]
7 Docent, dr Sonja Vujović, Univerzitet u Prištini, Ekonomski fakultet, Kolašinska ulica br. 156, Kosovska Mitrovica, Srbija, Telefon: +381 65 999 14 04, E-mail: [email protected]
8 Redovni profesor, dr Miloš Pavlović, Beogradska poslovna škola – Visoka škola strukovnih studija, Ulica Kraljice Marije br. 73, 11000 Beograd, Srbija, Telefon: +381 64 277 94 21, E-mail: [email protected]


1297EP 2017 (64) 3 (1297-1302)
INSTRUCTIONS TO AUTHORS
DETAIL INSTRUCTIONS TO AUTHORS WITH TEMPLATE FOR THE ARTICLES THAT WILL BE PUBLISHED IN JOURNAL ECONOMICS OF
AGRICULTURE
The ECONOMICS OF AGRICULTURE is an international scientific journal, published quarterly by Balkan Scientific Association of Agricultural Economists (BSAAE) in cooperation with Institute of Agricultural Economics Belgrade (IAE) and Academy of Economic Studies Bucharest (ASE), in which are published original scientific papers (double reviewed), review articles, pre-announcements, book reviews, short communications and research reports. Research reports and book reviews will be accepted after previous consultation/invitation with/from either a journal Editor, or Editor of the book review, in accordance with the journal submission criteria.
The journal ECONOMICS OF AGRICULTURE accepts only articles submitted electronically on English language, as e-mail attachment to the following e-mail address: [email protected] and [email protected]
The articles have to be submitted in duplicate, providing one copy without information about author(s), in order not to violate double-blind review process. In the second copy of the article must be specified all information about author(s) (in required format) that are necessary for further correspondence and full transparency of published article.
Submission of articles to the ECONOMICS OF AGRICULTURE implies that their content has not been published previously in English, or in any other language. Also, submitted papers should not be under consideration for their publication elsewhere (in some other journal) and their publication has to be approved by all authors with signed declaration. Publisher reserves right to verify originality of submitted article by use of specialized software for plagiarism detection.
1298 EP 2017 (64) 3 (1297-1302)
INSTRUCTIONS TO AUTHORS
REVIEW PROCESS
The articles submitted to the journal ECONOMICS OF AGRICULTURE will be double blind (peer) reviewed and must have two positive reviews consistent to the generally accepted scientific standards. The reviewer independently and autonomously evaluates the article and could give a positive review, suggest some corrections, or give a negative review. In case that the review reports are antagonistic (one is positive and the second one is negative) the final decision will be on third review. Manuscript returned to the author(s) for revision does not guarantee the publication acceptance after article correction. The final decision for publication will be made after repeated review of the revised manuscript. If the article is evaluated positively and accepted for publication, each author has to sign the warranty of paper originality and confirm the copyright transfer to the journal ECONOMICS OF AGRICULTURE.
RULES FOR TECHNICAL PREPARATION OF ARTICLES
These Instructions will give all necessary information to author(s), as well as template for the articles preparation before their submission for publication in the journal Economics of Agriculture. We are asking you to use this document with a maximal attention, in other words to realize it as a set of instructions and practical example that will contribute to easier and more efficient operation under your article within the all phases of journal editing. Articles that deviate from mentioned template are not be taken into consideration.
Page setup: Paper size: width 170 mm x height 240 mm; Margins: top/bottom 20 mm, left/right 18 mm; Layout: header 1,25cm, footer 1,25cm; Orientation: Portrait. Paper volume up to 30.000 characters (without spaces) or 15 pages is preferable. Articles should not be shorter than 10 pages. Depending on papers’ quality, Editorial Board could also accept longer articles. Article has to be prepared electronically (on computer), in program Microsoft Word XP or some later version of this program.
Below is a detail Template (technical instructions) for correct preparation of articles that will be submitted to the journal Economics of Agriculture. You are asked to maximum possible follow the technical instruction given by the following template.
1299EP 2017 (64) 3 (1297-1302)
INSTRUCTIONS TO AUTHORS
TEMPLATE: TITLE OF THE ARTICLE (CENTRED, TNR, SIZE 12, BOLD, ALL CAPITAL LETTERS, MAXIMUM IN TWO LINES)1
Anđela Marković2, Petar Petrović3, Mirko Mirković4
Summary
It is desirable that Summary contains up to 150 words, as well as to contain all essential paper elements, such as goal(s), used method(s), important results and general authors’ conclusion(s).
During the summary writing, it should be used font Times New Roman (TNR), font size 11, Italic, alignment text Justify, line spacing single, with interspace of 6 pt between paragraphs, without indentation of the first line.
Please, avoid the use of the indexes and special symbols within the Summary, and define all abbreviations whenever they are used for first time. Do not cite references in Summary.
Author(s) from Serbia are submitting article title, summary, key words and information about themselves on Serbian language at the end of the article, after the list of used literature. Text of the Serbian and English version of Summary must match in every sense.
Key words: note, maximally, five, key, words.
JEL: Q16, M24 (www.aeaweb.org/jel/jel_class_system.php)
1 Paper is a part of research within the project no. III 46006 - Sustainable agriculture and rural development in the function of accomplishing strategic objectives of the Republic of Serbia in the Danube region, financed by the Ministry of Education, Science and Technological Development of the Republic of Serbia. Project period: 2011-2014. This segment is not obligatory within the paper.
2 Anđela Marković, Ph.D., Principal Research Fellow, Institute of Agricultural Economics, Volgina Street no. 15, 11060 Belgrade, Serbia, Phone: +381 11 444 444/int 112, E-mail: [email protected]
3 Petar Petrović, Ph.D., Full Professor, University of Belgrade, Faculty of Agriculture, Nemanjina Street no. 6, 11080 Zemun, Serbia, Phone: +381 11 222 222, E-mail: [email protected]
4 Mirko Mirković, M.A., Assistant, University in Belgrade, Faculty of Forestry, Kneza Viseslava Street no. 1, 11000 Belgrade, Serbia, Phone: +381 64 33 33 333, E-mail: [email protected]

1300 EP 2017 (64) 3 (1297-1302)
INSTRUCTIONS TO AUTHORS
Introduction
Please strictly follow the instructions on article formatting, as well as styles provided in this template. Do not change font size, interspace between paragraphs and line spacing to insert more text into a conditionally limited number of pages.
Editorial Board organizes process of review of submitted articles and selects papers for publication based on the performed review, in other words according to estimated quality of the articles by the appointed reviewers. However, the ultimate responsibility for the views, originality and stands within the articles is exclusively on author(s) of manuscripts.
Please follow the basic principles of scientific papers structuring and try as much as possible to write a paper with next segments: Introduction, Paper goals, Data sources, Methodology, Results with Discussion, Conclusion (with Recommendations), Literature, etc.
During the article writing, it should be used font Times New Roman (TNR), font size 11, alignment text Justify, Line Spacing Single, with interspace of 6 pt between paragraphs, without indentation of the first line. Articles should be written only in English. It is advisable to write the article in the third-person singular or plural with the use of active form. Before paper submission, please check grammatical and spelling mistakes by the spellchecker for the English language.
Sub-headings should be written by font Times New Roman, font size 11, bold, centred, only first letter capital, interspace between sub-heading and paragraph above 12 pt (before 12 pt), and interspace between sub-heading and paragraph below 6 pt (after 6 pt). Please use the writing style presented in this template.
Please define abbreviations and acronyms during their first occurrence within the text, even in case that they were previously defined in article summary. Do not use abbreviations in article title, unless they can not be avoided.
For equations and formulas use the Microsoft Equation Editor or addition for equations writing MathType (www.mathtype.com). Use of built-in equation editor within the program Word 2007 is not recommended. Please check if all symbols within the equations/formulas are defined (forthwith after equation/formula).
Reference (author(s) of quotes) has to be entered directly in the text of article in next form (Petrović, 2012; or Petrović, Marković, 2012; or Mirković et al., 2012). Please do not write them as indexes in square brackets [3] or in footnote. Try to use a footnote only in the case of closer explanation of certain terms, or clarification of real and hypothetic situations. Do not numerate the pages.
Tables have to be created within the text of article, not taken in the form of images from other documents. Tables should be numerated according to order of their appearance. Titles of the tables have to be given immediately above the table to which they relate.
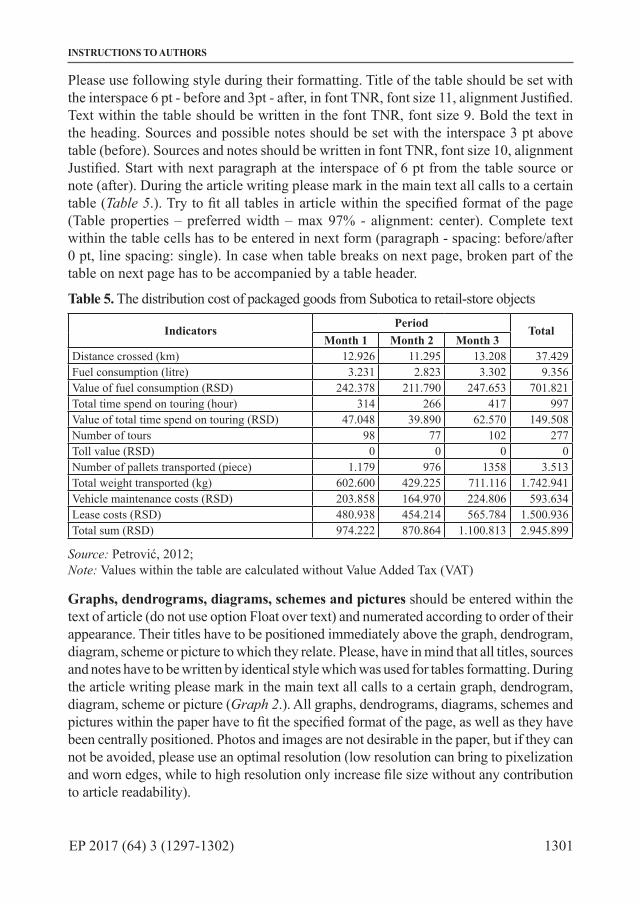
1301EP 2017 (64) 3 (1297-1302)
INSTRUCTIONS TO AUTHORS
Please use following style during their formatting. Title of the table should be set with the interspace 6 pt - before and 3pt - after, in font TNR, font size 11, alignment Justified. Text within the table should be written in the font TNR, font size 9. Bold the text in the heading. Sources and possible notes should be set with the interspace 3 pt above table (before). Sources and notes should be written in font TNR, font size 10, alignment Justified. Start with next paragraph at the interspace of 6 pt from the table source or note (after). During the article writing please mark in the main text all calls to a certain table (Table 5.). Try to fit all tables in article within the specified format of the page (Table properties – preferred width – max 97% - alignment: center). Complete text within the table cells has to be entered in next form (paragraph - spacing: before/after 0 pt, line spacing: single). In case when table breaks on next page, broken part of the table on next page has to be accompanied by a table header.
Table 5. The distribution cost of packaged goods from Subotica to retail-store objects
Indicators Period TotalMonth 1 Month 2 Month 3
Distance crossed (km) 12.926 11.295 13.208 37.429Fuel consumption (litre) 3.231 2.823 3.302 9.356Value of fuel consumption (RSD) 242.378 211.790 247.653 701.821Total time spend on touring (hour) 314 266 417 997Value of total time spend on touring (RSD) 47.048 39.890 62.570 149.508Number of tours 98 77 102 277Toll value (RSD) 0 0 0 0Number of pallets transported (piece) 1.179 976 1358 3.513Total weight transported (kg) 602.600 429.225 711.116 1.742.941Vehicle maintenance costs (RSD) 203.858 164.970 224.806 593.634Lease costs (RSD) 480.938 454.214 565.784 1.500.936Total sum (RSD) 974.222 870.864 1.100.813 2.945.899
Source: Petrović, 2012; Note: Values within the table are calculated without Value Added Tax (VAT)
Graphs, dendrograms, diagrams, schemes and pictures should be entered within the text of article (do not use option Float over text) and numerated according to order of their appearance. Their titles have to be positioned immediately above the graph, dendrogram, diagram, scheme or picture to which they relate. Please, have in mind that all titles, sources and notes have to be written by identical style which was used for tables formatting. During the article writing please mark in the main text all calls to a certain graph, dendrogram, diagram, scheme or picture (Graph 2.). All graphs, dendrograms, diagrams, schemes and pictures within the paper have to fit the specified format of the page, as well as they have been centrally positioned. Photos and images are not desirable in the paper, but if they can not be avoided, please use an optimal resolution (low resolution can bring to pixelization and worn edges, while to high resolution only increase file size without any contribution to article readability).

1302 EP 2017 (64) 3 (1297-1302)
INSTRUCTIONS TO AUTHORS
During the writing of the article conclusion, please have in mind that Conclusion can provide a concise overview of the main results of the article. Do not repeat parts of Summary in this place. Conclusion can explain the importance of article, or it can give recommendations for further action, or it can suggest further work on exposed theme.
Literature has to be set at the end of article (for authors from Serbia before summary in Serbian language), in alphabetical order, according to the author’s surname. All references should be cited in original language (in the language on which are published before), in the volume in which are used within the manuscript preparation. Literature units have to be written in font TNR, font size 11, alignment Justified, with mutual interspace of 3 pt - before/after. In all literature units only surnames are written as a whole, while all authors’ names has to be shorten on to initial (initials have to be set after surnames). Please, write surnames of all authors (do not use the style Petrović et al.). Do not combine literature units (under each ordinal number can be only one literature unit) and always write complete titles of used literature units. If used/cited literature was taken over from the internet publication, after adequate writing of literature unit, in brackets has to be noted complete link from which material was taken over (available at: www.petarpetrovic.pdf). Please follow the presented examples for the proper writing of different types of literature units.
Literature
1. Marković, A. (year): Title of the Book, Publisher, City of Publisher, Country of Publisher.2. Petrović, P., Mirković, M. (year): Title of the book chapter, in Book – title of the book, ch.
no. x, pp. xxx–xxx, Publisher, City of Publisher, Country of Publisher.3. Petrović, P., Mirković, M., Marković, A. (year): Title of the paper, Title of Journal, vol. x,
no. x, pp. xxx-xxx, Publisher, City of Publisher, Country of Publisher, (available at: www.petarpetrovic.pdf).
4. Petrović, P., Mirković, M. (year): Title of the conference paper/presentation, Proceedings from the conference - Title of the conference, City, Country, vol. xx, pp. xx-xx.
5. Marković, A. (or name/abbreviation of the Institution/company, for example FAO/UN/IAE) (year): Title of report/yearbook, no. of report xxx, City and Country of publisher/institution/company, (available at: www.fao.org/pdf).
6. Petrović, P., Mirković, M. (date): Title of the newspaper article, Newspaper title, City, Country, no. xx, (available at: www.politika. com/nauka/20%/srbija).
7. Petrović, P. (year): Title of Ph.D. dissertation, Ph.D. dissertation, Name of Faculty, Name of University, City, Country.
8. Marković, A. (or name/abbreviation of the Institution/company that develop patent, for example Faculty of Agriculture/IAE) (year): Title of the patent, Name of the institution that was registered patent, reg. no. of patent x xxx xxx, City, Country.
9. Title of the Law/regulation, Official Gazette, Country, no. and year.10. Title of Standard, Standard no. xxx, standard developer, year, City, Country.

1303EP 2017 (64) 3 (1303-1308)
UPUTSTVA AUTORIMA
DETALJNO UPUTSTVO AUTORIMA I ŠABLON ZA RADOVE KOJI SE OBJAVLJUJU U ČASOPISU EKONOMIKA POLJOPRIVREDE
EKONOMIKA POLJOPRIVREDE je međunarodni naučni časopis, koji kvartalno publikuje Naučno društvo agrarnih ekonomista Balkana (NDAEB) u saradnji sa Institutom za ekonomiku poljoprivrede iz Beograd (IEP) i Univerzitetom ekonomskih nauka iz Bukurešta (ASE). U časopisu se publikuju originalni naučni radovi (dvaputa recenzirani), pregledni članci, prethodna saopštenja, prikazi knjiga, kratki osvrti i izveštaji istraživanja. Izveštaji istraživanja i prikazi knjiga se prihvataju nakon prethodne konsultacije/poziva od strane urednika časopisa, ili urednika prikaza knjige, usklađeni sa ktiterijumima podnošenja radova.
Časopis EKONOMIKA POLJOPRIVREDE prihvata samo radove na engleskom jeziku, podnešene E-mejlom (kao attachment) na adresu: [email protected] i [email protected]
Radovi se dostavljaju u duplikatu, s tim da se na jednom primerku uklonjeni podaci o autorima, kako se ne bi narušio proces anonimnosti recenzije. U drugom primerku rada navode se sve informacije o autorima (u zahtevanom obliku) neophodne za dalju korespodenciju i punu transparentnost publikovanog rada.
Radovi koji se dostavljaju časopisu EKONOMIKA POLJOPRIVREDE moraju posedovati sadržaj istraživanja koja prethodno nisu publikovana na engleskom ili nekom drugom jeziku. Takođe, podnešeni radovi ne smeju biti u procesu razmatranja za publikovanje u nekom drugom časopisu, te njihova publikacija mora biti odobrena od strane svih autora potpisanom izjavom. Izdavač zadržava pravo provere originalnosti dostavljenog rada specijalizovanim softverom za otkrivanje plagijata.
1304 EP 2017 (64) 3 (1303-1308)
UPUTSTVA AUTORIMA
PROCES RECENZIJE
Radovi podnešeni časopisu EKONOMIKA POLJOPRIVREDE podležu duploj anonimnoj (double-blind) recenziji i moraju imati obe pozitivne recenzije usaglašene sa opšteprihvaćenim naučnim standardima. Recenzent samostalno i anonimno ocenjuje rukopis, te može dati pozitivnu recenziju, predlog dorade rada, ili negativnu recenziju. U slučaju antagonističnih recenzija (jedna je pozitivna, a druga negativna) konačna odluka se donosi na osnovu treće recenzije. Rad vraćen autorima na ispravku ne garantuje njegovo objavljivanje po urađenim korekcijama. Konačna odluka o publikovanju će biti donešena nakon ponovljenog procesa recenzije rukopisa. Ukoliko je rad pozitivno ocenjen i prihvaćen za publikovanje, svaki od autora mora potpisati garanciju originalnosti rada i odobrenje za prenos autorskih prava na časopis EKONOMIKA POLJOPRIVREDE.
PRAVILA TEHNIČKE PRIPREME RADOVA
Ovo uputstvo za autore daje sve neophodne informacije, kao i šablon za pripremu radova pre podnošenja za publikovanje u časopisu Ekonomika poljoprivrede. Molimo Vas da maksimalno pažljivo pristupite korišćenju ovog dokumenta, odnosno da ga shvatite kao skup uputstava i praktičan primer koji u mnogome doprinosi lakšoj i efikasnijoj manipulaciji nad Vašim radom u svim fazama uređivanja časopisa. Radovi koji odstupaju od datog šablona se neće uzimati u razmatranje.
Format strane (paper size): Width 170 mm x Height 240 mm; Margine: gore/dole 20 mm, levo/desno 18 mm; Layout: Header 1,25cm, Footer 1,25cm; Orientation: Portrait. Preferira se obim radova do maksimalnih 30.000 karaktera (bez razmaka), odnosno 15 stranica. Radovi ne bi trebalo da budu kraći od 10 stranica. U zavisnosti od kvaliteta rada Uredništvo može prihvatiti i duže radove. Molimo Vas da radove pripremate na računaru u programu Microsoft Word XP ili nekoj kasnijoj verziji ovog programa.
U nastavku sledi detaljan Šablon (tehničko uputstvo) za pravilnu pripremu radova za časopis Ekonomika poljoprivrede. Molimo Vas da maksimalno moguće poštujete tehnička pravila data sledećim šablonom.

1305EP 2017 (64) 3 (1303-1308)
UPUTSTVA AUTORIMA
ŠABLON: NASLOV RADA (CENTRIRAN, TNR SIZE 12, BOLD, SVA SLOVA VELIKA, MAKSIMALNO DVA REDA)1
Anđela Marković2, Petar Petrović3, Mirko Mirković4
Summary
Poželjno je da rezime sadrži do 150 reči, te da sadrži sve bitne činjenice rada, poput cilja rada, korišćene metode, najvažnijih rezultata i osnovnih zaključaka autora.
Tokom pisanja rezimea treba koristiti slova Times New Roman (TNR), veličina fonta (font size) 11, Italic, ravnanje teksta Justify, a tekst rezimea pisati bez proreda (Line Spacing Single), sa razmakom od 6 pt između pasusa, bez uvlačenja prvog reda.
Izbegavajte korišćenje indeksa i specijalnih simbola u apstraktu, odnosno definišite sve skraćenice u apstraktu kada se prvi put upotrebe. Nemojte citirati reference u apstraktu.
Autori iz Srbije šalju naslov rada, rezime rada, ključne reči i podatke o sebi i na srpskom jeziku na kraju rada, ispod listinga korišćene literature. Tekst srpske i engleske verzije apstrakta i ključnih reči se moraju podudarati u svakom pogledu.
Key words: navesti, maksimalno, pet, ključnih, reči.
JEL: Q16, M24 (www.aeaweb.org/jel/jel_class_system.php)
1 Paper is a part of research within the project no. III 46006 - Sustainable agriculture and rural development in the function of accomplishing strategic objectives of the Republic of Serbia in the Danube region, financed by the Ministry of Education, Science and Technological Development of the Republic of Serbia. Project period: 2011-2014. Ovaj segment nije obligatoran u radu.
2 Anđela Marković, Ph.D., Principal Research Fellow, Institute of Agricultural Economics, Volgina Street no. 15, 11060 Belgrade, Serbia, Phone: +381 11 444 444/int 112, E-mail: [email protected]
3 Petar Petrović, Ph.D., Full Professor, University of Belgrade, Faculty of Agriculture, Nemanjina Street no. 6, 11080 Zemun, Serbia, Phone: +381 11 222 222, E-mail: [email protected]
4 Mirko Mirković, M.A., Assistant, University in Belgrade, Faculty of Forestry, Kneza Viseslava Street no. 1, 11000 Belgrade, Serbia, Phone: +381 64 33 33 333, E-mail: [email protected]
1306 EP 2017 (64) 3 (1303-1308)
UPUTSTVA AUTORIMA
Introduction
Molimo Vas da striktno poštujete uputstva o formatiranju i stilove date u ovom šablonu. Ne menjajte veličinu fonta ili razmak redova da biste ubacili više teksta u uslovno ograničeni broj stranica.
Uredništvo organizuje proces recenziranja pristiglih radova i vrši odabir radova za publikovanje na osnovu urađenih recenzija, odnosno procenjenog kvaliteta radova od strane imenovanih recezenata. Međutim, krajnja odgovornost za poglede, originalnost i tvrdnje iznete u radovima počiva isključivo na autorima rada.
Molimo Vas da poštujete osnovna načela strukturiranja naučnih radova, odnosno trudite se koliko je to moguće da Vaš rad ima sledeće segmente: Uvod, Cilja rada i korišćena metodologija, Rezultati rada sa diskusijom, Zaključak, Literatura.
Tokom pisanja rada treba koristiti slova Times New Roman (TNR), veličina fonta (font size) 11, ravnanje teksta Justify, a tekst rada pisati bez proreda (Line Spacing Single), sa razmakom od 6 pt između pasusa, bez uvlačenja prvog reda. Radovi se pišu isključivo na engleskom jeziku. Preporučljivo je rad pisati u trećem licu jednine ili množine uz korišćenje aktivnog oblika. Pre slanja rada, obavezno proveriti pravopisne greške putem spellchecker-a za engleski jezik.
Podnaslovi se pišu fontom Times New Roman, veličina fonta (font size) 11, bold, centrirano, samo prvo slovo veliko, razmak podnaslova i teksta iznad 12 pt (before 12 pt), a razmak podnaslova i teksta ispod 6 pt (after 6 pt). Molimo Vas koristiti prikazani stil pisanja u ovom šablonu.
Molimo Vas da definišete skraćenice i akronime prilikom prvog pojavljivanja u tekstu rada, čak i u slučaju da su već bili definisani u apstraktu rada. Ne koristite skraćenice u naslovu rada osim ukoliko se one apsolutno ne mogu izbeći
Radi unosa jednačina i formula u rad, koristite Microsoft Equation Editor ili dodatak za pisanje jednačina MathType (www.mathtype.com). Ne preporučuje se korišćenje ugrađenog editor jednačina iz programa Word 2007. Proverite da li ste definisali sve simbole u jednačini (neposredno posle jednačine).
Reference (autori citata) se navode direktno u tekstu rada u sledećem obliku (Petrović, 2012; ili Petrović, Marković, 2012; ili Mirković et al., 2012). Ne navodite ih kao indekse u četvrtastoj zagradi [3] ili u fusnoti. Trudite se da fusnotu koristite samo u slučaju bližih objašnjenja određenih pojmova, odnosno razjašnjenja realnih ili hipotetičkih situacija. Nemojte vršiti numeraciju stranica.
Tabele moraju biti formirane u tekstu rada, a ne preuzete u formi slika iz drugih materijala. Tabele unositi u sam tekst rada i numerisati ih prema redosledu njihovog pojavljivanja. Nazivi tabela moraju biti dati neposredno iznad tabele na koju se odnose. Koristite dole prikazani stil tokom njihovog formatiranja. Naslov tabela pisati sa razmakom 6 pt – iznad/before i 3pt – ispod/after, u fontu TNR, font size 11, ravnanje Justified. Tekst unutar tabela pisati fontom TNR, font size 9. Tekst u zaglavlju tabela boldirati. Izvor i potencijalne napomene pisati sa razmakom 3 pt ispod tabela (before). Izvore i napomene pisati u fontu TNR, font size 10,
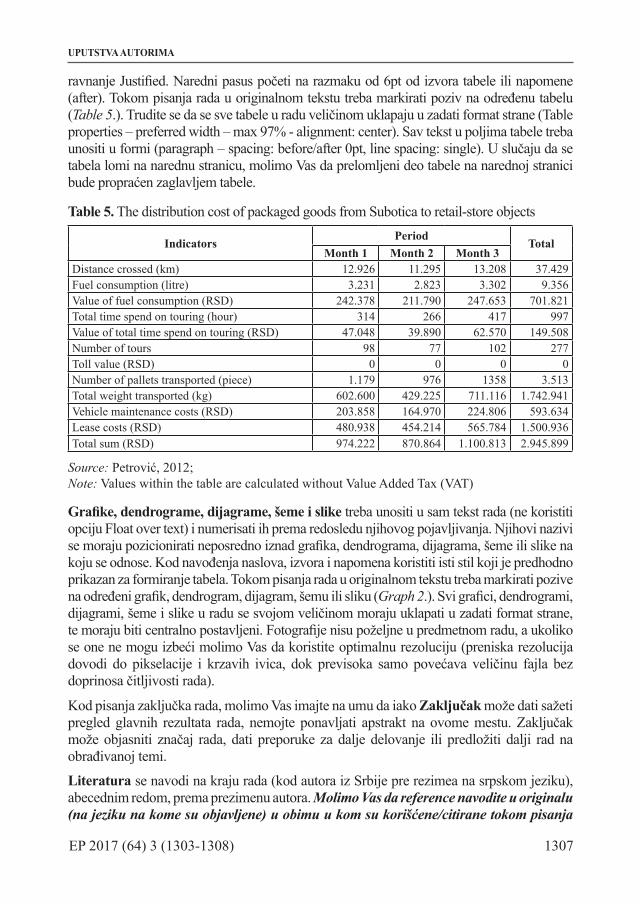
1307EP 2017 (64) 3 (1303-1308)
UPUTSTVA AUTORIMA
ravnanje Justified. Naredni pasus početi na razmaku od 6pt od izvora tabele ili napomene (after). Tokom pisanja rada u originalnom tekstu treba markirati poziv na određenu tabelu (Table 5.). Trudite se da se sve tabele u radu veličinom uklapaju u zadati format strane (Table properties – preferred width – max 97% - alignment: center). Sav tekst u poljima tabele treba unositi u formi (paragraph – spacing: before/after 0pt, line spacing: single). U slučaju da se tabela lomi na narednu stranicu, molimo Vas da prelomljeni deo tabele na narednoj stranici bude propraćen zaglavljem tabele.
Table 5. The distribution cost of packaged goods from Subotica to retail-store objects
Indicators Period TotalMonth 1 Month 2 Month 3
Distance crossed (km) 12.926 11.295 13.208 37.429Fuel consumption (litre) 3.231 2.823 3.302 9.356Value of fuel consumption (RSD) 242.378 211.790 247.653 701.821Total time spend on touring (hour) 314 266 417 997Value of total time spend on touring (RSD) 47.048 39.890 62.570 149.508Number of tours 98 77 102 277Toll value (RSD) 0 0 0 0Number of pallets transported (piece) 1.179 976 1358 3.513Total weight transported (kg) 602.600 429.225 711.116 1.742.941Vehicle maintenance costs (RSD) 203.858 164.970 224.806 593.634Lease costs (RSD) 480.938 454.214 565.784 1.500.936Total sum (RSD) 974.222 870.864 1.100.813 2.945.899
Source: Petrović, 2012; Note: Values within the table are calculated without Value Added Tax (VAT)
Grafike, dendrograme, dijagrame, šeme i slike treba unositi u sam tekst rada (ne koristiti opciju Float over text) i numerisati ih prema redosledu njihovog pojavljivanja. Njihovi nazivi se moraju pozicionirati neposredno iznad grafika, dendrograma, dijagrama, šeme ili slike na koju se odnose. Kod navođenja naslova, izvora i napomena koristiti isti stil koji je predhodno prikazan za formiranje tabela. Tokom pisanja rada u originalnom tekstu treba markirati pozive na određeni grafik, dendrogram, dijagram, šemu ili sliku (Graph 2.). Svi grafici, dendrogrami, dijagrami, šeme i slike u radu se svojom veličinom moraju uklapati u zadati format strane, te moraju biti centralno postavljeni. Fotografije nisu poželjne u predmetnom radu, a ukoliko se one ne mogu izbeći molimo Vas da koristite optimalnu rezoluciju (preniska rezolucija dovodi do pikselacije i krzavih ivica, dok previsoka samo povećava veličinu fajla bez doprinosa čitljivosti rada).
Kod pisanja zaključka rada, molimo Vas imajte na umu da iako Zaključak može dati sažeti pregled glavnih rezultata rada, nemojte ponavljati apstrakt na ovome mestu. Zaključak može objasniti značaj rada, dati preporuke za dalje delovanje ili predložiti dalji rad na obrađivanoj temi.
Literatura se navodi na kraju rada (kod autora iz Srbije pre rezimea na srpskom jeziku), abecednim redom, prema prezimenu autora. Molimo Vas da reference navodite u originalu (na jeziku na kome su objavljene) u obimu u kom su korišćene/citirane tokom pisanja
1308 EP 2017 (64) 3 (1303-1308)
UPUTSTVA AUTORIMA
rada. Literaturu navoditi u fontu TNR, font size 11, ravnanje Justified, sa međusobnim razmakom 3pt – iznad/before i 3pt – ispod/after. U svim literaturnim jedinicama samo se prezimena daju u punom obimu, dok se sva imena autora skraćuju na inicijal i stavljaju posle prezimena. Molimo Vas da navodite prezimena svih autora, a ne da koristite stil navođenja Petrović et al. Nemojte kombinovati literaturne jedinice (pod jednim rednim brojem može biti samo jedna referenca) i uvek pišite pune naslove u radu korišćenih literaturnih jedinica. Ukoliko je korišćena/citirana literatura preuzeta iz internet publikacija, posle pravilno izvršenog imenovanja literaturne jedinice u zagradi se mora navesti kompletan link sa koga je materijal preuzet (available at: www.petarpetrovic.pdf). Molimo Vas pridržavajte se dole navedenih primera navođenja različitih tipova literaturnih jedinica i referenci.
Literature
1. Marković, A. (godina izdanja): Naslov knjige, Izdavač, Mesto i Zemlja izdavača.2. Petrović, P., Mirković, M. (godina izdanja): Naslov poglavlja u knjizi, u knjizi – Naslov
knjige, ch. br. x, str. xxx–xxx, Izdavač, Mesto i Zemlja izdavača.3. Petrović, P., Mirković, M., Marković, A. (godina izdanja): Naslov rada, Časopis,
vol. x, br. x, str. xxx-xxx, Izdavač, Mesto i Zemlja izdavača, (dostupno na: www.petarpetrovic.pdf).
4. Petrović, P., Mirković, M. (godina izdanja): Naslov konferencijskog rada/prezentacije, Zbornik radova sa konferencije – Naziv konferencije, Mesto, Zemlja, vol. xx, str. xx-xx.
5. Marković, A. (ili ime/skraćenica Institutcije/Kompanije, na primer FAO/United Nations/IEP) (godina izdanja): Naslov izveštaja/godišnjaka, br. izveštaja xxx, Mesto i Zemlja izdavača/institucije/kompanije, (dostupno na: www.fao.org/pdf).
6. Petrović, P., Mirković, M. (godina izdanja): Naslov novinskog članka, Naziv novina, Mesto, Zemlja, br. xx, (dostupno na: www.politika. com/nauka/20%/srbija).
7. Petrović, P. (godina izdanja): Naslov doktorske disertacije, doktorska disertacija, Fakultet, Univerzitet, Mesto, Zemlja.
8. Marković, A. (ili ime/skraćenica Institucije/Kompanije koja je razvila patent, na primer Poljoprivredni fakultet/IEP) (godina registracije patenta): Naziv patenta, Institucija koja je registrovala patent, reg. br. patenta - x xxx xxx, Mesto, Zemlja.
9. Naziv zakona/uredbe, Službeni glasnik, Zemlja, br. i godina izdanja.10. Naziv standarda, Standard br. xxx, izdavač standarda, godina izdanja, Mesto, Zemlja.
Technical preparation, prepress and printing:DIS PUBLIC D.O.O., Braće Jerković 111-25, Belgrade, phone/fax: 011/39-79-789
Number of copies:300 copies

Notes:

Notes:

Notes:
Published quarterly
Journal is registered in major scientific databases:
• EBSCO,• AgEcon Search,• Social Science Research Network (SSRN),• ProQuest,• Ulrich’s Periodicals Directory,• CABI,• J-Gate,• The World Wide Web Virtual Library for European Integration,• SCIndeks,• EconLit
Journal is indexed in major scientific databases:
• Index Copernicus Journals Master List (ICV2013: 5,22).
The Ministry of Education, Science and Technological Development of the Republic of Serbia provides financial support for publishing of the quarterly journal
ECONOMICS OF AGRICULTURE
CIP - Каталогизација у публикацијиНародна библиотека Србије, Београд
33:63(497.11)
ЕКОНОМИКА пољопривреде = Economics ofAgriculture / editor-in-chief DragoCvijanović. - Год. 26, бр. 5 (1979)- . -Београд : Научно друштво аграрних економистаБалкана : Институт за економику пољопривреде; Букурешт : Академија економских наука,1979- (Belgrade : Dis Public). - 24 cm
Тромесечно. - Је наставак: Економикапроизводње хране = ISSN 0352-3454. - Другоиздање на другом медијуму: Економикапољопривреде (Online) = ISSN 2334-8453ISSN 0352-3462 = Економика пољопривреде(1979)COBISS.SR-ID 27671