Investor Presentation May 2021 - Athens Stock Exchange
44
Investor Presentation May 2021
-
Upload
khangminh22 -
Category
Documents
-
view
0 -
download
0
Transcript of Investor Presentation May 2021 - Athens Stock Exchange

Investor PresentationMay 2021
2
Group Structure

Group Overview
4
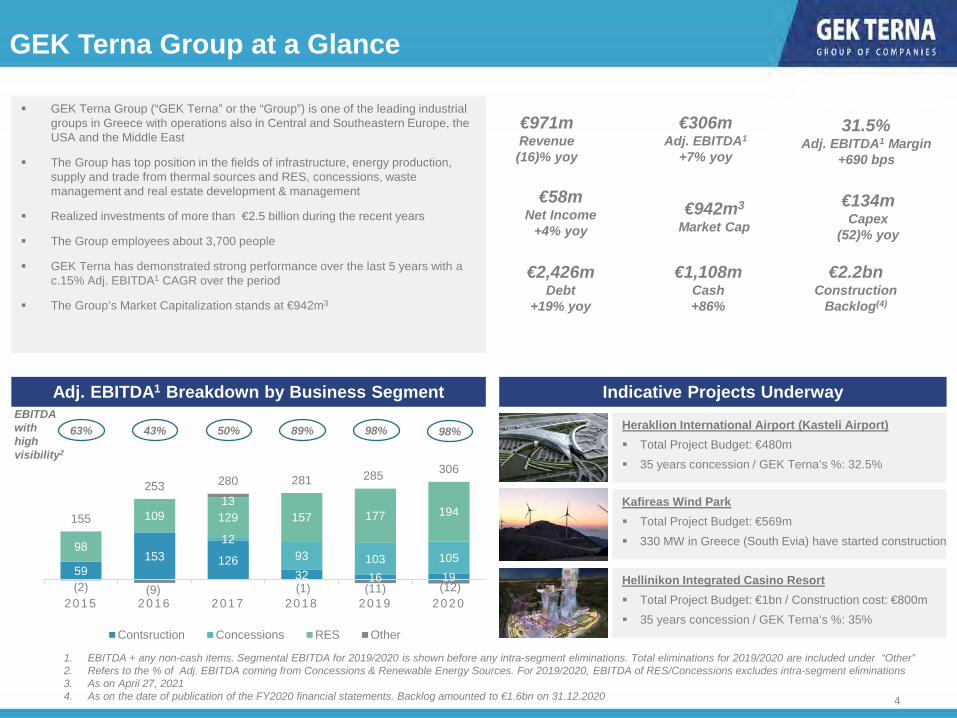
€2.2bnConstruction
Backlog(4)
Grou Structure
GEK Terna Group at a Glance
Adj. EBITDA1 Breakdown by Business Segment
GEK Terna Group (“GEK Terna” or the “Group”) is one of the leading industrial groups in Greece with operations also in Central and Southeastern Europe, the USA and the Middle East
The Group has top position in the fields of infrastructure, energy production, supply and trade from thermal sources and RES, concessions, waste management and real estate development & management
Realized investments of more than €2.5 billion during the recent years
The Group employees about 3,700 people
GEK Terna has demonstrated strong performance over the last 5 years with a c.15% Adj. EBITDA1 CAGR over the period
The Group’s Market Capitalization stands at €942m3
31.5%Adj. EBITDA1 Margin
+690 bps
€942m3
Market Cap
EBITDA with high visibility2
€134mCapex
(52)% yoy
€2,426mDebt
+19% yoy
€58mNet Income
+4% yoy
€1,108mCash+86%
€971mRevenue(16)% yoy
€306mAdj. EBITDA1
+7% yoy
Indicative Projects Underway
Heraklion International Airport (Kasteli Airport) Total Project Budget: €480m 35 years concession / GEK Terna’s %: 32.5%
Kafireas Wind Park Total Project Budget: €569m 330 MW in Greece (South Evia) have started construction
Hellinikon Integrated Casino Resort Total Project Budget: €1bn / Construction cost: €800m 35 years concession / GEK Terna’s %: 35%
1. EBITDA + any non-cash items. Segmental EBITDA for 2019/2020 is shown before any intra-segment eliminations. Total eliminations for 2019/2020 are included under “Other”2. Refers to the % of Adj. EBITDA coming from Concessions & Renewable Energy Sources. For 2019/2020, EBITDA of RES/Concessions excludes intra-segment eliminations3. As on April 27, 20214. As on the date of publication of the FY2020 financial statements. Backlog amounted to €1.6bn on 31.12.2020
59153 126
32 16 19
1293 103 105
98
109 129 157 177 194
(2) (9)
13
(1) (11) (12)
155
253 280 281 285 306
2015 2016 2017 2018 2019 2020
Contsruction Concessions RES Other
63% 43% 89% 98%50% 98%

5
100% 37%
25%(1)
50%(1)
100%
100%
17%(2)
100%
I
II
Real Estate Assets(3)
Construction Energy Production Concessions Real Estate Mining
Full Consolidation Equity Consolidation
1. ENGIE owns 50% of HERON I and HERON II; Qatar Petroleum owns 25% of HERON II2. Other shareholders: VINCI (29.9%); HOCHTIEF (17%); J&P AVAX (19.1%); AKTOR (17%)3. All Real Estate Segment subsidiaries are fully consolidated. Two Real Estate JVs/Associates are consolidated under the Equity method
Group Structure

6
Well diversified business profile with presence in defensive segments with significant cash flow visibility
Favorable positioning in terms of key megatrends in infrastructure and energy transition
Business units that collaborate to generate incremental value
Story of consistent organic growth and value creation
Leading industrial company with top positions in construction, concession, energy production and the largest renewable energy portfolio of a Greek company
Experienced in successful delivery of complicated projects
Strong management team with extensive experience long track record in the company
Key Investment Highlights
A leader in its core markets with great positioning in for expected infrastructure and energy transition developments

7
1969 GEK is
established
1972 Terna is established
1999 Terna and GEK join forces,
forming one of the largest Group in Greece
2012 Terna Energy enters the
US market as wind pars start operating in the US
2008 Concession commencement of Kentriki and Olympia Odos GEK & Terna merge into one entity, forming GEK TERNA
2000 The first wind park starts
operations in Greece Incorporation of HERON
2018 Achieved 100% ownership in Nea and Kentriki Odos
2020 - 2021 Construction and Concession commencement for Kastelli Airport Awarded the construction and a 35 year concession for the development and operation of
the Hellinikon Integrated Casino Resort (through the JV with Mohegan Gaming)
1994 Listing of Terna and GEK on
the Athens Stock Exchange
1997 Incorporation of Terna
Energy
2002 The Group’s restructuring is completed with the absorption
of GEK’s construction division by TERNA GEK is the holding company of the Group
2007 Terna Energy IPO Concession commencement
of Nea Odos
GEK Terna History – Corporate Milestones

8
Group Vision & Strategy
Continuous commitment to
high reputational standards
Expansion in new business activities and new
technologies
Strengthen leading position in core business activities in Greece
Sustainable growth
Solidify leading position in
construction
Grow concessions portfolio through participation in tenders
and leveraging construction business
More than double renewable energy
installed capacity within the next 5 years
Commitment to natural
environment
Value creation for employees, partners,
customers and shareholders
Selectively expand in adjacent businesses with collaborating
potential with existing business such as waste
management
Focus on new technologies and
innovation to enhance performance and growth
Targeted social contribution
Achieve high growth rates by
selectively investing in value
enhancing projects
Maintain resilient business profile
with high cash flow visibility
Key strategy pillars are focus on growth, synergies across segments, business resilience and high reputational standards

9
Strategic Initiatives & Implementation by Business
Maintain market leading position across the Group’s segments
Capture market opportunities, strengthening the Group’s core legacy business
Grow project portfolio with new projects offering high cash flow visibility and secured streams
Focus on new landmark contract wins such as signing of new public projects (€450m motorway North extension) and the Hellinikon casino (€800m contract)
Aim to seize the upside in construction as funds will flow into landmark developments
Optimal Group capital structure provides headroom for further growth in the segment both strategically and opportunistically as new opportunities arise in the post-pandemic era
Leading position in the domestic market will enable the Group to operate as a concessionaire in new projects
Construction
Concessions
Terna Energy aims to grow its installed capacity in the next 5 years, targeting 3GW of installed capacity
Growth in the segment to further support the Group’s cash flow visibilityRenewable
Energy Sources
Steady growth-oriented strategy Healthy capital structure enables the Group to reap the benefits of the expected market uptick Major recent contract wins are a testament of the Groups’ commitment to pursuing new opportunities in the market
Market Positioning
10
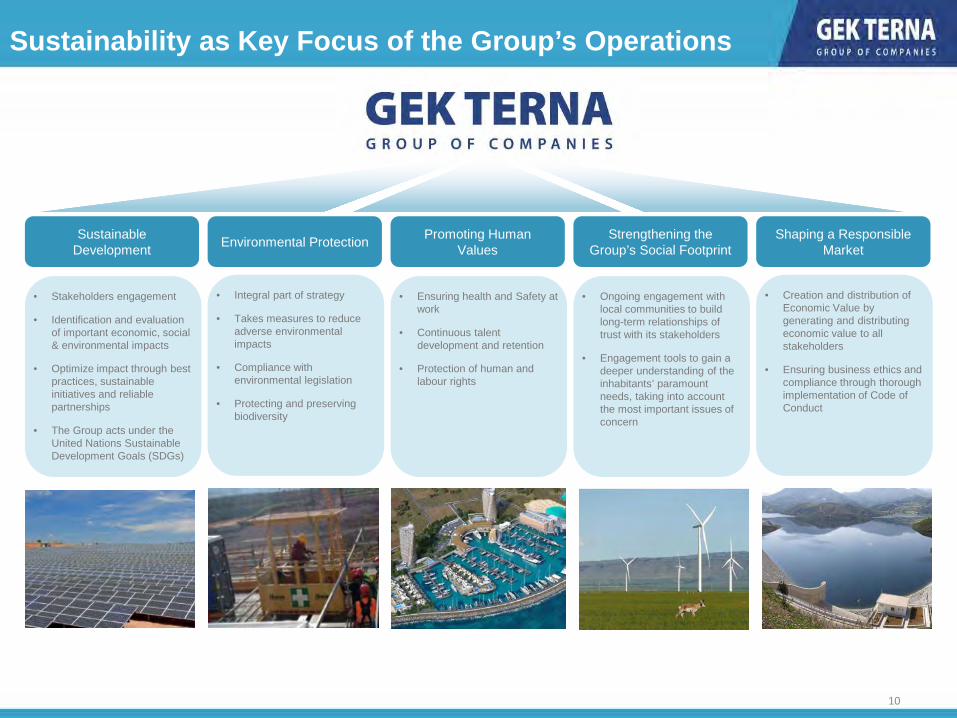
Sustainability as Key Focus of the Group’s Operations
• Creation and distribution of Economic Value by generating and distributing economic value to all stakeholders
• Ensuring business ethics and compliance through thorough implementation of Code of Conduct
• Ensuring health and Safety at work
• Continuous talent development and retention
• Protection of human and labour rights
• Stakeholders engagement
• Identification and evaluation of important economic, social & environmental impacts
• Optimize impact through best practices, sustainable initiatives and reliable partnerships
• The Group acts under the United Nations Sustainable Development Goals (SDGs)
• Integral part of strategy
• Takes measures to reduce adverse environmental impacts
• Compliance with environmental legislation
• Protecting and preserving biodiversity
Sustainable Development Environmental Protection Promoting Human
ValuesStrengthening the
Group’s Social FootprintShaping a Responsible
Market
• Ongoing engagement with local communities to build long-term relationships of trust with its stakeholders
• Engagement tools to gain a deeper understanding of the inhabitants’ paramount needs, taking into account the most important issues of concern

11
59
153126
32 16 19
12
93 103 105
98
109 129 157 177194
(2) (9)
13
(1) (11) (12)
155
253280 281
285306
2015 2016 2017 2018 2019 2020
779955 900 949
682498
15
16 89197
185
151
140
151173
216
237
273
38
42 24
40
52
48972
1.163 1.186
1.403
1.156
971
2015 2016 2017 2018 2019 2020
Adj. EBITDA3 Breakdown (€m)Revenue Breakdown (€m)1
Revenue & EBITDA Mix by Activity
2 2
1. Graph shows revenue figures after eliminations of intracompany transactions2. Concessions became fully consolidated from 2018 onwards3. EBITDA + any non cash items. Segmental EBITDA for 2019/2020 is shown before any intra-segment eliminations. In those cases, total eliminations are included under “Other”
Construction Concessions Electricity Production from RES Other
Most resilient business units have reached a critical size level
Well diversified mix of activities with Concessions and Electricity Production business units adding resilience and stability to operations

12
Free Cash Flow and Capital Deployment
279297
274 280
2017 2018 2019 2020
Gross Cash from Operations (€m)1
Gross Operating CFs / Adj. EBITDA2 (x)
1.0x 1.1x 1.0x
3
Investments Debt & Leverage Shareholder Remuneration
• Growth with capital deployment directed towards expansionary capex for high return projects (then limited maintenance)
• Maintain a strong credit profile
• Target to delever from current level through EBITDA growth and debt repayment
• Shareholders to benefit from value creating investments
• Cash distribution upon further maturing of investment portfolio considering also reinvestment opportunities
• Ongoing share buy back program
Capital Deployment
Capital Allocation Priority
Group’s capital allocation priority is value enhancing growth projects, while maintaining a solid credit profile
0.9x
1. Excluding Working Capital movements2. EBITDA + any non-cash items3. Concessions became fully consolidated from 2018 onwards

13
Most of the debt sits at Energy from Renewables and Concessions, the business units with the highest debt capacity
Terna Energy debt is primarily project finance
Holdco debt consists of bonds, serviced by upstream dividends
The Group has issued two corporate bonds of €500m and 120m, maturing in 2027 and 2025 respectively
Recent bond covenants allow significant headroom for further growth investments
The group allocates debt according to debt capacity per business unit and market conditions
37%
27%
25%
5%6%
Energy from RES
Concessions
Holdings
Construction
Other
Optimal Balance Sheet Structure
Total Debt:€2.4bn
Debt Breakdown by Segment 2020
27%
73%
Recourse Debt
Non-Recourse Debt
Total Debt:€2.4bn
GEK Terna Group funding strategy is based on autonomous funding by business unit along with corporate bond funding at the Holding Company level

14
0
30
60
90
120
150
180
Motorways Casino Kasteli Airport RES Construction Other Activities Free Cash Flow to theParent
FCF Available to GEK Terna Shareholders1 by Division
Concessions
2
FCF Contribution per Segment & Key Projects
1. Project level Operating Cash Flows, less Debt Servicing towards project finance and recourse debt2. Assuming no expansion Capex. For RES, the FCF available to GEK Terna Shareholders includes only project finance debt repayments
Highly visible FCF streams
FY-2020 Results
16
FY2020 Highlights
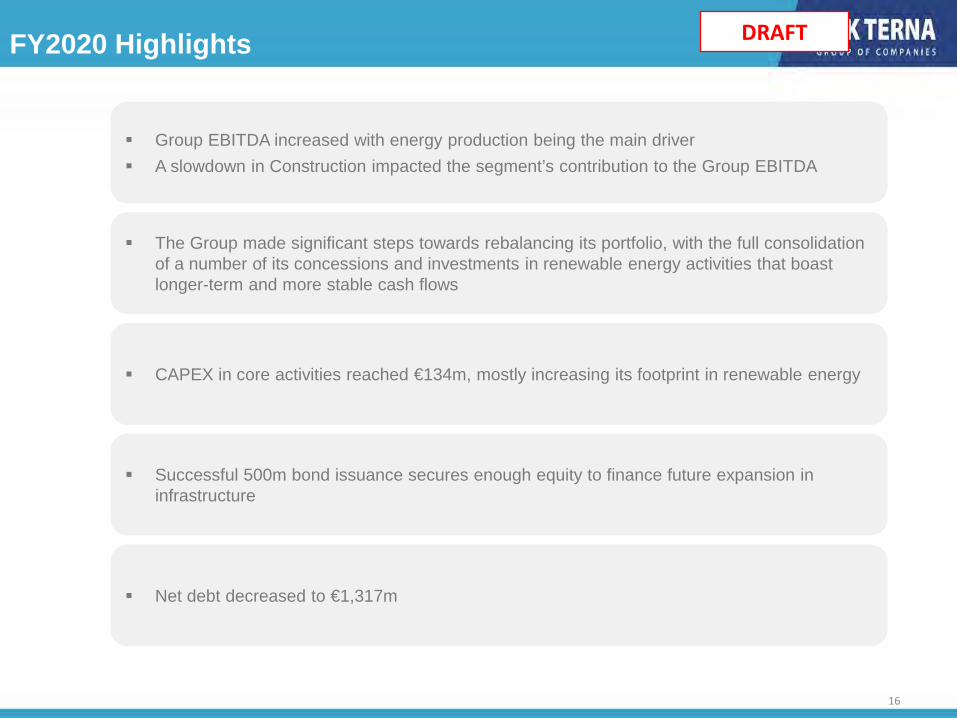
Group EBITDA increased with energy production being the main driver A slowdown in Construction impacted the segment’s contribution to the Group EBITDA
The Group made significant steps towards rebalancing its portfolio, with the full consolidation of a number of its concessions and investments in renewable energy activities that boast longer-term and more stable cash flows
CAPEX in core activities reached €134m, mostly increasing its footprint in renewable energy
Successful 500m bond issuance secures enough equity to finance future expansion in infrastructure
Net debt decreased to €1,317m
DRAFT
17
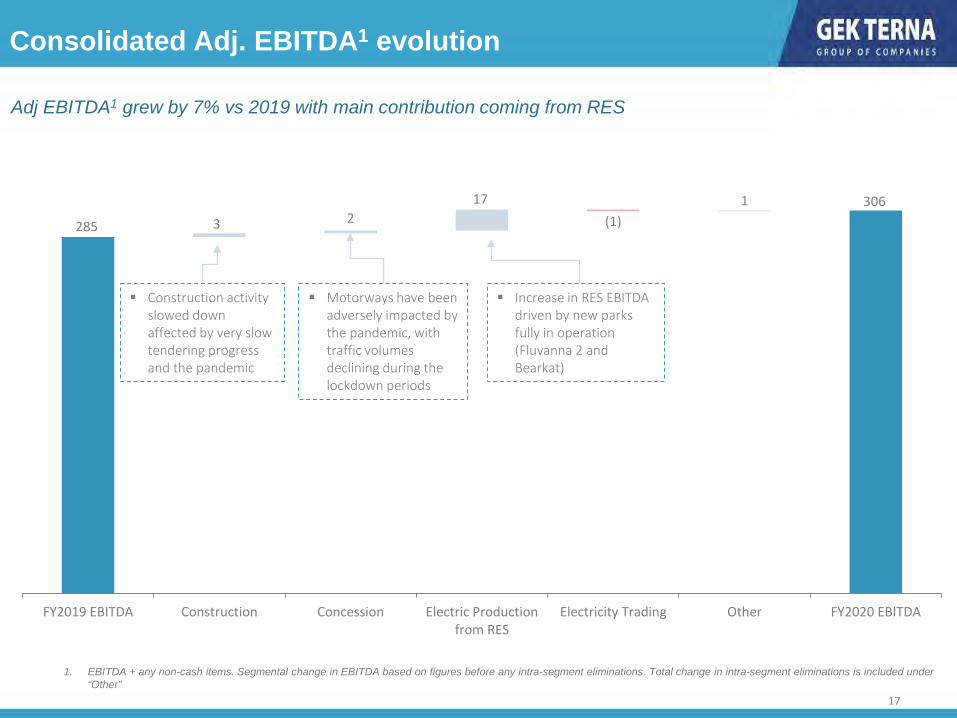
Adj EBITDA1 grew by 7% vs 2019 with main contribution coming from RES
Consolidated Adj. EBITDA1 evolution
285
3063 2
17(1)
1
FY2019 EBITDA Construction Concession Electric Productionfrom RES
Electricity Trading Other FY2020 EBITDA
Construction activity slowed down affected by very slow tendering progress and the pandemic
Motorways have been adversely impacted by the pandemic, with traffic volumes declining during the lockdown periods
Increase in RES EBITDA driven by new parks fully in operation (Fluvanna 2 and Bearkat)
1. EBITDA + any non-cash items. Segmental change in EBITDA based on figures before any intra-segment eliminations. Total change in intra-segment eliminations is included under “Other”

18
5,0x
4,3x
FY2019 FY2020
1.437 1.317
(280) (44)
8134
91
(28)
Net Debt FY2019 Cash fromOperations (before
WC)
Changes in WC Income Taxes Paid Capex Interest & OtherFinancial Expenses
Paid
Other Adjustments Net Debt FY2020
Optimal Balance Sheet Structure
Net Debt Bridge (€m)
Net Leverage Evolution Average Cost of Debt Evolution
5,38%4,38%
FY2019 FY2020

19
Developments during the period by activity
* 38% participation in TE, 50% ownership in the first plant (HERON 1) and 25% in HERON 2 after the deals with GDF SUEZ and Qatar Petroleum
Increased exposure to Motorway projects during 2019 Decrease in revenue mainly due to the lockdown restrictions that reduced
traffic. Easing of restrictions will boost the revenue generation of Motorways Secured projects such as the Kasteli airport and the Hellinikon Casino are
expected to significantly increase run-rate Revenue & EBITDA
Continued strong profitability and cash flow generation Increased revenue due to increase in fully operational parks Installed capacity amounts to 1,373MW, with a target of 3,000MW within the
next 5 years
Reduction in revenue is observed vs. previous years due to the broad and lucrative project portfolio of the Group over the last years
A rapid recovery is expected due to the current backlog of €2.6bn including a number of high quality construction projects, including the new International airport in Heraklion (€470m) and the Hellinikon Casino
The Group is planning to divest in the future from specific real estate assets
Still on investment phase – no results generated
Activity Revenue €m(1) Comments
Real Estate
Mining
Concessions
Energy Production
Construction
185
151
FY2019
FY2020
237
273
FY2019
FY2020
682
498
FY2019
FY2020
5
4
FY2019
FY2020
10
7
FY2019
FY2020
1. Revenues post intra-segment elimination

Construction Segment

21
Construction
Construction Outlook
Select upcoming projectsP&L3
Project Value (€bn)
Hellinikon 5.0
North Crete Motorway* 1.5
Undersea Salamina connection* 0.4
*concession
Sum 6.9
Backlog increased to €2.2bn1 following successful new contract wins: International airport in Heraklion (€480m) and Casino Resort in Limassol (€108m)
Impeccable track record in delivering complex projects on time and on budget, such as the Stavros Niarchos Cultural Centre and Ionia Odos
Significant infrastructure projects are expected to be tendered over the next quarters
There are 69 infrastructure projects in Greece2 in the pipeline for completion by 2022 totaling €21.4bn, 34 are motorways, ports and airports, 15 Energy, 10 railways and 10 water and waste projects
Projects completed & under construction
Kasteli AirportIonia Odos
2019 2020
Revenue 739.1 525.9
Growth % (27.1%) (28.9%)
Adj. EBITDA 16.2 19.0
Margin % 2.2% 3.6%
EBIT 3.6 6.9
Net Results (10.2) (9.7)
Nikola Tesla AirportCasino resort Limassol
1. As of the date of publishing the FY2020 financial statements2. PWC research3. All figures are shown before any inter-segmental eliminations
Significant increase in construction backlog to €2.2bn through new contract wins

2222
Backlog overview
Largest project: Design and Construction of new international airport in Heraklion, Crete (€475m)
Other projects include the construction of motorways, office buildings and power projects for clients such as the Ministry of Public Works
Accounts for c70% of backlog
Largest Project: Execution of buildings in Agia Napa in Cyprus (€141m) Other projects include construction of airports, roads and marinas in a number of
countries including Cyprus, Serbia, Bahrain & UAE Accounts for c30% of backlog
Greece
1,92,1 2,2
1,9
3,1
3,9
3,32,8
2,51,8 1,6 1,7 1,6
2,2
2 0 0 8 2 0 0 9 2 0 1 0 2 0 1 1 2 0 1 2 2 0 1 3 2 0 1 4 2 0 1 5 2 0 1 6 2 0 1 7 2 0 1 8 2 0 1 9 D E C - 2 0 A P R I L - 2 1
Construction Backlog Evolution (€bn)
2020 Backlog Breakdown by Geography
Overseas
GEK Terna Group traditionally acts as concessionaire in projects representing a
significant portion of the backlog
Total Backlog:€2.2m

2323
Construction highlights
Infrastructure Buildings Industrial Energy
Ionia Odos
Kallidromos Tunnel
Athens Metro
Construction and delivery of Klokovatunnel (3km) in record time (24m months)
Double tube tunnel with a length of 9,025m with cross passages every 500m
Egaleo-Haidari extension constitutes a section of Line 3, c. 1,418km long
Agia Nappa Marina
Construction of two towers (115m high); complex of villas and commercial buildings
Stavros Niarchos Cultural Centre
Spans in a 170,000sqm park, including National Library of Greece & Greek opera
Riffa Views Development
Construction of 326 residential two-storey villas in Bahrain
Hellenic Petroleum Refinery
Construction of a new fuel production unit in Thessaloniki
Kleemann Hellas HQ
Comprises 2 underground floors and 16 upper levels with a total height of 50m
Shell Tank Farm
Construction of ten product tanks with a total capacity of 28,000m3
HERON II Power Plant
Combined Cycle Power Plant with a nominal capacity of 435 MW
Dafnozonara Hydro Plant
Project involves a 12m high cement dam alongside the powerhouse
PPC Power Plant Megalopolis
Combined Cycle Power Plant with a nominal capacity of 811 MW

Concessions Segment
24

25
Hellinikon Casino
€1bn estimasted project budget Equity: €120m Term: 35 years / 35% stake
Nea Odos
Ionian Road & Central Greece Motorway (100% ownership)
Total length: 378.7km (159km newly built)— Equity invested €192m (100%)— Senior bank debt (non recourse):
€175m Expiration: 2037
Olympia Odos
Total length: 365km— Equity invested €209m (100%)— Senior bank debt (non recourse):
€675m Expiration: 2041 Participation: 17%
Kasteli Airport
New airport in Crete— 3,200m runway— 71,620m2 terminal— 15m passengers per year
Equity: €158.4m (100%); €36m subordinated loan
Term: 35 years 32.5% stake
Kentriki Odos
Total length: 231km— Equity invested €67m (100%)— Senior bank debt (non recourse):
€451m Expiration: 2036
Parking
Parking stations all over Greece— 2,235 total spaces— c.€10m investment
Ownership varies per project, ranging between 20% and 100%
Waste Management/E-Ticket 1
> 2 waste management projects— c.€26m investment
> 1 E-ticket project— c.€8m investment
Concessions overview
Concessions(2) 2019 2020Revenue 187.1 151.3 Growth % (5.0%) (19.2%)Adj. EBITDA 103.1 105.3 Margin % 55.1% 69.6%EBIT 51.7 44.1 Net Results 54.1 27.3
1. Through participation in Terna Energy2. All P&L figures are shown before any inter-segmental eliminations

Energy Production Segment

27
640 664 738986 1.032
1.390 1.373
3.000
2014 2015 2016 2017 2018 2019 2020 2025E
Energy Production – Renewable Energy (TERNA Energy)
P&L(2)
TERNA Energy is the largest renewables energy group in Greece (728 MW) with significant activities in the USA (513 MW1), Poland (102 MW) and Bulgaria (30 MW)
Total installed capacity amounts to 1,373 MW Strong and visible cash flow generation through a mix of Feed-in-Tariffs
and off-take agreements The company is also engaged in waste management and has been
awarded two waste management concessions in Greece— Plant in Epirus commenced operations in Mar 2019 while the plant
in Peloponnese is expected to commence operations in 2020330 MW in Greece (South Evia –Project Kafireas) will start construction soon, consisting of— 150 MW in South Evia owned by TE— Recently acquired 270 wind park in same area (180 MW will start)
2019 2020Revenue 237.3 273.4 Growth % 9.7% 15.2%
EBITDA 176.9 193.9 Margin % 74.6% 70.9%
EBIT 119.7 127.5 Net Results 46.5 68.8
1. Includes 200 MW of installed capacity from the assets acquired in the USA in Q1 20192. All P&L figures are shown before any inter-segmental eliminations
Overview Installed capacity evolution (MW)
Installed capacity split by country1
Largest renewable energy platform in Greece with substantial operations abroad
728513
102 30
Greece
USA
Poland
Bulgaria
1,373 MW

28
Overview of current portfolio and future pipeline
Terna Energy EBITDA (€m) Terna Energy Capital Expenditure (€m)
1. Total project cost = Cash grant/Tax equity + Project finance Debt + Equity
Pipeline
5886
146
229
109
205
105
2014 2015 2016 2017 2018 2019 2020
7499
116148
168 182 195
2014 2015 2016 2017 2018 2019 2020
Organic growth and value creation with a focused strategy and attractive pipeline
Project Type Capacity Total Project Cost1
Cash Grant/Tax
Equity
Project Finance Debt Equity / Cash
Expected commercial operation
UNDER CONSTRUCTION/READY TO BUILD €m €m €m €m
Peloponnese Waste Management Waste 2.4 MW 123 66 40 17 2021
South Evoia (Kafireas) Wind 330.0 MW 569 - 455 114 2022Taratsa Wind 30.0 MW 31 - 23 8 2021Evritania Wind 67.0 MW 81 - 63 18 2022TOTAL 429.4 MW 804 66 581 157
29
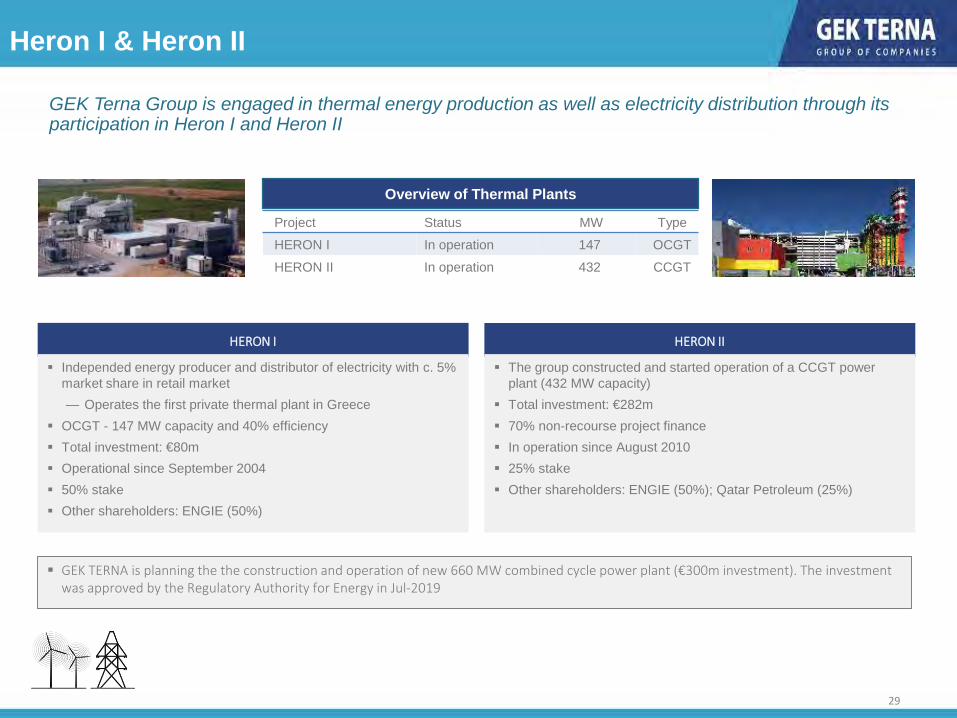
Heron I & Heron II
Project Status MW Type HERON I In operation 147 OCGT HERON II In operation 432 CCGT
HERON I
Independed energy producer and distributor of electricity with c. 5% market share in retail market — Operates the first private thermal plant in Greece
OCGT - 147 MW capacity and 40% efficiency Total investment: €80m Operational since September 2004 50% stake Other shareholders: ENGIE (50%)
HERON II
GEK Terna Group is engaged in thermal energy production as well as electricity distribution through its participation in Heron I and Heron II
GEK TERNA is planning the the construction and operation of new 660 MW combined cycle power plant (€300m investment). The investment was approved by the Regulatory Authority for Energy in Jul-2019
The group constructed and started operation of a CCGT power plant (432 MW capacity)
Total investment: €282m 70% non-recourse project finance In operation since August 2010 25% stake Other shareholders: ENGIE (50%); Qatar Petroleum (25%)
Overview of Thermal Plants

Real Estate Segment

31
Real Estate
Overview
GEK Terna is engaged in Real Estate development - the company holds a differentiated portfolio in Greece and abroad
— Offices— Commercial properties— Residential properties— Entertainment parks— Logistic centers-industrial parks— Hotels - Resorts— Parking stations
P&L 2019 2020Revenue 5.2 4.2 Growth % (47.0%) (19.6%)Adj. EBITDA 0.2 0.3 Margin % 4.1% 6.0%EBIT 0.4 (0.9)Net Results 0.3 (2.4)
P&L1
1. All P&L figures are shown before any inter-segmental eliminations

Macro Backdrop

33
Favorable Macro Conditions (1/3)
GDP Evolution After years of contraction in the Greek economy, a strong recovery is expected to take place
10-year Greek government bond yields have reached the lowest level compared to recent years
International investors have shown confidence in Greece through increased exposure in various industries of the domestic market
0,0%
5,0%
10,0%
15,0%
20,0%
Apr-14 Apr-15 Apr-16 Apr-17 Apr-18 Apr-19 Apr-20 Apr-21
0,7%
(0,4%) (0,5%)
1,3% 1,6% 1,9%
(8,2%)
3,8%5,0%
2,4%1,5% 1,5% 1,4%
(15,0%)
(10,0%)
(5,0%)
0,0%
5,0%
10,0%
2014 2015 2016 2017 2018 2019 2020 2021E 2022E 2023E 2024E 2025E 2026E
10Y Greek Government Bond Yield
Sources: IMF, Bloomberg

34
Favorable Macro Conditions (2/3)
Gross Fixed Capital Formation (Other Buildings and Structures) (€bn) Domestic Gross Fixed Capital Formation, currently standing ay €4.9bn, has decreased substantially over the years
Greece is lagging its European counterparts in terms of GFCF as % of GDP with infrastructure severely affected by the deep recession
The continuous underinvestment and lagging transport infrastructure cost have created the need for significant investments domestically
Gross Fixed Capital Formation (% of GDP)
10,511,1
9,2
6,4 6,6 7,0 6,6 6,57,7 7,7
6,0
4,5 4,9
0
2
4
6
8
10
12
2008 2009 2010 2011 2012 2013 2014 2015 2016 2017 2018 2019 2020
60% decrease
0
10
20
30
2000 2001 2002 2003 2004 2005 2006 2007 2008 2009 2010 2011 2012 2013 2014 2015 2016 2017 2018 2019
Greece EU-28
Sources: World Bank, Elstat

35
Favorable Macro Conditions (3/3)
RES’ % Contribution in total Gross Electricity Production RES’ contribution in gross electricity production is expected to reach 66% by 2030 in Greece
The targets set out in the Hellenic Republic’s National Energy and Climate Plan suggest an appetite towards RES and the regulatory framework is expected to help facilitate those targets
There is a government commitment to shut down lignite plants, creating more room for growth in the RES space
In addition, initiatives led by the EU Recovery Fund are expected to further support the Group’s growth
The Group’s leading position in the market combined with its capital structure will enable it to win new contracts and seize opportunities as they arise in the market
Indicative EU Recovery Fund Initiatives
33%42%
51%57%
66%
0%
25%
50%
75%
100%
2020 2022 2025 2027 2030
Delignification Shut-down of all operating lignite plants by 2028 for environmental purposes
RES Support of RES projects with a focus on innovative technologies
Spatial and Urban Plans Acceleration of spatial planning
Urban Regeneration
Comprehensive urban regeneration programme to upgrade buildings deemed of historical importance and renovate urban areas
€300m
€10bn
€350m
€360m
Initiative Description Requested Amount
Waste Management Construction of waste treatment and recycling plants €660m
Modernization of the Electricity
Network
Funding for major projects such as the Crete – Attica Interconnection and the Fourth Phase of the Interconnection of Cyclades
€600m
Sources: Ministry of Energy, Hellenic Republic

Appendix I – Financial Data

37
Group Balance SheetFigures in € (000') Group
FY2020 FY2019Assets
Total non‐current assets 2,836,302 3,013,538 Total current assets 1,799,420 1,295,731
Total Assets 4,635,722 4,309,269 Equity & Liabilities
Shareholders’ equityShare capital 58,951 58,951 Share premium account 381,283 381,283 Reserves 474,523 408,005 Retained earnings (402,514) (352,318)
Total Shareholders' Equity 512,243 495,921 Non‐controlling interests 311,625 270,954
Total Equity 823,868 766,875
Liabilities
Long‐term loans 2,198,693 1,788,773 Total non‐current liabilities 3,010,266 2,643,882 Total current liabilities 801,588 898,512
Total Liabilities 3,811,854 3,542,394
Total Equity & Liabilities 4,635,722 4,309,269

38
Group P&LFigures in € (000') Group
FY2020 FY2019Continuing operations
Turnover 971,305 1,155,739 Cost of sales (756,476) (919,263)
Gross profit 214,829 236,476 Administrative and distribution expenses (79,489) (75,658)Research and development expenses (4,516) (3,931)Other income/(expenses) 14,283 (3,162)
Results before taxes, financing and investing activities 145,107 153,725
Net financial income/(expenses) (99,467) (72,267)Profit / (loss) from sale of participations and securities 27,194 (520)Profit / (loss) from valuation of participations and securities (1,808) 3,386 Income / (losses) from participations and other securities 856 1,408 Profit / (loss) from the consolidation of associates under the equity method (1) (214)Profit / (loss) from the consolidation of joint ventures under the equity method (452) (7,700)
Earnings before taxes 71,429 77,817 Income tax (13,358) (22,086)
Net Earnings/(losses) after taxes 58,071 55,731 Attributable to
Shareholders of the parent from continuing operations 12,461 23,457
Non‐controlling interests from continuing operations 45,610 32,274

39
Group Cash FlowFigures in € (000') Group
FY2020 FY2019Cash Flows From Operating ActivitiesEarnings before tax 71,429 77,817
Depreciation 128,414 122,822 Fixed assets grants amortization (7,034) (8,194)Provisions 18,825 1,073 Impairments 7,772 16,194 Other non-cash expenses/revenue (26,710) (10,468)Interest and related revenue (17,432) (9,584)Interest and other financial expenses 137,327 127,861 Results from derivatives (20,428) (46,011)Other Adjustments (12,414) 2,038
Operating profit before changes in working capital 279,749 273,548 (Increase)/Decrease in:
Inventories 2,187 (2,248)Investment property as main activity 1,377 1,985 Trade receivables 50,545 90,335 Restricted Deposits (54,461) 12,361 Prepayments and other short term receivables 50,579 19,487
Increase/(Decrease) in:Suppliers (20,955) (43,619)Accruals and other short term liabilities 14,978 (96,815)Income tax payments (7,782) (16,894)
Net cash flows from operating activities 316,217 238,140 Cash Flows From Investing Activities
(Purchases) / Disposals of fixed assets (121,808) (186,952)Other Cash from Investing Acivities (22,923) (51,306)
Net cash flows for investing activities (144,731) (238,258)Cash flows from financing activitiesProceeds from Short term loans 209,036 282,610 Payments towards Short term loans (208,129) (281,624)Proceeds from long term loans 917,662 615,053 Payments towards long term loans (399,722) (482,564)Dividends paid to Non-Controlling Interests (25,744) (696)Interest & other financial expenditure (91,249) (89,017)Other Cash from Financing Acivities (54,590) 27,519
Net cash flows from financing activities 347,264 71,281 Effect of foreign exchange differences in cash (5,004) 266
Net change in cash and cash equivalents from continuing operations 513,746 71,429 Beginning of Period Balance 594,671 523,242
End of Period Balance 1,108,417 594,671

Appendix II – Concessions Breakdown

41
GEK Terna Group Concession PortfolioProject % Stake Equity Invested (€m)2 Commercial operation Concession Expiration
E65 & Nea Odos motorways 100% 254 2018 2037
Olympia Odos 17% 35 2018 2041
Epirus waste management1 100% 10 2019 2047
Peloponnese waste management1 100% 16 2023 2047
Kasteli airport 33% 160 2025 2060
Hellinikon casino 35% 120 2025 2060
Other (Parking, e-Ticket) 10%-20% 18 NA NA
Total 613
1. Reported under Terna Energy2. Incl. Shareholders loans

Appendix III – Share Price Performance
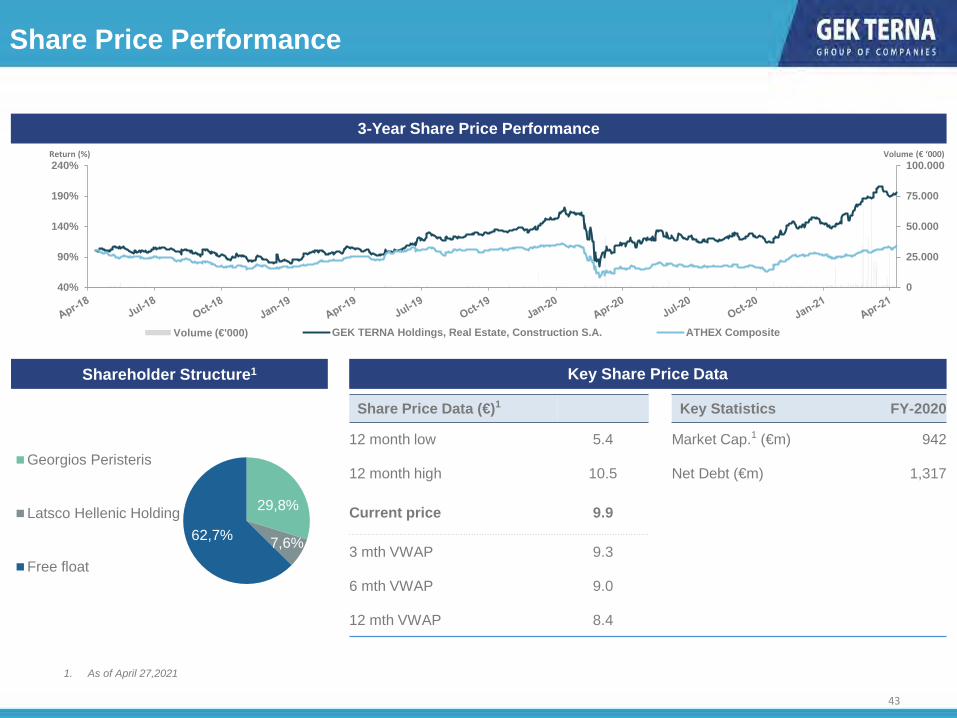
43
Volume (€ ‘000)
29,8%
7,6%62,7%
Georgios Peristeris
Latsco Hellenic Holding
Free float
Share Price Data (€)1 Key Statistics FY-2020
12 month low 5.4 Market Cap.1 (€m) 942
12 month high 10.5 Net Debt (€m) 1,317
Current price 9.9
3 mth VWAP 9.3
6 mth VWAP 9.0
12 mth VWAP 8.4
3-Year Share Price PerformanceReturn (%)
Key Share Price DataShareholder Structure1
Share Price Performance
1. As of April 27,2021
0
25.000
50.000
75.000
100.000
40%
90%
140%
190%
240%
Volume (€'000) GEK TERNA Holdings, Real Estate, Construction S.A. ATHEX Composite