Introduction - SUST Repository
42
] 1 [ Introduction 1-1 General Honey is essentially a highly concentrated water solution of two sugars dextrose and laevulose with small amount of at least 22 other more complex sugars .Many other substances also occur in honey .but the sugars are by far the major components. The principal physical characteristics and behavior of honey are due to its sugars, but minor constituents such as flavoring materials pigments, acids, and minerals are largely responsible for the differences among individual honey types. Honey, as it is found in the hive is a truly remarkable material elaborated by bees with floral nectar and less often with honeydew .Nectar is a thin easily spoiled sweet liquid that is changed by the honey bee to a stable, high density, high energy food. The earlier U.S .Food and drug Act defined honey as "the nectar and saccharine exudation of plants, gathered, modified and stored in the comb by honey bees is levorotatory; contains not more than 25% water ,not more than 0.25% ash ,and not more than 8% sucrose . The limits established in this definition were largely based on a survey published in 1908. Today, this definition has an advisory status only, but is not totally correct. As it allows too high a content of water and sucrose .is too low in ash, and makes no mention of honeydew. Colors of honey form a continuous range from very pale yellow through ambers to darkish red amber to nearly black .The variation are almost entirely due to the plant source of the honey, although climate may modify the color somewhat through the darkening action of heat. The flavor and aroma of honey vary even more than the color. Although there seems to be a characteristic "honey flavor" almost an infinite number of aroma and flavor variation can exist .As with color, the variation appear to be governed by the floral source .In general ,light colored honey is mild in flavor and darker honey has a more pronounced flavor .Exceptions to the rule sometimes endow a light honey with very definite specific flavors .Since flavor and aroma judgments are personal ,individual preference will vary ,but with the tremendous variety available ,every should be able to find a favorite honey.(White and Landis 1980).
-
Upload
khangminh22 -
Category
Documents
-
view
3 -
download
0
Transcript of Introduction - SUST Repository

]1[
Introduction
1-1 General
Honey is essentially a highly concentrated water solution of two sugars dextrose and laevulose with small amount of at least 22 other more complex sugars .Many other substances also occur in honey .but the sugars are by far the major components. The principal physical characteristics and behavior of honey are due to its sugars, but minor constituents such as flavoring materials pigments, acids, and minerals are largely responsible for the differences among individual honey types.
Honey, as it is found in the hive is a truly remarkable material elaborated by bees with floral nectar and less often with honeydew .Nectar is a thin easily spoiled sweet liquid that is changed by the honey bee to a stable, high density, high energy food. The earlier U.S .Food and drug Act defined honey as "the nectar and saccharine exudation of plants, gathered, modified and stored in the comb by honey bees is levorotatory; contains not more than 25% water ,not more than 0.25% ash ,and not more than 8% sucrose . The limits established in this definition were largely based on a survey published in 1908. Today, this definition has an advisory status only, but is not totally correct. As it allows too high a content of water and sucrose .is too low in ash, and makes no mention of honeydew.
Colors of honey form a continuous range from very pale yellow through ambers to darkish red amber to nearly black .The variation are almost entirely due to the plant source of the honey, although climate may modify the color somewhat through the darkening action of heat.
The flavor and aroma of honey vary even more than the color. Although there seems to be a characteristic "honey flavor" almost an infinite number of aroma and flavor variation can exist .As with color, the variation appear to be governed by the floral source .In general ,light colored honey is mild in flavor and darker honey has a more pronounced flavor .Exceptions to the rule sometimes endow a light honey with very definite specific flavors .Since flavor and aroma judgments are personal ,individual preference will vary ,but with the tremendous variety available ,every should be able to find a favorite honey.(White and Landis 1980).

]2[
1-1-1Enzymatic reactions of honey making
A honeybee starts the honey making process by visiting a flower and gathering some of its nectar. Many plants use nectar as a way of encouraging insects (Bee, wasps, butterflies, etc.) to stop at the flower. In the process of gathering nectar, the insect transfers pollen grains from one flower to another and pollinates the flower.
Most flower nectars are similar to sugar water - sucrose mixed with water. Nectars can contain other beneficial substances as well. To make honey, two things happen:
Enzymes that bees produce turn the sucrose (a disaccharide) into glucose and fructose (monosaccharides). Most of the moisture has to be evaporated, leaving only about 18-percent water in honey.
An enzyme, invertase, converts most of the sucrose into two six-carbon sugars, glucose and fructose. A small amount of the glucose is attacked by a second enzyme, glucose oxidase, and is converted into gluconic acid and hydrogen peroxide. The gluconic acid makes honey an acid medium with a low pH that is inhospitable to bacteria, mold, and fungi, organisms we call microbes, while the hydrogen peroxide gives short-range protection against these same organisms when the honey is ripening or is diluted for larval food. Honey bees also reduce the moisture content of nectar, which gives it a high osmotic pressure and protection against microbes.
The effect is to make honey a very stable food. It naturally resists molds, fungi and other bacteria, allowing it to last for years without refrigeration!
1-1-2 Nutritional value of honey
Honey is the name given to the sweet, yellowish liquid that is produced by honey bees. It has a taste that is distinctive from sugar and a nutritional value that is much higher than the latter. Honey is collected from a wide variety of flowers and forms the major source of food for the bees. It is stored in the hive of the bees and is used by them either in winters or when the food supply (flowers) is low. The bee-rearers extract the honey from the hives and thereafter, it is purified and sold in the market. Honey has been found to bestow a number of health and nutrition benefits on the users, some of which have been mentioned below.

]3[
Given below is the amount of nutrients in 100 gm of honey:
Carbohydrates - 82.4 g Sugars - 82.12 g Dietary fiber - 0.2 g Protein - 0.3 gm Water - 17.10 gm Riboflavin (Vitamin B2) - 0.038 mg Niacin (Vitamin B3) - 0.121 mg Pantothenic Acid (Vitamin B5) - 0.068 mg Vitamin B6 - 0.024 mg Folate (Vitamin B9) - 2 μg Vitamin C - 0.5 mg Calcium - 6 mg Iron - 0.42 mg Magnesium - 2 mg Phosphorus - 4 mg Potassium - 52 mg Sodium - 4 mg Zinc - 0.22 mg Energy - 300 kcal (1270 kJ)
1-1-3 Composition of honey
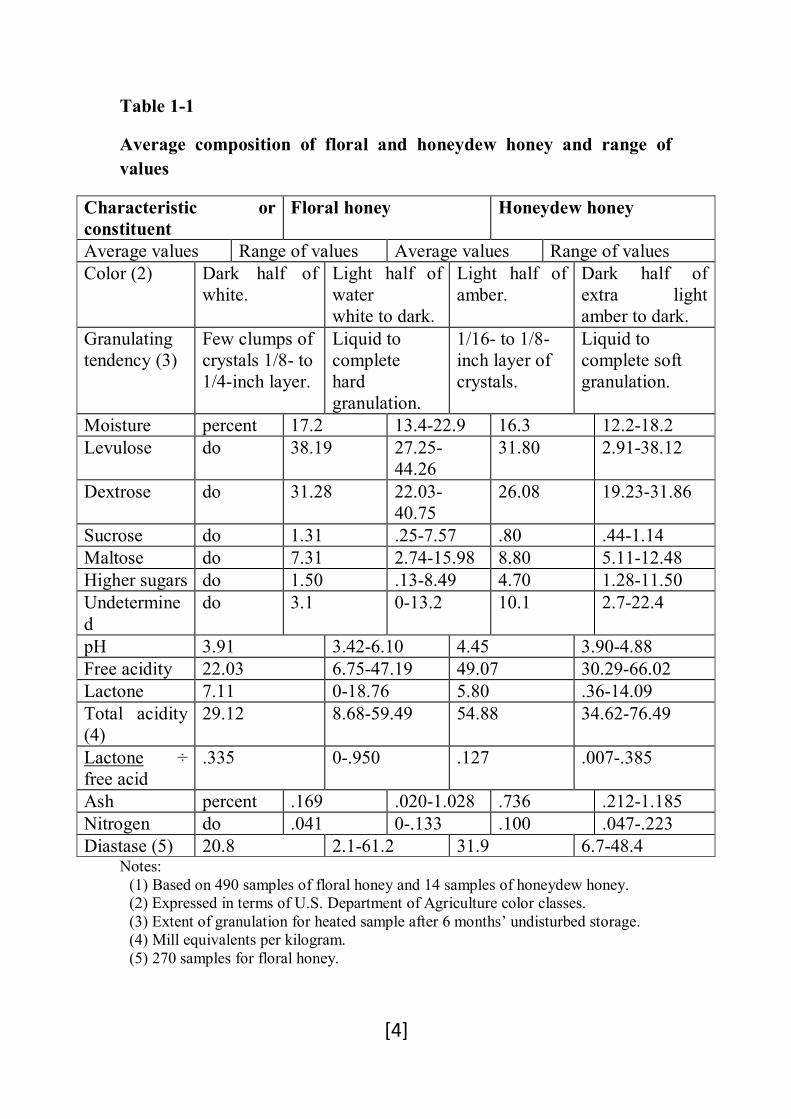
The largest portion of the dry matter in honey consists of the sugars. This very concentrated solution of several sugars results in the characteristic physical properties of honey –high viscosity, high density ,granulations tendencies, tendency to absorb moisture from the air ,and immunity from some types of spoilage .Because of its unique character and its considerable difference from the other sweeteners, chemists have long been in its composition in food technology sometimes have been frustrated in attempts to include honey in prepared food formulas or products .Limitation of methods available to earlier researchers made their results only approximate in regard to the true sugar composition of honey .Although recent research has greatly improved analytical procedure for sugars, even now some compromises are required to make possible accurate analysis of large numbers of honey samples for sugars see table 1-1 .(White and Landis 1980)
]4[
Table 1-1
Average composition of floral and honeydew honey and range of values
Characteristic or constituent
Floral honey Honeydew honey
Average values Range of values Average values Range of values Color (2) Dark half of
white. Light half of water white to dark.
Light half of amber.
Dark half of extra light amber to dark.
Granulating tendency (3)
Few clumps of crystals 1/8- to 1/4-inch layer.
Liquid to complete hard granulation.
1/16- to 1/8-inch layer of crystals.
Liquid to complete soft granulation.
Moisture percent 17.2 13.4-22.9 16.3 12.2-18.2 Levulose do 38.19 27.25-
44.26 31.80 2.91-38.12
Dextrose do 31.28 22.03-40.75
26.08 19.23-31.86
Sucrose do 1.31 .25-7.57 .80 .44-1.14 Maltose do 7.31 2.74-15.98 8.80 5.11-12.48 Higher sugars do 1.50 .13-8.49 4.70 1.28-11.50 Undetermined
do 3.1 0-13.2 10.1 2.7-22.4
pH 3.91 3.42-6.10 4.45 3.90-4.88 Free acidity 22.03 6.75-47.19 49.07 30.29-66.02 Lactone 7.11 0-18.76 5.80 .36-14.09 Total acidity (4)
29.12 8.68-59.49 54.88 34.62-76.49
Lactone ÷ free acid
.335 0-.950 .127 .007-.385
Ash percent .169 .020-1.028 .736 .212-1.185 Nitrogen do .041 0-.133 .100 .047-.223 Diastase (5) 20.8 2.1-61.2 31.9 6.7-48.4
Notes: (1) Based on 490 samples of floral honey and 14 samples of honeydew honey. (2) Expressed in terms of U.S. Department of Agriculture color classes. (3) Extent of granulation for heated sample after 6 months’ undisturbed storage. (4) Mill equivalents per kilogram. (5) 270 samples for floral honey.

]5[
1-1-3-1 Water content
The natural moisture of honey in the comb is that remaining from nectar after ripening .It is one of the most important characteristic of honey influencing keeping quality and granulation ,after extraction of honey its moisture content may change during storage ,According to the codex elementary the moisture content of honey should not exceed 20% ,if it exceeds 20% the fermentation yeast of the honey will turn the sugars of the honey into alcohol ,this causes honey to have a sour taste (Charlotte 2011).
1-1-3-2 Sugars
Honey is above all a carbohydrate material, with 95 to 99.9 percent of the solids being sugars, and the identification of these sugars has been studied for many years. Sugars are classified according to their size or the complexity of the molecules of which they are made .Dextrose (glucose) and laevulose (fructose),the main sugars in honey ,are simple sugars ,or monosaccharide's, and are the building blocks for the more complex honey sugars .Dextrose and laevulose account for about 85 percent of the solids in honey.
Dextrose and laevulose are still by far the major sugars in honey ,but 22 others have been found .All of these sugars are more complex than the monosaccharide's ,dextrose and laevulose .Ten disaccharides have been identified :sucrose, maltose ,is maltose, malt lose, nigerose, turanose, kojibiose , laminaribiose,a,B-trehalose, and gentiobiose.Ten trisaccharide are present :melezitose, 3-a-isomaltosylglucose, maltotriose ketose, panose, isomaltotriose, erlose, theanderose, centose, and isopanose. Two more complex sugars, isomaltotetraose and isomaltopentaose, have been identified .Most of these sugars are present in quite small quantities. (White and Landis 1980).

]6[
(i) Classification of sugars
Monosaccharide comes from the Greek monos, which means "one," and sakcharon meaning "sugar." From monosaccharides-the simplest form of sugar-more complex molecules are assembled. Two saccharides link together to form a substance with two molecules called a disaccharide. Sucrose (from cane sugar and sugar beets) is a disaccharide, as is lactose. Found in milk, lactose consists of one molecule of glucose and one of galactose. Oligosaccharides consist of three to six monosaccharides and are found in breast milk and plants: they coat our mucus-membrane linings and are present in saliva. Link many monosaccharides together-from hundreds to thousands-and you fashion a very large molecule called a polysaccharide. Starch is a polysaccharide, as is glycogen. Stored in the liver as a backup source of fuel, our bodies convert glycogen back to glucose when we need the energy. Unlike other creatures, including deer that feast in your garden and termites that munch the clapboard on your house, we cannot digest cellulose because our guts do not possess die necessary enzyme. (Emil and Mondoa 2012).
The chemical structures of saccharides convey distinct, stable cellular messages. The saccharide molecule contains component atoms of carbon, hydrogen, and oxygen arranged in a ring. The ratio is always 1:2:1. So for every unit of carbon and oxygen there are two units of hydrogen. In the case of glucose, for instance, there are six carbon atoms, twelve hydrogen, and six oxygen.
The way in which the individual sugar molecules are joined to each other determines how the body absorbs and uses them. Consider a piece of coal and a diamond. It's hard to think of two objects more different from each other. Yet both are pure carbon. The difference lies in the way in which the individual atoms bond to each other. Likewise, the way the individual saccharide molecules of the eight essential saccharides bond to each other appears to be nutritionally important.
Saccharides are so important that our bodies have developed a backup process for producing the ones in which our diets are deficient. Indeed, using multiple steps, numerous enzymes, and lots of energy-producing molecules such as ATP, most healthy bodies can create every other saccharide from glucose. Enzymes are basically molecular machines that perform energy transfers, converting molecules to new forms-they're in fact the most advanced micromachines ever devised. Xylose, for example, is several steps and enzymes away from glucose. Yet as anyone

]7[
who has worked in an assembly line knows, it takes just one machine breaking down to shut down the line.
In much the same way, one enzyme not working properly is all that it takes to jam up the works in the body and create inaccurate cell messages. The viruses, bacteria, and environmental toxins that invade our bodies compete for the same vital enzymes that convert saccharides from one form to another. The result, some scientists now believe, is that under stress the body may not be able to manufacture essential saccharides fast enough, dealing instead faulty messages by manufacturing inaccurate glycoproteins, the substances that contain sugars and proteins. At first, the body won't work optimally. Eventually, illness may result, particularly if the body is put under unusual or prolonged physical or emotional stress. Supplementing with foods and supplements rich in glyconutrients can help prevent potential breakdowns in glycoprotein manufacture and head off illness. (Emil and Mondoa 2012).
(ii) Structure of saccharides
(a) Mono saccharides
They are the simplest sugars and cannot be hydrolysed into simpler compounds. The general formula is CnH2nOn. They are further classified on the basis of number of carbon atoms present in molecule.
Triose (contain 3 carbon atoms), Example: Glyceraldehyde and dihydroxy acetone.
Tetrose (contain 4 carbon atoms), Example: Erythose and Threose.
Pentose (contain 5 carbon atoms), Example: Ribose, Ribulose, Deoxyribose, Arbinose, Xylose, and Xylulose.
Hexose (contain 6 carbon atoms), Example: Glucose, Fructose,Mannose and Galactose.
Heptose (contain 7 carbon atoms), Example: Sedoheptulose.
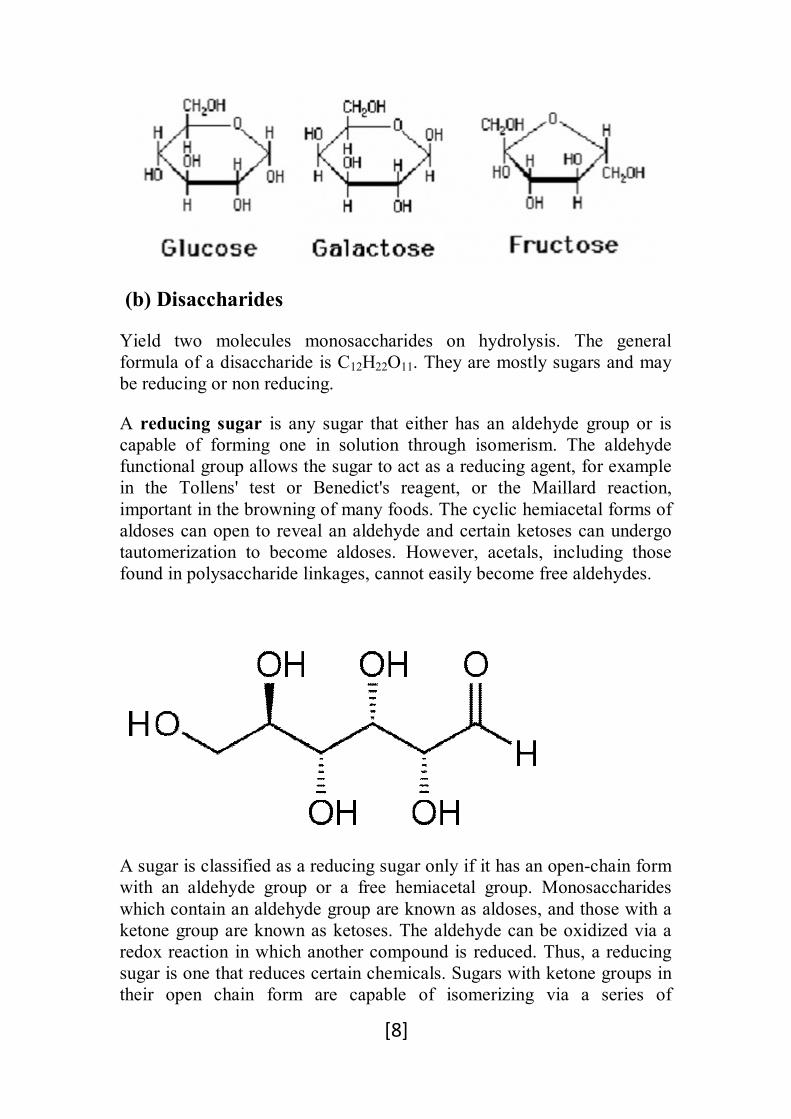
]8[
(b) Disaccharides
Yield two molecules monosaccharides on hydrolysis. The general formula of a disaccharide is C12H22O11. They are mostly sugars and may be reducing or non reducing.
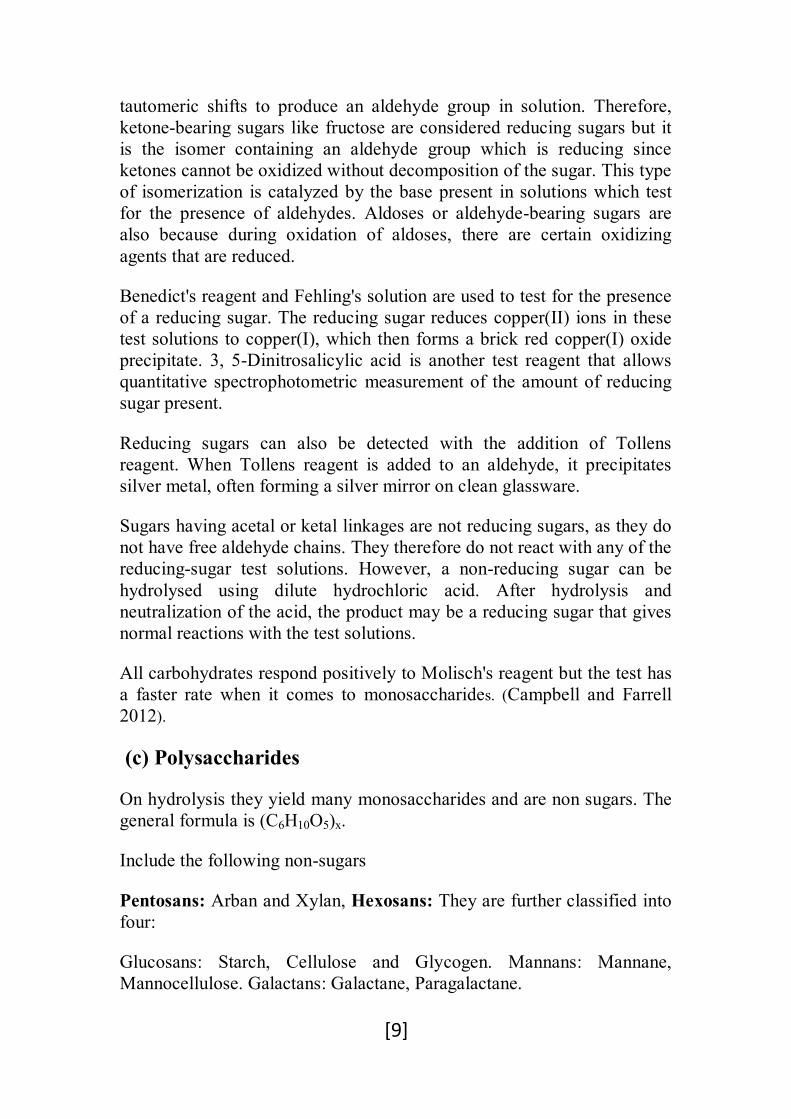
A reducing sugar is any sugar that either has an aldehyde group or is capable of forming one in solution through isomerism. The aldehyde functional group allows the sugar to act as a reducing agent, for example in the Tollens' test or Benedict's reagent, or the Maillard reaction, important in the browning of many foods. The cyclic hemiacetal forms of aldoses can open to reveal an aldehyde and certain ketoses can undergo tautomerization to become aldoses. However, acetals, including those found in polysaccharide linkages, cannot easily become free aldehydes.
A sugar is classified as a reducing sugar only if it has an open-chain form with an aldehyde group or a free hemiacetal group. Monosaccharides which contain an aldehyde group are known as aldoses, and those with a ketone group are known as ketoses. The aldehyde can be oxidized via a redox reaction in which another compound is reduced. Thus, a reducing sugar is one that reduces certain chemicals. Sugars with ketone groups in their open chain form are capable of isomerizing via a series of
]9[
tautomeric shifts to produce an aldehyde group in solution. Therefore, ketone-bearing sugars like fructose are considered reducing sugars but it is the isomer containing an aldehyde group which is reducing since ketones cannot be oxidized without decomposition of the sugar. This type of isomerization is catalyzed by the base present in solutions which test for the presence of aldehydes. Aldoses or aldehyde-bearing sugars are also because during oxidation of aldoses, there are certain oxidizing agents that are reduced.
Benedict's reagent and Fehling's solution are used to test for the presence of a reducing sugar. The reducing sugar reduces copper(II) ions in these test solutions to copper(I), which then forms a brick red copper(I) oxide precipitate. 3, 5-Dinitrosalicylic acid is another test reagent that allows quantitative spectrophotometric measurement of the amount of reducing sugar present.
Reducing sugars can also be detected with the addition of Tollens reagent. When Tollens reagent is added to an aldehyde, it precipitates silver metal, often forming a silver mirror on clean glassware.
Sugars having acetal or ketal linkages are not reducing sugars, as they do not have free aldehyde chains. They therefore do not react with any of the reducing-sugar test solutions. However, a non-reducing sugar can be hydrolysed using dilute hydrochloric acid. After hydrolysis and neutralization of the acid, the product may be a reducing sugar that gives normal reactions with the test solutions.
All carbohydrates respond positively to Molisch's reagent but the test has a faster rate when it comes to monosaccharides. (Campbell and Farrell 2012).
(c) Polysaccharides
On hydrolysis they yield many monosaccharides and are non sugars. The general formula is (C6H10O5)x.
Include the following non-sugars
Pentosans: Arban and Xylan, Hexosans: They are further classified into four:
Glucosans: Starch, Cellulose and Glycogen. Mannans: Mannane, Mannocellulose. Galactans: Galactane, Paragalactane.

]10[
Pectic compounds: Pectic acid, Pectin and Protopectin, Gums, Amino hexanes.
Storage Polysaccharide
Starch
Cellulose
Chitin
1-1-3-3 Acids
The flavor of honey results from the blending of many “notes,” not the least being a slight tartness or acidity. The acids of honey account for less than 0.5 percent of the solids, but this level contributes not only to the flavor, but is in part responsible for the excellent stability of honey against microorganisms. Several acids have been found in honey, glycolic acid being the major one. It arises from dextrose through the action of an enzyme called glucose oxides. Other acids in honey are formic, acetic, butyric, lactic, oxalic, tartaric, maleic, pyruvic, pyroglutamic, a-ketoglutaric, glycolic, citric, malic, 2- or 3-phosphoglyceric acid, a- or B-glycerophosphate, and glucose 6-phosphate. (White and Landis 1980).
1-1-3-4 Proteins and amino acids
It will be noted in table 1 that the amount of nitrogen in honey is low, 0.04 percent on the average, though it may range to 0.1 percent. Recent

]11[
work has shown that only 40 to 65 percent of the total nitrogen in honey is in protein, and some nitrogen resides in substances other than proteins, namely the amino acids. Of the 8 to 11 proteins found in various honeys, 4 are common to all, and appear to originate in the bee, rather than the nectar. Little is known of many proteins in honey, except that the enzymes fall into this class. The presence of proteins causes honey to have a lower surface tension than it would have otherwise, which produces a marked tendency to foam and form scum and encourages formation of fine air bubbles. Beekeepers familiar with surface scum, which is largely due to its relatively high protein content. The amino acids are simple compounds obtained when proteins are broken down by chemical or digestive processes. They are the “building blocks” of the proteins. Several of them are essential to life and must be obtained in the diet. The quantity of free amino acids in honey is small and of no nutritional significance. Breakthroughs in the separation and analysis of minute quantities of material (chromatography) have revealed that various honeys contain 11 to 21 free amino acids. Praline, glutamic acid, aniline, phenylalanine, tyrosine, Lucien, and isoleucine are the most common, with proline predominating. (White and Landis 1980).
1-1-3-5 Minerals
When honey is dried and burned, a small residue of ash invariably remains, which is the mineral content. As shown in table 1-2 it varies from 0.02 to slightly over 1 percent for a floral honey, averaging about 0.17 percent for the 490 samples analyzed.
Honeydew honey is richer in minerals, so much so that its mineral content is said to be a prime cause of its unsuitability for winter stores. Schuette and his colleagues at the University of Wisconsin have examined the mineral content of light and dark honey. They reported the following average values:(White and Landis1980)

]12[
Table 1- 2
Mineral content of light and dark honey
Mineral Light honey (p.p.m.)
Dark honey (p.p.m.)
Potassium 205 1,676 Chlorine 52 113 Sulfur 58 100 Calcium 49 51 Sodium 18 76 Phosphorus 35 47 Magnesium 19 35 Silica 22 36 Iron 2.4 9.4 Manganese .30 4.09 Copper .29 .56
1-1-3-6 Enzymes
One of the characteristics that sets honey apart from all other sweetening agents is the presence of enzymes. These conceivably arise from the bee, pollen, nectar, or even yeasts or micro-organisms in the honey. Those most prominent are added by the bee during the conversion of nectar to honey. Enzymes are complex protein materials that under mild conditions bring about chemical changes, which may be very difficult to accomplish in a chemical laboratory without their aid. The changes that enzymes bring about throughout nature are essential to life.(White and Landis 1980).
1-1-4 Physical properties of honey
1-1-4-1 Color
The color of honey forms continuous range from very pale yellow through amber to darkish red amber nearly to black .The variation are almost entirely due to the plant source of honey ,although climate may modify the color somewhat through the darkening action of heat.(White and Landis).
]13[
1-1-4-2 Odor and flavor
Flavor and odor of honey vary even more than color .Although there seems to be a characteristic honey flavor ,almost an infinitive number of odor and flavor variation can exist .As with color ,variation appear to be governed by floral source ,in general light colored honey is mild in flavor and darker honey has more pronounced flavor(Doner et al 1980).
1-1-4-3 Density
Honey is about 40% more dense than water, it depends 0n the water content of honey, the higher water content the lower density .This density of honey ranges from 1.37-1.4 g\cm3.
1-1-4-4 Specific gravity
The ratio of the weight of the volume of the substance to the weight of the same volume of water.
1-1-4-5 Viscosity
Freshly extracted honey is a viscous liquid .Its depends on a large variety of substance and therefore varies with its composition and particularly with its water content. (White J et al 1980).
Viscosity is an important technical parameter during honey processing because it reduces honey flow during extraction, pumping, setting and other process. Rising the temperature of honey lowers its viscosity. (White M 1975)
1-1-4-6 Refractive Index
Refractive index is a useful measure for quality of honey .Refractive index alters due to variation in water content .The refractive index of honey ranging from 1.504at 13%humidity to 1.474 at 25% humidity.
1-1-4-7 Electrical conductivity
Since honey contains electrolytes it exhibits varying degrees of electrical conductivity which is used to determine the quality of honey.This
]14[
property depends on the ash and acid content of honey ,the higher the content the higher the resulting conductivity.
The conductivity is a good criterion of the botaonical origin of honey and thus is very often used in a routine honey control .A lower limit has been proposed for blossom honeys (Bogdanov 1999).
1-1-5 Methods of sugars determination
A large number of analytical techniques have been developed to measure the total concentration and type of carbohydrates present in foods. The carbohydrate content of a food can be determined by calculating the percent remaining after all the other components have been measured: %carbohydrates = 100 - %moisture - %protein - %lipid - %mineral. Nevertheless, this method can lead to erroneous results due to experimental errors in any of the other methods, and so it is usually better to directly measure the carbohydrate content for accurate measurements.
The amount of preparation needed to prepare a sample for carbohydrate analysis depends on the nature of the food being analyzed. Aqueous solutions, such as fruit juices, syrups and honey, usually require very little preparation prior to analysis. On the other hand, many foods contain carbohydrates that are physically associated or chemically bound to other components, e.g., nuts, cereals, fruit, breads and vegetables. In these foods it is usually necessary to isolate the carbohydrate from the rest of the food before it can be analyzed. The precise method of carbohydrate isolation depends on the carbohydrate type, the food matrix type and the purpose of analysis; however, there are some procedures that are common to many isolation techniques. For example, foods are usually dried under c vacuum (to prevent thermal degradation), ground to a fine powder (to enhance solvent extraction) and then defatted by solvent extraction.
One of the most commonly used methods of extracting low molecular weight carbohydrates from foods is to boil a defatted sample with an 80% alcohol solution. Monosaccharide's and oligosaccharides are soluble in alcoholic solutions, whereas proteins, polysaccharides and dietary fiber are insoluble. The soluble components can be separated from the insoluble components by filtering the boiled solution and collecting the filtrate (the part which passes through the filter) and the retentante (the part retained by the filter). These two fractions can then be dried and weighed to determine their concentrations. In addition, to monosaccharide's and oligosaccharides various other small molecules

]15[
may also be present in the alcoholic extract that could interfere with the subsequent analysis e.g., amino acids, organic acids, pigments, vitamins, minerals etc. It is usually necessary to remove these components prior to carrying out a carbohydrate analysis. This is commonly achieved by treating the solution with clarifying agents or by passing it through one or more ion-exchange resins.
Clarifying agents. Water extracts of many foods contain substances that are colored or produce turbidity, and thus interfere with spectroscopic analysis or endpoint determinations. For this reason solutions are usually clarified prior to analysis. The most commonly used clarifying agents are heavy metal salts (such as lead acetate) which form insoluble complexes with interfering substances that can be removed by filtration or centrifugation. However, it is important that the clarifying agent does not precipitate any of the carbohydrates from solution as this would cause an underestimation of the carbohydrate content.
Ion-exchange. Many monosaccharides and oligosaccharides are non polar non-charged molecules and can therefore be separated from charged molecules by passing samples through ion-exchange columns. By using a combination of a positively and a negatively charged column it is possible to remove most charged contaminants. Non-polar molecules can be removed by passing a solution through a column with a non-polar stationary phase. Thus proteins, amino acids, organic acids, minerals and hydrophobic compounds can be separated from the carbohydrates prior to analysis.
Prior to analysis, the alcohol can be removed from the solutions by evaporation under vacuum so that an aqueous solution of sugars remains. (McClements,D.J 2005).
1-1-5-1 Chromatographic and Electrophoretic methods
Chromatographic methods are the most powerful analytical techniques for the analysis of the type and concentration of monosaccharides and oligosaccharides in foods. Thin layer chromatography (TLC), Gas chromatography (GC) and High Performance Liquid chromatography (HPLC) are commonly used to separate and identify carbohydrates. Carbohydrates are separated on the basis of their differential adsorption characteristics by passing the solution to be analyzed through a column. Carbohydrates can be separated on the basis of their partition coefficients, polarities or sizes, depending on the type of column used. HPLC is currently the most important chromatographic method for analyzing

]16[
carbohydrates because it is capable of rapid, specific, sensitive and precise measurements. In addition, GC requires that the samples be volatile, which usually requires that they be derivitized, whereas in HPLC samples can often be analyzed directly. HPLC and GC are commonly used in conjunction with NMR or mass spectrometry so that the chemical structure of the molecules that make up the peaks can also be identified.
Carbohydrates can also be separated by electrophoresis after they have been derivitized to make them electrically charged, e.g., by reaction with borates. A solution of the derivitized carbohydrates is applied to a gel and then a voltage is applied across it. The carbohydrates are then separated on the basis of their size: the smaller the size of a carbohydrate molecule, the faster it moves in an electrical field.
1-1-5-3 Chemical methods
A number of chemical methods used to determine monosaccharides and oligosaccharides are based on the fact that many of these substances are reducing agents that can react with other components to yield precipitates or colored complexes which can be quantified. The concentration of carbohydrate can be determined gravimetrically, spectrophotometrically or by titration. Non-reducing carbohydrates can be determined using the same methods if they are first hydrolyzed to make them reducing. It is possible to determine the concentration of both non-reducing and reducing sugars by carrying out an analysis for reducing sugars before and after hydrolyzation. Many different chemical methods are available for quantifying carbohydrates. Most of these can be divided into three catagories: titration, gravimetric and colorimetric. An example of each of these different types is given below.
A) Titration Methods
The Lane-Eynon method is an example of a tritration method of determining the concentration of reducing sugars in a sample. A burette is used to add the carbohydrate solution being analyzed to a flask containing a known amount of boiling copper sulfate solution and a methylene blue indicator. The reducing sugars in the carbohydrate solution react with the copper sulfate present in the flask. Once all the copper sulfate in solution has reacted, any further addition of reducing sugars causes the indicator to change from blue to white. The volume of sugar solution required to reach the end point is recorded. The reaction is not stoichemetric, which means that it is necessary to prepare a calibration curve by carrying out

]17[
the experiment with a series of standard solutions of known carbohydrate concentration.
The disadvantages of this method are (i) the results depend on the precise reaction times, temperatures and reagent concentrations used and so these parameters must be carefully controlled; (ii) it cannot distinguish between different types of reducing sugar, and (iii) it cannot directly determine the concentration of non-reducing sugars, (iv) it is sucseptible to interference from other types of molecules that act as reducing agents. (McClements, D.J 2005).
B) Gravimetric Methods
The Munson and Walker method is an example of a gravimetric method of determining the concentration of reducing sugars in a sample. Carbohydrates are oxidized in the presence of heat and an excess of copper sulfate and alkaline tartrate under carefully controlled conditions which leads to the formation of a copper oxide precipitate:
reducing sugar + Cu2+ + base oxidized sugar + CuO (precipitate)
The amount of precipitate formed is directly related to the concentration of reducing sugars in the initial sample. The concentration of precipitate present can be determined gravimetrically (by filtration, drying and weighing), or titrimetrically (by redissolving the precipitate and titrating with a suitable indicator). This method suffers from the same disadvantages as the Lane-Eynon method, neverthless, it is more reproducible and accurate.
C) Colorimetric Methods
The Anthrone reagent method is an example of a colorimetric method of determining the concentration of the total sugars in a sample. Sugars react with the anthrone reagent under acidic conditions to yield a blue-green color. The sample is mixed with sulfuric acid and the anthrone reagent and then boiled until the reaction is completed. The solution is then allowed to cool and its absorbance is measured at 620 nm. There is a linear relationship between the absorbance and the amount of sugar that was present in the original sample. This method determines both reducing and non-reducing sugars because of the presence of the strongly oxidizing sulfuric acid. Like the other methods it is non-stoichemetric and therefore it is necessary to prepare a calibration curve using a series of standards of known carbohydrate concentration.

]18[
The Phenol-Sulfuric Acid method is an example of a colorimetric method that is widely used to determine the total concentration of carbohydrates present in foods. A clear aqueous solution of the carbohydrates to be analyzed is placed in a test-tube, and then phenol and sulfuric acid are added. The solution turns a yellow-orange color as a result of the interaction between the carbohydrates and the phenol. The absorbance at 420 nm is proportional to the carbohydrate concentration initially in the sample. The sulfuric acid causes all non-reducing sugars to be converted to reducing sugars, so that this method determines the total sugars present. This method is non-stoichemetric and so it is necessary to prepare a calibration curve using a series of standards of known carbohydrate concentration.
D) Enzymatic Methods
Analytical methods based on enzymes rely on their ability to catalyze specific reactions. These methods are rapid, highly specific and sensitive to low concentrations and are therefore ideal for determination of carbohydrates in foods. In addition, little sample preparation is usually required. Liquid foods can be tested directly, whereas solid foods have to be dissolved in water first. There are many enzyme assay kits which can be purchased commercially to carry out analysis for specific carbohydrates. Manufacturers of these kits provide detailed instructions on how to carry out the analysis. The two methods most commonly used to determine carbohydrate concentration are: (i) allowing the reaction to go to completion and measuring the concentration of the product, which is proportional to the concentration of the initial substrate; (ii). Measuring the initial rate of the enzyme catalyzed reaction because the rate is proportional to the substrate concentration.
The major problem with this method is that many other oligosaccharides are also converted to monosaccharides by glucosidase, and it is difficult to determine precisely which oligosaccharides are present. This method is therefore useful only when one knows the type of carbohydrates present, but not their relative concentrations. Various other enzymatic methods are available for determining the concentration of other monosaccharides and oligosaccharides, e.g., lactose, galactose and raffinose .

]19[
1-1-5-4 Physical Methods
Many different physical methods have been used to determine the carbohydrate concentration of foods. These methods rely on their being a change in some physicochemical characteristic of a food as its carbohydrate concentration varies. Commonly used methods include polarimetry, refractive index, IR, and density.
A) Polarimetry
Molecules that contain an asymmetric carbon atom have the ability to rotate plane polarized light. A polarimeter is a device that measures the angle that plane polarized light is rotated on passing through a solution. A polarimeter consists of a source of monochromatic light, a polarizer, a sample cell of known length, and an analyzer to measure the angle of rotation. The extent of polarization is related to the concentration of the optically active molecules in solution. The overall angle of rotation depends on the temperature and wavelength of light used and so these parameters are usually standardized to 20oC and 589.3 nm (the D-line for sodium). A calibration curve of angle versus concentration is prepared using a series of solutions with known concentration. The concentration of carbohydrate in an unknown sample is then determined by measuring its angle of rotation and comparing it with the calibration curve.
B) Refractive Index
The refractive index (n) of a material is the velocity of light in a vacuum divided by the velocity of light in the material (n = c/cm). The refractive index of a material can be determined by measuring the angle of refraction (r) and angle of incidence (i) at a boundary between it and another material of known refractive index (Snells Law: sin(i)/sin(r) = n2/n1). In practice, the refractive index of carbohydrate solutions is usually measured at a boundary with quartz. The refractive index of a carbohydrate solution increases with increasing concentration and so can be used to measure the amount of carbohydrate present. The RI is also temperature and wavelength dependent and so measurements are usually made at a specific temperature (20 oC) and wavelength (589.3nm). This method is quick and simple to carry out and can be performed with simple hand-held instruments. It is used routinely in industry to determine sugar concentrations of syrups, honey, molasses, tomato products and jams.

]20[
C) Density
The density of a material is its mass divided by its volume. The density of aqueous solutions increases as the carbohydrate concentration increases. Thus the carbohydrate concentration can be determined by measuring density, e.g., using density bottles or hydrometers. This technique is routinely used in industry for determination of carbohydrate concentrations of juices and beverages.
D) Infrared
A material absorbs infrared due to vibration or rotation of molecular groups. Carbohydrates contain molecular groups that absorb infrared radiation at wavelengths where none of the other major food constituents absorb consequently their concentration can be determined by measuring the infrared absorbance at these wavelengths. By carrying out measurements at a number of different specific wavelengths it is possible to simultaneously determine the concentration of carbohydrates, proteins, moisture and lipids. Measurements are normally carried out by measuring the intensity of an infrared wave reflected from the surface of a sample: the greater the absorbance, the lower the reflectance. Analytical instruments based on infrared absorbance are non-destructive and capable of rapid measurements and are therefore particularly suitable for on-line analysis or for use in a quality control laboratory where many samples are analyzed routinely.
More sophisticated instrumental methods are capable of providing information about the molecular structure of carbohydrates as well as their concentration, e.g., NMR or mass spectrometry.
E) Immunoassays
Immunoassays are finding increasing use in the food industry for the qualitative and quantitative analysis of food products. Immunoassays specific for low molecular weight carbohydrates are developed by attaching the carbohydrate of interest to a protein, and then injecting it into an animal. With time the animal develops antibodies specific for the carbohydrate molecule. These antibodies can then be extracted from the animal and used as part of a test kit for determining the concentration of the specific carbohydrate in foods. Immunoassays are extremely sensitive, specific, easy to use and rapid.

]21[
1-2 Literature review
From previous studies we found that, the concentration of sugars of which total sugar was 79.1, 7 3.06 and 73.6% in Acacia, Herbal and Berry varieties respectively whereas reducing sugar was determined as 75% in Acacia, 69% in Herbal and 68% in Berry varieties of honey. These results can be compared with the findings of Kamal et al(2002) who reported 77 and 71% total sugar in different varieties of honey. In addition, many other scientists such as Castilla (1996) and Joshi(1997) also reported closely related findings of total sugar ranging from 53.3 to 80.7% in different varieties of honey. The results of this study on reducing sugar are also in agreement with the findings of Latif et al.(1956) who reported 65 to76% in different varieties of honey. The results of reducing sugar are in agreement with those of Abu-Taoush et al.(1993) who reported 79.46% reducing sugar in a specific variety of honey. Likewise, non reducing sugar was determined to be 5.6% as maximum concentration in Berry, whereas it was 4.05% in Herbal variety and 4.1% in Acacia variety. The findings of this study are further authenticated by Codex Alimentarius Commission(1969) given the fact that the range of non reducing sugar in honey is 1.15to12%. Besides, these results are also in agreement with those of Kamal et al (2002) who indicated a range of 1.115 to 12.135%in honey varieties. (Mohammed et al 2013).
Sugar content assays were made by HPLC with a refractometer detector according to Bogdanov et al.(1997).The following sugars were assayed and compared: glucose, fructose, sucrose, maltose, isomal-tose, turanose and trehalose. Significant differences were found for the contents of individual sugars in the stores made from syrup vs. those in the honey. Routine HPLC assays of sugars can be helpful in the identification of products made by bees from maltose syrups. The main distinguisher for those products was fructose content (lower than that in honey by 32%), high maltose content (over 5%) and low fructose to glucose (F/G) ratio (0.76 when averaged across subgroups) whereas in honey samples it was 1.18 on average. The lowest values of that parameter were found for rape honey averaging 0.98 %.( Helena 2007).
The main carbohydrates of honey are fructose, glucose, sucrose and maltose. Invertase hydrolyzes sucrose, fructose and glucose. Therefore low content of sucrose and high content of glucose and fructose in honey are parameters for characterization of honey quality. Several sorts of

]22[
honey contain heightened content of maltose. Therefore it is possible to use this criteria for identification several honey sorts. Each carbohydrate has a specific angle of rotation of polarized light (specific rotation). It depends on relations and content of carbohydrates in honey. The aim of the present research was to establish the relationship between honey sorts and content of carbohydrates as well as specific rotation and possibilities of using these criteria (content of carbohydrates, specific rotation, and activity of invertase) for characterization of honey quality. Following parameters were determined with different physico – chemical methods: specific rotation – by method of polarimetry, content of sugars with high pressure liquid chromatography and activity of invertase – spectrophotometrically. The following results of honey analysis were obtained: the activity of invertase 4–30 (invertase number); content of carbohydrates (sucrose 0.53.0%, glucose 30–38%, fructose 35–42%, and maltose 1–6%); specific rotation 20][Dα at -16° to -5° . The obtained results indicated that content of carbohydrates partially dependent on honey sorts. Content of sucrose depends on invertase activity in honey. Invertase is good parameter for honey characterization. Specific angle of rotation of polarized light is not available for identification of honey sorts. (Fredijs, 2008).
1-3 Medicinal and importance of honey
In all of ancient history, honey has been a constant part of medicine. Honey has very high levels of antioxidants, comparable to the levels in spinach, apples and strawberries. Antioxidants are very important to our health because they rid our system of damaging free radicals that cause cell damage. There are so many more uses for honey other than in your tea or cereal. Below are just some of the most commonly used medicinal remedies that are made from honey.
Honey has great antibacterial factors. It is not known exactly why honey is antibacterial, but studies have proven over and over again that honey is a great substance to use on wounds. Since honey is such a thick fluid, it breaks down the bacteria over time and does not allow it to grow again. Honey has been proven to be more effective in preventing infection in wounds than hydrogen peroxide.
Honey can also be very soothing to a sore throat. Next time you are suffering from a sore throat, add some honey to your tea. You can also make a gargle from honey. Combine two tablespoons of honey with 4 tablespoons of cider vinegar and add a pinch of salt and gargle this mixture throughout the day to soothe your sore throat.

]23[
If you are feeling down from the cold or flu, try mixing this drink containing honey. Take 8 ounces of hot water; add 2 ounces of lemon juice and one tablespoon of honey. If you have eucalyptus oil or ginger root, add it for added benefits. This drink will help your congestion.
Honey is also very healthy for your skin. A mixture of honey and ground almonds will serve as an excellent scrub for your face. For a great moisturizing rinse, mix 2 tablespoons of honey with 2 teaspoons of whole milk. Apply this mix to your face and neck and allow it to settle for 15 minutes. Rinse off 15 minutes later and feel your skin; it will be soft and supple and full of moisture.
If your hair is lacking shine, try honey, mix one teaspoon of honey with four cups of hot water. Lather throughout your hair and then rinse! Your hair should be full of shine and feel much more moisturized.
Honey can even be used as a mouth rinse. Its antiseptic properties will clean your mouth all while tasting great! Mix one tablespoon of honey with one cup of warm water and rinse throughout your mouth.
If you are diabetic, honey may be a great choice for a sweetener for you. The high level of fructose in honey is absorbed more slowly by your digestive tract than glucose. There is generally not the same sugar rush into your blood stream from honey as there is in standard table sugar. Consult your doctor first on this one, but honey may be a great option for sweetening your food if you are diabetic.
One last use for honey is to control stomach discomfort. Patients with infections, ulcers or inflammation of the gastric system have shown much improvement when they consumed honey. Honey can help fight bacteria that are present in your intestines and also help to heal any ulcers or abscesses. Honey is also proven to help control diarrhea.
All of these uses for honey are only some of the many benefits honey has on your health. Try to consume a tablespoon of honey daily to benefit your body. The vitamins and minerals contained in honey are a boost to your entire body systems (Jolin 2007).

]24[
OBJECTIVE
The objective of this work is to evaluate the quality of three Sudanese honey samples based on the glucose, fructose sucrose and maltose content.

]25[
CHAPTER TWO
MATERIALS AND METHODS
2-1 Sampling
Three different honey samples were purchased from the supermarket in South Sudan, AlFashir and AlGadarif and examined, They were collected during the period 1/5/2013-1/6/2013.
The honey was rinsed in plastic container and homogenized using glass rod, then transferred to glass containers and stored at ambient temperature.
2-2 Instruments Analytical balance.
High pressure liquid chromatograph.
Heater.
Thermometer.
pH meter (JENWAY 3510 pH meter).
Drying oven.
Watch glass.
2-3 Chemicals Methanol.
Acetonitrile.
Distilled water.
Standards fructose, glucose, sucrose and maltose.
Fehling's solutions A &B.
Aqueous methylene blue indicator 0.2%. Hydrochloric acid (5.6 N)
]26[
Sodium hydroxide (40%).
Iodine 0.1 N.
Sodium thiosulphate 0.1N .
Starch indicator.
2-4 Methods:-
2-4-1 Physical Properties
2-4-1-1 Refractive index
Refractometer was first calibrated with distilled water, the sample was placed on the prism and the control knob was turned to center shadow-line in the crosshair and the reading was taken
2-4-2 Chemical Properties
2-4-2-1 pH
pH meter was calibrated with puffer solution pH=4 and pH=7 then the pH of sample was measured.
2-4-2-2 Water content
About 5 gram of the sample was weighed accurately in watch glass and dried in drying oven at 105oC till constant weight. Water content of honey was calculated from the equation:
Water Percent = Wf-Wd/Wf*100
Wf: weight of sample
Wd: Weight of dried sample
2-4-3 HPLC Method
Sample prepeation:
2.5 g of honey was weighed into a beaker and dissolved in 20 ml water, 12.5 ml of methanol was pipetted into a 50 volumetric flask and the honey solution was transferred quantitatively to the flask and filled to the

]27[
mark with water.The sample was poured through a membrane filter and was collected in a sample vials and stored as for the standard solution.
Standards preparation:
25ml of methanol was pipette into a 100 ml calibrated flask the amounts detailed below were dissolved in approximately 40 ml water and transferred quantitatively to the flask and was filled to the mark with water
Fructose:2.000g,glucose:1.500g, sucrose:0.250g and maltose0.150g.
Anaytical stainless-steel column,4.6 mm diameter,250 mm length, containing amine-modified silica gel with 5-7mm particle size. Before use,carry out asystem suitability test to ensure all the sugars can be separated.
If a column of the type described above is used the following conditions have been found to give satisfactory separation:
Flow rate: 1.3ml/min
Mobile phase:Acetonitrile :water(80:20, v/v).
Column and detector temperature: 30o C.
The mass percentage of the sugars W,to be determined of fructose, glucose, sucrose and maltose in g\100 is calculated according to the following formula:
W= 100
022111 X
XMXVAXMXVA
Where
A1=Peak areas or peak height of the given sugar compound in the sample solution, expressed as units of areas, length or integration.
A2=Peak height of the given sugar compound in the standard solution, expressed as units of area, length or integration.
V1=Total volume of the sample solution in cm3

]28[
V2=Total volume of the standard solution in cm3
M1=Mass amount of the sugar in grams in the total volume of the standard (V2)
M0=Sample weight in gram
The pervious values were taken from the chromatograms in the appendix (I. II. III).
2-4-4 Lane –Eynon titrimetric method:-
2-4-4-1 Determination of reducing sugar:-
The method used was based on reduction of soxhlet's modification of Fehling's solution by titration at boiling point against solution of reducing sugar in honey.
2 g of the honey sample were accurately weighed and dissolved in distilled water and diluted to 250 ml in calibrated flask (honey solution).
12.5 ml of the soxhlet's modified Fehling solution A were pipette into a 250 ml Erlenmeyer flask and approximately12. 5 ml modified Fehling solution B were added and followed by 15 ml diluated honey solution from the burette.
The cold mixture was heated to boiling over wire gauze and maintained moderate temperature for 2 minutes.
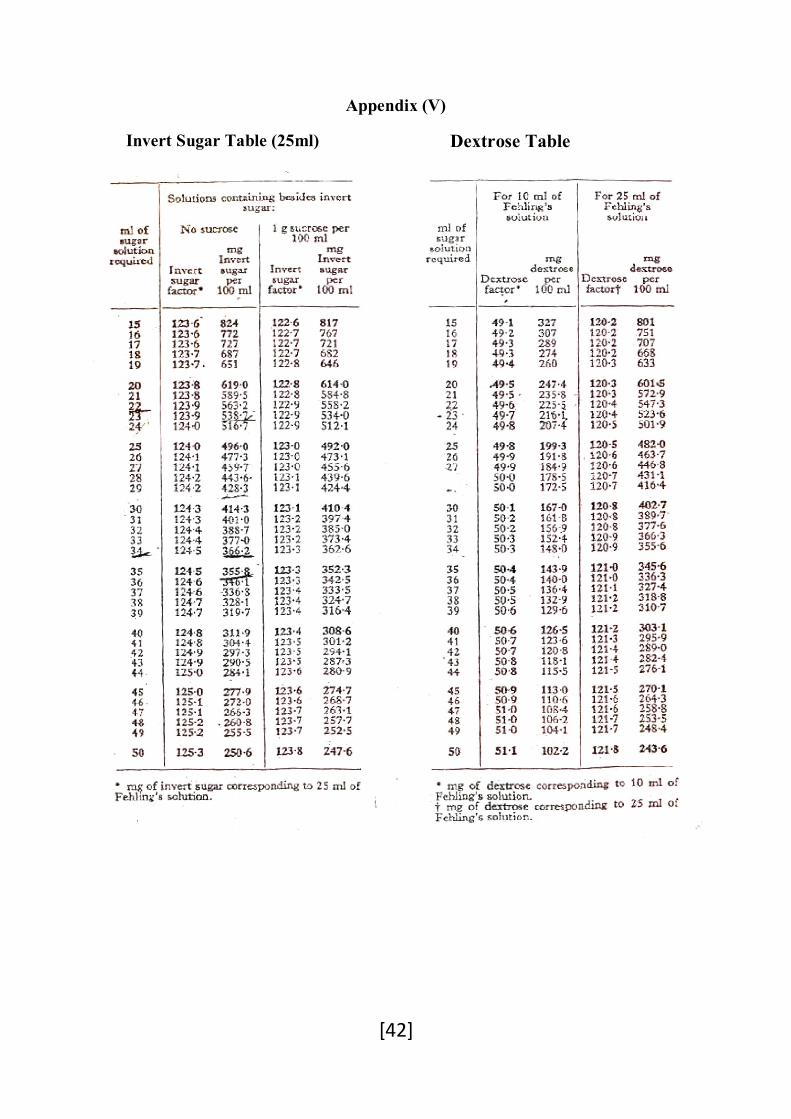
Then 1 ml of 0.2 % aqueous methylene blue was added whilst still boiling and titration was completed within a total boiling time of 3 minutes by repeated additions of diluted honey solution until the indicator was decolorize. The total volume of dilute honey solution was recorded (X ml) .The percentage was calculated from table (25ml) of Fehling solution which expressed in appendix(v).
Percentage = V/100, V = Value in table 25.
V 100 ـــــــــــــــ ml
X ـــــــــــــــ 250 ml
Percentage = X/2*100
]29[
2-4-4-2 Determination of sucrose:-
Sucrose was determined by Fehling's titration before and after inversion. Sucrose was calculated by difference.
50 ml from honey solution were taken, 5ml of 5.6 HCl was added, heated to 70o C over boiling water bath for 30 minutes.
Then neutralized with 5 M NaOH using litmus paper as indicator and the volume was adjusted to 100 ml (inversion method). Burette was filled with honey solution 12.5ml modified Fehling solution A was added, 12.5ml modified Fehling B was added and followed by 15ml of honey solution then 1 ml of aqueous methylene blue was added whilst still boiling and titration was completed within a total boiling time of 3 minutes by repeated addition of diluted honey solution until the indicator was decolorized the volume of dilute honey solution was recorded.
The percentage was calculated from table (25ml) of Fehling which expressed in appendix (v) .
Sucrose % = invert sugar – reducing sugar
2-4-5 Determination of glucose by iodometric titration:-
2 g of honey was diluted into 250 ml water and total reducing sugar was estimated by one of the standard procedure.
To determined dextrose ,25 ml of the honey solution was added by pipette a volume of 0.1 N iodine at least twice that required for the reaction followed by 100 ml of sodium bicarbonate / carbonate solution was left in the dark for 2 hours and was acidified with 12 ml of 25 % sulphuric acid and was titrated with 0.1 thiosulphate solution. Blank was carried out at the same time. The difference between the two titrations represent the dextrose.
Calculation:
1 ml 0.1 N iodine = 0.009005 g dextrose
Percent = X*0.009005*10/W*100
W=weight of sample

]30[
CHAPTER THREE
RESULTS AND DISCUSSION 3-1 Physical test:- 3-1-1 Refractive index:- Refractive indexes of South Sudan,Alfashir and AlGadarif sample were 1.490,1.490 and 1.489 respectively.
3-2 Chemical tests:-
3-2-1 pH:- The pH values of South Sudan,AlFashir and AlGadarif samples were 4.34,4.26 and 4.37 respectively.
The pH of honey is generally low due to presence of organic acids. The measured pH values were slight differente due to their different botanical origin and metal content.
3-2-2 Water content (%):-
The water contents of south Sudan,AlFashir and AlGadarif were 18.0,18.1 and 15.4.
The water content is an important factor that influencing quality and storage of honey .It is widely affected by the season and climate.
3.3 Results of Determination of sugars:-
3-3-1 Results of HPLC Method:-
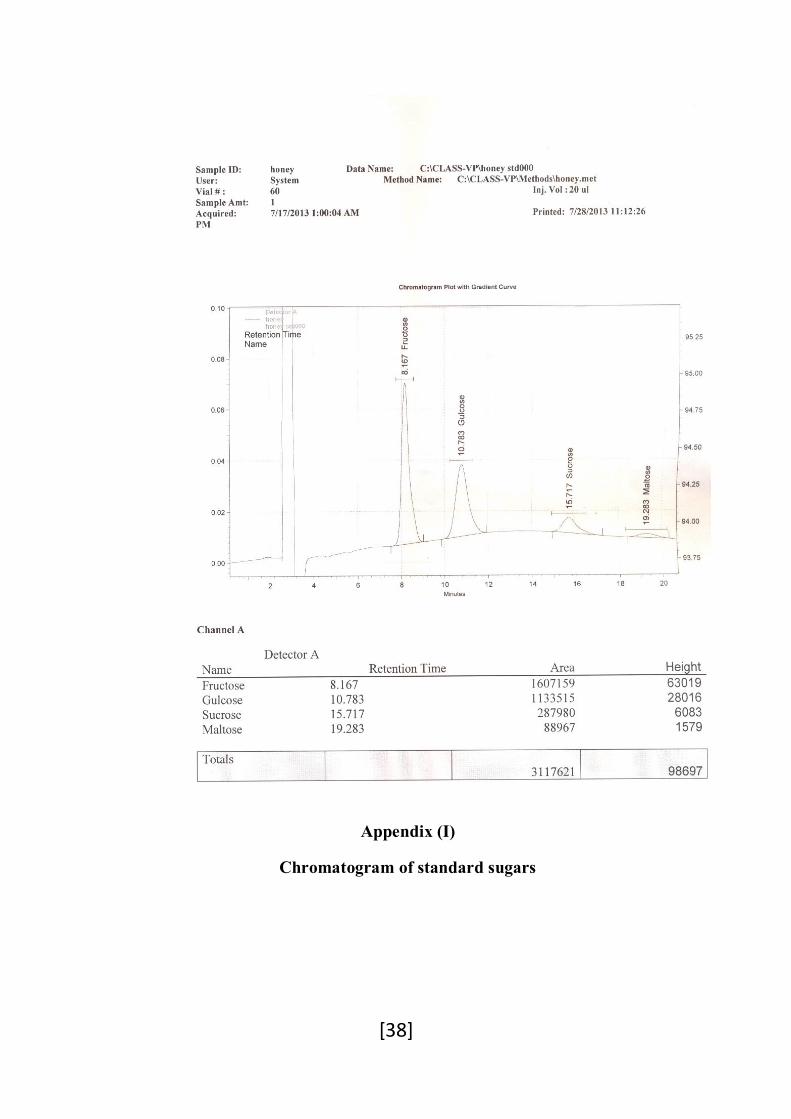
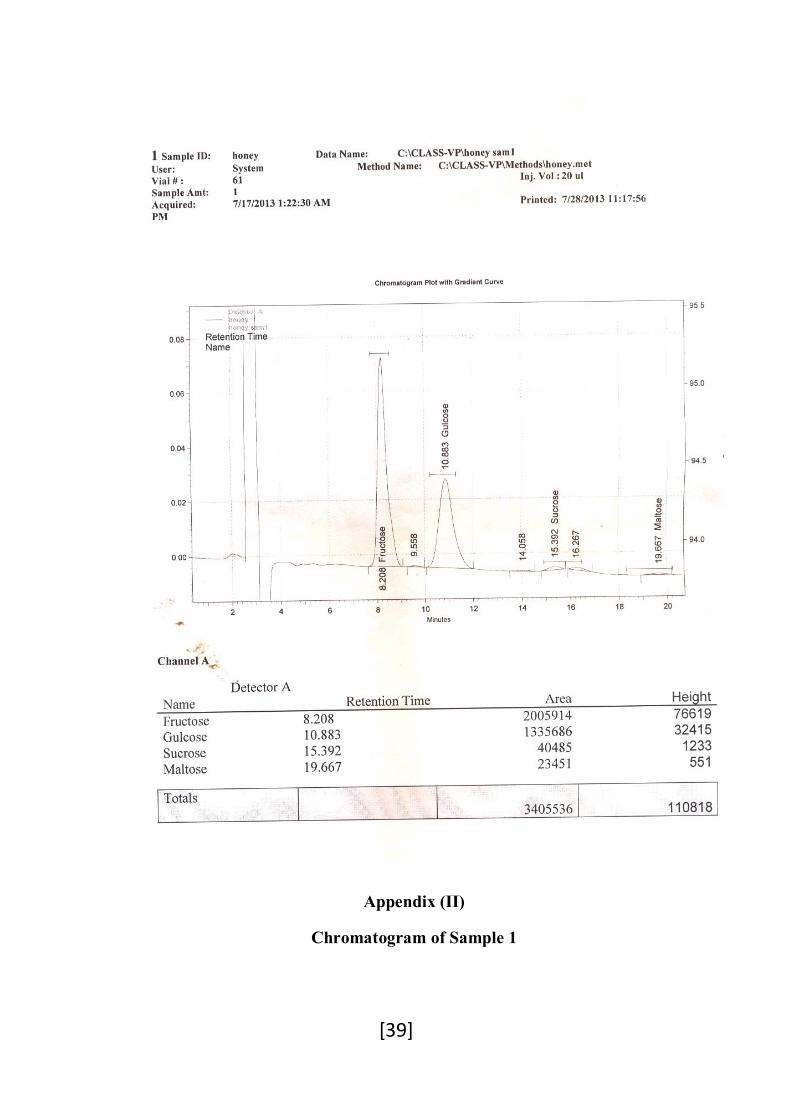
HPLC column was used to obtain separation of fructose, glucose, sucrose and maltose. The optimum mobile phase was found to be an acetonitrile: water mix in the ratio of 80-20.%. From the initial analyses performed on the honey, glucose and fructose became the primary sugars of interest since the concentration of sucrose in honey was found to be low and gave inconsistent results.

]31[
Table 3-1
Glucose, fructose, sucrose and maltose percentage
Maltose% Sucrose% Fructose% Glucose% Sample No
1.249 0.423 38.41 31.98 South Sudan
1
0.790 0.702 37.41 35.32 AlFashir 2
- 15.71 33.40 35.80 AlGdarif 3
3-3-2 Results Of Lane-Eynon Titrimetric Method:-
This method was used to determine the total reducing sugar content of the honey sample.
Table 3-2
Reducing sugar and sucrose percentage
Sucrose (%) Invert Sugar (%) Reducing Sugar (%) Sample No.
2.35 76.02 73.68 S.Sudan 1
3.9 74.3 70.4 AlFashir 2
11.36 71.02 59.66 AlGadarif 3

]32[
3-3-3 Results of iodometric titration :-
This method was used to determine glucose percent in honey samples.
Table 3-3
Glucose percent
No. Sample V V blank X=V-V blank Glucose Percent 1 S.Sudan 28.8 37.2 8.4 36.2 2 Alfashir 29.3 37.2 7.9 33.9 3 Algadarif 28.3 37.2 8.9 40.0
The fructose percent was estimated from classical methods as follows:
Fructose%=Reducing sugars (from lane-Eynon methods)-Glucose (by iodometric)
Table 3-4
F/G ratio
Sample Reducing sugar Glucose Fructose F\G ratio S.Sudan 73.68 36.2 37.48 1.03 Alfashir 70.4 33.9 36.5 1.07 Algdarif 59.66 40.0 19.66 0.49
Auerbach and Bod lander (Londs, 1924.43,389) have stated that the essential difference between genuine and artificial honey lies in the ratio of fructose to dextrose present
F/G ratio
Genuine honey 106-199:100
Artificial honey less than 90:100
(Pearson ,D .1970).

]33[
From above we note that the South Sudan and AlFashir samples were genuine honey, but AlGdarif samples was artificial honey.
Sucrose
Sucrose is the most important disaccharide present in honey .Its determination was considered important quality criterion.
The sucrose content of the sapmle No . (3) from AlGadarif in Table (3-1) was very high (15.7%).This could be due to mixing the honey with sucrose or molasses sucrose.
White and Landis (1980) determined the sucrose content of 439 honey samples using polarimetric method.The mean value they obtained was 1.3% .This result agrees with Lane-Eynon result in this study but there is a wide variation in HPLC results. This might be due to the precision of the HPLC method of analysis.
White (1975) reported that the determination of sucrose by the inversion method provides higher value due to presence of non-reducing oligosaccharides.
Reducing sugar
Reducing sugar calculated as percent invert sugar, are shown in Table (3-2)
Average reducing sugar by Lane-Eynon methods is 67.91%, by HPLC is 70.08.
The values obtained for the honey by the Lane-Eynon titration method were compared with those obtained by HPLC .The reducing sugar content of the sample for the HPLC was determined by adding the glucose values obtained by HPLC analysis.

]34[
Table 3-5
Total reducing sugars content (as % of honey sample)
Lane-Eynon Method HPLC Method Sample
73.68 69.31 South Sudan
70.40 72.73 Al Fashir
59.66 68.21 Al Gadarif
The difference in values could be due to handling error in sample preparation as well as precision of methods .Another possibility is that other reducing sugars might be present in these samples as they were evident in the titration results.
]35[
Chapter four
Recommendation
According to my finding in this research, the quality of honey can be detected from the percentage of sugars, however I recommend using (sucrose% or fructose/glucose ratio) to distinguish the genuine honey from artificial honey.Also I recommend to determine a non conventional sugars by HPLC which I appreciated the lack of standards of them.

]36[
References
Abu-Tarboush HM, Al-Kahtani HA, El-Sarrage MS (1993). Floral type identification and quality evaluation of some honey
Bogdanov S, 1999, honey quality , methods of analysis and international honey commission, 108-125.
Campbell, M. K., Farrell, S. O. (2012). Biochemistry. USA: Mary Finch
Carlotte Lietaer,( 2011), moisture content of honey, Food and agriculture organization of United Nation.
Codex Alimentarius Commission (2001). Recommended European regional standard for honey (CAC/RS 12-1969). David Pearson, Henry Edward cox, (1970),the chemical analysis of food. Emil I Mondoa,M.D,2012, What are saccharide and Why are They important,The New Healing Science of Glyconutrient.
Fredijs Dimins, Peteris Kuka, Ilze Cakste (2008), content of carbohydrates and specific Rrotation angle of honey.
Helena Rybak-Chmielewska (2007), high performance liquid chromatography (HPLC) study of sugars composition of some kinds of natural honey and winter stores processed by bees from starch syrup, Journal of Apicultural Science . 51, 23-37.
Jeffry AE, Carles M, 1996, medical uses of honey, Rev Biomed,7,43-49.
Jolin K (2007), Way to use honey as a Medicin, Honey is great source of healing
Joshi VK (1997). Fruit Wine, Nauni, Solan (HP). Directorate of Extension Education, Uni. of Hortic. and Forestry, Ch. 2.
Kamal A, Raza S, Rashid N, Hameed T, Gillani M, Qureshi AM, Nasim K (2002). Comparative study of honey collected from different flora of Pakistan. Online J. Bio. Sci.2(9): 626- 627.

]37[
Latif A, Qayyum HA, Haq M(1956). Research on the composition of native honey. Pak. J. Sci. Res.,8:163-165 McClements ,D.J (2005). Food Emulsions: Principles, Practice and Techniques. 2nd Edition, CRC Press. Boca Raton, FL
Molan PC. The antibacterial nature of honey. The nature of the antibacterial activity. Bee World 1992; 73: 5-28.
Saif –Ur-rahman ,Farouq Z,Tahir M, 2008,physical and spectroscopic characterization of Pakistan honey,Cien.Inv.Agr.,35(2), 199-204. White J W,Landis WD, 1980,honey composition and properties, beekeeping in the US agriculture handbook, 335,Washington, DC:US, department of agriculture technical bulletin.
White M, 1975, crane 1980, value added productsform bee keeping, FAO corporate document repository ,agriculture and consumer protection.
Wilkinson JM, Cavanagh HM. Antibacterial activity of 13 honeys against Escherichia coli and Pseudomonas aeruginosa. J Med Food 2005, 8: 100-103.
]38[
Appendix (I)
Chromatogram of standard sugars
]39[
Appendix (II)
Chromatogram of Sample 1

]40[
Appendix (III)
Chromatogram of Sample 2

]41[
Appendix (IV)
Chromatogram of Sample 3
]42[
Appendix (V)
Invert Sugar Table (25ml) Dextrose Table