ْنِم َناَسنِلإا َقَلَخ ٍقَلَع - SUST Repository
107
- i - ن الرحيم الر بسم اكم تنزيله تعا يقول ا: ﴿ إ ق ل ي خ ذ ال ك ب ر م اس ب أ ر ق( 1 ) ن م ان نس ا ق ل خ ق ل ع( 2 ) ْ أَ رْ اق ك ب ر و م ر ك ا( 3 ) يِ ذ ال م ل ق ال ب م ل ع( 4 ) م ل ع ي م ا ل م ان نس ا م ل ع( 5 ) ﴾ العظيـم دق ا صـعلق سـ ورة ال( 1 - 5 )
-
Upload
khangminh22 -
Category
Documents
-
view
0 -
download
0
Transcript of ْنِم َناَسنِلإا َقَلَخ ٍقَلَع - SUST Repository

- i -
بسم اهلل الرمحن الرحيم
(2)علق خلق اإلنسان من (1) ق رأ باسم ربك الذي خلق إ﴿: يقول اهلل تعاىل يف حمكم تنزيله
﴾ (5)علم اإلنسان ما لم ي علم (4) علم بالقلم الذي (3)األكرم وربك اقرأ
صـــــــــدق اهلل العظيــم
(5-1) ســـــورة العلق

- ii -
To our fathers and mothers who taught us great lessons about life, guiding,
motivate and support us along life’s level, reached us for this educational level
without them I would not become the person who I am today.
To our brothers and sisters who stand with us, allow us to use their purpose
when we need it to complete this research.
For future generations that hold future of the oil industry in Sudan.
We are honor to offer this modest work and we hope that helping to guide and
understand some principle of an oil industry process.
Thanks all for giving us a chance to prove and improve our self through all
levels of university life.

- iii -
Undertaking a project of this size requires the support, direction and advice. We are deeply
indebted to our supervisor Assistante. Proff. Eng. Satti Marghani Mohammed Ahmed
For his technical directions, Motivation and moral support throughout this research.
Our profound gratitude goes to engineer Khalid Abdelbaset for taking time out of his busy
schedule to guide us through this project.
We also wish to express our sincere appreciation for Abubaker Omer Mohammed Hussein,
for his efforts and time, that he sacrificed it for us to complete this research.
We also wish to express our appreciation and sincere thanks to Department of Petroleum
Engineering and Technology for information, advices and guidance that had given to us
throughout five years. Finally, we would like to extend our gratitude to people who worked
with us.

- iv -
In this research an EOR screening software has been designed by using visual basic
studio based on recent EOR projects and the advanced technologies and used it with SPE
format and EORgui software to apply screening criteria for Greater Neem field which is
partially depleted. It’s current condition requires implementing EOR techniques in order to
maximize oil recovery and field life as much as possible. After that, the results have been
obtained and compared between the three applications. It has been concluded that carbon
dioxide injection and polymer flooding are the most viable options for Greater Neem field.
Key words:
Enhanced Oil Recovery, Screening Criteria, EORgui ,SPE Format.

- v -
يستخدم معايير تحليلية محدثة (Visual Basicباستخدام لغة )تطوير برنامج في هذا البحث تم
نامج ، وبرالي صيغ جمعية مهندسي النفط فةالبرنامج، باإلضاهذا ستخدمأ. ولطرق االستخالص المحسن
EORgui)) ( إلختيار الطريقة األمثل لحقلGreater Neem) الذي استنزف جزئيا والظروف الحالية
نتائج مقارنة ال استخالصه. تمتلتطبيق إحدى طرق اإلستخالص المحسن لزيادة للدراسة،للحقل تحتاج
أن طريقة ث البح أظهرت نتائج .فيها البرنامج الذي تم تطويره بماالثالثة الطرق تحصل عليها باستخدامالم
البوليمير هما األمثل لهذا الحقل.حقن ثاني أكسيد الكربون وطريقة
كلمات داللية:
(EORguiاالستخالص المحسن للنفط ،المعيار التحليلي ،صيغ جمعية مهندسي النفط ،برنامج)

- vi -
Contents
Chapter 1: Introduction
1.1. EOR background........................................................................................................ 1
1.2. Problem statement...................................................................................................... 2
1.4. Objectives .................................................................................................................. 2
1.5. Methodology .............................................................................................................. 2
1.6. Greater Neem Overview: ........................................................................................... 3
Chapter 2: Literature Review and Theoretical background
2.1. Literature Review ...................................................................................................... 6
2.2. History of Oil in Sudan .............................................................................................. 7
2.3. Fluid and rock properties ......................................................................................... 11
2.3.1. Saturation .......................................................................................................... 11
2.3.2. Mobility Ratio ................................................................................................... 12
2.3.3. Capillary Pressure ............................................................................................. 12
2.3.4. Wettability ........................................................................................................ 12
2.3.5. Capillary number .............................................................................................. 13
2.3.6. Volumetric Sweep efficiency............................................................................ 14
2.3.7. Relative Permeability ........................................................................................ 14
2.3.8. Surface/Interfacial Tension ............................................................................... 15
2.4. Enhanced Oil Recovery ........................................................................................... 17
2.5. Processes of EOR methods ...................................................................................... 18
2.5.1. Miscible Methods ............................................................................................. 18
2.5.1.1. CO2 Flooding ............................................................................................. 19
2.5.1.2. Nitrogen and flue gas Injection .................................................................. 20
2.5.1.3. Hydrocarbon Injection ............................................................................... 21
2.5.1.4. Hydrogen Injection .................................................................................... 21
2.5.1.5. Problems in Applying Miscible Methods .................................................. 21
2.5.2. Chemical Flooding ............................................................................................ 21
2.5.2.1. Polymer flooding: ...................................................................................... 21
2.5.2.2. Surfactant flooding: ................................................................................... 22
2.5.2.3. Alkaline Flooding ...................................................................................... 24

- vii -
2.5.3. Microbial Enhanced Oil Recovery (MEOR) .................................................... 27
2.5.4. Thermal methods .............................................................................................. 28
2.5.4.1. Steam injection .......................................................................................... 29
2.5.4.2. Cyclic Steam Stimulation .......................................................................... 30
2.5.4.3. In-Situ Combustion .................................................................................... 32
2.5.4.4. Problems in Applying Thermal Processes: ................................................ 34
2.6. Screening Concept ................................................................................................... 35
2.7. Glance about economic view ................................................................................... 40
Chapter 3: Methodology
3.1. Screening using SPE format: ................................................................................... 41
3.1.1. Permeability plot ............................................................................................... 41
3.1.2. Viscosity plot: ................................................................................................... 42
3.1.3. Depth plot: ........................................................................................................ 42
3.1.4. Reservoir Pressure vs. Oil Viscosity: ............................................................... 43
3.1.5. Reservoir Depth vs. Viscosity: ......................................................................... 43
3.1.6. Oil gravity: ........................................................................................................ 44
3.2. Screening using EORgui:......................................................................................... 44
3.2.1 EORgui Description:.......................................................................................... 44
3.2.2. Applications of EORgui: .................................................................................. 44
3.2.3. EORgui sections: .............................................................................................. 45
3.2.4. EOR Method Quick Screening (figure 3.8): ..................................................... 45
3.3. Screening using EOR analysis: ................................................................................ 46
3.3.2. Applications of the program: ............................................................................ 48
3.3.3. Sections of the program: ................................................................................... 49
3.3.3.1. Screening Result: ....................................................................................... 49
3.3.3.2 Screening result details: .............................................................................. 49
3.3.3.3. Methods Percentage ................................................................................... 50
Chapter 4: Results and Discussion
4.1. Neem Main .............................................................................................................. 54
4.1.1. Neem Main-AG ................................................................................................ 54
4.1.2. Neem Main-Aradeiba ....................................................................................... 57

- viii -
4.1.3. Neem Main-Bantiu ........................................................................................... 60
4.2. Neem East ................................................................................................................ 63
4.2.1. Neem East-AG .................................................................................................. 63
4.2.2. Neem East Arardeiba ........................................................................................ 66
4.2.3. Neem East- Bantiu ............................................................................................ 69
4.3. NEEM K .................................................................................................................. 72
4.3.1. NEEM K- AG ................................................................................................... 72
4.3.2. Neem K-Amal ................................................................................................... 75
4.4. Neem F:.................................................................................................................... 78
4.4.1. Neem F-AG: ..................................................................................................... 78
4.5. Neem North: ............................................................................................................ 81
4.5.1. Neem North -AG .............................................................................................. 81
4.5.2. Neem North Bentui ........................................................................................... 84
Discussion: ...................................................................................................................... 89
Chapter 5: Conclusion and Recommendations
5.1. Conclusion: .............................................................................................................. 90
5.2. Recommendations:................................................................................................... 91
References:...................................................................................................................... 92

- ix -
List of figures:
Fig. 1.1: Location Map of Block4 (OEPA, 2014)...................................................................... 4
Fig.1.2: Location Map of Greater Neem Oil field (OEPA, 2014) ............................................. 4
Fig.1.3: Production Status as of 31st May 2014(OEPA,2014) ................................................... 5
Fig. 2.1: Production Forecast for Sudan & South Sudan (Sudapet, 2009) ................................ 9
Fig. 2.2: Average RF for Sudan & South (Sudapet, 2009) ........................................................ 9
Fig. 2.3: Recovery Stages of a Hydrocarbon Reservoir Through Time (Sultan Pwage et al,
2010) ................................................................................................................................ 10
Fig. 2.4: Illustration of Wettability (Tarek Ahmed, 2010) ...................................................... 13
Fig. 2.5 :Pressure Relation in Capillary Tube (Tarek Ahmed, 2010) ...................................... 16
Fig. 2.6: CO2 Flooding (Barrufet, M.A, 2001) ........................................................................ 19
Fig. 2.7: N2 Injection (Barrufet, M.A, 2001) ........................................................................... 20
Fig. 2.8: Polymer Process(Barrufet, M.A, 2001) ..................................................................... 22
Fig. 2.9: Surfactant Flooding Mechanism (Barrufet, M.A, 2001) ........................................... 23
Fig. 2.10: Surfactant Flooding Fingering (Akzonobe, 2006). ................................................. 24
Fig. 2.11: Schematic of Alkaline Flood Injection (Teknica,2001) ......................................... 25
Fig. 2.12: IFT of Murphy-Whittier Second and Third Zones Crude (Graue and Johnson,
1974) ................................................................................................................................ 26
Fig. 2.13: Typical Viscosity–Temperature Relationships for Several Crude Oils (Ronald E,
2001) ................................................................................................................................ 29
Fig. 2.14: Steam Injection Process (Sultan Pwaga, et al.,2010 ) ............................................. 30
Fig. 2.15: CSS Process (Sultan Pwaga, et al., 2010). .............................................................. 31
Fig. 2.16: CSS Stages (Sultan Pwaga, et al., 2010) ................................................................. 31
Fig. 2.17: In situ Combustion Process (Sultan Pwaga, et al.,2010) ......................................... 33
Fig. 2.18: Simplified Combustion Process (Sultan Pwaga, et al., 2010) ................................. 33
Fig. 2.19: The Cost of the Different Techniques Used in Enhanced Oil Recovery (OPEC,
2009) ................................................................................................................................ 40
Fig 3.1: Permeability Screening for EOR Methods (David, 2009).......................................... 41
Fig. 3.2: Viscosity Screening for EOR Methods (David, 2009) .............................................. 42
Fig. 3.3: Depth Screening for EOR Methods (David, 2009) ................................................... 42
Fig. 3.4: Pressure & Viscosity Screening for EOR Methods (David, 2009) ........................... 43
Fig. 3.5: Reservoir Depth & Viscosity Screening for EOR Methods (David, 2009) .............. 43
Fig. 3.6: Oil Gravity Range for EOR Methods (Taber et al, 1997) ......................................... 44
- x -
Fig. 3.7: EORgui Enhanced Oil Recovery Software (Petroleum Solutions, 2010) ................. 45
Fig. 3.8: EOR Method Quick Screening (Petroleum Solutions, 2010) .................................... 46
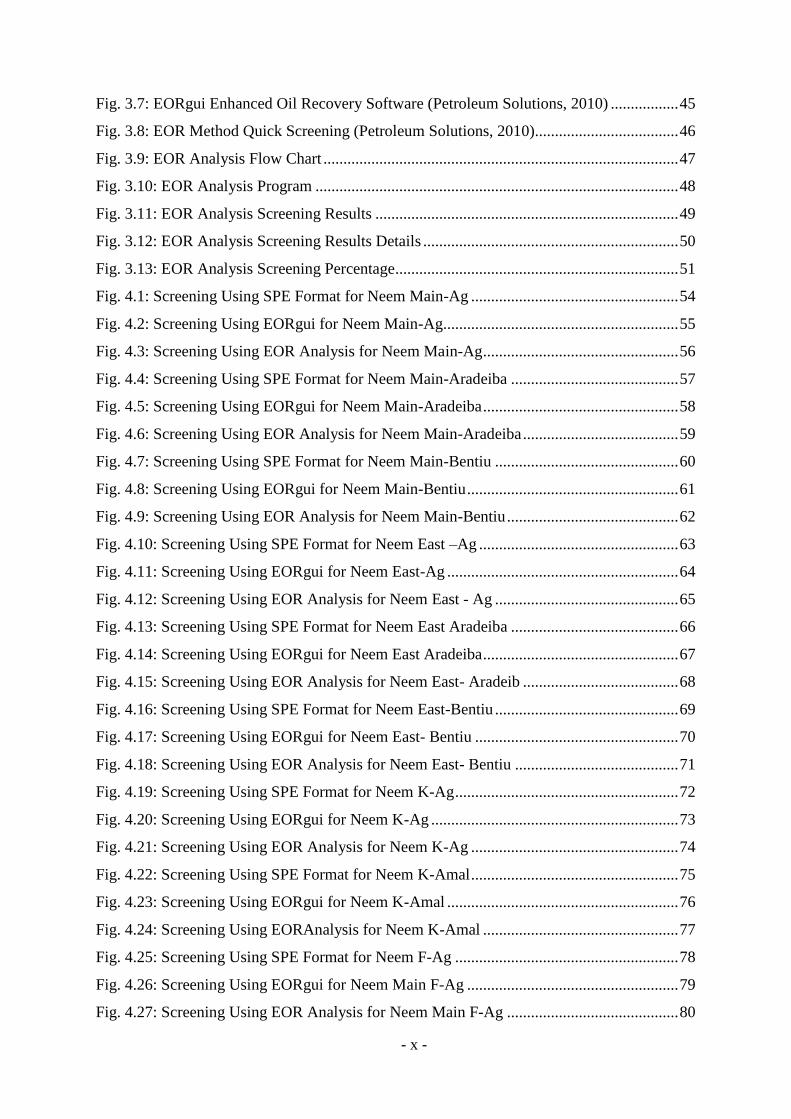
Fig. 3.9: EOR Analysis Flow Chart ......................................................................................... 47
Fig. 3.10: EOR Analysis Program ........................................................................................... 48
Fig. 3.11: EOR Analysis Screening Results ............................................................................ 49
Fig. 3.12: EOR Analysis Screening Results Details ................................................................ 50
Fig. 3.13: EOR Analysis Screening Percentage....................................................................... 51
Fig. 4.1: Screening Using SPE Format for Neem Main-Ag .................................................... 54
Fig. 4.2: Screening Using EORgui for Neem Main-Ag........................................................... 55
Fig. 4.3: Screening Using EOR Analysis for Neem Main-Ag ................................................. 56
Fig. 4.4: Screening Using SPE Format for Neem Main-Aradeiba .......................................... 57
Fig. 4.5: Screening Using EORgui for Neem Main-Aradeiba ................................................. 58
Fig. 4.6: Screening Using EOR Analysis for Neem Main-Aradeiba ....................................... 59
Fig. 4.7: Screening Using SPE Format for Neem Main-Bentiu .............................................. 60
Fig. 4.8: Screening Using EORgui for Neem Main-Bentiu ..................................................... 61
Fig. 4.9: Screening Using EOR Analysis for Neem Main-Bentiu ........................................... 62
Fig. 4.10: Screening Using SPE Format for Neem East –Ag .................................................. 63
Fig. 4.11: Screening Using EORgui for Neem East-Ag .......................................................... 64
Fig. 4.12: Screening Using EOR Analysis for Neem East - Ag .............................................. 65
Fig. 4.13: Screening Using SPE Format for Neem East Aradeiba .......................................... 66
Fig. 4.14: Screening Using EORgui for Neem East Aradeiba ................................................. 67
Fig. 4.15: Screening Using EOR Analysis for Neem East- Aradeib ....................................... 68
Fig. 4.16: Screening Using SPE Format for Neem East-Bentiu .............................................. 69
Fig. 4.17: Screening Using EORgui for Neem East- Bentiu ................................................... 70
Fig. 4.18: Screening Using EOR Analysis for Neem East- Bentiu ......................................... 71
Fig. 4.19: Screening Using SPE Format for Neem K-Ag ........................................................ 72
Fig. 4.20: Screening Using EORgui for Neem K-Ag .............................................................. 73
Fig. 4.21: Screening Using EOR Analysis for Neem K-Ag .................................................... 74
Fig. 4.22: Screening Using SPE Format for Neem K-Amal .................................................... 75
Fig. 4.23: Screening Using EORgui for Neem K-Amal .......................................................... 76
Fig. 4.24: Screening Using EORAnalysis for Neem K-Amal ................................................. 77
Fig. 4.25: Screening Using SPE Format for Neem F-Ag ........................................................ 78
Fig. 4.26: Screening Using EORgui for Neem Main F-Ag ..................................................... 79
Fig. 4.27: Screening Using EOR Analysis for Neem Main F-Ag ........................................... 80

- xi -
Fig. 4.28: Screening Using SPE Format for Neem North-Ag ................................................. 81
Fig. 4.29: Screening Using EORgui for Neem North-Ag ........................................................ 82
Fig. 4.30: Screening Using EOR Analysis for Neem North-Ag .............................................. 83
Fig 4.31: Screening Using SPE format for Neem North Bentui .............................................. 84
Fig. 4.32: Screening Using EORgui for Neem North-Bentui .................................................. 85
Fig. 4.33: Screening Using EOR Analysis for Neem North-Bentui ........................................ 86

- xii -
List of Tables
Table 1.1: Performance Summary for Greater Neem (OEPA, 2014) ........................................ 5
Table 2.1: Methods of Enhanced Recovery (Teknica, 2001) .................................................. 18
Table 2.2: Tertiary Oil Recovery-Alberta Systems (Teknica, 2001) ....................................... 27
Table 2.3: Oil Properties and Reservoir Characteristics for EOR Methods (Ahmed Aladasani
and Baojun Bai, 2010) ..................................................................................................... 36
Table 4.1: DATA of Greater Neem Field ................................................................................ 53
Table 4.2: Results Obtained From SPE Format, EORgui and EOR Analysis ......................... 87
Table 5.1. Suitable EOR Methods for Greater Neem .............................................................. 90
- xiii -
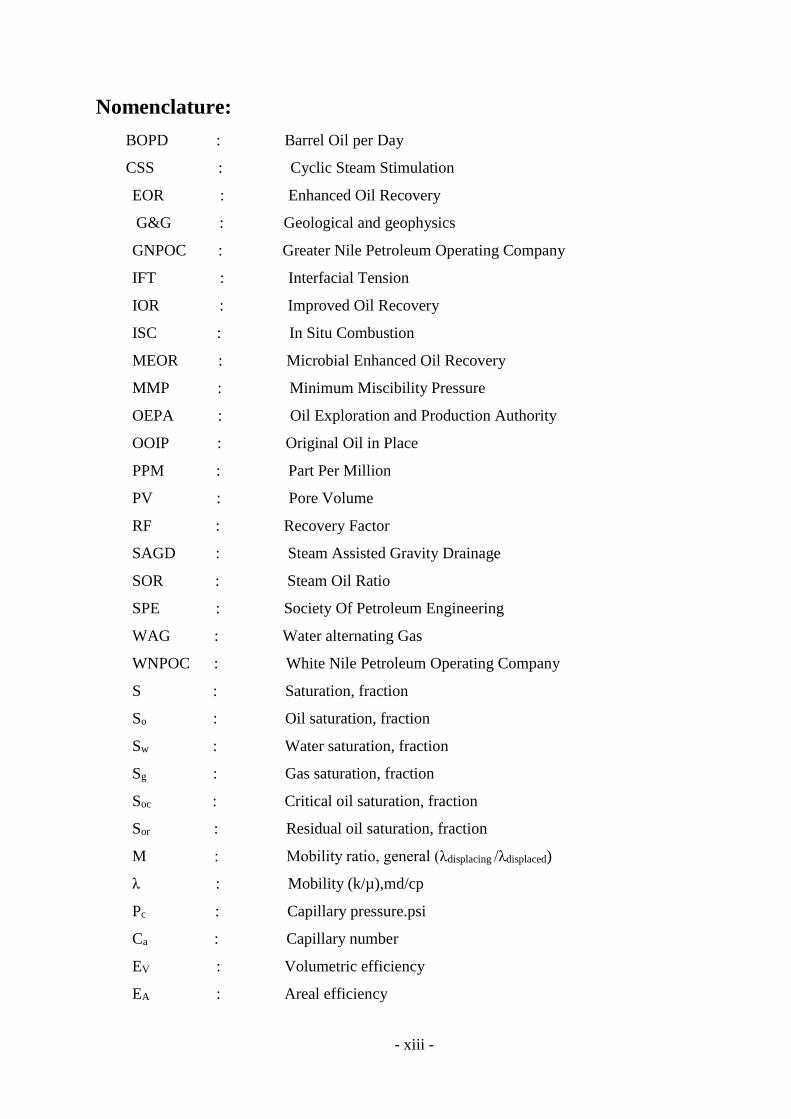
Nomenclature:
BOPD : Barrel Oil per Day
CSS : Cyclic Steam Stimulation
EOR : Enhanced Oil Recovery
G&G : Geological and geophysics
GNPOC : Greater Nile Petroleum Operating Company
IFT : Interfacial Tension
IOR : Improved Oil Recovery
ISC : In Situ Combustion
MEOR : Microbial Enhanced Oil Recovery
MMP : Minimum Miscibility Pressure
OEPA : Oil Exploration and Production Authority
OOIP : Original Oil in Place
PPM : Part Per Million
PV : Pore Volume
RF : Recovery Factor
SAGD : Steam Assisted Gravity Drainage
SOR : Steam Oil Ratio
SPE : Society Of Petroleum Engineering
WAG : Water alternating Gas
WNPOC : White Nile Petroleum Operating Company
S : Saturation, fraction
So : Oil saturation, fraction
Sw : Water saturation, fraction
Sg : Gas saturation, fraction
Soc : Critical oil saturation, fraction
Sor : Residual oil saturation, fraction
M : Mobility ratio, general (λdisplacing /λdisplaced)
λ : Mobility (k/µ),md/cp
Pc : Capillary pressure.psi
Ca : Capillary number
EV : Volumetric efficiency
EA : Areal efficiency

- xiv -
EI : Vertical efficiency
q : Production rate or flow rate, bbl/day
k : Absolute permeability, md
ki : Effective permeability to phase(i), md
kri : Relative permeability to phase(i),
σ : Surface tension, interfacial, lbm/s2
θ : Contact angle
g : Acceleration of gravity, ft/s2
ρ : Density, lbm/ft3
γo : Oil specific gravity
µo : Oil viscosity, cp
Ø : Porosity
h : Thickness (general and individual bed), ft.
D : Depth, ft.
T : Temperature, oF
CO2 : Carbon Dioxide
N2 : Nitrogen Gas

- 1 -
Chapter 1
Introduction
1.1. EOR background
The potential for enhanced recovery by advanced injection techniques has been known
for many decades, but unstable economic climate and the complex nature of the reservoir
processes often involved in enhanced recovery have hindered implementation of many
projects. Due to improved drilling methods, better production technologies, improved reservoir
knowledge, and higher oil prices, these methods are more attractive today (Green, D. and
Willhite, G.P., 1998).
Enhanced oil recovery (EOR) definition is “the recovery of oil by injection of a fluid
that is not native to the reservoir” and it is a method of extending the production life of depleted
oil filed according to Green, D. and Willhite, G.P. EOR used to recover oil by using two
different wells including water flooding, it is usually applied after primary, and secondary
recovery processes have been exhausted. EOR cannot be applied in all reservoirs. Effective
screening practice must be employed to identify suitable candidates. As a part of projections
discount cash-flow are performed to assess profitability.
The general mechanism of oil recovery is movement of hydrocarbons to production
wells due to a pressure difference between the reservoir and the production wells. The recovery
of oil reserves is divided into three main categories worldwide.
1- Primary recovery techniques: This implies the initial production stage, resulted from
the displacement energy naturally existing in a reservoir.
2- Secondary recovery techniques: Normally utilized when the primary production
declines. Traditionally these techniques are water flooding and gas injection. The
recovery factor can rise up to 50% by using them.
3- Tertiary recovery techniques: These techniques refer to the ones used after the
implementation of the secondary recovery method. Usually these processes use
miscible gases, chemicals, and/or thermal energy to displace additional oil after the
secondary recovery process has become uneconomical. The recovery factor may arise
up to 12% additionally to the RF obtained with the secondary recovery method.

- 2 -
Selection of EOR method:
There are many methods for enhanced oil recovery and each has differences that make
it more useful based on specific reservoir challenges and other parameters. Selecting the
suitable EOR method by screening the reservoir and fluid properties can ultimately reduce the
risk by eliminating inefficiencies.
The criteria for selecting particular EOR process are complex because of the large
number of petro-physical, chemical, geological, environmental and fluid properties (density &
viscosity which are dependent on temperature) that must be considered for each individual
case. The common methods used for the selection of EOR method include SPE Format and
EORgui. These will be discussed individually.
1.2. Problem statement
Greater Neem field has a low recovery (OEPA, 2014) because of the decrease in the
production that is why it needs to enhanced the recovery by EOR methods. EOR methods are
quite complex and the selecting of suitable method for each field requires prescreening of rock,
fluid and field characteristics in details. Before implementing any of these methods, they should
undergo a careful and detailed screening process, then come up with the most suitable and
compatible method.
This study examines the Greater Neem field though screening criteria using SPE format,
EORgui software and a new software (EOR analysis) built by project team and IT engineer to
compare and select the suitable EOR method to increase recovery factor.
1.4. Objectives
The main objectives of this research are:
1. To diagnose Greater Neem field and determine its problems which is low recovery.
2. Study rock and fluid properties that affect the selecting of EOR methods
3. To develop a new software based on updated screening criteria
4. Apply Greater Neem field data on EORgui to obtain results and compare it with the
results from a new software.
1.5. Methodology
1. Determine the geological description and data required for the Neem field.
2. Implement screening process for this field by using: SPE format (manual), EORgui and
new software.

- 3 -
3. Compare between obtained results to select the suitable method/s.
1.6. Greater Neem Overview:
The Greater Nile Petroleum Operating Company (GNPOC) operates greater Neem oil
field in Block 4. It is in South Kordofan state.
Block 4 is divided into four grouping/cluster: Greater Diffra, Greater Neem, Azraq area
and Canar area. The first commercial discovery in Block 4 was in 2002. The geological survey
shows a multiple structures, multi-reservoirs & highly faulted features. The depth of reservoirs
varies from 1400 to 3500 m. This reservoir is characterized by a high GOR and the porosity
ranges from 16-30%. Abu Gabra is the main reservoir with Bentiu and Aradeiba sand
representing the minor reservoirs. Figure 1-1 shows location map of block 4.
Well productivity is found to be good from DST. The produced oil is mainly light except
NEN, NENA, NEW, HLE and HLNE. Diffra FPF,NeemFPF and Canar FPF are the three
processing facilities in this block. CO2 is found in Neem East Bentiu/Intra-Bentiu.
Greater Neem field consists of five reservoirs: Neem Main, Neem K, Neem F, Neem
East,and Neem North.The first commercial discovery was in 2003. The geological survey
shows multiple structures, multi-reservoirs & highly faulted features. The depth of reservoirs
varies from 3000 to 3500m. This reservoir is characterized by a high GOR. AG is main
reservoir consist of alternations of Sand & Shale.
Well Productivity is found to be good from DST. The produced oil is mainly light except
Neem North and Neem West. CO2 is found in Neem East Bentiu/Intra-Bentiu.

- 4 -
Fig. 1.1: Location Map of Block4 (OEPA, 2014)
Fig.1.2: Location Map of Greater Neem Oil field (OEPA, 2014)

- 5 -
Fig.1.3: Production Status as of 31st May 2014(OEPA,2014)
In Greater Neem, the main producing sands are Abu Gabra and Bentiu .Water drive is
the main driving mechanism in this field. Field development plan conducted in 2005 and
updated in 2008 and new G&G study plan is set to start in 2014.
Table 1.1: Performance Summary for Greater Neem (OEPA, 2014)
Liquid flow rate 38.5 Mbbl/d
Oil flow rate 9 Mbbl/d
Water cut 77%
Cumulative oil production 52.87 MMstb
Number of wells 73wells (48 active)
2006 07 08 09 10 11 12 13 140
20000
40000
60000
80000
100000
0
20
40
60
80
100
LIQ
UID
RA
TE
( b
bl/d
)
OIL
RA
TE
( b
bl/d
)
WC
T (
%)
WPB: B4 G NEEM

- 6 -
Chapter 2
Literature Review and Theoretical background
2.1. Literature Review
Once primary and secondary oil recovery processes have been exhausted about two thirds
of original oil in place (OOIP) is left behind and the role of enhanced oil recovery methods
(EOR) is to recover that remaining oil. Selecting the suitable EOR method according to
reservoir characteristics screening must be done.
Taber et.al in 1996 developed EOR criteria in (EOR screening criteria revisited part1)
paper. The criteria are based on oil displacement mechanisms, the results of EOR field projects
application reported in oil and gas journal, and at various SPE, conferences and they mentioned
that: The depth oil gravity and oil production from hundreds of projects are displayed in graph
to show the wide distribution and relative importance of the methods. Steam flooding continues
to be dominant method but hydrocarbon injection and CO2 flooding are increasing and if only
oil gravity is considered, the results show that there is a wide choice of effective methods that
range from miscible recovery of the lightest oil by nitrogen injection to steam flooding and
surface mining for heavy oil and tar sands. However, there is often a wide overlap in choice
with low oil prices, there is less chemical flooding of the intermediate-gravity oils that are
normally waterflooding polymer flooding continues to show promise especially if projects are
started at high oil saturation.
In 1996, Taber.et.al also have published EOR screening criteria revisited part 2. They
have found that: The CO2 screening criteria were used to estimate the capacity of the world’s
oil reservoir for the storage/disposal of CO2 and the impact of oil prices on EOR production in
the U.S was considered by comparing the recent EOR production to that predicted by the NPC
reports for various oil prices
Ahmed Aladasani and Baojun Bai in 2010 reviews recent development in enhanced oil
recovery (EOR) techniques published in SPE conference proceedings for 2007 to 2009. It also
updates the EOR criteria developed by Taber et al.
Galal Eldin Yousif in 2010 has studied all Sudanese fields through screening criteria
based on only five properties, which are permeability, oil viscosity, depth, pressure and API
gravity by using SPE format, to select the suitable EOR method for each block to increase the

- 7 -
recovery factor. He reviewed economic analysis for methods that applied in Sudanese fields
also; he made road maps and wide picture for EOR in Sudan
Abd-Alrhman Salih Ali et al in 2010 had proposed screening criteria for all enhance oil
recovery methods based on geological description and reservoir properties from previous oil
field experience besides economic evaluation and ranking of IOR/EOR opportunities. Data
from AB field had been examined and the optimum. They had noted reservoir characteristics
for successful field enhancing performance.
Based on these studies a new software will be designed using updated screening criteria
and compare the results with SPE format and EORgui.
2.2. History of Oil in Sudan
Exploration activities in the Sudan began at the end of the 1950s in the coastal waters
of the Red Sea and the Sudanese continental shelf by the Italian company (AGIP) at mid of
1970s to 1980s exploration activities were very active and shifted to the interior basins of the
Sudan. Chevron drilled the first well in AbuGabra area in 1977 and Baraka-1 in 1978 providing
the presence of source rock and made its first discovery of unity-1. Sudan has been producing
its petroleum resource commercially since 1999 when Block 1/2/4 started production of
reserve. This was the major achievement by its operator GNPOC when they commercialize
and export crude to foreign buyers via 1500 km new pipeline to Port Sudan. Since then, its
daily production has increase to maximum of 300 KBOPD in 2006 (before it started declining
rapidly with increasing water production). Three more operators: Petro-Energy, PDOC and
WNPOC started their oil production in 2006 (Galal Eldin, 2010)
Total Sudan oil in place as of 1st January, 2009 was estimated to be 15.9 billion barrels,
39% of which (6.2 billion barrels) is in Block 3/7 operated by PDOC which contributes about
37% of total Sudan estimated ultimate oil recovery. GNPOC holds second biggest oil in place,
which is about 5.5 billion barrels but the highest recoverable oil of 1.6 billion barrels,
contributing about 45% of the national reserve. The remaining is possessed by WNPOC and
Petro-Energy (Galal Eldin, 2010).
The average recovery factor for Sudan is estimated at 23%, which is relatively low on
international standard, and GNPOC's average recovery factor is the highest at 26%, followed
by PDOC, Petro-Energy and WNPOC at 21.5%, 23% and 11.9% respectively according to
(Sudapet, 2009). This is low recovery factor is attributed to amongst other qualities of the oil
and also non-favorable reservoir properties, GNPOC's API is the highest at 33 API, followed
by PDOC at 25 API, WNPOC at 21 API and Petro-Energy at 18 API. With declining production

- 8 -
and the fact that 77% of the oil will remain in the ground at the end of field producing life,
there is an urgent need to adopt new approach in order to enhance oil recovery to arrest the
declining production. Most oil fields production are on natural depletion and assisted by
artificial lift pumps. Only Unity and Talih fields in GNPOC is on water injection to provide
pressure maintenance, while a pilot test was being implemented in PDOC. In the low API oil
and viscous crude production environment, water injection is usually not favorable for
application due to the poor mobility ratio which susceptible to water fingering. Early high
water-cut and low oil production rate are expected in heavy oil production. Beside infill
drilling, well stimulation and horizontal well drilling to produce the "low hanging fruits" a
major step forward is needed to improve oil recovery. Suitable and cost effective enhanced oil
recovery technique should be selected for implementation.
According to U.S Energy Information Administration report at September 2013, Sudan
and South Sudan have 5 billion barrels of proved crude oil reserves of January 1, 2013.
Approximately 1.5 billion barrels are in Sudan and 3.5 billion barrels in South Sudan.
Currently, oil produced from Blocks 2, 4, 6 and 17 counted as Sudan's production, while oil
from Blocks 1, 3 and 7 belongs to South Sudan. Total oil production in Sudan and South Sudan
reached its peak of 486,000 bbl/d in 2010, but it declined to 453,000 bbl/d in 2011.
After the secession of the South (85% of total oil production come from it) Sudan’s, oil
production declined to 120,000 bbl/d. At the end of 2012, Sudan brought two new fields: the
Hadida field in Block 6 and al-Barasaya in Block 17. Sudan hope to increase production in the
future by ramping up new fields and increasing oil recovery rates in existing fields from 23 %
to 47 % (eia, 2012). The production forecast for Sudan and South Sudan and average recovery
factor shown at figures (2.1 and 2.2).
There are many reasons for selecting EOR to increase the recovery factor in Sudan fields
including low recovery factor, high water cut and high amount of remaining oil reserves.
Availability of technology and good oil price also are important reasons for implementing EOR
processes.

- 9 -
Fig. 2.1: Production Forecast for Sudan & South Sudan (Sudapet, 2009)
Fig. 2.2: Average RF for Sudan & South (Sudapet, 2009)
EOR projects in Sudan are few; examples of these projects are chemical injection and
(CSS) in Bamboo field and thermal EOR project (CSS and steam flooding) in FNE Block in
Fula field.

- 10 -
Oil Recovery Processes
The recovery of oil reserves divided into three main categories as shown in figure 2.3.
Fig. 2.3: Recovery Stages of a Hydrocarbon Reservoir Through Time (Sultan
Pwage et al, 2010)
Primary oil recovery use natural reservoir energy to drive the oil through the complex pore
network to producing wells. That means it depends mainly on existing natural pressure in the
reservoir. Primary recovery efficiency is generally low and range from 5% - 20% OOIP
according to (Teknica, 2001).The driving energy may consist of expanding force of natural
gas, gravitational force, Influx of natural water, gravitational force and gas that released from
solution out of the oil. Secondary recovery purposes are pressure maintenance and pressure
restoration. It has involved the introduction of energy into a reservoir by injecting external fluid
such as gas or water (Teknica, 2001). The secondary oil recovery employed to increase the
pressure required to drive the oil to production wells when oil production declines because of
hydrocarbon production. Processes of secondary recovery include: water injection, which
refers to water, injected in the aquifer through several injection wells to support pressure or
improve sweep/displacement oil from the reservoir and the. Selection of water injection method
depends upon mobility ratio. Corrosion of surface and sub-surface equipment and formation
damage are the main disadvantages of water injection process.
Gas injection, which used for the purpose of maintaining reservoir pressure and
restoring oil well productivity. The primary problem with gas injection is the high mobility of
it and the benefits of gas injection depend upon horizontal and vertical sweep efficiency of the
injected gas. Using of gas injection is limited because of it is low oil displacement and also the
need of gas supplies in market.

- 11 -
Limitations of primary and secondary recovery processes
1- Leads to low oil production rates and oil recovery (5-10) % of original oil in place OOIP
(Teknica, 2001).
2- Secondary recovery does not yield a good recovery due to: water and gas coning
problems, low sweep efficiency and Unsuitable mobility ratio
Tertiary Oil recovery also known as enhanced oil recovery processes .it is refer to
processes in porous medium that recover oil not produced by the conventional methods. Ronald
.E (2001) states that" It is characterized by injection of special fluids such as: chemicals,
miscible gases and /or the injection of thermal energy".
2.3. Fluid and rock properties
To understand the basic principles of EOR some reservoir engineering parameters should
been known. Mobility Ratio, Relative Permeability, Wettability and IFT are the most important
reservoir engineering parameters.
2.3.1. Saturation
Saturation is defined as" that fraction, or percent, of the pore volume occupied by a
particular fluid (oil, gas, or water) "(Tarek Ahmed, 2010). This property expressed
mathematically by the following relationship
All saturation values based on pore volume and not on the gross reservoir volume. The
saturation range between (0-100) %. By definition, the sum of the saturations is 100%,
therefore for the oil phase to flow, the saturation of the oil must exceed a certain value, which
is termed critical oil saturation (Soc). At this particular saturation, the oil remains in the pores
and, for all practical purposes, will not flow. During the displacing process of the crude oil
system from the porous media by water or gas injection (or encroachment), there will be some
remaining oil left that is quantitatively characterized by a saturation value that is larger than
the critical oil saturation. This saturation value is called the residual oil saturation (Sor) .The
term residual saturation is usually associated with the non-wetting phase when it is being
displaced by a wetting phase.

- 12 -
2.3.2. Mobility Ratio
Tarek Ahmed (2010) states that “The mobility is defined as the ratio of permeability to
the viscosity and the mobility ratio is defined as the mobility of displacing phase (water) to the
mobility of the displaced phase (oil)".
Mp= Kp/µpMW.o = Mw/Mo (2-1)
Mobility control processes injected a low mobility-displacing agent to increase
volumetric and displacement sweep efficiency. This process includes polymer flooding and
foam flooding.
2.3.3. Capillary Pressure
The capillary forces in a petroleum reservoir are the result of the combined effect of the
surface and interfacial tensions of the rock and fluids, the pore size and geometry, and the
wetting characteristics of the system.
Any curved surface between two immiscible fluids has the tendency to contract into the
smallest possible area per unit volume. When two immiscible fluids are in contact, a
discontinuity in pressure exists between the two fluids, which depend upon the curvature of the
interface separating the fluids we call this pressure difference the capillary pressure (pc). The
displacement of one fluid by another in the pores of a porous medium is either aided or opposed
by the surface forces of capillary pressure.
It is necessary to maintain the pressure of the non-wetting fluid at a value greater than
that in the wetting fluid to maintain a porous medium partially saturated with non-wetting fluid
and while the medium is also exposed to wetting fluid. The capillary pressure can be expressed
as:
Capillary pressure = (pressure of the non-wetting phase) - (pressure of the wetting phase)
pc = pnw - pw (2-2)
There are three types of capillary pressure: Water-oil capillary pressure (denoted as Pcwo),
Gas-oil capillary pressure (denoted as Pcgo) and Gas-water capillary pressure (denoted as Pcgw)
2.3.4. Wettability
Fluid distribution in porous media affected by the forces at fluid/fluid interfaces, and by
forces at fluid/solid interfaces. Wettability Defined as the tendency of one fluid to spread on or
adhere to a solid surface in the presence of other immiscible fluids. Fluid distribution in porous
media depends on fluid-fluid forces and fluid-solid forces. When two immiscible fluids are in

- 13 -
contact with a solid surface, one fluid usually attracted more strongly than the other fluid
(wetting phase). Wettability can be determined when checking for the contact angle The solid
considered water-wet, if the contact angle α is smaller than 90°. At contact angles α larger than
90°, the fluid is referred to as oil-wet. Intermediate wettability occurs, when the contact angle
α is close to 90° (Figure 2.4)
Fig. 2.4: Illustration of Wettability (Tarek Ahmed, 2010)
By convention, contact angles measured through the water phase. Water-wet is that the
entire rock surface of both large and small pores coated with water. Oil-wet is that the oil
completely coats the rock surface. Intermediate wettability tends for both oil and water to wet
the rock surface. In case of wetting fluid, the contact angle is smaller than 90°. At contact angles
larger than 90°, the fluid referred to non-wetting. In oil/water phase, water is wetting fluid, and oil
is non-wetting fluid.
2.3.5. Capillary number
In fluid dynamics, the capillary number (Ca) represents the relative effect of viscous
forces versus surface tension acting across an interface between a liquid and a gas, or between
two immiscible liquids. For example, an air bubble in a liquid flow tends to be deform by the
friction of the liquid flow due to viscosity effects, but the surface/interfacial tension forces tend
to minimize the surface. The capillary number defined as:
Ca = µ𝑽
𝜸 (2-3)
Where µ is the shear viscosity of the liquid, V is a characteristic velocity and γ is the
surface or interfacial tension between the two fluid phases. The capillary number is a
dimensionless quantity, hence its value does not depend on the system of units. For low
capillary numbers (a rule of thumb says less than 10−5), flow in porous media is dominated by

- 14 -
capillary forces whereas for high capillary number the capillary forces are negligible compared
to the surface force.
2.3.6. Volumetric Sweep efficiency
It represents the overall fraction of the flood pattern that contacted by the injected fluid.
If the displacing fluid will contact all the oil initially present in reservoir, the volumetric sweep
efficiency will be unity.
Ev = 𝐕𝐨𝐥𝐮𝐦𝐞 𝐨𝐟 𝐨𝐢𝐥 𝐜𝐨𝐧𝐭𝐚𝐜𝐭𝐞𝐝 𝐛𝐲 𝐝𝐢𝐬𝐩𝐥𝐚𝐜𝐢𝐧𝐠 𝐟𝐥𝐮𝐢𝐝
𝐓𝐨𝐭𝐚𝐥 𝐚𝐦𝐨𝐮𝐧𝐭 𝐨𝐟 𝐨𝐢𝐥 𝐢𝐧 𝐩𝐥𝐚𝐜𝐞 (2-4)
Ev can decompose into two parts, (areal sweep efficiency) and (vertical sweep
efficiency).
Ev = EA × EI (2-5)
EA = 𝐀𝐫𝐞𝐚 𝐜𝐨𝐧𝐭𝐚𝐜𝐭𝐞𝐝 𝐛𝐲 𝐝𝐢𝐬𝐩𝐥𝐚𝐜𝐢𝐧𝐠 𝐟𝐥𝐮𝐢𝐝
𝐓𝐨𝐭𝐚𝐥 𝐚𝐫𝐞𝐚 (2-6)
EI = 𝐂𝐫𝐨𝐬𝐬 − 𝐬𝐞𝐜𝐭𝐢𝐨𝐧𝐚𝐥 𝐚𝐫𝐞𝐚 𝐜𝐨𝐧𝐭𝐚𝐜𝐭𝐞𝐝 𝐛𝐲 𝐝𝐢𝐬𝐩𝐥𝐚𝐜𝐢𝐧𝐠 𝐟𝐥𝐮𝐢𝐝
𝐓𝐨𝐭𝐚𝐥 𝐜𝐫𝐨𝐬𝐬 – 𝐬𝐞𝐜𝐭𝐢𝐨𝐧𝐚𝐥 𝐚𝐫𝐞𝐚 (2-7)
2.3.7. Relative Permeability
A measurement of the ability of two or more fluid phases to pass through a formation
matrix. The relative permeability reflects the ability of a specific formation to produce a
combination of oil, water or gas more accurately than the absolute permeability of a formation
sample, that is measured with a single-phase fluid, usually water.
The relative permeability of one phase in multiphase flow in porous media is a
dimensionless measure of the effective permeability of that phase. It is the ratio of the effective
permeability of that phase to the absolute permeability. It can been viewed as an adaptation of
Darcy's law to multiphase flow.
For two-phase flow in porous media given steady-state conditions, we can write
qi = 𝐾𝑖
µ𝑖 ΔPi for i = 1,2,.. (2-8)
Where qi the flux, ΔPi is the pressure drop, µi is the viscosity. The subscript i indicates
that the parameters are for phase i.
Ki is here the phase permeability (i.e., the effective permeability of phase i), as observed
through the equation above. Relative permeability, Kri, for phase i defined from

- 15 -
Ki = Kri × K, as Kri = 𝐊𝐢
𝐊 (2-9)
Where is the permeability of the porous medium in single-phase flow, i.e., the absolute
permeability K Relative permeability must be between zero and one. In applications, relative
permeability is often represented as a function of water saturation.
2.3.8. Surface/Interfacial Tension
The surface tension is defined as the force exerted on the boundary layer between a
vapor phase and liquid phase per unit length, (Tarek Ahmed, 2010) which is caused by
differences between the molecular forces in the vapor phase and those in the liquid phase, and
also by the imbalance of these forces at the interface. The surface tension can been measured
in the laboratory and is unusually expressed in dynes per centimeter and it is an important
property in reservoir engineering calculations and designing enhanced oil recovery projects.
Sugden suggested a relationship the correlating parameters of the proposed relationship
are molecular weight M of the pure component, the densities of both phases, and a newly
introduced temperature independent parameter Pch The relationship expressed mathematically
in the following form:
σ =[𝑃𝑐ℎ(𝑃𝑙−𝑃𝑣)
𝑀]
4 (2-10)
Where σ is the surface tension and Pch is a temperature independent parameter and is
called the parachor.
When the interface is between two liquids, the acting forces are called Interfacial
Tension. If a glass capillary tube is placed in a large open vessel containing water, the
combination of surface tension and wettability of tube to water will cause water to rise in the
tube above the water level in the container outside the tube as shown in Figure 2.5.
The water will rise in the tube until the total force acting to pull the liquid upward is
balanced by the weight of the column of liquid being supported in the tube.

- 16 -
Fig. 2.5 :Pressure Relation in Capillary Tube (Tarek Ahmed, 2010)
Assuming the radius of the capillary tube is r, the total upward force Fup, which holds the
liquid up, is equal to the force per unit length of surface times the total length of surface, or
Fup = (2πr) (σgw) (cos) (2-11)
Where:
σgw = surface tension between air (gas) and water (oil), dynes/cm
= contact angle
r = radius, cm.
The upward force is counteracted by the weight of the water, which is equivalent to a
downward force of mass times acceleration, or
Fdown = πr2 h (w - air) g (2-12)
Where:
h = height to which the liquid is held, cm
g = acceleration due to gravity, cm/sec2
w = density of water, gm/cm3
air = density of gas, gm/cm3
- 17 -
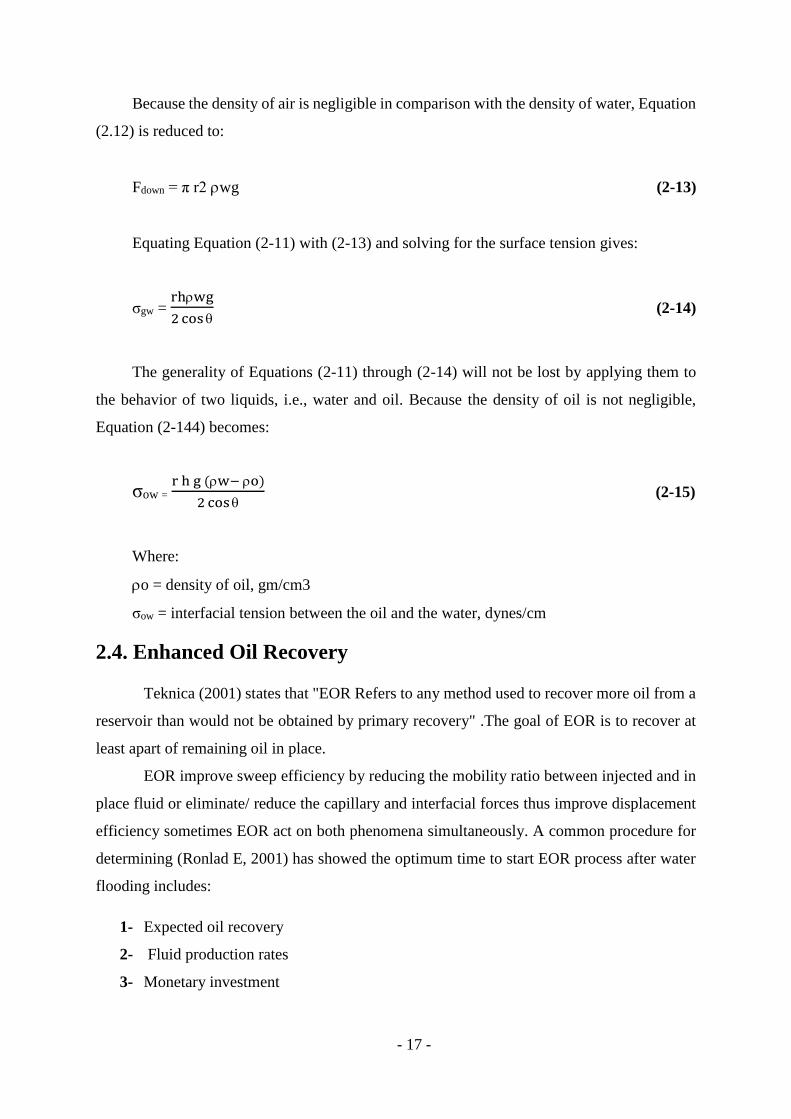
Because the density of air is negligible in comparison with the density of water, Equation
(2.12) is reduced to:
Fdown = π r2 wg (2-13)
Equating Equation (2-11) with (2-13) and solving for the surface tension gives:
σgw = rhwg
2 cos (2-14)
The generality of Equations (2-11) through (2-14) will not be lost by applying them to
the behavior of two liquids, i.e., water and oil. Because the density of oil is not negligible,
Equation (2-144) becomes:
σow = r h g (w− o)
2 cos (2-15)
Where:
o = density of oil, gm/cm3
σow = interfacial tension between the oil and the water, dynes/cm
2.4. Enhanced Oil Recovery
Teknica (2001) states that "EOR Refers to any method used to recover more oil from a
reservoir than would not be obtained by primary recovery" .The goal of EOR is to recover at
least apart of remaining oil in place.
EOR improve sweep efficiency by reducing the mobility ratio between injected and in
place fluid or eliminate/ reduce the capillary and interfacial forces thus improve displacement
efficiency sometimes EOR act on both phenomena simultaneously. A common procedure for
determining (Ronlad E, 2001) has showed the optimum time to start EOR process after water
flooding includes:
1- Expected oil recovery
2- Fluid production rates
3- Monetary investment

- 18 -
4- Costs of water treatment, pumping equipment, maintenance and operation of the water
facilities
5- Costs of drilling new injection wells or converting existing production wells into
injectors.
Improved Oil Recovery
Improve oil recovery reveres to any reservoir processes to improve oil recovery including
production enhancement by fraction acidizing or sand management for example, drilling new
wells (infill drilling),work overs and enhanced oil recovery.
2.5. Processes of EOR methods
2.5.1. Miscible Methods
Definition: “the processes where the effectiveness of the displacement result primarily
from miscibility between the oil in place and the injected fluid” (Sultan Pwaga, et al., 2010).
Examples of displacement fluid includes CO2, hydrocarbon solvents, nitrogen and H2.
Immiscible displacement processes: means the displacing fluid is immiscible with the
displaced fluid or two fluids do not mix in all proportion to form a single phase. For example,
Table 2.1: Methods of Enhanced Recovery (Teknica, 2001)
Method Method Used for Basic principle
Chemical
Methods
1- mobility control processes
(Polymer-augmented water flooding
/CO2-augmented water flooding
/immiscible CO2 displacement).
2- low IFT process
(e.g. surfactant flooding /alkaline
flooding)
Improve of :
- sweep efficiency.
- displacement efficiency
Miscible Methods Miscible fluid displacement using: CO2,
N2, alcohol, LPG, dry gas, rich gas.
-Improve of displacement
efficiency
Thermal Methods Cyclic steam injection, steam drive, in situ
combustion
-improve of both sweep
and displacement
efficiency

- 19 -
water flooding in it the micro displacement efficiency Ed less than one because part of crude
oil in place is trapped as isolated drops; rings…etc. depending on the wettability and that reduce
the relative permeability of the oil and then oil recovery.
Solvents are more expensive than water or dry gas, for economic reasons the injected
solvent must be small and maybe followed by less expensive fluid (water).
2.5.1.1. CO2 Flooding
CO2 flooding is a process whereby carbon dioxide is injected into an oil reservoir in order
to increase output (Sultan Pwaga, et al., 2010). It was discovered since 1985.
Processes of CO2 flooding:
CO2 recovers crude oil by injecting CO2 into the reservoir, the viscosity of any
hydrocarbon will be reduced also density. Oil will be easier to flow because the mobility
improved. As we see at figure below. The conditions for CO2 flooding shown at table 2.3
Fig. 2.6: CO2 Flooding (Barrufet, M.A, 2001)
We must restore pressure within reservoir to a suitable pressure for CO2 flooding by
injecting water.CO2 flooding is second most tertiary recovery technique. The Advantages of
CO2 flooding including reduce the residual oil saturation (Sor), extract heavier component,
when CO2 mixing with oil cause a reduction in oil viscosity and density. The displacement of
oil become more effective as a result of reduction in IFT
High mobility and Availability of carbon dioxide considered main disadvantage of carbon
dioxide flooding. Taber et al (1997) have shown that "Corrosion can cause problems especially
if there is early breakthrough of CO2 in producing wells”.

- 20 -
2.5.1.2. Nitrogen and flue gas Injection
Nitrogen and flue gases can enhance the recovery of oil by miscible displacement (require
high pressure in deep reservoir and light oil) or pressure maintenance and the processes sown
at figure 2.7.
According to Taber et al (1997), there are two process of nitrogen injection including
vaporizing the lighter components of the crude oil and generating miscibility if pressure is high
enough. The other process is providing a gas drive and enhancing gravity drainage in dipping
reservoirs. Shown at figure below.
Fig. 2.7: N2 Injection (Barrufet, M.A, 2001)
The Advantages of nitrogen injection including reduce the residual oil saturation (Sor).
Moreover, increasing oil production and recovery. When N2 mixing with oil cause a reduction
in oil viscosity. Thus, the displacement of oil will be more effective because of reducing
mobility ratio, and when using N2 the cost will be less than using CO2.
Some difficulties associated with nitrogen injection are the need a high pressure in deep
reservoirs. The difference between mobility’s will cause fingering.
Limitation:
1- A steeply dipping reservoir is desired to permit gravity stabilization of the displacement.
2- Developed miscibility can only be achieved with light oils and at very high pressure,
(deep reservoirs are needed).
Main problem is viscous fingering results in poor vertical and horizontal sweep
efficiency. The conditions for N2 flooding shown at table 2.3

- 21 -
2.5.1.3. Hydrocarbon Injection
Hydrocarbon Injection process consist of inject light hydrocarbons through reservoirs to
form miscible flood. It needs high pressure to enhanced oil movement by increasing the oil
volume (swelling) and that vaporizing the heavy oil components and decreasing the oil
viscosity. Immiscible gas displacement can made by hydrocarbon injection (Preservoir < MMP),
the conditions for hydrocarbon injection shown at table 2.3
The Advantages of hydrocarbon injection including reduce the residual oil saturation (Sor)
and reduction of oil viscosity. Moreover, vaporize the heavy oil component. Hydrocarbon
injection needs high pressure in deep reservoir but it consider as less effectiveness method
because of it is high cost.
2.5.1.4. Hydrogen Injection
Like hydrocarbon injection, its increase the oil volume (swelling) if pressure is high
enough to achieve miscibility and vaporize heavy component (Abdulbasit, 2013). The
conditions for hydrogen injection shown at table 2.3
The Advantages of hydrogen injection including reduction of oil viscosity and reduce the
residual oil saturation (Sor). Moreover, vaporize the heavy oil component, but hydrogen
injection failed many times because it is difficult to be controlled and also needs high pressure.
2.5.1.5. Problems in Applying Miscible Methods
Because of differences in density and viscosity between the injected fluid and the
reservoir fluid(s), the miscible process often suffers from: : poor mobility and viscous
fingering.
Injection of a miscible agent and brine was suggested to solve the problem but it was not
good enough because the miscible agent and brine tended to separate due to density differences.
Several techniques are suggested and they typically involve the injection of a miscible
agent followed by brine (miscible agent–brine injection). The latter variation have been named
the WAG (water alternate gas) process and has become the most popular.
2.5.2. Chemical Flooding
2.5.2.1. Polymer flooding:
Polymer flooding is the process of adding small amount of polymer to thicken brine (water)
to reduce water mobility. In which a large macromolecule is used to increase the displacing fluid
viscosity, this leads to improve sweep efficiency in the reservoir.

- 22 -
There are many types of polymer but the two basic types of polymers, which are widely used
in field recovery projects, are XC-biopolymer and Polyacrylamides.
Polymer flooding processes:
Firstly low-salinity brine (freshwater) slug injected to the reservoir followed by injection of a
slug of 0.3 or higher PV of polymer solution. The polymer slug followed by another freshwater and
then followed by continuous drive water injection. The schematic cross-section view of polymer
injection illustrated in figure 2.8.
Fig. 2.8: Polymer Process(Barrufet, M.A, 2001)
Polymers usually added to water in concentrations ranging from 250 to 2000 parts per million
(PPM).The conditions for polymer flooding shown at table 2.3
Limitations:
High oil viscosities require higher polymer concentration, which results in high cost. Results
from polymer flooding can be better if the process started before the water-oil ratio becomes
excessively high. Some heterogeneity is acceptable, but the extensive fractures must be avoided also
clays increase polymer adsorption.
2.5.2.2. Surfactant flooding:
The aim of surfactant flooding is to recover the capillary-trapped residual oil after
waterflooding. By means of surfactant solutions, the residual oil can been mobilized through a
strong reduction in the interfacial tensions between oil and water. By the possibility to inject
the surfactant before the reservoir is completely waterflooding, it is likely to improve the
process economy by earlier production of the extra oil, restricting us to a time window for the
application of surfactant flooding (Sultan Pwaga,et al.,2010).

- 23 -
A surfactant is a surface-active agent that contains a hydrophobic (“dislikes” water) part
to the molecule and a hydrophilic (“likes” water) part. The surfactant migrates to the interface
between the oil and water phases and helps make the two phases more miscible. As the
interfacial tension between an oil phase and a water phase is reduced, the capacity of the
aqueous phase to displace the trapped oil phase from the pores of the rock matrix increases..
Surfactant flooding processes:
After the surfactant solution injected into the formation, targeting the surface between
oil-water to break the attractive forces between them (IFT) by producing soaps at the contact:
reducing residual oil saturation. In addition to wettability change from oil wet to water wet,
followed by polymer injection to enhance the sweep efficiency and control the mobility as well
as to stabilize the flow pattern. The conditions of surfactant flooding shown at table2.3 the
following figure 2.9 shows the surfactant flooding mechanism:
Fig. 2.9: Surfactant Flooding Mechanism (Barrufet, M.A, 2001)
By designing and selecting a series of specialty surfactants to lower the interfacial
tension to the range of 10-3 dynes/cm, a recovery of 10-20 % of the original oil in place, when
not producible by other technologies, is technically and economically feasible by surfactant
flooding (Akzonobe, 2006).

- 24 -
Fig. 2.10: Surfactant Flooding Fingering (Akzonobe, 2006).
There are many factors should considered to performing a successful surfactant flooding
EOR these factors including Formulations, Cost of surfactants, Availability of chemicals,
Environmental impacts and oil price. The advantages of surfactant flooding are reduce IFT and
work as emulsifier between oil and water, Sor reduction to a very minimum value, which
immediately leads to increase in the recovery factor, wettability change from oil to water wet,
trapped (bypassed) oil is produced and injection of polymer leads to pattern flow stabilization
and mobility control. While the disadvantages are considered a complex process, expensive
compared to alkaline and polymer, incompatibility between surfactant-polymer in case of no
co-solvent is used, degradation of surfactant and polymer in case of high reservoir temperature
and strong aquifer leads to both surfactant and polymer adsorption.
2.5.2.3. Alkaline Flooding
Alkaline or caustic flooding is also method used to improve displacement efficiency. It
is explained that alkaline agents such as sodium hydroxide can react naturally with organic
acids in crude oils to produce soaps at water –oil interface. Then surfactant molecules are
formed in situ and reduce the IFT. The effect produced in the reservoir appears to be similar to
that of micellar solutions. But the difference is that alkaline flooding reduces the interfacial
tensions (IFT) with surfactant generated in situ and thus increases the microscopic sweep
efficiency and thereby increases oil recovery (Ronald E, 2001).

- 25 -
Ronald E (2001) has shown that "Alkaline substances have been used include sodium
hydroxide, sodium orthosilicate, sodium metasilicate, sodium carbonate, ammonia ammonium
hydroxide". The most popular one is sodium hydroxide. Sodium orthosilicate has some
advantages in brines with high divalent ion content.
Displacement Mechanisms:
The displacement mechanisms of alkaline flooding consist of: lowering the interfacial
tension between oil and water, mobility enhancement and wettability alteration. Moreover, the
solubilization of oil in some micellar system aid the displacement and figure 2.11 represents
alkaline flood injection.
Fig. 2.11: Schematic of Alkaline Flood Injection (Teknica,2001)
Alkaline processes:
The basis of alkaline flooding process starts with injecting a softened water pre-flush
injection followed by alkaline solution injection of about 10 to 30 percent PV and then followed
by continuous injection of drive water. This process can be changed slightly according the
reservoir condition. To improve sweep efficiency and control mobility, polymer slug should
be injected behind the alkaline solution. Because of complexity of mineralogy and lithology of
petroleum reservoir, a big consideration should be given to the possible reactions between rock-
alkaline solution, saline water and oil in existing conditions of pressure and temperature. This
explains the importance of efforts put into laboratory alkaline flooding tests and field trials in
order to design properly the best design system for specific conditions for certain reservoir.
In designing an alkaline process, the principal goal is to achieve a minimum IFT in the
reservoir. The corresponding alkali concentration is considered the optimum concentration. In

- 26 -
the laboratory, this concentration is very low. However, in the field, it discovered that this
concentration does not survive far from the wellbore because of the reaction with rock and
consumption.
Earliest laboratory experiments have shown that salinity plays important role in
determining optimum alkali concentration. For instance, minimum IFT could be achieved with
distilled water and a wide range of NaOH concentrations, between 0.1 and 0.8 wt %. Adding
alkali to increase concentration and then to keep the effect of alkaline concentration as far as
possible from the injection wellbore increased the salinity of the system and the IFT value
(figure 2.12).
Recent laboratory work has done for trying to adjust higher alkali levels without losing
the acceptable low IFT values. Experiments on core samples showed that the injection of
combination of alkali-surfactant-polymer behind water flooding is the most efficient one
comparing with polymer and alkali polymer (Table2.2). Moreover, it can reduce the IFT to the
lowest level. The displacement efficiency of adding low amount of surfactant to alkali-polymer
system is the same as in the micellar-polymer system, but at lower chemical cost.
Fig. 2.12: IFT of Murphy-Whittier Second and Third Zones Crude (Graue and
Johnson, 1974)

- 27 -
Although the laboratory tests and studies reported good results, the process will have to
be proven by an increasing number of field pilots and by commercial development.
Table 2.2: Tertiary Oil Recovery-Alberta Systems (Teknica, 2001)
2.5.3. Microbial Enhanced Oil Recovery (MEOR)
Microbial Enhanced Oil Recovery is potentially cost-effective method, particularly for
recovering additional oil from striper wells. Microorganisms are injected to the reservoir so
these organisms multiply and their metabolic products such as polymers, surfactants, gases and
acids improve oil recovery. The microbial mechanisms that supported in the work of Ahmed
Aladasani and Baojun Bai (2010) are:
1. Increasing in the reservoir pressure by generated gas.
2. Reduction in oil viscosity.
3. Permeability modification because of acidic dissolution or plugging.
4. Reduction in IFT by the generation of bio surfactant
Microbial Processes:
It is so difficult and complex to determine reservoir limitations on this technique. In
many cases, simple compatibility studies between reservoir fluids and microorganisms are
enough to predict whether microorganism applied successfully or not. According to Asimon
and Schuster Company Englewood Cliffs, 1992, compatibility tests are usually test tube
experiments in which various microbial formulations are grown in the presence of reservoir
fluids and sometimes reservoir rock. The growth and metabolite production of the
microorganisms are measure to determine the optimal condition.
Microbial Treatments
The most practiced MEOR technique includes cyclic treatments of producing wells.
There are generally two types of well-stimulation treatments: firstly, treatments designed to
improve injectivity by cleaning out the well bore. Secondly, those are designed to improve
crude oil mobilization in the near well bore region by removing paraffinic or asphaltic deposits.
These treatments are considered more important, because there is a potential for improved
System Final So (PV)
Polymer 0.388
Alkali-Polymer 0.251
Alkali-Surfactant-Polymer (0.1 wt %) 0.115

- 28 -
residual oil mobilization. Well stimulation treatments also can decrease the cost of maintenance
and operation of a well by improving injectivity.
In microbial-enhanced waterflood, the micro-organisms should be able to move through
reservoir and produce chemical products to mobilize crude oil. Micro-organisms can produce
surfactants which can decrease the IFT and may change relative permeability. Also micro-
organisms can produce gases such as Co2, N2, H2, and CH4 that can increase reservoir pressure
and decrease oil viscosity and both of them result in increasing oil recovery.
Fluid diversion is another application for micro-organisms in water flood. Because
polymers can be produced by many types of micro-organisms, it has been suggested that some
micro-organisms could be used in situ to plug high-permeability zones in reservoirs and thus
improve sweep efficiency. Injected micro-organisms remain in the water phase and may act to
increase relative permeability to oil and decrease relative permeability to water. Ahmed
Aladasani and Baojun Bai (2010) have both shown reservoir conditions for MEOR at table 2.3.
Limitations and challenges
Most successful MEOR projects are applied to reservoirs with temperature less than 55°C.
Low production rate and high water cut reservoirs are more suitable for MEOR projects. In
addition, the adsorption of surfactant to the reservoir rock and biodegradation impact MEOR
performance adversely.
2.5.4. Thermal methods
Thermal methods have been tested since 1950’s, primary and secondary production from
reservoirs containing heavy, low-gravity crude oils is usually a small fraction of the initial oil
in place. This is due of the fact that these types of oils are very thick and viscous and as a result
does not migrate readily to producing wells. Figure 2.13 shows a typical relationship between
the viscosity of a heavy, viscous crude oil and temperature. As can be seen, for certain crude
oils, viscosities decrease by orders of magnitude with an increase in temperature of 100–200◦F.
This suggests that if the temperature of a crude oil in the reservoir can be raised by 100–
200◦F over the normal reservoir temperature, the oil viscosity will be reduced significantly and
will flow much more easily to a producing well. The temperature of a reservoir can be raised
by injecting a hot fluid or by generating thermal energy in-situ by combusting the oil (Ronald
E, 2001).
Most of the oil that has been produced by EOR methods to date has been as a result of
thermal processes. There is a practical reason for this, as well as several technical reasons. In
order to produce more than 1–2% of the initial oil in place from a heavy-oil reservoir, operators

- 29 -
had to employ thermal methods. Thermal processes are most effective when a petroleum
reservoir contains a low-gravity (less than 20o API), high-viscosity oil and have a high porosity.
The injection of steam reduces the oil viscosity which causes an increase in the oil mobility.
Depending on the way in which the heat is generated in the reservoir. To do thermal injection
in EOR, new wells have to be drilled for injection except in Cyclic Steam Stimulation (CSS)
(Sultan Pwaga, et al.,2010).
Fig. 2.13: Typical Viscosity–Temperature Relationships for Several Crude Oils
(Ronald E, 2001)
Types of thermal EOR:
There are many types of thermal enhanced oil recovery including steam injection,
cyclic steam stimulation (CSS), in-situ combustion (ISC) and steam assisted gravity Drainage
(SAGD).
2.5.4.1. Steam injection
The steam drive process (figure 2.14) is much like a conventional water flood. Once a
pattern arrangement is established, steam is injected into several injection wells while the oil
is produced from other wells. This is different from the steam stimulation process, whereby the
oil is produced from the same well into which the steam is injected. As the steam is injected
into the formation, the thermal energy is used to heat the reservoir oil. Unfortunately, the energy
also heats the entire environment such as formation rock and water. Some energy is also lost
to the under burden and overburden. Once the oil viscosity is reduced by the increased
temperature, the oil can flow more readily to the producing wells. The steam moves through

- 30 -
the reservoir and comes in contact with cold oil, rock, and water. As the steam comes in contact
by the cold environment, it condenses and a hot water bank is formed. This hot water bank acts
as a water flood and pushes additional oil to the producing wells.
Several mechanisms have been identified that are responsible for the production of oil
from a steam drive. These include thermal expansion of the crude oil, viscosity reduction of
the crude oil, changes in surface forces as the reservoir temperature increases, and steam
distillation of the lighter portions of the crude oil.
Steam applications have been limited to shallow reservoirs because as the steam is
injected it loses heat energy in the well bore. If the well is very deep, all the steam will be
converted to liquid water. Recently, interest has been shown in downhole steam generation;
research to develop an economical system is continuing in this area.
Steam drives have been applied in many pilot and field scale projects with very good
success. Oil recoveries have ranged from 0.3 to 0.6 bbl of oil per barrel of steam injected.
The advantages of steam injection are reduces remaining oil thus increases recovery
factor and reduces oil viscosity resulting in mobility ratio reduction and wettability change.
Steam oil ratio is controlled by steam injection and good performance can obtain due to
continuous steam injection. While the disadvantages are in deep reservoirs steam injection loss
its effectiveness due to reduction of quality . If the depth is excessive, high the process cannot
be applied. Heat losses occurred in case of strong or excessive water drive.
Fig. 2.14: Steam Injection Process (Sultan Pwaga, et al.,2010 )
2.5.4.2. Cyclic Steam Stimulation
The steam stimulation process was discovered by accident in the Mine Grande Tar
Sands, Venezuela, in 1959. During a steam injection trial, it was decided to relieve the pressure

- 31 -
from the injection well by back flowing the well. When this was done, a very high oil
production rate was observed. Since this discovery, many fields have been placed on steam
stimulation. The steam stimulation process, also known as the steam huff and puff, steam soak,
or cyclic steam injection, begins with the injection of 5000–15,000 bbl of high-quality steam.
Fig. 2.15: CSS Process (Sultan Pwaga, et al., 2010).
This can take a period of days to weeks to accomplish. The well is then shut in, and the
steam is allowed to soak the area around the injection well. This soak period is fairly short,
usually from 1 to 5 days. The injection well is then placed on production. The length of the
production period is dictated by the oil production rate but can last from several months to a
year or more. The cycle is repeated as many times as is economically feasible. The oil
production will decrease with each new cycle (Sultan Pwaga, et al., 2010).
Fig. 2.16: CSS Stages (Sultan Pwaga, et al., 2010)
The advantages of CSS including prepares the field for future steam flooding by heating
a part of the reservoir. Heating causes reduction in oil viscosity and thereby change the
wettability around the well bore from oil to water wet in addition to mobility ratio reduction.
Another advantage is the quick increment in oil rate once the production phase is started.While

- 32 -
the disadvantages of CSS are difficult to be applied in case of low current reservoir pressure
and affected by strong water aquifer drive.
2.5.4.3. In-Situ Combustion
The crude oil was ignited down hole in in-situ combustion process, and then a stream of
air or oxygen-enriched air was injected in the well where the combustion was originated. The
flame front was then propagated through the reservoir. Large portions of heat energy were lost
to the overburden and under burden with this process. To reduce the heat losses, researchers
devised a reverse combustion process. In reverse combustion, the oil is ignited as in forward
combustion but the airstream is injected in a different well. The air is then “pushed” through
the flame front as the flame front moves in the opposite direction. Researchers found the
process to work in the laboratory, but when it was tried in the field on a pilot scale, it was never
successful. What they found was that the flame would be shut off because there was no oxygen
supply and that where the oxygen was being injected, the oil would self-ignite. The whole
process would then revert to a forward combustion process (Ronald E,2001).
When the reverse combustion process failed, a new technique called the forward wet
combustion process was introduced. This process begins as a forward dry combustion does,
but once the flame front is established, the oxygen stream is replaced by water .As the water
comes in contact with the hot zone left by the combustion front, it flashes to steam, using energy
that otherwise would have been wasted. The steam moves through the reservoir and aids the
displacement of oil. The wet combustion process has become the primary method of
conducting combustion projects. Not all crude oils are amenable to the combustion process.
For the combustion process to function properly, the crude oil has to have enough heavy
components to serve as the fuel source for the combustion. Usually this requires an oil of low
API gravity. As the heavy components in the oil are combusted, lighter components as well as
flue gases are formed. These gases are produced with the oil and raise the effective API gravity
of the produced oil.

- 33 -
Fig. 2.17: In situ Combustion Process (Sultan Pwaga, et al.,2010)
Fig. 2.18: Simplified Combustion Process (Sultan Pwaga, et al., 2010)
There are three types of in-situ combustion processes as described below:
1. Dry in-situ combustion
It is the normal in-situ combustion process, both injection of air and burning front are
created at the injector and it is not followed by injection of water and the process is kept dry,
in this process the propagation of the burning front and the combustion front are from the
injector to the producer.

- 34 -
2. Wet in-situ combustion:
In this process, water is injected into the reservoir, after the air is being injected to it. The
reason of water injection is to cool the reservoir to protect the well from damage due to the
very high temperature, which is created of the burning process.
3. Reverse in-situ combustion
In reverse in-situ combustion injection of air is in the injector and the ignition is created
in the producer, it is called reverse due to the direction of the combustion front is in the opposite
direction of the injection, then by the continuous air injection burning front is travelled in the
reservoir towards the producer.
The advantages of in-situ combustion are cheaper process and causes reduction in oil
viscosity thereby change the wettability around the well bore from oil to water wet in addition
to mobility ratio reduction. Incremental in recovery factor is another advantage. While the
disadvantages of in-situ combustion are a complex process and causes reservoir damage where
any other EOR methods cannot be applied after that. A part of OIIP is burned during ignition
and burning in the reservoir as well as providing fuel to the process. Also, Carbon dioxide is
formed during the process which it affects the surface facilities if it is being produced. Another
disadvantage is unfavorable gas-oil mobility during the injection and burning front processes.
2.5.4.4. Problems in Applying Thermal Processes:
The main technical problems associated with thermal techniques are poor sweep
efficiencies, loss of heat energy to unproductive zones underground and poor injectivity of
steam or air. Poor sweep efficiencies are due to the density differences between the injected
fluids and the reservoir crude oils. The lighter steam or air tends to rise to the top of the
formation and bypass large portions of crude oil. Research is being conducted on methods of
reducing the tendency for the injected fluids to override the reservoir oil. Techniques involving
foams are being employed.
Large heat losses continue to be associated with thermal processes. The wet combustion
process has lowered these losses for the higher-temperature combustion techniques, but the
losses are severe enough in many applications to prohibit the combustion process. The losses
are not as large with the steam processes because they involve smaller temperatures. The
development of a feasible downhole generator will significantly reduce the losses associated
with steam injection processes.

- 35 -
The poor injectivity found in thermal processes is largely a result of the nature of the
reservoir crudes. Operators have applied fracture technology in connection with the injection
of fluids in thermal processes. This has helped in many reservoirs.
Operational problems include the following: the formation of emulsions, the corrosion of
injection and production tubing and facilities, and the creation of adverse effects on the
environment. When emulsions are formed with heavy crude oil, they are very difficult to break.
Operators need to be prepared for this. In the high-temperature environments created in the
combustion processes and when water and stack gases mix in the production wells and
facilities, corrosion becomes a serious problem. Special well liners are often required. Stack
gases also pose environmental concerns in both steam and combustion applications.
Stack gases are formed when steam is generated by either coal- or oil-fired generators
and, of course, during the combustion process as the crude is burned (Sultan Pwaga, et al.,
2010).
2.6. Screening Concept
A large number of variables are associated with a given oil reservoir for instance,
pressure, temperature, crude oil type and viscosity and the nature of the rock matrix and connate
water Because of these variables not every type of EOR process can be applied to every
reservoir. An initial screening procedure would quickly eliminate some EOR processes from
consideration in particular reservoir application .table 2.5 contains the screening criteria for
different EOR methods. In summary factors used in the screening are:
1- Reservoir conditions- temperature and pressure.
2- Reservoir fluid properties-oil viscosity and density and formation water salinity.
3- Reservoir geology-rock type and depth and permeability and porosity(Teknica, 2001)
In general screening has two sides: Technical screening & Commercial screening

- 36 -
Table 2.3: Oil Properties and Reservoir Characteristics for EOR Methods (Ahmed Aladasani and Baojun Bai, 2010)
Oil properties Reservoir Characteristics
SN EOR Method #
Projects
Gravity
(°API)
Viscosity
(cp)
Porosity
(%)
Oil
Saturation
(%PV)
Formation
Type
Permeability
(md)
Net
Thickness
Depth
(ft)
Temperature
(°F)
Miscible Gas Injection
1 CO2 139 28[22]-45
Avg. 37
35-0
Avg. 2.1
3-37
Avg.
14.8
15-89
Avg. 46
Sandstone
or
Carbonate
1.5-4500
Avg. 201.1
[Wide
Range]
1500a-
13365
Avg.
6171.2
82-250
Avg. 136.3
2 Hydrocarbon 70 23-57
Avg. 38.3
18000-
0.04
Avg.
286.1
4.25-45
Avg.
14.5
30-98
Avg. 71
Sandstone
or
Carbonate
0.1-5000
Avg. 726.2
[Thin
unless
dipping]
4040[400
0]-15900
Avg.
8343.6
85-329
Avg. 202.2
3 WAG 3 33-39
Avg. 35.6
0.3-0
Avg. 0.06
11-24
Avg.
18.3
Sandstone 130-1000
Avg. 1043.3
[NC] 7545-
8887
Avg.
8216.8
194-253
Avg. 229.4
4 Nitrogen 3 38[35]-54
Avg. 47.6
0.2-0
Avg. 0.07
7.5-14
Avg.
11.2
0.76[0.4]-
0.8
Avg. 0.78
Sandstone
or
Carbonate
0.2-35
Avg. 15
[Thin
unless
dipping]
10000[60
00]-
18500
Avg.
14633.3
190-325
Avg. 266.6
Immiscible Gas Injection

- 37 -
5 Nitrogen 8 16-54
Avg. 34.6
18000-0
Avg.
2256.8
11-28
Avg.
19.46
47-98.5
Avg. 71
Sandstone 3-2800
Avg. 1041.7
1700-
18500
Avg.
7914.2
82-325
Avg. 173.1
6 CO2 16 11-35
Avg. 22.6
592-0.6
Avg. 65.5
17-32
Avg.
26.3
42-78
Avg. 56
Sandstone
or
Carbonate
30-1000
Avg. 217
1150-
18500
Avg.
3385
82-198
Avg. 124
7 Hydrocarbon 2 22-48
Avg. 35
4-0.25
Avg. 2.1
5-22
Avg.
13.5
75-83
Avg. 79
Sandstone 40-1000
Avg. 520
6000-
7000
Avg.
6500
170-180
Avg. 175
8 Hydrocarbon
+WAG
14 9.3-41
Avg. 31
16000-
0.17
Avg.
3948.2
18-31.9
Avg.
25.09
Avg. 88
Sandstone
or
Carbonate
100-6600
Avg. 2392
2650-
9199
Avg.
7218.71
131-267
Avg. 198.7
(Enhanced) Waterflooding
9 Polymer 53 13-42.5
Avg. 26.5
4000b-0.4
Avg.
123.2
10.4-33
Avg.
22.5
34-82
Avg. 64
Sandstone 1.8e-5500
Avg. 834.1
[NC] 700-9460
Avg.
4221.9
74-237.2
Avg. 167
10 Alkaline
Surfactant
Polymer
(ASP)
13 23[20]-
34[35]
Avg. 32.6
6500c-11
Avg.
875.8
26-32
Avg.
26.6
68[35]-74.8
Avg. 73.7
Sandstone 596[10]-
1520
[NC] 2723-
3900[900
0]
Avg.
2984.5
118[80]-
158[200]
Avg. 121.6

- 38 -
11 Surfactant +
P/A
3 22-39
Avg. 31
15.6-3
Avg. 9.3
16-16.8
Avg.
16.4
43.5-53
Avg. 48
Sandstone 50-60
Avg. 55
[NC] 625-5300
Avg.
2941.6
122-155
Avg. 138.5
Thermal/Mechanical
12 Combustion 27 10-38
Avg. 23.6
2770-
1.44
Avg.
504.8
14-35
Avg.
23.3
50-94
Avg. 67
Sandstone
or
Carbonate
[Preferably
Carbonate]
10-15000
Avg. 1981.5
[> 10] 400-
11300
Avg.
5569.6
64.4-230
Avg. 175.5
13 Steam 271 8-30
Avg. 14.5
5E6-3d
Avg.
32971.3
12-65
Avg.
32.2
35-90
Avg. 66
Sandstone 1e-15000
Avg. 2605.7
[> 20] 200-9000
Avg.
1643.6
10-350
Avg. 105.8
14 Hot Water 10 12-25
Avg. 18.6
8000-170
Avg.
2002
25-37
Avg.
31.2
15-85
Avg. 58.5
Sandstone 900-6000
Avg. 3346
500-2950
Avg.
1942
75-135
Avg. 98.5
15 [Surface
Mining]
- [7]-[11] [Zero
could
flow]
[NC] [> 8 wt%
sand]
[Mineable
tar sand]
[NC] [> 10] [> 3:1
overburd
en to
sand
ratio]
[NC]
Microbial
16 Microbial 4 12-33
Avg. 26.6
8900-1.7
Avg.
2977.5
12-26
Avg. 19
55-65
Avg. 60
Sandstone 180-200
Avg. 190
1572-
3464
Avg.
2445.3
86-90
Avg. 88

- 39 -
The following reported EOR reservoir characteristics have extreme values that impact the respective average and range in Table 2.3
a- Minimum CO2 miscible flooding depth reported in Salt Creek Field, U.S.A.
b- Maximum polymer flooding viscosity reported in Pelican Lake, Canada
c- Maximum ASP flooding viscosity reported in Logomar, Venezuela
d- Maximum steam injection viscosity reported in Athabasca Oil Sand, Canada
e- Maximum steam injection permeability reported in North Midway-Sunset, U.S.A

- 40 -
2.7. Glance about economic view
The enhanced oil recovery projects are affected by a lot of economic factors, these include
change in oil price, adjustment in taxes, political situations, and the constancy of the oil industry
of productive countries.
Getting started with this type of projects, it requires providing the capital share with the
proper management of investors, to make them agree to bear all the risk factors associated with
technical changes that may arise on recovery method, especially that the enhanced recovery
project do not always give immediate result. Generally the related cost for this type of project
is so high especially capitalism (OPEX), but having a high cost is not constant rule.
Most of studies ensure that delaying this type of project to late time from field age, mean
in most times losing huge amount of oil, there for losing a lot of profit could be gained. That’s
why companies shouldn’t be looking after proved reserves, but concerning and pay more
attention to the employment of typical technology of the proper enhanced oil recovery during
the production interval.
Figure (2.19) show the relative cost of moderation different techniques used in enhanced
oil recovery. Although the oil prices that prevailed in doing this figure estimation is relatively
old, but any change in oil price was accompanied by a relative change in capital and operational
cost. The cost make this estimation reflects an approximation for the area of the cost of each
method, or at least shows the cost of each technique for the rest of the techniques.
Fig. 2.19: The Cost of the Different Techniques Used in Enhanced Oil Recovery (OPEC,
2009)

- 41 -
Chapter 3
Methodology
This chapter will review some of common methods to select the most technically
applicable EOR processes, which they are: Manual method using SPE format, EORgui allows
to apply EOR screening criteria of nine methods to any field and a new designed software
(EOR analysis) allows to apply EOR screening criteria of fifteen methods to any field.
3.1. Screening using SPE format:
SPE (Society of Petroleum Engineers) has established technical EOR screening concepts
using certain format. This format is based on field experience, project implementation around
the world and this method was the start point of all the EOR screening software's .The objective
is to select the suitable EOR method to be implemented in the future. The procedure contains
five plots:
3.1.1. Permeability plot
Permeability is one of the important factors in EOR screening, due to injection of the
fluids into the formation. It is important as well for the mobility ratio; all EOR methods require
high and enough permeability. Figure 3.1 presented permeability screening for EOR methods.
Fig 3.1: Permeability Screening for EOR Methods (David, 2009)

- 42 -
3.1.2. Viscosity plot:
Viscosity is important factor in EOR screening too, due to injection of both thermal and
miscible gas react with oil viscosity. It is important as well for the mobility ratio; all EOR
methods need viscosity data as in figure 3.2.
Fig. 3.2: Viscosity Screening for EOR Methods (David, 2009)
3.1.3. Depth plot:
Depth is one of the important factor in EOR screening too, due to injection of thermal
requires shallow formations because of steam quality and heat losses, and miscible gas
injection requires deep formations (Abdulbasit, 2013)as in figure 3.3 .
Fig. 3.3: Depth Screening for EOR Methods (David, 2009)

- 43 -
3.1.4. Reservoir Pressure vs. Oil Viscosity:
Pressure Vs viscosity also important plot to define the suitable EOR method (consists of
two main factors): Viscosity in X- axis and pressure in Y-axis, the location in the plot is used
to define the suitable method. Single value or range is used in the plot as in figure 4.4.
Fig. 3.4: Pressure & Viscosity Screening for EOR Methods (David, 2009)
3.1.5. Reservoir Depth vs. Viscosity:
It consists of two main factors: Depth in X- axis and viscosity in Y-axis, the location in
the plot is used to define the suitable method as in figure 3.5. The final screening result based
on the combination between the five plots.
Fig. 3.5: Reservoir Depth & Viscosity Screening for EOR Methods (David, 2009)
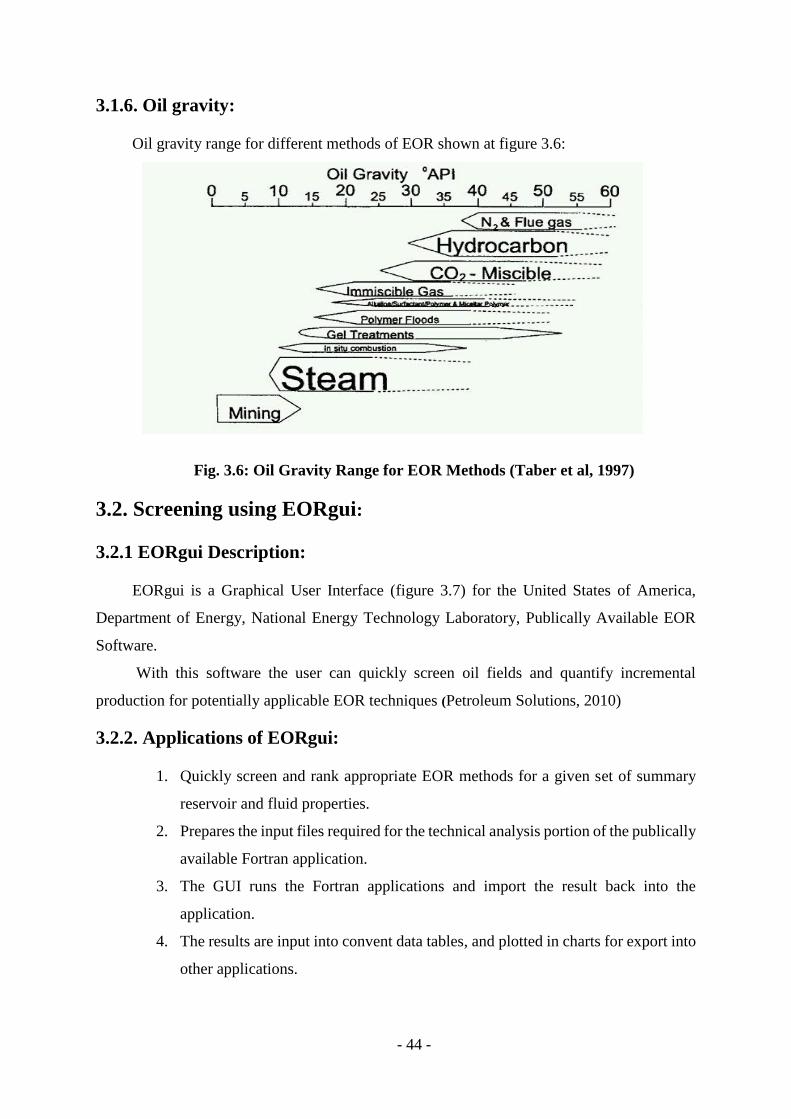
- 44 -
3.1.6. Oil gravity:
Oil gravity range for different methods of EOR shown at figure 3.6:
Fig. 3.6: Oil Gravity Range for EOR Methods (Taber et al, 1997)
3.2. Screening using EORgui:
3.2.1 EORgui Description:
EORgui is a Graphical User Interface (figure 3.7) for the United States of America,
Department of Energy, National Energy Technology Laboratory, Publically Available EOR
Software.
With this software the user can quickly screen oil fields and quantify incremental
production for potentially applicable EOR techniques (Petroleum Solutions, 2010)
3.2.2. Applications of EORgui:
1. Quickly screen and rank appropriate EOR methods for a given set of summary
reservoir and fluid properties.
2. Prepares the input files required for the technical analysis portion of the publically
available Fortran application.
3. The GUI runs the Fortran applications and import the result back into the
application.
4. The results are input into convent data tables, and plotted in charts for export into
other applications.
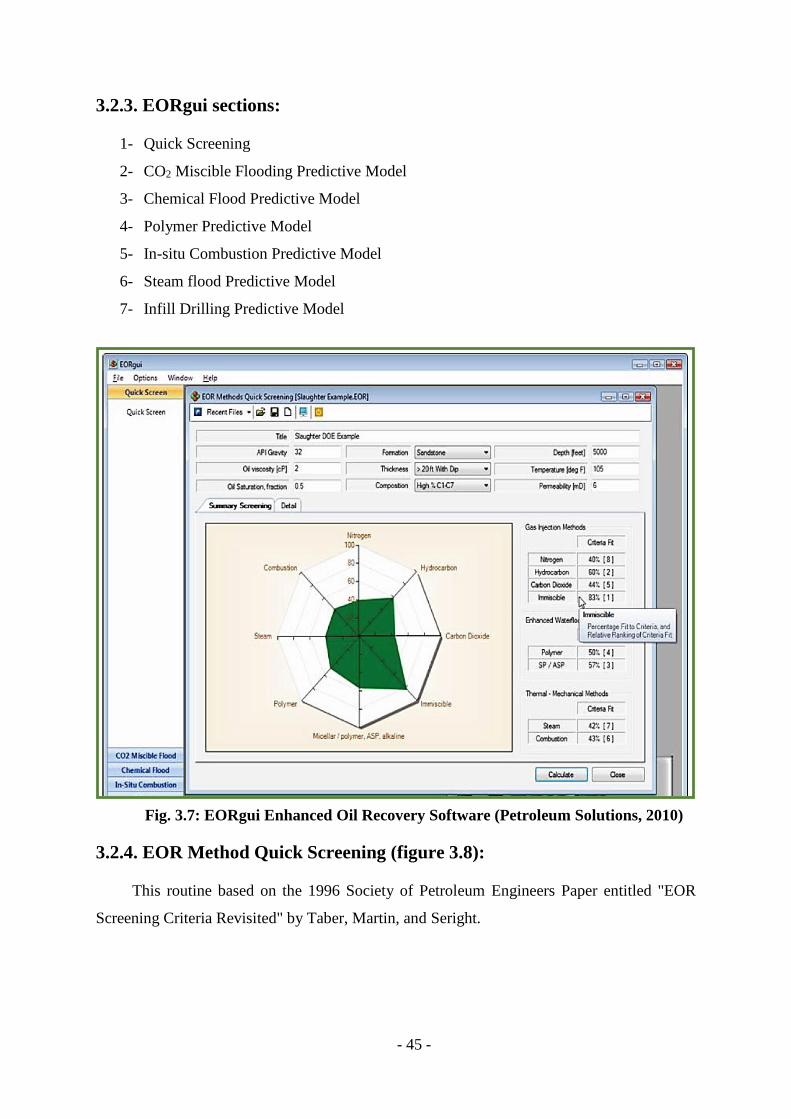
- 45 -
3.2.3. EORgui sections:
1- Quick Screening
2- CO2 Miscible Flooding Predictive Model
3- Chemical Flood Predictive Model
4- Polymer Predictive Model
5- In-situ Combustion Predictive Model
6- Steam flood Predictive Model
7- Infill Drilling Predictive Model
Fig. 3.7: EORgui Enhanced Oil Recovery Software (Petroleum Solutions, 2010)
3.2.4. EOR Method Quick Screening (figure 3.8):
This routine based on the 1996 Society of Petroleum Engineers Paper entitled "EOR
Screening Criteria Revisited" by Taber, Martin, and Seright.

- 46 -
Fig. 3.8: EOR Method Quick Screening (Petroleum Solutions, 2010)
3.3. Screening using EOR analysis:
EOR analysis is a software built by project team and IT engineer, using visual basic
environment. The routine is based on 2010 society of petroleum engineer’s paper entitled
“Recent Developments and Updated Screening Criteria of Enhanced Oil Recovery
Techniques” by Ahmad Aladasani and Baojun Bai. With this program, the user can quickly
screen oil field to determine the suitable EOR method/s. Fifteen methods of enhanced oil
recovery are available using nine properties: (API, Gravity, Porosity, and Oil saturation,
Formation, Thickness, Permeability, Depth and Temperature). EOR analysis software is
designed to make the selection of enhanced oil recovery method, easier and quicker. The flow
chart of the software illustrated in figure 3.9.

- 47 -
START
Input Properties: Gravity, Oil Viscosity, Porosity, Oil
Saturation, Formation, Thickness. Permeability, Depth,
Temperature
IF the
property in
range
NO YES
y = 0
And fill the box with Red
color
X = 1
And fill the box with Green
color
Percentage = 𝑋 ×100
𝑋+𝑦 %
IF the
Percentage
= 100 %
YES NO
END
‘’ PASS’’ “Not Recommended”
Fig. 3.9: EOR Analysis Flow Chart

- 48 -
Fig. 3.10: EOR Analysis Program
3.3.1. Microsoft Visual Studio:
Microsoft Visual Studio is an integrated development environment (IDE) from
Microsoft. It is used to develop computer programs for Microsoft Windows, as well as
websites, web applications and web services. Visual Studio uses Microsoft software
development platforms such as Windows API, Windows Forms, Windows Presentation
Foundation, Windows Store, and Microsoft Silverlight. It can produce both native code and
managed code.
Visual Studio support different programming language and allows the code editor. Visual
Studio features including code editor, debugger, designer and other tools
3.3.2. Applications of the program:
1- Quickly screen suitable EOR methods for each reservoir based on its properties
2- The program runs the visual basic applications and imports the results back into the
application
3- Technical screening can made by this program not economical screening.
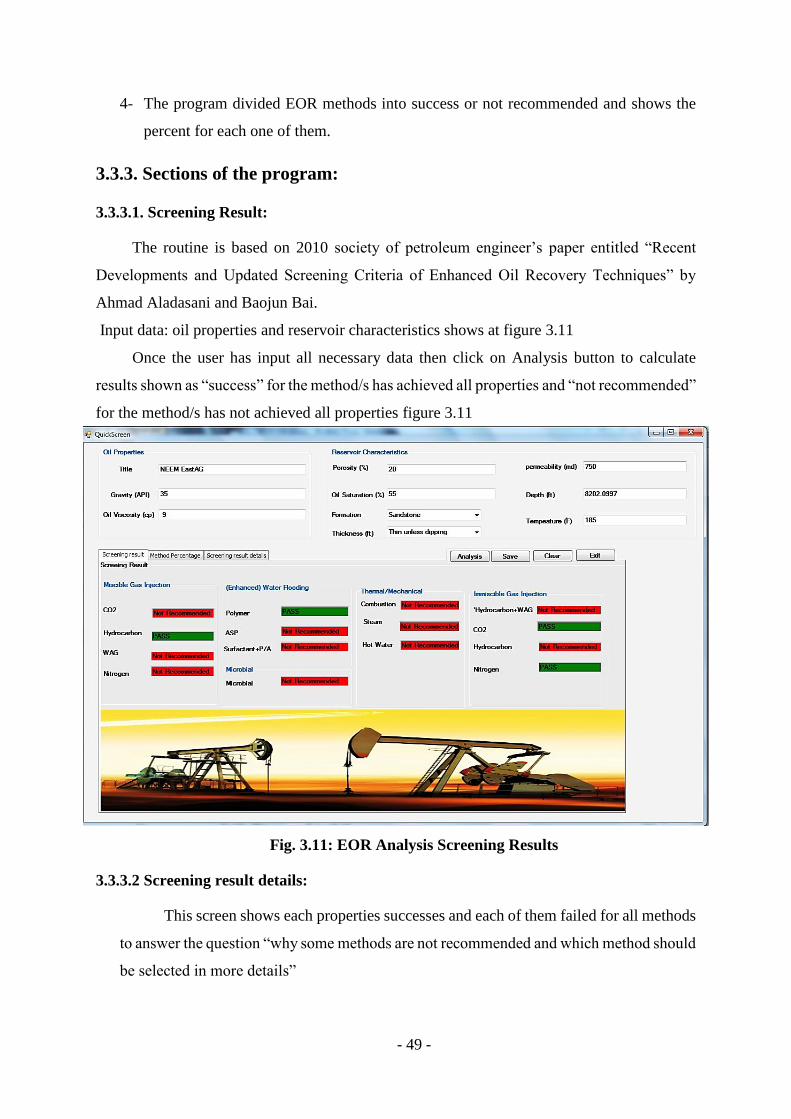
- 49 -
4- The program divided EOR methods into success or not recommended and shows the
percent for each one of them.
3.3.3. Sections of the program:
3.3.3.1. Screening Result:
The routine is based on 2010 society of petroleum engineer’s paper entitled “Recent
Developments and Updated Screening Criteria of Enhanced Oil Recovery Techniques” by
Ahmad Aladasani and Baojun Bai.
Input data: oil properties and reservoir characteristics shows at figure 3.11
Once the user has input all necessary data then click on Analysis button to calculate
results shown as “success” for the method/s has achieved all properties and “not recommended”
for the method/s has not achieved all properties figure 3.11
Fig. 3.11: EOR Analysis Screening Results
3.3.3.2 Screening result details:
This screen shows each properties successes and each of them failed for all methods
to answer the question “why some methods are not recommended and which method should
be selected in more details”

- 50 -
If a cell is colored red then this criteria is not met, whereas if a cell is colored green then
the criteria is met, whereas if the cell is colored white then the criteria is not critical as
shown in figure (3.12).
Fig. 3.12: EOR Analysis Screening Results Details
3.3.3.3. Methods Percentage:
This screen shows (figure 3.13) the percent of each method based on the properties have
been achieved by it, for example if only four properties have been achieved from the nine
properties thus the percent is calculated as follows:
Percentage = 4
9 × 100 % = 44%
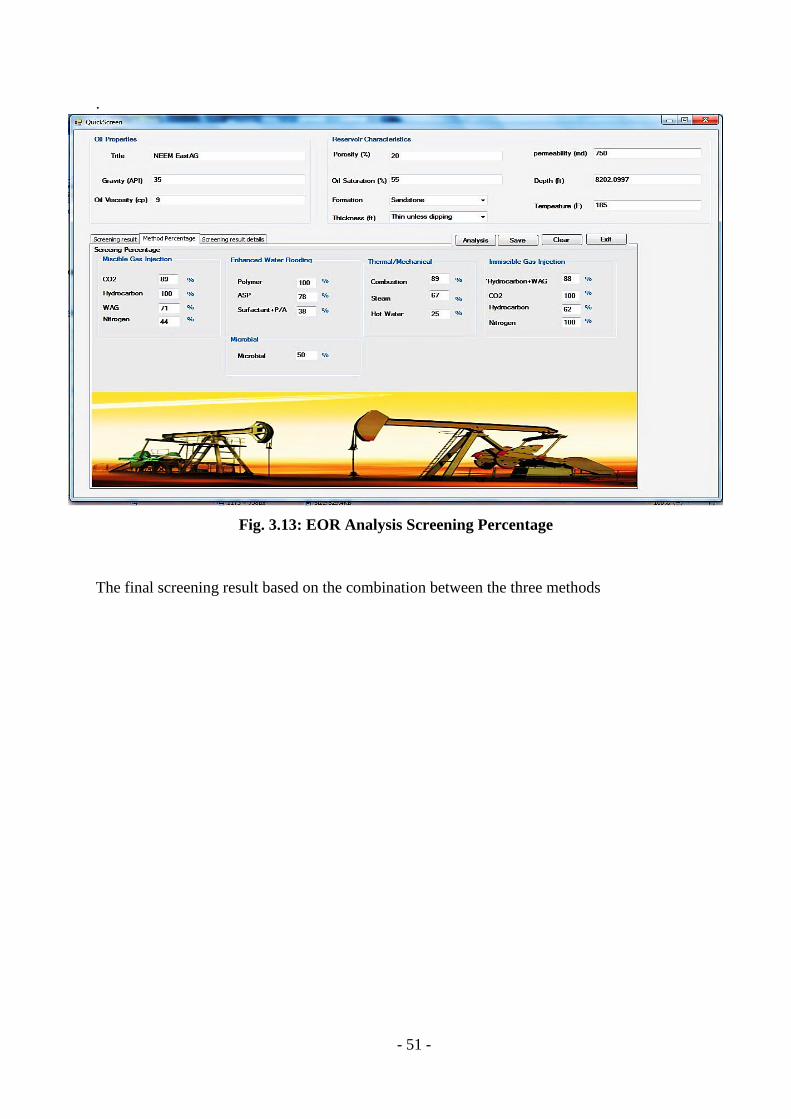
- 51 -
.
Fig. 3.13: EOR Analysis Screening Percentage
The final screening result based on the combination between the three methods

- 52 -
Chapter 4
Results and Discussion
In this chapter, data illustrated in table (4.1) was processed by using the three methods
that discussed in previous chapter.
In addition, the results, which were obtained from the technical screening, have been
summarized in table (4.2) and these results have been discussed individually for each method.

- 53 -
Table 4.1: DATA of Greater Neem Field
parameter NEEM Main NEEM K NEEM F NEEM East NEEM North
Reservoir Aradeiba Bantiu AG Amal AG AG Aradieba Bantiu AG Bantiu AG
Depth (mKB) 1800 2000 2400 750 2550 3100 1800 2100 2500 1800 2100
Initial pressure, (psi) 2300 2600 3300 1800 3200 4100 2565 2700 3200 2400 2900
Current pressure, (psi) 1850 1900 2500 1200 2440 2900 2000 1980 2350 1758 2
Temperature. degC 70 75 88 53 91 102 71 78 85 76 86
Porosity, friction 0.19 0.23 0.18 0.31 0.19 0.15 0.19 0.23 0.20 0.26 0.20
Permeability, mD 200-300 1500-2000 300-600 1000-1300 300-600 600-1000 200-300 1000-1500 600-900 4000-6000 400-900
Oil gravity, Deg API 27 32 40-44 15 38 41 25 33 35 28 21
Viscosity, CP 17 2.2-4 2-6 10 1-3 3-5 18 2-7 9 12 15
Oil FVF, rb/STB 1.03 1.04 1.08-1.6 1.01 1.08 1.1 1.03 1.05 1.2 1.05 1.08
Net pay, m 5-6 6-9 4-8 12 7-9 6-8 4-5 5-10 3-8 5.5-9 4-9
Oil saturation, friction 0.45 0.56 0.59 0.69 0.60 0.58 0.49 0.56 0.55 0.67 0.66

- 54 -
4.1. Neem Main
4.1.1. Neem Main-AG
1- Screening using SPE format:
Fig. 4.1: Screening Using SPE Format for Neem Main-Ag
Suitable EOR methods are :
1-Miscible CO2
2-Miscible HC
3-Polymer

- 55 -
2- Screening using EORgui:
Fig. 4.2: Screening Using EORgui for Neem Main-Ag
Suitable EOR methods are:
1- Chemical methods group(Micellar/Polymer,ASP,Alkaline) has a higher percentage
with (91%)
2- Immisible method in second order with (83%)
3- Combustion in third order with (75%)
4- Carbon dioxide in forth order with (60%)

- 56 -
3- Screening Using EOR Analysis:
Fig. 4.3: Screening Using EOR Analysis for Neem Main-Ag
Suitable EOR methods are: (Miscible HC, Immiscible N2, and Polymer),
Miscible CO2, Immiscible CO2.

- 57 -
4.1.2. Neem Main-Aradeiba
1- Screening Using SPE Format:
Fig. 4.4: Screening Using SPE Format for Neem Main-Aradeiba
Suitable EOR methods are:
1-Miscible CO2
2-Chemical (Alkaline, Polymer)

- 58 -
2- Screening using EORgui:
Fig. 4.5: Screening Using EORgui for Neem Main-Aradeiba
Suitable EOR methods are:
1-Immisible method has a higher percentage (83%)
2- Chemical methods group(Micellar/Polymer,ASP,Alkaline) in second order with
(73%)
3- Combustion in third order with (67%)
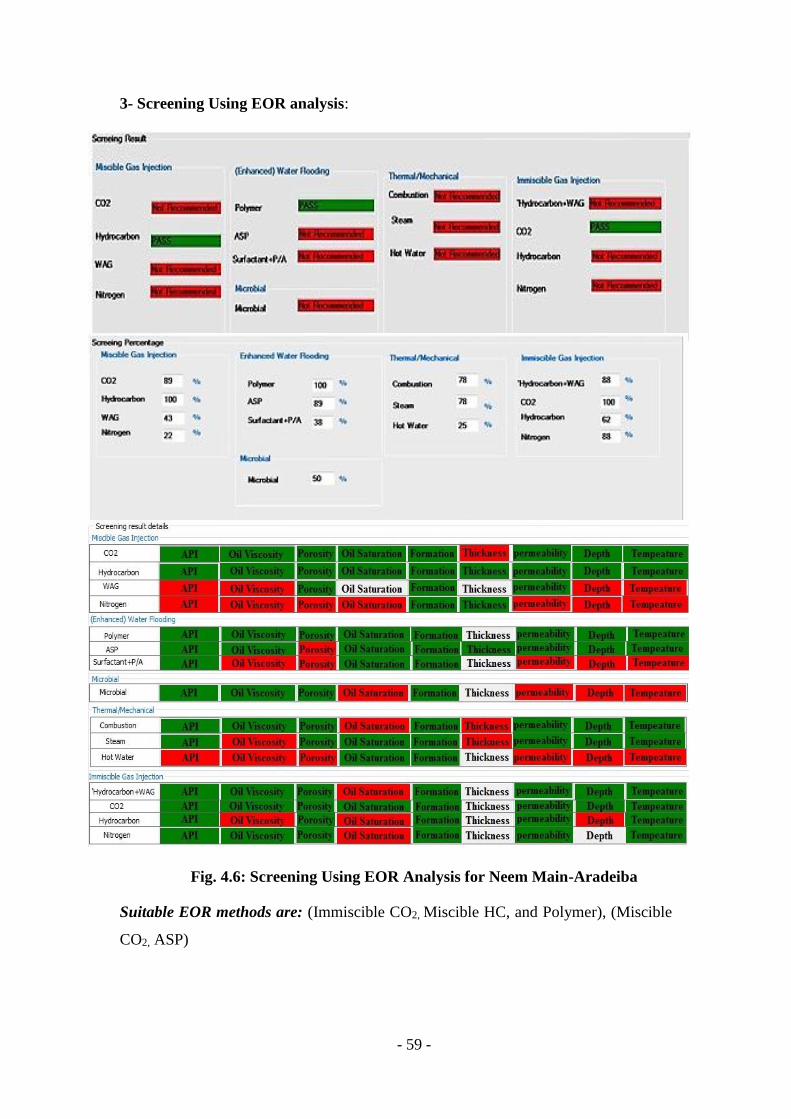
- 59 -
3- Screening Using EOR analysis:
Fig. 4.6: Screening Using EOR Analysis for Neem Main-Aradeiba
Suitable EOR methods are: (Immiscible CO2, Miscible HC, and Polymer), (Miscible
CO2, ASP)
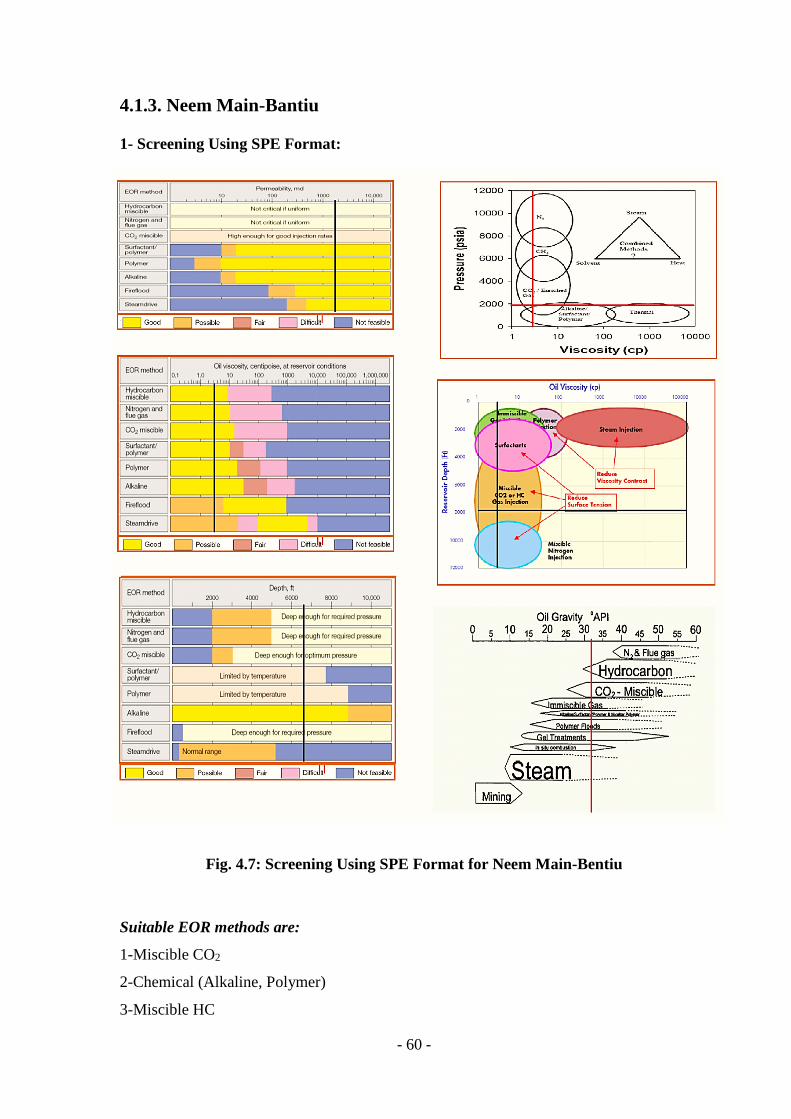
- 60 -
4.1.3. Neem Main-Bantiu
1- Screening Using SPE Format:
Fig. 4.7: Screening Using SPE Format for Neem Main-Bentiu
Suitable EOR methods are:
1-Miscible CO2
2-Chemical (Alkaline, Polymer)
3-Miscible HC

- 61 -
2- Screening Using EORgui:
Fig. 4.8: Screening Using EORgui for Neem Main-Bentiu
Suitable EOR methods are:
1- Chemical methods group(Micellar/Polymer,ASP,Alkaline) has a higher percentage
with (91%)
2- Immisible method in second order with (83%)
3- Combustion in third order with (75%)
4- Polymer and Steam in forth order with (60%)

- 62 -
3- Screening Using EOR Analysis:
Fig. 4.9: Screening Using EOR Analysis for Neem Main-Bentiu
Suitable EOR methods are: (Miscible HC, Immiscible N2, Polymer),(Miscible CO2 ,
Combustion), Immiscible CO2.

- 63 -
4.2. Neem East
4.2.1. Neem East-AG
1- Screening using SPE format:
Fig. 4.10: Screening Using SPE Format for Neem East –Ag
Suitable EOR methods are:
1-Miscible CO2
2-Chemical (Alkaline, Polymer)
3-Miscible HC

- 64 -
2- Screening Using EORgui:
Fig. 4.11: Screening Using EORgui for Neem East-Ag
Suitable EOR methods are:
1- Chemical methods group (Micellar/Polymer,ASP,Alkaline) has a higher
percentage with (91%)
2- Immisible method in second order with (83%)
3- Combustion in third order with (75%)
4- Steam in forth order with (60%)

- 65 -
3- Screening Using EOR analysis:
Fig. 4.12: Screening Using EOR Analysis for Neem East - Ag
Suitable EOR methods are: (Miscible HC, Immiscible N2, Polymer, and Immiscible
CO2), (Combustion, Miscible CO2)

- 66 -
4.2.2. Neem East Arardeiba
1- Screening using SPE Format:
Fig. 4.13: Screening Using SPE Format for Neem East Aradeiba
Suitable EOR methods are:
1-Chemical (Alkaline, Polymer)
2- Miscible CO2
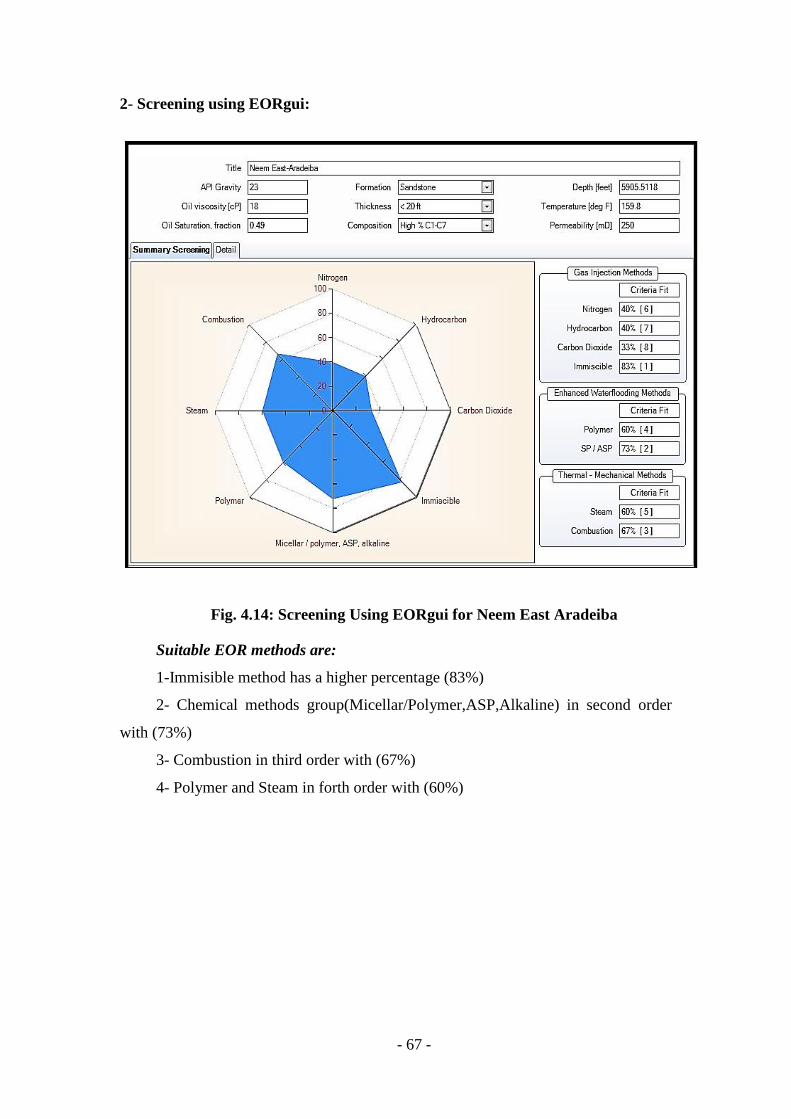
- 67 -
2- Screening using EORgui:
Fig. 4.14: Screening Using EORgui for Neem East Aradeiba
Suitable EOR methods are:
1-Immisible method has a higher percentage (83%)
2- Chemical methods group(Micellar/Polymer,ASP,Alkaline) in second order
with (73%)
3- Combustion in third order with (67%)
4- Polymer and Steam in forth order with (60%)

- 68 -
3- Screening using EOR Analysis
Fig. 4.15: Screening Using EOR Analysis for Neem East- Aradeiba
Suitable EOR methods are: (Miscible HC, Immiscible N2, Polymer, and Immiscible
CO2), (ASP, Miscible CO2), (Combustion, Steam)

- 69 -
4.2.3. Neem East- Bantiu
1- Screening using SPE Format:
Fig. 4.16: Screening Using SPE Format for Neem East-Bentiu
Suitable EOR methods are:
1-Miscible CO2
2-Chemical (ASP, Alkaline)
3-Miscible HC

- 70 -
2- Screening Using EORgui:
Fig. 4.17: Screening Using EORgui for Neem East- Bentiu
Suitable EOR methods are:
1- Chemical methods group(Micellar/Polymer,ASP,Alkaline) has a higher
percentage with (91%)
2- Immisible method in second order with (83%)
3- Combustion in third order with (75%)
4- Steam and Polymer in forth order with (60%)

- 71 -
3- Screening Using EOR Analysis:
Fig. 4.18: Screening Using EOR Analysis for Neem East- Bentiu
Suitable EOR methods are: (Miscible HC, Immiscible N2, and Polymer),
Miscible CO2, Combustion, and Immiscible CO2

- 72 -
4.3. NEEM K
4.3.1. NEEM K- AG
1- Screening using SPE format:
Fig. 4.19: Screening Using SPE Format for Neem K-Ag
Suitable EOR methods are:
1-Miscible CO2
2- Miscible HC
3-Alkaline

- 73 -
2- Screening using EORgui:
Fig. 4.20: Screening Using EORgui for Neem K-Ag
Suitable EOR methods are:
1- Chemical methods group(Micellar/Polymer,ASP,Alkaline) has a higher
percentage with (91%)
2- Immisible method in second order with (83%)
3- Combustion in third order with (75%)
4- Carbon dioxide in forth order with (67%)

- 74 -
3- Screening using EOR analysis:
Fig. 4.21: Screening Using EOR Analysis for Neem K-Ag
Suitable EOR methods are: (Miscible HC, Immiscible N2, and Polymer),
(Miscible CO2, Combustion), Immiscible CO2

- 75 -
4.3.2. Neem K-Amal
1- Screening using SPE Format:
Fig. 4.22: Screening Using SPE Format for Neem K-Amal
Suitable EOR methods are chemical (Alkaline, Polymer)

- 76 -
2- Screening using EORgui:
Fig. 4.23: Screening Using EORgui for Neem K-Amal
Suitable EOR methods are:
1- Chemical methods group(Micellar/Polymer,ASP,Alkaline) has a higher
percentage with (100%)
2- Immisible method in second order with (83%)
3- Steam in third order with (80%)
4- Combustion in forth order with (67%)

- 77 -
3- Screening using EOR analysis:
Fig. 4.24: Screening Using EORAnalysis for Neem K-Amal
Suitable EOR methods are: Polymer, Combustion, Immiscible CO2, and Steam

- 78 -
4.4. Neem F:
4.4.1. Neem F-AG:
1- Screening using SPE format:
Fig. 4.25: Screening Using SPE Format for Neem F-Ag
Suitable EOR methods are:
1-Miscible CO2
2-Miscible HC
3-Alkaline

- 79 -
2- Screening using EORgui format:
Fig. 4.26: Screening Using EORgui for Neem Main F-Ag
Suitable EOR methods:
1- Chemical methods group(Micellar/Polymer,ASP,Alkaline) has a higher
percentage with (91%)
2- Immisible method in second order with (83%)
3- Combustion in third order with (75%)
4- Carbon dioxid in forth order with (60%)

- 80 -
3- Screening using EOR analysis:
Fig. 4.27: Screening Using EOR Analysis for Neem Main F-Ag
Suitable EOR methods are: (Miscible HC, Immiscible N2), Miscible CO2,
Polymer, and Combustion

- 81 -
4.5. Neem North:
4.5.1. Neem North -AG
1- Screening using SPE format:
Fig. 4.28: Screening Using SPE Format for Neem North-Ag
Suitable EOR methods are:
1-Chemical (Alkaline, Polymer)
2-Miscible (CO2, HC)

- 82 -
2- Screening using EORgui:
Fig. 4.29: Screening Using EORgui for Neem North-Ag
Suitable EOR methods are:
1-Immisible method has a higher percentage (83%)
2- Chemical methods group(Micellar/Polymer,ASP,Alkaline) in second order
with (82%)
3- Combustion in third order with (75%)
4- Polymer and Steam in forth order with (60%)

- 83 -
3- Screening using EOR analysis:
Fig. 4.30: Screening Using EOR Analysis for Neem North-Ag
Suitable EOR methods are: Polymer, (Immiscible CO2, Immiscible N2), (Miscible HC,
ASP, Combustion)

- 84 -
4.5.2. Neem North Bentui
1- Screening using SPE format:
Fig 4.31: Screening Using SPE format for Neem North Bentui
Suitable EOR methods are:
1- Alkaline
2- Polymer, Miscible CO2

- 85 -
2- Screening using EORgui:
Fig. 4.32: Screening Using EORgui for Neem North-Bentui
Suitable EOR methods are:
1- Chemical methods group(Micellar/Polymer,ASP,Alkaline) has a higher
percentage with (100%)
2- Immisible method in second order with (83%)
3- Combustion in third order with (75%)
4- Steam and Polymert in forth order with (67%).

- 86 -
3. Screening using EOR analysis:
Fig. 4.33: Screening Using EOR Analysis for Neem North-Bentui
Suitable EOR methods are (Miscible HC, Polymer), ASP, Combustion, Immiscible
CO2, Miscible CO2

- 87 -
Table 4.2: Results Obtained From SPE Format, EORgui and EOR Analysis
Field Name Formation SPE Format EORgui EOR Analysis
Neem Main
AG
1-Miscible CO2
2-Miscible HC
3-Polymer
1-Chemical (Micellar/polymer, ASP, Alkaline)
2-Immiscible
3-Combustion
4- Miscible CO2
1-(Miscible HC, Immiscible N2, Polymer)
2-Miscible CO2
3-Immiscible CO2
Aradeiba
1-Miscible CO2
2-Chemical (Alkaline,
Polymer)
1-Immiscible
2-chemical (Micellar/polymer, ASP, Alkaline)
3-Combustion
4- Polymer & Steam
1-(Immiscible CO2, Miscible HC, Polymer)
2-(Miscible CO2, ASP)
Bentiu
1-Miscible CO2
2-Chemical (Alkaline,
Polymer)
3-Miscible HC
1-chemical (Micellar/polymer, ASP, Alkaline)
2-Immiscible
3-Combustion
4-Polymer & Steam
1-(Miscible HC, Immiscible N2, Polymer)
2-(Miscible CO2 , Combustion)
3-Immiscible CO2
Neem K
AG
1-Miscible CO2
2- Miscible HC
3-Alkaline
1-Chemical (Micellar/polymer, ASP, Alkaline)
2-Immiscible
3-Combustion
4-Miscible CO2
1-(Miscible HC, Immiscible N2, Polymer)
2-(Miscible CO2 , Combustion)
3-Immiscible CO2
Amal
Chemical (Alkaline,
Polymer)
1-chemical (Micellar/polymer, ASP, Alkaline)
2-Immiscible
3-Steam
4-Combustion
1-Polymer
2-Combustion
3-Immiscible CO2
4-Steam

- 88 -
Neem F
AG
1-Miscible CO2
2-Miscible HC
3-Alkaline
1-chemical (Micellar/polymer, ASP, Alkaline)
2-Immiscible
3-Combustion
4-Miscible CO2
1-(Miscible HC, Immiscible N2)
2-Miscible CO2
3-Polymer
4-Combustion
Neem East
AG
1-Miscible CO2
2-Chemical (Alkaline,
Polymer)
3-Miscible HC
1-chemical (Micellar/polymer, ASP, Alkaline)
2-Immiscible
3-Combustion
4-Steam
1-(Miscible HC, Immiscible N2, Polymer,
Immiscible CO2)
2-(Combustion, Miscible CO2)
Aradeiba
1-Chemical (Alkaline,
Polymer)
2- Miscible CO2
1-Immiscible
2-chemical (Micellar/polymer, ASP, Alkaline),
3-Combustion
4-Polymer & Steam
1-(Miscible HC
2-Immiscible N2, Polymer, Immiscible CO2)
3-(ASP, Miscible CO2)
4-(Combustion, Steam)
Bentiu
1-Miscible CO2
2-Chemical (ASP,
Alkaline)
3-Miscible HC
1-chemical (Micellar/polymer, ASP, Alkaline)
2-Immiscible
3-Combustion
4-Steam & Polymer
1-(Miscible HC, Immiscible N2, Polymer)
2-Miscible CO2
3-Combustion
4-Immiscible CO2
Neem North
AG
1-Chemical (Alkaline,
Polymer)
2-Miscible (CO2, HC)
1-Immiscible
2-chemical (Micellar/polymer, ASP, Alkaline)
3-Combustion, Polymer & Steam
1-Polymer
2-(Immiscible CO2, Immiscible N2)
3-(Miscible HC, ASP, Combustion)
Bentiu
1-Alkaline
2-Polymer, Miscible CO2
1-chemical (Micellar/polymer, ASP, Alkaline)
2-Immiscible
3-Combustion, Polymer & Steam
1-(Miscible HC, Polymer)
2-ASP
3-Combustion
4-Immiscible CO2
5-Miscible CO2
- 89 -
Discussion:
1. A steep dipping reservoir is preferred to permit some stabilization of displacing front
in gas methods.
2. Generally, miscible methods give good results at low viscosity and high permeability.
3. Depth must be high enough to required pressure in case of miscible methods to form
MMP.
4. For good CO2 injection rate the permeability should be high enough.
5. Relatively homogenous formation is preferred in chemical methods.
6. Chemical methods except alkaline limited by temperature and depth (Degradation of
surfactant and polymer at high temperature).
7. To apply thermal methods porosity must be high to minimize heat losses in the rock
matrix.
8. Thermal methods used for heavy oil.
9. Steam injection limited to shallow reservoir to limit heat loss.
10. HC injection needs uniform reservoirs and low viscosi

- 90 -
Chapter 5
Conclusion and Recommendation
5.1. Conclusion:
The suitable EOR methods for Greater Neem Field based on the combination of results
obtained by EORgui, EOR analysis and manual method by using SPE format curves shown at
table 5.1.
Table 5.1. Suitable EOR Methods for Greater Neem
EOR method
Neem Main
AG Immiscible N2, Miscible CO2, Polymer
Aradeiba Immiscible CO2, Miscible CO2, Polymer
Bentiu Miscible CO2, Immiscible (CO2, N2), Polymer
Neem K AG Miscible CO2, Immiscible (CO2, N2), Polymer
Amal Polymer, Immiscible CO2, Combustion & Steam
Neem F AG Miscible CO2, Polymer, Immiscible N2
Neem East
AG Immiscible (CO2, N2), Polymer, Combustion
Aradeiba Immiscible (CO2, N2), Polymer, Miscible CO2 & Combustion
Bentiu Immiscible (CO2, N2), Polymer, Combustion, Miscible CO2
Neem North AG Polymer, Miscible CO2, Immiscible (CO2, N2)
Bentiu Polymer, Immiscible CO2 , Combustion,
From table (5.1) The suitable EOR methods for Greater Neem reservoirs are: polymer,
CO2 injection (Immiscible or miscible). CO2 injection (Immiscible or miscible) are effective in
term of cost because the availability of CO2 in Neem field.
MMP calculated based on reservoir temperature from (Ahmed, T., 2007) as:
MMP = 15.988 × T × (0.7744206 + 0.0011038 × MWC5+)
Where:
T : Temperature in oF
MWC5+ : Molecular weight of pentanes and heavier fractions of the oil
- 91 -
5.2. Recommendations:
1. Through the results and discussion obtained in this research, the following
recommendations have been signed:
2. The following step after the technical screening is economical screening process to
come up with the most cost effective method. This process should include;
availability of injected fluid, cost of equipment, remaining oil and recovery factor
by the method…etc.
3. It is recommended to conduct lab analysis for the selected EOR process.
4. The final step required is implementing pilot test to achieve high verification in order
to apply the method in the whole field.
5. In case of the MMP is greater than formation break down pressure (Pbd), reservoir
pressure should be supported by using water flooding to avoid formation fracture.
6. water flooding can be done by using one injection well or more and there are many
factors must be studied carefully before selecting well/s location including: reservoir
uniformity and pay continuity, reservoir geometry and depth, fluid properties and
saturations, lithology and rock properties and reservoir driving mechanisms
7. The program can be improved by adding other functions to it for example: Draw
curves related any method with its percentage, Alter screening criteria to update the
program with most recent criteria because it is based on field application that does
not stop.
8. It is recommended to permit more cooperation between university and petroleum
companies to provide the actual field data needed.

- 92 -
References:
1. Ahmed, T., 2010. Reservoir Engineering Hand book. 4td ed. Houston: Gulf
Professional Publishing
2. Ahmed, T., 2007. Equation of State and PVT Analysis: Application for
Improved Reservoir Modeling. Houston: Gulf Professional Publishing
3. Akzonobel Surface Chemistry,2006.Enhanced Oil Recovery (EOR) Chemicals
and Formulations.PP(1-6)
4. Aladasani, A., and Bai, B., 2010. Recent Development and updated Screening
Criteria of Enhanced Oil Recovery Techniques .Beijing: SPE paper 130726.
5. Asimon and Schuster Company Englewood Cliffs, 1992. Applied Enhanced Oil
Recovery. New Jersey: Prentice-Hall inc 07632
6. Barrufet, M.A., 2001. Introduction to Enhanced Oil Recovery (EOR) Methods.
Class Notes for PETE 609 – Module
7. David, H., 2009, Training course enhanced oil recovery modeling. Khartoum:
Sudapet Co. Ltd
8. Green, D.W., and Willhite, G.P., 1998. Enhanced Oil Recovery. Texas: Society
of Petroleum Engineers
9. Kleppe, et al., 1992.Recent Advances in Improved Oil Recovery Methods for
North Sea Sandstone. Stavanger: Norwegian Petroleum Diredorate.
10. Oil Exploration and Production Administration (OEPA).2014
11. OPEC, 2009 Enhanced Oil Recovery. Kwait: OPEC
12. Pwaga, S.et al, 2010. Comparative Study of Different EOR Methods.
Trondheim: Norwegian University of Science and Technology
13. Taber, J.J., Martin, F.D. and Seight, R.S.,1997. EOR screening criteria
revisited-Part1,Oklahoma U.S.A.: SPE paper 35385.
14. Taber, J.J., Martin, F.D. and Seight, R.S.,1997. EOR screening criteria
revisited-Part2,Oklahoma U.S.A.: SPE paper 39234.
15. Teknica, 2001, Enhanced Oil Recovery. Alberta: Teknica Petroleum Services
Ltd
16. Terry, R.E.,2001, Enhanced Oil Recovery, Brigham: Brigham Young
University
17. www.eia.gov/countries/cab.cfm?fips=su

- 93 -
18. www.ogj.com/articles/print/volume-108/issue-33/exploration-
_development/southern-secession.html
19. www.petroleumsolutions.co.uk/eorguimain.html
20. www.sudapet.com