International energy R&D spillovers and the economics of greenhouse gas atmospheric stabilization
31
INTERNATIONAL ENERGY R&D SPILLOVERS AND THE ECONOMICS OF GREENHOUSE GAS ATMOSPHERIC STABILIZATION VALENTINA BOSETTI CARLO CARRARO EMANUELE MASSETTI MASSIMO TAVONI CESIFO WORKING PAPER NO. 2151 CATEGORY 8: RESOURCES AND ENVIRONMENT NOVEMBER 2007 An electronic version of the paper may be downloaded • from the SSRN website: www.SSRN.com • from the RePEc website: www.RePEc.org • from the CESifo website: Twww.CESifo-group.org/wpT
-
Upload
independent -
Category
Documents
-
view
2 -
download
0
Transcript of International energy R&D spillovers and the economics of greenhouse gas atmospheric stabilization

INTERNATIONAL ENERGY R&D SPILLOVERS AND THE ECONOMICS OF GREENHOUSE GAS
ATMOSPHERIC STABILIZATION
VALENTINA BOSETTI CARLO CARRARO
EMANUELE MASSETTI MASSIMO TAVONI
CESIFO WORKING PAPER NO. 2151 CATEGORY 8: RESOURCES AND ENVIRONMENT
NOVEMBER 2007
An electronic version of the paper may be downloaded • from the SSRN website: www.SSRN.com • from the RePEc website: www.RePEc.org
• from the CESifo website: Twww.CESifo-group.org/wp T

CESifo Working Paper No. 2151
INTERNATIONAL ENERGY R&D SPILLOVERS AND THE ECONOMICS OF GREENHOUSE GAS
ATMOSPHERIC STABILIZATION
Abstract It is widely recognized that technological change has the potential to reduce GHG emissions without compromising economic growth; hence, any better understanding of the process of technological innovation is likely to increase our knowledge of mitigation possibilities and costs. This paper explores how international knowledge flows affect the dynamics of the domestic R&D sector and the main economic and environmental variables. The analysis is performed using WITCH, a dynamic regional model of the world economy, in which energy technical change is endogenous. The focus is on disembodied energy R&D international spillovers. The knowledge pool from which regions draw foreign ideas differs between High Income and Low Income countries. Absorption capacity is also endogenous in the model. The basic questions are as follows. Do knowledge spillovers enhance energy technological innovation in different regions of the world? Does the speed of innovation increase? Or do free-riding incentives prevail and international spillovers crowd out domestic R&D efforts? What is the role of domestic absorption capacity and of policies designed to enhance it? Do greenhouse gas stabilization costs drop in the presence of international technological spillovers? The new specification of the WITCH model presented in this paper enables us to answer these questions. Our analysis shows that international knowledge spillovers tend to increase free-riding incentives and decrease the investments in energy R&D. The strongest cuts in energy R&D investments are recorded among High Income countries, where international knowledge flows crowd out domestic R&D efforts. The overall domestic pool of knowledge, and thus total net GHG stabilization costs, remain largely unaffected. International spillovers, however, are also an important policy channel. We therefore analyze the implication of a policy mix in which climate policy is combined with a technology policy designed to enhance absorption capacity in developing countries. Significant positive impacts on the costs of stabilising GHG concentrations are singled out. Finally, a sensitivity analysis shows that High Income countries are more responsive than Low Income countries to changes in the parameters and thus suggests to focus additional empirical research efforts on the former.
JEL Code: H4, O3, Q4.
Keywords: climate policy, energy R&D, international R&D spillovers, stabilization.
Valentina Bosetti Carlo Carraro
Emanuele Massetti Massimo Tavoni
Fondazione Eni Enrico Mattei Campo S. Maria Formosa, Castello 5252
Italy – 30122 Venice [email protected]
First Draft: November 10th, 2006. This version: July, 6th. 2007 This paper is part of the research work being carried out by the Climate Change Modelling and Policy Research Programme of the Fondazione Eni Enrico Mattei and by the Climate Impacts and Policy Division of the EuroMediterranean Center on Climate Change. Financial support from the Italian Ministry of the Environment is gratefully acknowledged. The authors are also grateful to participants at the 9th
IAEE Conference, Florence, 11-
13 June 2007, for helpful comments. The usual disclaimer applies.
1. Introduction
It is now widely recognized that technological change has the potential to reduce GHG
emissions without generating negative feedbacks on economic growth. This is one of the
reasons behind the many efforts recently devoted to the development of Integrated Economy-
Climate Models, in which technological change is endogenous and responds to market and
policy incentives. Significant improvements in the estimate of optimal abatement paths and
costs have thus been achieved. In particular, by disentangling the determinants of knowledge
accumulation, and linking them to incentives arising from emission targets, it is now possible to
measure how climate policy-induced technical change reduces the costs of atmospheric
stabilization (Grubb, Carraro and Schellnhuber, 2006). However, despite this encouraging
progress, the knowledge accumulation processes are still unclear, and the actual potential of
technological innovation is far from being fully understood.
For example, a few studies on the economics of atmospheric stabilization have addressed the
role of international knowledge flows in the process of knowledge production and
accumulation.1 The transfer of knowledge across countries is instead crucial in shaping the
diffusion of new technologies and in spreading basic scientific developments that gradually
foster technological innovation in places different from where they were originally conceived.
This is of central importance if we consider that new technologies are created and developed in
a handful of countries, and that still greater concentration is recorded for the expenditure on
energy R&D. However, despite its concentrated origin, knowledge clearly flows across
countries: developing economies import goods and services that embody the technological
progress made in the laboratories of richer countries, and are increasingly exposed to the flow of
knowledge that circulates among world research laboratories, the so-called disembodied
knowledge flows. There is also a rich exchange of knowledge among industrialized countries,
that often participate in joint research agreements to share the costs and risks of the most
expensive projects.2 It is therefore crucial to understand how knowledge flows across countries
1 In Buonanno, Carraro e Galeotti (2003) the world stock of knowledge affects productivity of the energy input and reduces the emission output ratio. Gerlagh and Kuik (2003) use a static general equilibrium model to analyze the effect of endogenous technical change and international technology diffusion on carbon leakage. Kemfert (2005) contains some attempts to account for international technology spillovers across countries via capital flows in a general equilibrium model. Some improvements are contained in Gerlagh (2006), again within a CGE framework. 2 A good example is ITER, a joint international research and development project that aims to demonstrate the scientific and technical feasibility of fusion power. The partners in the project are the European Union, Japan, the People´s Republic of China, India, the Republic of Korea, the Russian Federation and the USA.
2
in order to correctly assess by how much and at what cost technological change can increase
energy efficiency and lower carbon intensity worldwide.
The idea of reducing atmospheric stabilization costs by filling the knowledge gap between
countries with more technological cooperation is very attractive indeed, and has been
emphasized by several authors (e.g. Barrett, 1994, 2002; Carraro and Siniscalco, 1994; Grubb,
Hope and Fouquet, 2002; Philibert, 2004; Buchner et al, 2005). On these grounds, any policy
aimed at increasing the circulation of world knowledge should be promoted. For example, favor
treatment could be dispensed to knowledge flows, disclosure of sensitive information could be
encouraged and joint development programs could be financed to increase knowledge sharing
and the productivity of R&D efforts. These proposals have also captivated the interest of policy
makers: the basic idea of knowledge transfers is at the core of the recent Asia-Pacific agreement
on climate change control.
However, the enhanced circulation of ideas and the free dissemination of technological
innovation throughout the world does not necessarily imply that total global innovation will
increase and abatement costs decrease. Several obstacles have been identified (Cf. Carraro,
2001 for a survey). For example, a given country may not have the capacity to absorb the flow
of ideas and research results coming from other countries. Knowledge from international
spillovers may crowd out domestic R&D efforts. Free-riding incentives may induce some
countries to reduce their own expenditures in Research and Development. The basic questions
are therefore as follows. Do knowledge spillovers enhance energy technological innovation in
different regions of the world? Do spillovers increase R&D expenditures? Or do free-riding
incentives prevail and international spillovers crowd out domestic R&D efforts? What is the
role of domestic absorption capacity and of policies designed to enhance it? And finally, do
greenhouse gas stabilization costs drop in the presence of international technological spillovers?
The new model specification presented in this paper enables us to answer these questions.
We address both researchers and policy makers by discussing modelling issues and analysing
possible cost reductions achievable by greater knowledge diffusion. Our exploration of the role
of international knowledge spillovers will be based on a new version of WITCH, a dynamic
regional model of the world economy, in which energy technical change is endogenous and
free-riding incentives from R&D spillovers and other sources are also accounted for. Although
embodied technology transfers play an important role in spreading technical know-how across
the world, we focus our analysis on disembodied knowledge spillovers, i.e. on the positive
3

externality that emerges from the exposure to foreign patents, scientists, laboratories and
blueprints.3
In this paper, we disentangle three main issues that a modeler faces when dealing with
international knowledge spillovers: first, the size and the characteristics of the international
knowledge pool from which each country picks ideas to implement at home has to be defined.
From another perspective, are knowledge stocks cumulated in different countries heterogeneous
or homogeneous, and if they are a mix, to what degree do they overlap? Second, the process of
knowledge absorption: are spillovers a "manna from heaven" that indiscriminately falls in each
country, regardless of its degree of technological development, or is some domestic effort
necessary to absorb foreign knowledge? Third, how do spillovers interact with the domestic
knowledge production sector? Do patents, blueprints produced abroad substitute those
discovered at home?
Unfortunately, the limited empirical work on energy efficiency R&D spillovers does not
provide us with clear indications on the most appropriate model specification.4 We therefore
make and compare some reasonable assumptions on absorption capacity, on the available
international knowledge pool, and on the interactions between international spillovers and the
domestic R&D sector. These assumptions are then integrated into the equations of the WITCH
model. This is then used to analyze how costs and benefits of GHG stabilisation policy are
affected by the presence of international R&D spillovers, to define the impact of international
spillovers on domestic R&D efforts, and to determine what policy can be designed to enhance
the dissemination of energy-saving technologies.
The rest of the paper is structured as follows: Section 2 briefly introduces the WITCH model
and discusses our modeling of R&D spillovers. Section 3 presents the calibration results, a new
baseline, and analyses the dynamics of stabilization investments in R&D when international
spillovers are explicitly modeled. In this section, we also present our new results on the costs
and benefits of GHG stabilization policy. Section 4 discusses a policy mix in which climate
policy is combined with an R&D incentive scheme designed to enhance the absorption capacity
in developing countries, and thus the dissemination of new energy technologies. Section 5
shows the main outputs of our sensitivity analysis. A concluding section summarizes our results.
3 For the role of trade in spreading technological knowledge see Keller (1997), Coe and Helpman (1995), Eaton and Kortum (1996). 4 See Lanjouw and Mody (1996) for an analysis of innovation and international diffusion of environmental responsive technology.
4

2. The WITCH model
2.1 Short model description
WITCH – World Induced Technical Change Hybrid – is a regional integrated assessment model
structured to provide normative information on the optimal responses of world economies to
climate damages. It is a hybrid model because it combines features of both top-down and
bottom-up modeling: the top-down component consists of an inter-temporal optimal growth
model in which the energy input of the aggregate production function has been integrated into a
bottom-up like description of the energy sector. World countries are grouped in 12 regions that
strategically interact when determining their optimal policies. A game theoretic framework is
adopted to capture these strategic interactions. A climate module and a damage function provide
the feedback on the economy of carbon dioxide emissions into the atmosphere.
WITCH top-down framework guarantees a coherent, fully intertemporal allocation of
investments that have an impact on the level of mitigation – R&D effort, investments in energy
technologies, fossil fuel expenditures. The regional specification of the model and the presence
of interdependencies among regions – through CO2, exhaustible natural resources, trade and
technological spillovers – allows us to account for the incentives to free-ride. By solving an
open-loop Nash game, the investment strategies are optimized taking into account both
economic and environmental externalities.
WITCH contains a detailed representation of the energy sector, which allows the model to
produce a reasonable characterization of future energy and technological scenarios and an
assessment of their compatibility with the goal of stabilizing greenhouse gases concentrations.
In addition, by endogenously modeling fuel (oil, coal, natural gas, uranium) prices, as well as
the cost of storing the CO2 captured, the model can be used to evaluate the implication of
mitigation policies on the energy system in all its components. In the next subsections, we focus
on the representation of technical change; for a thorough description of the model, see Bosetti et
al. (2006) and Bosetti, Massetti and Tavoni (2007).
2.2 Endogenous Technical Change (ETC) in the WITCH model
Energy-related technical change is endogenous in WITCH. Thanks to the hybrid nature of the
model, we portray endogenous technological change both in its bottom-up and top-down
dimensions: R&D investments designed to enhance energy-efficiency increase the productivity
5
of energy inputs in generating energy services; growing expertise driven by Learning-by-Doing
(LbD) reduces the cost of power generation plants.
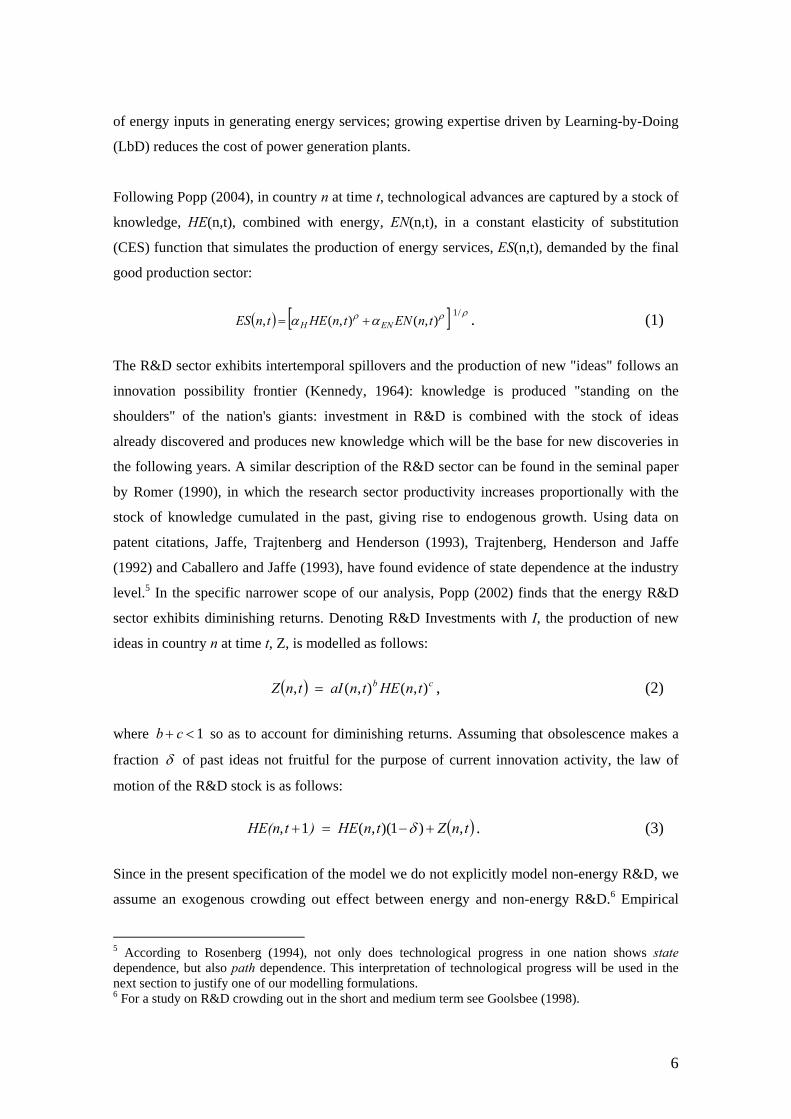
Following Popp (2004), in country n at time t, technological advances are captured by a stock of
knowledge, HE(n,t), combined with energy, EN(n,t), in a constant elasticity of substitution
(CES) function that simulates the production of energy services, ES(n,t), demanded by the final
good production sector:
( ) [ ρρρ αα/1
),(),(, tnENtnHEtnES ENH += ] . (1)
The R&D sector exhibits intertemporal spillovers and the production of new "ideas" follows an
innovation possibility frontier (Kennedy, 1964): knowledge is produced "standing on the
shoulders" of the nation's giants: investment in R&D is combined with the stock of ideas
already discovered and produces new knowledge which will be the base for new discoveries in
the following years. A similar description of the R&D sector can be found in the seminal paper
by Romer (1990), in which the research sector productivity increases proportionally with the
stock of knowledge cumulated in the past, giving rise to endogenous growth. Using data on
patent citations, Jaffe, Trajtenberg and Henderson (1993), Trajtenberg, Henderson and Jaffe
(1992) and Caballero and Jaffe (1993), have found evidence of state dependence at the industry
level.5 In the specific narrower scope of our analysis, Popp (2002) finds that the energy R&D
sector exhibits diminishing returns. Denoting R&D Investments with I, the production of new
ideas in country n at time t, Z, is modelled as follows:
( ) cb tnHEtn aI tnZ ),(),(, = , (2)
where so as to account for diminishing returns. Assuming that obsolescence makes a
fraction
1<+ cb
δ of past ideas not fruitful for the purpose of current innovation activity, the law of
motion of the R&D stock is as follows:
( )tnZtn HE) tHE(n ,)1)(,(1, +−=+ δ . (3)
Since in the present specification of the model we do not explicitly model non-energy R&D, we
assume an exogenous crowding out effect between energy and non-energy R&D.6 Empirical
5 According to Rosenberg (1994), not only does technological progress in one nation shows state dependence, but also path dependence. This interpretation of technological progress will be used in the next section to justify one of our modelling formulations. 6 For a study on R&D crowding out in the short and medium term see Goolsbee (1998).
6
studies have shown that the returns to higher investments in R&D are four times higher than
those for general investment, thus the total cost of energy R&D investments is as in equation
(4):
)(4),(),(& ntItnIntCOST DR ψ+= . (4)
Where ψ is the crowding out parameter which measures how many dollars of generic R&D
investment are lost per each dollar of energy R&D investment. We set 5.0=ψ as in Popp
(2004).
2.3. International R&D Spillovers
Researchers do not only stand on the shoulders of their predecessors but also on those of their
neighbours.7 Knowledge flows across countries, either embodied in traded goods or
disembodied, in blueprints, patents, exchange of ideas between researchers, and imitation. We
concentrate here on disembodied knowledge spillovers. Being WITCH a multiregional model,
we can accommodate for the effect of disembodied knowledge spillovers by introducing a
transmission channel across energy R&D sectors in each region. Thus, the implications of these
spillovers for investments in the creation of new ideas, climate policy costs and energy demand
can all be analysed.
Unfortunately, the empirical analysis of international spillovers induced by energy-saving R&D
investments is almost nonexistent and it is thus not possible to derive useful modeling insights
from the available empirical research. After comparing several alternative specifications of the
equations representing technology spillovers in the model, here is the one that we propose as the
most reliable. Countries/regions are exposed to a pool of world knowledge that can be
considered as a global public good. A fraction of this knowledge is absorbed by each country
and is available for use in the domestic R&D sector. Different assumptions can be made on (1)
the characteristics of world knowledge, on (2) the process of absorption and on (3) the way in
which countries use this available information. We follow this three-step approach to highlight
the most relevant issues and to illustrate our modelling choices.
7 See Chapter 11 in Rosenberg (1982).
7
2.4 International Knowledge Pool
We consider two distinct views of the pool of international knowledge. In the first,
technological development is seen as a process in which all countries move upwards on the
same knowledge ladder, with the least technologically advanced lying at the bottom and the
technological innovator at the top; each region has a distinct position along the ladder at any
time. Only knowledge still not possessed (in its possess) is attractive. Innovators receive scarce
or no benefit from exposure to international knowledge while laggards harvest substantial gains.
This was the view of technological progress put forward by Gerschenkron (1962) in his famous
essay Economic Backwardness in Historical Perspective: by adopting frontier technologies,
backward countries could catch up with advanced economies at a relatively fast pace. More
recently, the idea of knowledge that trickles down from the technological frontier to the
technological laggards was explored by Acemoglu, Aghion and Zilibotti (2006).
In our second description of world knowledge, we assume that countries move, at least partially,
along independent technological patterns, and thus all external knowledge adds new insights to
the domestic knowledge capital. Rosenberg (1994), in his second exploration of technological
development, argues that indeed the technological development of countries tends to follow
specific patterns influenced by the sequence of particular events which constitutes the history of
the system. According to this view, the very same history of countries, their different regulatory
regimes, and their economic and social environments, are drivers of technological
differentiation. Indeed, for energy technologies we record a similar pattern of R&D and
technology discoveries, and a clear example of path-dependent technological progress is the
success of the wind industry in Europe. When technologies tend to diverge, spillovers are a
great source of benefit because they fill in important gaps that might otherwise remain
unexplored.
According to the first view, the knowledge pool accessible to each region is provided by the
technology that lies unexplored between its own and the innovator’s knowledge stock, whereas
according to the second view, the knowledge pool equals the overall amount of world
knowledge detained by other countries. Both these two representations of the pool of ideas
available to each country capture some interesting and important features of the process of
technology diffusion. In our analysis, we assume that the first view prevails in Low Income
countries. Therefore, for Low Income countries, the absorption of knowledge from the
innovator is the prevailing effect to model, i.e. the Gerschenkron effect. The second view, i.e.
8

the situation described by Rosenberg with heterogeneous capital stocks, is to be preferred for
High Income countries.
We combine these two different representations in one single formulation by assuming that the
technological frontier is set not only by a single innovator but by the whole group of High
Income countries, i.e. that the technological frontier is measured by the sum of the stocks of
R&D capital detained by these countries. High Income countries may draw from the knowledge
stock of all other High Income countries, while the Low Income countries’ knowledge pool
consists of the knowledge accumulated in the more advanced economies (those setting the
world’s technological frontier). For Low Income countries, we describe the process of
technological advancement as an upward movement along a technology ladder; the gap to fill is
measured by the difference between each country’s R&D capital stock and the technological
frontier capital. At high levels of technological development, however, countries specialize in
different energy R&D paths and thus they have the opportunity to benefit from all other High
Income countries’ R&D stocks, which constitute the knowledge pool. By assuming a
technological frontier determined by more than one country, we avoid the case of one single
world leader, which cannot absorb any valuable knowledge from its followers, which is highly
unrealistic when not dealing with a specific industry. If we define HI as the set of High Income
Countries, equation (5) describes the knowledge pool for all n countries:
( ) ( ) ( )tnHEtnHEtnKPHIn
,,, −=∑ ∈ , (5)
where HE is the regional stock of knowledge as defined in equation (3).
2.5 Knowledge Absorption
Moving to the second logical step, we assume that only a fraction ),( tnγ of the world’s
available pool of knowledge is absorbed by each country. The absorption parameter γ might be
an indicator of industrial policy or of the legal environment, or a measure of some effort to
absorb international knowledge. We consider γ as being primarily a function of domestic
knowledge. In this we follow Cohen and Levinthal (1989), who were the first to suggest that the
process of learning, far from being free, is costly and that most of this cost is borne by a stock of
knowledge cumulated in the receiving country. Keller (2004) reinforces this position in his
survey of international knowledge spillovers by showing that an R&D effort is needed to absorb
international knowledge. By means of an empirical analysis of spillovers across OECD
manufacturing industries, Kneller (2005) finds that absorptive capacity, rather than physical
9

distance, plays an important role in determining the amount of knowledge transfers at the
international level. Also Griffith, Redding and Van Reenen (2003) find that R&D increases the
absorption of knowledge spillovers and that neglecting this "second face" of knowledge
investments necessarily leads to an underestimation of R&D's social rate of return. Accordingly,
we assume that the absorption capacity ),( tnγ is a function of the distance of R&D capital
accumulated in the region with respect to the technological frontier. We use the ratio of one
country’s capital stock to the technological frontier as an indicator of this distance, as shown in
equation (6):
( )( )∑ ∈
=HIn
tnHEtnHEtn
,,),(γ . (6)
The further one country lies from the technological frontier, the lesser this country is able to
absorb knowledge from the potentially available international knowledge pool. In words, the
lack of laboratories, scientific bodies, investments in R&D in Low Income countries is a serious
obstacle to the profitable use of the knowledge that circulates in the world. The low absorptive
capacity of Low Income countries realistically reduces the potentially very large inflow of
knowledge from the technological frontier in determining the overall amount of knowledge
spillovers. More in general, also High Income Countries may see their absorptive capacity
decline over time if they do not innovate at the same pace of their advanced partners. This is
indeed true for all technological breakthroughs that completely change the paradigms in a
discipline: even if close to the frontier, countries lagging behind might fail to reap any benefit
from these new discoveries.
Accordingly, the spillover of international knowledge in region n at time t, , is
obtained by multiplying the Knowledge Pool and the absorption capacity:
( tnSPILL , )
( ) ( )( )
( ) ( ) ( )[ tnHEtnHEtjHE
tnHEtnKPtntnSPILL
HInHIn
,,,
,,,),(
−= ]⋅=
∑∑ ∈∈
γ (7)
Notice that spillovers are a bell-shaped function of the country’s R&D capital stock. For Low
Income countries, the peak of the curve lies halfway from the technological frontier. Spillovers
are thus first increasing and then decreasing along the transition from low to high level of
technological progress. For High Income countries, spillovers are increasing until the capital
10
stock of one country is equal to the sum of the capital stocks of all the other High Income
countries.
2.6 Spillover Use
The third and final step consists in defining how countries use the spillover in their process of
knowledge generation. We assume that spillovers enter the domestic R&D sector as an input in
the innovation possibility frontier. Thanks to this highly standardized aggregation of different
production inputs we can control for the elasticity of the production of new ideas to
international R&D spillover, i.e. the coefficient d in equation (8) below:8
( ) ( ) ( )dcbDR tnSPILLtnHEtnIn a tnZ ,),(),(, &= . (8)
2.7 Synthesis
In the previous sub-sections, we described the logical steps that have been followed to introduce
international energy R&D spillovers in the WITCH model. There is a variety of other available
options that were considered and explored. However, the one chosen is the strongest from a
theoretical point of view, and it has the advantage of being tractable and easily understandable,
while capturing the most interesting effects at work.
Notice that in our framework the public good features of the knowledge pool are somehow
mitigated. Were knowledge a fully global public good, the incentive to free-riding would
dominate, regions would invest less in technology R&D and the overall production of
knowledge would shrink.9 On the contrary, by giving knowledge a role in the process of
knowledge absorption and by letting international R&D spillover augment the productivity of
domestic investment, we have introduced forces that work against the free-riding incentive. This
is in accordance with the literature on knowledge spillovers. As an example, Cohen and
Levinthal (1989) have shown that when domestic R&D increases absorption capacity and some
general conditions hold, the incentive to invest more in R&D offsets the disincentive
represented by free-riding, and world investments in R&D eventually increase.
8 For an analogous aggregation of spillovers to domestic investment and capital stock see Acemoglu (2002), p. 793. 9 The standard result that sees free-riding effects to dominate has also been questioned by D’Aspremont and Jacquemin (1988), who show how, in a cooperative setting with strong knowledge flows, spillovers induce higher overall investment in R&D due to the full internalization of positive externalities.
11

3. Calibration, New Baseline and the Effects of Spillovers on GHG Stabilization
Summing up, the new equation that describes the process of technology creation in country n at
time t is as follows:
( ) ( )( )
( ) ( )[d
HInHIn
cbDR tnHEtnHE
tnHEtnHEtnHEtnaI tnZ
⎪⎭
⎪⎬⎫
⎪⎩
⎪⎨⎧
−= ∑∑ ∈∈
,,,
,),(),(, & ] (9)
We set the parameter d to be equal to 0.15, i.e. an increase of 1% of international spillovers
increases the output of domestic ideas by 0.15%. Since, to our knowledge, there is no empirical
evidence that attributes the value of the elasticity of knowledge generation to international
spillovers, we have chosen here a value slightly lower than the elasticity of knowledge
production to domestic investments (equal to 0.18), and about one third of the elasticity with
respect to past capital stock, which is equal to 0.53 in the model without spillovers. Thus, we
give priority to domestic investments in generating new discoveries, and we assume that
intertemporal knowledge spillovers are stronger than the international ones. The effects and the
robustness of this choice will be tested through an appropriate sensitivity analysis (see Section
5).
We calibrated the new production function so as to reproduce the same time path of the R&D
capital stock without international spillovers; this also yields exactly equal paths for output and
all energy variables and a very similar time path for R&D investments. Calibration was
performed by reducing c in equation (9) so as to accommodate for the new input. By explicitly
modelling international spillovers, we can separate the two "standing on shoulders" effects and
attribute a correct nationality to the "giants" on which present researchers stand. Decreasing
returns to scale are preserved. New values for parameter c are country- and time-specific.
We tested the above modeling choices by computing the costs and benefits of a 450 stabilization
policy, i.e. a policy aimed at stabilizing atmospheric CO2 concentrations at 450ppmv (550ppmv
when considering all gases) at the end of the 21st century. We computed the effects of this
stabilization policy both with and without international energy R&D spillovers.
In the WITCH model, the group of High Income countries is composed by USA, OLDEURO,
NEWEURO, KOSAU (Korea, South Africa and Australia), CAJANZ (Canada, Japan, New
12
Zeland), while all other regions are labeled as Low Income.10 A world ceiling on emissions
across the century is derived consistently from the stabilization target and emission allowances
are distributed across world regions according to the Sovereignty rule, i.e. each year regions
receive a fraction of permits equal to their share of world emissions in the base year 2002. This
distribution scheme is, of course, highly questionable, but it offers the grounds for studying
policies to redistribute the effort of stabilization from Low Income to High Income countries.
The latter may design policies to compensate Low Income countries for any distribution of
permits that is considered inequitable, as will be shown in Section 4. A world carbon market
equalizes marginal abatement costs worldwide.11
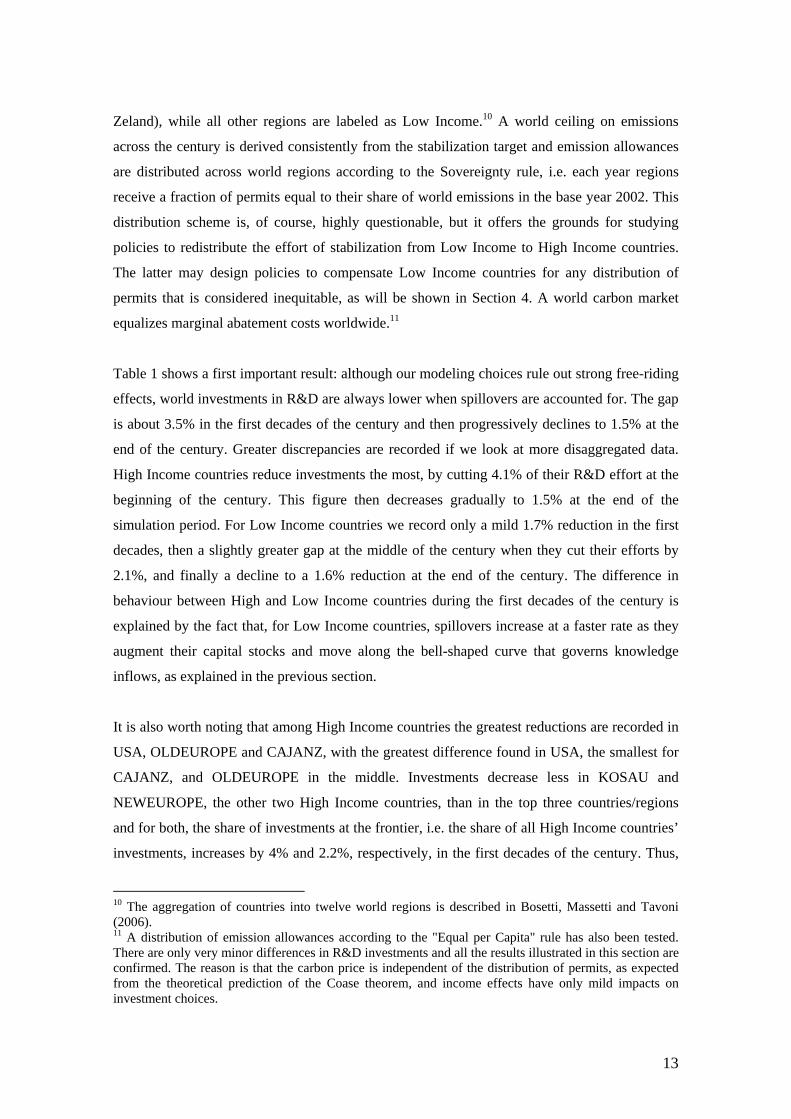
Table 1 shows a first important result: although our modeling choices rule out strong free-riding
effects, world investments in R&D are always lower when spillovers are accounted for. The gap
is about 3.5% in the first decades of the century and then progressively declines to 1.5% at the
end of the century. Greater discrepancies are recorded if we look at more disaggregated data.
High Income countries reduce investments the most, by cutting 4.1% of their R&D effort at the
beginning of the century. This figure then decreases gradually to 1.5% at the end of the
simulation period. For Low Income countries we record only a mild 1.7% reduction in the first
decades, then a slightly greater gap at the middle of the century when they cut their efforts by
2.1%, and finally a decline to a 1.6% reduction at the end of the century. The difference in
behaviour between High and Low Income countries during the first decades of the century is
explained by the fact that, for Low Income countries, spillovers increase at a faster rate as they
augment their capital stocks and move along the bell-shaped curve that governs knowledge
inflows, as explained in the previous section.
It is also worth noting that among High Income countries the greatest reductions are recorded in
USA, OLDEUROPE and CAJANZ, with the greatest difference found in USA, the smallest for
CAJANZ, and OLDEUROPE in the middle. Investments decrease less in KOSAU and
NEWEUROPE, the other two High Income countries, than in the top three countries/regions
and for both, the share of investments at the frontier, i.e. the share of all High Income countries’
investments, increases by 4% and 2.2%, respectively, in the first decades of the century. Thus,
10 The aggregation of countries into twelve world regions is described in Bosetti, Massetti and Tavoni (2006). 11 A distribution of emission allowances according to the "Equal per Capita" rule has also been tested. There are only very minor differences in R&D investments and all the results illustrated in this section are confirmed. The reason is that the carbon price is independent of the distribution of permits, as expected from the theoretical prediction of the Coase theorem, and income effects have only mild impacts on investment choices.
13

our results show that spillovers enhance convergence among countries at the frontier, as detailed
in Table 2.
2022 2042 2062 2082 2102USA -5.2% -4.2% -3.3% -2.6% -1.8%OLDEURO -3.8% -3.2% -2.6% -2.1% -1.4%NEWEURO -0.3% -0.5% -0.5% -0.5% -0.4%KOSAU -2.0% -1.9% -1.7% -1.4% -1.0%CAJAZ -3.3% -2.8% -2.2% -1.8% -1.2%TE -1.0% -1.3% -1.3% -1.2% -0.9%MENA -2.2% -2.5% -2.5% -2.4% -2.0%SSA 0.6% -0.3% -0.4% -0.4% -0.4%SASIA -1.2% -1.7% -1.8% -1.7% -1.3%CHINA -1.8% -2.4% -2.4% -2.2% -1.7%EASIA -1.4% -1.9% -2.0% -1.9% -1.5%LACA -2.0% -2.2% -2.1% -1.9% -1.4%WORLD -3.5% -2.9% -2.5% -2.0% -1.5%HIGH INCOME -4.1% -3.4% -2.7% -2.1% -1.5%LOW INCOME -1.7% -2.1% -2.1% -2.0% -1.6%
Table 1. Reduction of R&D Investments when Spillovers are Modeled.
2022 2042 2062 2082 2102USA -1.2% -0.9% -0.7% -0.5% -0.3%OLDEURO 0.3% 0.2% 0.1% 0.1% 0.0%NEWEURO 4.0% 3.0% 2.2% 1.6% 1.1%KOSAU 2.2% 1.5% 1.0% 0.7% 0.4%CAJAZ 0.8% 0.6% 0.4% 0.3% 0.2%
Table 2. Variation of Share of High Income Countries Investments.
Among Low Income countries, we record reductions in investments for all countries except for
SSA (Sub-Saharan Africa) that slightly increases its investments when spillovers are introduced.
However, as shown in Table 3, during the first decades of the century, reductions are inferior to
those recorded for High Income countries and thus their share of world R&D between 2002 and
2032 increases, ranging from 4.3% for SSA to 1.3% for MENA (Middle East and North Africa).
As a group, Low Income countries increase their share of world investments between 2002 and
2082 and slightly invert the trend at the end of the century.
Summing up, our results show some convergence in R&D investments shares among High
Income countries. As a group, these countries lose grounds in favour of Low Income countries
14

in the first decades of the century. Hence, our formulation of international R&D Spillovers
captures the convergence process from multiple perspectives. It must also be stressed that these
results are obtained within a stabilization scenario in which, even without spillovers, there is a
high degree of convergence in R&D investments and capital stocks across world regions.
International spillovers thus reinforce an already strong underlying convergence process.12
Changes in the stock of R&D are instead negligible. International knowledge inflows substitute
domestic investments and the cuts are spread across the economy. In addition, energy R&D
expenditures at the end of the century, when they are at their highest level, range from 0.12% to
0.02% of GDP, respectively, for USA and SSA. Therefore, the change induced by spillovers is
small in absolute terms. As a consequence, gains in terms of stabilization costs are also
negligible. As an example, over the whole century, the USA save 72 USD Billions over a
cumulated GDP of more than 2100 Trillions in our stabilization scenario, i.e. a modest 0.003%.
Given that the stock of domestic R&D changes only slightly, and that we do not record any
significant effect of spillovers on the available income, there is also no adjustment in the
investment in all energy technologies, and the price of emissions permits does not vary when
spillovers are introduced.
2022 2042 2062 2082 2102USA -1.8% -1.3% -0.9% -0.6% -0.3%OLDEURO -0.3% -0.3% -0.1% 0.0% 0.1%NEWEURO 3.4% 2.6% 2.0% 1.6% 1.1%KOSAU 1.6% 1.1% 0.8% 0.6% 0.5%CAJANZ 0.2% 0.2% 0.2% 0.3% 0.3%TE 2.6% 1.7% 1.1% 0.8% 0.6%MENA 1.3% 0.4% -0.1% -0.3% -0.5%SSA 4.3% 2.8% 2.1% 1.7% 1.2%SASIA 2.4% 1.3% 0.6% 0.3% 0.2%CHINA 1.7% 0.6% 0.1% -0.1% -0.2%EASIA 2.2% 1.1% 0.4% 0.1% 0.0%LACA 1.6% 0.8% 0.4% 0.2% 0.1%HI -0.6% -0.4% -0.2% -0.1% 0.0%LI 1.9% 0.9% 0.3% 0.1% -0.1%
Table 3. Variation of Share of World Investments in Energy R&D.
12 In order to control for differences between the two stabilization scenarios that might arise from small discrepancies between the baselines with and without spillovers, we have also compared the changes in investments in R&D induced by the stabilization policy with and without spillovers and we are able to confirm the results illustrated in the text.
15

4. GHG Stabilisation and Technology Diffusion. A Policy Exercise
Even though spillovers have a major impact on the amount and distribution of R&D
investments, but only a minor impact on energy investments and overall stabilization costs, they
may play an important role to shape investment and emission strategies. Assume indeed that a
set of countries decide to adopt an energy R&D policy to stimulate the development of a new
low-carbon energy technology. The overall effects of this policy can be properly assessed only
in a model with international spillovers, where the benefits of R&D investments are not limited
to the country where investments are made. As another example, consider a policy aimed at
increasing the circulation of world knowledge, indistinctly among regions or with a special
focus on some areas. This kind of policy intervention is frequently debated (Cf. Barrett, 2001)
and could be the core of a future GHG stabilization treaty (this is recommended, for example, in
the June 2007 Heiligendamm Summit Declaration). Again, the overall effects of such policy can
only be studied in models in which knowledge flows are explicitly modeled.
Let us analyse, in this paper, a third case, in which a 450 ppm stabilization policy, based on the
introduction of a global permit market, is coupled to a policy to foster knowledge dissemination.
Let us assume that emission permits are distributed according to the Sovereignty rule as in the
previous stabilization exercise. With such a distribution of emission permits – rather extreme
but often debated in the policy arena – complementary policies to alleviate the burden falling on
Low Income countries would be needed to redistribute the cost of stabilizing GHG
concentrations. R&D cooperation policies are certainly among the most promising tools to
attain this objective.
We consider here an R&D cooperation policy in which High Income countries use a fraction of
the revenues from emission permit sales to build absorption capacity in Low Income countries.
This is shown in equation (10), which modifies equation (9):
( ) ( )( )
( ) ( )[ ] LIntnHEtnHEtnHE
tnABStnHEtnHEtnaI tnZ
d
HInHIn
cbDR ∈∀
⎪⎭
⎪⎬⎫
⎪⎩
⎪⎨⎧
−⎥⎥
⎦
⎤
⎢⎢
⎣
⎡ += ∑
∑ ∈
∈
,,,
),(,),(),(, & (10)
where is the Low Income countries absorption capacity stock, which derives from the
flow of R&D cooperation aid, , coming from High Income countries. evolves
as shown in equation (11):
( tnABS , ))( )tAID ( tnABS ,
16
( ) ( )tAIDtnABStnABS +−=+ δ1),()1,( (11)
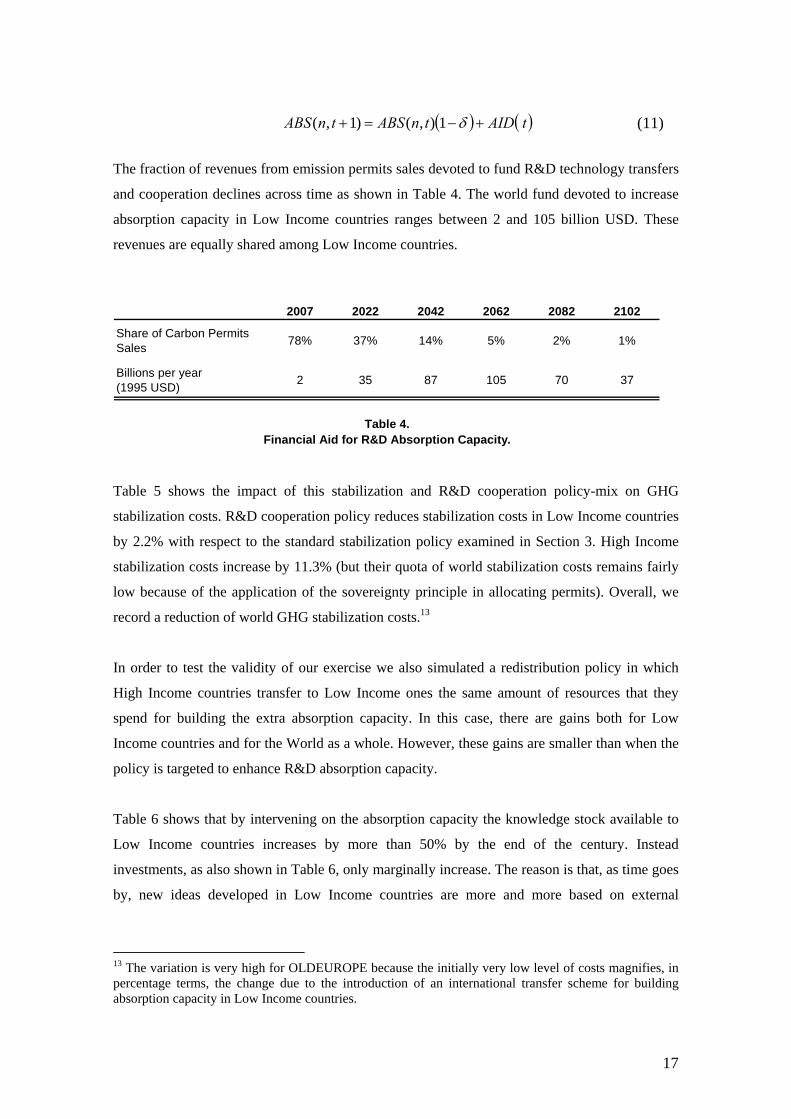
The fraction of revenues from emission permits sales devoted to fund R&D technology transfers
and cooperation declines across time as shown in Table 4. The world fund devoted to increase
bsorption capacity in Low Income countries ranges between 2 and 105 billion USD. These
revenues are equally shared among Low Income countries.
a
2007 2022 2042 2062 2082 2102
Share of Carbon Permits Sales 78% 37% 14% 5% 2% 1%
Billions per year(1995 USD) 2 35 87 105 70 37
Table 4.Financial Aid for R&D Absorption Capacity.
Table 5 shows the impact of this stabilization and R&D cooperation policy-mix on GHG
stabilization costs. R&D cooperation policy reduces stabilization costs in Low Income countries
by 2.2% with respect to the standard stabilization policy examined in Section 3. High Income
stabilization costs increase by 11.3% (but their quota of world stabilization costs remains fairly
w because of the application of the sovereignty principle in allocating permits). Overall, we
is case, there are gains both for Low
come countries and for the World as a whole. However, these gains are smaller than when the
and more based on external
lo
record a reduction of world GHG stabilization costs.13
In order to test the validity of our exercise we also simulated a redistribution policy in which
High Income countries transfer to Low Income ones the same amount of resources that they
spend for building the extra absorption capacity. In th
In
policy is targeted to enhance R&D absorption capacity.
Table 6 shows that by intervening on the absorption capacity the knowledge stock available to
Low Income countries increases by more than 50% by the end of the century. Instead
investments, as also shown in Table 6, only marginally increase. The reason is that, as time goes
by, new ideas developed in Low Income countries are more
13 The variation is very high for OLDEUROPE because the initially very low level of costs magnifies, in percentage terms, the change due to the introduction of an international transfer scheme for building absorption capacity in Low Income countries.
17

knowledge than on domestic effort. The economic gains are induced by this increased free flow
of knowledge, which comes at no cost for Low Income countries.
USA 13.06% 12.00%OLDEURO 210.76% 193.66%NEWEURO 0.39% 0.83%KOSAU 1.99% 2.38%CAJAZ 10.28% 9.55%TE -2.04% -2.43%MENA -2.72% -1.21%SSA -1.90% -5.10%SASIA -2.34% -1.43%CHINA -2.02% -1.11%EASIA -2.24% -1.21%LACA -2.46% -1.47%WORLD -0.67% -0.09%HIGH INCOME 11.33% 10.63%LOW INCOME -2.30% -1.55%
450 + R&D Absorption 450 + Transfer
Table 5. Change of Stabilization Costs.
450 + Transfer450 + R&D Absorption 450 + Transfer
USA 0% 0% -1% 0%OLDEURO 0% 0% -1% 0%NEWEURO 0% 0% -1% 0%KOSAU 0% 0% -1% 0%CAJAZ 0% 0% -1% 0%TE 56% 0% 6% 0%MENA 46% 0% 3% 0%SSA 93% 0% 13% 0%SASIA 53% 0% 4% 0%CHINA 46% 0% 3% 0%EASIA 53% 0% 4% 0%LACA 47% 0% 3% 0%WORLD 25% 0% 1% 0%HIGH INCOME 0% 0% -1% 0%LOW INCOME 52% 0% 4% 0%
R&D Capital at 2102 R&D Investments(Cumulative, 2002-2102)
450 + R&D Absorption
Table 6.Change of R&D Capital and R&D Investments
when Absorption Capacity Building Policy is Implemented.
18

The above analysis of the combined stabilization and R&D policy should be considered as a
realistic proxy of any policy under which the distribution of emission permits, or the abatement
effort, favours High Income countries and a set of re-distribution measures is therefore
necessary. Our analysis clearly shows that absorption capacity is a powerful channel through
in LI countries can be enhanced, and through this channel it is possible
to increase equity and achieve higher efficiency.
arameter d. With the lower bound, instead, we allow for a sufficiently low relevance of
for all values of the parameter d that were considered,
vestments in energy R&D in a 450ppmv stabilization scenario decline in almost all countries
e countries progresses over time, reaches its maximum before the end of the
entury, and then regresses to converge towards values similar to those found for High Income
its of the internationally available pool of technologies due to
which the capital stocks
5. Sensitivity Analysis.
As previously discussed, there is some uncertainty over the value to assign to the elasticity of
knowledge creation to international R&D spillovers. Therefore, we tested the robustness of our
findings to different values of this elasticity. We used a symmetric interval around the central
value of 0.15 by setting 0.20 and 0.10 as upper and lower bounds, respectively. With the upper
bound value, the elasticity of knowledge creation to international spillovers is greater than that
of domestic investments, whose value is 0.18. 0.20 is thus a considerably high level for the
p
international R&D spillovers by assuming that a one percent increase of foreign knowledge is
almost half as powerful as a one percent increase in domestic investment in creating new ideas.
Sensitivity analysis shows that
in
when spillovers are explicitly modeled (the only exception is SSA). This confirms the results
described in the previous section.
Figures 1 to 4 show, for different years, the relationship found between the parameter d and the
magnitude of cuts in energy R&D investments, with respect to the stabilization scenario without
spillovers. The strongest responses are recorded from High Income countries, but the sensitivity
of Low Incom
c
countries. For these countries we find instead a constantly declining responsiveness to spillovers
across time.
This implies that our model yields different reactions to spillovers as a function of the degree of
economic development (the level of knowledge accumulation). Initially, Low Income countries
find it difficult to reap the benef
19

their low absorption capacity; however, as their cumulated stock of knowledge increases, they
s
ome meaningful implications: empirical research should above all be addressed to estimate the
impact of energy R&D spillovers in High Income countries and the lack of reliable data on Low
Income countries should not be considered as a serious obstacle to perform model simulations.
substitute more and more easily foreign to domestic investments and become more reactive to
the foreign flows of knowledge.
Consider now the responsiveness of domestic investments to international spillovers in the first
half of the century. In case of "standing-on-shoulders" effects, as in WITCH, investments in the
next decades will be crucial to determine future knowledge stocks and energy intensities in the
subsequent decades. It is thus important to understand the effect of knowledge spillovers on
these early investments. We have seen that while Low Income countries investments’ decisions
are relatively rigid with respect to the degree of international spillovers, High Income countries
show a higher margin of variation, that ranges from -2.8% to -6% in 2012. This result bear
s
2022
-7%-6%-5%-4%-3%-2%-1%0%
0.10
0.11
0.12
0.
2012
-7%-6%-5%-4%-3%-2%-1%0%
0.10
0.11
0.12
0.13
0.
13 14 15 1614 15 16
0. 0. 0.17
0.18
0.19
0.20
WORLD OECD NONOECD
0. 0. 0. 0.17
0.18
0.19
0.20
WORLD OECD NONOECD
Figure 1. Figure 2.
2062
-7%-6%-5%-4%-3%-2%-1%0%
0.10
0.11
0.12
0.13
0.14
0.15
0.16
0.17
0.18
0.19
0.20
WORLD OECD NONOECD
2102
-7%-6%-5%-4%-3%-2%-1%0%
0.10
0.11
0.12
0.13
0.14
0.15
0.16
0.17
0.18
0.19
0.20
WORLD OECD NONOECD
Figure 3. Figure 4.
20
USA
-10.0%
-8.0%
-6.0%
-4.0%
-2.0%
0.0%2002 2022 2042 2062 2082 2102
CHINA
-3.5%-3.0%-2.5%-2.0%-1.5%-1.0%-0.5%0.0%
2002 2022 2042 2062 2082 2102
Figure 5. Figure 6.
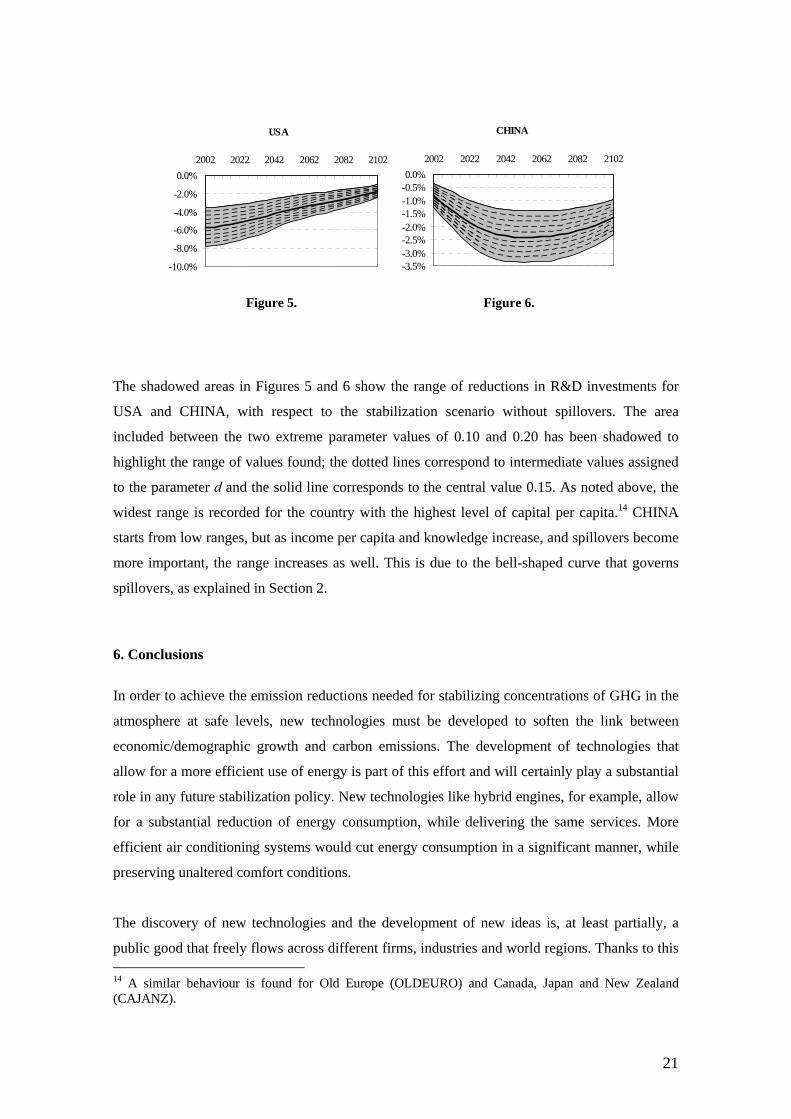
The shadowed areas in Figures 5 and 6 show the range of reductions in R&D investments for
USA and CHINA, with respect to the stabilization scenario without spillovers. The area
included between the two extreme parameter values of 0.10 and 0.20 has been shadowed to
highlight the range of values found; the dotted lines correspond to intermediate values assigned
to the parameter d and the solid line corresponds to the central value 0.15. As noted above, the
widest range is recorded for the country with the highest level of capital per capita.14 CHINA
starts from low ranges, but as income per capita and knowledge increase, and spillovers become
more important, the range increases as well. This is due to the bell-shaped curve that governs
spillovers, as explained in Section 2.
6. Conclusions
In order to achieve the emission reductions needed for stabilizing concentrations of GHG in the
atmosphere at safe levels, new technologies must be developed to soften the link between
economic/demographic growth and carbon emissions. The development of technologies that
allow for a more efficient use of energy is part of this effort and will certainly play a substantial
role in any future stabilization policy. New technologies like hybrid engines, for example, allow
for a substantial reduction of energy consumption, while delivering the same services. More
efficient air conditioning systems would cut energy consumption in a significant manner, while
preserving unaltered comfort conditions.
The discovery of new technologies and the development of new ideas is, at least partially, a
public good that freely flows across different firms, industries and world regions. Thanks to this 14 A similar behaviour is found for Old Europe (OLDEURO) and Canada, Japan and New Zealand (CAJANZ).
21
flow of ideas, the development of new technologies spreads across firms, industries and world
regions from an initially very narrow set of innovators. The development of new technologies is
concentrated in a few world regions, and international spillovers have a potential role to play in
assuring a wider diffusion of new discoveries. Greater knowledge flows will make it easier and
less costly to achieve energy efficiency gains.
This paper contributes to the literature on the costs of GHG stabilization by providing a first
assessment of the potential role of international knowledge flows in fostering the development
of new energy technologies. Disembodied international energy R&D spillovers are modeled in
the WITCH model. The amount of spillovers entering each world region depends on a pool of
freely available knowledge and on the ability of each country to benefit from it, i.e. on its
absorption capacity. Knowledge acquired from abroad combines with domestic capital stock
and investments and thus contributes to the production of new technologies at home.
We focused on the stabilization of world CO2 concentrations in the atmosphere at 450ppmv by
the end of the 21st century (550 ppmv when considering all gases) and showed that, when
international knowledge spillovers are explicitly modeled, optimal energy R&D investments are
lower than previously estimated. In particular, the strongest free-riding effects are recorded
among High Income countries. The reason lies in the higher exposure of these economies to the
international exchange of ideas, and thus on greater benefits in terms of potential investment
savings. However, thanks to spillovers, total knowledge stocks remain unchanged and the main
gain for each country is a lower expenditure in energy R&D. These savings are not negligible in
absolute terms, but are only a small share of the overall stabilization bill. The result is that
stabilization costs are slightly changed by endogenising international energy R&D spillovers.
Sensitivity analysis revealed that these findings are robust to a range of parameter values. High
income countries are more sensitive to variations of the parameters than Low Income countries,
especially in the first decades of the century. Given the lack of empirical evidence on the actual
role of international spillovers in the development of domestic technologies, it is worth
concentrating the efforts in studying knowledge dynamics in High Income countries.
Despite the above conclusions, this paper has achieved some policy relevant results.
International spillovers are indeed an important policy channel. This is why we focused our
analysis on a policy-mix in which a stabilization policy based on a global permit market is
coupled with a technology policy based on transfers designed to enhance the absorption
22

capacity in Low Income countries. The new model that we developed enabled us to assess the
implications of such policy-mix. Our results show that this policy-mix can reduce the costs of
stabilizing GHG emissions (and is more cost-effective than a stabilization policy alone). More
specifically, without policies targeted to enhance absorption capacity, the dissemination of
knowledge does not appear to contribute significantly to the achievement of ambitious
stabilization targets. Low Income countries have barriers that prevent them from absorbing
international knowledge spillovers. Hence, exchanges of ideas remains confined to High Income
countries, were the overwhelming majority of R&D investments takes place. However, even
with greater absorption capacity, the main effect is a substitution of foreign to domestic efforts,
as has been found optimal for High Income countries. Therefore, greater knowledge flows and
higher investments in absorption capacity in Low Income countries must necessarily be
combined with specific measures aimed at reducing free-riding incentives.
It is worth noting that during the 2007 G8 Summit at Heiligendamm, in Germany,
complementary-technology-agreement for contrasting climate change and increasing energy
security have been strongly advocated. The final Summit Declaration explicitly asks for
"unprecedented international cooperation" in developing new technologies.16 Our policy
exercise shows a previously disregarded possible area of policy intervention in the spirit of the
Heiligendamm Declaration.
16 Heiligendamm Summit Declaration, June 7, 2007, at Para. 43.
23

References Acemoglu, D. (2002), "Directed Technical Change," Review of Economic Studies, 69(4), 781—809.
Acemoglu, D., P. Aghion and F. Zilibotti (2006), "Distance to Frontier, Selection, and Economic Growth," Journal of the European Economic Association, 4(1), 37—74.
Barrett, S. (1994), "Self-enforcing International Environmental Agreements," Oxford Economic Papers, Special Issue on Environmental Economics, 46(3), 878—94.
Barrett, S. (2001), Towards a Better Climate Treaty. Policy Matters 01-29, Washington, DC: AEI-Brookings Joint Center for Regulatory Studies.
Barrett, S. (2002), Environment and Statecraft. Oxford, Oxford University Press.
Bosetti, V., C. Carraro, M. Galeotti, E. Massetti and M. Tavoni, (2006), "WITCH: A World Induced Technical Change Hybrid Model," The Energy Journal, Special Issue on Hybrid Modeling of Energy-Environment Policies: Reconciling Bottom-up and Top-down, 13—38.
Bosetti, V., E. Massetti and M. Tavoni (2007), "FEEM’s WITCH Model: Structure, Baseline, Solutions," FEEM Working Paper No 10/2007.
Buchner, B., Carraro, C., Cersosimo, I. and C. Marchiori (2005), “Back to Kyoto? US Participation and the Linkage between R&D and Climate Cooperation”, in A. Haurie and L. Viguier, eds., Coupling Climate and Economic Dynamics, Kluwer Academic Publishers, pp. 173-204. Buonanno, P., C. Carraro and M. Galeotti (2003), "Endogenous Induced Technical Change and the Costs of Kyoto," Resource and Energy Economics, 25(1), 11—34.
Caballero, R.J and A.B. Jaffe (1993), "How High are Giants’ Shoulders: An Empirical Assessment of Knowledge Spillovers and Creative Destruction in a Model of Economic Growth," NBER Macroeconomics Annual 1993, Cambridge (MA), MIT Press, 15—74.
Carraro, C. (2001) “Environmental Technological Innovation and Diffusion”, in H. Folmer, L. Gabel, S. Gerking and A. Rose, eds., Frontiers of Environmental Economics, E. Elgar: Cheltenham.
Carraro, C. and D. Siniscalco (1994), “Environmental Policy Re-considered: The Role of Technological Innovation", European Economic Review, 38, 545—554.
Coe, D. and E. Helpman (1995), "International R&D Spillovers," European Economic Review, 39(5), 859—887.
Cohen, W. and D. Levinthal (1989), "Innovation and Learning: the Two Faces of R&D," Economic Journal, 99(397), 569—596.
D’Aspremont, C. and A. Jacquemin (1988), "Cooperative and Noncooperative R&D in Duopoly with Spillovers," The American Economic Review, 78(5), 1133—1137.
24
Eaton, J. and S. Kortum (1996), "Trade in Ideas: Patenting & Productivity in the OECD," Journal of International Economics, 40(3-4), 251—278.
Eaton, J. and S. Kortum (1999), "International Technology Diffusion: Theory and Measurement," International Economic Review, 1999.
Gerlagh, R. (2006), “International Carbon Leakage. Interpreting CGE's and assessing the implications of international technology spillovers”, paper presented at the 2nd Meeting of the Transust Project, Vienna, 10 October, 2006.
Gerlagh and Kuik (2003), "Trade Liberalization and Carbon Leakage," The Energy Journal, 24(3), 97—120.
Gerschenkron, A. (1962), Economic Backwardness in Historical Perspective. Harvard University Press.
Goolsbee, A. (1998), "Does Government R&D Policy Mainly Benefit Scientists and Engineers?" The American Economic Review, 88(2), 298—302.
Griffith, R., S. Redding and J. Van Reenen (2003), "R&D and Absorptive Capacity: Theory and Empirical Evidence", Scandinavian Journal of Economics, 105(1), 99—118.
Grubb, M., C. Carraro and J. Schellnhuber (2006), "Technological Change for Atmospheric Stabilization: Introductory Overview to the Innovation Modeling Comparison Project," The Energy Journal, Special Issue on Endogenous Technological Change and the Economics of Atmospheric Stabilisation, March, pp. 1—8.
Grubb, M., C. Hope and R. Fouquet (2002), "Climatic Implications of the Kyoto Protocol: The Contribution of International Spillover," Climatic Change, 54(1-2), 11—28.
Jaffe, A.B., M. Trajtenberg and R. Henderson (1993), "Geographic Localization of Knowledge Spillovers as Evidenced by Patent Citations," Quarterly Journal of Economics, 108(3), 577—598.
Keller, W. (1997), "Trade and the Transmission of Technology," NBER Working Paper No 6113.
Keller, W. (2004), "International Technology Diffusion," Journal of Economic Literature, 42(3), 752—782.
Kemfert, C. (2005), "Induced Technological Change in a Multi-Regional, Multi-Sectoral, Integrated Assessment Model (WIAGEM). Impact assessment of climate policy strategies," Ecological Economics, 54(2-3), 293–305.
Kennedy, C. (1964), "Induced Bias in Innovation and the Theory of Distribution", Economic Journal, 74(295), 541—547.
Kneller, R. (2005), "Frontier Technology, Absorptive Capacity and Distance", Oxford Bulletin of Economics and Statistics, 67(1), 1—23.
Lanjouw, J.O. and A. Mody (1996), "Innovation and the International Diffusion of Environmentally Responsive Technology," Research Policy, 25, 549—571.
25
Philibert, C. (2004), "International Energy Technology Collaboration and Climate Change Mitigation," OECD Environment Directorate and International Energy Agency, Paris.
Popp, D. (2002), “Induced Innovation and Energy Prices”, The American Economic Review, 92(1), 160—180.
Popp, D. (2004), "ENTICE: Endogenous Technological Change in the DICE Model of Global Warming", Journal of Environmental Economics and Management, 48(1), 742—768.
Romer, P. (1990), "Endogenous Technical Change," Journal of Political Economy, 98, S71—S102.
Rosenberg, N. (1982), Inside the Black Box: Technology and Economics, Cambridge University Press, Cambridge.
Rosenberg, N. (1994), Exploring the Black Box: Technology, Economics, and History. Cambridge University Press, Cambridge.
Trajtenberg, M., R. Henderson, A.B. Jaffe (1992), "Ivory Tower vs Corporate Lab: An Empirical Study of Basic Research and Appropriability," NBER Working Paper No. 4146.
26

CESifo Working Paper Series
for full list see Twww.cesifo-group.org/wp T (address: Poschingerstr. 5, 81679 Munich, Germany, [email protected])
___________________________________________________________________________ 2088 Arti Grover, International Outsourcing and the Supply Side Productivity Determinants,
September 2007 2089 M. Alejandra Cattaneo and Stefan C. Wolter, Are the Elderly a Threat to Educational
Expenditures?, September 2007 2090 Ted Bergstrom, Rod Garratt and Damien Sheehan-Connor, One Chance in a Million:
Altruism and the Bone Marrow Registry, September 2007 2091 Geraldo Cerqueiro, Hans Degryse and Steven Ongena, Rules versus Discretion in Loan
Rate Setting, September 2007 2092 Henrik Jacobsen Kleven, Claus Thustrup Kreiner and Emmanuel Saez, The Optimal
Income Taxation of Couples as a Multi-Dimensional Screening Problem, September 2007
2093 Michael Rauber and Heinrich W. Ursprung, Life Cycle and Cohort Productivity in
Economic Research: The Case of Germany, September 2007 2094 David B. Audretsch, Oliver Falck and Stephan Heblich, It’s All in Marshall: The Impact
of External Economies on Regional Dynamics, September 2007 2095 Michael Binder and Christian J. Offermanns, International Investment Positions and
Exchange Rate Dynamics: A Dynamic Panel Analysis, September 2007 2096 Louis N. Christofides and Amy Chen Peng, Real Wage Chronologies, September 2007 2097 Martin Kolmar and Andreas Wagener, Tax Competition with Formula Apportionment:
The Interaction between Tax Base and Sharing Mechanism, September 2007 2098 Daniela Treutlein, What actually Happens to EU Directives in the Member States? – A
Cross-Country Cross-Sector View on National Transposition Instruments, September 2007
2099 Emmanuel C. Mamatzakis, An Analysis of the Impact of Public Infrastructure on
Productivity Performance of Mexican Industry, September 2007 2100 Gunther Schnabl and Andreas Hoffmann, Monetary Policy, Vagabonding Liquidity and
Bursting Bubbles in New and Emerging Markets – An Overinvestment View, September 2007
2101 Panu Poutvaara, The Expansion of Higher Education and Time-Consistent Taxation,
September 2007
2102 Marko Koethenbuerger and Ben Lockwood, Does Tax Competition Really Promote
Growth?, September 2007 2103 M. Hashem Pesaran and Elisa Tosetti, Large Panels with Common Factors and Spatial
Correlations, September 2007 2104 Laszlo Goerke and Marco Runkel, Tax Evasion and Competition, September 2007 2105 Scott Alan Carson, Slave Prices, Geography and Insolation in 19th Century African-
American Stature, September 2007 2106 Wolfram F. Richter, Efficient Tax Policy Ranks Education Higher than Saving, October
2007 2107 Jarko Fidrmuc and Roman Horváth, Volatility of Exchange Rates in Selected New EU
Members: Evidence from Daily Data, October 2007 2108 Torben M. Andersen and Michael Svarer, Flexicurity – Labour Market Performance in
Denmark, October 2007 2109 Jonathan P. Thomas and Tim Worrall, Limited Commitment Models of the Labor
Market, October 2007 2110 Carlos Pestana Barros, Guglielmo Maria Caporale and Luis A. Gil-Alana, Identification
of Segments of European Banks with a Latent Class Frontier Model, October 2007 2111 Felicitas Nowak-Lehmann D., Sebastian Vollmer and Immaculada Martínez-Zarzoso,
Competitiveness – A Comparison of China and Mexico, October 2007 2112 Mark Mink, Jan P.A.M. Jacobs and Jakob de Haan, Measuring Synchronicity and Co-
movement of Business Cycles with an Application to the Euro Area, October 2007 2113 Ossip Hühnerbein and Tobias Seidel, Intra-regional Tax Competition and Economic
Geography, October 2007 2114 Christian Keuschnigg, Exports, Foreign Direct Investment and the Costs of Corporate
Taxation, October 2007 2115 Werner Bönte, Oliver Falck and Stephan Heblich, Demography and Innovative
Entrepreneurship, October 2007 2116 Katrin Assenmacher-Wesche and M. Hashem Pesaran, Assessing Forecast Uncertainties
in a VECX Model for Switzerland: An Exercise in Forecast Combination across Models and Observation Windows, October 2007
2117 Ben Lockwood, Voting, Lobbying, and the Decentralization Theorem, October 2007 2118 Andrea Ichino, Guido Schwerdt, Rudolf Winter-Ebmer and Josef Zweimüller, Too Old
to Work, too Young to Retire?, October 2007

2119 Wolfgang Eggert, Tim Krieger and Volker Meier, Education, Unemployment and
Migration, October 2007 2120 Stefan Napel and Mika Widgrén, The European Commission – Appointment,
Preferences, and Institutional Relations, October 2007 2121 Bertil Holmlund and Martin Söderström, Estimating Income Responses to Tax
Changes: A Dynamic Panel Data Approach, October 2007 2122 Doina Maria Radulescu, From Separate Accounting to Formula Apportionment:
Analysis in a Dynamic Framework, October 2007 2123 Jelle Brouwer, Richard Paap and Jean-Marie Viaene, The Trade and FDI Effects of
EMU Enlargement, October 2007 2124 Kurt R. Brekke, Luigi Siciliani and Odd Rune Straume, Competition and Waiting Times
in Hospital Markets, October 2007 2125 Alexis Direr, Flexible Life Annuities, October 2007 2126 Johannes Becker and Clemens Fuest, Quality versus Quantity – The Composition Effect
of Corporate Taxation on Foreign Direct Investment, October 2007 2127 Balázs Égert, Real Convergence, Price Level Convergence and Inflation Differentials in
Europe, October 2007 2128 Marko Koethenbuerger, Revisiting the “Decentralization Theorem” – On the Role of
Externalities, October 2007 2129 Axel Dreher, Silvia Marchesi and James Raymond Vreeland, The Politics of IMF
Forecasts, October 2007 2130 Andreas Knabe and Ronnie Schöb, Subsidizing Extra Jobs: Promoting Employment by
Taming the Unions, October 2007 2131 Michel Beine and Bertrand Candelon, Liberalization and Stock Market Co-Movement
between Emerging Economies, October 2007 2132 Dieter M. Urban, FDI Technology Spillovers and Wages, October 2007 2133 Valentina Bosetti, Carlo Carraro, Emanuele Massetti and Massimo Tavoni, Optimal
Energy Investment and R&D Strategies to Stabilise Greenhouse Gas Atmospheric Concentrations, October 2007
2134 David-Jan Jansen and Jakob de Haan, The Importance of Being Vigilant: Has ECB
Communication Influenced Euro Area Inflation Expectations?, October 2007 2135 Oliver Falck, Heavyweights – The Impact of Large Businesses on Productivity Growth,
October 2007

2136 Xavier Freixas and Bruno M. Parigi, Banking Regulation and Prompt Corrective
Action, November 2007 2137 Jan K. Brueckner, Partial Fiscal Decentralization, November 2007 2138 Silvia Console Battilana, Uncovered Power: External Agenda Setting, Sophisticated
Voting, and Transnational Lobbying, November 2007 2139 Alan J. Auerbach, Michael P. Devereux and Helen Simpson, Taxing Corporate Income,
November 2007 2140 Lorenzo Cappellari, Paolo Ghinetti and Gilberto Turati, On Time and Money
Donations, November 2007 2141 Roel Beetsma and Heikki Oksanen, Pension Systems, Ageing and the Stability and
Growth Pact, November 2007 2142 Hikaru Ogawa and David E. Wildasin, Think Locally, Act Locally: Spillovers,
Spillbacks, and Efficient Decentralized Policymaking, November 2007 2143 Alessandro Cigno, A Theoretical Analysis of the Effects of Legislation on Marriage,
Fertility, Domestic Division of Labour, and the Education of Children, November 2007 2144 Kai A. Konrad, Mobile Tax Base as a Global Common, November 2007 2145 Ola Kvaløy and Trond E. Olsen, The Rise of Individual Performance Pay, November
2007 2146 Guglielmo Maria Caporale, Yannis Georgellis, Nicholas Tsitsianis and Ya Ping Yin,
Income and Happiness across Europe: Do Reference Values Matter?, November 2007 2147 Dan Anderberg, Tax Credits, Income Support and Partnership Decisions, November
2007 2148 Andreas Irmen and Rainer Klump, Factor Substitution, Income Distribution, and
Growth in a Generalized Neoclassical Model, November 2007 2149 Lorenz Blume, Jens Müller and Stefan Voigt, The Economic Effects of Direct
Democracy – A First Global Assessment, November 2007 2150 Axel Dreher, Pierre-Guillaume Méon and Friedrich Schneider, The Devil is in the
Shadow – Do Institutions Affect Income and Productivity or only Official Income and Official Productivity?, November 2007
2151 Valentina Bosetti, Carlo Carraro, Emanuele Massetti and Massimo Tavoni, International
Energy R&D Spillovers and the Economics of Greenhouse Gas Atmospheric Stabilization, November 2007