Remote sensing signatures: Measurements, modelling and applications
Upload
khangminh22Category
view
3download
0
Ahmed et al. Environ Syst Res (2020) 9:32 https://doi.org/10.1186/s40068-020-00195-0
REVIEW
Integration of remote sensing and bioclimatic data for prediction of invasive species distribution in data-poor regions: a review on challenges and opportunitiesNurhussen Ahmed1* , Clement Atzberger2 and Worku Zewdie1
Abstract
Prediction and modeling using integrated datasets and expertise from various disciplines greatly improve the man-agement of invasive species. So far several attempts have been made to predict, handle, and mitigate invasive alien species impacts using specific efforts from various disciplines. Yet, the most persuasive approach is to better control its invasion and subsequent expansion by making use of cross-disciplinary knowledge and principles. However, the information in this regard is limited and experts from several disciplines have sometimes difficulties understanding well each other. In this respect, the focus of this review was to overview challenges and opportunities in integrat-ing bioclimatic, remote sensing variables, and species distribution models (SDM) for predicting invasive species in data-poor regions. Google Scholar search engine was used to collect relevant papers, published between 2005–2020 (15 years), using keywords such as SDM, remote sensing of invasive species, and contribution of remote sensing in SDM, bioclimatic variables, invasive species distribution in data-poor regions, and invasive species distribution in Ethiopia. Information on the sole contribution of remote sensing and bioclimatic datasets for SDM, major challenges, and opportunities for integration of both datasets are systematically collected, analyzed, and discussed in table and figure formats. Several major challenges such as quality of remotely sensed data and its poor interpretation, inap-propriate methods, poor selection of variables, and models were identified. Besides, the availability of Earth Obser-vation (EO) data with high spatial and temporal resolution and their capacity to cover large and inaccessible areas at a reasonable cost, as well as progress in remote sensing data integration techniques and analysis are among the opportunities. Also, the impacts of important sensor characteristics such as spatial and temporal resolution are crucial for future research prospects. Similarly important are studies analyzing the impacts of interannual variability of vegeta-tion and land use patterns on invasive SDM. Urgently needed are clearly defined working principles for the selection of variables and the most appropriate SDM.
Keywords: Bioclimatic variables, Remote sensing, Species distribution modeling, Invasive species
© The Author(s) 2020. This article is licensed under a Creative Commons Attribution 4.0 International License, which permits use, sharing, adaptation, distribution and reproduction in any medium or format, as long as you give appropriate credit to the original author(s) and the source, provide a link to the Creative Commons licence, and indicate if changes were made. The images or other third party material in this article are included in the article’s Creative Commons licence, unless indicated otherwise in a credit line to the material. If material is not included in the article’s Creative Commons licence and your intended use is not permitted by statutory regulation or exceeds the permitted use, you will need to obtain permission directly from the copyright holder. To view a copy of this licence, visit http://creat iveco mmons .org/licen ses/by/4.0/.
IntroductionInvasive species are a serious worldwide threat to biodi-versity (Paz-Kagan et al. 2019; Somers and Asner 2012; Truong et al. 2017). They moreover negatively affect livelihoods (Shackleton et al. 2014, 2015), density, rich-ness, and diversity of native woody species, and quality and distribution of water (Bekele et al. 2018). They have also a huge capacity to invade all land use types at high
Open Access
*Correspondence: [email protected] Department of Remote Sensing, Ethiopian Space Science and Technology Institute (ESSTI), Entoto Observatory and Research Center, Addis Ababa, EthiopiaFull list of author information is available at the end of the article

Page 2 of 18Ahmed et al. Environ Syst Res (2020) 9:32
invasion rates such as watercourses, highways, irrigated areas, forests, degraded lands, and agricultural land (Shif-eraw et al. 2019c) in particular if the invaded areas have low diversity (Ilukor et al. 2016; Sun et al. 2015). The negative impact of invasive species is generally increas-ing over time as it usually requires huge amounts of labor and costs to eradicate infested areas (Bekele et al. 2018). In particular, relatively poor countries often don’t have the necessary means to remove areas invaded by invasive species. Any deferment, however, further aggravates the problem (Vilà et al. 2011).
Currently, the adverse impacts of invasive species are in most countries by far greater than their positive return. In Ethiopia, the negative impact of Prosopis Juli-flora (hereafter Prosopis) outweighs its positive contribu-tion both to the ecosystem and livelihood (Iluker et al. 2014; Wakie et al. 2014). Currently, in Ethiopia, around 4.56 million hectares of land is highly suitable for Pros-opis distribution (Sintayehu et al. 2020). In addition, in the Afar region, Prosopis has invaded about 1.17 million hectares of land and is expected to increase at a rate of 8.3% annually (Shiferaw et al. 2019b). It invades native species and grasslands that were an important source of fodder for the locality (Ayanu et al. 2014; Wakie et al. 2014). Economically, an expected 535 billion dollars net loss may occur under poor management (Iluker et al. 2014). Hence, as eradication of invasive species is dif-ficult and costly, early detection and prevention, using an integrated data source, need to be prioritized for its management (Paz-Kagan et al. 2019; West et al. 2014; Zimmermann et al. 2007). Although mapping current distribution and modeling of suitable habitat for invasive species are of particular interest, published reports are limited (Fischer et al. 2013; Ng et al. 2018).
Species distribution modeling (SDM) has a great potential for the identification of suitable habitats and modeling prediction of invasive species (Bradley 2014; Filho et al. 2010; Feilhauer et al. 2012; Truong et al. 2017). They are also useful for planning and management of conservation efforts involving at a range of different scales. They also help to address important policy and strategic concerns on a global scale (Cayuela et al. 2009). Even though invasive SDM makes field inventories more efficient and effective, their prediction potential is often limited by spatial bias, lack of spatially explicit predictor variables, and unavailability of species absence data (Cay-uela et al. 2009; Filho et al. 2010; He et al. 2015). In view of this, the prediction of invasive species requires great care (Václavík and Meentemeyer 2012).
Advancements in remote sensing technology and statistical modeling increasingly support the predic-tion efficiency of SDM by reducing SDM-inherent limi-tations (He et al. 2015). Remotely sensed rainfall and
temperature data are available at the different temporal and spatial resolutions but are not yet widely used (Amiri et al. 2020; Deblauwe et al. 2016; Fernandez et al. 2013). Normalized Difference Vegetation Index (NDVI), Leaf Area Index (LAI), Enhanced Vegetation Index (EVI), and other EO derived data are still under-used in SDM though their potential is unquestionable (Feilhauer et al. 2012; He et al. 2015; Klerk and Buchanan 2017). This is particularly important for data-poor regions such as Ethiopia where weather stations are scarcely found (Deblauwe et al. 2016; Truong et al. 2017). Most studies in Ethiopia were carried out using survey data which is costly and time-consuming. Though the use of remote sensing data is at its infant stage, in recent years some few studies were carried out using remote sensing and bioclimatic variables (Ayanu et al. 2014; Shiferaw et al. 2019a; Wakie et al. 2014).
Besides the contributions of remotely sensed environ-mental variables, bioclimatic variables are equally impor-tant for predicting invasive species distribution (Amiri et al. 2020; Bradley et al. 2018; Deblauwe et al. 2016; Fer-nandez et al. 2013). Though it has the coarse resolution, climate variables alone have great potential to predict invasive species while the presence of remotely sensed environmental variables supports to provide spatial detail (Truong et al. 2017; Zimmermann et al. 2007). So far, several review articles have been published regard-ing SDM (e.g.; Kissling et al. 2018; Urbina-Cardona et al. 2019), and invasive species (e.g.; Bartz and Kowarik 2019; Kapitza et al. 2019; Shackleton et al. 2015; Vilà et al. 2011) and role of remote sensing in invasive SDM (e.g.; (Brad-ley 2014; He et al. 2015; Huang and Asner 2009; D. Roc-chini et al. 2015a, b; Royimani et al. 2018; Transon et al. 2018)). For example, Thamaga and Dube (2018a, b) have provided an overview of remote sensing on water hya-cinth. Similarly, Matongera et al. (2016) have reviewed the advancement and challenges of remote sensing in mapping and sensing Bracken fern invasive species. Brad-ley et al. 2014 also provides a detailed description of the spectral, textural, and phenological approach of remote detection of invasive plants. Some review papers also focused on the impacts of climate-based variables in invasive species distribution (e.g.; Tricarico 2016; Zhao et al. 2013). However, to the best of our knowledge, stud-ies to highlight the integration of different disciplines for accurate prediction of SDM are still missing. In light of this, Cord et al. (2013) wrote a commentary on the need for bridging disciplinary perspective for better use of their full potential. As the integration of remotely sensed environmental data sources, bioclimatic variables and SDM could be an effective and reliable tool to predict and map invasive species distribution; this review paper pro-vides a review of the state-of-the-art in this field.

Page 3 of 18Ahmed et al. Environ Syst Res (2020) 9:32
MethodsThe Google Scholar search engine was used to identify relevant papers. The following keywords/phrases were used alone and in combination to search published arti-cles in the past 15 years:
• SDM• Remote sensing of invasive species• Contribution of remote sensing in SDM• Bioclimatic variables• Invasive species distribution in data-poor regions• Invasive species distribution in Ethiopia
In this way, 442 papers were retrieved, published between 2000–2020. Out of these papers, 112 stud-ies, published between 2005–2020 (March), were finally selected (Fig. 1). The main aim of the review was to describe challenges and opportunities in combining (bio) climatic (both in situ and/or remote sensing based) and EO derived variables with SDM for predicting invasive species distribution. In particular, the role of EO in the prediction of invasive species was thoroughly examined. Varied views of integrating these datasets with SDM were also explored. Major challenges and opportunities
associated with the process of integrating these datasets were highlighted. Finally, recommendations were dis-tilled out of the body of published work, providing some guidance concerning the design of future studies. To prepare this review paper, we first define the methodol-ogy used to select and analyze published (SCI) papers. Thereafter, in two separate chapters, we summarize the sole use of either (bio) climatic or EO data for SDM. The next chapter follows a summary of the combined use of the two datasets for SDM, followed by a review chapter on the use of such data for invasive species modeling in Ethiopia. Finally, we highlight the challenges and oppor-tunities offered by a combined analysis of EO and (bio) climatic data. The review concludes with chapters on rec-ommendations and conclusions.
Results and discussionContribution of remote sensing in SDMRemote sensing is the most cost-effective approach to monitor vegetation cover and its changes over time, as it provides wide spatial coverage and repeated meas-urements over a short period, which are difficult to achieve otherwise (Paz-Kagan et al. 2019; Rocchini et al. 2015a, b; Rocchini et al. 2015a, b). The availability of
56 studies used to prepare figures
46 studies used to prepare tables
183 studies excluded after reading
their title
Studies collected using google
scholar search engine (n=442)
112 studies (published between
2005-2020) used for the
preparation of the review paper
148 studies excluded after reading
their abstract
259 papers selected to read their
abstract
Fig. 1 Selection process of articles used for the review paper
Page 4 of 18Ahmed et al. Environ Syst Res (2020) 9:32
multi-temporal satellite data at varied spatial resolution has immense importance in modeling the distribution of invasive species (Bradley 2014; Buermann et al. 2008; Paz-Kagan et al. 2019; Saatchi et al. 2008; Truong et al. 2017). Several studies used multi-temporal and high spa-tial resolution data for mapping and modeling of invasive species (Evangelista et al. 2008; Huang and Asner 2009; Ng et al. 2017; Shiferaw et al. 2019a; Somers and Asner, 2012; Wakie et al. 2014).
Importantly, ongoing developments in remote sens-ing technologies lead to steadily improved sensors that have the potential to better support predictions of inva-sive species (Buermann et al. 2008; Huang and Asner 2009; Leitão and Santos 2019; Truong et al. 2017). With the availability of freely available Copernicus satel-lites (in particular Sentinel-2), unprecedented detail is offered every 5 days at the equator, for the identifica-tion of invasive species, (Ng et al. 2017; Rajah et al. 2018, 2019; Thamaga and Dube 2018a, 2018b) as well as crop and vegetation mapping (Immitzer et al. 2019; Shoko and Mutanga 2017; Vuolo et al. 2018; Wessel et al. 2018). The tremendous additional potential is offered by a steadily
growing fleet of commercial satellites, UAV, and hyper-spectral sensors (Feilhauer et al. 2013; Piiroinen et al. 2018).
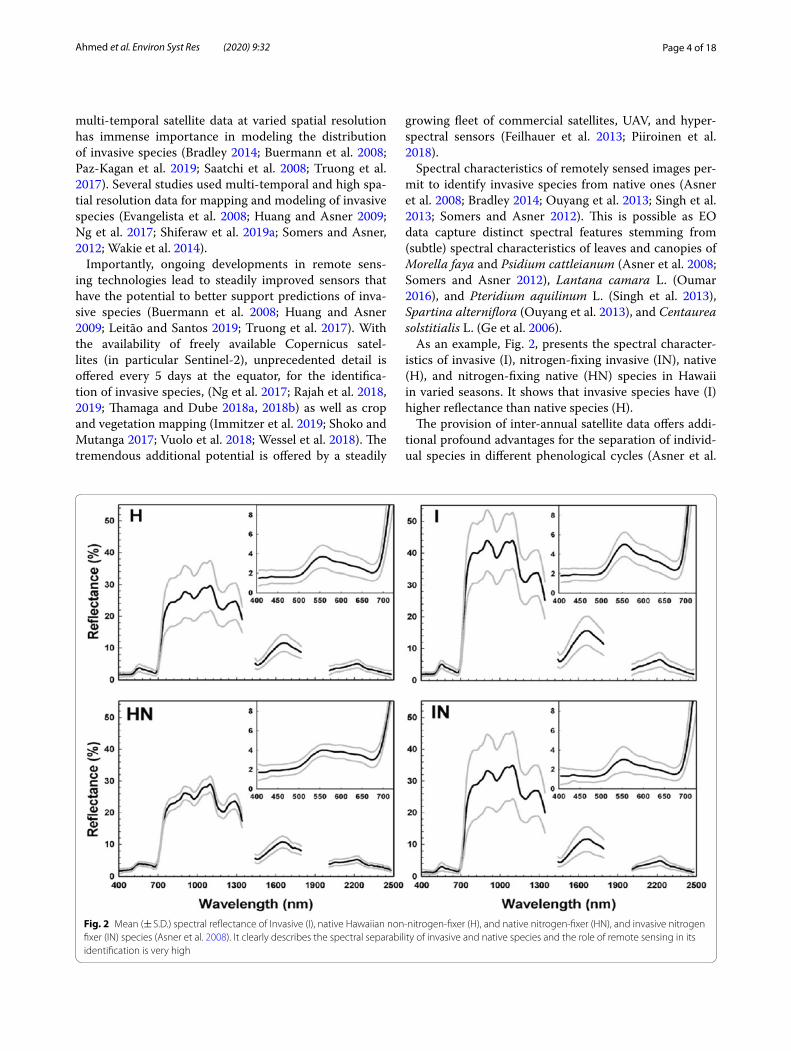
Spectral characteristics of remotely sensed images per-mit to identify invasive species from native ones (Asner et al. 2008; Bradley 2014; Ouyang et al. 2013; Singh et al. 2013; Somers and Asner 2012). This is possible as EO data capture distinct spectral features stemming from (subtle) spectral characteristics of leaves and canopies of Morella faya and Psidium cattleianum (Asner et al. 2008; Somers and Asner 2012), Lantana camara L. (Oumar 2016), and Pteridium aquilinum L. (Singh et al. 2013), Spartina alterniflora (Ouyang et al. 2013), and Centaurea solstitialis L. (Ge et al. 2006).
As an example, Fig. 2, presents the spectral character-istics of invasive (I), nitrogen-fixing invasive (IN), native (H), and nitrogen-fixing native (HN) species in Hawaii in varied seasons. It shows that invasive species have (I) higher reflectance than native species (H).
The provision of inter-annual satellite data offers addi-tional profound advantages for the separation of individ-ual species in different phenological cycles (Asner et al.
Fig. 2 Mean (± S.D.) spectral reflectance of Invasive (I), native Hawaiian non-nitrogen-fixer (H), and native nitrogen-fixer (HN), and invasive nitrogen fixer (IN) species (Asner et al. 2008). It clearly describes the spectral separability of invasive and native species and the role of remote sensing in its identification is very high

Page 5 of 18Ahmed et al. Environ Syst Res (2020) 9:32
2008; Bradley 2014; Ge et al. 2006; Somers and Asner 2012). By observing the same target (pixel) multiple times during a growing cycle, additional (multi-temporal) indi-cators and features can be extracted, further benefiting the species identification. Understory invasive species that have a longer growing season in the early spring and late fall seasons for example can be identified from other trees using remote sensing (Bradley 2014).
Furthermore, EO data has a great potential to quantify environmental properties, biodiversity conservation, and detecting long-term change of ecosystem, often impossi-ble to quantify otherwise (Cord et al. 2013; Prates-Clark et al. 2008; Taddese 2014). Moreover, the availability of multi-temporal remote sensing data permits ecolo-gists to design SDM beyond climatic variables, by add-ing remotely sensed environmental variables (Cord and Rodder 2011). It has been pointed out that, incorporating remotely sensed environmental variables increases the acceptance of SDM for the prediction of invasive species (Leitão and Santos 2019). Climate and weather variables can also be derived from EO sensors and used for the prediction of invasive SDM, though published reports using this kind of application are limited (Deblauwe et al. 2016; Fernandez et al. 2013; Truong et al. 2017). Gener-ally, the application of remote sensing products and their integration with climate data can create a better under-standing of the field of SDM (Cord et al. 2013; Truong et al. 2017).
Contribution of bioclimatic data in SDMFor the better prediction of invasive species using SDM, it is necessary to include climate variables. Climate vari-ables are one of the major contributing factors for pre-dicting invasive species (Deblauwe et al. 2016; Fernandez et al. 2013; Re et al. 2020). SDMs perform better when climate data are used (either partially or completely) for model predictions (Ahmadi et al. 2020; Guisan et al. 2007; Truong et al. 2017; Zimmermann et al. 2007). Pro-jection of invasive species distribution can also be pos-sible using climate models (Heshmati et al. 2019). Unlike remote sensing, which mainly leverages the spectral signature of vegetation, climate data can provide infor-mation about environmental factors affecting species. Biophysical properties of vegetation can provide basic information on vegetation (Amiri et al. 2020; Deblauwe et al. 2016). For example, invasive species (Acacia mel-anoxylon R., Gleditsia triacanthos L.) often spread more widely in the dry season due to their unique biophysical characteristics to cope with water limitations (Godoy et al. 2011). Overlooking this will create inconsistencies in the prediction of invasive species distributions (Amiri et al. 2020; Bellard et al. 2018; Truong et al. 2017).
There are different sources of climate data sets that can be used for predicting invasive species. These data sources are either spatially interpolated (e.g.; World-Clim, Climatic Research Unit (CRU)), or satellite-based estimates of climatic variables (e.g.; Tropical Rainfall Measuring Mission (TRMM) and Moderate Resolution Imaging Spectrometer (MODIS). For example, in World-Clim, climate data is spatially interpolated using spline interpolation. This data is very popular to use for invasive SDM (Hijmans et al. 2005; Vega et al. 2017). However, there are some uncertainties in this product as it can be affected by closeness to weather stations, inter-annual variability, and topographic heterogeneity (Amiri et al. 2020; Fernandez et al. 2013). As a result, WorldClim as well as other station-based climate data is always uncer-tain for the prediction of invasive species distribution when ground weather stations are sparse (Amiri et al. 2020; Deblauwe et al. 2016). In such cases, the inclusion of satellite-based climate data improves the prediction of invasive species compared to models that only consider spatially interpolated climate data (Engler et al. 2013). Figure 3 describes a methodological flow chart on how to derivate bioclimatic variables from remotely sensed datasets. Even if remotely sensed climate data has great potential in providing better temporal and spatial reso-lution, the EO should always be examined and validated using station based climate data to check their accuracy (Loew et al. 2017; Richter and Hank 2012).
Integration of remote sensing and bioclimatic variablesInvasive SDM can benefit from using bioclimatic, sur-vey, remote sensing data, and/or integration of all with SDM. Predicting the risk of invasive species at different scales can be quantified by readily available remote sens-ing products in conjunction with climate data and SDM (Wakie et al. 2014; Zimmermann et al. 2007). However, there is no consensus among scientists whether the inte-gration of both datasets with SDM can enhance the pre-diction of species distribution or not. Some researchers argue that integration of both datasets with SDM has huge potential for efficient mapping of species distri-bution, compared to using remotely sensed or climate data alone (Arogoundade et al. 2019; Buermann et al. 2008; Prates-Clark et al. 2008). Other papers revealed that the integration of both datasets could even decrease the accuracy of modeling due to the quality of remotely sensed environmental variables (land cover) (Engler et al. 2013; Truong et al. 2017; Zimmermann et al. 2007).
In addition, a study by Truong et al. (2017), evaluated the performance of bioclimatic and remote sensing data separately and in combination using the MaxEnt model. They concluded that despite the challenges, the integration of both datasets had a promising future for

Page 6 of 18Ahmed et al. Environ Syst Res (2020) 9:32
invasive SDM. Similarly, a study by Wakie et al. (2014), employed the MaxEnt model for integration of 19 bio-climatic variables with remotely sensed environmental parameters. Their study revealed that the integration of both datasets enhances the prediction of invasive species, particularly in areas where sufficient ground survey is difficult to undertake. Besides, a study by Feil-hauer et al. (2012) combined 19 WorldClim bioclimatic data with MODIS NDVI time-series data to determine species distribution at coarse spatial resolution. They indicated that there is a strong improvement in spe-cies prediction when data are combined. However, completely ignoring EO variables and fully depending on climate data, or even excess of climate variables, might lead to unreliable results (Li et al. 2014). Hence, combining spatially interpolated ground stations with remotely sensed climate data has profound importance to accurately utilize their respective benefits sides while reducing their limitations. Besides, for an improved prediction of invasive species several requirements are of utmost importance:
• High spatial, temporal, and spectral resolution satel-lite products (Engler et al. 2013; Truong et al. 2017)
• Proper selection of environmental variables (Cord and Rodder 2011; Zimmermann et al. 2007), and
• Appropriate techniques to integrate both data sets (Cord et al. 2013; Guisan et al. 2007)
Several studies followed the below flowchart (Fig. 4) to integrate remote sensing and bio (climatic) variables for a particular species distribution modeling. The first requirement is to select remote sensing and bio (climatic) datasets. Once the datasets are selected the next step is to select the best-performed variables. After appropri-ate variables are selected the next step is to choose the modeling technique. Moreover, model performance can be computed using different approaches and best-performed variables from both models can be selected for the integration of remote sensing with bio (climatic) based model. The overall process to integrate both data-sets is presented in Fig. 4.
Furthermore, a few papers are summarized in Table 1 that focuses on the prediction of species using both data-sets. This yields insights on the kind of variables and SDM was most often used in combining the two datasets for the prediction of invasive species.
From Table 1, the following observations are extracted:
• There is poor agreement on the process of selecting variables and SDM for the prediction of invasive spe-cies distribution.
Pre-processing such as radiometric,
geometric corrections and validations
against ground truth
Pre-processing such as radiometric,
geometric corrections and validations
against ground truth
Derivation of temperature based bioclimatic
variables such as annual mean temperature (°C),
mean diurnal range (°C). This can be done in
different tools such as ArcGIS and R software’s
Derivation of rainfall based bioclimatic variables
such as annual precipitation (mm), precipitation of
wettest month (mm). This can be done in different
tools such as ArcGIS and R software’s
Variable selection using different
variable selection techniques (table 2)
Modelling using different modelling
techniques
Temperature based satellite remote sensing
datasets such as MODIS Land Surface
temperature (LST) gridded data
Rainfall based satellite remote sensing
datasets such as TRMM and CHIRPS
gridded data
Fig. 3 Derivation of bioclimatic variables from remotely sensed data (adapted from Amiri et al. 2020; Deblauwe et al. 2016)

Page 7 of 18Ahmed et al. Environ Syst Res (2020) 9:32
• Justifications to select (or ignore) variables and SDM are overlooked.
• Although integration of remotely sensed environ-mental variables, bioclimatic variables, and SDM are highly valuable for studying species distribu-tion, methods that specifically work on the integra-tion of EO and bioclimatic variables are requiring.
Experiences in EthiopiaMore than 35 invasive alien species are reported in Ethio-pia (Shiferaw et al. 2018; Tamiru 2017). However, only a few attempts were made to map their distribution. For example, Prosopis (Ayanu et al. 2014; Hundessa and Fufa 2016; Shiferaw et al. 2019a; Wakie et al. 2014), Mimosa diplotricha (Wakjira 2011); Parthenium hysterophorus
Map outputs on
species distribution
Map outputs on
species distribution
Map outputs on
species distribution
Remote sensing datasets Bioclimatic datasets
Model prediction for remote sensing based model using
different models such as random
forest
Evaluation of model
performance using different
techniques such as cross
validation
Pre-processing such as image
mosaicking, sub-setting,
atmospheric and radiometric
corrections
Pre-processing such as sub-
setting
Variable selection using different
techniques such as variable
inflation factor
Variable selection using
different techniques such as
variable inflation factor
Field data on species
presence and absence or
presence only records
Model prediction for bioclimatic dataset using different models
such as random forest
Identifying best
performed variables
Evaluation of model
performance using different
techniques such as cross
validation
Model prediction for
integrated datasets using
different models such as
random forest
Evaluation of model
performance using
different techniques such
as cross validation
Identifying best
performed variables
Identifying best
performed variables
Fig. 4 Methodological flowchart used in several studies to integrate remote sensing and bioclimatic based models (adapted from Engler et al. 2013; Truong et al. 2017; Zimmermann et al. 2007)

Page 8 of 18Ahmed et al. Environ Syst Res (2020) 9:32
L. (Beyene and Tessema 2015) are to mention most. Out of the papers retrieved for this review, 23 focused on the distribution of invasive species in Ethiopia. However, only seven of those studies employed satellite data or bio-climatic data and/or a combination of both datasets. The
rest used survey data to map the distribution of invasive species, which is very difficult and time-consuming. For example, (Beyene and Tessema 2015; Hundessa and Fufa 2016; Tola and Tessema 2019; Wakjira 2011) followed the same methodology for various invasive species. These
Table 1 Variables, SDM, and species used in combination of both datasets of some researches
Variables SDM References
Climate variables (mean annual rainfall, mean monthly tem-perature, monthly land surface temperature during day and night time)
Remote sensing variables (monthly land surface temperature during the day and nighttime, panchromatic reflectance, red reflectance, near-infrared reflectance, shortwave infrared band 6 reflectance, NDVI, elevation, slope, relief, landform, rugged, and distance to River)
Survey data (distance to road, distance to village)
Random Forest (RF) Shiferaw et al. (2019a)
Climate variables (temperature seasonality)Remote sensing variables (elevation, landform, lithology,
distance to water, distance to urban areas)Survey data (distance to road)
RF, MaxEnt, logistic regression, Bayesian networks, Ensemble Ng et al. (2018)
Climate variables (19 WorldClim bioclimatic variables)Remote sensing variables (bedrock, bulk density, cation
exchange capacity, soil texture fraction clay, coarse frag-ments volumetric, soil organic carbon stock, soil organic carbon content, soil pH, soil texture fraction silt, soil texture fraction sand, land cover, gross primary productivity, coef-ficient of variation, gross primary productivity, elevation)
MaxEnt Truong et al. (2017)
Climate variables (WorldClim variables and MODIS land surface temperature)
Remote sensing variables (long term EVI, surface reflectance including blue, red, near-infrared, and middle infrared wave-lengths and land cover data)
MaxEnt Cord et al. (2014a, b)
Climate variables (WorldClim bioclimatic variables)Remote sensing variables (monthly NDVI and EVI), elevation
and slope
MaxEnt Wakie et al. (2014)
Climatic variables (growing degree days, mean temperature of the coldest month, summer moisture index, summer sum of precipitations, winter sum of precipitations, yearly solar radiation, summer solar radiation, soil water balance, topographic wetness index, topographic position
Remote sensing variables (NDVI, Renormalized Difference Vegetation Index (RDVI), Modified Simple Ratio index (MSR), Modified Chlorophyll Absorption Ratio Index 1 (MCARI1), blue band, green band, red band, near-infrared band, slope and topographic position, distance to the nearest water body)
9 SDM including Generalized Linear Model (GLM), RF, Artifi-cial Neural Network, and Ensemble model
Engler et al. (2013)
Climatic variables (WorldClim bioclimatic variables)Remote sensing variables (NDVI)
Partial Least Squares regression Feilhauer et al. (2012)
Climatic variables (WorldClim bioclimatic variables)Remote sensing variables (LAI, vegetation density, seasonality,
and net primary productivity, forest cover, and heteroge-neity, surface moisture, and roughness (forest structure), seasonality, topography, and ruggedness)
MaxEnt Buermann et al. (2008)
Climatic variables (WorldClim bioclimatic variables)Remote sensing variables (monthly NDVI, monthly LAI, percent
tree cover, scatter meter backscatter monthly composites at 1 km, elevation)
MaxEnt Prates-Clark et al. (2008)
Climatic variables (Bioclimatic variables derived from DAYMET)Remote sensing variables (NDVI)
GLM Zimmermann et al. (2007)

Page 9 of 18Ahmed et al. Environ Syst Res (2020) 9:32
authors gathered survey data at 10 km intervals; ignoring remote sensing and bioclimatic variables.
In the Afar region Ayanu et al. (2014), employed long term satellite data to provide basic information on the historical distribution of Prosopis and land-use changes and conclude that the role of long term remote sensing data has great contribution to manage invasive Prosopis distribution. In addition, Shiferaw et al. (2019a) used long term satellite data to quantify Prosopis distribu-tion and its impact on land-use changes and ecosystem services and conclude that remote sensing data has a great contribution to quantify land cover changes and ecosystem services. Similarly, Wakie et al. (2014) and Shiferaw et al. (2019a) took into account both biocli-matic and remotely sensed variables for prediction of invasive Prosopis using MaxEnt and RF models respec-tively, and conclude that the use of integrated datasets has great importance in studying invasive species dis-tribution and prediction. Shiferaw et al. (2019a) pro-vided a comparison study on the performance of SDM in the prediction of Prosopis and conclude that the use of the best-performing machine learning algorithm provides better accuracy than the ensemble model. Moreover, West et al. (2014) provided extensive infor-mation on the potential distribution of Prosopis in Ethi-opia using the Landsat 8 and MaxEnt model (Fig. 5). Overall, remotely sensed satellite data and bioclimatic variables have been scarcely used for mapping invasive species distribution in Ethiopia, indicating that the use of these data is still in its infancy in the country.
Challenges in the combination of EO and climate datasetsCombining EO and climate data is not without chal-lenges. Major problems relate to:
1. The nature of species (invasive species are more difficult than native ones) (Evangelista et al. 2008; Václavík and Meentemeyer 2012),
2. Poor methodology in the selection of variables (Guisan et al. 2007),
3. Inappropriate selection of models (Guisan et al. 2007),
4. Quality issues of the data (Cord and Rodder 2011; Truong et al. 2017; Tuanmu and Jetz 2014), and
5. The difficulty of interpretation of remotely sensed data (Cord and Rodder 2011).
Unlike other species, mapping and modeling of inva-sive species require the highest care as it violates major assumptions known in SDM (Václavík and Meentemeyer 2012). Besides, remote sensing limitations such as failure to detect all plants, the trade-off between spatial with temporal and spatial with spectral resolutions negatively affects SDM application (He et al. 2015). It is also pointed out that, it is difficult to find reliable, high-quality land cover remotely sensed information at any time is also a great challenge (Bradley and Fleishman 2008; Prates-Clark et al. 2008). In addition to quality concern, the interpretation of remotely sensed signals is also challeng-ing and disturbs the accuracy of other variables (Cord and Rodder 2011; Zimmermann et al. 2007).
Another major challenge relates to the fact that remote sensing toolset consists of sensors with widely vary-ing sensor characteristics (Saatchi et al. 2008; Tuanmu and Jetz 2014). For example, the spatial resolution has a strong impact on the prediction of invasive species. The coarse spatial resolution of satellites limits certainly details of the map, whereas fine resolution brings its own problem in relation to cost, preprocessing, and intra-class variability (Boyd and Foody 2011).
Sample size and design in presence and absence data is also another challenge in SDM (Fithian et al. 2014; Roc-chini et al. 2015a, b). Most researchers used the only presence or pseudo absence data for modeling prediction of species distribution as absence data for invasive spe-cies are difficult to obtain (Ng et al. 2018; Václavík and Meentemeyer 2012). In addition, employing a reasonable sample size using appropriate techniques can enhance the prediction of species distribution (Xie et al. 2008).
Proper selection of SDM can significantly increase the efficiency of prediction. Selecting a specific model needs to provide justifiable criteria as it can affect the result (Sakate and Kashid 2016). However, in most cases, mod-els are selected without providing significant justification.
Fig. 5 Habitat suitability for distribution of Prosopis in Ethiopia using combined (EO and climate parameters) and MaxEnt model (West et al. 2014)

Page 10 of 18Ahmed et al. Environ Syst Res (2020) 9:32
Some researchers use single models for mapping and predicting invasive species distribution (e.g.; MaxEnt model used by Truong et al. 2017; Wakie et al. 2014). Some other researchers first compare different mod-els and then use the best performing model for predic-tion (e.g. Engler et al. 2013; Ng et al. 2018; Shiferaw et al. 2019a). Other papers suggest that ensemble models are preferable over single models (e.g.; Früh et al. 2018; Ng et al. 2018)). Figure 6 depicts various SDM employed bio-climatic data, remote sensing data, or their combination. Maximum entropy (MaxEnt), RF, GLM, Multivariate Adaptive Regression Splines (MARS), Generalized Addi-tive Model (GAM), Gradient Boosted Model (GBM), ensemble model, and Support Vector Machine learning (SVM) are analyzed within about 49 studies.
As indicated in Fig. 5, GLM and MaxEnt are largely used in bioclimatic and remote sensing based research. This might be attributed to the challenge of collecting
absence data for invasive species (Ng et al. 2018; Václavík and Meentemeyer 2012). MaxEnt is popular in SDM, through evaluating the quality of SDM is difficult (Filho et al. 2010; West et al. 2014). From the presence and absence of data models, the RF is the most employed model in bioclimatic, remote sensing, and integrated datasets.
Variable selection methodsTo ensure a non-bias variable selection, it is important to determine variable correlation through a set of stand-ardized tests (Phillips et al. 2006). It is hard to know; however, in which environmental variables are most appropriate and useful for predicting species distribution (Aranda and Lobo 2011). The importance of environ-mental variables is dependent on the type, nature of spe-cies, and its topography (Cord et al. 2013). Due to this, we can’t see consistent variables used by researchers for
0
1
2
3
4
5
6
7
8
Maxent RF GLM MARS GAM GBM SVM Ensemble
Bioclima�c Remote sensing CombinedFig. 6 Species distribution models (SDM) and their use of bioclimatic, remote sensing, and combined data. Maxent, GLM, MARS, GAM, and GBM use presence-only data whereas RF and SVM use both presence and absence data
Table 2 Variable selection techniques used in the integration of remote sensing and bioclimatic based variables
S.no Variable selection methods References
1 Correlation (Pearson, Kendall, Spearman) Buermann et al. (2008); Engler et al. (2013); Gormley et al. (2011); Ng et al. (2018); Saatchi et al. (2008); Truong et al. (2017); Wakie et al. (2014); West et al. (2014); Zimmermann et al. (2007)
2 Principal component analysis Deblauwe et al. (2016); Feilhauer et al. 2012; Jensen et al. (2020)
3 Variance inflation factor Ahmadi et al. (2020); Ng et al. (2018); Shiferaw et al. (2019c)
4 Weighted mean fitted analysis approach Shiferaw et al. (2019a)
5 Permutation importance Wilson et al. (2013)
6 Expert knowledge Beaumont et al. (2005); Jones (2012); Ng et al. (2018)
Page 11 of 18Ahmed et al. Environ Syst Res (2020) 9:32
the prediction of species distribution even with similar climate, species, and study locations. The selection of sig-nificant variables is a crucial step and can determine the accuracy of models (Beaumont et al. 2005; Elkind et al. 2019). The following are (Table 2) among the variable selection methods used in several studies.
Furthermore, the following variables were selected in many invasive species prediction studies using the above variable selection techniques.
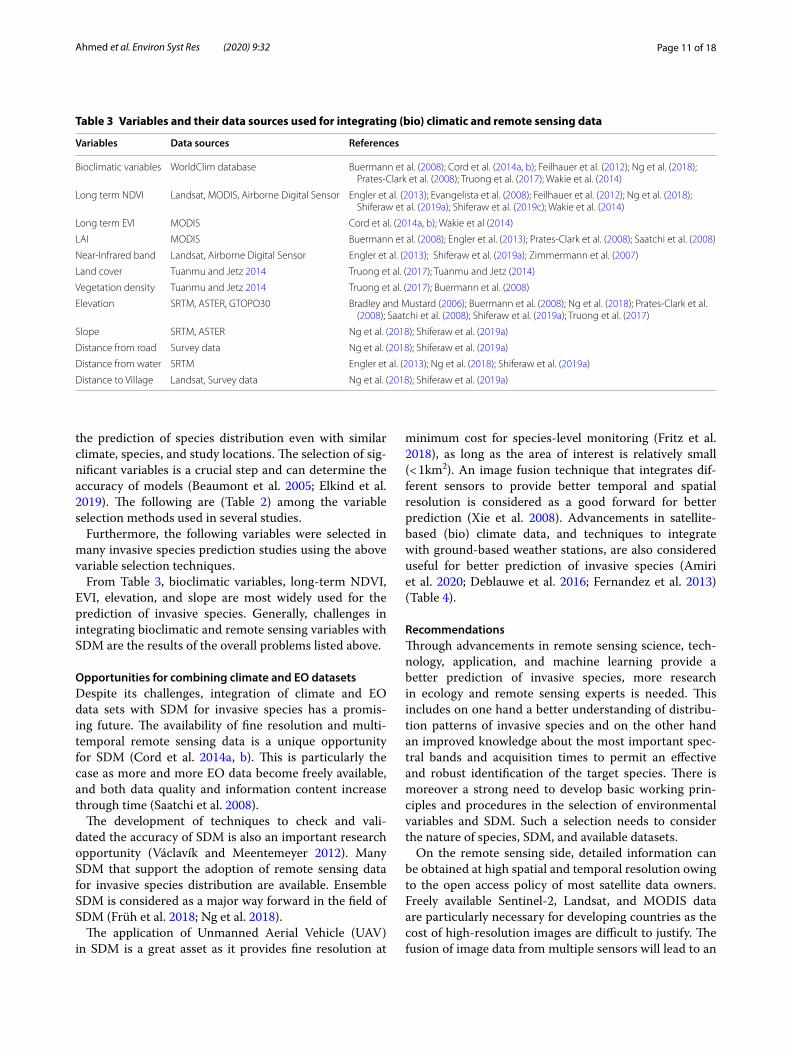
From Table 3, bioclimatic variables, long-term NDVI, EVI, elevation, and slope are most widely used for the prediction of invasive species. Generally, challenges in integrating bioclimatic and remote sensing variables with SDM are the results of the overall problems listed above.
Opportunities for combining climate and EO datasetsDespite its challenges, integration of climate and EO data sets with SDM for invasive species has a promis-ing future. The availability of fine resolution and multi-temporal remote sensing data is a unique opportunity for SDM (Cord et al. 2014a, b). This is particularly the case as more and more EO data become freely available, and both data quality and information content increase through time (Saatchi et al. 2008).
The development of techniques to check and vali-dated the accuracy of SDM is also an important research opportunity (Václavík and Meentemeyer 2012). Many SDM that support the adoption of remote sensing data for invasive species distribution are available. Ensemble SDM is considered as a major way forward in the field of SDM (Früh et al. 2018; Ng et al. 2018).
The application of Unmanned Aerial Vehicle (UAV) in SDM is a great asset as it provides fine resolution at
minimum cost for species-level monitoring (Fritz et al. 2018), as long as the area of interest is relatively small (< 1km2). An image fusion technique that integrates dif-ferent sensors to provide better temporal and spatial resolution is considered as a good forward for better prediction (Xie et al. 2008). Advancements in satellite-based (bio) climate data, and techniques to integrate with ground-based weather stations, are also considered useful for better prediction of invasive species (Amiri et al. 2020; Deblauwe et al. 2016; Fernandez et al. 2013) (Table 4).
RecommendationsThrough advancements in remote sensing science, tech-nology, application, and machine learning provide a better prediction of invasive species, more research in ecology and remote sensing experts is needed. This includes on one hand a better understanding of distribu-tion patterns of invasive species and on the other hand an improved knowledge about the most important spec-tral bands and acquisition times to permit an effective and robust identification of the target species. There is moreover a strong need to develop basic working prin-ciples and procedures in the selection of environmental variables and SDM. Such a selection needs to consider the nature of species, SDM, and available datasets.
On the remote sensing side, detailed information can be obtained at high spatial and temporal resolution owing to the open access policy of most satellite data owners. Freely available Sentinel-2, Landsat, and MODIS data are particularly necessary for developing countries as the cost of high-resolution images are difficult to justify. The fusion of image data from multiple sensors will lead to an
Table 3 Variables and their data sources used for integrating (bio) climatic and remote sensing data
Variables Data sources References
Bioclimatic variables WorldClim database Buermann et al. (2008); Cord et al. (2014a, b); Feilhauer et al. (2012); Ng et al. (2018); Prates-Clark et al. (2008); Truong et al. (2017); Wakie et al. (2014)
Long term NDVI Landsat, MODIS, Airborne Digital Sensor Engler et al. (2013); Evangelista et al. (2008); Feilhauer et al. (2012); Ng et al. (2018); Shiferaw et al. (2019a); Shiferaw et al. (2019c); Wakie et al. (2014)
Long term EVI MODIS Cord et al. (2014a, b); Wakie et al (2014)
LAI MODIS Buermann et al. (2008); Engler et al. (2013); Prates-Clark et al. (2008); Saatchi et al. (2008)
Near-Infrared band Landsat, Airborne Digital Sensor Engler et al. (2013); Shiferaw et al. (2019a); Zimmermann et al. (2007)
Land cover Tuanmu and Jetz 2014 Truong et al. (2017); Tuanmu and Jetz (2014)
Vegetation density Tuanmu and Jetz 2014 Truong et al. (2017); Buermann et al. (2008)
Elevation SRTM, ASTER, GTOPO30 Bradley and Mustard (2006); Buermann et al. (2008); Ng et al. (2018); Prates-Clark et al. (2008); Saatchi et al. (2008); Shiferaw et al. (2019a); Truong et al. (2017)
Slope SRTM, ASTER Ng et al. (2018); Shiferaw et al. (2019a)
Distance from road Survey data Ng et al. (2018); Shiferaw et al. (2019a)
Distance from water SRTM Engler et al. (2013); Ng et al. (2018); Shiferaw et al. (2019a)
Distance to Village Landsat, Survey data Ng et al. (2018); Shiferaw et al. (2019a)

Page 12 of 18Ahmed et al. Environ Syst Res (2020) 9:32
Tabl
e 4
Clim
ate
and
EO d
atas
ets
are
used
for t
he p
redi
ctio
n of
spe
cies
dis
trib
utio
n m
odel
ing
Clim
ate
and
EO d
atas
ets
Des
crip
tion
Spat
ial r
esol
utio
nA
cces
sibi
lity
Refe
renc
es
Wor
ldC
limIt
is a
wor
ld g
ridde
d cl
imat
e da
ta th
at c
onta
ins
19
bioc
limat
ic v
aria
bles
. It i
s de
sign
ed b
ased
on
the
splin
e in
terp
olat
ion
of lo
ng-t
erm
sta
tion
clim
ate
data
1km
2Fr
eeBu
cklin
et a
l. (2
016)
; Fer
nánd
ez a
nd H
amilt
on (2
015)
; H
eshm
ati e
t al.
(201
9); T
ruon
g et
al.
(201
7)
TRM
MIt
is a
join
t mis
sion
from
NA
SA a
nd Ja
pan
deve
lope
d in
199
7 to
pro
vide
pre
cipi
tatio
n da
ta5
kmFr
eeSa
atch
i et a
l. (2
008)
MO
DIS
It is
an
inst
rum
ent t
hat c
olle
cts
rem
otel
y se
nsed
da
ta s
tart
ing
from
200
0 to
the
pres
ent u
sing
bot
h Te
rra
and
Aqu
a sa
telli
tes
250
m to
1 k
mFr
eeCo
rd a
nd R
odde
r (20
11);
Feilh
auer
et a
l. (2
012)
; Tr
uong
et a
l. (2
017)
;
Land
sat 5
It is
laun
ched
in 1
984,
pro
vide
s an
ear
th im
age
that
ca
n be
hel
pful
for d
iffer
ent a
pplic
atio
ns30
mFr
eeD
ubul
a et
al.
(201
6); W
est e
t al.
(201
4)
Land
sat 7
It is
laun
ched
in 1
999,
equ
ippe
d w
ith a
n en
hanc
ed
them
atic
map
per p
lus
prov
ides
ear
th o
bser
vatio
n us
ing
8 ba
nds
30 m
Free
Evan
gelis
ta e
t al.
(200
8); L
ima
et a
l. (2
019)
Land
sat 8
OLI
(Ope
ratio
nal L
and
Man
ager
)It,
is la
unch
ed in
201
3, h
as 9
spe
ctra
l ban
ds w
ith
16-d
ay te
mpo
ral r
esol
utio
n us
ing
Land
sat 8
OLI
an
d Th
erm
al In
frare
d Se
nsor
30 m
Free
Khar
e et
al.
(201
9); M
eron
i et a
l. (2
017)
Sent
inel
1It
is d
esig
ned
and
deve
lope
d by
the
Euro
pean
sa
telli
te a
genc
y an
d fu
nded
by
the
Euro
pean
Co
mm
issi
on
5 m
to 4
0 m
Free
Raja
h et
al.
(201
9)
Sent
inel
2It
was
laun
ched
in 2
015
(Sen
tinel
2A
) and
201
7 (S
entin
el 2
B) p
rovi
ding
dat
a at
five
day
s (a
t the
eq
uato
r) te
mpo
ral r
esol
utio
n ha
ving
13
spec
tral
ba
nds
10–6
0 m
Free
Aro
goun
dade
et a
l. (2
019)
; Frit
z (2
018)
; Kia
la e
t al.
(201
9); L
ima
et a
l. (2
019)
; Ng
et a
l. (2
017)
Spot
6SP
OT
6 an
opt
ical
imag
ing
was
laun
ched
in 2
012
aim
ed fo
r diff
eren
t app
licat
ions
1.5–
6 m
Com
mer
cial
Khar
e et
al.
(201
9)
SRTM
Shut
tle R
adar
Top
ogra
phic
Mis
sion
(SRT
M) a
imed
to
pro
vide
topo
grap
hic
data
for 8
0% o
f the
land
su
rfac
e w
as la
unch
ed in
200
0. It
can
be
used
for
diffe
rent
app
licat
ions
incl
udin
g hy
drol
ogy
and
vege
tatio
n
30–9
0 m
Free
Girm
a et
al.
(201
5); H
erna
ndez
et a
l. (2
006)
; Vác
laví
k an
d M
eent
emey
er (2
012)
; Wak
ie e
t al.
(201
4)
GTO
PO30
Glo
bal T
opog
raph
ic D
ata
(GTO
PO30
) is
a G
loba
l D
igita
l DEM
sin
ce 1
993
1 km
Free
Truo
ng e
t al.
(201
7)
Wor
ld v
iew
2It
prov
ides
hig
h-re
solu
tion
imag
ery
of p
anch
ro-
mat
ic a
nd e
ight
mul
tispe
ctra
l ban
ds. I
t is
used
for
diffe
rent
app
licat
ions
1.8
mCo
mm
erci
alEl
kind
et a
l. (2
019)
; Paz
-Kag
an e
t al.
(201
9)
LiD
AR
Ligh
t Det
ectio
n A
nd R
angi
ng (L
iDA
R) c
omm
only
us
ed to
pro
vide
hig
h-re
solu
tion
map
s us
ing
lase
r lig
ht
On-
dem
and
Com
mer
cial
Sank
ey e
t al.
(201
7)
Aer
ial p
hoto
grap
hTh
e ae
rial p
hoto
grap
h is
defi
ned
as ta
king
pho
to-
grap
hs fr
om a
ircra
ft o
r flyi
ng o
bjec
ts. I
t pro
vide
s hi
gh-r
esol
utio
n im
ager
y fo
r diff
eren
t app
licat
ions
On-
dem
and
Com
mer
cial
Mül
lero
vá e
t al.
(201
7)

Page 13 of 18Ahmed et al. Environ Syst Res (2020) 9:32
Tabl
e 4
(con
tinu
ed)
Clim
ate
and
EO d
atas
ets
Des
crip
tion
Spat
ial r
esol
utio
nA
cces
sibi
lity
Refe
renc
es
SAR
Synt
hetic
Ape
rtur
e Ra
dar (
SAR)
is a
type
of r
adar
ai
med
to p
rovi
de fi
ne re
solu
tion
rada
r dat
a th
at
can
be u
sed
for d
iffer
ent a
pplic
atio
ns
It de
pend
s on
the
type
of S
AR
Com
mer
cial
Raja
h et
al.
(201
8)
Rapi
d Ey
eIt
is a
gro
up o
f five
ear
th o
bser
vatio
n sa
telli
tes
aim
ed a
t pro
vidi
ng h
igh-
reso
lutio
n im
ages
at fi
ve
spec
tral
ban
ds
6.5
mCo
mm
erci
alKh
are
et a
l. (2
019)
Plei
ades
The
Plei
ades
is a
gro
up o
f tw
o sa
telli
tes
that
pro
vide
gl
obal
dat
a at
26
days
of t
empo
ral r
esol
utio
n0.
5–2
mCo
mm
erci
alN
g et
al.
(201
7)
Qui
kSC
AT
Qui
kSC
AT s
atel
lite
is a
mic
row
ave
rada
r aim
ed to
m
easu
re n
ear-
surf
ace
win
d sp
eed
and
dire
ctio
n2.
25 k
mFr
eePr
ates
-Cla
rk e
t al.
(200
8); S
aatc
hi e
t al.
(200
8)
Eart
h ob
serv
ing-
1 H
yper
ion
(EO
-1)
It w
as la
unch
ed in
200
0 ai
med
at p
rovi
ding
diff
er-
ent a
pplic
atio
ns in
clud
ing
the
spec
tral
defi
nitio
n of
fore
st c
anop
y an
d st
ruct
ure.
Hyp
erio
n an
d A
dvan
ced
Land
Man
ager
are
the
two
mai
n in
stru
-m
ents
use
d in
EO
-1
30 m
Free
Som
ers
and
Asn
er (2
012)

Page 14 of 18Ahmed et al. Environ Syst Res (2020) 9:32
important advancement, as the integrating of different sensors will not only permit a better temporal and spatial resolution but will also leverage synergies from different band settings (Rajah et al. 2018). Furthermore, evaluat-ing and boosting the capability of machine learning algo-rithms for the prediction of invasive species is necessary.
Bioclimatic variables derived from the WorldClim database are a good source of information for the predic-tion of invasive species. However, these records need to be updated using recent climate data as the latest version considers interpolation of climate data only from 1970 to 2000. Besides, there is also a need to integrate bioclimatic variables of WorldClim with remotely sensed bioclimatic variables to obtain a better spatial and temporal resolu-tion. Moreover, evaluating the integration of remotely sensed environmental variables with bioclimatic varia-bles in the prediction of invasive species is also necessary. Several studies (Truong et al. 2017; Cord et al. 2014a, b; Engler et al. 2013; Buermann et al. 2008) tried to evaluate the efficiency of bioclimatic and remote sensing variables separately and in combination. However, similar studies should be motivated for different species and geographic areas.
ConclusionThe integration of remote sensing and bioclimatic varia-bles with SDM has the potential to play a key role in map-ping and prediction of invasive species especially in arid and semi-arid areas where accessibility of environmental data is a challenge. Both datasets have their own advan-tages and hence it can be expected that the integration of both datasets provides richer and more predictive infor-mation. In data-poor regions where survey data is sparse, remote sensing can provide useful information due to its multi-temporal, spatial, and spectral resolution, and the resulting possibility to identify invasive species and to map certain environmental variables. On the other side, bioclimatic variables can solve some of the limitations of remotely sensed variables in relation to climate data. Hence, persistent information can possibly be obtained through the integration of both data sets. The integra-tion of both datasets should in our opinion—and sup-ported by the research community—be considered as a viable tool to increase the efficiency of SDM even though more research is required. It is also necessary to give due attention to presenting the guiding principle that helps to select variables and models for better accuracy of SDM. Furthermore, it is also necessary to validate remotely sensed (bio) climatic datasets and their integration with (spatially interpolated climate) data.
AbbreviationsSDM: Species Distribution Modelling; EO: Earth Observation; NDVI: Normalized Difference Vegetation Index; LAI: Leaf Area Index; EVI: Enhanced Vegetation Index; CRU : Climatic Research Unit; TRMM: Tropical Rainfall Measuring Mission; MODIS: Moderate Resolution Imaging Spectrometer; MSR: Modified Simple Ratio Index; RDVI: Renormalized Difference Vegetation Index; MCARI1: Modi-fied Chlorophyll Absorption Ratio Index; GLM: Generalized Linear Model; RF: Random Forest; GAM: Generalized Additive Model; GBM: Gradient Boosted Model; SVM: Support Vector Machine; MARS: Multivariate Adaptive Regression Splines; UAV: Unmanned Aerial Vehicle; OLI: Operational Land Manager; SRTM: Shuttle Radar Topographic Mission; GTOP30: Global Topographic data; LiDAR: Light Detection and Ranging; SAR: Synthetic Aperture Radar.
AcknowledgmentsThis review paper is part of the doctoral study entitled “role of remote sensing in invasive species distribution modeling, the case of the lower Awash River basin, Ethiopia”. We would like to thank Wollo University and the Ethiopian Space Science and Technology Institute (ESSTI) for allowing this doctoral study.
Authors’ contributionsAll authors made a valuable contribution. NA designed and wrote the methodology, collect literature, carried out data analysis, and wrote the draft manuscript; CA refines the methodology, support in collecting additional literature, rewrite the manuscript; and WZ supports in refining methodology, collection of additional literature, and refining the manuscript. All authors read and approved the final manuscript.
FundingNone.
Availability of data and materialsNot applicable.
Ethics approval and consent to participateNot applicable.
Consent for publicationThe authors agreed to submit the manuscript for publication in Environmental Systems Research. Besides we obtained permission from the publisher and author for Figs. 2 and 5 respectively.
Competing interestsThe authors declare that there is no conflict of interest.
Author details1 Department of Remote Sensing, Ethiopian Space Science and Technol-ogy Institute (ESSTI), Entoto Observatory and Research Center, Addis Ababa, Ethiopia. 2 Institute for Surveying, Remote Sensing and Land Information (IVFL), University of Natural Resources and Life Sciences, Vienna (BOKU), Peter JordanStraße 82, 1190 Vienna, Austria.
Received: 29 August 2020 Accepted: 26 October 2020
ReferencesAhmadi K, Alavi SJ, Amiri GZ, Hosseini SM, Serra-Diaz JM, Svenning J (2020) The
potential impact of future climate on the distribution of European yew (Taxus baccata L.) in the Hyrcanian Forest region (Iran). Int J Biomete-orol. https ://doi.org/10.1007/s0048 4-020-01922 -z
Amiri M, Tarkeshi M, Jafari R, Jetschke G (2020) Bioclimatic variables from precipitation and temperature records vs. remote sensing-based bio-climatic variables: which side can perform better in species distribution modeling. Ecol Inform 57(101060):1–16. https ://doi.org/10.1016/j.ecoin f.2020.10106 0

Page 15 of 18Ahmed et al. Environ Syst Res (2020) 9:32
Aranda SC, Lobo JM (2011) How well does presence-only-based species distribution modeling predict assemblage diversity? a case study of the Tenerife flora. Ecography 34:31–38. https ://doi.org/10.1111/j.1600-0587.2010.06134 .x
Arogoundade AM, Odindi J, Mutanga O (2019) Modelling Parthenium hysterophorus invasion in KwaZulu-Natal province using remotely sensed data and environmental variables. Geocarto Int. https ://doi.org/10.1080/10106 049.2019.15812 68
Asner GP, Knapp DE, Kennedy-bowdoin T, Jones MO, Martin RE, Boardman J, Hughes RF (2008) Invasive species detection in Hawaiian rainforests using airborne imaging spectroscopy and LiDAR. Remote Sens Environ 112:1942–1955. https ://doi.org/10.1016/j.rse.2007.11.016
Ayanu Y, Jentsch A, Müller-Mahn D, Rettberg S, Romankiewicz C, Koellner T (2014) Ecosystem engineer unleashed: Prosopis juliflora threatening ecosystem services? Reg Environ Change 15(1):155–167. https ://doi.org/10.1007/s1011 3-014-0616-x
Bartz R, Kowarik I (2019) Assessing the environmental impacts of invasive alien plants : a review of assessment approaches. NeoBiota 43:69–99. https ://doi.org/10.3897/neobi ota.43.30122
Beaumont LJ, Hughes L, Poulsen M (2005) Predicting species distributions: use of climatic parameters in BIOCLIM and its impact on predictions of species’ current and future distributions. Ecol Model 186:251–270. https ://doi.org/10.1016/j.ecolm odel.2005.01.030
Bekele K, Haji J, Legesse B, Schaffner U (2018) Economic impacts of Prosopis spp. invasions on dryland ecosystem services in Ethiopia and Kenya: evidence from choice experimental data. J Arid Environ. https ://doi.org/10.1016/j.jarid env.2018.07.001
Bellard C, Jeschke JM, Leroy B, Mace GM (2018) Insights from modeling studies on how climate change affects invasive alien species geography. Ecol Evol. https ://doi.org/10.1002/ece3.4098
Beyene H, Tessema T (2015) Distribution, abundance, and socio-economic impacts of parthenium (Parthenium hysterophorus). J Poverty Invest-ment Dev 19:22–29
Boyd DS, Foody GM (2011) An overview of recent remote sensing and GIS-based research in ecological informatics. Ecol Inform 6:25–36. https ://doi.org/10.1016/j.ecoin f.2010.07.007
Bradley BA (2014) Remote detection of invasive plants: a review of spectral, textural, and phenological approaches. Biol Invasions. https ://doi.org/10.1007/s1053 0-013-0578-9
Bradley BA, Allen JM, O’Neill MW, Wallace RD, Bargeron CT, Richburg JA, Stinson K (2018) Invasive species risk assessments need more consist-ent spatial abundance data. Ecosphere 9(7):e02302. https ://doi.org/10.1002/ecs2.2302
Bradley BA, Fleishman E (2008) Can remote sensing of land cover improve spe-cies distribution modeling? J Biogeogr 35:1158–1159. https ://doi.org/10.1111/j.1365-2699.2008.01928 .x
Bradley BA, Mustard JF (2006) Characterizing the landscape dynamics of an invasive plant and risk of invasion using remote sensing. Ecol Appl 16(3):1132–1147
Bucklin DN, Basille M, Romañach SS, Brandt LA, Mazzotti FJ, Watling JI, Mazzotti F (2016) Considerations for building climate-based species distribution models. UF/IFAS extension University of Florida WE375: 1–8.
Buermann W, Saatchi S, Smith TB, Zutta BR, Chaves JA, Milá B, Graham CH (2008) Predicting species distributions across the Amazonian and Andean regions using remote sensing data. J Biogeogr. https ://doi.org/10.1111/j.1365-2699.2007.01858 .x
Cayuela L, Golicher DJ, Newton AC, Kolb M, de Alburquerque FS, Arets EJMM, Alkemade JRM, Pérez AM (2009) Species distribution modeling in the tropics: problems, potentialities, and the role of biological data for effective species conservation. Trop Conserv Sci 2(3):319–352
Cord AF, Klein D, Gernandt DS, de la Rosa JAP, Dech S (2014) Remote sensing data can improve predictions of species richness by stacked spe-cies distribution models: a case study for Mexican pines. J Biogeogr 41:736–748. https ://doi.org/10.1111/jbi.12225
Cord AF, Klein D, Mora F, Dech S (2014) Comparing the suitability of classified land cover data and remote sensing variables for modeling distribution patterns of plants. Ecol Model 272:129–140. https ://doi.org/10.1016/j.ecolm odel.2013.09.011
Cord AF, Meentemeyer RK, Leitao PJ, VaclaviK T (2013) Modelling species distri-butions with remote sensing data: bridging disciplinary perspectives. J Biogeogr 40:2226–2227. https ://doi.org/10.1111/jbi.12199
Cord A, Rodder D (2011) Inclusion of habitat availability in species distribu-tion models through multi-temporal remote-sensing data? Ecol Appl 21(8):3285–3298
Deblauwe V, Droissart V, Bose R, Sonké B, Blach-Overgaard A, Svenning J-C, Wieringa JJ, Ramesh BR, Stévart T, Couvreur TLP (2016) Remotely sensed temperature and precipitation data improve species distribution modeling in the tropics. Global Ecol Biogeogr 25:443–454. https ://doi.org/10.1111/geb.12426
Diniz Filho JAF, Ferro VG, Santos T, Nabout JC, Dobrovolski R, De Marco JP (2010) The three phases of the ensemble forecasting of niche models: geographic range and shifts in climatically suitable areas of Utetheisa ornatrix. Revista Brasileira de Entomologia 54(3):339–349
Dubula B, Tesfamichael SG, Rampedi IT (2016) Assessing the potential of remote sensing to discriminate invasive Asparagus laricinus from adjacent land cover types. Cogent Geoscience 2:1154650. https ://doi.org/10.1080/23312 041.2016.11546 50
Elkind K, Sankey TT, Munson SM, Aslan CE (2019) Invasive buffelgrass detec-tion using high-resolution satellite and UAV imagery on Google Earth Engine. Remote Sens Ecol Conserv. https ://doi.org/10.1002/rse2.116
Engler R, Waser LT, Zimmermann NE, Schaub M, Berdos S, Ginzler C, Psomas A (2013) Combining ensemble modeling and remote sensing for map-ping individual tree species at high spatial resolution. For Ecol Manage 310:64–73. https ://doi.org/10.1016/j.forec o.2013.07.059
Evangelista PH, Kumar S, Stohlgren TJ, Jarnevich CS, Crall AW, Norman JB, Barnett DT (2008) Modelling invasion for a habitat generalist and a specialist plant species. Diversity Distrib 14:808–817. https ://doi.org/10.1111/j.1472-4642.2008.00486 .x
Feilhauer H, He KS, Rocchini D (2012) Modeling species distribution using niche-based proxies derived from composite bioclimatic variables and MODIS NDVI. Remote Sens 4:2057–2075. https ://doi.org/10.3390/rs407 2057
Feilhauer H, Thonfeld F, Faude U, He KS, Rocchini D, Schmidtlein S (2013) Assessing floristic composition with multispectral sensors—a com-parison based on monotemporal and multiseasonal field spectra. Int J Appl Earth Observ Geoinform 21:218–229. https ://doi.org/10.1016/j.jag.2012.09.002
Fernández M, Hamilton H (2015) Ecological niche transferability using invasive species as a case study. PLoS ONE 10(3):e0119891. https ://doi.org/10.1371/journ al.pone.01198 91
Fernandez M, Hamilton H, Kueppers L (2013) Characterizing uncertainty in species distribution models derived from interpolated weather station data. Ecosphere 4(5):61. https ://doi.org/10.1890/ES13-00049
Fischer D, Thomas SM, Suk JE, Sudre B, Hess A, Tjaden NB, Beierkuhnlein C, Semenza JC (2013) Climate change effects on chikungunya transmis-sion in Europe: Geospatial analysis of vector’s climatic suitability and virus’ temperature requirements. Int J Health Geographics 12(51):1–12. https ://doi.org/10.1186/1476-072X-12-51
Fithian W, Elith J, Hastie T, Keith DA (2014) Special feature paper: bias cor-rection in species distribution models: pooling survey and col-lection data for multiple species. Methods Ecol Evol. https ://doi.org/10.1111/2041-210X.12242
Fritz A, Li L, Storch I, Koch B (2018) UAV-derived habitat predictors contribute strongly to understanding avian species—habitat relationships on the Eastern Qinghai-Tibetan Plateau. Remote Sens Ecol Conserv. https ://doi.org/10.1002/rse2.73
Früh L, Kampen H, Kerkow A, Schaub GA, Walther D, Wieland R (2018) Modelling the potential distribution of an invasive mosquito species: comparative evaluation of four machine learning methods and their combinations. Ecol Model 388:136–144. https ://doi.org/10.1016/j.ecolm odel.2018.08.011
Ge S, Everitt J, Carruthers R, Gong P, Anderson G (2006) Hyperspectral charac-teristics of canopy components and structure for phenological assess-ment. Environ Monit Assess 120:109–126. https ://doi.org/10.1007/s1066 1-005-9052-1
Girma A, de Bie CAJM, Skidmore AK, Venus V, Bongers F (2015) Hyper-temporal SPOT-NDVI dataset parameterization captures species distribu-tions. Int J Geographical Inform Sci. https ://doi.org/10.1080/13658 816.2015.10825 65
Godoy O, de Lemos-Filho JP, Valladares F (2011) Invasive species can handle higher leaf temperatures under water stress than Mediterranean

Page 16 of 18Ahmed et al. Environ Syst Res (2020) 9:32
natives. Environ Exp Bot 71:207–214. https ://doi.org/10.1016/j.envex pbot.2010.12.001
Gormley AM, Forsyth DM, Griffioen P, Lindeman M, Ramsey DSL, Scroggie MP, Woodford L (2011) Using presence-only and presence-absence data to estimate the current and potential distributions of estab-lished invasive species. J Appl Ecol 48:25–34. https ://doi.org/10.1111/j.1365-2664.2010.01911 .x
Guisan A, Zimmermann NE, Elith J, Graham CH, Phillips S, Peterson AT (2007) What matters for predicting the occurrences of trees: techniques, data, or species’ characteristics? Ecol Monogr 77(4):615–630. https ://doi.org/10.1890/06-1060.1
He KS, Bradley BA, Cord AF, Rocchini D, Tuanmu M, Schmidtlein S, Turner W, Wegmann M, Pettorelli N (2015) Will remote sensing shape the next generation of species distribution models ? Remote Sens Ecol Conserv. https ://doi.org/10.1002/rse2.7
Hernandez PA, Graham CH, Master LL, Albert DL (2006) The effect of sample size and species characteristics on performance of different species distribution modeling methods. Ecography 29:773–785
Heshmati I, Khorasani N, Shams-Esfandabad B, Riazi B (2019) Forthcoming risk of Prosopis juliflora global invasion triggered by climate change: implications for environmental monitoring and risk assessment. Environ Monit Assess 191(72):1–12. https ://doi.org/10.1007/s1066 1-018-7154-9
Hijmans RJ, Cameron SE, Parra JL, Jones PG, Jarvis A (2005) Very high resolu-tion interpolated climate surfaces for global land areas. Int J Climatol 25:1965–1978. https ://doi.org/10.1002/joc.1276
Huang C-Y, Asner GP (2009) Applications of remote sensing to alien invasive plant studies. Sensors 9:4869–4889. https ://doi.org/10.3390/s9060 4869
Hundessa N, Fufa A (2016) Distribution and socio-economic impacts of Pros-opis juliflora in East Shewa and West Arsi Zones, Ethiopia. Int J African Asian Stud 24:31–41
Iluker J, Birner R, Tilahun M, Getu S (2014) A social-economic assessment of the impact of Prosopis juliflora invasion and participative management approach in the Afar Region, Ethiopia. Managing Prosopis Juliflora for Better (Agro-) Pastoral Livelihoods in the Horn of Africa 30–38.
Ilukor J, Rettberg S, Treydte A, Birner R (2016) To eradicate or not to eradicate? Recommendations on Prosopis juliflora management in Afar, Ethiopia, from an interdisciplinary perspective. Pastoralism Res Policy Pract 6(14):1–8. https ://doi.org/10.1186/s1357 0-016-0061-1
Immitzer M, Neuwirth M, Böck S, Brenner H, Vuolo F, Atzberger C (2019) Optimal Input Features for tree species classification in Central Europe Based on Multi-Temporal Sentinel-2 Data. Remote Sens 11(2599):1–23. https ://doi.org/10.3390/rs112 22599
Jensen T, Hass FS, Akbar MS, Petersen PH, Arsanjani JJ (2020) Employing machine learning for detection of invasive species using Sentinel-2 and AVIRIS data: the case of Kudzu in the United States. Sustainability 12(3544):1–16. https ://doi.org/10.3390/SU120 93544
Jones CC (2012) Challenges in predicting the future distributions of invasive plant species. For Ecol Manage 284:69–77. https ://doi.org/10.1016/j.forec o.2012.07.024
Kapitza K, Zimmermann H, Martín-lópez B, Von Wehrden H (2019) Research on the social perception of invasive species: a systematic literature review. NeoBiota 43:47–68. https ://doi.org/10.3897/neobi ota.43.31619
Khare S, Latifi H, Rossi S, Ghosh SK (2019) Fractional cover mapping of invasive plant species by combining very high-resolution stereo and multi-sensor multispectral imageries. Forests 10(540):1–15. https ://doi.org/10.3390/f1007 0540
Kiala Z, Mutanga O, Odindi J, Peerbhay K (2019) Feature selection on sentinel-2 multispectral imagery for mapping a landscape infested by parthenium weed. Remote Sens 11(1892):1–17. https ://doi.org/10.3390/rs111 61892
Kissling WD, Ahumada JA, Bowser A, Fernandez M, Fern´andez N, García EA, et al (2018) Building essential biodiversity variables (EBVs) of species distribution and abundance at a global scale. Biol Rev 93:600–625. https ://doi.org/10.1111/brv.12359
Klerk H, Buchanan G (2017) Remote sensing training in African conservation. Remote Sens Ecol Conserv. https ://doi.org/10.1002/rse2.36
Leitão PJ, Santos MJ (2019) Improving models of species ecological niches: a remote sensing overview. Ecol Evol Front. https ://doi.org/10.3389/fevo.2019.00009
Li G, Xu G, Guo K, Du S (2014) Mapping the global potential geographical distribution of black locust (Robinia Pseudoacacia L.) using herbarium
data and a maximum entropy model. Forests 5:2773–2792. https ://doi.org/10.3390/f5112 773
Lima TA, Beuchle R, Langner A, Grecchi RC, Griess VC, Achard F (2019) Comparing sentinel-2 MSI and landsat 8 OLI Imagery for monitoring selective logging in the Brazilian Amazon. Remote Sens 11(961):1–21. https ://doi.org/10.3390/rs110 80961
Loew A, Bell W, Brocca L, Bulgin CE, Burdanowitz J, Calbet X et al (2017) Validation practices for satellite-based Earth observation data across communities. Rev Geophys 55:779–817. https ://doi.org/10.1002/2017R G0005 62
Matongera TN, Mutanga O, Dube T, Lottering RT (2016) Detection and mapping of bracken fern weeds using multispectral remotely sensed data: a review of progress and challenges. Geocarto Int. https ://doi.org/10.1080/10106 049.2016.12407 19
Meroni M, Ng W-T, Rembold F, Leonardi U, Atzberger C, Gadain H, Shaiye M (2017) Mapping Prosopis juliflora in West Somaliland with Landsat 8 Satellite imagery and ground information. Land Degrad Dev 28:494–506. https ://doi.org/10.1002/ldr.2611
Müllerová J, Bruna J, Bartalos T, Dvorak P, Vitkova M, Pyšek P (2017) Timing is important : unmanned aircraft vs. satellite imagery in plant invasion monitoring. Front Plant Sci. https ://doi.org/10.3389/fpls.2017.00887
Ng W-T, Silva ACO, Rima P, Atzberger C, Immitzer M (2018) Ensemble approach for potential habitat mapping of invasive Prosopis spp. in Turkana Kenya. Ecol Evol 8(23):1–11. https ://doi.org/10.1002/ece3.4649
Ng W-T, Rima P, Einzmann K, Immitzer M, Atzberger C, Eckert S (2017) Assessing the potential of sentinel-2 and pléiades data for the detec-tion of prosopis and vachellia spp. In Kenya. Remote Sens 9(74):1–29. https ://doi.org/10.3390/rs901 0074
Oumar Z (2016) Assessing the utility of the SPOT 6 sensor in detecting and mapping lantana camara for a community clearing project in KwaZulu-Natal, South Africa. South Afr J Geomatics 5(2):214–226. https ://doi.org/10.4314/sajg.v5i2.9
Ouyang Z-T, Gao Y, Xie X, Guo H-Q, Zhang T-T, Zhao B (2013) Spectral discrimination of the invasive plant spartina alterniflora at multiple phenological stages in a saltmarsh wetland. PLoS ONE 8(6):e67315. https ://doi.org/10.1371/journ al.pone.00673 15
Paz-Kagan T, Silver M, Panov N, Karnieli A (2019) Multispectral approach for identifying invasive plant species based on flowering phenology characteristics. Remote Sens 11(953):1–18. https ://doi.org/10.3390/rs110 80953
Phillips SJ, Anderson RP, Schapire RE (2006) Maximum entropy modeling of species geographic distributions. Ecol Model 190:231–259. https ://doi.org/10.1016/j.ecolm odel.2005.03.026
Piiroinen R, Fassnacht FE, Heiskanen J, Maeda E, Mack B, Pellikka P (2018) Invasive tree species detection in the Eastern Arc Mountains biodi-versity hotspot using one-class classification. Remote Sens Environ 218:119–131. https ://doi.org/10.1016/j.rse.2018.09.018
Prates-Clark C, Saatchi SS, Agosti D (2008) Predicting geographical dis-tribution models of high-value timber trees in the Amazon Basin using remotely sensed data. Ecol Model 211:309–323. https ://doi.org/10.1016/j.ecolm odel.2007.09.024
Rajah P, Odindi J, Mutanga O (2018) Evaluating the potential of freely available multispectral remotely sensed imagery in mapping American bramble (Rubus cuneifolius). S Afr Geogr J. https ://doi.org/10.1080/03736 245.2018.14616 83
Rajah P, Odindi J, Mutanga O, Kiala Z (2019) The utility of Sentinel-2 Vegeta-tion Indices (VIs) and Sentinel-1 Synthetic Aperture Radar (SAR) for invasive alien species detection and mapping. Nat Conserv 35:41–61. https ://doi.org/10.3897/natur econs ervat ion.35.29588
Re D, Tordoni E, De Pascalis F, Negrı´n-Pe´rez Z, Ferna´ndez-Palacios J, Are´valo J, et al (2020) Invasive fountain grass (Pennisetum setaceum (Forssk) increases its potential area of distribution in Tenerife island under future climatic scenarios. Plant Ecol. https ://doi.org/10.1007/s1125 8-020-01046 -9
Richter K, Atzberger C, Hank TB, Mauser W (2012) Derivation of biophysi-cal variables from Earth observation data: validation and statistical measures. Appl Remote Sens 6:1–24. https ://doi.org/10.1117/1.JRS.6.06355 7
Rocchini D, Boyd DS, Feret J-B, Foody GM, He KS, Lausch A, Nagendra H, Wegmann M, Pettorelli N (2015) Satellite remote sensing to monitor

Page 17 of 18Ahmed et al. Environ Syst Res (2020) 9:32
species diversity: potential and pitfalls. Remote Sens Ecol Conserv. https ://doi.org/10.1002/rse2.9
Rocchini D, Andreo V, Forster M, Garzon-lopez CX, Gutierrez AP, Gillespie TW (2015) Potential of remote sensing to predict species invasions: a modeling perspective. Prog Phys Geogr 39(3):283–309. https ://doi.org/10.1177/03091 33315 57465 9
Royimani L, Mutanga O, Odindi J, Dube T (2018) Advancements in satel-lite remote sensing for mapping and monitoring of alien invasive plant species (AIPs). Phys Chem Earth. https ://doi.org/10.1016/j.pce.2018.12.004
Saatchi S, Buermann W, Steege H, Mori S, Smith TB (2008) Modeling distri-bution of Amazonian tree species and diversity using remote sensing measurements. Remote Sens Environ 112:2000–2017. https ://doi.org/10.1016/j.rse.2008.01.008
Sakate DM, Kashid DN (2016) A new robust model selection method in GLM with application to ecological data. Environ Syst Res 5(9):1–8. https ://doi.org/10.1186/s4006 8-016-0060-7
Sankey TT, Mcvay J, Swetnam TL, Mcclaran MP, Heilman P, Nicholas M (2017) UAV hyperspectral and lidar data and their fusion for arid and semi-arid land vegetation monitoring. Remote Sens Ecol Conserv. https ://doi.org/10.1002/rse2.44
Shackleton RT, Le Maitre DC, Van Wilgen BW, Richardson DM (2015) The impact of invasive alien Prosopis species (mesquite) on native plants in different environments in South Africa. South Afr J Botany 97:25–31. https ://doi.org/10.1016/j.sajb.2014.12.008
Shackleton RT, Le Maitre DC, Pasiecznik NM, Richardson DM (2014) Prosopis: A global assessment of the biogeography, benefits, impacts and management of one of the world’s worst woody invasive plant taxa. AoB PLANTS 6: plu027. https ://doi.org/10.1093/aobpl a/plu02 7
Shiferaw W, Demissew S, Bekele T (2018) Invasive alien plant species in Ethiopia: ecological impacts on biodiversity a review paper. Int J Mol Biol 3(4):169–176
Shiferaw H, Schaffner U, Bewket W, Alamirew T, Zeleke G, Teketay D, Eckert S (2019a) Modelling the current fractional cover of an invasive alien plant and drivers of its invasion in a dryland ecosystem. Sci Rep 9(1576):1–12. https ://doi.org/10.1038/s4159 8-018-36587 -7
Shiferaw H, Bewket W, Alamirew T, Zeleke G, Teketay D, Bekele K, Schaffner U, Eckert S (2019b) Implications of land use/land cover dynamics and Prosopis invasion on ecosystem service values in Afar Region, Ethiopia. Sci Total Environ 675:354–366. https ://doi.org/10.1016/j.scito tenv.2019.04.220
Shiferaw H, Bewket W, Eckert S (2019c) Performances of machine learning algorithms for mapping fractional cover of an invasive plant species in a dryland ecosystem. Ecol Evol. https ://doi.org/10.1002/ece3.4919
Shoko C, Mutanga O (2017) Examining the strength of the newly-launched Sentinel 2 MSI sensor in detecting and discriminating subtle differences between C3 and C4 grass species. ISPRS J Photogram-metry Remote Sens 129:32–40. https ://doi.org/10.1016/j.isprs jprs.2017.04.016
Singh K, Forbes A, Akombelwa M (2013) The Evaluation of high-resolution aerial imagery for monitoring of bracken fern. South Afr J Geomatics 2(4):296–308
Sintayehu DW, Dalle G, Bobasa AF (2020) Impacts of climate change on cur-rent and future invasion of Prosopis juliflora in Ethiopia: environmen-tal and socio-economic implications. Heliyon 6:e04596. https ://doi.org/10.1016/j.heliy on.2020.e0459 6
Somers B, Asner GP (2012) Hyperspectral time series analysis of native and invasive species in hawaiian rainforests. Remote Sens 4:2510–2529. https ://doi.org/10.3390/rs409 2510
Sun Y, Müller-schärer H, Maron JL, Schaffner U (2015) Origin mat-ters : diversity affects the performance of alien invasive species but not of native species. Am Nat 185(6):725–736. https ://doi.org/10.1086/68125 1
Taddese H (2014) Suitability analysis for Jatropha curcas production in Ethiopia—a spatial modeling approach. Environ Syst Res 3:25. https ://doi.org/10.1186/s4006 8-014-0025-7
Tamiru G (2017) Invasive alien weed species distribution, impacts on agriculture, challenge, and reaction in ethiopia: a review. J Biol Agric Healthcare 7(7):136–146
Thamaga KH, Dube T (2018a) Remote sensing of invasive water hyacinth (Eichhornia crassipes): a review on applications and challenges. Remote Sens Appl Soc Environ. https ://doi.org/10.1016/j.rsase .2018.02.005
Thamaga KH, Dube T (2018b) Testing two methods for mapping water hya-cinth (Eichhornia crassipes) in the Greater Letaba river system, South Africa: discrimination and mapping potential of the polar-orbiting Sentinel-2 MSI and Landsat 8 OLI sensors. Int J Remote Sens. https ://doi.org/10.1080/01431 161.2018.14797 96
Tola J, Tessema T (2019) Abundance and distribution of invasive alien plant species in Illu Ababora Zone abundance and distribution of invasive alien plant species in Illu Ababora Zone of Oromia National Regional State, Ethiopia. J Agric Sci Food Technol 1(7):94–100
Transon J, Andrimont R, Maugnard A, Defourny P (2018) Survey of hyper-spectral earth observation applications from space in the sentinel-2 context. Remote Sens 10(157):1–32. https ://doi.org/10.3390/rs100 20157
Tricarico E (2016) Do alien invasive species and climate change foster conservation behavior ? Aquatic Conserv: Mar. Freshw Ecosyst 26:228–232. https ://doi.org/10.1002/aqc.2637
Truong TTA, Hardy G, Andrew ME (2017) Contemporary remotely sensed data products refine invasive plants risk mapping in data-poor regions. Front Plant Sci 8:1–18. https ://doi.org/10.3389/fpls.2017.00770
Tuanmu M-N, Jetz W (2014) A global 1-km consensus land-cover product for biodiversity and ecosystem modeling. Global Ecol Biogeogr 23(9):1–15. https ://doi.org/10.1111/geb.12182
Urbina-Cardona N, Blair ME, London MC, Loyola R, Vela´squez-Tibata J, Morales-Devia H, (2019) Species distribution modeling in Latin America: a 25-year retrospective review. Trop Conserv Sci 12:1–19. https ://doi.org/10.1177/19400 82919 85405 8
Václavík T, Meentemeyer K (2012) Equilibrium or not? Modelling the poten-tial distribution of invasive species in different stages of invasion. Diversity Distrib 18:73–83
Vega GC, Pertierra LR, Olalla-tárraga MÁ (2017) Data descriptor: MERRAclim, a high-resolution global dataset of remotely sensed bioclimatic variables for ecological modeling. Sci Data. https ://doi.org/10.1038/sdata .2017.78
Vilà M, Espinar JL, Hejda M, Hulme PE, Jarošík V, Maron JL, Pergl J, Schaf-fner U, Sun Y, Pyšek P (2011) Ecological impacts of invasive alien plants: a meta-analysis of their effects on species, communities, and ecosystems. Ecol Lett 14:702–708. https ://doi.org/10.1111/j.1461-0248.2011.01628 .x
Vuolo F, Neuwirth M, Immitzer M, Atzberger C, Ng W-T (2018) How much does multi-temporal Sentinel-2 data improve crop type classifica-tion ? Int J Appl Earth Obs Geoinformation 72:122–130. https ://doi.org/10.1016/j.jag.2018.06.007
Wakie TT, Evangelista PH, Jarnevich CS, Laituri M (2014) Mapping current and potential distribution of non-native Prosopis juliflora in the Afar region of Ethiopia. PLoS ONE 9(11):3–11. https ://doi.org/10.1371/journ al.pone.01128 54
Wakjira M (2011) An invasive alien weed giant sensitive plant (Mimosa diplotricha Sauvalle) invading Southwestern Ethiopia. Afr J Agric Res 6(1):127–131. https ://doi.org/10.5897/AJAR1 0.421
Wessel M, Brandmeier M, Tiede D (2018) Evaluation of different machine learning algorithms for scalable classification of tree types and tree species based on sentinel-2 data. Remote Sens 10(1419):1–21. https ://doi.org/10.3390/rs100 91419
West AM, Wakie T, Evangelista PH (2014). Mapping distribution and forecast-ing invasion of mesquite (Prosopis juliflora) in Ethiopia Ecological Forecasting Issue December):1–18
Wilson JW, Sexton JO, Todd Jobe R, Haddad NM (2013) The relative con-tribution of terrain, land cover, and vegetation structure indices to species distribution models. Biol Cons 164:170–176. https ://doi.org/10.1016/j.bioco n.2013.04.021
Xie Y, Sha Z, Yu M (2008) Remote sensing imagery in vegetation mapping : a review. J Plant Ecol 1(1):9–23. https ://doi.org/10.1093/jpe/rtm00 5
Zhao M, Peng C, Xiang W, Deng X, Tian D, Zhou X, Yu G, He H, Zhao Z (2013) Plant phenological modeling and its application in global climate

Page 18 of 18Ahmed et al. Environ Syst Res (2020) 9:32
change research: overview and future challenges. Environ Rev 21:1–14. https ://doi.org/10.1139/er-2012-0036
Zimmermann NE, Edwards TC Jr, Moisen GG, Frescino TS, Blackard JA (2007) Remote sensing-based predictors improve distribution models of rare, early successional and broadleaf tree species in Utah. J Appl Ecol 44:1057–1067. https ://doi.org/10.1111/j.1365-2664.2007.01348 .x
Publisher’s NoteSpringer Nature remains neutral with regard to jurisdictional claims in pub-lished maps and institutional affiliations.
Copyright © 2022 FDOKUMEN