Expression of Chemoresistance-Associated ABC Proteins in ...

Integrated Genome-wide DNA Copy Number and ExpressionAnalysis Identifies Distinct Mechanisms of Primary Chemo-resistance in Ovarian Carcinomas
Dariush Etemadmoghadam1,2, Anna deFazio3, Rameen Beroukhim4, Craig Mermel4, JoshyGeorge1,2, Gaddy Getz4, Richard Tothill1, Aikou Okamoto5, Maria B Raeder6, AOCS StudyGroup1,3,7, Paul Harnett3, Stephen Lade1, Lars A Akslen8, Anna Tinker1, BiancaLocandro1, Kathryn Alsop1, Yoke-Eng Chiew3, Nadia Traficante1, Sian Fereday1, DarylJohnson1, Stephen Fox1, William Sellers9, Mitsuyoshi Urashima5, Helga B Salvesen6,10,Matthew Meyerson4, and David Bowtell1,2
1Peter MacCallum Cancer Centre, Locked Bag 1, A’Beckett St, Melbourne, Victoria 8006, Australia
2Department of Biochemistry and Molecular Biology, University of Melbourne, Parkville, Victoria, 3010,Australia
3Westmead Institute for Cancer Research, University of Sydney at Westmead Millennium Institute, WestmeadHospital, New South Wales 2145, Australia
4Broad Institute of Massachusetts Institute of Technology and Harvard, 7 Cambridge Center, Cambridge,MA 02142, USA
5Jikei University School of Medicine 3-25-8, Nishi-Shimbashi, Minatoku, Tokyo, 105-8461 Japan
6Department of Obstetrics and Gynecology, Haukeland University Hospital, Bergen, Norway
7Queensland Institute of Medical Research, Brisbane, Queensland 4006, Australia
8The Gade Institute, The University of Bergen, N-5021 Bergen, Norway
9Novartis Institutes for Biomedical Research, 250 Mass Ave, Cambridge, MA 02139, USA
10Institute of Clinical Medicine, The University of Bergen, N-5021 Bergen, Norway
AbstractPurpose—A significant number of women with serous ovarian cancer are intrinsically refractoryto platinum-taxol based treatment. We analyzed somatic DNA copy number variation (CNV) andgene expression data to identify key mechanisms associated with primary resistance in advanced-stage serous cancers.
Experimental Design—Genome-wide CNV was measured in 118 ovarian tumors using high-resolution oligonucleotide microarrays. A well-defined subset of 85 advanced-stage serous tumorswas then used to relate CNV to primary resistance to treatment. The discovery-based approach wascomplemented by quantitative-PCR copy number analysis of twelve candidate genes as independentvalidation of previously reported associations with clinical outcome. Likely CNV targets and tumormolecular subtypes were further characterized by gene expression profiling.
Corresponding Author, Professor David Bowtell, Peter MacCallum Cancer Centre. Locked Bag 1, A’Beckett Street, Melbourne, VIC8006, Australia, Telephone: +61 3 96561356, Fax: +61 3 96561414, Email: E-mail: [email protected].
NIH Public AccessAuthor ManuscriptClin Cancer Res. Author manuscript; available in PMC 2010 February 15.
Published in final edited form as:Clin Cancer Res. 2009 February 15; 15(4): 1417–1427. doi:10.1158/1078-0432.CCR-08-1564.
NIH
-PA Author Manuscript
NIH
-PA Author Manuscript
NIH
-PA Author Manuscript

Results—Amplification of 19q12, containing Cyclin E (CCNE1) and 20q11.22-q13.12, mappingimmediately adjacent to the steroid receptor co-activator NCOA3, were significantly associated withpoor response to primary treatment. Other genes previously associated with CNV and clinicaloutcome in ovarian cancer were not associated with primary treatment resistance. Chemoresistanttumors with high CCNE1 copy number and protein expression were associated with increased cellularproliferation but so too were a subset of treatment responsive patients, suggesting a cell-cycleindependent role for CCNE1 in modulating chemoresponse. Patients with a poor clinical outcomewithout CCNE1 amplification over expressed genes involved in extracellular matrix deposition.
Conclusions—We have identified two distinct mechanisms of primary treatment failure in serousovarian cancer, involving CCNE1 amplification and enhanced extracellular matrix deposition.CCNE1 copy number is validated as a dominant marker of patient outcome in ovarian cancer.
Relevance to Future Practice of Clinical MedicineResistance to chemotherapy in women with advanced stage ovarian cancer is a major clinicalproblem. We describe two distinct molecular mechanisms of resistance that have future clinicalrelevance for response prediction and the development of novel therapeutic strategies. The keyfinding that CCNE1 (cyclin E) amplification is strongly associated with treatment-resistancein ovarian carcinomas is consistent with previous associations with poor survival reported forovarian and other cancer types. Amplification status of CCNE1 therefore has potential fortherapeutic exploitation, whereby patients carrying CCNE1 amplification may benefit fromnovel, cyclin-related targeted treatments. Whereas a second group of patients, exhibiting analternative mode of resistance associated with host tissue elements and reactive stroma, arelikely to benefit from therapeutic strategies that target different activation pathways.
INTRODUCTIONStandard of care for women with advanced stage ovarian cancer involves primary cytoreductivesurgery followed by adjuvant chemotherapy with a platinum-based agent, often regarded asthe most active component, and a taxane (1). Whilst response rates to first-line treatment arehigh, 20-25% of cases relapse during or soon after the cessation of primary therapy (2). Theability to predict treatment response and the development of therapies to counter primarychemoresistance are key goals of ovarian cancer research. Known platinum-resistancemechanisms include reduced drug delivery to target DNA and failure of cells to initiate celldeath in response to platinum-induced DNA damage, due to defects in DNA damagerecognition, repair and apoptosis (3). However, most mechanistic studies on platinumresistance have been performed using in vitro cell models and few have been shown to berelevant in the clinical setting (3).
Chromosomal aberrations reflect oncogene activation and loss of tumor suppressor genes (4)and global surveys of DNA gain or loss have been considered a fertile area to search fordeterminants of chemoresistance and survival in ovarian cancer. Comparative genomichybridization (CGH) on metaphase spreads (5,6) has been superseded by higher resolutionarray CGH using large mapped insert clones (7,8) or oligonucleotide probes (9). Although anumber of chromosomal regions (6-8,10,11) and individual genes, including FGF1 (9),EVI1 (12), CCNE1 (13,14), PRKCI (15), RSF1 (16), RAB25 (17), BRCA1 (18), ERBB2 (19,20), MUC1 (21), IGF2R (22), ZNF217 (23) and MYC (24), have reported CNV linked to patientoutcome in ovarian cancer, most have not yet been validated in independent studies until now.
We performed both a discovery and validation study in a clinically well-characterized samplepopulation of ovarian tumors, comprising the largest cohort to be analyzed by both copynumber and gene expression microarrays to date. High-resolution oligonucleotide copy numberanalysis on 118 high grade serous ovarian cancers, including 85 tumors representing a carefully
Etemadmoghadam et al. Page 2
Clin Cancer Res. Author manuscript; available in PMC 2010 February 15.
NIH
-PA Author Manuscript
NIH
-PA Author Manuscript
NIH
-PA Author Manuscript

selected patient cohort, were used to identify recurrent regions of genomic change associatedwith primary treatment response. In parallel, we performed the first direct comparison of twelvegenes previously associated with CNV and clinical outcome in ovarian cancer, usingquantitative-PCR (qPCR).
Among six regions of CNV that were differentially altered in patients with either a good orpoor response to primary treatment, we show that amplification of 19q12, associated withCCNE1, and 20q13, mapped immediately adjacent to NCOA3, were significantly associatedwith chemoresistance.
Importantly CCNE1 was the only previously reported CNV associated with poor outcome inovarian cancer validated as a marker for primary chemoresistance. We also identify a groupof chemoresistant cases without CCNE1 amplification or increased cellular proliferation,which are characterized by increased expression of extracellular matrix related genes. Thisdata implies that patients without CCNE1 amplification and a poor response to treatment followa distinct molecular pathway to those cases with CCNE1 amplification, possibly involvingECM deposition from activated stroma.
MATERIALS AND METHODSPatients
The study population consisted of 118 patients diagnosed with epithelial ovarian, primaryperitoneal or fallopian tube cancer between 1988 and 2005 (Supplementary Table 1). Primarytreatment failure occurs in a minority of patients and is influenced by the adequacy of surgicaldebulking. We therefore pre-selected a cohort of patients from four studies to obtain adequatenumbers of responsive and resistant patients in our cohort; the Australian Ovarian Cancer Study(AOCS) (25), Westmead Hospital (Sydney, Australia), Haukeland University Hospital ofBergen (Bergen, Norway) or Jikei University (Tokyo, Japan). This project had institutionalethics review board approval at all participating centers.
Clinical Treatment and DefinitionsPatients underwent laparotomy for diagnosis, staging and tumor debulking and subsequentlyreceived first-line platinum based chemotherapy. Tumor material for the study was excised atthe time of primary surgery, prior to the administration of chemotherapy. Surgical staging wasassessed in accordance with FIGO (Fédération Internationale des Gynaecologistes etObstetristes) classification. Optimal debulking was defined as ≤ 1 cm (diameter) residualdisease, and sub-optimal debulking was more than 1 cm (diameter) residual disease.
A subset of 85 cases selected from the total cohort of 118 tumors were used to investigateresponse to therapy and survival (Table 1). The ‘clinical cohort’ included cases that had StageIII or IV serous invasive disease and received treatment including a platinum-based agent,carboplatin or cisplatin, administered without delay (within 6 weeks of surgery) and completedadequately (at least 4 cycles of platinum) unless disease progression was evident while on firstline treatment. Patients who had received neo-adjuvant chemotherapy were excluded.
The cohort was further stratified into platinum ‘Resistant’ and treatment ‘Responsive’ patientsbased on progression-free interval. Less than six months to disease progression was chosen asan endpoint to define Resistant cases due to its clinical relevance in identifying platinumresistant disease (1). ‘Resistant’ cases either progressed on primary treatment, had stabledisease (evidenced by persistently elevated CA125) or had a partial or complete CA125response and relapsed within six months from the end of primary chemotherapy.
Etemadmoghadam et al. Page 3
Clin Cancer Res. Author manuscript; available in PMC 2010 February 15.
NIH
-PA Author Manuscript
NIH
-PA Author Manuscript
NIH
-PA Author Manuscript

Given that sub-optimal debulking can contribute to rapid disease progression (26), any casewith > 2 cm residual disease or unknown debulking status were excluded from the ‘Resistant’group. Treatment ‘Responsive’ patients had a complete pathological response and/or noevidence of disease progression for a minimum of 9 months from the end of primary treatment.
Progressive disease was determined based on CA125 marker and imaging according toRECIST criteria modified for ovarian cancer (27) (28), or on clinical examination. Progression-free survival (PFS) was calculated as the interval between the end of primary treatment todisease progression; overall survival (OS) was defined as the time interval between the dateof surgery and the date of death from any cause.
Histological subtype and tumor grade (according to World Health Organization criteria) werederived from the diagnostic pathology reports. Although central pathology review of all caseswas not performed, hematoxylin and eosin (H&E) stained sections flanking the fresh-frozentissue used for nucleic acid extraction were reviewed by collaborating pathologists to assesscellular composition and confirm histology. Samples were only included if histology asassessed from the fresh-frozen slide review was consistent with the original pathology report.
Nucleic Acid ExtractionDNA was extracted from whole tumor tissue for samples with ≥ 80% neoplastic cells. Forsamples with < 80% overall tumor cells, needle dissection of serial tumor sections wasperformed to enrich for the epithelial fraction prior to DNA extraction. Needle-dissectedsamples were stained with cresyl-violet (Ambion, Austin, TX) to facilitate morphologicaldistinction between tumor and stromal elements. Genomic DNA was extracted using a DNeasykit (Qiagen, Valencia, CA) according to the manufacturer’s protocol and quantified byspectrophotometry. Total RNA from whole tumor samples was isolated by phenol-chloroformextraction (Invitrogen, Carlsbad, CA) and purified using Qiagen RNeasy columns (Qiagen,Valencia, CA) according to the standard protocol. RNA quality was assessed using theBioanalyzer 2100 (Agilent, Santa Clara, CA) prior to gene expression profiling.
SNP Mapping and Expression MicroarraysAffymetrix 50K XbaI SNP mapping arrays were used for genome-wide copy number analysis(29). Affymetrix U133plus2.0 arrays were used to measure gene expression of 47,000transcripts including 38,500 characterized genes. The mapping and expression array assayswere performed according to the manufacturer’s protocol (Affymetrix, Santa Clara, CA).Further experimental details are given in Supplementary Methods.
SNP Microarray Data AnalysisCNV frequency and amplitude (gain, amplification, single copy loss or homozygous deletion)was examined to determine the significance of CNV using GISTIC as described previously(30). After microarray and copy number normalization steps were applied, a G score wasgenerated for each SNP to assess copy number variation across all samples in the tumor set. AG score was calculated considering frequency of copy number change (f) and mean copynumber amplitude (c) equal to for amplifications and fordeletions. The background distribution of random G scores was estimated by permutationtesting of all marker labels and each G score then assigned a false discovery rate (FDR)corrected significance (q-value). A q-value cut-off of 0.25 was used to define significantregions of recurrent CNV. Within each region, the locus with minimal q-value was alsoidentified as the primary target or peak CNV, whilst allowing for one randomly aberrant samplethat may have shifted the peak boundary (29).
Etemadmoghadam et al. Page 4
Clin Cancer Res. Author manuscript; available in PMC 2010 February 15.
NIH
-PA Author Manuscript
NIH
-PA Author Manuscript
NIH
-PA Author Manuscript

GISTIC analysis was then performed on the treatment ‘Responsive’ and ‘Resistant’ classtumors separately to identify CNV that were either unique to one group or varied in frequencyor amplitude of CNV occurrence between classes. The difference in calculated G scores foreach peak SNP (Gi) identified by GISTIC in either the treatment Responsive and/or Resistant
classes was calculated, where . Each ΔG score was then assigned aFDR-corrected ΔG significance (ΔG p-value) by further permutation testing of all markervalues to generate the expected chance or background distribution of ΔG scores. Peak CNVwith ΔG p-values <0.05 were classified as Differentially Mapped Peaks (DMP).
Quantitative PCR (qPCR)SNP-based copy number was validated by qPCR on a subset 52 cases for which DNA wasavailable. PCR primers were designed using Primer3 (31) and selected to avoid known SNPsand not to amplify products with homology to other sequences (Supplementary Table 2). Toevaluate consistency of results, two independent primer sets were used to amplify each geneof interest, except for MYC and for MUC1/FGF1 where previously published primer sequenceswere used (9,21). Real-time quantitative-PCR was performed using SYBR Green qPCR on the7900HT Fast Real-Time PCR system (Applied Biosystems, Foster City, CA) as described inSupplementary Methods.
Expression Microarray Data AnalysisMatched SNP and expression data was available for 52 samples. In addition, 37 samples thatmet our clinical criteria but were not assayed by SNP array had expression data available(25). The combined data set (n = 89, Supplementary Table 3) was used to identify gene probe-sets within CNV regions with a significant correlation with clinical outcome. Transcriptionprofiling was also used to further characterize molecular subtypes of chemoresistant patientsas detailed in Supplementary Methods.
ImmunohistochemistryImmunohistochemistry was performed according to standard protocols using antibodiesagainst CCNE1 (Clone 13A3, LabVision, Fremont CA) and Ki-67 (Clone MIB1, Dako,Denmark) on tissue microarrays containing a subset of Stage III/IV, serous tumors from the‘clinical cohort’ as defined above (see Supplementary Methods). Staining was assessed by apathologist and images captured using an Olympus BX51 microscope.
RESULTSSignificant Regions of Amplification and Deletion in Ovarian Tumors
High-resolution analysis of a large cohort of tumors provided an unprecedented view ofcommon CNV in ovarian cancer. Data was analyzed using a statistically-robust algorithm(GISTIC) that sequentially filters the data and creates a probabilistic estimate of the mostsignificant regions of CNV and minimal or peak(s) loci within each region, likely to contain‘driver’ oncogenes or tumor suppressors. GISTIC analysis includes a quality control step wheretumor samples with insignificant detectable CNV are removed from the analysis (30). Froman original cohort of 128, ten samples were excluded from the final analysis due to suspectedstromal contamination. Supplementary Figure 1 shows summary information on CNV in thecohort of 118 cases, where regions of gain or loss are depicted according the significance ofCNV accounting for copy number frequency and magnitude. Genome coordinates for eachregion of CNV in addition to the minimally targeted peak(s) are given in Supplementary Table4. A total of 19 amplification peaks and 22 deletion peaks were identified. This study focusedon regions of amplification associated with primary treatment failure and further analysis ofpotential driver genes in regions of amplification and deletion will be described elsewhere.
Etemadmoghadam et al. Page 5
Clin Cancer Res. Author manuscript; available in PMC 2010 February 15.
NIH
-PA Author Manuscript
NIH
-PA Author Manuscript
NIH
-PA Author Manuscript

Amplification of 19q12 and 20q11.22-q13.12 are Significantly Associated with PrimaryChemoresistance
We next identified regions of CNV associated with clinical course following primary treatment(Figure 1). To ensure adequate numbers of cases to investigate primary treatment response, wecarefully selected a cohort of primary invasive serous ovarian cancer patients of 33 pooroutcome (Resistant) and 52 good outcome (treatment Responsive) cases, obtained fromAustralian, Japanese and Norwegian sample sets. The two groups were well-balanced forprognostic features (patient age, FIGO Stage, histopathological grade and extent of residualdisease following debulking surgery), with no statistically significant difference between anytested variable except progression-free survival (PFS) and overall survival (OS) (Table 1).
Copy number analysis performed separately on the ‘Resistant’ and treatment ‘Responsive’samples identified a total of 20 amplification peaks and 20 deletion peaks in the responsivetumors and 14 amplification peaks and 17 deletion peaks resistant class (Supplementary Table5 and 6).
The frequency and amplitude (G score) of each peak CNV was then compared between classesto identify genomic regions that were differentially amplified or deleted between responseclasses. We chose to focus only on the identified peak CNV (total of 71 distinct or overlappingpeaks between both classes) as these regions were considered most likely to contain CNV-targeted genes important in tumorigenesis and disease progression. By using only peak SNPs,as opposed to all >50,000 SNP makers, we also limit detection of chance correlations withoutcome variables associated multiple-hypothesis testing.
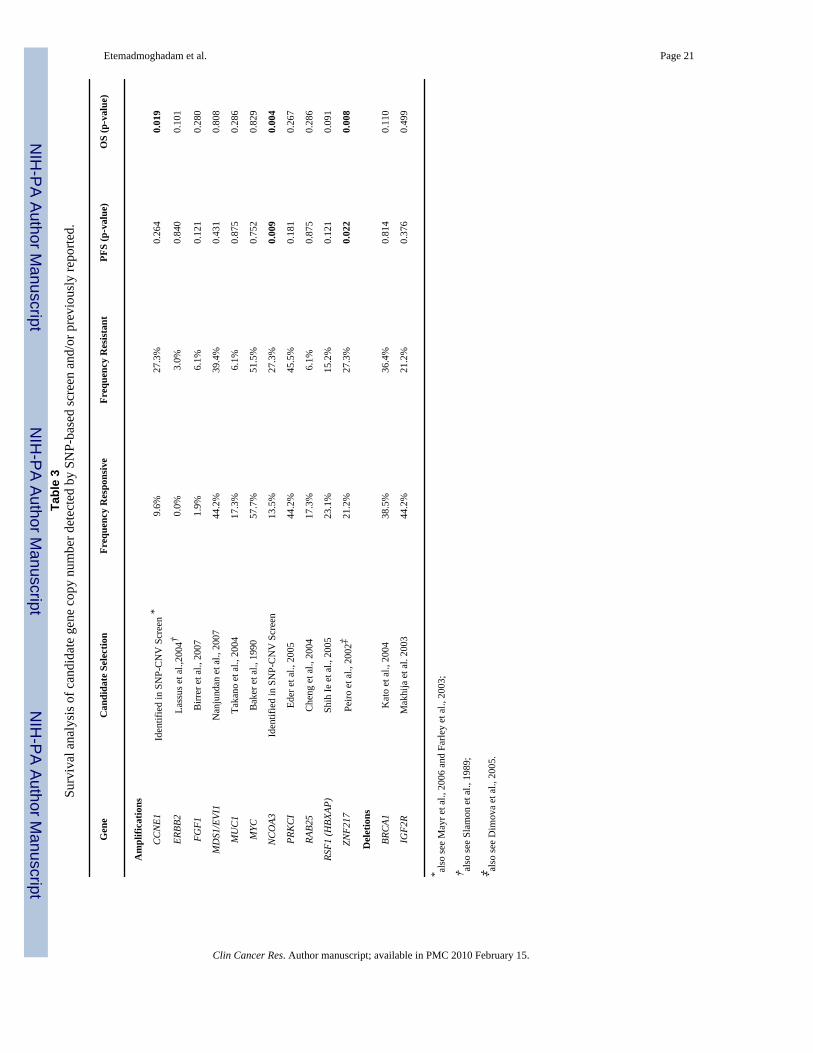
Six class-specific Differentially Mapped Peaks (DMP) were defined (Table 2). The twohighest-ranking DMP were amplification of 19q12 (incorporating CCNE1) and 20q11.22-q13.12 (immediately adjacent to NCOA3), which were more commonly associated with theResistant response class. Both 19q12 and 20q11.22-q13.12 copy number were also statisticallysignificantly associated with survival (PFS and/or OS) where time to clinical progression wasconsidered as a continuous variable (Table 3).
Figure 2 shows the G score profile for chromosome 19 and chromosome 20 using all tumorsand for each response class individually. The effect of class-specific tumor heterogeneity onG score values is evident for both DMP amplicons, where decreased G score values wereobserved in the combined analysis (Figure 2A and 2C) compared with an analysis of specificpatient subgroups (Figure 2B and 2D).
To identify the most likely driver genes within the amplicons, gene expression values for allprobes within the 19q12 and 20q11.22-q13.12 DMP were correlated with PFS and OS. Genesthat were significantly correlated (p<0.05) with either PFS or OS are shown in SupplementaryTable 7. These include CCNE1, contained within the 19q12 amplicon, and NCOA3, althoughnot within the peak, maps immediately distal (~0.7 Mb) to the 20q11.22-q13.12 amplicon.
In addition to identifying copy number associations between copy number and treatmentresponse in identified peak CNV we also directly tested copy number associations with PFSand OS of twelve literature derived candidates previously associated with clinical course inovarian cancer but may not have been localized within significant peak CNV as determinedby GISTIC analysis (Table 3). Genes included amplification of CCNE1, also identified by ourscreen, in addition to ERBB2, FGF1, MDS1/EVI1, MUC1, MYC, PRKCI, RAB25, RSF1,ZNF217 and deletion of BRCA1 and IGF2R (Table 3).
Gene copy number was estimated by SNP microarray using the copy number of SNPs withineach gene or the two flanking SNP markers. Of the tested genes CCNE1 was significantly
Etemadmoghadam et al. Page 6
Clin Cancer Res. Author manuscript; available in PMC 2010 February 15.
NIH
-PA Author Manuscript
NIH
-PA Author Manuscript
NIH
-PA Author Manuscript

associated with shorter OS, consistent with its localization within the 19q12 DMP associatedwith the treatment resistant class, and ZNF217 with shorter PFS and OS, despite not beingassociated with a primary treatment response group peak CNV specifically (Table 3).
Microarray-based copy number assessment of the two highest ranking DMP and the remainingliterature-derived candidates were technically validated by quantitative PCR (qPCR) (Table3). A high degree of concordance between SNP and qPCR data was observed for most genes(median Pearson correlation coefficient of 0.7) however FGF1 MUC1, PRKC1 and RAB25showed Pearson coefficients of <0.5 (Supplementary Figure 2). The difference may relate tolimitations of the microarray platform; although the 50K SNP arrays used in this study providedvery high-resolution genome-wide analysis of CNV, coverage of all areas was not equal. Forexample, RAB25 and MUC1, both previously reported to be associated with CNV and clinicaloutcome in ovarian cancer (17,21), reside in regions with relatively poor SNP representationon the 50K SNP platform. Given these results, we also tested the association between qPCR-determined copy number of the four genes with clinical outcome to supplement data from theSNP-based analysis.
CNV was demonstrated for FGF1, MUC1, PRKC1 and RAB25 by qPCR, however theirassociation with clinical outcome remained insignificant (Supplementary Table 8). Incomparison to the SNP microarrays, quantitative-PCR analysis detected a substantially largernumber of cases with amplification of the FGF1 and RAB25 loci. In contrast to previousfindings (9), however, we still did not find an association between FGF1 amplification andoutcome in our cohort. A trend towards amplification and resistance was evident for RAB25,but this did not reach statistical significance. It is possible that the smaller sample size used forthe qPCR analysis, compared with the SNP experiments, may have adversely affected theability to detect a significant association between copy number and outcome.
Distinct Gene Expression Changes in Tumors from Patients with or without CCNE1Amplification and Poor Treatment Response
The association between CCNE1 amplification and primary treatment resistance ranked as themost significant DMP associated with patient outcome and was consistent with previous studies(14). We therefore sought to better understand the molecular changes in tumors harboringamplification of the CCNE1 locus and to contrast these with tumors from patients who had apoor response to treatment without CCNE1 amplification.
A total of 47 samples, of the 85 samples analyzed using SNP microarrays, were also evaluatedby qPCR and gene expression arrays. Samples were segregated into four groups (A-D)according to CCNE1 amplification (as assessed by qPCR) and chemotherapy response status(Figure 3A). The observed statistical significance of CCNE1 amplification and poor treatmentresponse was maintained in this sample subset (p<0.001 by Fisher test; p<0.01 association withPFS, Figure 3A). Pair-wise comparisons of gene expression were then made between theResistant groups (A and B) and the CCNE1 unamplified Responsive group (C) using a signalto noise metric for all genes. The top ranking genes were then analyzed for over-representationof genes according to biological processes and molecular function categories using PANTHER(Protein ANalysis THrough Evolutionary Relationships) classification (Supplementary Table9) (32).
As expected, we found an enrichment of cell cycle-associated genes in samples with CCNE1amplification (Group A, Figure 3A) relative to cases with poor survival and no amplificationof CCNE1. Figure 3B shows up-regulation of cell cycle-associated genes in the Resistantsamples with CCNE1 amplification using a cell cycle gene set obtained from Whitfield et al.(33). Tumors from patients with a relatively good clinical outcome (Group C, Figure 3A)appeared to include a heterogeneous population of tumors with respect to up-regulation of cell
Etemadmoghadam et al. Page 7
Clin Cancer Res. Author manuscript; available in PMC 2010 February 15.
NIH
-PA Author Manuscript
NIH
-PA Author Manuscript
NIH
-PA Author Manuscript
cycle genes. In cases without CCNE1 amplification but a short time to relapse, there wasincreased expression of genes with extracellular matrix (ECM) structure, cell adhesion andsignaling molecular functions (Group B, Figure 3A; Supplementary Table 9).
Immunohistochemical Staining of CCNE1 and Ki-67 are Associated with Specific TumorSubtypes
Cyclin E and proliferation-related Ki-67 antigen immunohistochemical staining was performedon tissue microarrays (TMA) to provide protein level validation of CCNE1 gene amplificationand its association with cellular proliferation. Examples of tumor tissue with low and high levelIHC staining are shown in Figure 3, including CCNE1 amplification/chemoresponse groupsA, B and C. A significant difference between subtypes (A, B and C) and degree of CCNE1positively stained tumor nuclei (p<0.02, Kruskal-Wallis rank sum test) was observed, withincreased staining in tumors with CCNE1 gene amplification.
The degree of Ki-67 staining was similar between treatment Resistant (Groups A and Bcombined) and Responsive (group C) groups when directly compared (median staining of~40% in each class), suggesting no obvious association between cellular proliferation andchemoresponse. When samples were segregated further by CCNE1 amplification status, a trendsimilar to that observed by gene expression analysis of cell-cycle markers was seen. Figure 3Dshows increased median staining of Ki-67 in the Resistant samples with CCNE1 amplification(~55%) compared to those without CCNE1 gene amplification (~40%). Treatment Responsivetumors appear to represent a heterogeneous population of tumors with or without increasedcellular proliferation, with median Ki-67 staining similar to that of the group B (CCNE1unamplified, chemoresistant) tumors (~40%).
DISCUSSIONTo the best of our knowledge, our cohort of 118 cases provides the largest single sample setof ovarian cancers examined by high-resolution genome-wide copy number analysis to date,using three-fold or more than samples than most previous studies. We applied a novel approachto defining peak regions of genomic change, GISTIC, which has been shown to identify knownoncogene and tumor suppressor gene loci with superior accuracy than other microarrayanalytical methods (30). The data confirms CNV events previously identified in ovarian cancer,such as amplification regions containing CCNE1 (34), NOTCH3 (35), RSF1 (16), PRKCI(15), MDS1-EVI1 (12) and MYC (24) and deletions of WWOX (36) and RB1 (37). Novel copynumber aberrations identified included amplification of; 1q23.3, containing NUF2 andPBX1; 6p23-p22.3, including the oncogene DEK, and 15q26.2-q26.3, containing the potentialtherapeutic target IGF1R. Detailed analysis of this global survey of gains and loss in ovariancancer will be described elsewhere (manuscript in preparation).
To identify regions of CNV associated with primary treatment response, we explicitly chosea large group of cases with clinically-defined response to primary treatment that were matchedfor stage, histology, grade, treatment regimen and debulk status. Prior to deriving associationswith clinical outcome variables, we had the option of either using the entire dataset to firstdefine peak regions of CNV, or to define minimal regions of CNV for each response groupseparately. Separate analysis of response groups appears superior and makes sense intuitively,as heterogeneity between groups may obscure findings if the data is treated as a single entity.For example, analysis of the separate response cohorts identified a discrete peak nearNCOA3 in the treatment Resistant group (Figure 2D), which has tentatively been linked to pooroutcome in ovarian cancer (38). However, this observation was masked in the analysis of theentire 118 tumors, where the 20q peak was mapped to 20q13.31-q13.32, distal to NCOA3(Figure 2B and Supplementary Table 4).
Etemadmoghadam et al. Page 8
Clin Cancer Res. Author manuscript; available in PMC 2010 February 15.
NIH
-PA Author Manuscript
NIH
-PA Author Manuscript
NIH
-PA Author Manuscript

This study appears to be the most robust analysis of primary response in ovarian cancer to date,incorporating high-resolution genome-wide analysis, expression profiling, the use ofsignificant numbers of cases, and explicit clinico-pathological criteria in a single combinedapproach. Although a number of previous studies of ovarian cancer have sought relate CNVto clinical outcome, only two (5,6) have involved similar numbers of serous cancers to thisstudy and these utilized much lower resolution, metaphase CGH analysis. Consistent withStaebler et al., we saw no evidence of a higher average number of chromosomal aberrationsin the Resistant and Responsive patients, with many regions such as 3q26 and 8q24 showingfrequent but equivalent change in the two groups. In fact, a greater number of significant CNVoverall was detected in the responsive group compared to the resistant group (40 peaks and 31peaks respectively, Supplementary Tables 5 and 6). The difference is most likely related to thelarger size of the responsive cohort, allowing for the detection of additional low frequencyevents.
In addition to our genome-wide discovery approach, we performed the first head-to-headanalysis of candidate genes associated with CNV and outcome in ovarian cancer as independentvalidation of previous findings. CCNE1 was the only candidate taken from the literature wherecopy number was specifically associated with primary chemoresistance in our samplepopulation. Discrepancy may relate to variation in methods used to detect CNV such as thesensitivity or resolution of microarray platforms (9,12,15,17) or approaches taken in samplepreparation. For example, laser-capture microdissection (9) or immunomagnetic separation(16) may have improved the ability to detect CNV in some studies, while the use of only wholetumour material (15,17) or a lower percentage tumour content cut-off for needle-dissection(12) may have obscured molecular correlations with outcome. Some of the selected candidategenes had previously been shown to correlate with PFS and/or OS, rather than categoricalresponse to primary treatment per se and therefore may not have been validated in this cohort.For example, ZNF217, previously associated with overall survival (23), was associated withboth PFS and OS in our analysis but not platinum resistance specifically. Furthermore, studiesoften varied in response definitions and survival endpoints used to derived clinical associations.For example, whereas some investigators have used progression free interval, others have usedpathological/clinical response after treatment to derive response status (19,21).
In this study, ‘Resistant’ cases had either progressive or stable disease during treatment or hada partial or complete CA125 response and relapsed within six months from the end of primarychemotherapy. When examined separately, there appeared to be no obvious distinction betweenthese two modes of resistance and the presence of molecular prognostic markers (specifically,cyclin E amplification). However, as the number of samples from each category of resistancewas low a thorough statistical analysis could not be performed.
SNP-based and qPCR copy number data were general highly concordant, although somedifferences were apparent that were primarily explained by poor representation of SNP markersin some regions (particularly for MUC1 and RAB25), preventing accurate quantification ofspecific genes using flanking SNP markers. In addition, consistent with previous reports (39)we found that the amplification amplitude was lower with SNP data (Supplementary Figure2). Saturation of the SNP array probes at high copy number and/or smoothing of SNP dataresulting in compression of copy number values likely accounts for quantitative differencesbetween the observed qPCR and SNP data. Related to this, it is notable that we did not observea statistically significant value for PFS using SNP data as a continuous variable for CCNE1(Table 3) although the association was clear using qPCR data. Specifically, all samples withhigh-level amplification of the CCNE1 gene as assessed by qPCR (log2 ratio ≥ 2), werechemoresistant (Figure 3A). The difference may be explained by SNP copy numberunderestimation of high-level gains (Supplementary Figure 2).
Etemadmoghadam et al. Page 9
Clin Cancer Res. Author manuscript; available in PMC 2010 February 15.
NIH
-PA Author Manuscript
NIH
-PA Author Manuscript
NIH
-PA Author Manuscript

Expression profiling was used to identify likely gene targets in each DMP and to validateassociations with progression-free and overall survival in samples additional to those analyzedby SNP microarray. The magnitude of fold change between chemoresponse groups was, inmost cases, moderate (<1.5, Supplementary Table 7). This is probably in part due to the factthat mean gene expression differences between groups does not sufficiently account formolecular heterogeneity within groups, particularly where CNV occur at low frequencies. Wedid, however find analysis of gene expression associations with PFS and OS useful fornarrowing down likely candidates for further validation studies.
Analysis of the SNP copy number data revealed amplifications associated withchemoresistance, involving two loci, each with highly relevant biological candidates within ornear the mapped peak regions: CCNE1 and NCOA3. Previously overexpression of the steroidreceptor co-activator NCOA3 (AIB1) in breast tumors, believed to interact with nuclearhormone receptors to enhance their transcriptional activity, has been shown to be significantlycorrelated with shorter PFS and OS (40). In ovarian tumors, while a trend to towardsamplification and poor OS has been observed, statistical significance was not demonstrated(38). Interestingly, another potential target of 20q amplification including in our candidate genescreen, ZNF217 is located ~1.2 Mb away from the chromosome 20 DMP containingNCOA3. The ZNF217 locus was not identified as a peak CNV significantly associated withplatinum resistance in our cohort, in addition it showed a lower statistical association with PFSand OS than NCOA3. While it has been suggested that 20q involves a number of distinctamplicons (38), our findings suggests that NCOA3 rather than ZNF217 is the more likely targetof 20q amplification events associated with resistance, with increased gene expression alsosignificantly correlated with shorter PFS and OS (Supplementary Table 7). Given the size ofthe mapped DMP amplicon on 20q (>10 Mb) however, it is possible that additional gene(s)within the mapped region are important in tumorigenesis and treatment response. Identificationof other drivers requires further systematic functional characterization of all genes within thisregion.
CCNE1 functions as a regulatory subunit of CDK2 essential for G1 to S-phase transition andDNA replication, in addition to playing a role in apoptosis and chromosomal instability intumor cells (41). CyclinE-cdk2 act through phosphorylation of substrates involved in G1progression, S-phase entry and centrosome duplication, in addition to having kinase-independent functions involving loading mini-chromosome maintenance (MCM) proteins ontoreplication origins, as quiescent cells enter the cell cycle (42).
CCNE1 gene amplification has been identified as a mechanism of overexpression in ovariantumors with a direct correlation with poor outcome in this and previous studies (13,14),although it had not been explicitly associated with primary treatment resistance until now.Previous studies associating CCNE1 with poor outcome in ovarian cancer involved samplesdrawn from the US Gynecological Oncology Group (GOG) bank (14) and from Germanpatients (13). Our study included patients from Australia, Norway and Japan. Collectively,these findings indicate that CCNE1 amplification is likely to be a marker of primary treatmentfailure and poor outcome in patients from diverse ethnic backgrounds.
Whilst the independent identification of the CCNE1 amplicon in these studies suggests that isthe dominant region of copy number gain associated with poor outcome in ovarian cancer, themechanism of resistance is unclear. We find that CCNE1 amplification led to expression ofcell cycle associated genes. Accelerated repopulation of tumor cells after treatment is apotential mechanism of treatment failure (43) that may be facilitated by CCNE1 amplificationin cells ‘hard-wired’ for increased proliferative capacity. However, we also see increasedexpression of cell cycle genes in the treatment Responsive primary tumors. In addition,increased proliferation, including via forced expression of CCNE1 in ovarian cells in vitro
Etemadmoghadam et al. Page 10
Clin Cancer Res. Author manuscript; available in PMC 2010 February 15.
NIH
-PA Author Manuscript
NIH
-PA Author Manuscript
NIH
-PA Author Manuscript

(44), has previously been linked to chemosensitivity rather than chemoresistance (45,46).Taken together, these seemingly contradictory findings, suggest that cellular proliferationalone may not account for response to chemotherapy. Recently, CCNE1 has been reported tohave a role in mediating asymmetric cell division, specifying cell fate and, importantly, indriving stem cell self-renewal, independent of its activity in cellular proliferation (47,48).Enhanced self-renewal may provide a novel mechanism for treatment failure in patients withtumors bearing a CCNE1 amplification.
Although there was no statistically significant difference in grade between resistant andresponsive groups, we note that four cases of Grade 1 serous carcinoma were included in the‘responsive’ group (Table 1). Interestingly, one low-grade sample represented in the resistantgroup contained a CCNE1 amplification and is represented in Group A (Figure 3), suggestingthat CCNE1 amplification, and poor outcome is not exclusive to high-grade tumours.
By applying gene expression analysis to samples from Resistant patients without CCNE1amplification, we were able define a distinct molecular subtype of Resistant cases characterizedby increased ECM-associated markers. This finding is consistent with our recent analysis ofserous tumors that identified a molecular subtype characterized by extracellular matrix, matrixremodeling and stromal response that was were strongly associated with desmoplastic responseand poor survival (25). A florid stromal reaction may reflect a host response aimed at containingan aggressive tumor or, alternatively, may directly participate in driving tumor growth (49).Recent findings also indicate that collagen deposition and tumor microenvironment may playa direct role in chemoresistance (50).
In conclusion, we have highlighted biologically aggressive tumors with CCNE1 or NCOA3amplifications and the role of ECM strongly influence clinical chemoresistance. Given thatCCNE1 amplification appears to be consistently associated with short response time (our study)and poor survival (our findings and others), priority should be placed on determining theappropriateness of directing patients carrying CCNE1 amplification for trials with noveltreatments, either directly targeting CCNE1 or downstream pathway members. Furthermore,non tumor-centric modes of resistance associated with host tissue elements, such as the ECMor activated stroma, may require alternative therapeutic strategies.
Supplementary MaterialRefer to Web version on PubMed Central for supplementary material.
AcknowledgementsWe thank Britt Edvardsen, Melanie Trivett and Elena Takano for their technical assistance in addition to MauriceLoughrey for additional pathological review of tissue samples.
This study was supported by the U.S. Army Medical Research and Materiel Command under DAMD17-01-1-0729,The Cancer Council Victoria, Queensland Cancer Fund, The Cancer Council New South Wales, The Cancer CouncilSouth Australia, The Cancer Foundation of Western Australia, The Cancer Council Tasmania and the National Healthand Medical Research Council of Australia (NHMRC), the U.S. Department of Defense grant PC040638 and theDana-Farber/Harvard Cancer Center Prostate SPORE.
We gratefully acknowledge the cooperation of the following institutions associated with the Australian Ovarian CancerStudy: New South Wales: John Hunter Hospital, North Shore Private Hospital, Royal Hospital for Women, RoyalNorth Shore Hospital, Royal Prince Alfred Hospital, Westmead Hospital; Queensland: Mater Misericordiae Hospital,Royal Brisbane and Women’s Hospital, Townsville Hospital, Wesley Hospital; South Australia: Flinders MedicalCentre, Queen Elizabeth II, Royal Adelaide Hospital; Tasmania: Royal Hobart Hospital; Victoria: FreemasonsHospital, Mercy Hospital for Women, Monash Medical Centre, Royal Women’s Hospital; Western Australia: KingEdward Memorial Hospital, St John of God Hospitals Subiaco, Sir Charles Gairdner Hospital, Western AustraliaResearch Tissue Network (WARTN): and the Westmead Gynaecological Oncology Tissue Bank, a member of theAustralasian Biospecimens Network-Oncology group.
Etemadmoghadam et al. Page 11
Clin Cancer Res. Author manuscript; available in PMC 2010 February 15.
NIH
-PA Author Manuscript
NIH
-PA Author Manuscript
NIH
-PA Author Manuscript

We also acknowledge the contribution of the AOCS Management Group: D Bowtell, G Chenevix-Trench, A Green,P Webb, A deFazio, D Gertig, the study nurses and research assistants and express our gratitude to all women whoparticipated in the study.
References1. Harries M, Gore M. Part I:chemotherapy for epithelial ovarian cancer-treatment at first diagnosis.
Lancet Oncol 2002;3:529–36. [PubMed: 12217790]2. Bookman MA. Standard treatment in advanced ovarian cancer in 2005: the state of the art. Int J Gynecol
Cancer 2005;15 Suppl 3:212–20. [PubMed: 16343233]3. Kelland L. The resurgence of platinum-based cancer chemotherapy. Nat Rev Cancer 2007;7:573–84.
[PubMed: 17625587]4. Pinkel D, Albertson DG. Comparative Genomic Hybridization. Annu Rev Genomics Hum Genet. 20055. Partheen K, Levan K, Osterberg L, Helou K, Horvath G. Analysis of cytogenetic alterations in stage
III serous ovarian adenocarcinoma reveals a heterogeneous group regarding survival, surgicaloutcome, and substage. Genes Chromosomes Cancer 2004;40:342–8. [PubMed: 15188458]
6. Staebler A, Karberg B, Behm J, et al. Chromosomal losses of regions on 5q and lack of high-levelamplifications at 8q24 are associated with favorable prognosis for ovarian serous carcinoma. GenesChromosomes Cancer 2006;45:905–17. [PubMed: 16845658]
7. Kim SW, Kim JW, Kim YT, et al. Analysis of chromosomal changes in serous ovarian carcinomausing high-resolution array comparative genomic hybridization: Potential predictive markers ofchemoresistant disease. Genes Chromosomes Cancer 2007;46:1–9. [PubMed: 17044060]
8. Bernardini M, Lee CH, Beheshti B, et al. High-resolution mapping of genomic imbalance andidentification of gene expression profiles associated with differential chemotherapy response in serousepithelial ovarian cancer. Neoplasia 2005;7:603–13. [PubMed: 16036111]
9. Birrer MJ, Johnson ME, Hao K, et al. Whole genome oligonucleotide-based array comparative genomichybridization analysis identified fibroblast growth factor 1 as a prognostic marker for advanced-stageserous ovarian adenocarcinomas. J Clin Oncol 2007;25:2281–7. [PubMed: 17538174]
10. Osterberg L, Levan K, Partheen K, Helou K, Horvath G. Cytogenetic analysis of carboplatin resistancein early-stage epithelial ovarian carcinoma. Cancer Genet Cytogenet 2005;163:144–50. [PubMed:16337857]
11. Suzuki S, Moore DH, Ginzinger DG, et al. An approach to analysis of large-scale correlations betweengenome changes and clinical endpoints in ovarian cancer. Cancer Res 2000;60:5382–5. [PubMed:11034075]
12. Nanjundan M, Nakayama Y, Cheng KW, et al. Amplification of MDS1/EVI1 and EVI1, located inthe 3q26.2 amplicon, is associated with favorable patient prognosis in ovarian cancer. Cancer Res2007;67:3074–84. [PubMed: 17409414]
13. Mayr D, Kanitz V, Anderegg B, et al. Analysis of gene amplification and prognostic markers inovarian cancer using comparative genomic hybridization for microarrays and immunohistochemicalanalysis for tissue microarrays. Am J Clin Pathol 2006;126:101–9. [PubMed: 16753589]
14. Farley J, Smith LM, Darcy KM, et al. Cyclin E expression is a significant predictor of survival inadvanced, suboptimally debulked ovarian epithelial cancers: a Gynecologic Oncology Group study.Cancer Res 2003;63:1235–41. [PubMed: 12649182]
15. Eder AM, Sui X, Rosen DG, et al. Atypical PKCiota contributes to poor prognosis through loss ofapical-basal polarity and Cyclin E overexpression in ovarian cancer. Proc Natl Acad Sci U S A2005;102:12519–24. [PubMed: 16116079]
16. Shih Ie M, Sheu JJ, Santillan A, et al. Amplification of a chromatin remodeling gene, Rsf-1/HBXAP,in ovarian carcinoma. Proc Natl Acad Sci U S A 2005;102:14004–9. [PubMed: 16172393]
17. Cheng KW, Lahad JP, Kuo WL, et al. The RAB25 small GTPase determines aggressiveness of ovarianand breast cancers. Nat Med. 2004
18. Kato H, Arakawa A, Suzumori K, Kataoka N, Young SR. FISH analysis of BRCA1 copy number inparaffin-embedded ovarian cancer tissue samples. Exp Mol Pathol 2004;76:138–42. [PubMed:15010292]
Etemadmoghadam et al. Page 12
Clin Cancer Res. Author manuscript; available in PMC 2010 February 15.
NIH
-PA Author Manuscript
NIH
-PA Author Manuscript
NIH
-PA Author Manuscript

19. Lassus H, Leminen A, Vayrynen A, et al. ERBB2 amplification is superior to protein expressionstatus in predicting patient outcome in serous ovarian carcinoma. Gynecol Oncol 2004;92:31–9.[PubMed: 14751135]
20. Slamon DJ, Godolphin W, Jones LA, et al. Studies of the HER-2/neu proto-oncogene in human breastand ovarian cancer. Science 1989;244:707–12. [PubMed: 2470152]
21. Takano M, Fujii K, Kita T, Kikuchi Y, Uchida K. Amplicon profiling reveals cytoplasmicoverexpression of MUC1 protein as an indicator of resistance to platinum-based chemotherapy inpatients with ovarian cancer. Oncol Rep 2004;12:1177–82. [PubMed: 15547734]
22. Makhija S, Sit A, Edwards R, et al. Identification of genetic alterations related to chemoresistance inepithelial ovarian cancer. Gynecol Oncol 2003;90:3–9. [PubMed: 12821334]
23. Peiro G, Diebold J, Lohrs U. CAS (cellular apoptosis susceptibility) gene expression in ovariancarcinoma: Correlation with 20q13.2 copy number and cyclin D1, p53, and Rb protein expression.Am J Clin Pathol 2002;118:922–9. [PubMed: 12472286]
24. Baker VV, Borst MP, Dixon D, Hatch KD, Shingleton HM, Miller D. c-myc amplification in ovariancancer. Gynecol Oncol 1990;38:340–2. [PubMed: 2227545]
25. Tothill RW, Tinker AV, George J, et al. Novel molecular subtypes of serous and endometrioid ovariancancer linked to clinical outcome. Clin Cancer Res. in press
26. Chi DS, Eisenhauer EL, Lang J, et al. What is the optimal goal of primary cytoreductive surgery forbulky stage IIIC epithelial ovarian carcinoma (EOC)? Gynecol Oncol 2006;103:559–64. [PubMed:16714056]
27. Rustin GJ, Nelstrop AE, Tuxen MK, Lambert HE. Defining progression of ovarian carcinoma duringfollow-up according to CA 125: a North Thames Ovary Group Study. Ann Oncol 1996;7:361–4.[PubMed: 8805927]
28. Vergote I, Rustin GJ, Eisenhauer EA, et al. Re: new guidelines to evaluate the response to treatmentin solid tumors [ovarian cancer]. Gynecologic Cancer Intergroup. J Natl Cancer Inst 2000;92:1534–5. [PubMed: 10995813]
29. Matsuzaki H, Dong S, Loi H, et al. Genotyping over 100,000 SNPs on a pair of oligonucleotide arrays.Nat Methods 2004;1:109–11. [PubMed: 15782172]
30. Beroukhim R, Getz G, Nghiemphu L, et al. Assessing the significance of chromosomal aberrationsin cancer: Methodology and application to glioma. Proc Natl Acad Sci U S A 2007;104:20007–12.[PubMed: 18077431]
31. Rozen S, Skaletsky H. Primer3 on the WWW for general users and for biologist programmers.Methods Mol Biol 2000;132:365–86. [PubMed: 10547847]
32. Mi H, Guo N, Kejariwal A, Thomas PD. PANTHER version 6: protein sequence and functionevolution data with expanded representation of biological pathways. Nucleic Acids Res2007;35:D247–52. [PubMed: 17130144]
33. Whitfield ML, George LK, Grant GD, Perou CM. Common markers of proliferation. Nat Rev Cancer2006;6:99–106. [PubMed: 16491069]
34. Snijders AM, Nowee ME, Fridlyand J, et al. Genome-wide-array-based comparative genomichybridization reveals genetic homogeneity and frequent copy number increases encompassingCCNE1 in fallopian tube carcinoma. Oncogene 2003;22:4281–6. [PubMed: 12833150]
35. Park JT, Li M, Nakayama K, et al. Notch3 gene amplification in ovarian cancer. Cancer Res2006;66:6312–8. [PubMed: 16778208]
36. Paige AJ, Taylor KJ, Taylor C, et al. WWOX: a candidate tumor suppressor gene involved in multipletumor types. Proc Natl Acad Sci U S A 2001;98:11417–22. [PubMed: 11572989]
37. Gorringe KL, Jacobs S, Thompson ER, et al. High-resolution single nucleotide polymorphism arrayanalysis of epithelial ovarian cancer reveals numerous microdeletions and amplifications. ClinCancer Res 2007;13:4731–9. [PubMed: 17699850]
38. Tanner MM, Grenman S, Koul A, et al. Frequent amplification of chromosomal region 20q12-q13in ovarian cancer. Clin Cancer Res 2000;6:1833–9. [PubMed: 10815905]
39. Zhao X, Li C, Paez JG, et al. An integrated view of copy number and allelic alterations in the cancergenome using single nucleotide polymorphism arrays. Cancer Res 2004;64:3060–71. [PubMed:15126342]
Etemadmoghadam et al. Page 13
Clin Cancer Res. Author manuscript; available in PMC 2010 February 15.
NIH
-PA Author Manuscript
NIH
-PA Author Manuscript
NIH
-PA Author Manuscript

40. Zhao C, Yasui K, Lee CJ, et al. Elevated expression levels of NCOA3, TOP1, and TFAP2C in breasttumors as predictors of poor prognosis. Cancer 2003;98:18–23. [PubMed: 12833450]
41. Hwang HC, Clurman BE. Cyclin E in normal and neoplastic cell cycles. Oncogene 2005;24:2776–86. [PubMed: 15838514]
42. Geng Y, Lee YM, Welcker M, et al. Kinase-independent function of cyclin E. Mol Cell 2007;25:127–39. [PubMed: 17218276]
43. Kim JJ, Tannock IF. Repopulation of cancer cells during therapy: an important cause of treatmentfailure. Nat Rev Cancer 2005;5:516–25. [PubMed: 15965493]
44. Bedrosian I, Lu KH, Verschraegen C, Keyomarsi K. Cyclin E deregulation alters the biologicproperties of ovarian cancer cells. Oncogene 2004;23:2648–57. [PubMed: 15007381]
45. Kolfschoten GM, Hulscher TM, Pinedo HM, Boven E. Drug resistance features and S-phase fractionas possible determinants for drug response in a panel of human ovarian cancer xenografts. Br J Cancer2000;83:921–7. [PubMed: 10970695]
46. Jazaeri AA, Awtrey CS, Chandramouli GV, et al. Gene expression profiles associated with responseto chemotherapy in epithelial ovarian cancers. Clin Cancer Res 2005;11:6300–10. [PubMed:16144934]
47. Chia W, Prokopenko SN. Cyclin E at the centre of an identity crisis. Nat Cell Biol 2005;7:3–5.[PubMed: 15632940]
48. Chia W, Somers WG, Wang H. Drosophila neuroblast asymmetric divisions: cell cycle regulators,asymmetric protein localization, and tumorigenesis. J Cell Biol 2008;180:267–72. [PubMed:18209103]
49. Olumi AF, Grossfeld GD, Hayward SW, Carroll PR, Tlsty TD, Cunha GR. Carcinoma-associatedfibroblasts direct tumor progression of initiated human prostatic epithelium. Cancer Res1999;59:5002–11. [PubMed: 10519415]
50. Sherman-Baust CA, Weeraratna AT, Rangel LB, et al. Remodeling of the extracellular matrix throughoverexpression of collagen VI contributes to cisplatin resistance in ovarian cancer cells. Cancer Cell2003;3:377–86. [PubMed: 12726863]
Etemadmoghadam et al. Page 14
Clin Cancer Res. Author manuscript; available in PMC 2010 February 15.
NIH
-PA Author Manuscript
NIH
-PA Author Manuscript
NIH
-PA Author Manuscript

Figure 1.Schematic of experimental design used to identify CNV changes associated with response toprimary treatment.
Etemadmoghadam et al. Page 15
Clin Cancer Res. Author manuscript; available in PMC 2010 February 15.
NIH
-PA Author Manuscript
NIH
-PA Author Manuscript
NIH
-PA Author Manuscript

Figure 2.GISTIC G score profile of chromosome 19 (A and B) and 20 (C and D). G scores are shownfor all ovarian samples (A and C) and for Responsive (blue) and Resistant (red) samplesseparately (B and D). *indicates mapped CNV peaks within regions of CNV. Regions withsignificant ΔG values used to define Differentially Mapped Peaks (DMP) are indicated.
Etemadmoghadam et al. Page 16
Clin Cancer Res. Author manuscript; available in PMC 2010 February 15.
NIH
-PA Author Manuscript
NIH
-PA Author Manuscript
NIH
-PA Author Manuscript

Figure 3.Characterization of tumor subtypes classified by treatment response and CCNE1 amplificationstatus. (A) Samples stratified by treatment response (Resistant, <6 months PFS; Responsive,>9 months PFS) and CCNE1 amplification (CCNE1amp) status as estimated by quantitative-PCR. Amplification is defined as a log2 copy number ratio > 0.3. Four subtypes are observed;Group A (CCNE1 amplified, Resistant), Group B (CCNE1 unamplified, Resistant), Group C(CCNE1 unamplified, Responsive) and Group D (CCNE1 amplified, Responsive). Censoredsurvival data represented by clear circles. (B) Gene expression heat-map of cell cycle genes inCCNE1amp/Response Groups A, B and C. Red indicates increased gene expression, greenindicates decreased gene expression. CCNE1 gene expression probe indicated by arrow. (C)
Etemadmoghadam et al. Page 17
Clin Cancer Res. Author manuscript; available in PMC 2010 February 15.
NIH
-PA Author Manuscript
NIH
-PA Author Manuscript
NIH
-PA Author Manuscript

Example of tumor tissue with (i) 20% and (ii) 60% of cells with CCNE1 staining and (iii) 10%and (iv) 90% of tumor cells with nuclear Ki-67 staining. (D) Box plots depict range of IHCstaining for CCNE1amp/Response Groups A, B and C for (top) CCNE1, p<0.02 and (below)Ki-67, p<0.28. Values for each sample taken as the average of up to four TMA cores. A totalof 5, 7 and 16 tumors from each group A, B and C respectively (n = 28) are represented.
Etemadmoghadam et al. Page 18
Clin Cancer Res. Author manuscript; available in PMC 2010 February 15.
NIH
-PA Author Manuscript
NIH
-PA Author Manuscript
NIH
-PA Author Manuscript

NIH
-PA Author Manuscript
NIH
-PA Author Manuscript
NIH
-PA Author Manuscript
Etemadmoghadam et al. Page 19
Table 1Clinical Cohort Patient Clinicopathological Characteristics.
Responsive Resistant p-value
Age
Mean 57 59 0.19a
Standard Deviation 10 13
Range 36-78 23-85
Stage
III 46 (88%) 29 (88%) 1.00b
IV 6 (12%) 4 (12%)
Grade
Low (well differentiated) 4 (8%) 1 (3%) 0.43b
Medium 22 (42%) 11 (33%)
High (poorly differentiated) 24 (46%) 19 (58%)
Unknown 2 (4%) 2 (6%)
Residual Disease
≤ 1 cm 26 (50%) 20 (61%) 0.82b
> 1 cm 19 (37%) 13 (39%)
Unknown 7 (13%) 0 (0%)
Primary Treatment
Pt-based † 2 (4%) 4 (12%) 0.08b
Pt-based + Taxane 40 (77%) 17 (52%)
Pt-based + Other 1 (2%) 2 (6%)
Pt-based + Taxane + Other 9 (17%) 10 (30%)
PFS
from End of Primary Tx
Median (months) 17.50 3.75 <0.001c
95% Confidence Interval 14.6-26.9 2.57-4.87
Events 40 (77%) 33 (100%)
OS
from Surgery
Median (years) 5.07 1.63 <0.001c
95% Confidence Interval 4.55-6.72 1.40-2.66
Events 22 (42%) 28 (85%)
Total Cases (n=85) 52 33
Calculated p-values from
awilcoxon rank sum test,
bfisher test or
ccox proportional hazard model.
†Pt, Platinum-based agent; cisplatin or carboplatin.
Clin Cancer Res. Author manuscript; available in PMC 2010 February 15.

NIH
-PA Author Manuscript
NIH
-PA Author Manuscript
NIH
-PA Author Manuscript
Etemadmoghadam et al. Page 20Ta
ble
2D
iffer
entia
lly M
appe
d Pe
aks
(DM
P) fr
om c
ompa
rativ
e co
py n
umbe
r ana
lysi
s of
Tre
atm
ent R
esis
tant
and
Res
pons
ive
Cla
sses
. Pea
ksw
ith F
DR
-cor
rect
ed Δ
G sc
ore
p-va
lue
<0.0
5 fr
om 7
1 te
sted
regi
ons s
how
n.
CN
VC
ytob
and
(Pea
k)Pe
ak P
ositi
on (M
b)E
nric
hed
in R
espo
nse
Cla
ssΔG
scor
ep-
valu
e
Am
plifi
catio
n19
q12
34.3
9-35
.02
Res
ista
nt0.
200.
003
Am
plifi
catio
n20
q11.
22-q
13.1
233
.52-
44.8
9R
esis
tant
0.11
0.01
6
Am
plifi
catio
n5p
15.3
18.
28-1
1.14
Res
ista
nt0.
120.
024
Am
plifi
catio
n6p
25.1
6.31
-8.4
7R
espo
nsiv
e-0
.09
0.03
7
Del
etio
n22
q13.
3146
.61-
49.0
2R
espo
nsiv
e-0
.10
0.04
5
Del
etio
n2q
3420
9.49
-209
.52
Res
pons
ive
-0.1
80.
046
Clin Cancer Res. Author manuscript; available in PMC 2010 February 15.
NIH
-PA Author Manuscript
NIH
-PA Author Manuscript
NIH
-PA Author Manuscript
Etemadmoghadam et al. Page 21Ta
ble
3Su
rviv
al a
naly
sis o
f can
dida
te g
ene
copy
num
ber d
etec
ted
by S
NP-
base
d sc
reen
and
/or p
revi
ousl
y re
porte
d.
Gen
eC
andi
date
Sel
ectio
nFr
eque
ncy
Res
pons
ive
Freq
uenc
y R
esis
tant
PFS
(p-v
alue
)O
S (p
-val
ue)
Am
plifi
catio
ns
CC
NE1
Iden
tifie
d in
SN
P-C
NV
Scr
een
*9.
6%27
.3%
0.26
40.
019
ERBB
2La
ssus
et a
l.,20
04†
0.0%
3.0%
0.84
00.
101
FGF1
Birr
er e
t al.,
200
71.
9%6.
1%0.
121
0.28
0
MD
S1/E
VI1
Nan
jund
an e
t al.,
200
744
.2%
39.4
%0.
431
0.80
8
MU
C1
Taka
no e
t al.,
200
417
.3%
6.1%
0.87
50.
286
MYC
Bak
er e
t al.,
199
057
.7%
51.5
%0.
752
0.82
9
NC
OA3
Iden
tifie
d in
SN
P-C
NV
Scr
een
13.5
%27
.3%
0.00
90.
004
PRK
CI
Eder
et a
l., 2
005
44.2
%45
.5%
0.18
10.
267
RAB2
5C
heng
et a
l., 2
004
17.3
%6.
1%0.
875
0.28
6
RSF1
(HBX
AP)
Shih
Ie e
t al.,
200
523
.1%
15.2
%0.
121
0.09
1
ZNF2
17Pe
iro e
t al.,
200
2‡21
.2%
27.3
%0.
022
0.00
8
Del
etio
ns
BRC
A1K
ato
et a
l., 2
004
38.5
%36
.4%
0.81
40.
110
IGF2
RM
akhi
ja e
t al.
2003
44.2
%21
.2%
0.37
60.
499
* also
see
May
r et a
l., 2
006
and
Farle
y et
al.,
200
3;
† also
see
Slam
on e
t al.,
198
9;
‡ also
see
Dim
ova
et a
l., 2
005.
Clin Cancer Res. Author manuscript; available in PMC 2010 February 15.
Copyright © 2022 FDOKUMEN