Expression of epidermal growth factor receptor in human gastric and colonic carcinomas
Upload
independentCategory
view
3download
0
EUROPEAN
European Polymer Journal 41 (2005) 2559–2568
www.elsevier.com/locate/europolj
POLYMERJOURNAL
Process optimization and empirical modelingfor electrospun polyacrylonitrile (PAN) nanofiber
precursor of carbon nanofibers
S.Y. Gu a,*,1, J. Ren a, G.J. Vancso b
a Institute of Nano- and Bio-Polymeric Materials, School of Materials Science and Engineering, Tongji University,
1239 Siping Road, Shanghai 200092, Chinab Materials Science and Technology of Polymer, Faculty of Chemical Technology and MESA+ Research Institute,
University of Twente, P.O. Box 217, 7500 AE Enschede, The Netherlands
Received 7 April 2005; accepted 5 May 2005Available online 5 July 2005
Abstract
Ultrafine fibers were spun from polyacrylonitrile (PAN)/N,N-dimethyl formamide (DMF) solution as a precursor ofcarbon nanofibers using a homemade electrospinning set-up. Fibers with diameter ranging from 200 nm to 1200 nmwere obtained. Morphology of fibers and distribution of fiber diameter were investigated varying concentration andapplied voltage by scanning electric microscopy (SEM). Average fiber diameter and distribution were determined from100 measurements of the random fibers with an image analyzer (SemAfore 5.0, JEOL). A more systematic understand-ing of process parameters was obtained and a quantitative relationship between electrospinning parameters and averagefiber diameter was established by response surface methodology (RSM). It was concluded that concentration of solu-tion played an important role to the diameter of fibers and standard deviation of fiber diameter. Applied voltage had nosignificant impact on fiber diameter and standard deviation of fiber diameter.� 2005 Elsevier Ltd. All rights reserved.
Keywords: Electrospinning; Response surface methodology; Polyacrylonitrile nanofibers; Average fiber diameter; Standard deviationof fiber diameter
0014-3057/$ - see front matter � 2005 Elsevier Ltd. All rights reservdoi:10.1016/j.eurpolymj.2005.05.008
* Corresponding author. Tel.: +86 21 65989238; fax: +86 2155037011.
E-mail addresses: [email protected], [email protected] (S.Y. Gu).1 Some of the work was done in Materials Science and
Technology of Polymer, Faculty of Chemical Technology,University of Twente when the author worked there as avisiting scholar.
1. Introduction
1.1. Background
Carbon fibers are now important industrially andhave gained a wide range of applications, from sportsequipment to the aerospace industry. Carbon nano-fibers, like other one-dimensional (1D) nanostructuressuch as nanowires, nanotubes, and molecular wires,are receiving increasing attention because of their large
ed.
2560 S.Y. Gu et al. / European Polymer Journal 41 (2005) 2559–2568
length to diameter ratio. This is due to their potentialapplication in nanocomposites [1], high temperaturecatalysis, template for nanotubes [2], filters [3], recharge-able batteries [4], supercapacitors [5,6], bottom–upassembly applications in nanoelectronics and photonics[7], etc.
Carbon nanofibers can be produced by traditionalvapor growth method [8] or plasma enhanced chemicalvapor depositing method which was developed at thebeginning of this century [9]. However vapor growthor plasma enhanced chemical vapor depositing methodinvolves a complicated process and high cost. Carbonnanofibers can also be produced by stabilizing, carbon-izing, activating electrospun precursors. Chun et al. [3]produced carbon nanofibers with diameter in the rangefrom 100 nm to a few microns from electrospun polyac-rylonitrile and mesophase pitch precursor fibers. Wanget al. [10–12] produced carbon nanofibers from carbon-izing of electrospun PAN nanofibers and studied theirstructure and conductivity. Hou et al. [2] reported amethod to use the carbonized electrospun PAN nanofi-bers as substrates for the formation of multi-wall carbonnanotubes. Kim et al. [5,13] produced carbon nanofibersfrom PAN-based or pitch-based electrospun fibers andstudied the electrochemical properties of carbon nano-fibers web as an electrode for supercapacitor. Parket al. [14] produced pitch-based carbon fibers by stabiliz-ing, carbonizing, activating electrospun web from petro-leum-derived isotropic pitch solution in tetrahydrofuran(THF). The electrical conductivities of the carbonizedweb were measured to be 6.3 and 8.3 S/cm at 1000 and1200 �C, respectively, which indicated that the web wassuitable to make electrodes of electrical double layercapacitors (EDLCs). But the diameter of fibers frompitch-based electrospun fibers was in the range of severalmicrons.
1.2. Electrospinning
Electrospinning has been recognized as an efficienttechnique for the fabrication of fibers in nanometer tomicron diameter range from polymer solutions or melts.In a typical process, an electrical potential is applied be-tween a droplet of polymer solution or melt held at theend of a capillary and a grounded collector. When theapplied electric field overcomes the surface tension ofthe droplet, a charged jet of polymer solution or meltis ejected. The jet grows longer and thinner due to bend-ing instability or splitting [15] until it solidifies or collectson the collector.
Electrospinning is a process involving polymerscience, applied physics, fluid mechanics, electrical,mechanical, chemical, material engineering and rheo-logy. The fiber morphology is controlled by the experi-mental parameters and is dependent upon solutionconductivity, concentration, viscosity, polymer molecu-
lar weight, applied voltage, etc. [16,17]. Much workhas been done on the effect of parameters on the elec-trospinning process and morphology of fibers. Demiret al. [18] reported that the fiber diameter increased withincreasing polymer concentration according to a powerlaw relationship and Deitzel et al. [17] reported a bimo-dal distribution of fiber diameter for fibers spun fromhigher concentration solution. Boland et al. [19] ob-tained a strong linear relationship between fiber diame-ter and concentration in electrospun poly(glycolic acid)(PGA). Mo et al. [20], Ryu et al. [21] and Katti et al.[22] also reported a significant relationship between fiberdiameter and concentration in electrospinning process.For the effect of applied voltage, Reneker et al. [23] ob-tained a result that fiber diameter did not change muchwith electric field when they studied the electrospinningbehavior of polyethylene oxide. Mo et al. and Katti et al.[20,22] reported that fiber diameter tended to decreasewith increasing electrospinning voltage, although theinfluence was not as great as that of polymer concentra-tion. But Demir et al. [18] reported that fiber diameterincreased with increasing electrospinning voltage whenthey electrospun polyurethane fibers. Larrondo andManley [24–26] determined that doubling the appliedelectric field decreased the fiber diameter by roughlyhalf. However, Baumgarten [27] showed that the diame-ter of the jet reached a minimum after an initial increasein field strength and then became much larger withincreasing fields. This effect was caused by the feed rateof the polymer solution through the capillary and illus-trated one of the complexities of the electrospinning pro-cess. That is, increasing the field does increase theelectrostatic stress and create smaller diameter fibers,but it also draws more materials out of the syringe.Sukigara [28,29] studied the effect of electrospinningparameters (electric field, tip-to-collector distance andconcentration) on the morphology and fiber diameterof regenerated silk from Bombyx mori using responsesurface methodology and concluded that the silk con-centration was the most important parameter in produc-ing uniform cylindrical fibers less than 100 nm indiameter.
In order to optimize and predict the morphologyand average fiber diameter of electrospun PAN precur-sor, design of experiment was employed in the presentwork. Morphology of fibers and distribution of fiberdiameter of PAN precursor were investigated varyingconcentration and applied voltage. Main effect andinteraction of factors were studied by two-way analysisof variance. A more systematic understanding of theseprocess conditions was obtained and a quantitativebasis for the relationships between average fiber diameterand electrospinning parameters was established usingresponse surface methodology (RSM), which will pro-vide some basis for the preparation of carbonnanofibers.

Table 1Design of experiment (factors and levels)
Factor Factor level
Concentration (wt.%) 6, 8, 10,12Applied voltage (kV) 10, 15, 20
S.Y. Gu et al. / European Polymer Journal 41 (2005) 2559–2568 2561
2. Experimental
2.1. Preparation of polymer solution
PAN (cat 18.131-5) was obtained from Aldrich andused without further purification. 99.5% N,N-dimethyl-formamide (DMF) was purchased from Merck. Theconcentrations from 6 to 12 wt.% PAN/DMF solutionwere stirred by an electromagnetically driven magnetat room temperature for 30–50 h in order to obtainhomogenous solution.
2.2. Electrospinning set-up
The schematic electrospinning setup used for the elec-trospinning process is shown in Fig. 1. The spinningsolution was placed in a vertically aligned glass pipettewith a tip around 1 mm in diameter. A stainless steelelectrode was immersed in the solution and connectedto a high voltage power supply (Bertan series 230-30R), which can generate DC voltage up to 30 kV. A flatmetal plate with aluminum foil was placed below servingas a grounded counter electrode. The voltage betweenthe electrode and the counter electrode could be con-trolled by the high voltage power supply. The air pres-sure above the solution was controlled with an airpump so that a stable drop of the solution was sus-pended at the tip of the capillary before the power wassupplied. The solutions were electrospun between 10and 20 kV vertically to the collector. The grounded col-lector was located at a distance of 10 cm.
Fibers collected directly on the aluminum foil couldbe studied by scanning electron microscopy (SEM) afterdrying under vacuum at room temperature for 24 h.
2.3. Morphology
The morphology of electrospun PAN fibers wasobserved by scanning electron microscopy (SEM,
Pump
Collector
HV
Electrode
Fig. 1. Schematic set-up of electrospinning.
JEOL JSM-5600LV) after being gold-coated. The dia-meter of electrospun fibers was measured with animage analyzer (SemAfore 5.0, JEOL). For each experi-ment, average fiber diameter and distribution weredetermined from about 100 measurements of the ran-dom fibers.
2.4. Design of experiment
A factorical experiment was designed to investigateand identify the significance of two processing parame-ters (one is concentration and the other is applied volt-age) on average fiber diameter as shown in Table 1.
The experiment was performed for at least three lev-els of each factor to fit a quadratic model. These levelswere chosen equally spaced. Four levels of concentra-tion and three levels of applied voltage resulted in 12possible combinations of factor setting. A schematicof experimental design is shown in Fig. 2. The valuesin the brackets are coded values of the factors (v1: con-centration, v2: applied voltage) and the values at coor-dinate points and the brackets behind represent theaverage fiber diameter and standard deviation of fiberdiameter, respectively. For the details of calculationof coded values, please refer to Refs. [30] and [31].Coded and uncoded values of the factors are listed inTable 2.
App
lied
volta
ge/k
V
(1,-1) 1170(238) (1/3,-1) 394(69) (-1/3,-1) 290(66)(-1,-1) 214(44)
(1,0)
1160(267)
(1/3,0)
436(176)
(-1/3,0)
290(53)
(-1,0)
213(46)
(1,1) 1140(387)(1/3,1) 472(70)(-1/3,1) 291(63)(-1,1) 208(39)
12108 6
20
10
15
Concentration/wt%
Fig. 2. Design of experimental. Coded values are shown in thebrackets (concentration and applied voltage). The values at thecoordinate points and the brackets behind show the averagefiber diameters (nm) of about 100 measurements and thestandard deviation of fiber diameters.
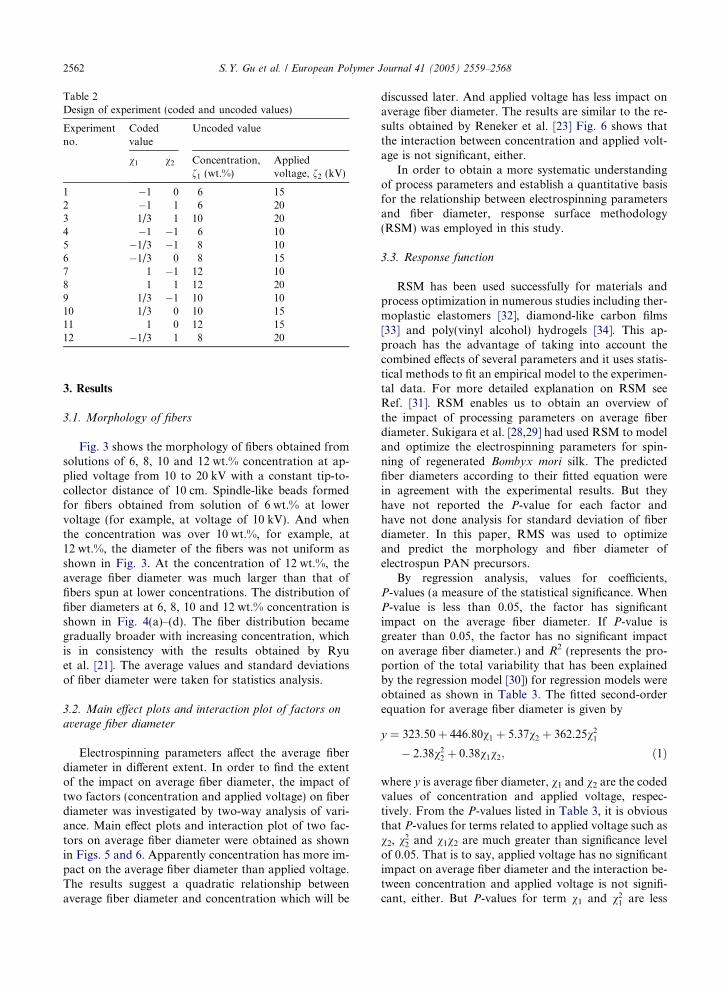
Table 2Design of experiment (coded and uncoded values)
Experimentno.
Codedvalue
Uncoded value
v1 v2 Concentration,f1 (wt.%)
Appliedvoltage, f2 (kV)
1 �1 0 6 152 �1 1 6 203 1/3 1 10 204 �1 �1 6 105 �1/3 �1 8 106 �1/3 0 8 157 1 �1 12 108 1 1 12 209 1/3 �1 10 1010 1/3 0 10 1511 1 0 12 1512 �1/3 1 8 20
2562 S.Y. Gu et al. / European Polymer Journal 41 (2005) 2559–2568
3. Results
3.1. Morphology of fibers
Fig. 3 shows the morphology of fibers obtained fromsolutions of 6, 8, 10 and 12 wt.% concentration at ap-plied voltage from 10 to 20 kV with a constant tip-to-collector distance of 10 cm. Spindle-like beads formedfor fibers obtained from solution of 6 wt.% at lowervoltage (for example, at voltage of 10 kV). And whenthe concentration was over 10 wt.%, for example, at12 wt.%, the diameter of the fibers was not uniform asshown in Fig. 3. At the concentration of 12 wt.%, theaverage fiber diameter was much larger than that offibers spun at lower concentrations. The distribution offiber diameters at 6, 8, 10 and 12 wt.% concentration isshown in Fig. 4(a)–(d). The fiber distribution becamegradually broader with increasing concentration, whichis in consistency with the results obtained by Ryuet al. [21]. The average values and standard deviationsof fiber diameter were taken for statistics analysis.
3.2. Main effect plots and interaction plot of factors on
average fiber diameter
Electrospinning parameters affect the average fiberdiameter in different extent. In order to find the extentof the impact on average fiber diameter, the impact oftwo factors (concentration and applied voltage) on fiberdiameter was investigated by two-way analysis of vari-ance. Main effect plots and interaction plot of two fac-tors on average fiber diameter were obtained as shownin Figs. 5 and 6. Apparently concentration has more im-pact on the average fiber diameter than applied voltage.The results suggest a quadratic relationship betweenaverage fiber diameter and concentration which will be
discussed later. And applied voltage has less impact onaverage fiber diameter. The results are similar to the re-sults obtained by Reneker et al. [23] Fig. 6 shows thatthe interaction between concentration and applied volt-age is not significant, either.
In order to obtain a more systematic understandingof process parameters and establish a quantitative basisfor the relationship between electrospinning parametersand fiber diameter, response surface methodology(RSM) was employed in this study.
3.3. Response function
RSM has been used successfully for materials andprocess optimization in numerous studies including ther-moplastic elastomers [32], diamond-like carbon films[33] and poly(vinyl alcohol) hydrogels [34]. This ap-proach has the advantage of taking into account thecombined effects of several parameters and it uses statis-tical methods to fit an empirical model to the experimen-tal data. For more detailed explanation on RSM seeRef. [31]. RSM enables us to obtain an overview ofthe impact of processing parameters on average fiberdiameter. Sukigara et al. [28,29] had used RSM to modeland optimize the electrospinning parameters for spin-ning of regenerated Bombyx mori silk. The predictedfiber diameters according to their fitted equation werein agreement with the experimental results. But theyhave not reported the P-value for each factor andhave not done analysis for standard deviation of fiberdiameter. In this paper, RMS was used to optimizeand predict the morphology and fiber diameter ofelectrospun PAN precursors.
By regression analysis, values for coefficients,P-values (a measure of the statistical significance. WhenP-value is less than 0.05, the factor has significantimpact on the average fiber diameter. If P-value isgreater than 0.05, the factor has no significant impacton average fiber diameter.) and R2 (represents the pro-portion of the total variability that has been explainedby the regression model [30]) for regression models wereobtained as shown in Table 3. The fitted second-orderequation for average fiber diameter is given by
y ¼ 323.50þ 446.80v1 þ 5.37v2 þ 362.25v21
� 2.38v22 þ 0.38v1v2; ð1Þ
where y is average fiber diameter, v1 and v2 are the codedvalues of concentration and applied voltage, respec-tively. From the P-values listed in Table 3, it is obviousthat P-values for terms related to applied voltage such asv2, v2
2 and v1v2 are much greater than significance levelof 0.05. That is to say, applied voltage has no significantimpact on average fiber diameter and the interaction be-tween concentration and applied voltage is not signifi-cant, either. But P-values for term v1 and v2
1 are less

Fig. 3. The morphology of fibers at applied voltage from 10 to 20 kV at concentrations from 6% to 12% with a constant tip-to-collector distance of 10 cm (The values below the images and the brackets show the average fiber diameter (nm) and the standarddeviation of fiber diameter. The scale bars for fibers from solution from 6 to 10 wt.% and 12 wt.% are 2 mm and 5 mm, respectively).
S.Y. Gu et al. / European Polymer Journal 41 (2005) 2559–2568 2563
than 0.05. Therefore, concentration has significant im-pact on average fiber diameter. R2 is 0.975. That is tosay, this model explains 98% of the variability in newdata.
Because terms related to applied voltage have no sig-nificant impact on average fiber diameter, we removedterm v2, v2
2, v1v2 and fitted the equation by regressionanalysis again. The model and the results were obtainedas shown in Table 4. The fitted equation in coded unit isgiven by
y0 ¼ 321.9þ 444.80v1 þ 362.30v21; ð2Þ
where y 0 is the average fiber diameter. And in uncodedunit,
y0 ¼ 2241.77� 575.57f1 þ 40.25f21; ð3Þ
where f1 is the concentration of polymer solution. Allthe P-values are less than the significance level of 0.05.That is to say, average fiber diameter has a quadraticrelationship with solution concentration.
In order to find the statistical characteristics of stan-dard deviation of fiber diameter, regression analysis wasdone for standard deviation at the same time. The re-sults were listed in Table 5. The fitted second-order

100 200 300 4000
10
20
Cou
nts
Average fiber diameter/nm100 200 300 400 500
0
10
20
Cou
nts
Average fiber diameter/nma
300 400 500 600 7000
10
20
Cou
nts
Average fiber diameter/nm800 100012001400160018002000
0
5
10
Cou
nts
Average fiber diameter/nm
b
c d
Fig. 4. Distribution of fiber diameters obtained at 10 kV with a tip-to-collector distance of 10 cm. The concentrations for (a), (b), (c)and (d) are 6, 8, 10 and 12 wt.%, respectively.
2564 S.Y. Gu et al. / European Polymer Journal 41 (2005) 2559–2568
equation for standard deviation of fiber diameter isgiven by
Sy ¼ 80.92þ 121.00v1 þ 17.75v2 þ 98.25v21
� 13.50v22 þ 34.95v1v2; ð4Þ
where Sy is the standard deviation of fiber diameter.Similar results were obtained. The P-values related toapplied voltage are much greater than significance levelof 0.05. Therefore applied voltage has no significant ef-fect on the standard deviation of fiber diameter and theinteraction between concentration and applied voltageon the standard deviation of fiber diameter is not signif-icant, either. But P-values for term v1 and v2
1 are lessthan 0.05. Concentration has significant impact on stan-dard deviation of fiber diameter. R2 is 0.903. This indi-cates that this model explains 90% of the variability innew data. After removing term v2, v2
2, v1v2, the fittedequation of standard deviation of fiber diameter asshown in Table 6 is given by
S0y ¼ 71.92þ 121.10v1 þ 98.25v2
1; ð5Þ
where S0y is the standard deviation of fiber diameter.
In uncoded unit,
S0y ¼ 592.87� 156.13f1 þ 10.92f21. ð6Þ
All the P-values are less than the significance level of0.05. Therefore, standard deviation of average fiberdiameter has a quadratic relationship with solution con-centration too.
4. Discussion
During the electrospinning process, the droplet ofsolution at the capillary tip gradually elongates from ahemispherical shape to a conical shape or Taylor coneas the electric field is increased. A further increase inthe electric field results in the ejection of a jet from theapex of the cone. The jet grows longer and thinner until

6 8 10 12 14
200
400
600
800
1000
1200
Ave
rage
fibe
r di
amet
er/n
m
Concentration/ wt%a
10 15 20
200
400
600
800
1000
1200
Ave
rage
fibe
r di
amet
er/n
m
Applied voltage/kVb
Fig. 5. Main effect plots of concentration (a) and appliedvoltage (b) on average fiber diameter.
Table 5Analysis of variance for the two factors (concentration, appliedvoltage) and coefficients of the model in coded unit* (forstandard deviation of fiber diameter)
Term Coefficient P-value
Constant CS0 80.92 0.035Concentration: v1 CS1 121.0 0.001Applied voltage: v2 CS2 17.75 0.338v21 CS11 98.25 0.020v22 CS22 �13.5 0.663v1v2 CS12 34.95 0.177
F Significance R2
11.12 0.000 0.903
* Model: Sy ¼ CS0 þ CS1v1 þ CS2v2 þ CS11v21 þ CS22v22þCS12v1v2, where Sy is the standard deviation of fiber diameter.
Table 3Analysis of variance for the two factors (concentration, appliedvoltage) and coefficients of the model in coded unit* (foraverage fiber diameter)
Term Coefficient P-value
Constant C0 323.50 0.035Concentration: v1 C1 446.80 0.000Applied voltage: v2 C2 5.37 0.863v21 C11 362.25 0.001v22 C22 �2.38 0.365v1v2 C12 0.38 0.993
F Significance R2
45.91 0.000 0.975
* Model: y ¼ C0 þ C1v1 þ C2v2 þ C11v21 þ C22v22 þ C12v1v2,where y is average fiber diameter.
Table 4Analysis of variance for the two factors (concentration, appliedvoltage) and coefficients of the model in coded unit* (foraverage fiber diameter, after removing terms related to appliedvoltage)
Term Coefficient P-value
Constant C00 321.90 0.000
Concentration: v1 C01 444.80 0.000
v21 C011 362.30 0.000
F Significance R2
171.17 0.000 0.974
In uncoded unit, y0 ¼ 2241.77� 575.567f1 þ 40.25f21, where f1is concentration of polymer solution.* Model: y0 ¼ C0
0 þ C01v1 þ C0
11v21, where y 0 is fiber diameter.
10 15 20
200
400
600
800
1000
1200
6 wt% 8 wt% 10 wt% 12 wt%
Ave
rage
fibe
r di
amet
er/n
m
Applied voltage/kV
Fig. 6. Interaction plots between concentration and appliedvoltage on average fiber diameter.
S.Y. Gu et al. / European Polymer Journal 41 (2005) 2559–2568 2565
it solidifies and collects on the collector. The fiber mor-phology is controlled by process parameters. In thisstudy the effect of solution concentration and appliedvoltage on fiber morphology and average fiber diameterwere investigated. Polymer concentration was found tobe the most significant factor controlling the fiberdiameter in the electrospinning process.
4.1. Polymer concentration
Fig. 3 shows spindle-like bead formation at concen-tration of 6 wt.% under applied voltage of 10 kV. The
formation of beads can be related to the formation ofdroplets in electrospray. In the case of low-molecular-weight liquid, when a high electrical force is applied,

Table 6Analysis of variance for the two factors (concentration, appliedvoltage) and coefficients of the model in coded unit* (forstandard deviation of fiber diameter, after removing termsrelated to applied voltage)
Term Coefficient P-value
Constant C0S0 71.92 0.012
Concentration: v1 C0S1 121.1 0.000
v21 C0S11 98.25 0.014
F Significance R2
24.27 0.000 0.844
In uncoded unit S0y ¼ 592.87� 156.13f1 þ 10.92f21, where f1 isthe standard deviation of concentration of polymer solution.* Model: S0y ¼ C0
S0 þ C0S1v1 þ C0
S11v21, where S
0y is the standard
deviation of fiber diameter.
2566 S.Y. Gu et al. / European Polymer Journal 41 (2005) 2559–2568
formation of droplets can occur [35]. A theory proposedby Rayleigh explained this phenomenon. As evaporationof a droplet takes places, the droplet decreases in size.Therefore the charge density of its surface is increased.This increase in charge density due to Coulomb repul-sion overcomes the surface tension of the droplet andcauses the droplet to split into smaller droplets [35,36].However, in the case of a polymer solution (high molec-ular weight liquid) the emerging jet does not break upinto droplets, but is stabilized and forms a string ofbeads connected by a fiber. As the concentration is in-creased, a string of connected beads is seen, and withfurther increase there is reduced bead formation untilonly smooth fibers are formed [17]. And sometimes spin-dle-like beads can form due to the extension causing bythe electrostatic stress. In this study, spindle-like beadsformed at lower concentration of 6 wt.%. When the con-centration was increased, uniform fibers formed. How-ever, when the concentration was increased to 12 wt.%,fibers became rather thick and not uniform. And the fi-ber diameter distribution became gradually broader withincreasing concentration as shown in Fig. 4. The chang-ing of fiber morphology can probably be attributed to acompetition between surface tension and viscosity. Asconcentration was increased, the viscosity of the poly-mer solution increased. The surface tension attemptedto reduce surface area per unit mass, thereby causedthe formation of beads/spheres. Viscoelastic forces re-sisted the formation of beads and allowed for the forma-tion of smooth fibers. Therefore formation of beads atlower polymer solution concentration (low viscosity) oc-curred where surface tension had a greater influencethan the viscoelastic force. However, bead formationwas reduced and finally eliminated at higher polymersolution concentration, where viscoelastic forces had agreater influence in comparison with surface tension.But when the concentration was too high, for example12 wt.%, high viscosity and rapid evaporation of solvent
made the extension of jet more difficult. Thicker and un-uniform fibers were formed.
Besides the effect on fiber morphology, polymer con-centration had significant impact on the average fiberdiameter from the results obtained by response surfacemethodology. The fiber diameter increased with increas-ing polymer concentration because the higher viscosityresisted the extension of the jet. In this study, the aver-age fiber diameter was related to the solution concentra-tion through a quadratic relationship. The relationshipbetween solution concentration and droplet diameterin electrospray followed a power law relationship withexponent of 0.3 from the results of Chen et al. [37].And Deitzel et al. [17] obtained that the average fiberdiameter was related to the solution concentration in apower law relationship with an exponent of about 0.5while Demir et al. [18] reported a power law relationshipwith an exponent of 3. However, Boland reported astrong linear relationship between fiber diameter andconcentration [19]. The differences in the relationship be-tween fiber diameter and concentration may be attri-buted to the in-flight splitting or splaying phenomenaof electrospinning jet reported by Doshi and Reneker[38]. In our study, splitting of jet was not observed.The quadratic relationship between fiber diameter andconcentration indicated that the polymer concentrationplayed an important role in determining the fiberdiameter.
4.2. Applied voltage
From the results shown in Figs. 3, 5 and 6, Tables 3,and 5, it is obvious that the diameter of electrospunPAN fibers did not change significantly over the rangeof applied voltage for the various solution concentra-tions in the experimental region. The same result wasfound by Reneker et al. [23] when they studied the var-iation of nanofiber diameter of polyethylene oxide asprocess parameters were changed. But it is contradictorywith the results obtained by Fennessey and Farris [39],Ding et al. [40] and others [20,22]. In their experiments,the diameter of fibers collected on target decreased asthe applied voltage increased because of the increasingof the pulling and stretching force in their experiments.The inconsistency may be caused by the difference ofthe experimental conditions. The flow rate of solutionin Fennessey�s experiment was maintained the same withthe help of a dual syringe infusion pump, while in ourexperiment the solution was brought down automati-cally by the electrostatic force and hydrodynamic forceof the fluid. So the flow rate in our experiments wasnot controlled. The diameter of fiber is a combinationresult of feed rate and electrostatic force. Increasingthe applied voltage does increase the electrostatic forceand create smaller diameter fibers. But it also drawsmore solution out of the capillary. If the increasing of

S.Y. Gu et al. / European Polymer Journal 41 (2005) 2559–2568 2567
electrostatic force draws much more solution out of thecapillary, the fiber diameter would increased withincreasing applied voltage as reported by Demir et al.[18]. In our study, increasing of applied voltage didnot affect the flow rate to a large extent. Combinationof increasing of applied voltage and flow rate resultedthat the fiber diameter did not change significantly withapplied voltage.
From the results and analysis above, uniform PANnanofibers can be obtained from solution with concen-tration of 8 wt.% and 10 wt.% regardless of applied volt-age in our study. Polymer concentration has significantimpact on fiber diameter. The fitted model as shown inEq. (3) could be used to predict the concentrationneeded to produce a desired fiber diameter within theconcentration range that is capable of being spun. Theequation is valid only at the experimental conditionslisted in this study and would need to be regeneratedfor any additional polymer solution or electrospinningconditions.
The mechanical properties, structures of the electro-spun PAN non-woven precursor and carbon nanofibersas well as carbonization process of the precursors will becarried out in our subsequent studies.
5. Conclusions
The electrospinning of PAN/DMF was processedand fibers with diameter ranging from 200 nm to1200 nm were obtained depending on the electrospin-ning condition. Morphology of fibers and distributionof fiber diameter were investigated at various concentra-tions and applied voltages. Fibers with diameter over1000 nm were obtained at concentration of 12 wt.%.Uniform PAN nanofibers were obtained at concentra-tion of 8 wt.% and 10 wt.% under applied voltage of10–20 kV. While for solution with concentration of6 wt.%, fibers with spindle-like beads were obtained atlower applied voltage and uniform nanofibers were ob-tained at higher applied voltage.
Two-way analysis of variance was carried out at thesignificance level of 0.05 to study the impact of concen-tration and applied voltage on average fiber diameter. Itwas concluded that concentration of solution was themost significant factor impacting the diameter of fibersand standard deviation of fiber diameter. Applied volt-age had no significant impact on average fiber diameter.The average fiber diameter increased with polymer con-centration according to a quadratic relationship underthe experimental conditions studied in this study. Thestandard deviation of fiber diameter increased with poly-mer concentration according to a quadratic relationshiptoo. The model can be used to predict the average fiberdiameter and its standard deviation, and to optimizeelectrospinning conditions. The model is valid only at
the experimental region in this study and would needto be regenerated in other situations.
Acknowledgements
The authors would like to thank Padberg CJ, Mate-rial Science and Technology of Polymer, Faculty ofChemical Technology, University of Twente, for hiskind help of SEM.
References
[1] Shofner ML, Rodriguez-Macias FJ, Vaidyanathan R.Compos Part A 2003;34:1207.
[2] Hou H, Reneker DH. Adv Mater 2004;16:69.[3] Chun I, Reneker DH, Fong H, Fang X, Dietzel J, Tan NB,
et al. J Adv Mater 1999;31:36.[4] Takami N, Satoh A, Hara M, Oshaki T. J Electrochem Soc
1995;142:2564.[5] Kim C, Yang KS. Appl Phys Lett 2003;83:1216.[6] Arbizzani C, Mastragostino M, Meneghello L, Paraventi
R. Adv Mater 1996;8:331.[7] Duan X, Huang Y, Wang J, Lieber DM. Nature
2001;409:66.[8] Endo M, Takeuchi K, Igarashi S. J Phys Chem Solids
1993;54:1841.[9] Merkulov VI, Melechko AV, Guillorn MA. Appl Phys
Lett 2002;80:4816.[10] Wang Y, Serrano S, Santiago-Aviles JJ. Synth Met
2003;38:423.[11] Wang Y, Santiago-Aviles JJ. J Appl Phys 2003;94:1721.[12] Wang Y, Serrano S, Santiago-Aviles JJ. J Mater Sci Lett
2002;21:1055.[13] Park SH, Kim C, Jeong YH, Lim DY, Lee YE, Yang KS.
Synth Met 2004;143:175.[14] Park SH, Kim C, Choi YO, Yang KS. Carbon 2003;
41:2653.[15] Reneker DH, Yarin AL, Fong H, Koombhongse S. J Appl
Phys 2000;87:4531.[16] Fong H, Chun I, Reneker DH. Polymer 1999;40:4585.[17] Deitzel JM, Kleinmeyer J, Harris D, Tan NCB. Polymer
2001;42:261.[18] Demir MM, Yilgor I, Yilgor E, Erman B. Polymer 2002;
43:3303.[19] Boland ED, Wnek GE, Simpson DG, Pawlowski KJ,
Bowlin GL. J Macromol Sci, Pure Appl Chem 2001;A38:1231.
[20] Mo XM, Xu CY, Kotaki M, Ramakrishna S. Biomaterials2004;25:1883.
[21] Ryu YJ, Kim HY, Lee KH, Park HC, Lee DR. Eur PolymJ 2003;39:1883.
[22] Katti DS, Robinson KW, Ko FK, Laurencin CT. J BiomedMater Res B 2004. Article online in advance of print.
[23] Reneker DH, Chun I. Nanotechnology 1996;7:216.[24] Larrondo L, Manley RStJ. J Polym Sci Polym Phys Ed
1981;19:909.[25] Larrondo L, Manley RStJ. J Polym Sci Polym Phys Ed
1981;19:921.

2568 S.Y. Gu et al. / European Polymer Journal 41 (2005) 2559–2568
[26] Larrondo L, Manley RStJ. J Polym Sci Polym Phys Ed1981;19:933.
[27] Baumgarten PK. J Colloid Interf Sci 1971;36:71.[28] Sukigara S, Gandhi M, Ayutsede J, Micklus M, Ko F.
Polymer 2003;4:5721.[29] Sukigara S, Gandhi M, Ayutsede J, Micklus M, Ko F.
Polymer 2004;45:3701.[30] Schmidt SR, Launsby RG. Understanding industrial
designed experiments. 4th ed. Colorado: Air academypress & associates; 1999.
[31] Montgomery DC. Design and analysis of experiments. 5thed. New York: John Wiley Sons, Inc; 2002.
[32] Lope-Manchado MA, Arroyo M. Polymer 2001;42:6557.[33] Wachter R, Cordery A. Carbon 1999;37:1529.[34] Trieu H, Putubuddin S. Polymer 1995;36:2531.[35] Rayleigh JWG. London Edinburgh Dublin Philos 1982;
44:184.[36] Zeleny J. Phys Rev 1914;3:69.[37] Chen DR, Pui DYH, Kaufman SL. J Aerosol Sci 1995;
26:963.[38] Doshi J, Reneker DH. J Electrostat 1995;35:151.[39] Fennessey SF, Farris RJ. Polymer 2004;45:4217.[40] Ding B, Kim HY, Lee SC, Shao CL, Lee DR, Park SJ,
et al. J Polym Sci B 2002;40:1261.
Copyright © 2022 FDOKUMEN