Indian Wheat and Rice Sector Policies and the Implications of Reform
52
Electronic copy available at: http://ssrn.com/abstract=1084557
-
Upload
independent -
Category
Documents
-
view
3 -
download
0
Transcript of Indian Wheat and Rice Sector Policies and the Implications of Reform
Electronic copy available at: http://ssrn.com/abstract=1084557
Electronic copy available at: http://ssrn.com/abstract=1084557
ww
w.er
s.usda.gov
Visit Our Website To Learn More!
National Agricultural LibraryCataloging Record:
The U.S. Department of Agriculture (USDA) prohibits discrimination in all its programs and activities on the basis of race, color, national origin, age, disability, and, where applicable, sex, marital status, familial status, parental status, religion, sexual orientation, genetic information, political beliefs, reprisal, or because all or a part of an individual's income is derived from any public assistance program. (Not all prohibited bases apply to all programs.) Persons with disabilities who require alternative means for communication of program information (Braille, large print, audiotape, etc.) should contact USDA's TARGET Center at (202) 720-2600 (voice and TDD).
To file a complaint of discrimination write to USDA, Director, Office of Civil Rights, 1400 Independence Avenue, S.W., Washington, D.C. 20250-9410 or call (800) 795-3272 (voice) or (202) 720-6382 (TDD). USDA is an equal opportunity provider and employer.
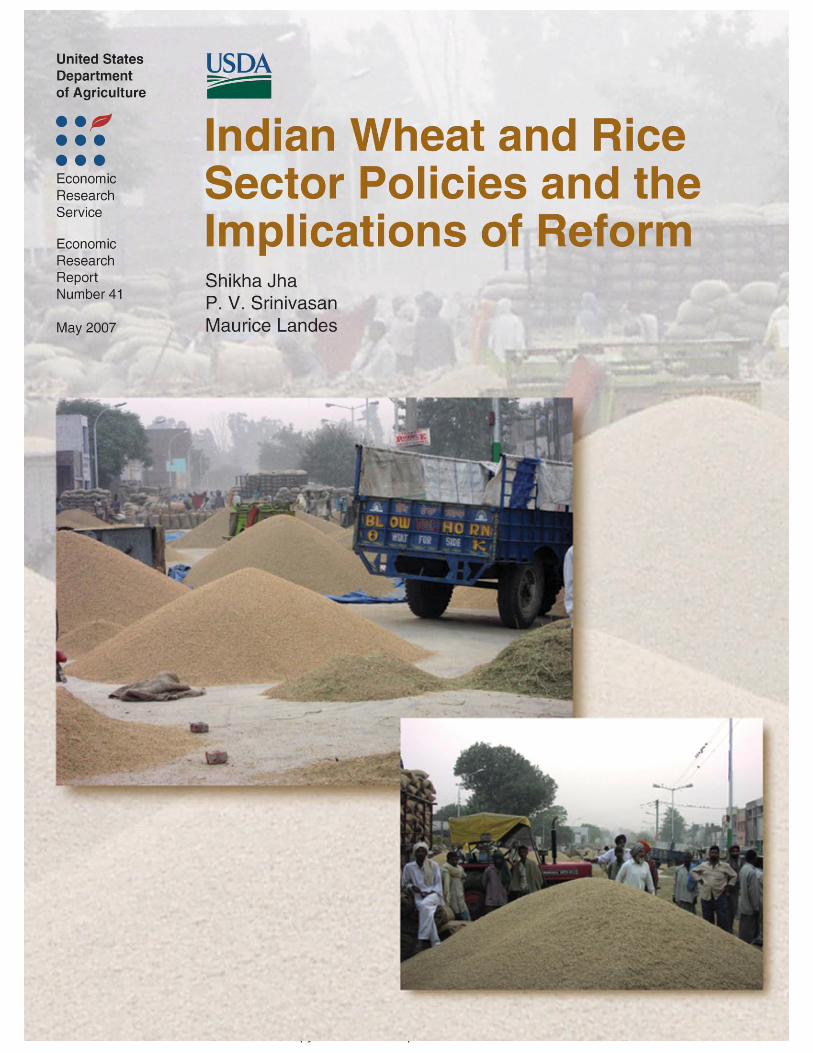
Photo credits: Maurice Landes.
Jha, Shikha Indian wheat and rice sector policies and the implications of reform. (Economic research report (United States. Dept. of Agriculture. Economic Research Service) ; no. 41)
1. Wheat—Economic aspects—India. 2. Rice—Economic aspects—India. 3. Food consumption—India. 4. Agriculture and state—India. 5. Agricultural administration—India. 6. Agricultural subsidies—India. I. Srinivasan, P. V. II. Landes, Maurice. III. United States. Dept. of Agriculture. Economic Research Service. IV. Title.
HD2073
United StatesDepartmentof Agriculture
www.ers.usda.gov
A Report from the Economic Research Service
Shikha Jha, P.V. Srinivasan, and Maurice Landes
AbstractDuring 1998-2002, India experienced record public surpluses of wheat and rice, sharplyhigher government grain subsidy outlays, and declining per capita consumption ofwheat and rice. By 2006, despite continued high subsidies and sluggish domesticconsumption, India developed a large wheat deficit because of reduced price incentives,weak yield growth, and rising subsidized consumption. The pronounced market cyclesand declining per capita consumption for India’s major food staples are creating pres-sure for Indian policymakers to adjust longstanding policies. While there has been nopolitical consensus on more fundamental reform, recent policy changes have movedtoward better targeting of food subsidies to low-income consumers, decentralization ofgovernment operations, and slowed growth in producer price subsidies. Decentralizationis likely to reduce government costs with little impact on producers, consumers, ortrade. Lower price supports would aid consumers at the cost of producers, and sharplylower government costs. Adoption of a U.S.-style deficiency payment program couldmaintain producer support with less market distortion and lower cost, but would requiredevising a viable system to make and monitor farmer payments.
Keywords: India, wheat, rice, production, consumption, trade, policy, reform
About the AuthorsShikha Jha is a Country Economist with the Asian Development Bank (ADB), P.V.Srinivasan is a Professor at the Indira Gandhi Institute for Development Research inMumbai, India, and Maurice Landes is a Senior Economist at the Economic ResearchService, USDA. The views expressed in this paper do not necessarily reflect the viewsor policies of the ADB, its Board of Governors, or the governments they represent.Support for this study—including the analysis of policy options and the analysis ofIndian producer support policies—was provided by the ERS–India Emerging Markets Project.
Economic
Research
Report
Number 41
Indian Wheat and Rice Sector Policies and theImplications of Reform
May 2007
ContentsSummary . . . . . . . . . . . . . . . . . . . . . . . . . . . . . . . . . . . . . . . . . . . . . . . . . . .iii
Introduction . . . . . . . . . . . . . . . . . . . . . . . . . . . . . . . . . . . . . . . . . . . . . . . . .1
Production and Producer Policy . . . . . . . . . . . . . . . . . . . . . . . . . . . . . . . .2
Consumption and Consumer Policy . . . . . . . . . . . . . . . . . . . . . . . . . . . . .9
Trade and Trade Policy . . . . . . . . . . . . . . . . . . . . . . . . . . . . . . . . . . . . . . .13
Government Food Grain Operations . . . . . . . . . . . . . . . . . . . . . . . . . . . .15
Wheat and Rice Sector Reform Options . . . . . . . . . . . . . . . . . . . . . . . . .17
Conclusions . . . . . . . . . . . . . . . . . . . . . . . . . . . . . . . . . . . . . . . . . . . . . . . . .25
References . . . . . . . . . . . . . . . . . . . . . . . . . . . . . . . . . . . . . . . . . . . . . . . . . .27
Appendix 1: Spatial Model of India’s Wheat and Rice Sectors . . . . . . . . . . . . . . . . . . . . . . . . . . . . . . . . . . . . . .30
Appendix 2: Statistical Tables . . . . . . . . . . . . . . . . . . . . . . . . . . . . . . . . .43
iiIndian Wheat and Rice Sector Policies and the Implications of Reform / ERR-41
Economic Research Service/USDA
SummaryBetween 1947, when India achieved independence, and 2000, the country’sfood grain sector turned perennially large deficits into large surpluses of themajor Indian food staples, wheat and rice. During the 1960s and 1970s, theturnaround was achieved through rapid gains in yields, combined with poli-cies that balanced producer and consumer interests. In the 1990s, growth inyields and consumption slowed and government policy sought to sustainprogress by increasing producer support and improving the targeting of foodsubsidies to low-income consumers. By 2000, the Government faced anunwanted combination of high domestic prices, declining per capitaconsumption, record grain surpluses, and soaring budgetary costs. Morerecently, in 2006, lower prices, weak yield growth, and rising subsidizeddistribution have led to the reemergence of a substantial wheat deficit.
What Is the Issue?
Weak growth in food grain production and consumption, and pronouncedrecent market cycles, have created pressure for reform of India’s long-standing food grain policies. Because India’s food grain economy is one ofthe world’s largest, the path India eventually takes on food grain policy islikely to have important implications for U.S. and global markets for wheatand rice. There has been considerable public debate in India on the need forchanges in agricultural and food grain policy, but political consensus onmajor reform has proved difficult to achieve. This study examines recentdevelopments in India’s markets and policies for wheat and rice, andanalyzes the impacts of several policy changes already underway or underconsideration to rebalance producer and consumer interests and controlbudgetary costs.
What Did the Study Find?
The Indian Government has taken steps to decentralize public food grainoperations in order to reduce budgetary costs and to improve the targeting ofIndia’s large food subsidy outlays to low-income consumers. Although therehas been no explicit change in price support policy, wheat and rice supportprices declined in real terms between 2000 and 2006. This study analyzedpotential impacts of three policy reform options that might be pursued overthe next several years:
1. Complete decentralization of government wheat and rice procure-ment and distribution
2. Decentralization plus 10- and 20-percent real reductions in wheatand rice support prices
3. Decentralization plus a shift to use of deficiency payments ratherthan government purchases to support wheat and rice producers.
Results indicate that decentralizing procurement from the Central to theState Governments (option 1) can substantially reduce government costswith little overall impact on producers, consumers, or trade. Decentraliza-tion may also allow more scope for efficient private traders to participateand invest in grain marketing.
iiiIndian Wheat and Rice Sector Policies and the Implications of Reform / ERR-41
Economic Research Service/USDA
Changes in price support policy that reduce minimum support prices forwheat and rice (option 2) would yield larger impacts on domestic supplyand demand than decentralization, as well as sharply lower budgetary costs.Production and producer welfare may decline, but these losses are morethan offset by gains in consumption and consumer welfare, particularlyamong lower income consumers. Although trade impacts are minor in thescenario analyzed, lower domestic prices are likely to boost the competitive-ness of Indian exports in years of surplus, while the recovery in consump-tion and lower stocks increase the potential for imports in years of deficit.
Replacing the existing system of supporting producer prices throughgovernment purchases with a U.S.-style deficiency payment program(option 3) would sharply reduce the budgetary costs of supporting producerswhile also reducing market distortion. However, this option would requiredevelopment of a viable mechanism to make payments to producers andthwart corruption. This option possibly could be based on a recent initiativeto create a system of verifiable and negotiable warehouse receipts.
The major options available to the Indian Government to improve perform-ance and reduce distortions in the wheat and rice sectors appear able todeliver significant cost savings and improved overall welfare. In the mediumterm, these reforms also may boost consumption and lower stocks, withincreased likelihood of imports in years of poor harvests, as well as compet-itive exports in years of surplus. Further analysis is needed to assess thelonger term implications of decentralization and changes in producer subsi-dies in the food grain sector, including the impacts of shifting subsidyoutlays to public investments, and of measures to strengthen private investment in food grain markets.
How Was the Study Conducted?
Data and information used to analyze developments in India’s wheat andrice sectors were taken from published literature and publicly availableIndian data sources. A spatial model of India’s wheat and rice sectors wasdeveloped to analyze the impacts of alternative policies on India’s supply,demand, and trade of wheat and rice, including impacts on producers,consumers, and government costs across the various States of India. Supportfor this study was provided by the ERS–India Emerging Markets Project.
ivIndian Wheat and Rice Sector Policies and the Implications of Reform / ERR-41
Economic Research Service/USDA
IntroductionDuring the 60 years since independence in 1947, progress in India’s wheatand rice sectors—which supply the bulk of daily caloric food intake for apopulation that now exceeds 1 billion people—has made India self-reliant inits major food staples. During the 1960s and 1970s, progress was achievedthrough the successful adoption of yield-enhancing Green Revolution tech-nology, supported by market interventions that sought to balance producerand consumer interests. In the 1990s, when yield and consumption growthslowed, the policy response was to combine higher producer incentives withefforts to better target consumer subsidies. Since then, the wheat and ricesectors have become more volatile. In 2000, the Government faced a combi-nation of record grain surpluses, high domestic prices, declining per capitaconsumption, and soaring budgetary costs. And, by 2006, reduced priceincentives, weak yield growth, and rising subsidized consumption led to thereemergence of a large wheat deficit. Concerns with the recent trends inproduction and consumption and sharp market cycles are creating pressurefor reform of India’s longstanding policy regime in the food grain sector.
Because India’s food grain economy is one of the world’s largest, the pathIndia eventually takes on food grain policy is likely to have important implica-tions for U.S. and global markets for wheat and rice. Once a major cerealimporter, India’s cereal imports trended downward between the 1970s and thelate 1990s when, aided in some years by export subsidies aimed at reducingsurpluses, India became a major exporter of rice and a significant exporter ofwheat. Future trends in wheat and rice trade will be determined not only bychanges in yield growth and consumer demand, but, perhaps more impor-tantly, by changes made in policies affecting producers and consumers.
This study examines recent trends in India’s markets and policies for wheatand rice, and analyzes the impacts of several policy options—decentralizinggovernment procurement and distribution by having State governmentsdirectly purchase grain to meet distribution needs, reductions in producersupport prices, and a shift to U.S.-style deficiency payments for producersupport—to rebalance producer and consumer interests and control budg-etary costs. The analysis indicates that the ongoing process of decentralizingprocurement from the Central to the State Governments can substantiallyreduce the government costs with little impact on producers, consumers, ortrade. Allowing the minimum support prices for wheat and rice to decline inreal terms would have even more significant impacts on costs and providebenefits for consumers, but would reduce stocks and exportable surplusesand increase the potential for future imports. Replacing the existing systemthat relies on government purchases to maintain cereal support prices with aU.S.-style deficiency payment program would have little impact on supplyand demand and provide further significant cuts in budgetary costs, but mayface prohibitive implementation problems.
1Indian Wheat and Rice Sector Policies and the Implications of Reform / ERR-41
Economic Research Service/USDA
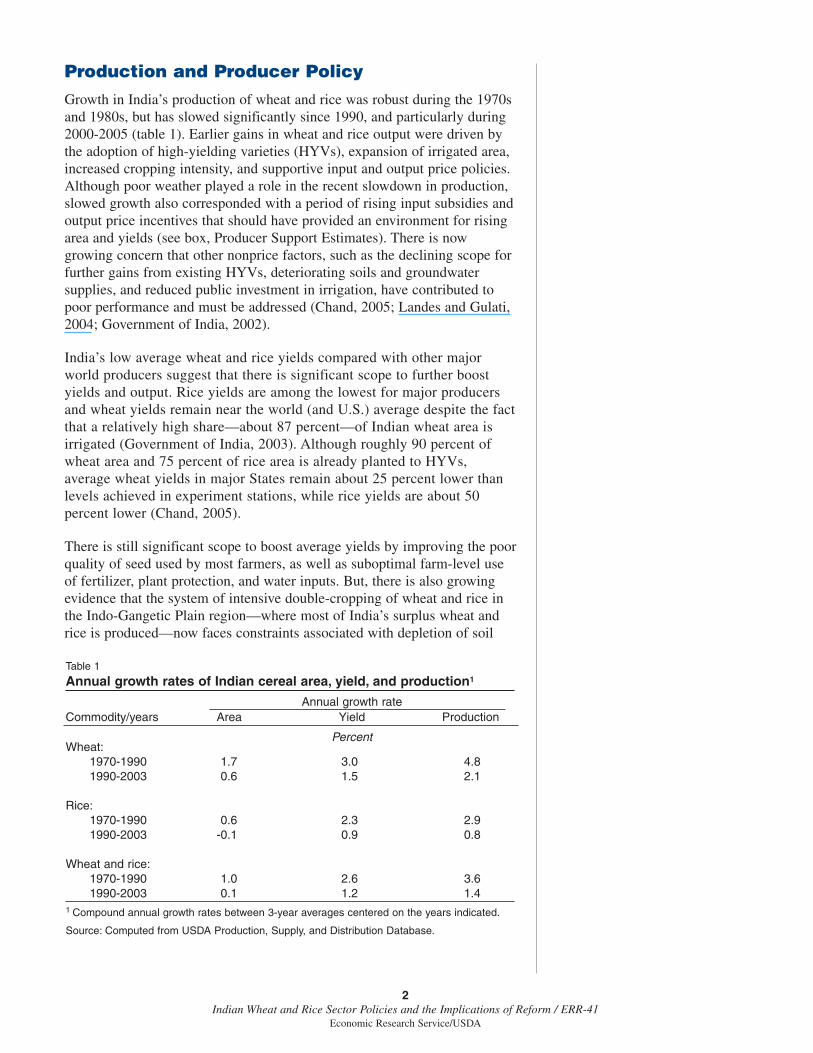
Production and Producer PolicyGrowth in India’s production of wheat and rice was robust during the 1970sand 1980s, but has slowed significantly since 1990, and particularly during2000-2005 (table 1). Earlier gains in wheat and rice output were driven bythe adoption of high-yielding varieties (HYVs), expansion of irrigated area,increased cropping intensity, and supportive input and output price policies.Although poor weather played a role in the recent slowdown in production,slowed growth also corresponded with a period of rising input subsidies andoutput price incentives that should have provided an environment for risingarea and yields (see box, Producer Support Estimates). There is nowgrowing concern that other nonprice factors, such as the declining scope forfurther gains from existing HYVs, deteriorating soils and groundwatersupplies, and reduced public investment in irrigation, have contributed topoor performance and must be addressed (Chand, 2005; Landes and Gulati,2004; Government of India, 2002).
India’s low average wheat and rice yields compared with other majorworld producers suggest that there is significant scope to further boostyields and output. Rice yields are among the lowest for major producersand wheat yields remain near the world (and U.S.) average despite the factthat a relatively high share—about 87 percent—of Indian wheat area isirrigated (Government of India, 2003). Although roughly 90 percent ofwheat area and 75 percent of rice area is already planted to HYVs,average wheat yields in major States remain about 25 percent lower thanlevels achieved in experiment stations, while rice yields are about 50percent lower (Chand, 2005).
There is still significant scope to boost average yields by improving the poorquality of seed used by most farmers, as well as suboptimal farm-level useof fertilizer, plant protection, and water inputs. But, there is also growingevidence that the system of intensive double-cropping of wheat and rice inthe Indo-Gangetic Plain region—where most of India’s surplus wheat andrice is produced—now faces constraints associated with depletion of soil
2Indian Wheat and Rice Sector Policies and the Implications of Reform / ERR-41
Economic Research Service/USDA
Table 1
Annual growth rates of Indian cereal area, yield, and production1
Annual growth rateCommodity/years Area Yield Production
PercentWheat:
1970-1990 1.7 3.0 4.81990-2003 0.6 1.5 2.1
Rice:1970-1990 0.6 2.3 2.91990-2003 -0.1 0.9 0.8
Wheat and rice:1970-1990 1.0 2.6 3.61990-2003 0.1 1.2 1.4
1 Compound annual growth rates between 3-year averages centered on the years indicated.
Source: Computed from USDA Production, Supply, and Distribution Database.
3Indian Wheat and Rice Sector Policies and the Implications of Reform / ERR-41
Economic Research Service/USDA
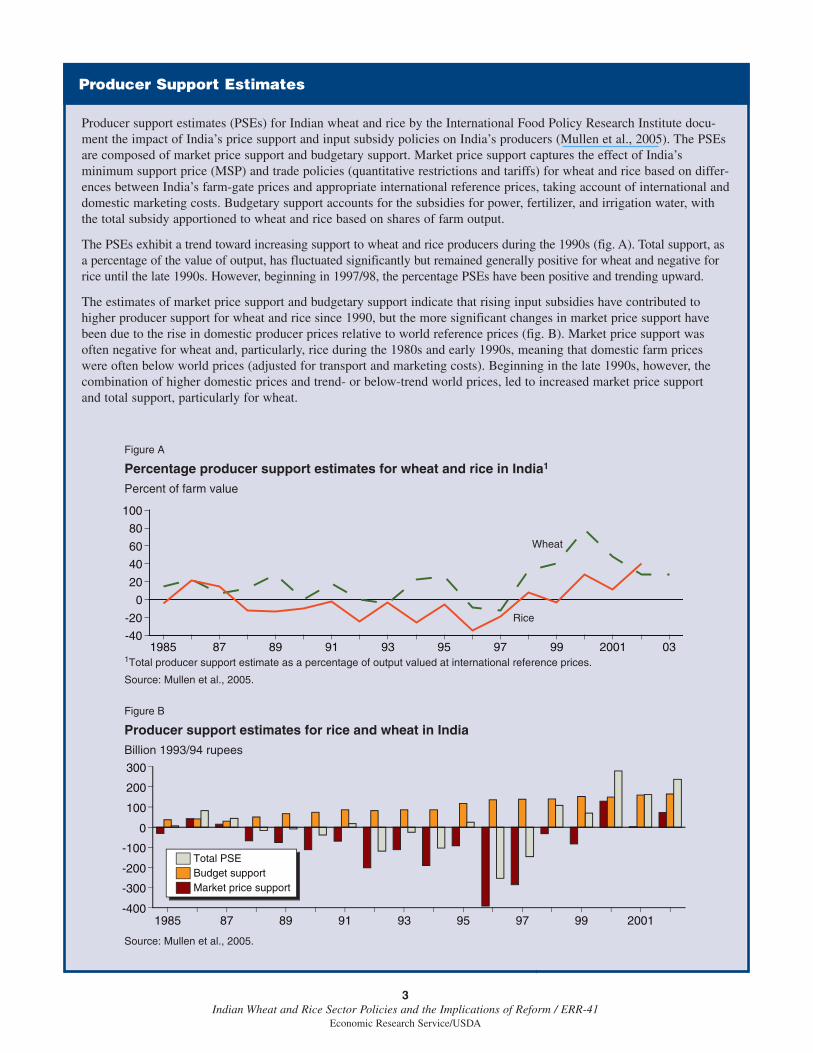
Producer support estimates (PSEs) for Indian wheat and rice by the International Food Policy Research Institute docu-ment the impact of India’s price support and input subsidy policies on India’s producers (Mullen et al., 2005). The PSEsare composed of market price support and budgetary support. Market price support captures the effect of India’sminimum support price (MSP) and trade policies (quantitative restrictions and tariffs) for wheat and rice based on differ-ences between India’s farm-gate prices and appropriate international reference prices, taking account of international anddomestic marketing costs. Budgetary support accounts for the subsidies for power, fertilizer, and irrigation water, withthe total subsidy apportioned to wheat and rice based on shares of farm output.
The PSEs exhibit a trend toward increasing support to wheat and rice producers during the 1990s (fig. A). Total support, asa percentage of the value of output, has fluctuated significantly but remained generally positive for wheat and negative forrice until the late 1990s. However, beginning in 1997/98, the percentage PSEs have been positive and trending upward.
The estimates of market price support and budgetary support indicate that rising input subsidies have contributed tohigher producer support for wheat and rice since 1990, but the more significant changes in market price support havebeen due to the rise in domestic producer prices relative to world reference prices (fig. B). Market price support wasoften negative for wheat and, particularly, rice during the 1980s and early 1990s, meaning that domestic farm priceswere often below world prices (adjusted for transport and marketing costs). Beginning in the late 1990s, however, thecombination of higher domestic prices and trend- or below-trend world prices, led to increased market price support and total support, particularly for wheat.
Producer Support Estimates
Figure A
Percentage producer support estimates for wheat and rice in India1
1Total producer support estimate as a percentage of output valued at international reference prices.
Source: Mullen et al., 2005.
Percent of farm value
Rice
Wheat
1985 87 89 91 93 95 97 99 2001 03-40
-20
0
20
40
60
80
100
Figure B
Producer support estimates for rice and wheat in India
Source: Mullen et al., 2005.
Billion 1993/94 rupees
1985 87 89 91 93 95 97 99 2001-400
-300
-200
-100
0
100
200
300
Market price supportBudget supportTotal PSE
and water resources and pest problems that may continue to slow yieldgrowth and result in shifts to other crops (RWC-CIMMYT, 2003).
Sustaining adequate growth in wheat and rice output to meet domesticdemand is likely to be increasingly dependent on public and private invest-ments to strengthen research, education, delivery of quality inputs, anddevelopment and use of water resources. But, while private investment inagriculture has increased modestly in recent years, public investment hasdeclined, falling from the equivalent of 10 percent of agricultural output in1981-83 to just 5 percent in 1998-2000 (Landes and Gulati, 2004).1 Totalpublic and private investment in agriculture amounted to about 16 percent ofagricultural output in 2000-03, below the 29-percent investment/output ratiofor the remainder of the Indian economy. Public investment has been weak-ened, in part, by budgetary pressures stemming from the large increase inexpenditures on the “food grain” subsidy (the cost of food grain pricesupport and procurement, storage, and public distribution), and input subsi-dies on fertilizer, water, and power. Incentives for private investment arereduced by policies that constrain private agricultural markets, regulatemovement and storage of essential commodities, and impose relatively hightaxes on processed foods (Landes and Gulati, 2004).
Producer Price Policy
Producer price policy has played an important role in supporting the growthof India’s wheat and rice output since the 1970s. Price policy for wheat andrice is implemented through minimum support prices (MSPs) for fair-to-average quality (FAQ) grain that are revised annually and defended byIndian Government purchases in surplus areas during harvest. For wheat, theMSP is paid directly to farmers in the primary markets where they sell theirgrain. For rice, about half of total procurement is purchased in primarymarkets in the form of unmilled rice (paddy) at the MSP and about half ispurchased as milled rice through a statutory, fixed-price levy imposed onrice millers in some States. Under the levy, millers are obligated to deliver ashare of the rice they process to the government at a fixed, below-marketprice. The levy shares vary from State to State (from a low of 10 percent toa high of 75 percent) and, particularly in States with high levies, the systemresults in an actual farm price below the rice MSP under most market condi-tions. Grain procured in price-support operations is stored by the FoodCorporation of India (FCI), a parastatal, which either makes the grain avail-able to State governments for subsidized distribution, holds it in storage, or,when conditions permit, allocates surplus grain for export.
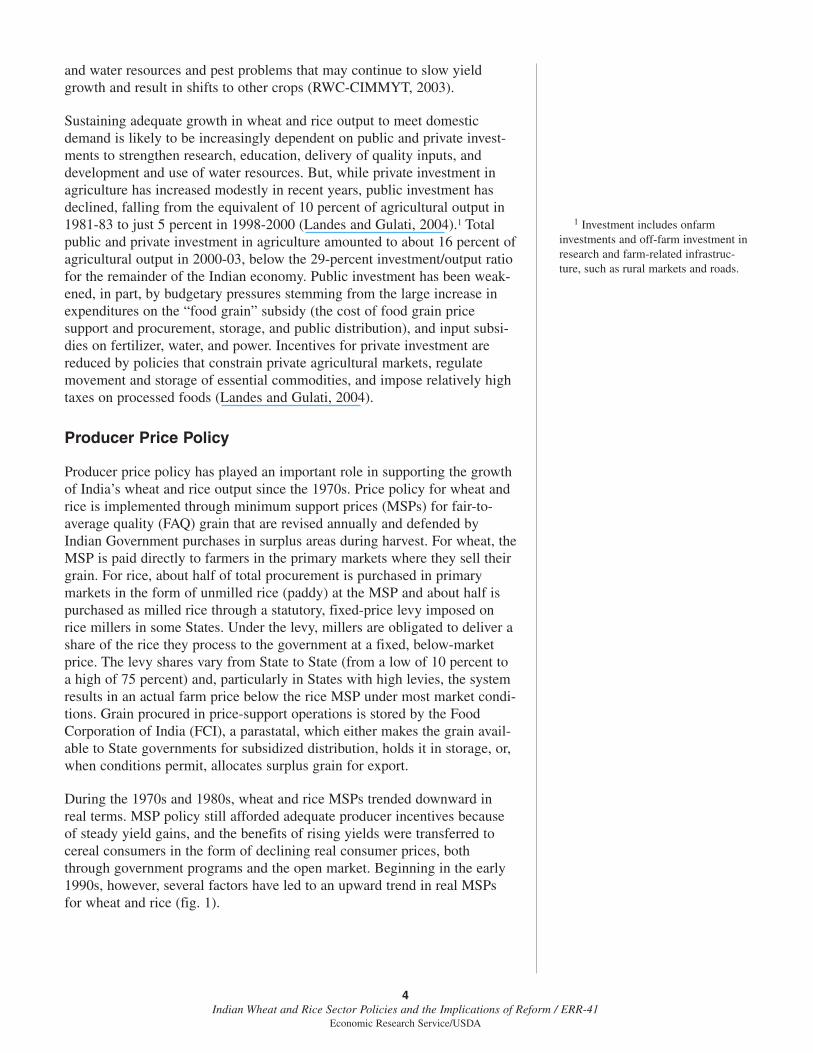
During the 1970s and 1980s, wheat and rice MSPs trended downward inreal terms. MSP policy still afforded adequate producer incentives becauseof steady yield gains, and the benefits of rising yields were transferred tocereal consumers in the form of declining real consumer prices, boththrough government programs and the open market. Beginning in the early1990s, however, several factors have led to an upward trend in real MSPsfor wheat and rice (fig. 1).
4Indian Wheat and Rice Sector Policies and the Implications of Reform / ERR-41
Economic Research Service/USDA
1 Investment includes onfarminvestments and off-farm investment inresearch and farm-related infrastruc-ture, such as rural markets and roads.
� MSPs are based largely on costs of production—as estimated by India’sCommission on Agricultural Costs and Prices (CACP)—using a “fullcost” measure that includes the costs of variable inputs, the rental valueof land, the imputed value of family labor, and a 10-percent return tomanagement. Devaluation of the rupee in the early 1990s helped push upthe costs of traded inputs. In addition, production cost hikes have likelybeen compounded as MSP benefits are reflected in the costs of land,labor, and management. Basing MSPs on production costs allowedMSPs to become increasingly disconnected from market conditions asIndia transitioned from deficits to surpluses.
� When India began to eliminate quantitative restrictions on cereal exportsin the second half of the 1990s, producers initially benefited from rela-tively high world prices. When world prices fell back toward trend in thelate 1990s, there was pressure to compensate producers for the impact oflower world prices by increasing MSPs more than indicated by theCACP estimates of changes in production costs.
� The political environment for cereals policy changed in the 1990s, whenIndia entered an era of coalition governments and the farm lobbybecame more influential. During 1995/96-2001/02, just before andduring the accumulation of surpluses, the Government set MSPs abovethe recommendations of the Commission on Agricultural Costs andPrices (based on production costs) in 4 of 7 years for rice and 5 of 7years for wheat (Parikh et al., 2003).
� The MSP mechanism is one of the few policy levers available to Indianpolicymakers in the food grain sector and there is a tendency to try touse it to achieve multiple policy goals, including price stabilization andincome support.
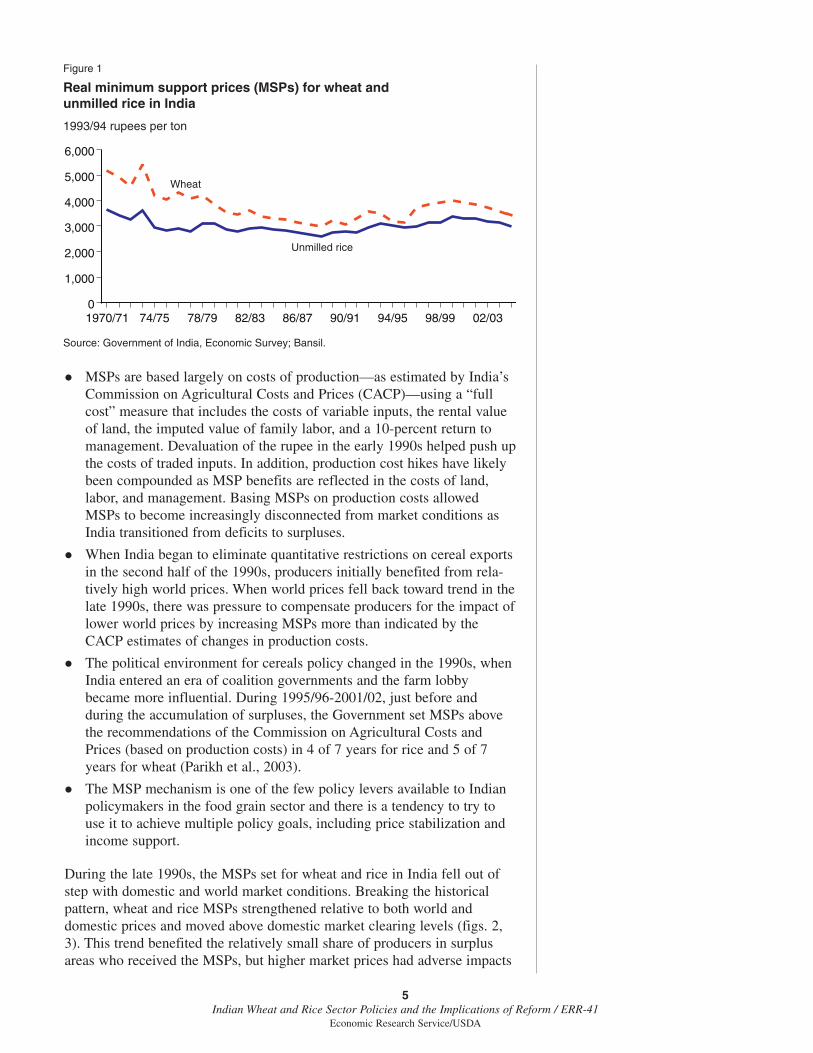
During the late 1990s, the MSPs set for wheat and rice in India fell out ofstep with domestic and world market conditions. Breaking the historicalpattern, wheat and rice MSPs strengthened relative to both world anddomestic prices and moved above domestic market clearing levels (figs. 2,3). This trend benefited the relatively small share of producers in surplusareas who received the MSPs, but higher market prices had adverse impacts
5Indian Wheat and Rice Sector Policies and the Implications of Reform / ERR-41
Economic Research Service/USDA
Figure 1
Real minimum support prices (MSPs) for wheat and unmilled rice in India
Source: Government of India, Economic Survey; Bansil.
1993/94 rupees per ton
Unmilled rice
Wheat
1970/71 74/75 78/79 82/83 86/87 90/91 94/95 98/99 02/030
1,000
2,000
3,000
4,000
5,000
6,000
on consumers. By maintaining high prices, the Government became respon-sible for the storage and transport of most of the marketed surplus of wheatand rice in the country—which some observers termed a “de facto national-ization” of grain trade. Further, because high-quality grain tended to bepurchased at above the MSP by private traders, and government agencieswere often obliged to buy grain below the FAQ standard, most government-owned grain was of medium or low quality. This resulted in rising budgetarycosts for procurement, storage, and storage losses, together with reducedincentives for private investment in grain storage and handling. The policyof maintaining high wheat and rice prices—along with subsidies on waterand fertilizer—has also contributed to emergent problems with soil andwater-resource depletion associated with the intensive wheat-rice croppingsystem in northern India.
Since 2001, following the accumulation of large surplus stocks, there havebeen relatively small nominal annual increases in wheat and rice MSPs. In
6Indian Wheat and Rice Sector Policies and the Implications of Reform / ERR-41
Economic Research Service/USDA
Figure 3
Rice prices and production costs in India
Sources: Government of India, Ministry of Finance, Economic Survey; Government of India,Ministry of Agriculture, Commission on Agricultural Costs and Prices; ERS data.
1993/94 rupees per ton
Cost of production, Punjab
World, Thai
Index (1993/94=100)
Real wholesale price(right axis)
Minimum support price
1980/81 84/85 88/89 92/93 96/97 2000/01 04/050
2,000
4,000
6,000
8,000
10,000
12,000
14,000
16,000
0
20
40
60
80
100
120
Figure 2
Wheat prices and production costs in India
Sources: Government of India, Ministry of Finance, Economic Survey; Government of India,Ministry of Agriculture, Commission on Agricultural Costs and Prices; ERS data.
1993/94 rupees per ton
Cost of production, Punjab
World, U.S.
1980/81 84/85 88/89 92/93 96/97 2000/01 04/050
1,000
2,000
3,000
4,000
5,000
6,000
7,000
8,000
0
20
40
60
80
100
120
140
Index (1993/94=100)
Real wholesale price(right axis)
Minimum support price

real terms, wheat and rice MSPs have declined by 14 percent and 11percent, although, because of appreciation of the rupee against the dollar,MSPs have continued to rise in dollar terms. MSPs for rice and, particularly,wheat have also tended to decline relative to both MSPs and market pricesfor competing crops of oilseeds, pulses, and sugarcane. As a consequence,there has been slower growth in wheat and rice output, including both areaand yield, slowed growth in government procurement of wheat and rice inprice support operations, and real declines in domestic wholesale prices.
Input Policies
The major input policies affecting India’s wheat and rice sectors are subsi-dies on fertilizer, power, and irrigation water, together with public invest-ments in surface, and to a lesser extent, ground water irrigation. Together,the subsidies on fertilizer, power, and water have grown about 6 percentannually in real terms since 1990, reaching nearly 500 billion rupees (Rs)(about $10 billion), equivalent to about 11 percent of total agriculturaloutput, in 2002/03 (fig. 4). The cost of providing free or subsidized(depending on the State) electricity for agriculture accounts for more thantwo-thirds of total input subsidies, as well as most of the growth since1990.2 Irrigation is a key factor in boosting crop yields, but it is widelyacknowledged that the subsidies for irrigation have played a role inpromoting the inefficient use of water and the overpumping of groundwater.
Fertilizer subsidies are provided to farmers in the form of reduced prices fordomestic and imported fertilizers, and to the fertilizer industry in the formof preferential prices to offset the losses of higher cost plants. The portionof the fertilizer subsidy going to Indian farmers amounted to about Rs70billion ($1.4 billion) in 2002/03, and has tended to decline since the mid-1990s. Subsidies on irrigation water were about Rs60 billion ($1.2 billion)in 2002/03 and have also shown little growth.
7Indian Wheat and Rice Sector Policies and the Implications of Reform / ERR-41
Economic Research Service/USDA
Figure 4
Major input subsidies in India
Source: Government of India, Ministry of Finance, Economic Survey.
Billion 1993/94 rupees
1985 87 89 91 93 95 97 99 20010
50
100
150
200
250
300
1Includes only portion of fertilizer subsidy that goes to farmers rather than to fertilizer manufacturers.
PowerFertilizer1Irrigation water
2 In Indian agriculture, electricity is used primarily for ground water irrigation sets.
Reform of policies in the power sector is seen as the key to containingsubsidy costs and allowing public resources to be shifted toward productiveinvestments in irrigation, research, and market infrastructure. Moreover, thepower subsidies tend to mostly benefit larger farmers, who own more pumpsets (Gulati and Narayanan, 2003). Decisions on power sector reform lieprimarily with State Governments, which complicates reaching an agree-ment to withdraw or reduce the power subsidies, which are popular amongrural voters.
Production credit is also a key input in the rice and wheat sectors. Althoughthere is a large network of commercial, cooperative, and “regional rural”banks extending institutional credit for agriculture, total institutional creditas a share of farm output has not been increasing, indicating that there hasbeen little improvement in credit availability (Government of India, Ministryof Finance, Economic Survey). Available evidence suggests that a largeshare of farmers, particularly smaller farmers, remain dependent on nonin-stitutional credit supplied by moneylenders, landlords, and traders at highinterest rates relative to institutional credit (Rao and Jeromi, 2006). Institu-tional credit to agriculture, considered a priority sector, is typically extendedat prime commercial lending rates. However, official debt relief, which wason the order of 2 percent of total credit extended in 2005/06, is periodicallyextended to farmers.
8Indian Wheat and Rice Sector Policies and the Implications of Reform / ERR-41
Economic Research Service/USDA
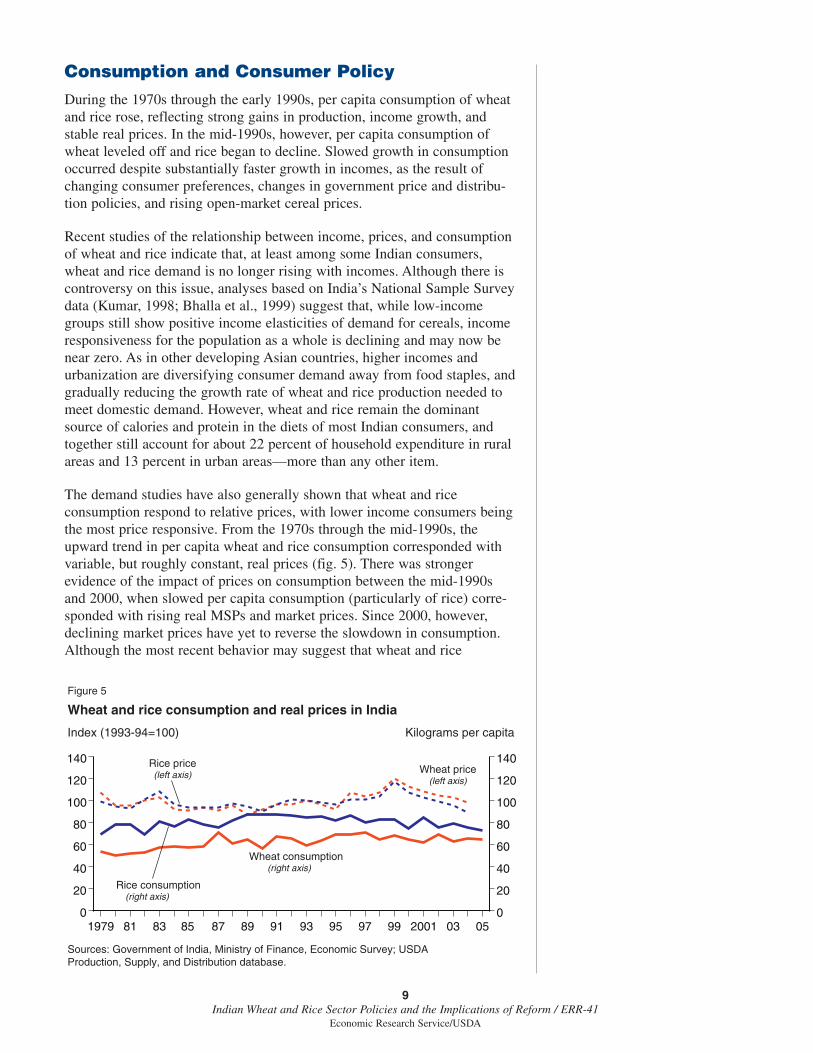
Consumption and Consumer PolicyDuring the 1970s through the early 1990s, per capita consumption of wheatand rice rose, reflecting strong gains in production, income growth, andstable real prices. In the mid-1990s, however, per capita consumption ofwheat leveled off and rice began to decline. Slowed growth in consumptionoccurred despite substantially faster growth in incomes, as the result ofchanging consumer preferences, changes in government price and distribu-tion policies, and rising open-market cereal prices.
Recent studies of the relationship between income, prices, and consumptionof wheat and rice indicate that, at least among some Indian consumers,wheat and rice demand is no longer rising with incomes. Although there iscontroversy on this issue, analyses based on India’s National Sample Surveydata (Kumar, 1998; Bhalla et al., 1999) suggest that, while low-incomegroups still show positive income elasticities of demand for cereals, incomeresponsiveness for the population as a whole is declining and may now benear zero. As in other developing Asian countries, higher incomes andurbanization are diversifying consumer demand away from food staples, andgradually reducing the growth rate of wheat and rice production needed tomeet domestic demand. However, wheat and rice remain the dominantsource of calories and protein in the diets of most Indian consumers, andtogether still account for about 22 percent of household expenditure in ruralareas and 13 percent in urban areas—more than any other item.
The demand studies have also generally shown that wheat and riceconsumption respond to relative prices, with lower income consumers beingthe most price responsive. From the 1970s through the mid-1990s, theupward trend in per capita wheat and rice consumption corresponded withvariable, but roughly constant, real prices (fig. 5). There was strongerevidence of the impact of prices on consumption between the mid-1990sand 2000, when slowed per capita consumption (particularly of rice) corre-sponded with rising real MSPs and market prices. Since 2000, however,declining market prices have yet to reverse the slowdown in consumption.Although the most recent behavior may suggest that wheat and rice
9Indian Wheat and Rice Sector Policies and the Implications of Reform / ERR-41
Economic Research Service/USDA
Figure 5
Wheat and rice consumption and real prices in India
Sources: Government of India, Ministry of Finance, Economic Survey; USDA Production, Supply, and Distribution database.
Index (1993-94=100)
Rice consumption (right axis)
Kilograms per capita
Rice price(left axis)
Wheat consumption (right axis)
1979 81 83 85 87 89 91 93 95 97 99 2001 03 050
20
40
60
80
100
120
140
0
20
40
60
80
100
120
140Wheat price
(left axis)
consumers are becoming less responsive to changes in relative prices, it islikely that the relatively low-income consumers served by India’s food-distribution programs remain responsive to changes in relative prices.
Food Distribution Policies
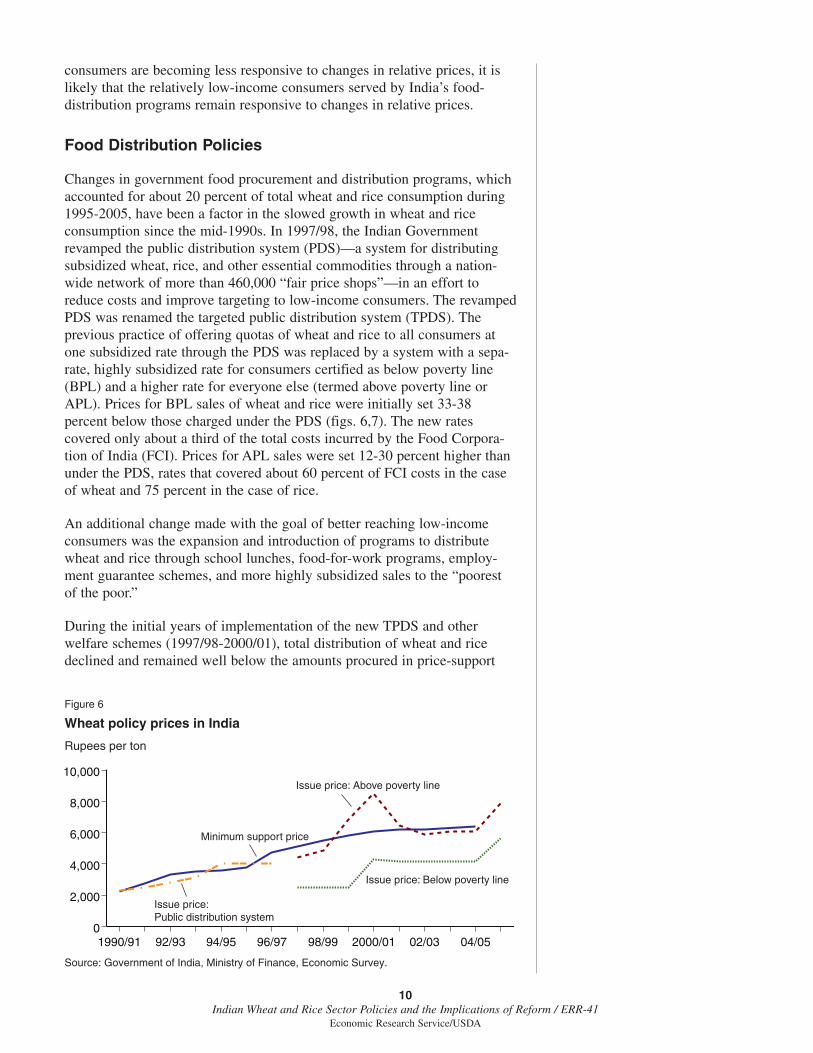
Changes in government food procurement and distribution programs, whichaccounted for about 20 percent of total wheat and rice consumption during1995-2005, have been a factor in the slowed growth in wheat and riceconsumption since the mid-1990s. In 1997/98, the Indian Governmentrevamped the public distribution system (PDS)—a system for distributingsubsidized wheat, rice, and other essential commodities through a nation-wide network of more than 460,000 “fair price shops”—in an effort toreduce costs and improve targeting to low-income consumers. The revampedPDS was renamed the targeted public distribution system (TPDS). Theprevious practice of offering quotas of wheat and rice to all consumers atone subsidized rate through the PDS was replaced by a system with a sepa-rate, highly subsidized rate for consumers certified as below poverty line(BPL) and a higher rate for everyone else (termed above poverty line orAPL). Prices for BPL sales of wheat and rice were initially set 33-38percent below those charged under the PDS (figs. 6,7). The new ratescovered only about a third of the total costs incurred by the Food Corpora-tion of India (FCI). Prices for APL sales were set 12-30 percent higher thanunder the PDS, rates that covered about 60 percent of FCI costs in the caseof wheat and 75 percent in the case of rice.
An additional change made with the goal of better reaching low-incomeconsumers was the expansion and introduction of programs to distributewheat and rice through school lunches, food-for-work programs, employ-ment guarantee schemes, and more highly subsidized sales to the “poorestof the poor.”
During the initial years of implementation of the new TPDS and otherwelfare schemes (1997/98-2000/01), total distribution of wheat and ricedeclined and remained well below the amounts procured in price-support
10Indian Wheat and Rice Sector Policies and the Implications of Reform / ERR-41
Economic Research Service/USDA
Figure 6
Wheat policy prices in India
Source: Government of India, Ministry of Finance, Economic Survey.
Rupees per ton
Issue price: Below poverty line
1990/91 92/93 94/95 96/97 98/99 2000/01 02/03 04/050
2,000
4,000
6,000
8,000
10,000Issue price: Above poverty line
Minimum support price
Issue price: Public distribution system
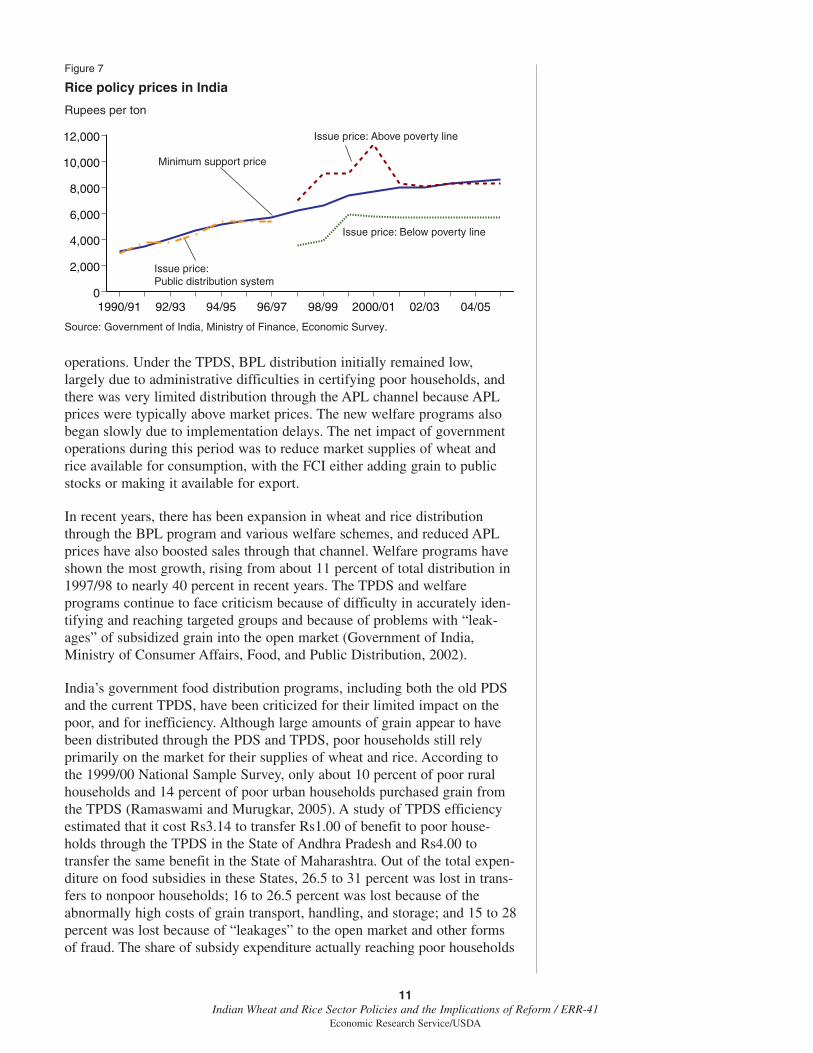
operations. Under the TPDS, BPL distribution initially remained low,largely due to administrative difficulties in certifying poor households, andthere was very limited distribution through the APL channel because APLprices were typically above market prices. The new welfare programs alsobegan slowly due to implementation delays. The net impact of governmentoperations during this period was to reduce market supplies of wheat andrice available for consumption, with the FCI either adding grain to publicstocks or making it available for export.
In recent years, there has been expansion in wheat and rice distributionthrough the BPL program and various welfare schemes, and reduced APLprices have also boosted sales through that channel. Welfare programs haveshown the most growth, rising from about 11 percent of total distribution in1997/98 to nearly 40 percent in recent years. The TPDS and welfareprograms continue to face criticism because of difficulty in accurately iden-tifying and reaching targeted groups and because of problems with “leak-ages” of subsidized grain into the open market (Government of India,Ministry of Consumer Affairs, Food, and Public Distribution, 2002).
India’s government food distribution programs, including both the old PDSand the current TPDS, have been criticized for their limited impact on thepoor, and for inefficiency. Although large amounts of grain appear to havebeen distributed through the PDS and TPDS, poor households still relyprimarily on the market for their supplies of wheat and rice. According tothe 1999/00 National Sample Survey, only about 10 percent of poor ruralhouseholds and 14 percent of poor urban households purchased grain fromthe TPDS (Ramaswami and Murugkar, 2005). A study of TPDS efficiencyestimated that it cost Rs3.14 to transfer Rs1.00 of benefit to poor house-holds through the TPDS in the State of Andhra Pradesh and Rs4.00 totransfer the same benefit in the State of Maharashtra. Out of the total expen-diture on food subsidies in these States, 26.5 to 31 percent was lost in trans-fers to nonpoor households; 16 to 26.5 percent was lost because of theabnormally high costs of grain transport, handling, and storage; and 15 to 28percent was lost because of “leakages” to the open market and other formsof fraud. The share of subsidy expenditure actually reaching poor households
11Indian Wheat and Rice Sector Policies and the Implications of Reform / ERR-41
Economic Research Service/USDA
Figure 7
Rice policy prices in India
Source: Government of India, Ministry of Finance, Economic Survey.
Rupees per ton
Issue price: Below poverty line
Issue price: Above poverty line
Minimum support price
Issue price: Public distribution system
1990/91 92/93 94/95 96/97 98/99 2000/01 02/03 04/050
2,000
4,000
6,000
8,000
10,000
12,000

was about 25 percent in Maharashtra and 32 percent in Andhra Pradesh(Ramaswami, 2002).
Because a high proportion of India’s food subsidy costs stem from theGovernment’s involvement in owning, transporting, and storing grain, a shiftto a program based on food stamps, such as that used in the United States,would have the potential to significantly reduce government costs. With afood stamp program, physical handling and distribution of grain would liewith the private sector, thereby reducing or eliminating a large share ofcurrent government costs. The corruption-related “leakages” of grain duringgovernment handling and storage could also be avoided. Setting up a U.S.-style food stamp program would involve many of the same problems inidentifying and targeting poor households as the TPDS has, but might haveadvantages in reaching remote areas where TPDS shops are not viable, andin subsidizing foods, particularly coarse grains, that are important for poorhouseholds in some areas but are not handled by the TPDS.
A key precondition for implementing a food stamp program in India isdevelopment of an administratively workable system of issuing andredeeming coupons that will prevent food stamps and program benefits frombeing used fraudulently. Another issue is concern about loss of governmentcontrol of physical grain markets and private traders in the current system.The potential benefits of shifting to a food stamp program are discussed inIndia’s 10th Five Year Plan (Government of India, Planning Commission,2002). To date, there has been a small State-level food-coupon scheme inAndhra Pradesh, with plans for a food stamp pilot project in Maharashtrathat is intended to evaluate the feasibility of implementing the program on alarger scale (Ramaswami, 2002; Ramaswami and Murugkar, 2005).
12Indian Wheat and Rice Sector Policies and the Implications of Reform / ERR-41
Economic Research Service/USDA

Trade and Trade PolicySince 1970, India’s trade in cereals has shown a trend from net imports tonet exports of both wheat and rice—a trend that reflects shifts in tradepolicy, as well as longer term changes in supply and demand (fig. 8).Through the 1980s and early 1990s, Indian agriculture had export restric-tions and overvalued exchange rates that resulted in net taxation of the farmsector. Exports of agricultural goods, including wheat and rice, wererestricted through various regulations to bolster India’s domestic food secu-rity. For wheat and rice, quantitative controls on imports and exports wereadministered through the Food Corporation of India (FCI).
In the mid-1990s, trade policies were changed when quantitative restrictionson imports were lifted and replaced by tariffs. The wheat tariff was initiallyset at zero, but was raised to 50 percent in 1999 to curb imports intosouthern India at a time when surpluses were growing in the north. The ricetariff has remained at 70 percent, a level that prohibits trade fromoccurring.3 Export restrictions on wheat and rice, historically imposedthrough State trading, quotas, and minimum export prices, have beenprogressively liberalized.
In 2000, India began to provide budgetary subsidies to support exports ofsurplus wheat and rice when the combination of declining world pricesand higher domestic prices made Indian wheat and rice uncompetitive inworld markets. In 2005, the Government halted export subsidies becauseof tightening domestic supplies and reduced Indian competitiveness ininternational markets, although private traders remain free to export wheatand rice.
The removal of quantitative restrictions on exports and imports, whilehaving potentially positive impacts on investment and competitiveness inthe wheat and rice sectors, has exposed problems with the existing mecha-nism for minimum support prices (MSPs) and created new challenges formeeting the needs of consumers through the targeted public distributionsystem (TPDS):
13Indian Wheat and Rice Sector Policies and the Implications of Reform / ERR-41
Economic Research Service/USDA
Figure 8
Trends in India's wheat and rice trade
Source: USDA Production, Supply, and Distribution database.
Million tons
Rice Wheat
1970/71 74/75 78/79 82/83 86/87 90/91 94/95 98/99 02/03-12-10-8-6-4-202468
Imports
Exports
3 India’s World Trade Organizationbound tariffs are 100 percent for wheatand 70 percent for milled rice.
� The removal of quantitative trade restrictions has exposed the needfor an MSP-setting mechanism that keeps support prices betterconnected to domestic and world prices, rather than production costs.While the MSP based primarily on production costs worked effec-tively and benefited producers and traders in an environment of rela-tively high international prices during the mid-1990s, it createdproblems when world prices fell from their 1995/96 peak. In the late1990s, MSPs set largely on the basis of production costs and politicalimperatives to support producers became disconnected from marketrealities, leading to declining consumption and large grain surplusesand budgetary costs.
� The removal of export restraints has increased demands on domesticdistribution programs to stabilize supplies for lower incomeconsumers. An important rationale for earlier restraints on exportswas to ensure stable supplies and prices for domestic consumers.Higher domestic prices and declines in per capita rice consumptionin the period following the liberalization of wheat and rice tradesuggest that at least some consumers have been adversely affected.However, since global rice prices have been declining since the mid-1990s, these impacts were likely at least partially driven by highMSPs and declines in distribution associated with implementation ofthe TPDS, and not just the removal of export restraints.
14Indian Wheat and Rice Sector Policies and the Implications of Reform / ERR-41
Economic Research Service/USDA
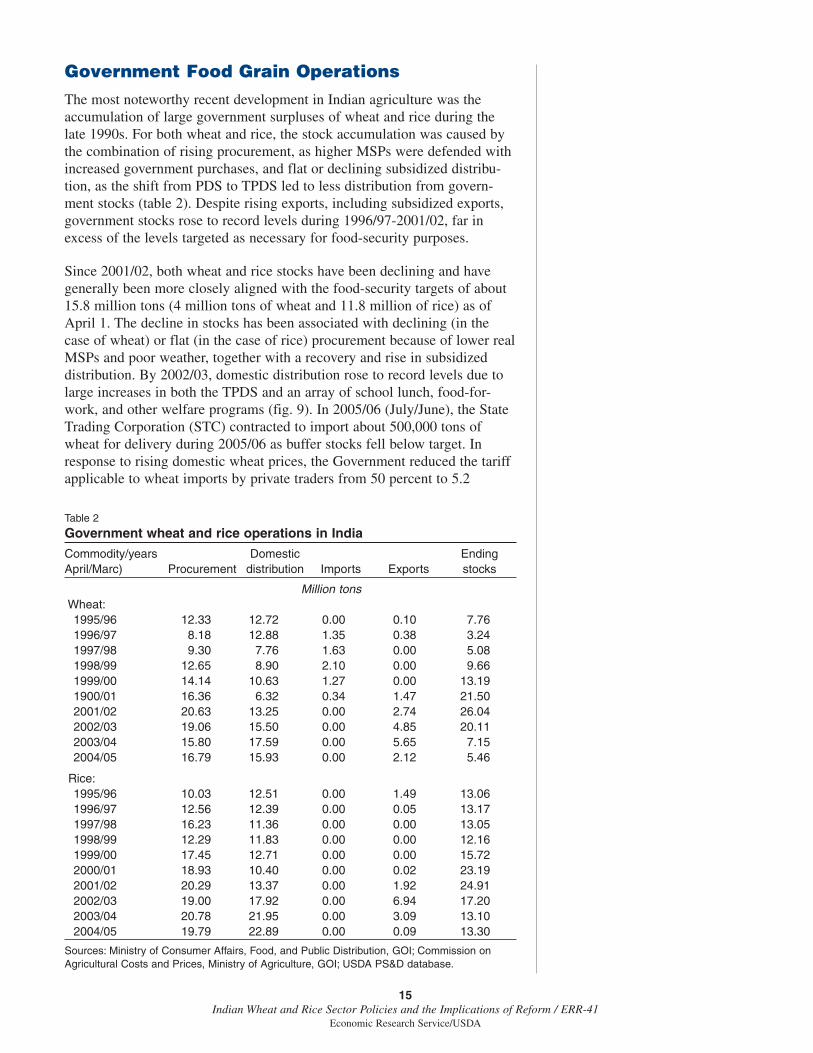
Government Food Grain OperationsThe most noteworthy recent development in Indian agriculture was theaccumulation of large government surpluses of wheat and rice during thelate 1990s. For both wheat and rice, the stock accumulation was caused bythe combination of rising procurement, as higher MSPs were defended withincreased government purchases, and flat or declining subsidized distribu-tion, as the shift from PDS to TPDS led to less distribution from govern-ment stocks (table 2). Despite rising exports, including subsidized exports,government stocks rose to record levels during 1996/97-2001/02, far inexcess of the levels targeted as necessary for food-security purposes.
Since 2001/02, both wheat and rice stocks have been declining and havegenerally been more closely aligned with the food-security targets of about15.8 million tons (4 million tons of wheat and 11.8 million of rice) as ofApril 1. The decline in stocks has been associated with declining (in thecase of wheat) or flat (in the case of rice) procurement because of lower realMSPs and poor weather, together with a recovery and rise in subsidizeddistribution. By 2002/03, domestic distribution rose to record levels due tolarge increases in both the TPDS and an array of school lunch, food-for-work, and other welfare programs (fig. 9). In 2005/06 (July/June), the StateTrading Corporation (STC) contracted to import about 500,000 tons ofwheat for delivery during 2005/06 as buffer stocks fell below target. Inresponse to rising domestic wheat prices, the Government reduced the tariffapplicable to wheat imports by private traders from 50 percent to 5.2
15Indian Wheat and Rice Sector Policies and the Implications of Reform / ERR-41
Economic Research Service/USDA
Table 2
Government wheat and rice operations in India
Commodity/years Domestic EndingApril/Marc) Procurement distribution Imports Exports stocks
Million tonsWheat:1995/96 12.33 12.72 0.00 0.10 7.761996/97 8.18 12.88 1.35 0.38 3.241997/98 9.30 7.76 1.63 0.00 5.081998/99 12.65 8.90 2.10 0.00 9.661999/00 14.14 10.63 1.27 0.00 13.191900/01 16.36 6.32 0.34 1.47 21.502001/02 20.63 13.25 0.00 2.74 26.042002/03 19.06 15.50 0.00 4.85 20.112003/04 15.80 17.59 0.00 5.65 7.152004/05 16.79 15.93 0.00 2.12 5.46
Rice:1995/96 10.03 12.51 0.00 1.49 13.061996/97 12.56 12.39 0.00 0.05 13.171997/98 16.23 11.36 0.00 0.00 13.051998/99 12.29 11.83 0.00 0.00 12.161999/00 17.45 12.71 0.00 0.00 15.722000/01 18.93 10.40 0.00 0.02 23.192001/02 20.29 13.37 0.00 1.92 24.912002/03 19.00 17.92 0.00 6.94 17.202003/04 20.78 21.95 0.00 3.09 13.102004/05 19.79 22.89 0.00 0.09 13.30
Sources: Ministry of Consumer Affairs, Food, and Public Distribution, GOI; Commission onAgricultural Costs and Prices, Ministry of Agriculture, GOI; USDA PS&D database.

percent in June 2006 and then to zero in September. An additional 5-6million tons of imports have been contracted for delivery during 2006/07,including about 1 million tons by private traders.
Government policies since the mid-1990s have led to higher costs forgovernment wheat and rice operations (fig. 10). Initially, rising costs weredriven by the need to defend high MSPs resulting in large procurement andstorage costs, and the need to dispose of excess stocks through subsidizedexports. More recently, although MSPs have declined gradually in real termsand stocks have fallen, costs have remained high because of record levels ofdistribution through the more highly subsidized BPL channel of the TPDSand various welfare programs. The cost of wheat and rice operationsreached about Rs269 billion ($6 billion) in 2004/05.
16Indian Wheat and Rice Sector Policies and the Implications of Reform / ERR-41
Economic Research Service/USDA
Figure 9
Domestic wheat and rice distribution by program in India (April/March years)
Sources: Government of India, Ministry of Consumer Affairs, Food, and PublicDistribution; Government of India, Ministry of Agriculture, Commission on Agricultural Costs and Prices; USDA, Production, Supply, and Distribution database.
Billion 1993/94 rupees
Public distribution systemTargeted public distribution systemOther welfare programsOpen market sales
1990/91 92/93 94/95 96/97 98/99 2000/01 02/03 04/050
10
20
30
40
50
Figure 10
India wheat and rice consumption and food subsidy
Sources: Government of India, Ministry of Consumer Affairs, Food, and PublicDistribution; USDA, Production, Supply, and Distribution database.
Per capita consumption (kilograms)
Food subsidy(right axis)
1990/91 92/93 94/95 96/97 98/99 2000/01 02/03 04/05125
130
135
140
145
150
155
160
0
50
100
150
200
250
300
350
Food subsidy (billion rupees)
Wheat & rice consumption (left axis)

Wheat and Rice Sector Reform OptionsIndian policymakers are considering a range of policy options to strengthenthe performance of the wheat and rice sectors and control budgetary costs.The introduction of the targeted public distribution system (TPDS) in themid-1990s, as well as the recent trend toward smaller increases in minimumsupport prices (MSPs) for wheat and rice, have been aimed at reducing thegovernment stock surplus, better targeting of food subsidies to the poor, andcorrecting price distortions. However, subsidy costs remain high and foodgrain policies are essentially the same as during the Green Revolutionperiod, when more extensive government intervention was justified byconcern with large cereal deficits, the need to protect poor consumers, andthe need to promote the adoption of new technology by producers.
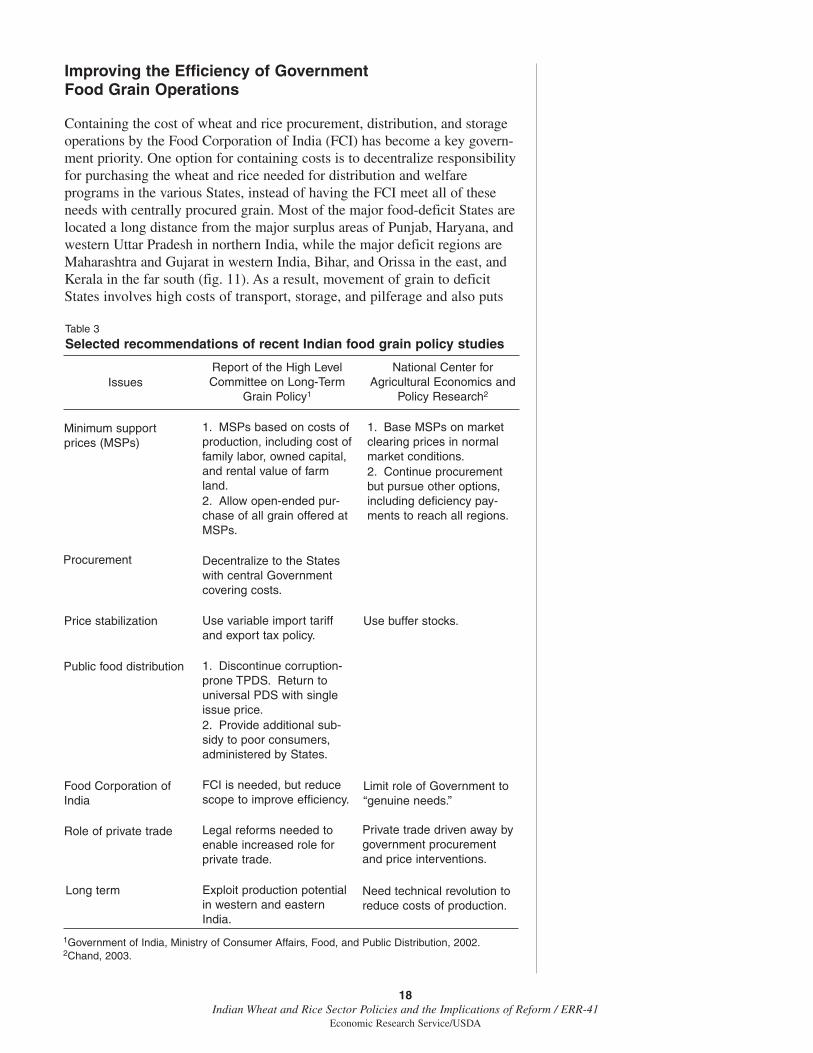
There is growing recognition that the policy framework that may haveserved India well in the past must be reformed to be consistent withchanging consumer demand and an increasingly market-oriented economy,to more efficiently meet the needs of low-income consumers, and to providean environment for stronger public and private investment in the farm sector.India’s 10th Five Year Plan, the Government’s current official planningdocument, identifies a number of food-policy issues, including MSP reform,decentralization of the PDS, and the introduction of food stamps as policygoals (Government of India, Planning Commission, 2002). Recent studieshave also made the case for changes in food grain policy (Government ofIndia, Ministry of Consumer Affairs, Food, and Public Distribution, 2002;Chand, 2003), but it has proven difficult to achieve consensus on reform andit is unclear which reforms will eventually be implemented (table 3).
In this section, we describe and analyze several of the major policy optionsavailable to the Indian Government, specifically: (1) the ongoing process ofdecentralizing government procurement and distribution by making the Statesresponsible for grain purchasing and distribution, (2) the implications ofreducing wheat and rice MSPs, and (3) the possible implications of shifting toa U.S.-style producer deficiency-payment program as a means of providingproducer support. These policy scenarios are analyzed using a spatial modelof India’s wheat and rice sectors that accounts for differences in supply,demand, and prices across India’s various States, as well as the logistical costsinvolved in transport, handling, and storage across the States. The analyticalframework is described in appendix 1, along with model data and elasticities.More detailed results are reported in Jha and Srinivasan (2006).
Some issues faced by policymakers and noted in studies of India’s wheatand rice policy, particularly alternative approaches to assuring domesticprice stability and the efficient distribution of food, were not analyzed forthis study (table 3). Approaches to price stability were examined in anearlier study using a different analytical framework (Jha and Srinivasan,1999). The results of that study indicated that buffer stocks are a relativelyhigh-cost option for achieving a given level of price stability compared withinternational trade, conducted by either the private sector or the Govern-ment, under a system of variable levies. Study of the cost and effectivenessof food distribution under the TPDS awaits the availability of householdsurvey data from the 2004/05 round of India’s National Sample Survey.
17Indian Wheat and Rice Sector Policies and the Implications of Reform / ERR-41
Economic Research Service/USDA
Improving the Efficiency of Government Food Grain Operations
Containing the cost of wheat and rice procurement, distribution, and storageoperations by the Food Corporation of India (FCI) has become a key govern-ment priority. One option for containing costs is to decentralize responsibilityfor purchasing the wheat and rice needed for distribution and welfareprograms in the various States, instead of having the FCI meet all of theseneeds with centrally procured grain. Most of the major food-deficit States arelocated a long distance from the major surplus areas of Punjab, Haryana, andwestern Uttar Pradesh in northern India, while the major deficit regions areMaharashtra and Gujarat in western India, Bihar, and Orissa in the east, andKerala in the far south (fig. 11). As a result, movement of grain to deficitStates involves high costs of transport, storage, and pilferage and also puts
18Indian Wheat and Rice Sector Policies and the Implications of Reform / ERR-41
Economic Research Service/USDA
Table 3
Selected recommendations of recent Indian food grain policy studies
Issues
Minimum supportprices (MSPs)
Report of the High LevelCommittee on Long-Term
Grain Policy1
1. MSPs based on costs ofproduction, including cost offamily labor, owned capital,and rental value of farmland.2. Allow open-ended pur-chase of all grain offered atMSPs.
Decentralize to the Stateswith central Governmentcovering costs.
Use variable import tariffand export tax policy.
1. Discontinue corruption-prone TPDS. Return to universal PDS with singleissue price.2. Provide additional sub-sidy to poor consumers,administered by States.
FCI is needed, but reducescope to improve efficiency.
Legal reforms needed toenable increased role forprivate trade.
Exploit production potentialin western and easternIndia.
National Center forAgricultural Economics and
Policy Research2
1. Base MSPs on marketclearing prices in normalmarket conditions.2. Continue procurementbut pursue other options,including deficiency pay-ments to reach all regions.
Use buffer stocks.
Limit role of Government to“genuine needs.”
Private trade driven away bygovernment procurementand price interventions.
Need technical revolution toreduce costs of production.
Procurement
Price stabilization
Public food distribution
Food Corporation ofIndia
Role of private trade
Long term
1Government of India, Ministry of Consumer Affairs, Food, and Public Distribution, 2002.2Chand, 2003.
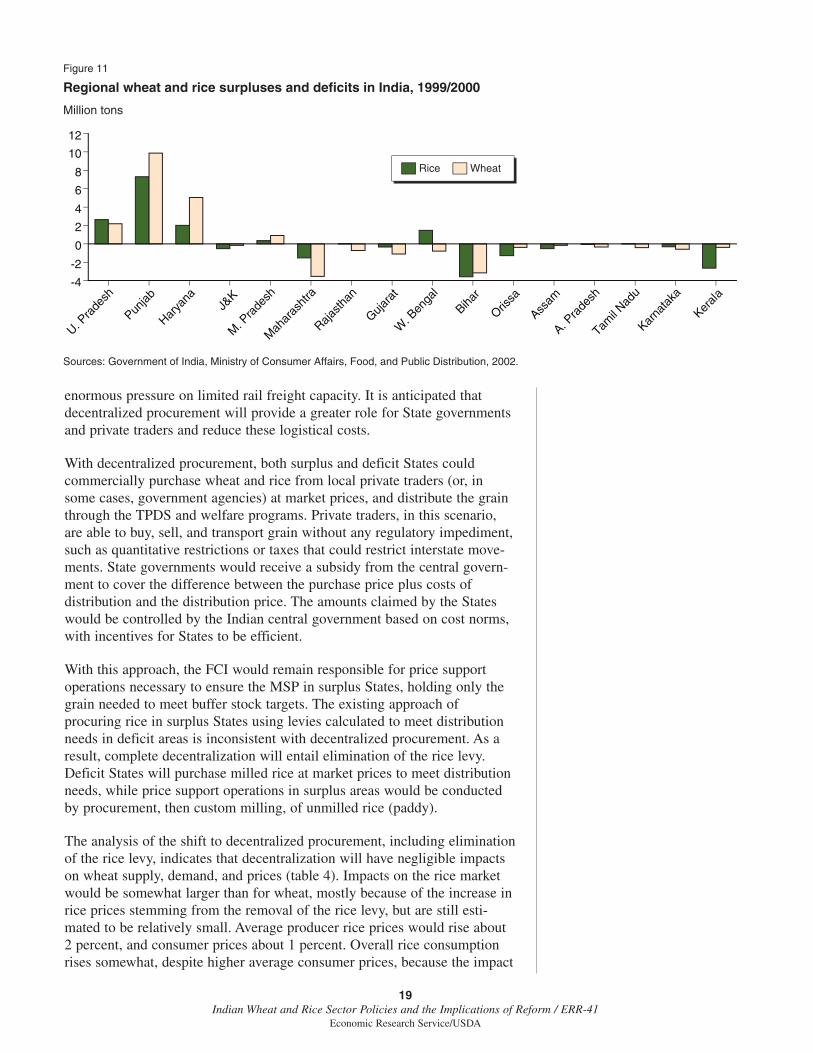
enormous pressure on limited rail freight capacity. It is anticipated thatdecentralized procurement will provide a greater role for State governmentsand private traders and reduce these logistical costs.
With decentralized procurement, both surplus and deficit States couldcommercially purchase wheat and rice from local private traders (or, insome cases, government agencies) at market prices, and distribute the grainthrough the TPDS and welfare programs. Private traders, in this scenario,are able to buy, sell, and transport grain without any regulatory impediment,such as quantitative restrictions or taxes that could restrict interstate move-ments. State governments would receive a subsidy from the central govern-ment to cover the difference between the purchase price plus costs ofdistribution and the distribution price. The amounts claimed by the Stateswould be controlled by the Indian central government based on cost norms,with incentives for States to be efficient.
With this approach, the FCI would remain responsible for price supportoperations necessary to ensure the MSP in surplus States, holding only thegrain needed to meet buffer stock targets. The existing approach ofprocuring rice in surplus States using levies calculated to meet distributionneeds in deficit areas is inconsistent with decentralized procurement. As aresult, complete decentralization will entail elimination of the rice levy.Deficit States will purchase milled rice at market prices to meet distributionneeds, while price support operations in surplus areas would be conductedby procurement, then custom milling, of unmilled rice (paddy).
The analysis of the shift to decentralized procurement, including eliminationof the rice levy, indicates that decentralization will have negligible impactson wheat supply, demand, and prices (table 4). Impacts on the rice marketwould be somewhat larger than for wheat, mostly because of the increase inrice prices stemming from the removal of the rice levy, but are still esti-mated to be relatively small. Average producer rice prices would rise about2 percent, and consumer prices about 1 percent. Overall rice consumptionrises somewhat, despite higher average consumer prices, because the impact
19Indian Wheat and Rice Sector Policies and the Implications of Reform / ERR-41
Economic Research Service/USDA
Figure 11
Regional wheat and rice surpluses and deficits in India, 1999/2000
Sources: Government of India, Ministry of Consumer Affairs, Food, and Public Distribution, 2002.
Million tons
Rice Wheat
U. Pra
desh
Punjab
Harya
naJ&
K
M. P
rade
sh
Mah
aras
htra
Rajasth
an
Gujara
t
W. B
enga
l
Bihar
Orissa
Assam
A. Pra
desh
Tamil N
adu
Karna
taka
Kerala
-4
-2
0
2
4
6
8
10
12

of higher prices and somewhat lower open-market consumption in deficitStates is offset by lower prices and higher consumption in surplus States,together with steady availability of subsidized grain.
The impacts of decentralization on central government operations and costswould be more significant, with about a 29-percent decline in procurement, anend to central grain supply to distribution programs, and somewhat lowergovernment wheat and rice stocks. Government costs would drop more than20 percent, as the increased costs incurred by States in meeting distributionneeds through open-market purchases are offset by lower central procurementand stockholding costs. Given the weak condition of most State governmentfinances, it is likely that the central government would have to compensate theStates for any increase in States’ costs due to decentralization.
20Indian Wheat and Rice Sector Policies and the Implications of Reform / ERR-41
Economic Research Service/USDA
Table 4
Impacts of decentralization of procurement and targeted publicdistribution system (TPDS)1
Total/Variable Wheat Rice average
Percent change
Production 0.0 0.1 0.1Consumption 0.1 0.4 0.3Producer price 0.0 1.9 1.1Consumer price 0.0 0.9 0.5Procurement -15.7 -38.1 -28.9Central TPDS
requirement -100.0 -100.0 -100.0Stocks -0.6 -1.6 -1.1Government costs -12.3 -26.0 -21.2
Net TPDS costs 19.4 75.7 61.2Procurement costs -15.7 -37.4 -29.9Storage costs 0.0 -1.6 -0.8
1Percentage change from before decentralization based on current policy.
Source: Jha and Srinivasan, 2006.
Table 5
Consumption impacts of decentralization of procurement and targetedpublic distribution system1
Population group2 Wheat Rice Total
Percent change
Rural 0.11 0.52 0.33Poor 0.09 0.50 0.33Middle 0.12 0.59 0.37Rich 0.13 0.10 0.11
Urban 0.11 0.33 0.22Poor 0.10 0.47 0.29Middle 0.13 0.22 0.18Rich 0.00 0.41 0.20
1Percentage change from before decentralization based on current policy.2Expenditure classes are based on monthly per capita expenditure classifications from theNational Sample Survey: poor (rupees 0-340/month), middle (rupees 340-775), and rich(rupees 775+)
Source: Jha and Srinivasan, 2006.

The analysis also estimates the impacts of decentralization at the State leveland for rural and urban consumers by income class. Despite some variationby State, the overall impacts of decentralization appear to be positive forrural and urban consumers across income groups (table 5). In India, wherepolicymakers are sensitive to economic policy changes that would particu-larly affect the cost of basic foods and the welfare of low-incomeconsumers, positive impacts across income groups increase the feasibilityand sustainability of a policy change.
The results suggest that the process of decentralization of procurement islikely to have negligible impacts on wheat or rice trade, at least with theexisting tariff structure. However, with States responsible for meeting theirown distribution needs, deficit States in peninsular India with proximity toports may be more likely than the FCI currently is to resort to imports—asopposed to domestic purchases from surplus areas of northern India—in theevent that tariffs are reduced.
Producer Price Policy Reform
The emergence of large food-grain surpluses during the late 1990s waslargely due to the failure of price policy to successfully adapt to a new envi-ronment that included changes in consumer demand, slowed growth in food-grain yields, and more open-border policies. In this context, the “cost ofproduction plus” formula for producer support resulted in minimum supportprices (MSPs) that were out of line with domestic and world market condi-tions, declining consumption, and burgeoning food subsidies.
A recent study of the economywide impacts of increasing the wheat and riceMSPs when they are above market-clearing levels highlights the limitationsof the producer price policies pursued during the late 1990s (Parikh et al.,2003). The study found that boosting wheat and rice MSPs above market-clearing levels leads not only to lower total consumption, but also to loweragricultural investment that ultimately offsets any short-term price-inducedgains in output. With higher MSPs, public investment falls as budget-constrained government expenditure is shifted from investments to currentsubsidies. And, although higher MSPs may boost private investment inwheat and rice production by some households, overall private investment inagriculture falls because many low-income households—which typicallyspend a large share of income on food staples—must shift expenditure frominvestment to consumption. Analysis of distributional impacts found that 80percent of rural consumers and all urban consumers are ultimately worse offwhen MSPs are set above market-clearing levels.
Reform of minimum support price policy. Since 2001, although there hasbeen no explicit change in MSP policy, MSPs for wheat and rice havetrended downward in real terms and relative to most other crops. Since
21Indian Wheat and Rice Sector Policies and the Implications of Reform / ERR-41
Economic Research Service/USDA
2001, in contrast to the late 1990s, wheat and rice MSPs have tended to beset at or very near the cost-based levels recommended by the Commissionon Agricultural Costs and Prices, with little or no change imposed by policymakers.
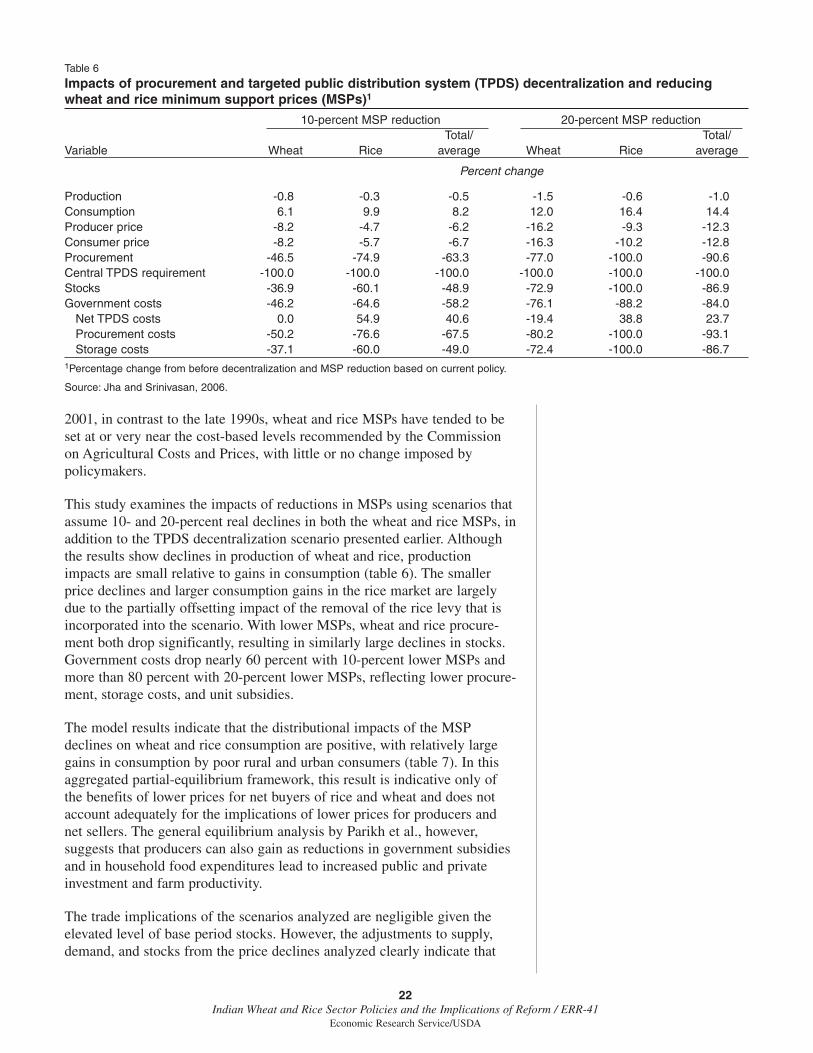
This study examines the impacts of reductions in MSPs using scenarios thatassume 10- and 20-percent real declines in both the wheat and rice MSPs, inaddition to the TPDS decentralization scenario presented earlier. Althoughthe results show declines in production of wheat and rice, productionimpacts are small relative to gains in consumption (table 6). The smallerprice declines and larger consumption gains in the rice market are largelydue to the partially offsetting impact of the removal of the rice levy that isincorporated into the scenario. With lower MSPs, wheat and rice procure-ment both drop significantly, resulting in similarly large declines in stocks.Government costs drop nearly 60 percent with 10-percent lower MSPs andmore than 80 percent with 20-percent lower MSPs, reflecting lower procure-ment, storage costs, and unit subsidies.
The model results indicate that the distributional impacts of the MSPdeclines on wheat and rice consumption are positive, with relatively largegains in consumption by poor rural and urban consumers (table 7). In thisaggregated partial-equilibrium framework, this result is indicative only ofthe benefits of lower prices for net buyers of rice and wheat and does notaccount adequately for the implications of lower prices for producers andnet sellers. The general equilibrium analysis by Parikh et al., however,suggests that producers can also gain as reductions in government subsidiesand in household food expenditures lead to increased public and privateinvestment and farm productivity.
The trade implications of the scenarios analyzed are negligible given theelevated level of base period stocks. However, the adjustments to supply,demand, and stocks from the price declines analyzed clearly indicate that
22Indian Wheat and Rice Sector Policies and the Implications of Reform / ERR-41
Economic Research Service/USDA
Table 6
Impacts of procurement and targeted public distribution system (TPDS) decentralization and reducingwheat and rice minimum support prices (MSPs)1
10-percent MSP reduction 20-percent MSP reductionTotal/ Total/
Variable Wheat Rice average Wheat Rice average
Percent change
Production -0.8 -0.3 -0.5 -1.5 -0.6 -1.0Consumption 6.1 9.9 8.2 12.0 16.4 14.4Producer price -8.2 -4.7 -6.2 -16.2 -9.3 -12.3Consumer price -8.2 -5.7 -6.7 -16.3 -10.2 -12.8Procurement -46.5 -74.9 -63.3 -77.0 -100.0 -90.6Central TPDS requirement -100.0 -100.0 -100.0 -100.0 -100.0 -100.0Stocks -36.9 -60.1 -48.9 -72.9 -100.0 -86.9Government costs -46.2 -64.6 -58.2 -76.1 -88.2 -84.0
Net TPDS costs 0.0 54.9 40.6 -19.4 38.8 23.7Procurement costs -50.2 -76.6 -67.5 -80.2 -100.0 -93.1Storage costs -37.1 -60.0 -49.0 -72.4 -100.0 -86.7
1Percentage change from before decentralization and MSP reduction based on current policy.
Source: Jha and Srinivasan, 2006.

imports become more likely as MSPs decline and reduced procurementlowers stock levels.
Our approach to analyzing the impacts of lower real MSPs does not dealwith the issue of how MSPs are set. MSP reductions are unlikely to stemfrom the cost-based approach currently in use, and would likely require thatrecent domestic and international market price trends be given a largerweight in setting MSPs.
Because of the limitations of the two-commodity, partial equilibrium model(see appendix 1), the impacts of reduced MSPs described here are mostuseful for the short and medium run. The model does not account for cross-commodity developments in supply and demand or changes in inputmarkets and technology that may alter the responsiveness of producers andconsumers to changing prices in the longer term.
Deficiency payments. A deficiency payment system would allow the IndianGovernment to maintain a desired level of support for producers with lessdistortion of market prices and without incurring the costs of procuring,handling, and storing grain. With deficiency payments, farmers wouldreceive a direct government payment covering the difference between themarket price at which they sell their grain and the price level supported bythe Government—such as the MSP.
We analyze the market and government cost impacts of maintaining thesame level of support in the reference scenario (before decentralization orreductions in MSP) by means of farmer deficiency payments instead of bygovernment procurement. Compared with supporting the MSP throughprocurement, the deficiency payment scheme provides consumers withlower prices because all grain remains in the market rather than moving intogovernment stocks after procurement. The analysis indicates that wheat
23Indian Wheat and Rice Sector Policies and the Implications of Reform / ERR-41
Economic Research Service/USDA
Table 7
Consumption impacts of procurement and targeted public distributionsystem decentralization and reducing wheat and rice minimumsupport prices (MSPs)1
10-percent MSP reduction 20-percent MSP reductionPopulation Total/ Total/group2 Wheat Rice average Wheat Rice average
Percent change
Rural 7.5 12.6 10.2 14.7 20.7 17.9Poor 7.9 15.6 12.5 15.3 25.5 21.4Middle 7.3 12.0 9.7 14.4 19.7 17.2Rich 7.7 6.9 7.4 15.5 11.8 13.9
Urban 2.8 6.1 4.5 5.8 10.3 8.1Poor 5.3 8.3 6.8 10.4 13.9 12.2Middle 1.2 5.1 3.2 2.6 8.8 5.8Rich 0.8 1.3 1.0 2.0 2.4 2.2
1Percentage change from before decentralization and MSP reduction based on current policy.2Expenditure classes are based on monthly per capita expenditure classifications from theNational Sample Survey: poor (rupees 0-340/month), middle (rupees 340-775), and rich(rupees 775+).Source: Jha and Srinivasan, 2006.

prices would fall an average of 26 percent, and rice prices about 10 percent.Although some producers (those previously selling above the MSP) wouldexperience somewhat lower returns despite deficiency payments, losses inproducer welfare would be more than offset by large gains in consumerwelfare. Government costs are also estimated to fall sharply—about 60percent below the current system—as the cost of making deficiencypayments to farmers is more than offset by the elimination of governmentprocurement and storage costs.
The deficiency payment would, in theory, allow the Government to supportproducers with lower consumer and budgetary costs and less distortion ofdomestic markets. However, a major impediment to this approach isdevising a mechanism for administering deficiency payments that reachesall producers and is not susceptible to fraud. One possibility would be tobuild on the relatively recent initiative to create a system of verifiable andnegotiable warehouse receipts that is being promoted in some States, in partby India’s rapidly expanding futures markets for farm commodities.
24Indian Wheat and Rice Sector Policies and the Implications of Reform / ERR-41
Economic Research Service/USDA

ConclusionsThe economic environment for India’s food grain sector has changed signifi-cantly since the Green Revolution of the 1960s and 1970s, but policies havenot. Higher incomes are diversifying consumer demand away from staplefood grains. More open borders are increasing linkages between domesticand global markets and prices. And, slowed growth wheat and rice produc-tivity is signaling the need to boost lagging investment in new technologyand improve the performance of input markets.
Government price support, procurement, and distribution policies have, inrecent years, come under increasing criticism because they distort marketsand have high budgetary costs. High minimum support prices for wheat andrice resulted in increased production and procurement of these crops, withthe income transfers accruing to large farmers in surplus States. Coupledwith subsidies on fertilizers, power, and irrigation, wheat and rice price poli-cies have had a detrimental effect on the production of other crops, as wellas on soil and water resources in major producing areas. Price and procure-ment policies have had adverse impacts on consumers—particularly lowerincome consumers—by raising prices and restricting open market suppliesof wheat and rice. And, perhaps more importantly in the long run, Govern-ment policy interventions in the market have contributed to weakeninginvestment in agricultural production technology, as well as underminingincentives for private investment to improve the efficiency of input andoutput markets.
Concern with the recent performance of the wheat and rice sectors has ledto increased recognition of the need for reform, and considerable publicdebate. Although there has been no consensus on major reforms, the IndianGovernment has taken steps to improve the performance of the distributionsystem in reaching target groups and increasing the efficiency of public foodgrain operations through decentralization. In addition, although there hasbeen no explicit change in price support policy, wheat and rice supportprices announced since 1999/2000 have been declining in real terms.
Analysis of the potential impacts of decentralization of the procurement anddistribution system by making State governments responsible for procure-ment indicates that the overall impacts on supply, demand, prices, and tradewill be small. At the same time, this approach can lead to substantial budg-etary savings by reducing procurement and public stockholding to meetpublic distribution needs, and also allow further scope for efficient privatetraders to participate in grain marketing.
Changes in India’s price support policy that reduce minimum support prices(MSPs) for wheat and rice would have more significant impacts on domesticsupply and demand, and on the costs of government food grain operations,than decentralization. This analysis also shows declines in domestic openmarket prices as a result of a reduction in wheat and rice MSPs. Althoughproduction and producer welfare decline, the results show that these lossesare offset by larger gains in consumption and consumer welfare, particularlyamong lower income consumers. Lower procurement costs and stocks alsolead to sharp declines in budgetary costs. Although trade impacts are minorin the scenario analyzed, the reduction in domestic market prices associated
25Indian Wheat and Rice Sector Policies and the Implications of Reform / ERR-41
Economic Research Service/USDA

with this scenario increases the competitiveness of Indian exports in years ofsurplus, while the recovery in consumption and lower stocks increase thepotential for imports in years of deficit.
Introduction of a deficiency payment program, while presenting administra-tive problems, would provide a means of maintaining a desired level ofsupport for wheat and rice producers with less market distortion and lowerbudgetary costs than the current system of physical procurement and distri-bution. Analysis of this option indicates that it could sharply reduce thebudgetary cost of maintaining producer support while also allowing open-market prices to fall and consumption to rise.
The policy options available to the Indian Government to improve perform-ance and reduce distortions in the wheat and rice sectors analyzed hereshould be able to deliver cost savings and improved overall welfare. At leastin the near and medium term, for which the analytical framework used inthis study is most suited, they also appear likely to deliver higher levels ofconsumption, lower stocks, and an increased potential for imports in yearsof poor harvests, as well as competitive exports in years of surplus. Furtheranalysis is required to assess the longer term impacts on India’s markets ifreduced public spending on food grain operations is translated into produc-tive public investment, and if improved incentives for private investmentenhance the performance of input and output markets.
26Indian Wheat and Rice Sector Policies and the Implications of Reform / ERR-41
Economic Research Service/USDA
ReferencesAcharya, S.S. 2001. Domestic Agricultural Marketing Policies, Incentives
and Integration, in: S.S. Acharya and D.P. Chaudhri (eds.), IndianAgricultural Policy at the Crossroads: Priorities and Agenda, RawatPublications, New Delhi.
Bansil, P.C. 1992. Agricultural Statistical Compendium, Vol. I. TechnoEconomic Research Institute, New Delhi, February.
Bhalla, G.S., P. Hazel,and J. Kerr. 1999. Prospects for India’s Cereal Supplyand Demand to 2020. Food, Agriculture, and the Environment DiscussionPaper 29. International Food Policy Research Institute. November, 34 p.http://www.ifpri.org/2020/dp/dp29.pdf
Chand, Ramesh. 2005. India’s National Agricultural Policy: A Critique, in:R. Chand (ed.), India’s Agricultural Challenges: Reflections on Policy,Technology, and Other Issues, Centre for Trade and Development, NewDelhi.
Chand, Ramesh. 2003. Government Intervention in Food Grain Markets inthe New Context. Policy Paper 19. National Centre for AgriculturalEconomics and Policy Research (NCAP), Indian Council of AgriculturalResearch, New Delhi, March.
Food and Agriculture Organization. 2006. FAOSTAT database.
Government of India, Directorate of Census Operations.http://www.mp.nic.in/des/census2001/STAT~1~1.xls
Government of India, Ministry of Agriculture, Directorate of Economics andStatistics, 1975-2000. Agricultural Prices in India (various issues).
Government of India, Ministry of Agriculture. 2000-2004. Reports of theCommission on Agricultural Costs and Prices (various issues).
Government of India, Ministry of Agriculture. 2003. Agricultural Statisticsat a Glance.
Government of India, Ministry of Consumer Affairs, Food, and PublicDistribution. 2002-2005. Monthly Food Grain Bulletin (various issues).
Government of India, Ministry of Consumer Affairs, Food, and PublicDistribution. 1996-1997. Bulletin of Food Statistics (various issues).
Government of India, Ministry of Consumer Affairs, Food, and PublicDistribution. 2002. Report of the High Level Committee on Long-TermGrain Policy, July.
Government of India, Ministry of Finance. 1990/91-2005/06. EconomicSurvey (various issues).
Government of India, Ministry of Statistics and Programme Implementation,National Sample Survey Organization. 1999-2000. Level and Pattern ofConsumer Expenditure in India and Household Consumption in India,NSS 55th Round.
27Indian Wheat and Rice Sector Policies and the Implications of Reform / ERR-41
Economic Research Service/USDA
Government of India, Ministry of Statistics and Programme Implementation,Central Statistical Organization. 2000-2005. Statistical Pocket Book (various issues).
Government of India, Planning Commission. 2002. 10th Five Year Plan(2002-07).
Gulati, Ashok, and S. Narayanan. 2003. The Subsidy Syndrome in IndianAgriculture. Oxford University Press, New Delhi, 297 pages.
Gulati, A. and T. Kelly. 1999. Trade Liberalization and Indian Agriculture,Oxford University Press, New Delhi, 296 pages.Indiastat.com (http://www.indiastat.com/).
Jha, Shikha, and P.V. Srinivasan. 2006. India: Reforming Farm SupportPolicies for Grains. PP-052. Indira Gandhi Institute for DevelopmentResearch, Mumbai, India, January. http://www.igidr.ac.in/pub/pdf/PP-052.pdf
Jha, Shikha, and P.V. Srinivasan. 2004. Achieving Food Security in a CostEffective Way: Implications of Domestic Deregulation and Reform UnderLiberalized Trade. MTID Discussion Paper No. 67. International FoodPolicy Research Institute, May. http://www.ifpri.org/divs/mtid/dp/mtidp67.htm.
Jha, Shikha, and P. V. Srinivasan. 1999. Grain Price Stabilization in India:Evaluation of Policy Alternatives. Agricultural Economics 21, pp. 93-108.
Kumar, P. 1998. Food Demand and Supply Projections for India.Agricultural Economics Policy Paper 98-01. Indian Agricultural ResearchInstitute, New Delhi, 141 p.
Landes, R., and A. Gulati. 2004. “Farm Sector Performance and ReformAgenda.” Economic and Political Weekly (Mumbai), August 7-13, 2004,pp. 3611-3619.
Mullen, K., D. Orden, and A. Gulati. 2005. Agricultural Policies in India:Producer Support Estimates, 1985-2002. MTID Discussion Paper No. 82,International Food Policy Research Institute, February.
Murty, K.N. 2001. Inter Regional Variations in Consumption Patterns inSemi-Arid Tropical India: A Demand Systems Approach, DiscussionPaper 01-06, Indian Statistical Institute, Delhi Centre.
Murty, K.N. 1997. Trends in Consumption and Estimates of Income andPrice Elasticities of Demand for Major Crops in Semi-Arid Tropics ofIndia–A Compendium, Socio-Economics and Policy Division ProgressReport 123, ICRISAT, India.
Mythili, G. 2001. “A Note on Acreage Response for Major Crops inSelected States,” Ch. 14 in Accelerating Growth Through Globalizationof Indian Agriculture, K.P. Kalirajan, G. Mythili, and U. Sankar (eds),Macmillan India, New Delhi.
Parikh, K.S., A. Ganesh-Kumar, and G. Darbha. 2003. “Growth and WelfareConsequences of Rise in MSP.” Economic and Political Weekly(Mumbai), March 1, 2003, pp. 891-895.
28Indian Wheat and Rice Sector Policies and the Implications of Reform / ERR-41
Economic Research Service/USDA

Ramaswami, Bharat, and M. Murugkar. 2005. FAQs About the MaharashtraFood Stamps Program. Unpublished paper, Indian Statistical Institute,Delhi, November.
Ramaswami, Bharat. 2002. “Efficiency and Equity of Food MarketInterventions,” Economic and Political Weekly (Mumbai), March 23,2002, pp 1129-1135.
Rao, V.M., and P. D. Jeromi. 2006. “Modernizing Indian Agriculture: AReview of Critical Policy Issues,” in Indian Economy SinceIndependence, 17th edition, Uma Kapila (ed.), Academic Foundation,New Delhi, pp. 263-350.
RWC-CIMMYT. 2003. Addressing Resource Conservation Issues in Rice-Wheat Systems of South Asia: A Resource Book. Rice-Wheat Consortiumfor the Indo-Gangetic Plains. International Maize and WheatImprovement Center. New Delhi, India. 305 p.
U.S. Department of Agriculture. 2006. USDA Production, Supply, andDistribution database.
29Indian Wheat and Rice Sector Policies and the Implications of Reform / ERR-41
Economic Research Service/USDA
The wide variation in regional agricultural production and consumptionpatterns in India suggests that a spatial equilibrium model is an appropriatetool for analyzing the welfare impacts of domestic reforms. A multiregional,partial-equilibrium model of the wheat and rice sectors is used to analyzethe impact of selected alternative farm support programs for rice and wheatmarkets in India. The spatial trade equilibrium model covers 18 major States(regions) that account for 99 percent of total production of these grains.Demand and supply functions for rice and wheat are specified for each Statebased on elasticity estimates available from the existing literature. Thesefunctions are calibrated for the base year 2000-01 using data on all exoge-nous and endogenous variables. In the model, regional demands andsupplies of rice and wheat interact with each other through their substitutionpossibilities, both in consumption and in production. Equilibrium prices andother variables are obtained as a solution to the commodity balance equa-tions subject to the constraints imposed due to government interventions.2
The two-commodity model described and used here has both strengthsand weaknesses for this analysis. A key strength is that, by focusing onlyon the two crops (rice and wheat) that are most important for the policyissues being examined, the model remains relatively small, simple, andeasy to interpret and understand. Rice and wheat are India’s dominantfood commodities in both production and consumption, and they accountfor nearly all government expenditure on procurement, distribution, andstorage. Interactions with other crops are unlikely to have a major impact on model results in the short- or medium term. Focusing on rice andwheat also plays to the strengths of available data and research on supplyand demand elasticities, and minimizes reliance on the relatively poordata and larger number of assumptions necessary to expand the model toother commodities.
Model Limitations
While this two-commodity is useful in evaluating short- and medium-termimplications of the scenarios analyzed, it has more limited value in under-standing the longer term implications of the policy options studied. In thelonger term, changes in consumer preferences and the prices of other foodand nonfood items can be expected to play a larger role in shaping riceand wheat demand. In addition, longer term supply developments arelikely to be shaped more significantly by the prices of competing crops, aswell as technical trends and developments in water, fertilizer and otherinput markets that are not accounted for. For more in depth analysis oflonger term implications, a more detailed, multi-commodity frameworkmay be needed.
A further limitation of the model, relevant primarily for the analysis ofminimum support price (MSP) reductions, is that it does not account for theimpacts on production associated with increased producer price risk. LowerMSPs would expose producers to more price risk that could potentially
30Indian Wheat and Rice Sector Policies and the Implications of Reform / ERR-41
Economic Research Service/USDA
Appendix 1—Spatial Model of India’s Wheat and Rice Sectors1 1 Model specification, data, calibra-
tion of parameters, and results arereported in more detail in Jha andSrinivasan (2006) at http://www.igidr.ac.in/pub/pdf/PP-052.pdf and Jha andSrinivasan (2004) at http://www.ifpri.org/divs/mtid/dp/mtidp67.htm.
2 Computation of equilibriumprices is formulated as a mixed com-plementarity problem (MCP). Themarket equilibrium that satisfies thecommodity balance equations and theset of inequalities depicting govern-ment interventions is obtained as asolution to the MCP using PATHsolver in generalized algebraic model-ling systems (GAMS) software.
affect planting and input use decisions, indicating that the model will tend tounderestimate declines in production associated with lower MSPs. However,since the scenarios analyzed only reduce rather than eliminate the MSPs, itis not clear how significant the impacts are on model results.
Demand and Supply Functions
The total population is divided into six income groups—three for rural areas(rural poor, rural middle class, rural rich) and three for urban areas (urbanpoor, urban middle class, and urban rich)—with demand functions specifiedfor each group. Aggregate demand in each State is obtained as the sum ofgroup demands weighted by the population of each group. Linear demandfunctions are used to incorporate the effects of own price, cross price andincome. For each region i, the open market demand function for each cate-gory of consumers is specified as:
Di = αi + βi pri + γi qri + λi yi (1)
where
pri = Own retail price
qri = Retail price of the other crop
yi = Per capita income
The supply function is also assumed linear. It depends on the weightedaverage of market and procurement prices received by the farmers.3
Si = ai + bi wapi + ci qfi (2)
where
Si = Production
wap i = {λ pfi + (1 – λ) lvpi} = weighted average of procurement andmarket prices
pfi = Farm harvest price
lvp = Levy price (MSP in case of wheat and levy procurement pricein case of rice)
qfi = Weighted average farm harvest price of substitute crop
Interstate Trade
Aggregate regional imports are defined as the difference between freemarket demand, i.e., total consumption net of consumption through govern-ment distribution programs, and free market supply, i.e., production net ofprocurement. In addition to transport costs, private traders incur other trans-action costs that manifest in the form of policy induced market restrictions,infrastructure bottlenecks, other trade obstacles etc. These transaction costsare modeled as implicit tariffs on interstate trade. In the absence of suchtransaction costs, spatial arbitrage possibilities are determined by transportcosts alone.
31Indian Wheat and Rice Sector Policies and the Implications of Reform / ERR-41
Economic Research Service/USDA
3 Depending on the production pat-terns in different States, rice and wheatare substitutes in production in onlysome States. However, from the avail-able literature we could not find sig-nificant cross price elasticity estimatesand had to drop this variable from thesupply equations for all States.
Trade from Region i to Region j is determined by the following complemen-tarity (no spatial arbitrage) condition
Tij ≥ 0 ⊥ [pi + tcij+ tm] ≥ pj (3b)
where
Tij = Trade from Region i to Region j
tcij = the transportation cost from State i to State j
pi = wholesale price
tm = traders’ margins.
With the above complementarity condition, trade will not take place (Tij = 0)so long as the sum of purchase cost in State i, cost of transporting grains toState j, and the traders’ margin inflated by the implicit tariff exceeds thereturns, the open market price in State j, i.e., (pi + tcij+ tm) > pj. Trade takesplace so long as the reverse inequality holds. Perfectly competitive marketsimply that trade from State i to j will continue to grow until all the arbitragebenefits are exhausted and total cost equals the open market price in the desti-nation State. Thus, Tij > 0 implies that (pi + tcij+ tm) = pj. Transport costs areassumed to be exogenous (constant average unit costs).
Foreign Trade
External trade is modeled by treating the rest of the world as another regionwith which individual States can directly trade by incurring the additionalcosts of transport from the nearest/ cheapest port. Given that the world ricemarket is thin, we make the large country assumption. Imports, e.g., wouldtend to become costlier as the magnitude of imports goes up. Similarly, theprice received for exports would decline as quantity traded goes down.
Exports take place so long as the price received remains higher than the costof purchasing the grains plus transport cost from the State center to the port.Imports take place if it is cheaper to import than to buy in the domesticlocal market. Exports/imports are therefore obtained from the followingcomplementarity conditions
xi,ROW ≥ 0 ⊥ [pi + tci,ROW + traders’ margins] ≥ px (4a)
mi,ROW ≥ 0 ⊥ [pm + tci,ROW + traders’ margins] ≥ pi (4b)
where x and m denote exports and imports and px and pm denote theirrespective prices
px = border price – port clearance charges – (ec × x)
Dm = border price + port clearance charges + (ic × m)
where border price is expressed in domestic currency, ic is the import coeffi-cient and ec the export coefficient. The coefficients ic and ec are obtainedfrom their respective price elasticities of exports (imports) with respect toexports (imports), evaluated at the base year values.
32Indian Wheat and Rice Sector Policies and the Implications of Reform / ERR-41
Economic Research Service/USDA
Price Relationships
Equilibrium prices computed in the model are at the wholesale level. However,consumers face the retail price, which enters in the demand equation:
pri = pi * (1 + retail margin) 4 (5)
Farmers receive the farm harvest price pfi, which enters the supply equation:
pfi = pi / (1 + wholesale margin + marketing cost) (6)
The targeted public distribution system (TPDS) sale price in State i for bothrice and wheat is expressed as a fixed percentage lower than the market price:
TPDSPi = ni pi
The procurement, or farm, price is assumed to be the same for all States andit is exogenous. For rice it is the fixed levy price whereas for wheat it is afixed minimum support price (MSP).
Public Intervention
Public distribution: Quantities distributed through the targeted public distri-bution system (TPDS) are fixed exogenously for each State.
Procurement of grains under the MSP: In all scenarios where MSP policy isimplemented by physical procurement of grain, the quantities procured ofboth rice and wheat is determined endogenously based on the complemen-tarity conditions.
procRi ≥ 0 ⊥ pRi ≥ MSPRi
procWi ≥ 0 ⊥ pWi ≥ MSPWi (7)
where procRi and procWi denote quantities procured of rice and wheatrespectively.
The above complementarity conditions imply that quantities procured willbe zero when the open market price is higher than the MSP. Moreover,whenever quantity procured is positive, open market price will equal theMSP. The exception is when rice procurement is by levy, in which case riceprocurement is taken as an exogenously fixed percentage of production,procRi = μi SRi where μI is the levy fraction of output in State i.
Market Equilibrium
The market clearing condition equates net availability to demand in eachState. Since TPDS quantities are exogenously specified, the conditionreduces to equating open market demand with net supply, which caters tothe domestic open market demand. The net grain available for consumptionwithin a State through open market purchase is obtained by subtracting fromproduction the outflows from the State, which consist of net regional
33Indian Wheat and Rice Sector Policies and the Implications of Reform / ERR-41
Economic Research Service/USDA
4 Since we do not have data onretail profit margins, we assume themto be the same percentage as thewholesale margin applied on farm har-vest prices to derive wholesale prices.
imports, government procurement and net foreign exports. Thus the equilib-rium condition for each State i is
Si + (Σj Tij – Σj Tji) – proci – (Ei – Mi) = Di (8)
Markets are cleared by the adjustment of price pi. The level of MSP is suchthat the quantity procured is more than enough to cover the TPDS require-ments. Similarly, the size of the rice levy is such that TPDS needs are met.The difference between the quantity procured and TPDS distribution istaken to be the stocks held by the government.
Welfare Measures
Change in Producer Surplus
PS = Si (wap1 – wap0) + ½ (spe) Si (wap1 – wap0)2 /wap0
where
wap0 = weighted average of procurement and market prices in the base year scenario,
wap1 = weighted average of procurement and market prices in the alternative scenarios.
spe = price elasticity of supply.
Change in Consumer Surplus
CS = - Di (pr1 – pr0) - ½ (dpe) Di (pr1 – pr0)2 /pr0
where
pr0 = own retail base year price,
pr1 = own retail current year price.
Dpe = price elasticity of demand.
Gains to Traders
Apart from consumers and producers, other agents in the economy alsoexperience welfare changes. They include traders who earn profit marginsby trading within State from farm to wholesale market (wholesale traders)and from wholesale to retail market (retail traders) and interstate traders.The surplus of these traders arises from different sources: (1) if productiongoes up, more grain is brought from farm gate to wholesale market andhence increases their surplus; (2) if more grain is traded across States, inter-state traders gain; and (3) if more grain is consumed, then retailers’ surplusgoes up. The entire amount of difference between prices at the two points oftrade does not constitute the income of traders as they incur some costs toprovide services (e.g., finding a buyer and arranging payments, etc). Whole-salers help in the delivery of grain from farm gate to the wholesale markets(within-State transaction) or between wholesale markets in different States.
34Indian Wheat and Rice Sector Policies and the Implications of Reform / ERR-41
Economic Research Service/USDA
Using data on profit margins in trading from farm to wholesale market andfrom wholesale to retail market, we can calculate the gains from trade accruingto traders in each State. The gains from trade are obtained by comparing thesurpluses in different scenarios with surpluses in the base scenario.
Wholesale Traders’ Surplus (From Farm to Wholesale Markets)
To get this surplus, the margin is multiplied with the wholesale price andlocal production net of procurement, net exports abroad and net exports toother States. This captures the margins of wholesalers both from inside andoutside State i.
WTSi = margin * pi * [Si – proci – {Ei – Mi} – {Σj Tij – Σj Tji}]
Retail Traders’ Surplus (From Wholesale to Retail Markets)
The retail traders’ surplus is obtained by applying the margin to the freemarket demand times the retail price.
RTSi = margin × pri × Di
Savings in Government Costs
Total government cost = purchase cost + procurement incidental cost +storage cost + distribution cost
where
Purchase cost = government procurement × MSP in the case of wheat,
Purchase cost = government procurement × levy price in the case of rice,
Procurement incidental cost = government procurement × incidental cost,
Storage cost = (procurement – PDS) × storage cost,
Distribution = TPDS × distribution cost
Sale realization = TPDS × central issue price
Net government cost = total government expenditure – sales realization
Quantity Data
Supply is taken to be production net of seed, feed and wastage. Rice and wheatconsumption is obtained from National Sample Survey data for 1999-2000.TPDS quantities are also taken from the same source and are assumed fixed inthe model. Procurement is carried out under price-support for wheat and as alevy for rice in the base scenario. The base year data satisfy commoditybalances across States by appropriately adjusting for interstate trade (table 1.1).
Total demand is disaggregated into six different income groups (rural poor,rural middle, rural rich, urban poor, urban middle, and urban rich) based onmonthly per capita consumption expenditure data for 1999-2000 (Govern-ment of India, Ministry of Statistics and Programme Implementation,
35Indian Wheat and Rice Sector Policies and the Implications of Reform / ERR-41
Economic Research Service/USDA

National Sample Survey Organization). Data on groupwise per capitaexpenditure is obtained by extrapolating 1993-94 expenditure data to 2000-01 using the consumer price index (Murty, 2001). Estimates of open marketdemand for the six groups are computed based on 1999-2000 State-levelsurvey data on monthly per capita consumption expenditures, rice and wheatconsumption, and purchases of TPDS rice and wheat in rural and urbanareas by expenditure class for individuals and households, together withState population data. The consumption data are summarized in tables 1.2 -1.4.
Price Data
Consumer demand is modeled in terms of retail price, which is obtained byapplying the retail margin to inflate wholesale prices, taken from Chand(2003). The model equilibrium solution is derived in terms of wholesaleprice but, since levy prices and MSPs are fixed in terms of farm-gate prices,these are inflated using wholesale margins to make them comparable towholesale level prices. Adjustments are made using data on margins insurplus States where government procurement occurs. Data on MSPs forwheat and MSPs and levy prices for rice are taken from Government ofIndia sources (table 1.5).
Model Elasticities
Model elasticities are based on the results of recent comprehensive studiesof supply response and food demand. Own price elasticities of supply aretaken from Jha and Srinivasan (1999) and Mythili (2001). The supply elas-ticities are estimated in terms of net production obtained after adjusting forseed, feed and wastage. For wheat, an average all-India elasticity is useddue to nonavailability of State estimates. Cross-price elasticities are not usedin the supply equations because available data shows no substitution inproduction of rice and wheat in major producing States, since these cropsare largely grown in different seasons,.
For demand, own-price and income elasticities of demand for rice andwheat by State, rural and urban groups, and income class are based oncomprehensive estimation work by Murty (1997) using National SampleSurvey data. Cross-price elasticities of demand for rice and wheat are basedon estimations by Gulati and Kelly (1999).
For the purpose of the scenarios analyzed in this study, the results are mostsensitive to the size of the price elasticities of supply and demand thatgovern responses to changes in producer and consumer prices across Statesresulting from decentralization, and over time as MSPs are adjusted.Although alternative studies and methodologies have yielded somewhatdifferent results for price elasticities of rice and wheat supply and demandin India, both supply and demand are consistently found to be inelastic toprice and differences between studies are generally small. Because thedifferences are small, use of alternative available estimates is unlikely tofundamentally change results, although future estimates based on morerecent production data and more recent rounds of the National SampleSurvey would strengthen confidence in the scenario outcomes.
36Indian Wheat and Rice Sector Policies and the Implications of Reform / ERR-41
Economic Research Service/USDA
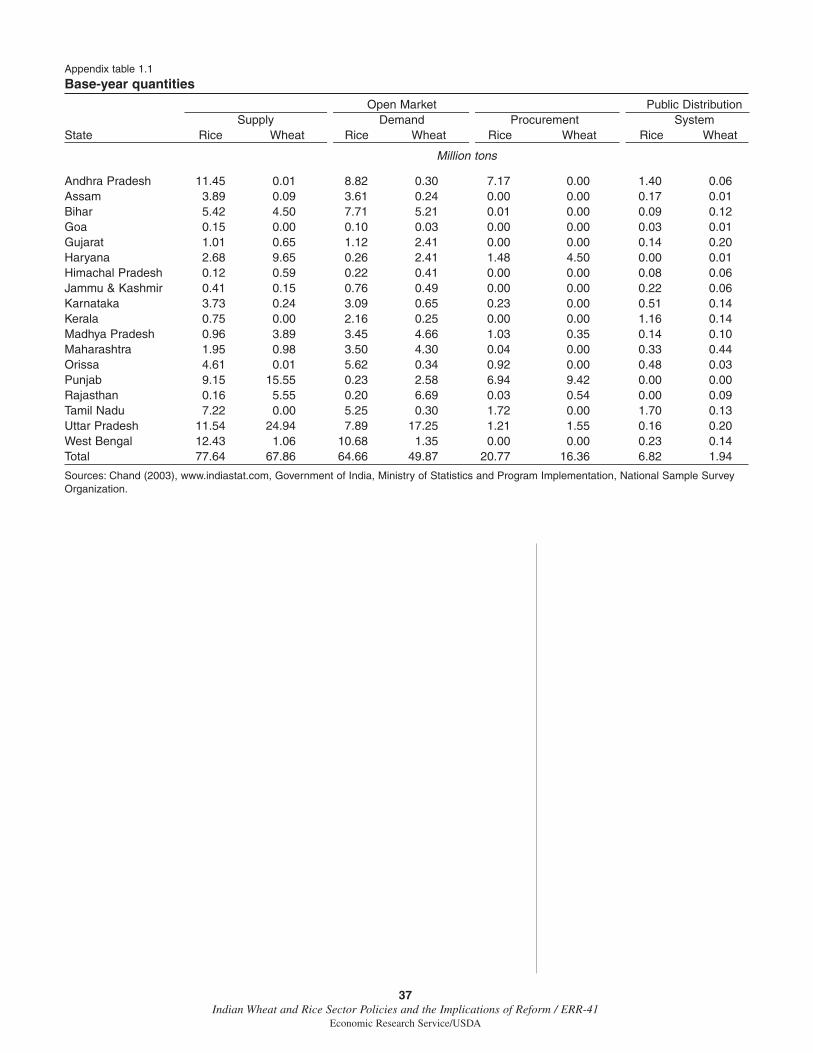
37Indian Wheat and Rice Sector Policies and the Implications of Reform / ERR-41
Economic Research Service/USDA
Appendix table 1.1
Base-year quantities
Open Market Public DistributionSupply Demand Procurement System
State Rice Wheat Rice Wheat Rice Wheat Rice Wheat
Million tons
Andhra Pradesh 11.45 0.01 8.82 0.30 7.17 0.00 1.40 0.06Assam 3.89 0.09 3.61 0.24 0.00 0.00 0.17 0.01Bihar 5.42 4.50 7.71 5.21 0.01 0.00 0.09 0.12Goa 0.15 0.00 0.10 0.03 0.00 0.00 0.03 0.01Gujarat 1.01 0.65 1.12 2.41 0.00 0.00 0.14 0.20Haryana 2.68 9.65 0.26 2.41 1.48 4.50 0.00 0.01Himachal Pradesh 0.12 0.59 0.22 0.41 0.00 0.00 0.08 0.06Jammu & Kashmir 0.41 0.15 0.76 0.49 0.00 0.00 0.22 0.06Karnataka 3.73 0.24 3.09 0.65 0.23 0.00 0.51 0.14Kerala 0.75 0.00 2.16 0.25 0.00 0.00 1.16 0.14Madhya Pradesh 0.96 3.89 3.45 4.66 1.03 0.35 0.14 0.10Maharashtra 1.95 0.98 3.50 4.30 0.04 0.00 0.33 0.44Orissa 4.61 0.01 5.62 0.34 0.92 0.00 0.48 0.03Punjab 9.15 15.55 0.23 2.58 6.94 9.42 0.00 0.00Rajasthan 0.16 5.55 0.20 6.69 0.03 0.54 0.00 0.09Tamil Nadu 7.22 0.00 5.25 0.30 1.72 0.00 1.70 0.13Uttar Pradesh 11.54 24.94 7.89 17.25 1.21 1.55 0.16 0.20West Bengal 12.43 1.06 10.68 1.35 0.00 0.00 0.23 0.14Total 77.64 67.86 64.66 49.87 20.77 16.36 6.82 1.94
Sources: Chand (2003), www.indiastat.com, Government of India, Ministry of Statistics and Program Implementation, National Sample SurveyOrganization.
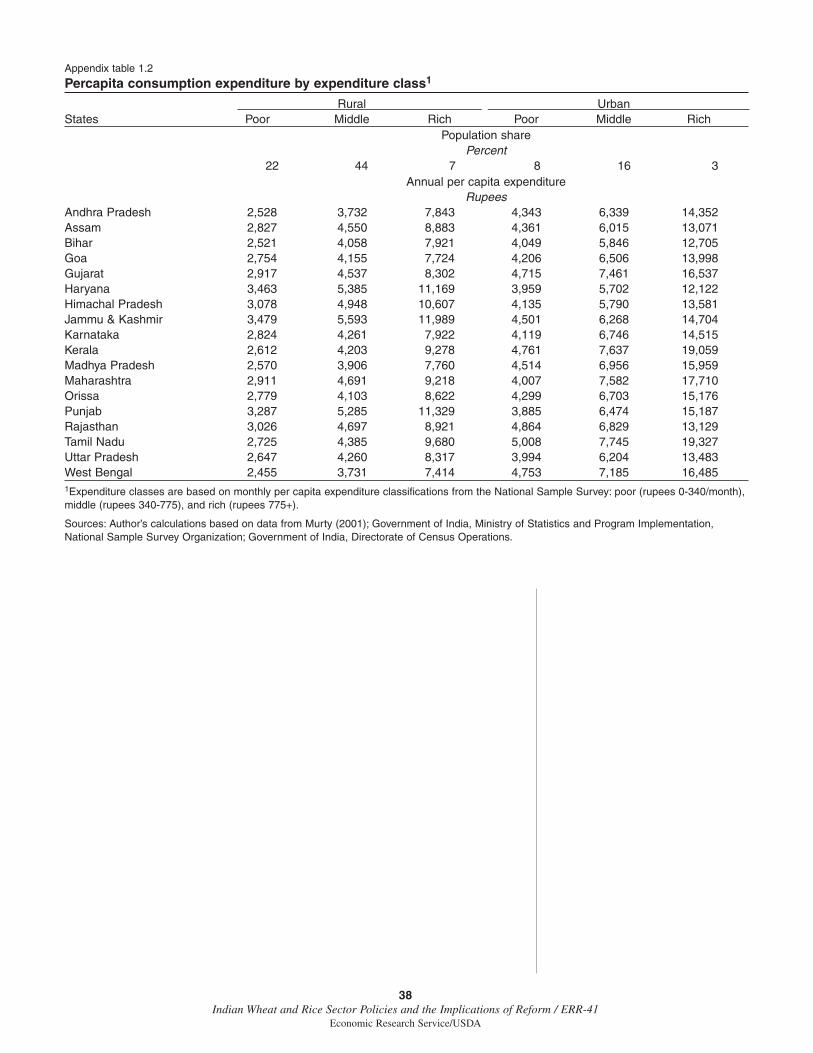
38Indian Wheat and Rice Sector Policies and the Implications of Reform / ERR-41
Economic Research Service/USDA
Appendix table 1.2
Percapita consumption expenditure by expenditure class1
Rural UrbanStates Poor Middle Rich Poor Middle Rich
Population sharePercent
22 44 7 8 16 3Annual per capita expenditure
RupeesAndhra Pradesh 2,528 3,732 7,843 4,343 6,339 14,352Assam 2,827 4,550 8,883 4,361 6,015 13,071Bihar 2,521 4,058 7,921 4,049 5,846 12,705Goa 2,754 4,155 7,724 4,206 6,506 13,998Gujarat 2,917 4,537 8,302 4,715 7,461 16,537Haryana 3,463 5,385 11,169 3,959 5,702 12,122Himachal Pradesh 3,078 4,948 10,607 4,135 5,790 13,581Jammu & Kashmir 3,479 5,593 11,989 4,501 6,268 14,704Karnataka 2,824 4,261 7,922 4,119 6,746 14,515Kerala 2,612 4,203 9,278 4,761 7,637 19,059Madhya Pradesh 2,570 3,906 7,760 4,514 6,956 15,959Maharashtra 2,911 4,691 9,218 4,007 7,582 17,710Orissa 2,779 4,103 8,622 4,299 6,703 15,176Punjab 3,287 5,285 11,329 3,885 6,474 15,187Rajasthan 3,026 4,697 8,921 4,864 6,829 13,129Tamil Nadu 2,725 4,385 9,680 5,008 7,745 19,327Uttar Pradesh 2,647 4,260 8,317 3,994 6,204 13,483West Bengal 2,455 3,731 7,414 4,753 7,185 16,4851Expenditure classes are based on monthly per capita expenditure classifications from the National Sample Survey: poor (rupees 0-340/month),middle (rupees 340-775), and rich (rupees 775+).
Sources: Author’s calculations based on data from Murty (2001); Government of India, Ministry of Statistics and Program Implementation,National Sample Survey Organization; Government of India, Directorate of Census Operations.

39Indian Wheat and Rice Sector Policies and the Implications of Reform / ERR-41
Economic Research Service/USDA
Appendix table 1.3
Rice and wheat consumption by expenditure class1
Rice WheatOpen Open
Expenditure TPDS market Total TPDS market Totalclasses consumption demand demand consumption demand demand
Million tonsRural
Poor 1.27 14.93 16.19 0.32 8.04 8.36Middle 3.27 30.52 33.78 0.87 23.13 24.01Rich 0.93 4.33 5.27 0.23 5.14 5.37All 5.46 49.78 55.24 1.42 36.32 37.74
UrbanPoor 0.28 6.07 6.35 0.11 5.22 5.33Middle 0.87 7.57 8.45 0.33 7.03 7.36Rich 0.2 1.24 1.44 0.08 1.29 1.37All 1.35 14.88 16.23 0.52 13.54 14.06
Total (rural + urban)Poor 1.54 21 22.54 0.43 13.27 13.69
Middle 4.14 38.09 42.23 1.21 30.16 31.37Rich 1.14 5.57 6.71 0.31 6.43 6.74All 6.82 64.66 71.47 1.94 49.87 51.8
1Expenditure classes are based on monthly per capita expenditure classifications from theNational Sample Survey: poor (rupees 0-340/month), middle (rupees 340-775), and rich(rupees 775+).Sources: Author’s calculations based on data from Murty (2001); Government of India, Ministryof Statistics and Program Implementation, National Sample Survey Organization; Governmentof India, Directorate of Census Operations.
Appendix table 1.4
Rural and urban open market demand by State
Rice WheatStates Rural Urban Total Rural Urban Total
Million tons
Andhra Pradesh 6.61 2.22 8.82 0.14 0.16 0.30Assam 3.18 0.43 3.61 0.19 0.05 0.24Bihar 7.02 0.68 7.71 4.58 0.62 5.21Goa 0.06 0.04 0.10 0.01 0.02 0.03Gujarat 0.69 0.43 1.12 1.22 1.20 2.41Haryana 0.18 0.09 0.26 1.81 0.60 2.41Himachal Pradesh 0.20 0.02 0.22 0.37 0.04 0.41Jammu & Kashmir 0.60 0.16 0.76 0.40 0.10 0.49Karnataka 1.86 1.23 3.09 0.33 0.32 0.65Kerala 1.63 0.53 2.16 0.17 0.08 0.25Madhya Pradesh 2.80 0.65 3.45 3.24 1.42 4.66Maharashtra 1.88 1.62 3.50 2.01 2.29 4.30Orissa 4.86 0.76 5.62 0.21 0.13 0.34Punjab 0.13 0.10 0.23 1.86 0.72 2.58Rajasthan 0.12 0.08 0.20 5.03 1.66 6.69Tamil Nadu 2.81 2.44 5.25 0.08 0.22 0.30Uttar Pradesh 6.72 1.17 7.89 14.01 3.24 17.25West Bengal 8.45 2.23 10.68 0.66 0.69 1.35Total 49.78 14.88 64.66 36.32 13.54 49.87
Sources: Author’s calculations based on data from Murty (2001); Government of India, Ministryof Statistics and Program Implementation, National Sample Survey Organization; Governmentof India, Directorate of Census Operations.

40Indian Wheat and Rice Sector Policies and the Implications of Reform / ERR-41
Economic Research Service/USDA
Appendix table 1.5
Base-year prices
Rice levyRetail price Wholesale price farm gate
State Rice Wheat Rice Wheat price
Rupees per 100 kiliograms
Andhra Pradesh 1,477 1,146 1,291 1,002 900Assam 1,554 1,216 1,328 1,038 846Bihar 1,378 1,108 1,247 957 861Goa 1,465 1,261 1,305 1,016 831Gujarat 1,418 1,062 1,152 863 827Haryana 1,218 876 1,028 739 904Himachal Pradesh 1,310 876 1,105 739 904Jammu & Kashmir 1,442 1,098 1,216 927 904Karnataka 1,368 1,058 1,277 988 830Kerala 1,459 1,138 1,317 1,027 830Madhya Pradesh 1,261 960 1,158 868 840Maharashtra 1,372 1,157 1,222 932 831Orissa 1,292 978 1,192 902 869Punjab 1,218 876 1,028 739 904Rajasthan 1,248 840 1,097 1,016 881Tamil Nadu 1,515 1,114 1,305 752 830Uttar Pradesh 1,176 852 1,028 988 869West Bengal 1,100 1,040 1,028 791 827
Sources: Chand (2003); http://www.indiastat.com/; and Government of India, Ministry of ConsumerAffairs, Food, and Public Distribution, Bulletin of Food Statistics.
Appendix table 1.6
Price elasticities of demand for rice by expenditure class1
Own price elasticities of demand Cross priceRural Urban elasticities
States Poor Middle Rich Poor Middle Rich (rice/wheat)
Andhra Pradesh -2.22 -1.77 -1.15 -1.32 -0.87 -0.26 0.045Assam -2.25 -1.79 -1.18 -1.35 -0.90 -0.28 0.044Bihar -2.25 -1.79 -1.18 -1.35 -0.90 -0.28 0.044Goa -2.84 -2.39 -1.77 -1.94 -1.49 -0.87 0.046Gujarat -1.07 -0.62 0.00 -0.17 -0.28 0.90 0.046Haryana -2.21 -1.75 -1.14 -1.31 -0.86 -0.24 0.045Himachal Pradesh -1.92 -1.47 -0.85 -1.02 -0.57 0.05 0.046Jammu & Kashmir -1.92 -1.47 -0.85 -1.02 -0.57 0.05 0.046Karnataka -2.84 -2.39 -1.77 -1.94 -1.49 -0.87 0.047Kerala -2.27 -1.82 -1.20 -1.37 -0.92 -0.30 0.045Madhya Pradesh -2.59 -2.14 -1.52 -1.69 -1.24 -0.62 0.047Maharashtra -2.29 -1.84 -1.22 -1.39 -0.94 -0.33 0.045Orissa -2.22 -1.77 -1.15 -1.32 -0.90 -0.26 0.045Punjab -1.92 -1.47 -0.85 -1.02 -0.57 0.05 0.046Rajasthan -1.87 -1.42 -0.80 -0.97 -0.52 0.10 0.044Tamil Nadu -2.27 -1.82 -1.20 -1.37 -0.92 -0.30 0.047Uttar Pradesh -2.25 -1.79 -1.18 -1.35 -0.90 -0.28 0.044West Bengal -2.59 -2.14 -1.52 -1.69 -1.24 -0.62 0.0451Expenditure classes are based on monthly per capita expenditure classifications from the National Sample Survey: poor (rupees 0-340/month), middle (rupees 340-775), and rich (rupees 775+).Sources: Murty, 1997; and Gulati and Kelly, 1999.

41Indian Wheat and Rice Sector Policies and the Implications of Reform / ERR-41
Economic Research Service/USDA
Appendix table 1.7
Price elasticities of demand for wheat by expenditure class1
Own price elasticities of demand Cross priceRural Urban elasticities
States Poor Middle Rich Poor Middle Rich (wheat/rice)
Andhra Pradesh -2.43 -2.15 -1.99 -1.17 -0.88 -0.72 0.101Assam -1.06 -0.78 -0.62 -0.20 0.48 0.64 0.100Bihar -1.06 -0.78 -0.62 -0.20 0.48 0.64 0.100Goa -1.93 -1.65 -1.48 -0.66 -0.38 -0.22 0.102Gujarat -2.47 -2.19 -2.03 -1.20 -0.92 -0.76 0.103Haryana -1.55 -1.27 -1.11 -0.28 0 0.16 0.101Himachal Pradesh -1.70 -1.42 -1.25 -1.02 -0.15 0.01 0.102Jammu & Kashmir -1.70 -1.42 -1.25 -1.02 -0.15 0.01 0.102Karnataka -1.93 -1.65 -1.48 -1.94 -0.38 -0.22 0.102Kerala -2.14 -1.86 -1.70 -1.37 -0.59 -0.43 0.104Madhya Pradesh -1.69 -1.41 -1.25 -0.43 -0.14 0.02 0.101Maharashtra -2.52 -2.24 -2.08 -1.26 -0.98 -0.82 0.103Orissa -2.43 -2.15 -1.70 -1.17 -0.88 -0.72 0.101Punjab -1.70 -1.42 -1.25 -0.43 -0.15 0.01 0.102Rajasthan -1.27 -0.99 -0.83 -0.01 0.28 0.44 0.100Tamil Nadu -2.14 -1.86 -1.70 -0.88 -0.59 -0.43 0.104Uttar Pradesh -1.06 -0.78 -0.62 -1.35 0.48 0.64 0.100West Bengal -1.69 -1.41 -1.25 -0.43 -0.14 0.02 0.1011Expenditure classes are based on monthly per capita expenditure classifications from the National Sample Survey: poor (rupees 0-340/month),middle (rupees 340-775), and rich (rupees 775+).
Sources: Murty, 1997; and Gulati and Kelly, 1999.
Appendix table 1.8
Income elasticities of demand for rice by expenditure class1
Rural UrbanState Poor Middle Rich Poor Middle Rich
Andhra Pradesh 1.34 0.77 0.34 1.23 0.66 0.23Assam 1.23 0.66 0.23 1.12 0.55 0.12Bihar 1.23 0.66 0.23 1.12 0.55 0.12Goa 1.54 0.98 0.55 1.43 0.87 0.44Gujarat 1.26 0.69 0.26 1.15 0.58 0.15Haryana 1.35 0.79 0.36 1.24 0.68 0.25Himachal Pradesh 1.40 0.83 0.40 1.29 0.72 0.29Jammu & Kashmir 1.40 0.83 0.40 1.29 0.72 0.29Karnataka 1.54 0.98 0.55 1.43 0.87 0.44Kerala 1.20 0.64 0.21 1.09 0.53 0.10Madhya Pradesh 1.05 0.49 0.06 0.94 0.38 -0.05Maharashtra 1.35 0.79 0.36 1.24 0.68 0.25Orissa 1.34 0.77 0.34 1.23 0.66 0.23Punjab 1.40 0.83 0.40 1.29 0.72 0.29Rajasthan 1.86 1.29 0.86 1.75 1.18 0.75Tamil Nadu 1.20 0.64 0.21 1.09 0.53 0.10Uttar Pradesh 1.23 0.66 0.23 1.12 0.55 0.12West Bengal 1.05 0.49 0.06 0.94 0.38 -0.051Expenditure classes are based on monthly per capita expenditure classifications from theNational Sample Survey: poor (rupees 0-340/month), middle (rupees 340-775), and rich(rupees 775+).
Source: Murty, 1997.
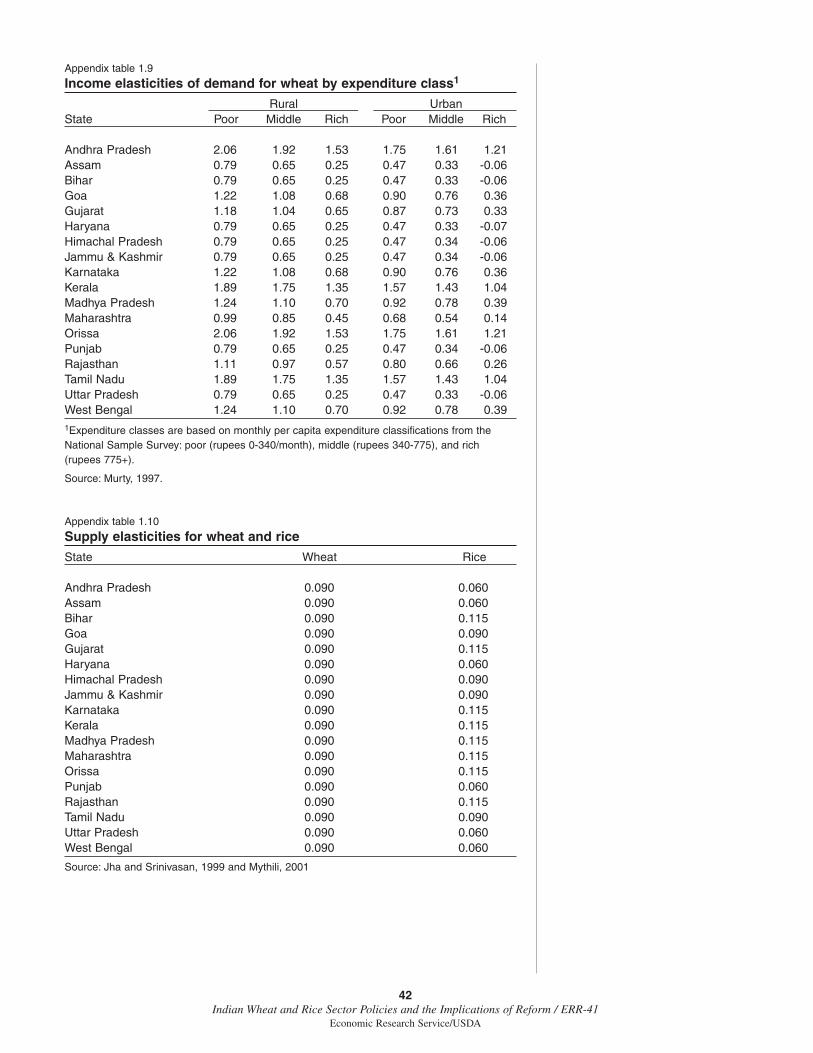
42Indian Wheat and Rice Sector Policies and the Implications of Reform / ERR-41
Economic Research Service/USDA
Appendix table 1.9
Income elasticities of demand for wheat by expenditure class1
Rural UrbanState Poor Middle Rich Poor Middle Rich
Andhra Pradesh 2.06 1.92 1.53 1.75 1.61 1.21Assam 0.79 0.65 0.25 0.47 0.33 -0.06Bihar 0.79 0.65 0.25 0.47 0.33 -0.06Goa 1.22 1.08 0.68 0.90 0.76 0.36Gujarat 1.18 1.04 0.65 0.87 0.73 0.33Haryana 0.79 0.65 0.25 0.47 0.33 -0.07Himachal Pradesh 0.79 0.65 0.25 0.47 0.34 -0.06Jammu & Kashmir 0.79 0.65 0.25 0.47 0.34 -0.06Karnataka 1.22 1.08 0.68 0.90 0.76 0.36Kerala 1.89 1.75 1.35 1.57 1.43 1.04Madhya Pradesh 1.24 1.10 0.70 0.92 0.78 0.39Maharashtra 0.99 0.85 0.45 0.68 0.54 0.14Orissa 2.06 1.92 1.53 1.75 1.61 1.21Punjab 0.79 0.65 0.25 0.47 0.34 -0.06Rajasthan 1.11 0.97 0.57 0.80 0.66 0.26Tamil Nadu 1.89 1.75 1.35 1.57 1.43 1.04Uttar Pradesh 0.79 0.65 0.25 0.47 0.33 -0.06West Bengal 1.24 1.10 0.70 0.92 0.78 0.391Expenditure classes are based on monthly per capita expenditure classifications from theNational Sample Survey: poor (rupees 0-340/month), middle (rupees 340-775), and rich(rupees 775+).
Source: Murty, 1997.
Appendix table 1.10
Supply elasticities for wheat and rice
State Wheat Rice
Andhra Pradesh 0.090 0.060Assam 0.090 0.060Bihar 0.090 0.115Goa 0.090 0.090Gujarat 0.090 0.115Haryana 0.090 0.060Himachal Pradesh 0.090 0.090Jammu & Kashmir 0.090 0.090Karnataka 0.090 0.115Kerala 0.090 0.115Madhya Pradesh 0.090 0.115Maharashtra 0.090 0.115Orissa 0.090 0.115Punjab 0.090 0.060Rajasthan 0.090 0.115Tamil Nadu 0.090 0.090Uttar Pradesh 0.090 0.060West Bengal 0.090 0.060
Source: Jha and Srinivasan, 1999 and Mythili, 2001
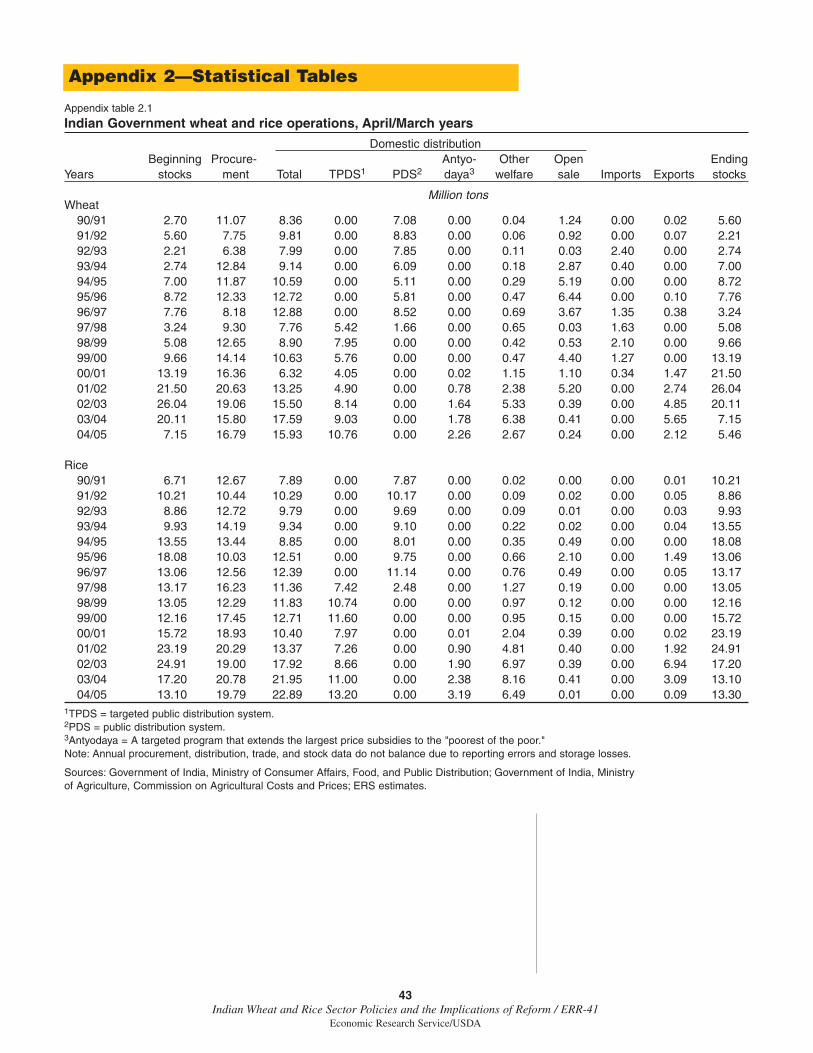
43Indian Wheat and Rice Sector Policies and the Implications of Reform / ERR-41
Economic Research Service/USDA
Appendix table 2.1
Indian Government wheat and rice operations, April/March years
Domestic distributionBeginning Procure- Antyo- Other Open Ending
Years stocks ment Total TPDS1 PDS2 daya3 welfare sale Imports Exports stocks
Million tonsWheat
90/91 2.70 11.07 8.36 0.00 7.08 0.00 0.04 1.24 0.00 0.02 5.6091/92 5.60 7.75 9.81 0.00 8.83 0.00 0.06 0.92 0.00 0.07 2.2192/93 2.21 6.38 7.99 0.00 7.85 0.00 0.11 0.03 2.40 0.00 2.7493/94 2.74 12.84 9.14 0.00 6.09 0.00 0.18 2.87 0.40 0.00 7.0094/95 7.00 11.87 10.59 0.00 5.11 0.00 0.29 5.19 0.00 0.00 8.7295/96 8.72 12.33 12.72 0.00 5.81 0.00 0.47 6.44 0.00 0.10 7.7696/97 7.76 8.18 12.88 0.00 8.52 0.00 0.69 3.67 1.35 0.38 3.2497/98 3.24 9.30 7.76 5.42 1.66 0.00 0.65 0.03 1.63 0.00 5.0898/99 5.08 12.65 8.90 7.95 0.00 0.00 0.42 0.53 2.10 0.00 9.6699/00 9.66 14.14 10.63 5.76 0.00 0.00 0.47 4.40 1.27 0.00 13.1900/01 13.19 16.36 6.32 4.05 0.00 0.02 1.15 1.10 0.34 1.47 21.5001/02 21.50 20.63 13.25 4.90 0.00 0.78 2.38 5.20 0.00 2.74 26.0402/03 26.04 19.06 15.50 8.14 0.00 1.64 5.33 0.39 0.00 4.85 20.1103/04 20.11 15.80 17.59 9.03 0.00 1.78 6.38 0.41 0.00 5.65 7.1504/05 7.15 16.79 15.93 10.76 0.00 2.26 2.67 0.24 0.00 2.12 5.46
Rice 90/91 6.71 12.67 7.89 0.00 7.87 0.00 0.02 0.00 0.00 0.01 10.2191/92 10.21 10.44 10.29 0.00 10.17 0.00 0.09 0.02 0.00 0.05 8.8692/93 8.86 12.72 9.79 0.00 9.69 0.00 0.09 0.01 0.00 0.03 9.9393/94 9.93 14.19 9.34 0.00 9.10 0.00 0.22 0.02 0.00 0.04 13.5594/95 13.55 13.44 8.85 0.00 8.01 0.00 0.35 0.49 0.00 0.00 18.0895/96 18.08 10.03 12.51 0.00 9.75 0.00 0.66 2.10 0.00 1.49 13.0696/97 13.06 12.56 12.39 0.00 11.14 0.00 0.76 0.49 0.00 0.05 13.1797/98 13.17 16.23 11.36 7.42 2.48 0.00 1.27 0.19 0.00 0.00 13.0598/99 13.05 12.29 11.83 10.74 0.00 0.00 0.97 0.12 0.00 0.00 12.1699/00 12.16 17.45 12.71 11.60 0.00 0.00 0.95 0.15 0.00 0.00 15.7200/01 15.72 18.93 10.40 7.97 0.00 0.01 2.04 0.39 0.00 0.02 23.1901/02 23.19 20.29 13.37 7.26 0.00 0.90 4.81 0.40 0.00 1.92 24.9102/03 24.91 19.00 17.92 8.66 0.00 1.90 6.97 0.39 0.00 6.94 17.2003/04 17.20 20.78 21.95 11.00 0.00 2.38 8.16 0.41 0.00 3.09 13.1004/05 13.10 19.79 22.89 13.20 0.00 3.19 6.49 0.01 0.00 0.09 13.30
1TPDS = targeted public distribution system.2PDS = public distribution system.3Antyodaya = A targeted program that extends the largest price subsidies to the "poorest of the poor." Note: Annual procurement, distribution, trade, and stock data do not balance due to reporting errors and storage losses.
Sources: Government of India, Ministry of Consumer Affairs, Food, and Public Distribution; Government of India, Ministryof Agriculture, Commission on Agricultural Costs and Prices; ERS estimates.
Appendix 2—Statistical Tables

44Indian Wheat and Rice Sector Policies and the Implications of Reform / ERR-41
Economic Research Service/USDA
Appendix table 2.2
Total supply and use of wheat in India, April/March years
ConsumptionProduc- Beginning Food Ending
Year Area Yield tion stocks Imports Exports Total Food capita Feed stocks
1,000ha Tons/ha -- - - - - - - - - - - - - -- - - - - - - - --- - - 1,000 tons - - - - - -- - - - Kilograms 1,000 tons
1970/71 16,626 1.21 20,093 4,000 2,927 13 22,007 21,967 41 40 5,0001971/72 18,241 1.31 23,832 5,000 1,749 5 23,576 23,526 43 50 7,0001972/73 19,139 1.38 26,410 7,000 502 667 28,245 28,145 50 100 5,0001973/74 19,463 1.27 24,735 5,000 3,243 0 30,178 30,078 52 100 2,8001974/75 18,583 1.17 21,778 2,800 4,970 0 27,048 26,948 46 100 2,5001975/76 18,010 1.34 24,104 2,500 6,900 0 27,004 26,904 45 100 6,5001976/77 20,454 1.41 28,846 6,500 5,066 0 28,412 28,312 46 100 12,0001977/78 20,922 1.39 29,010 12,000 298 536 30,772 30,372 48 400 10,0001978/79 21,456 1.48 31,749 10,000 50 614 33,685 33,335 52 350 7,5001979/80 22,641 1.57 35,508 7,500 0 481 36,027 35,627 54 400 6,5001980/81 22,172 1.44 31,830 6,500 50 55 34,325 34,025 50 300 4,0001981/82 22,279 1.63 36,313 4,000 2,000 0 36,313 36,013 52 300 6,0001982/83 22,144 1.69 37,452 6,000 2,486 100 37,838 37,538 53 300 8,0001983/84 23,567 1.82 42,794 8,000 3,270 35 42,029 41,729 58 300 12,0001984/85 24,672 1.84 45,476 12,000 700 100 43,076 42,776 58 300 15,0001985/86 23,564 1.87 44,069 15,000 50 400 43,719 43,319 58 400 15,0001986/87 22,997 2.05 47,052 15,000 15 500 45,567 45,167 59 400 16,0001987/88 23,131 1.92 44,323 16,000 10 500 56,492 56,092 72 400 3,3411988/89 23,063 2.00 46,169 3,341 2,100 20 48,929 48,629 61 300 2,6611989/90 24,109 2.24 54,110 2,661 100 20 53,201 53,001 65 200 3,6501990/91 23,502 2.12 49,850 3,650 100 200 47,595 47,395 56 200 5,8051991/92 24,167 2.28 55,134 5,805 100 680 58,009 57,509 67 500 2,3501992/93 23,260 2.39 55,690 2,350 2,500 50 57,515 57,215 66 300 2,9751993/94 24,589 2.33 57,210 2,975 500 28 53,377 53,177 60 200 7,2801994/95 25,100 2.38 59,840 7,280 30 100 58,330 58,130 64 200 8,7201995/96 25,600 2.56 65,470 8,720 50 1,500 64,978 64,678 70 300 7,7621996/97 25,011 2.48 62,097 7,762 1,445 2,000 66,064 65,714 69 350 3,2401997/98 25,887 2.68 69,350 3,240 1,731 0 69,246 68,896 71 350 5,0751998/99 26,700 2.49 66,350 5,075 2,203 0 63,707 63,357 64 350 9,9211999/00 27,400 2.58 70,780 9,921 1,372 200 68,793 68,443 68 350 13,0802000/01 27,486 2.78 76,369 13,080 441 1,569 66,821 66,321 65 500 21,5002001/02 25,700 2.71 69,680 21,500 32 3,087 65,125 64,625 62 500 23,0002002/03 25,900 2.77 71,810 23,000 34 4,850 74,294 73,694 70 600 15,7002003/04 24,860 2.62 65,100 15,700 8 5,650 68,258 67,658 63 600 6,9002004/05 26,620 2.71 72,150 6,900 32 2,120 72,838 72,338 66 500 4,1002005/06 26,500 2.59 68,640 4,100 6,000 801 69,971 69,671 63 300 2,000
Source: USDA Production, Supply, and Distribution database.

45Indian Wheat and Rice Sector Policies and the Implications of Reform / ERR-41
Economic Research Service/USDA
Appendix table 2.3
Total supply and use of rice in India, October/September years
ConsumptionProduc- Beginning Food Ending
Year Area Yield tion stocks Imports Exports Total Food capita Feed stocks
1,000ha Tons/ha - - - - - - - - - - - - - - - - - - 1,000 tons - - - - - - - - - - - - - - - - - Kilograms 1,000 tons
1970/71 37,592 1.12 42,225 5,000 307 20 41,512 41,512 77 0 6,0001971/72 37,758 1.14 43,068 6,000 133 10 43,541 43,541 79 0 5,6501972/73 36,688 1.07 39,245 5,650 0 15 40,780 40,780 72 0 4,1001973/74 38,286 1.15 44,051 4,100 65 35 43,181 43,181 75 0 5,0001974/75 37,889 1.04 39,579 5,000 155 18 43,502 43,502 74 0 1,2141975/76 39,475 1.23 48,740 1,214 230 38 43,646 43,646 72 0 6,5001976/77 38,511 1.09 41,917 6,500 42 23 43,436 43,436 70 0 5,0001977/78 40,282 1.31 52,617 5,000 10 143 49,484 49,484 78 0 8,0001978/79 40,482 1.33 53,773 8,000 10 450 50,333 50,333 78 0 11,0001979/80 39,414 1.07 42,330 11,000 5 425 45,910 45,910 70 0 7,0001980/81 40,152 1.34 53,631 7,000 70 900 53,301 53,301 79 0 6,5001981/82 40,708 1.31 53,248 6,500 10 675 54,083 54,083 79 0 5,0001982/83 38,262 1.23 47,116 5,000 80 200 48,496 48,496 69 0 3,5001983/84 41,244 1.46 60,097 3,500 850 220 58,227 58,227 81 0 6,0001984/85 41,159 1.42 58,337 6,000 10 160 56,687 56,687 77 0 7,5001985/86 41,137 1.55 63,825 7,500 5 250 62,080 62,080 83 0 9,0001986/87 40,774 1.48 60,416 9,000 5 350 60,071 60,071 78 0 9,0001987/88 38,806 1.47 56,862 9,000 650 200 59,312 59,312 76 0 7,0001988/89 41,736 1.69 70,489 7,000 650 450 65,689 65,689 82 0 12,0001989/90 42,167 1.74 73,573 12,000 50 500 71,123 71,123 87 0 14,0001990/91 42,687 1.74 74,291 14,000 0 700 73,091 73,091 87 0 14,5001991/92 42,650 1.75 74,680 14,500 15 600 74,595 74,595 87 0 14,0001992/93 41,775 1.74 72,868 14,000 55 650 75,273 75,273 86 0 11,0001993/94 42,034 1.91 80,300 11,000 0 750 76,050 76,050 85 0 14,5001994/95 42,500 1.92 81,810 14,500 0 4,150 77,660 77,660 85 0 14,5001995/96 42,300 1.82 76,980 14,500 0 3,700 76,280 76,280 82 0 11,5001996/97 43,283 1.89 81,730 11,500 0 2,100 81,630 81,630 86 0 9,5001997/98 43,420 1.90 82,540 9,500 12 4,000 77,552 77,552 80 0 10,5001998/99 44,600 1.93 86,080 10,500 4 3,350 81,234 81,234 83 0 12,0001999/00 45,160 1.99 89,680 12,000 86 1,400 82,650 82,650 83 0 17,7162000/01 44,361 1.92 84,980 17,716 0 1,685 75,960 75,960 75 0 25,0512001/02 44,600 2.09 93,340 25,051 0 6,300 87,611 87,611 84 0 24,4802002/03 40,400 1.78 71,820 24,480 0 5,440 79,860 79,860 76 0 11,0002003/04 42,400 2.09 88,530 11,000 0 3,100 85,630 85,630 80 0 10,8002004/05 42,300 2.01 85,130 10,800 0 4,678 83,743 83,743 74 0 8,5002005/06 43,400 2.11 91,790 8,500 0 3,800 85,220 85,220 77 0 11,270
Source: USDA Production, Supply, and Distribution database.
United States Department of AgricultureEconomic Research Service
1800 M Street, NWWashington, DC 20036-4789
www.ers.usda.gov