Structural characterization of Brachypodium genome and its syntenic relationship with rice and wheat
16
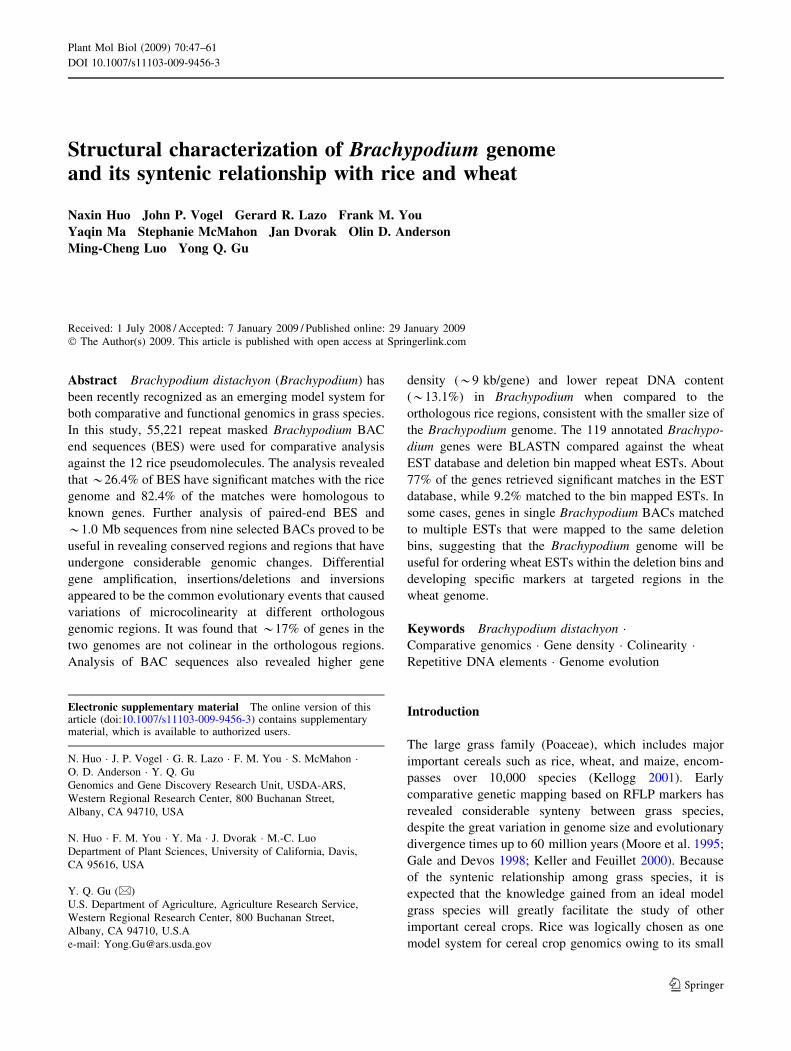
eScholarship provides open access, scholarly publishing services to the University of California and delivers a dynamic research platform to scholars worldwide. University of California Peer Reviewed Title: Structural characterization of Brachypodium genome and its syntenic relationship with rice and wheat Author: Huo, Naxin ; Vogel, John P. ; Lazo, Gerard R. ; You, Frank M. ; Ma, Yaqin ; McMahon, Stephanie ; et al. Publication Date: 2009 Publication Info: Postprints, Multi-Campus Permalink: http://escholarship.org/uc/item/7ss61705 DOI: 10.1007/s11103-009-9456-3 Abstract: Brachypodium distachyon (Brachypodium) has been recently recognized as an emerging model system for both comparative and functional genomics in grass species. In this study, 55,221 repeat masked Brachypodium BAC end sequences (BES) were used for comparative analysis against the 12 rice pseudomolecules. The analysis revealed that ~26.4% of BES have significant matches with the rice genome and 82.4% of the matches were homologous to known genes. Further analysis of paired-end BES and ~1.0 Mb sequences from nine selected BACs proved to be useful in revealing conserved regions and regions that have undergone considerable genomic changes. Differential gene amplification, insertions/deletions and inversions appeared to be the common evolutionary events that caused variations of microcolinearity at different orthologous genomic regions. It was found that ~17% of genes in the two genomes are not colinear in the orthologous regions. Analysis of BAC sequences also revealed higher gene density (~9 kb/gene) and lower repeat DNA content (~13.1%) in Brachypodium when compared to the orthologous rice regions, consistent with the smaller size of the Brachypodium genome. The 119 annotated Brachypodium genes were BLASTN compared against the wheat EST database and deletion bin mapped wheat ESTs. About 77% of the genes retrieved significant matches in the EST database, while 9.2% matched to the bin mapped ESTs. In some cases, genes in single Brachypodium BACs matched to multiple ESTs that were mapped to the same deletion bins, suggesting that the Brachypodium genome will be useful for ordering wheat ESTs within the deletion bins and developing specific markers at targeted regions in the wheat genome.
-
Upload
independent -
Category
Documents
-
view
2 -
download
0
Transcript of Structural characterization of Brachypodium genome and its syntenic relationship with rice and wheat
eScholarship provides open access, scholarly publishingservices to the University of California and delivers a dynamicresearch platform to scholars worldwide.
University of California
Peer Reviewed
Title:Structural characterization of Brachypodium genome and its syntenic relationship with rice andwheat
Author:Huo, Naxin; Vogel, John P.; Lazo, Gerard R.; You, Frank M.; Ma, Yaqin; McMahon, Stephanie; et al.
Publication Date:2009
Publication Info:Postprints, Multi-Campus
Permalink:http://escholarship.org/uc/item/7ss61705
DOI:10.1007/s11103-009-9456-3
Abstract:Brachypodium distachyon (Brachypodium) has been recently recognized as an emerging modelsystem for both comparative and functional genomics in grass species. In this study, 55,221 repeatmasked Brachypodium BAC end sequences (BES) were used for comparative analysis againstthe 12 rice pseudomolecules. The analysis revealed that ~26.4% of BES have significant matcheswith the rice genome and 82.4% of the matches were homologous to known genes. Furtheranalysis of paired-end BES and ~1.0 Mb sequences from nine selected BACs proved to be usefulin revealing conserved regions and regions that have undergone considerable genomic changes.Differential gene amplification, insertions/deletions and inversions appeared to be the commonevolutionary events that caused variations of microcolinearity at different orthologous genomicregions. It was found that ~17% of genes in the two genomes are not colinear in the orthologousregions. Analysis of BAC sequences also revealed higher gene density (~9 kb/gene) and lowerrepeat DNA content (~13.1%) in Brachypodium when compared to the orthologous rice regions,consistent with the smaller size of the Brachypodium genome. The 119 annotated Brachypodiumgenes were BLASTN compared against the wheat EST database and deletion bin mapped wheatESTs. About 77% of the genes retrieved significant matches in the EST database, while 9.2%matched to the bin mapped ESTs. In some cases, genes in single Brachypodium BACs matchedto multiple ESTs that were mapped to the same deletion bins, suggesting that the Brachypodiumgenome will be useful for ordering wheat ESTs within the deletion bins and developing specificmarkers at targeted regions in the wheat genome.
Structural characterization of Brachypodium genomeand its syntenic relationship with rice and wheat
Naxin Huo Æ John P. Vogel Æ Gerard R. Lazo Æ Frank M. You ÆYaqin Ma Æ Stephanie McMahon Æ Jan Dvorak Æ Olin D. Anderson ÆMing-Cheng Luo Æ Yong Q. Gu
Received: 1 July 2008 / Accepted: 7 January 2009 / Published online: 29 January 2009
� The Author(s) 2009. This article is published with open access at Springerlink.com
Abstract Brachypodium distachyon (Brachypodium) has
been recently recognized as an emerging model system for
both comparative and functional genomics in grass species.
In this study, 55,221 repeat masked Brachypodium BAC
end sequences (BES) were used for comparative analysis
against the 12 rice pseudomolecules. The analysis revealed
that *26.4% of BES have significant matches with the rice
genome and 82.4% of the matches were homologous to
known genes. Further analysis of paired-end BES and
*1.0 Mb sequences from nine selected BACs proved to be
useful in revealing conserved regions and regions that have
undergone considerable genomic changes. Differential
gene amplification, insertions/deletions and inversions
appeared to be the common evolutionary events that caused
variations of microcolinearity at different orthologous
genomic regions. It was found that *17% of genes in the
two genomes are not colinear in the orthologous regions.
Analysis of BAC sequences also revealed higher gene
density (*9 kb/gene) and lower repeat DNA content
(*13.1%) in Brachypodium when compared to the
orthologous rice regions, consistent with the smaller size of
the Brachypodium genome. The 119 annotated Brachypo-
dium genes were BLASTN compared against the wheat
EST database and deletion bin mapped wheat ESTs. About
77% of the genes retrieved significant matches in the EST
database, while 9.2% matched to the bin mapped ESTs. In
some cases, genes in single Brachypodium BACs matched
to multiple ESTs that were mapped to the same deletion
bins, suggesting that the Brachypodium genome will be
useful for ordering wheat ESTs within the deletion bins and
developing specific markers at targeted regions in the
wheat genome.
Keywords Brachypodium distachyon �Comparative genomics � Gene density � Colinearity �Repetitive DNA elements � Genome evolution
Introduction
The large grass family (Poaceae), which includes major
important cereals such as rice, wheat, and maize, encom-
passes over 10,000 species (Kellogg 2001). Early
comparative genetic mapping based on RFLP markers has
revealed considerable synteny between grass species,
despite the great variation in genome size and evolutionary
divergence times up to 60 million years (Moore et al. 1995;
Gale and Devos 1998; Keller and Feuillet 2000). Because
of the syntenic relationship among grass species, it is
expected that the knowledge gained from an ideal model
grass species will greatly facilitate the study of other
important cereal crops. Rice was logically chosen as one
model system for cereal crop genomics owing to its small
Electronic supplementary material The online version of thisarticle (doi:10.1007/s11103-009-9456-3) contains supplementarymaterial, which is available to authorized users.
N. Huo � J. P. Vogel � G. R. Lazo � F. M. You � S. McMahon �O. D. Anderson � Y. Q. Gu
Genomics and Gene Discovery Research Unit, USDA-ARS,
Western Regional Research Center, 800 Buchanan Street,
Albany, CA 94710, USA
N. Huo � F. M. You � Y. Ma � J. Dvorak � M.-C. Luo
Department of Plant Sciences, University of California, Davis,
CA 95616, USA
Y. Q. Gu (&)
U.S. Department of Agriculture, Agriculture Research Service,
Western Regional Research Center, 800 Buchanan Street,
Albany, CA 94710, U.S.A
e-mail: [email protected]
123
Plant Mol Biol (2009) 70:47–61
DOI 10.1007/s11103-009-9456-3
genome size and importance as a staple crop (Goff 1999;
Shimamoto and Kyozuka 2002; IRGSP 2005). The com-
pletion of the rice genome sequence has fueled its use in
comparative genomics to understand the evolution of grass
genomes as well as in map-based cloning of important
genes in other cereal crops such as wheat (Song et al. 2002;
Ling et al. 2003; Lai et al. 2004; Yan et al. 2004; Yan et al.
2006; Bruggmann et al. 2006; Wei et al. 2007).
Despite their close relationship, grass genomes are
evolutionarily labile for many characteristics including
chromosome number, ploidy, and genome size. In addition,
common sequence changes such as insertion, deletion,
duplication, and translocation can further complicate the
use of many regions of the rice genome for cross-species
comparison with other grasses (Sorrells et al. 2003;
Bruggmann et al. 2006). Therefore, comparative analysis
using more than two grass genomes could allow for elu-
cidation of the nature of sequence changes that occurred in
specific lineages during the evolutionary history of grass
species (Song et al. 2002; Lai et al. 2004; Wei et al. 2007;
Salse et al. 2008). For genome studies in Triticeae species
including wheat and barley, a more closely related model
grass genome will serve as a better intermediate for com-
parative and functional analysis.
The genus Brachypodium belongs to the Brachypodieae
tribe, which is sister group to the four major cool season
grass tribes of great economic importance—Triticeae,
Aveneae, Poeae, and Bromeae (Draper et al. 2001; Kellogg
2001; Vogel et al. 2006). Hence, the Brachypodium gen-
ome is expected to show greater gene colinearity to the
genomes of major cool season cereal grain and forage
grasses and will be more useful in gene discovery in large
Triticeae genomes such as wheat and barley (Garvin et al.
2008; Opanowicz et al. 2008; Ozdemir et al. 2008). In
addition, the annual species in the genus Brachypodium
possess a range of desirable biological features that make it
well suited for functional genomics. For example, diploid
Brachypodium has one of the smallest genomes in grasses
(*300 Mb). The plant also has small physical stature,
short life cycle, and undemanding growth requirements—
all of which make it amenable to high-throughput genetic
screening. Therefore, Brachypodium could serve as a util-
ity model system for various types of plant research
(Beckmann et al. 2008; Li et al. 2008; Idziak and Hasterok
2008; Parker et al. 2008; Spielmeyer et al. 2008).
Despite the growing interest in utilization of Brachypo-
dium as a model grass, little is still known about the structure
and organization of the Brachypodium genome. The utility of
Brachypodium for grass crop genomics remains to be thor-
oughly tested. So far, comparative analysis with rice and
wheat have been only conducted in a few genetic regions
from a perennial, outbreeding species B. sylvativum (Foote
et al. 2004; Griffiths et al. 2006; Bossolini et al. 2007; Faris
et al. 2008; Spielmeyer et al. 2008), which has a genome
reported to be *470 Mb (Foote et al. 2004) with a size
similar to that of rice, but larger than that of B. distachyon.
B. sylvaticum has proved useful in mapping the wheat Ph1
gene (Griffiths et al. 2006). It was shown that the orthologous
sequences from B. sylvaticum are more colinear to wheat as
compared to those of rice. B. sylvaticum and wheat shared
such high sequence identity that probes derived from
B. sylvaticum sequences can be directly used for wheat
mapping (Griffiths et al. 2006). Comparative studies on the
wheat Lr34 region also indicated that B. sylvaticum and
wheat showed perfect macro-colinearity of genetic markers,
whereas rice contained a *200-kb inversion in the orthol-
ogous region (Bossolini et al. 2007). It was estimated that
B. sylvaticum and wheat diverged 35–40 Mya, significantly
more recently than the divergence of rice and wheat
(Bossolini et al. 2007). As far as we know, comparative
analysis using B. distachyon genome has not been reported.
A genome study on B. distachyon will provide important
insights into the gene distribution and evolution of repetitive
DNA in a compact grass genome.
Previously, we sequenced *65,000 BAC ends from
Brachypodium BAC libraries to generate *38 Mb of
random short genomic sequence, representing 10% of the
Brachypodium genome (Huo et al. 2007). Analysis of BES
revealed low repetitive DNA content and close phyloge-
netic relationship with the Triticeae species. In this study,
we compared the BES against the rice genome to assess
sequence conservation between these two compact grass
genomes. To further analyze the colinearity of the orthol-
ogous regions, we sequenced nine Brachypodium BAC
clones selected on basis of BAC-end matches to the rice
genome. Our study provides the first comparison of the
Brachypodium and rice genomes at multiple genetic loci.
To evaluate the utility of Brachypodium for cereal crops
with large genomes, the annotated Brachypodium genes
were BLASTN searched against the wheat EST database
and deletion-bin mapped wheat ESTs. Comparative anal-
ysis using the Brachypodium genome could offer a
potentially useful strategy for the development of wheat
genetic and linkage maps.
Materials and methods
Blast search of Brachypodium BES against the rice
genome
To anchor Brachypodium BACs onto the rice genome, the
55,221 repeat masked BES were compared to the rice
genome sequence using BLASTN. An expectation value
(E) of e-10 was used as the significant threshold (www.
tigr.org). The BES were assigned to individual rice
48 Plant Mol Biol (2009) 70:47–61
123
chromosomes based on their best match to the rice genome.
BES matching the rice genome were also analyzed by
BLASTX against NCBI non-redundant protein database
(http://www.ncbi.nlm.nih.gov/BLAST).
Sequencing of Brachypodium BAC clones
and sequence assembling
BAC DNA was isolated with the Qiagen Large Construct
Kit (Qiagen, Valencia, CA) and shotgun libraries were
constructed as described previously (Gu et al. 2003). In
brief, the purified DNA was sheared and size selected by
agarose gel electrophoresis. Fragments with sizes between
3 and 5 kb were ligated into the pCR4TOPO vector using a
TOPO cloning kit (Invitrogen, Carlsbad, CA). The ligation
mixture was transformed into electrocompetent TOP10
cells. Plasmid DNA was isolated using the PerfectPrep
Direct Bind Kit (Eppendorf, Boulder, CO). For each BAC,
768 subclones were sequenced from both ends using T7
and T3 primers and BigDye terminator chemistry (Applied
Biosystems, Foster City, CA) on an ABI3730XL auto-
mated sequencer (Applied Biosystems). Gaps were filled
by sequencing PCR products amplified directly from the
BAC clones.
The BAC sequences were assembled using the Laser-
gene SeqMan Module (DNAStar, www.DNAStar.com) as
described previously (Gu et al. 2003). In this module, we
set the stringency for base calling and quality assessment to
‘‘high’’ to generate the most accurate consensus sequence
possible. The sequence assembling was performed using a
40-bp window size and a 95% match requirement.
Annotation of Brachypodium repetitive elements
To define the Brachypodium repetitive element, a survey of
the composition and contents of the Brachypodium repeat
element sequences in the sequenced BACs was conducted
using the RepeatMasker program (http://www.repeat
masker.org). The BAC sequences were also searched
using BLASTN against the Triticeae Repeat Sequence
(TREP) database (http://wheat.pw.usda.gov/ITMI/Repeats)
and the local BLAST database containing unique Brac-
hypodium repeat element sequences (Huo et al. 2007).
Gene annotation
To annotate coding sequences, a combination of BLASTN
and BLASTX against non-redundant nucleotide and pro-
tein databases were utilized to identify all putative gene
sequences. In addition, coding regions in the BAC
sequences were also predicted using FGENESH (http://
www.softberry.com) set for a monocot model. Predicted
genes were then compared to the nonredundant and dbEST
databases of NCBI (March 2008) using BLASTN and
BLASTX. If a hypothetical protein was predicted, the
sequence was searched against UniProt (Ver. 9.7) of
European Bioinformatics Institute database (March 2008).
Only matches with E values smaller than e-10 were
accepted. The complete annotation of each sequenced BAC
clone has been submitted to GenBank (Accession numbers
EU730894-EU730902).
Brachypodium sequence comparison with rice
and wheat
Orthologous rice sequences and annotations in VISTA
format were downloaded from Gramene (http://www.
gramene.org) and TIGR Rice Genome Browser (http://
www.tigr.org). The orthologous rice sequences were
re-annotated with the same criteria used to annotate the
Brachypodium BACs. For comparative analysis between
rice and Brachypodium, the rice CDS annotated in
orthologous regions were aligned with the Brachypodium
sequences to identify genes that were colinear. Sequence
alignment analysis was performed using the VISTA pro-
gram (Mayor et al. 2000). To compare Brachypodium and
wheat, the annotated Brachypodium genes were compared
to the deletion bin mapped wheat EST database
(http://wheat.pw.usda.gov/wEST/) using BLASTN. Brac-
hypodium genes were also compared to NCBI wheat and
rice EST databases using BLASTN.
Results
Anchoring Brachypodium BES onto the rice genome
Analysis of *65,000 Brachypodium BES revealed its
relatively simple genome with low repetitive DNA content
and high gene density (Huo et al. 2007). To provide an
initial genome-wide comparison of rice and Brachypodium,
both with compact genomes, we attempted to anchor
Brachypodium BES onto the rice genome. Since the coding
sequences of transposable elements (TE) often identify
multiple noncolinear matches between the two grass spe-
cies, it was critical to use repeat-masked BES in the
analysis. Our BLASTN analysis showed that 14,547 out of
55,221 repeat-masked BES (26.3%) had matches to the rice
genome sequence (E \ e-10) at the nucleotide level. Fur-
ther analysis using BLASTX showed that 11,982 (82.4%)
out of these 14,547 BES matched to known protein-coding
genes at E \ e-10. The nature of the remaining 17.4% of
the matches is unclear, however, some of these sequences
could represent conserved noncoding sequences as previ-
ously suggested (Bossolini et al. 2007).
Plant Mol Biol (2009) 70:47–61 49
123
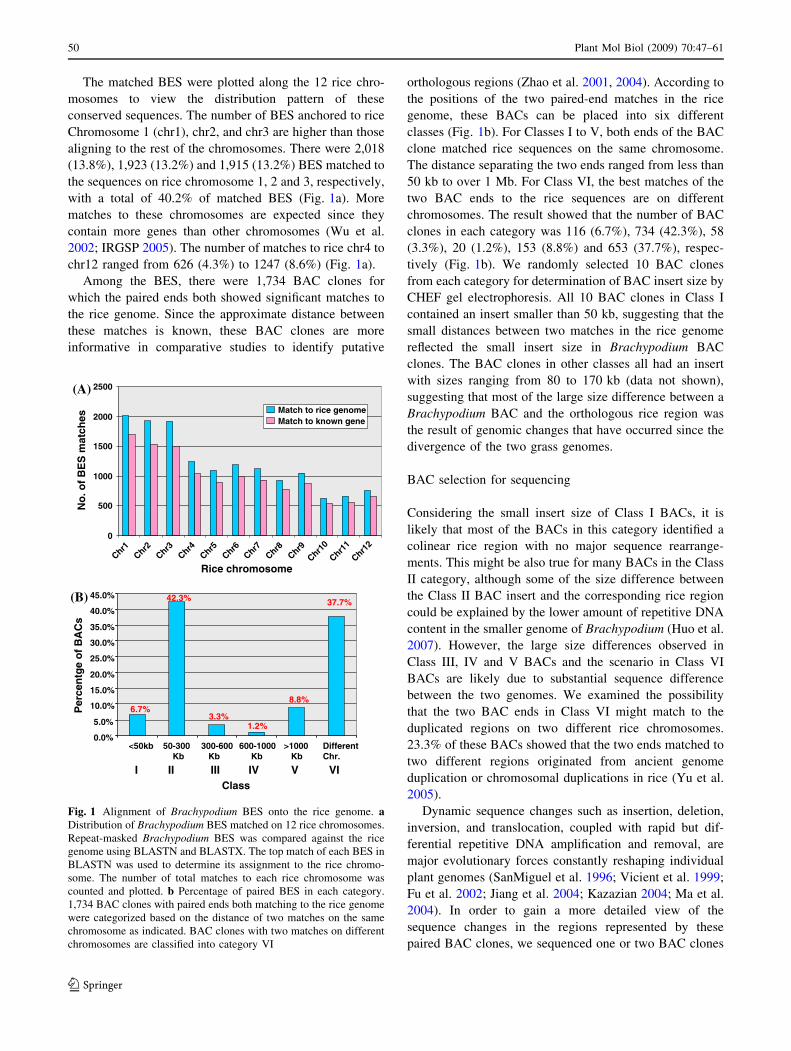
The matched BES were plotted along the 12 rice chro-
mosomes to view the distribution pattern of these
conserved sequences. The number of BES anchored to rice
Chromosome 1 (chr1), chr2, and chr3 are higher than those
aligning to the rest of the chromosomes. There were 2,018
(13.8%), 1,923 (13.2%) and 1,915 (13.2%) BES matched to
the sequences on rice chromosome 1, 2 and 3, respectively,
with a total of 40.2% of matched BES (Fig. 1a). More
matches to these chromosomes are expected since they
contain more genes than other chromosomes (Wu et al.
2002; IRGSP 2005). The number of matches to rice chr4 to
chr12 ranged from 626 (4.3%) to 1247 (8.6%) (Fig. 1a).
Among the BES, there were 1,734 BAC clones for
which the paired ends both showed significant matches to
the rice genome. Since the approximate distance between
these matches is known, these BAC clones are more
informative in comparative studies to identify putative
orthologous regions (Zhao et al. 2001, 2004). According to
the positions of the two paired-end matches in the rice
genome, these BACs can be placed into six different
classes (Fig. 1b). For Classes I to V, both ends of the BAC
clone matched rice sequences on the same chromosome.
The distance separating the two ends ranged from less than
50 kb to over 1 Mb. For Class VI, the best matches of the
two BAC ends to the rice sequences are on different
chromosomes. The result showed that the number of BAC
clones in each category was 116 (6.7%), 734 (42.3%), 58
(3.3%), 20 (1.2%), 153 (8.8%) and 653 (37.7%), respec-
tively (Fig. 1b). We randomly selected 10 BAC clones
from each category for determination of BAC insert size by
CHEF gel electrophoresis. All 10 BAC clones in Class I
contained an insert smaller than 50 kb, suggesting that the
small distances between two matches in the rice genome
reflected the small insert size in Brachypodium BAC
clones. The BAC clones in other classes all had an insert
with sizes ranging from 80 to 170 kb (data not shown),
suggesting that most of the large size difference between a
Brachypodium BAC and the orthologous rice region was
the result of genomic changes that have occurred since the
divergence of the two grass genomes.
BAC selection for sequencing
Considering the small insert size of Class I BACs, it is
likely that most of the BACs in this category identified a
colinear rice region with no major sequence rearrange-
ments. This might be also true for many BACs in the Class
II category, although some of the size difference between
the Class II BAC insert and the corresponding rice region
could be explained by the lower amount of repetitive DNA
content in the smaller genome of Brachypodium (Huo et al.
2007). However, the large size differences observed in
Class III, IV and V BACs and the scenario in Class VI
BACs are likely due to substantial sequence difference
between the two genomes. We examined the possibility
that the two BAC ends in Class VI might match to the
duplicated regions on two different rice chromosomes.
23.3% of these BACs showed that the two ends matched to
two different regions originated from ancient genome
duplication or chromosomal duplications in rice (Yu et al.
2005).
Dynamic sequence changes such as insertion, deletion,
inversion, and translocation, coupled with rapid but dif-
ferential repetitive DNA amplification and removal, are
major evolutionary forces constantly reshaping individual
plant genomes (SanMiguel et al. 1996; Vicient et al. 1999;
Fu et al. 2002; Jiang et al. 2004; Kazazian 2004; Ma et al.
2004). In order to gain a more detailed view of the
sequence changes in the regions represented by these
paired BAC clones, we sequenced one or two BAC clones
Rice chromosome
No
. of
BE
S m
atch
es
0
500
1000
1500
2000
2500(A)
(B)
Chr1Chr2
Chr3Chr4
Chr5Chr6
Chr7Chr8
Chr9Chr1
0
Chr11
Chr12
Match to rice genomeMatch to known gene
6.7%3.3%
1.2%
8.8%
37.7%
42.3%
5.0%
10.0%
15.0%
20.0%
25.0%
30.0%
35.0%
40.0%
45.0%
Per
cen
tge
of
BA
Cs
Class
6.7%3.3%
1.2%
8.8%
37.7%
42.3%
0.0%
I II III VIVIV
6.7%3.3%
1.2%
8.8%
37.7%42.3%
<50kb 50-300Kb
300-600Kb
600-1000Kb
>1000Kb
DifferentChr.
Fig. 1 Alignment of Brachypodium BES onto the rice genome. aDistribution of Brachypodium BES matched on 12 rice chromosomes.
Repeat-masked Brachypodium BES was compared against the rice
genome using BLASTN and BLASTX. The top match of each BES in
BLASTN was used to determine its assignment to the rice chromo-
some. The number of total matches to each rice chromosome was
counted and plotted. b Percentage of paired BES in each category.
1,734 BAC clones with paired ends both matching to the rice genome
were categorized based on the distance of two matches on the same
chromosome as indicated. BAC clones with two matches on different
chromosomes are classified into category VI
50 Plant Mol Biol (2009) 70:47–61
123

from different categories (Table 1). Considering the small
insert size in Class I and likely colinearity with the corre-
sponding rice region, no BAC clones were selected from
this class. Instead, a BAC clone from Class II with an insert
(*113 kb) similar to the size in the corresponding rice
region (115.8 kb) was selected for sequencing. This BAC
spanned a larger colinear region as compare to the BACs in
Class I. Three random BACs, DH085B13, DB091J02 and
DH002G02 were also chosen for sequencing in order to
obtain a random sample sequence. The total assembled
sequence of the nine Brachypodium BACs was 1,071 kb
(Table 1).
Brachypodium repetitive DNA in sequenced BACs
Transposable elements (TE) are one of the major compo-
nents of plant genomes (SanMiguel et al. 1996; Meyers
et al. 2001; Li et al. 2004; Messing et al. 2004; Paux et al.
2006). To evaluate the TE content in the compact Brac-
hypodium genome, the sequences from the nine BAC
clones were compared to repetitive DNA databases using
the RepeatMasker program (http://www.repeatmasker.org).
TEs are classified based on their transposition mechanism
as either DNA (Class II) or RNA (Class I) elements. The
percentage of different types of TE is shown in Table 1.
Clearly, there is significant variation of TE content and
types among each BAC. The percentage of RNA TE ranges
from 0.8% to 12.9% with an average of 6.7%. The per-
centage of DNA TE ranges from 0.9% to 3.0% with an
average of 1.6%. Therefore, the average DNA TE content
in the sequenced BACs is comparable to that estimated by
BAC end sequences (1.28%); while the average RNA TE
(6.7%) is slightly lower than the previous estimate (7.87%)
(Huo et al. 2007).
Previously, we developed a database for the unique
Brachypodium repetitive element sequences (UBRES)
(Huo et al. 2007). The large contiguous BAC sequences
were compared against the UBRES database (http://brachy
podium.pw.usda.gov). Totally, 43,931 bp had significant
matches to the UBRES. The percentage of the sequences
matched to UBRES ranged from 1.0% to 9.8% with an
average of 4.1%. This was lower than the percentage
(7.4%) of UBRES observed previously (Huo et al. 2007).
Taken together, the total repetitive DNA content in
sequenced BACs ranges from 4.2% to 23.5% with an
average of 13.1%. This number is lower than the estimate
based on BES (18.4%). This may be attributable to the pre-
selection of six BAC clones that contained gene sequences
at both ends. Relative higher gene content and lower DNA
content in pre-selected BACs have been discussed (Devos
et al. 2005). The difference may also be due to sampling
error since the BAC sequences described here came from
nine locations in the genomes whereas the BES were
derived from the 32,500 locations sampled during our BES.
Two of the random BACs have the highest repetitive DNA
content. In addition, the large variation of repetitive DNA
content in each BAC also indicates that TEs are not evenly
distributed in the genome sequence. This suggests that
there may be hot spots for TE insertions (Ma and Ben-
netzen 2004) even in the compact genome of
Brachypodium.
Gene annotation of Brachypodium BACs and rice
orthologous regions
The nine BAC clones represent different genetic loci in the
Brachypodium genome. Detailed analysis of the sequences
could provide the first insight into the gene content and
distribution in the Brachypodium genome. As over-esti-
mation of the gene number is a common problem in gene
annotation (Bennetzen et al. 2004; Devos et al. 2005; Ma
et al. 2005), we used stringent parameters for gene
Table 1 Sequence composition of nine Brachypodium BACs
Clone ID Category Size
(kb)
Gene
no.
Gene density (kb/
gene)
RNA TE (bp) DNA TE (bp) Othersa (bp) UBRES (bp) Total repeat
DB009O11 Class II 113.0 16 7.1 950 (0.8%) 2,149 (1.9%) 463 (0.4%) 1,134 (1.0%) 4,696 (4.2%)
DB009L22 Class III 128.8 16 8.1 9,638 (7.5%) 1,400 (1.1%) 929 (0.7%) 7,973 (6.2%) 19,940 (15.5%)
DB038O09 Class IV 102.4 11 9.3 1,994 (1.9%) 2,118 (2.1%) 251 (0.2%) 2,254 (2.2%) 6,617 (6.5%)
DH003L20 Class V 89.3 8 11.2 2,824 (3.2%) 1,091 (1.2%) 199 (0.2%) 1,338 (1.5%) 5,452 (6.1%)
DB031O07 Class V 107.3 9 11.9 11,439 (10.7%) 2,854 (2.7%) 779 (0.7%) 1,170 (1.1%) 16,242 (15.2%)
DH037O21 Class VI 162.5 24 6.8 16,158 (10.0%) 1,812 (1.1%) 1,104 (0.7%) 6,432 (4.0%) 25,506 (15.7%)
DH085B13 Random 138.9 20 6.9 3,625 (2.6%) 1,227 (0.9%) 609 (0.4%) 2,429 (1.8%) 7,890 (5.7%)
DB091J02 Random 100.2 6 16.7 12,942 (12.9%) 987 (1.0%) 551 (0.6%) 8,640 (8.6%) 23,120 (23.1%)
DH002G02 Random 128.6 9 14.3 12,592 (9.8%) 3,921 (3.0%) 1,169 (0.9%) 12,561 (9.8%) 30,243 (23.5%)
Total 1,071 119 9 71,795 (6.7%) 17,559 (1.6%) 5,789 (0.5%) 43,931 (4.1%) 139,706 (13.1%)
a Including the known unclassified, small RNA, satellites, simple repeats and low complexity repeat
Plant Mol Biol (2009) 70:47–61 51
123
assignment in Brachypodium BACs. We only counted
putative genes that had a significant match (BLASTX E
value smaller than e-10) to a known gene that was not a
transposable element (TE). For the nine Brachypodium
BACs, a total of 196 genes were predicted by FGENESH,
and 119 of these genes were confirmed by BLASTX search
with these criteria. The gene annotations of each BAC are
shown in Supplement 1.
The precise borders of each region in the rice genome
orthologous to the individual Brachypodium BAC were
identified by local BLAST of the BAC sequences against
the rice genome assembly (TIGR rice pseudomolecule
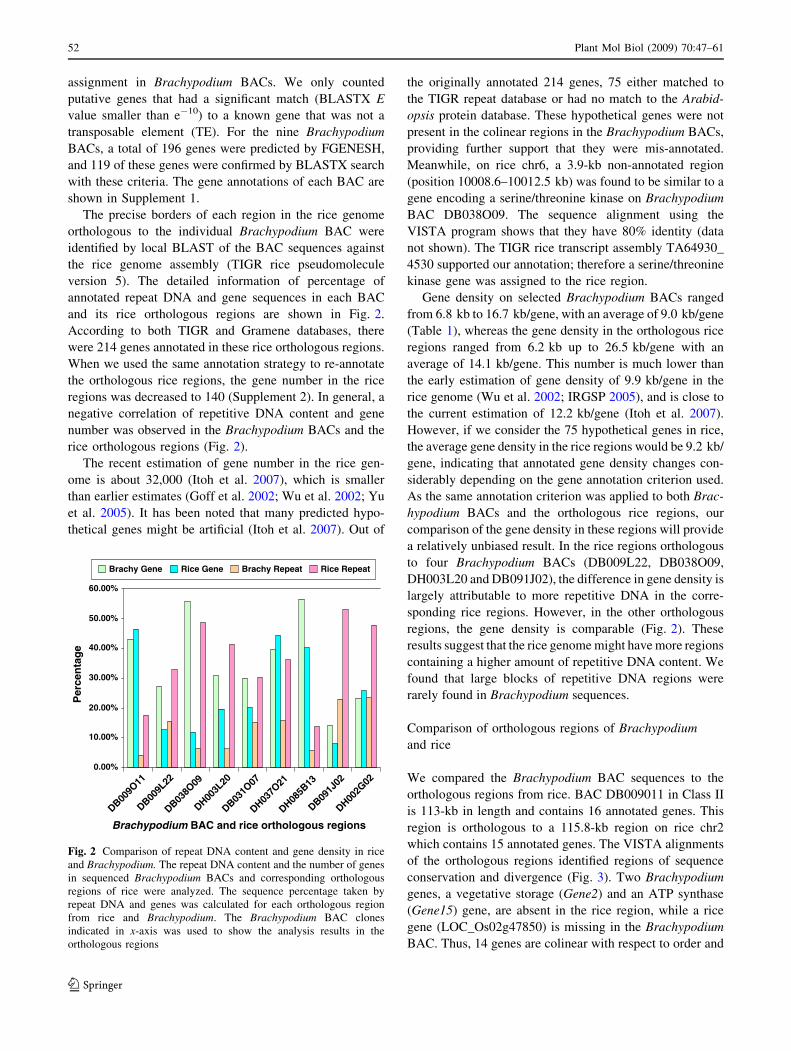
version 5). The detailed information of percentage of
annotated repeat DNA and gene sequences in each BAC
and its rice orthologous regions are shown in Fig. 2.
According to both TIGR and Gramene databases, there
were 214 genes annotated in these rice orthologous regions.
When we used the same annotation strategy to re-annotate
the orthologous rice regions, the gene number in the rice
regions was decreased to 140 (Supplement 2). In general, a
negative correlation of repetitive DNA content and gene
number was observed in the Brachypodium BACs and the
rice orthologous regions (Fig. 2).
The recent estimation of gene number in the rice gen-
ome is about 32,000 (Itoh et al. 2007), which is smaller
than earlier estimates (Goff et al. 2002; Wu et al. 2002; Yu
et al. 2005). It has been noted that many predicted hypo-
thetical genes might be artificial (Itoh et al. 2007). Out of
the originally annotated 214 genes, 75 either matched to
the TIGR repeat database or had no match to the Arabid-
opsis protein database. These hypothetical genes were not
present in the colinear regions in the Brachypodium BACs,
providing further support that they were mis-annotated.
Meanwhile, on rice chr6, a 3.9-kb non-annotated region
(position 10008.6–10012.5 kb) was found to be similar to a
gene encoding a serine/threonine kinase on Brachypodium
BAC DB038O09. The sequence alignment using the
VISTA program shows that they have 80% identity (data
not shown). The TIGR rice transcript assembly TA64930_
4530 supported our annotation; therefore a serine/threonine
kinase gene was assigned to the rice region.
Gene density on selected Brachypodium BACs ranged
from 6.8 kb to 16.7 kb/gene, with an average of 9.0 kb/gene
(Table 1), whereas the gene density in the orthologous rice
regions ranged from 6.2 kb up to 26.5 kb/gene with an
average of 14.1 kb/gene. This number is much lower than
the early estimation of gene density of 9.9 kb/gene in the
rice genome (Wu et al. 2002; IRGSP 2005), and is close to
the current estimation of 12.2 kb/gene (Itoh et al. 2007).
However, if we consider the 75 hypothetical genes in rice,
the average gene density in the rice regions would be 9.2 kb/
gene, indicating that annotated gene density changes con-
siderably depending on the gene annotation criterion used.
As the same annotation criterion was applied to both Brac-
hypodium BACs and the orthologous rice regions, our
comparison of the gene density in these regions will provide
a relatively unbiased result. In the rice regions orthologous
to four Brachypodium BACs (DB009L22, DB038O09,
DH003L20 and DB091J02), the difference in gene density is
largely attributable to more repetitive DNA in the corre-
sponding rice regions. However, in the other orthologous
regions, the gene density is comparable (Fig. 2). These
results suggest that the rice genome might have more regions
containing a higher amount of repetitive DNA content. We
found that large blocks of repetitive DNA regions were
rarely found in Brachypodium sequences.
Comparison of orthologous regions of Brachypodium
and rice
We compared the Brachypodium BAC sequences to the
orthologous regions from rice. BAC DB009011 in Class II
is 113-kb in length and contains 16 annotated genes. This
region is orthologous to a 115.8-kb region on rice chr2
which contains 15 annotated genes. The VISTA alignments
of the orthologous regions identified regions of sequence
conservation and divergence (Fig. 3). Two Brachypodium
genes, a vegetative storage (Gene2) and an ATP synthase
(Gene15) gene, are absent in the rice region, while a rice
gene (LOC_Os02g47850) is missing in the Brachypodium
BAC. Thus, 14 genes are colinear with respect to order and
Brachypodium BAC and rice orthologous regions
Per
cen
tag
e
0.00%
10.00%
20.00%
30.00%
40.00%
50.00%
60.00%
DB009O
11
DB009L
22
DB038O
09
DH003L
20
DB031O
07
DH037O
21
DH085B
13
DB091J
02
DH002G
02
Brachy Gene Rice Gene Brachy Repeat Rice Repeat
Fig. 2 Comparison of repeat DNA content and gene density in rice
and Brachypodium. The repeat DNA content and the number of genes
in sequenced Brachypodium BACs and corresponding orthologous
regions of rice were analyzed. The sequence percentage taken by
repeat DNA and genes was calculated for each orthologous region
from rice and Brachypodium. The Brachypodium BAC clones
indicated in x-axis was used to show the analysis results in the
orthologous regions
52 Plant Mol Biol (2009) 70:47–61
123
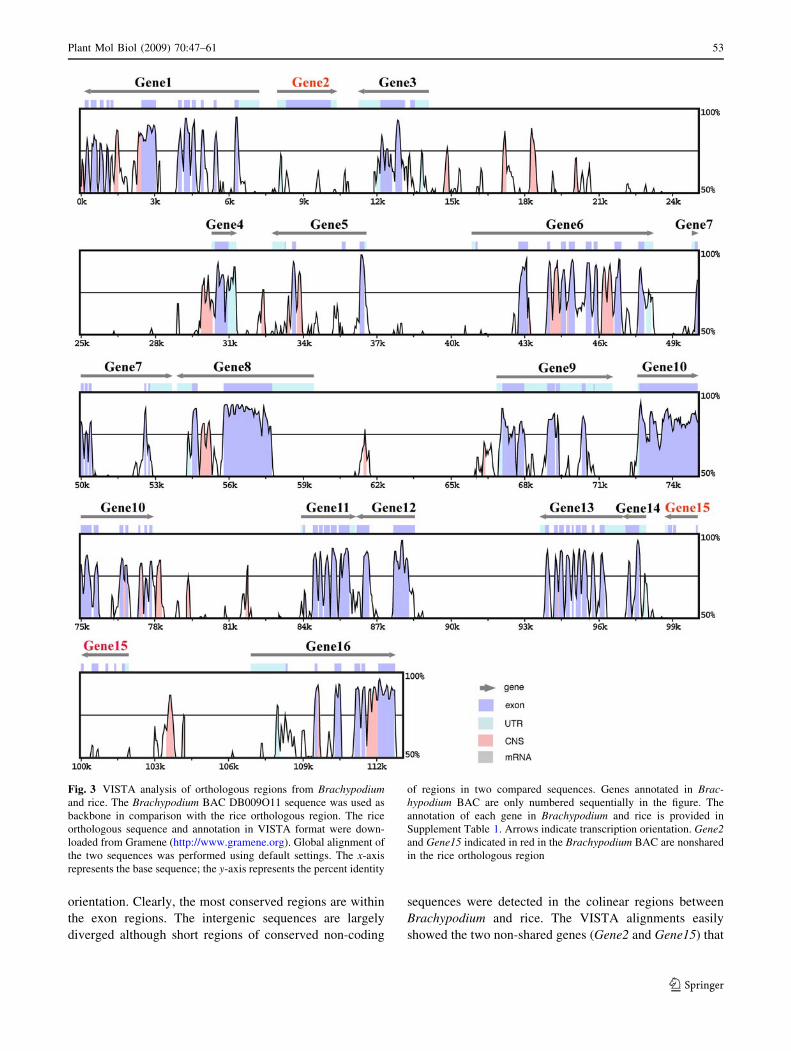
orientation. Clearly, the most conserved regions are within
the exon regions. The intergenic sequences are largely
diverged although short regions of conserved non-coding
sequences were detected in the colinear regions between
Brachypodium and rice. The VISTA alignments easily
showed the two non-shared genes (Gene2 and Gene15) that
Fig. 3 VISTA analysis of orthologous regions from Brachypodiumand rice. The Brachypodium BAC DB009O11 sequence was used as
backbone in comparison with the rice orthologous region. The rice
orthologous sequence and annotation in VISTA format were down-
loaded from Gramene (http://www.gramene.org). Global alignment of
the two sequences was performed using default settings. The x-axis
represents the base sequence; the y-axis represents the percent identity
of regions in two compared sequences. Genes annotated in Brac-hypodium BAC are only numbered sequentially in the figure. The
annotation of each gene in Brachypodium and rice is provided in
Supplement Table 1. Arrows indicate transcription orientation. Gene2and Gene15 indicated in red in the Brachypodium BAC are nonshared
in the rice orthologous region
Plant Mol Biol (2009) 70:47–61 53
123

are only present in Brachypodium (Fig. 3). The intergenic
distances are also similar in size to the orthologous region,
suggesting a generally conserved region.
The Class III BAC DB009L22 (128.8 kb) (Fig. 4b) and
Class IV BAC DB038O09 (102.4 kb) (Fig. 4c) are
orthologous to a 341.5-kb region on rice chr12 and 690-kb
region on rice chr6, respectively. As shown in Fig. 4c, the
large size difference (587.6 kb) between DB038O09 and
the orthologous rice region is primarily due to the presence
of a 426-kb fragment containing five genes in the rice
Fig. 4 Comparison of the
sequenced Brachypodium BAC
regions with the rice
orthologous regions. Sequenced
Brachypodium BAC regions and
the corresponding rice
orthologous regions are
represented by solid black lines.
Genes conserved between
Brachypodium and rice are
depicted as blue boxes. Non-
conserved genes are indicated in
red and black boxes. Black
boxes represent non-conserved
genes at the end of BAC clones.
Duplicated genes are labeled as
green boxes. Orthologous genes
in blue boxes are connected by
dotted black lines. Annotated
genes from both sequences were
numbered sequentially. The
annotation of each gene is
provided in Supplement 1 and 2.
For 4B and 4C, the yellow lines
in the middle of the rice
orthologous regions represented
non-colinear fragments. In 4C,
this region is re-drawn in scale
on the top with annotated genes
indicated. The pink box
represents a gene that is missing
in the rice genome annotation
54 Plant Mol Biol (2009) 70:47–61
123
genome. The absence of these five genes in the Brachyp-
odium region also causes disruption of microcolinearity in
the orthologous regions. Another factor causing the large
size difference is the multiple duplications of a gene
encoding UDP-glycosyltransferase, which resulted in nine
copies (Gene16 to Gene24) spanning more than 100-kb in
rice, whereas only one copy (Gene8) exists in the Brac-
hypodium region (Fig. 4c). In addition to the above major
sequence changes, there are three genes (Gene3, Gene14,
and Gene15) unique to the rice region (Fig. 4c).
The size difference between BAC DB009L22 and the
orthologous region on rice chr12 was due to a 178-kb
sequence containing three genes that was only present in
the rice region (Fig. 4b). The presence of non-colinear 178-
kb and 426-kb segments in the two orthologous rice
regions could be caused by insertion in the rice genome or
deletion in the Brachypodium genome.
Two BAC clones DH003L20 (89.3 kb) (Fig. 4d) and
DB031O07 (107.3 kb) (Fig. 4e) were selected from the
Class V category. The ends of DH003L20 matched two
rice regions separated by 2,089 kb on chr6, while the ends
of DB031O07 matched rice regions 7,032 kb apart on chr7.
In both cases, it was found that the last genes on one end of
the Brachypodium BAC clones were not present in the
colinear positions in rice, instead they matched to regions
millions of base pairs away on the same chromosome. The
remaining regions in these two BACs were mostly colinear
with the rice orthologous regions, except one Brachypo-
dium gene in each BAC was not present in the orthologous
rice regions (Supplement 1, 2).
The two ends of BAC DH037O21 (162.5 kb) (Fig. 4f)
in Class VI matched to two regions located on different rice
chromosomes. Further sequence analysis revealed that the
region containing the first 11 genes in Brachypodium was
orthologous to a 134.7-kb region on rice chr10, while the
region containing the last 13 genes is orthologous to a 86.6-
kb region on rice chr3 (Fig. 4f). Rice chr10 is colinear to
rice chr3 due to ancient duplication events (Yu et al. 2005).
Because of the differential sequence evolution in the
duplicated regions, it appears that half of Brachypodium
became more colinear with a region on rice chr3 and the
other half more colinear with the paralogous region on rice
chr10. If fact, we were unable to determine the true rice
orthologous region for BAC DH037O21. Sequence chan-
ges have also occurred in the two rice regions as compared
to the Brachypodium sequence. These include an inversion
on chr3 and duplications of a proline-rich protein gene in
two regions in rice as compared to one duplication region
in Brachypodium (Fig. 4f). Furthermore, there are seven
genes unique in the rice regions and three genes unique in
the Brachypodium region.
Among the three random BACs, 20, 9, and 6 genes were
identified in DH085B13 (138.9 kb) (Fig. 4g), DH002G02
(128.6 kb) (Fig. 4h), and DB091J02 (100.2 kb) (Fig. 4i),
respectively. When compared with the rice orthologous
regions, major sequence rearrangements were not identi-
fied, except a region containing three genes was inverted in
Brachypodium BAC DH002G2. In addition, DH085B13
contains three non-colinear genes, DB091J02 and
DH002G02 contain one non-colinear gene each (Supple-
ment 1, 2).
Analysis of non-colinear genes
Our analysis showed that a total of 17 Brachypodium genes
(out of 113 genes; 15%) are not present in the rice
orthologous regions, while 27 rice genes (out of 140 genes;
19%) are absent in the Brachypodium regions. To examine
if these non-colinear Brachypodium genes are present
somewhere else in the rice genome, we BLASTN com-
pared the non-colinear Brachypodium genes to the rice
genome database. The result showed that 15 of the 17 non-
colinear Brachypodium genes found matches in the rice
genome at a BLASTX E value less than e-10, although it is
not clear if these matches represent retrieving of the
paralogous genes (Supplement 1, 2). Only two Brachypo-
dium genes were missing from the rice genome; one gene is
homologous to a wheat prolamine and the other is a gene
fragment similar to wheat and Arabidopsis SKP1 gene.
Among the 27 genes that were not shared in Brachypodium
orthologous regions, 26 genes have significant matches in
Brachypodium genome (e-10 or lower). Only one unknown
gene LOC_Os03g26791 was missing in Brachypodium.
Thus, our results are consistent with the previous results
showing that most non-collinear genes in the maize or/and
sorghum genomes were found in the rice genome at non-
orthologous locations (Song et al. 2002; Lai et al. 2004).
Nevertheless, based on the comparative sequence analysis,
only *17% of the genes in the two genomes are not
colinear in the orthologous regions. It is worth noting that
the degree of microsynteny based on sequence comparison
in orthologous regions appeared to be different from that of
macrosynteny estimated on BES alignment to the rice
genome (Fig 1b). Although the reason causing the differ-
ence in microsynteny and macrosynteny levels is unclear,
Gaut (2002) estimated that the macrosynteny probability of
any given marker based on loss rate of syntenic gene
during genome evolution is about 50% between two grass
species with the divergence time of *50 Mya, which is
similar to the result observed in BES alignment to the rice
genome. One possible explanation for the difference in our
results could be attributable to the different analysis
methods used. Detailed comparative sequence analysis in
the orthologous regions allows identifying colinear genes
that might have been dramatically changed due to high
sequence divergence, rearrangement or partial deletion. In
Plant Mol Biol (2009) 70:47–61 55
123
our BES alignment analysis, only the top match was
counted. Therefore, the top match might be a paralogous
gene on different chromosomes if the orthologous genes
have been significantly changed, resulting in lower degree
of synteny.
Sequence comparison among Brachypodium, rice
and wheat
Several phylogenetic studies have indicated that Brachyp-
odium and the Triticeae (wheat and barley) are more
closely related to each other than to rice (Vogel et al. 2006;
Bossolini et al. 2007; Huo et al. 2007). This close rela-
tionship suggests that Brachypodium may serve as a better
model for Triticeae crop research. To evaluate the utility of
Brachypodium as a model for wheat, we first compared all
of our annotated Brachypodium genes to the wheat EST
database. For the nine individual BACs, the percentages of
genes with significant matches (E value less than e-5)
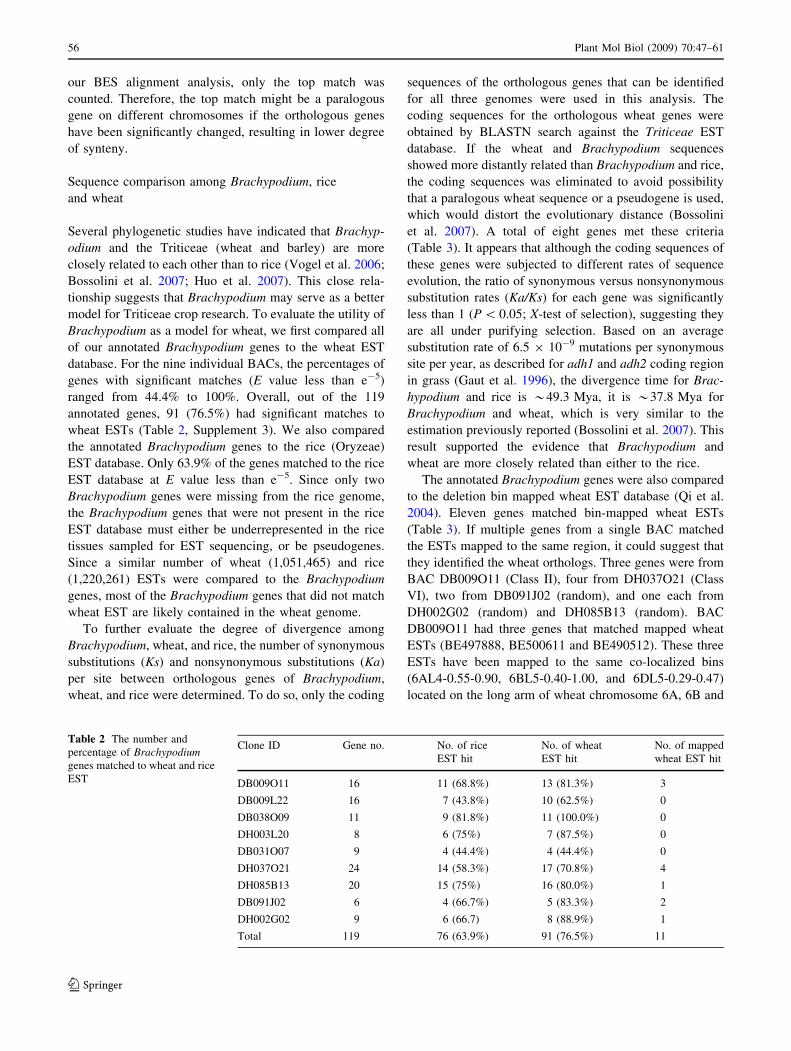
ranged from 44.4% to 100%. Overall, out of the 119
annotated genes, 91 (76.5%) had significant matches to
wheat ESTs (Table 2, Supplement 3). We also compared
the annotated Brachypodium genes to the rice (Oryzeae)
EST database. Only 63.9% of the genes matched to the rice
EST database at E value less than e-5. Since only two
Brachypodium genes were missing from the rice genome,
the Brachypodium genes that were not present in the rice
EST database must either be underrepresented in the rice
tissues sampled for EST sequencing, or be pseudogenes.
Since a similar number of wheat (1,051,465) and rice
(1,220,261) ESTs were compared to the Brachypodium
genes, most of the Brachypodium genes that did not match
wheat EST are likely contained in the wheat genome.
To further evaluate the degree of divergence among
Brachypodium, wheat, and rice, the number of synonymous
substitutions (Ks) and nonsynonymous substitutions (Ka)
per site between orthologous genes of Brachypodium,
wheat, and rice were determined. To do so, only the coding
sequences of the orthologous genes that can be identified
for all three genomes were used in this analysis. The
coding sequences for the orthologous wheat genes were
obtained by BLASTN search against the Triticeae EST
database. If the wheat and Brachypodium sequences
showed more distantly related than Brachypodium and rice,
the coding sequences was eliminated to avoid possibility
that a paralogous wheat sequence or a pseudogene is used,
which would distort the evolutionary distance (Bossolini
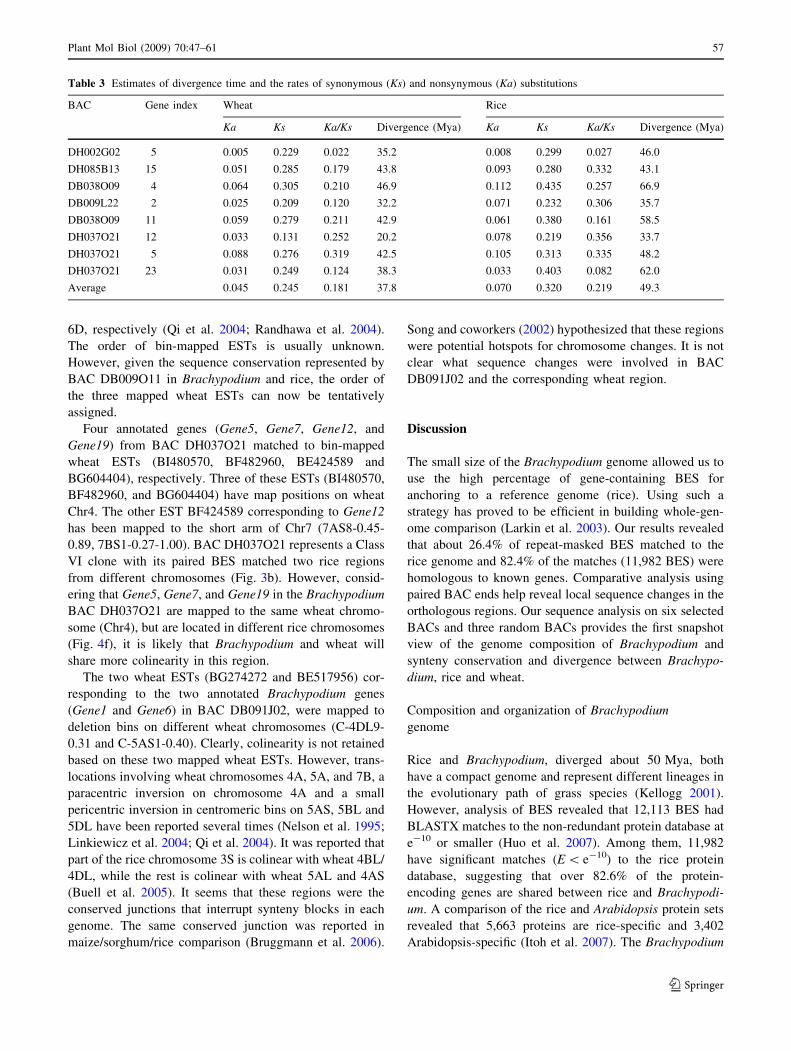
et al. 2007). A total of eight genes met these criteria
(Table 3). It appears that although the coding sequences of
these genes were subjected to different rates of sequence
evolution, the ratio of synonymous versus nonsynonymous
substitution rates (Ka/Ks) for each gene was significantly
less than 1 (P \ 0.05; X-test of selection), suggesting they
are all under purifying selection. Based on an average
substitution rate of 6.5 9 10-9 mutations per synonymous
site per year, as described for adh1 and adh2 coding region
in grass (Gaut et al. 1996), the divergence time for Brac-
hypodium and rice is *49.3 Mya, it is *37.8 Mya for
Brachypodium and wheat, which is very similar to the
estimation previously reported (Bossolini et al. 2007). This
result supported the evidence that Brachypodium and
wheat are more closely related than either to the rice.
The annotated Brachypodium genes were also compared
to the deletion bin mapped wheat EST database (Qi et al.
2004). Eleven genes matched bin-mapped wheat ESTs
(Table 3). If multiple genes from a single BAC matched
the ESTs mapped to the same region, it could suggest that
they identified the wheat orthologs. Three genes were from
BAC DB009O11 (Class II), four from DH037O21 (Class
VI), two from DB091J02 (random), and one each from
DH002G02 (random) and DH085B13 (random). BAC
DB009O11 had three genes that matched mapped wheat
ESTs (BE497888, BE500611 and BE490512). These three
ESTs have been mapped to the same co-localized bins
(6AL4-0.55-0.90, 6BL5-0.40-1.00, and 6DL5-0.29-0.47)
located on the long arm of wheat chromosome 6A, 6B and
Table 2 The number and
percentage of Brachypodiumgenes matched to wheat and rice
EST
Clone ID Gene no. No. of rice
EST hit
No. of wheat
EST hit
No. of mapped
wheat EST hit
DB009O11 16 11 (68.8%) 13 (81.3%) 3
DB009L22 16 7 (43.8%) 10 (62.5%) 0
DB038O09 11 9 (81.8%) 11 (100.0%) 0
DH003L20 8 6 (75%) 7 (87.5%) 0
DB031O07 9 4 (44.4%) 4 (44.4%) 0
DH037O21 24 14 (58.3%) 17 (70.8%) 4
DH085B13 20 15 (75%) 16 (80.0%) 1
DB091J02 6 4 (66.7%) 5 (83.3%) 2
DH002G02 9 6 (66.7) 8 (88.9%) 1
Total 119 76 (63.9%) 91 (76.5%) 11
56 Plant Mol Biol (2009) 70:47–61
123
6D, respectively (Qi et al. 2004; Randhawa et al. 2004).
The order of bin-mapped ESTs is usually unknown.
However, given the sequence conservation represented by
BAC DB009O11 in Brachypodium and rice, the order of
the three mapped wheat ESTs can now be tentatively
assigned.
Four annotated genes (Gene5, Gene7, Gene12, and
Gene19) from BAC DH037O21 matched to bin-mapped
wheat ESTs (BI480570, BF482960, BE424589 and
BG604404), respectively. Three of these ESTs (BI480570,
BF482960, and BG604404) have map positions on wheat
Chr4. The other EST BF424589 corresponding to Gene12
has been mapped to the short arm of Chr7 (7AS8-0.45-
0.89, 7BS1-0.27-1.00). BAC DH037O21 represents a Class
VI clone with its paired BES matched two rice regions
from different chromosomes (Fig. 3b). However, consid-
ering that Gene5, Gene7, and Gene19 in the Brachypodium
BAC DH037O21 are mapped to the same wheat chromo-
some (Chr4), but are located in different rice chromosomes
(Fig. 4f), it is likely that Brachypodium and wheat will
share more colinearity in this region.
The two wheat ESTs (BG274272 and BE517956) cor-
responding to the two annotated Brachypodium genes
(Gene1 and Gene6) in BAC DB091J02, were mapped to
deletion bins on different wheat chromosomes (C-4DL9-
0.31 and C-5AS1-0.40). Clearly, colinearity is not retained
based on these two mapped wheat ESTs. However, trans-
locations involving wheat chromosomes 4A, 5A, and 7B, a
paracentric inversion on chromosome 4A and a small
pericentric inversion in centromeric bins on 5AS, 5BL and
5DL have been reported several times (Nelson et al. 1995;
Linkiewicz et al. 2004; Qi et al. 2004). It was reported that
part of the rice chromosome 3S is colinear with wheat 4BL/
4DL, while the rest is colinear with wheat 5AL and 4AS
(Buell et al. 2005). It seems that these regions were the
conserved junctions that interrupt synteny blocks in each
genome. The same conserved junction was reported in
maize/sorghum/rice comparison (Bruggmann et al. 2006).
Song and coworkers (2002) hypothesized that these regions
were potential hotspots for chromosome changes. It is not
clear what sequence changes were involved in BAC
DB091J02 and the corresponding wheat region.
Discussion
The small size of the Brachypodium genome allowed us to
use the high percentage of gene-containing BES for
anchoring to a reference genome (rice). Using such a
strategy has proved to be efficient in building whole-gen-
ome comparison (Larkin et al. 2003). Our results revealed
that about 26.4% of repeat-masked BES matched to the
rice genome and 82.4% of the matches (11,982 BES) were
homologous to known genes. Comparative analysis using
paired BAC ends help reveal local sequence changes in the
orthologous regions. Our sequence analysis on six selected
BACs and three random BACs provides the first snapshot
view of the genome composition of Brachypodium and
synteny conservation and divergence between Brachypo-
dium, rice and wheat.
Composition and organization of Brachypodium
genome
Rice and Brachypodium, diverged about 50 Mya, both
have a compact genome and represent different lineages in
the evolutionary path of grass species (Kellogg 2001).
However, analysis of BES revealed that 12,113 BES had
BLASTX matches to the non-redundant protein database at
e-10 or smaller (Huo et al. 2007). Among them, 11,982
have significant matches (E \ e-10) to the rice protein
database, suggesting that over 82.6% of the protein-
encoding genes are shared between rice and Brachypodi-
um. A comparison of the rice and Arabidopsis protein sets
revealed that 5,663 proteins are rice-specific and 3,402
Arabidopsis-specific (Itoh et al. 2007). The Brachypodium
Table 3 Estimates of divergence time and the rates of synonymous (Ks) and nonsynymous (Ka) substitutions
BAC Gene index Wheat Rice
Ka Ks Ka/Ks Divergence (Mya) Ka Ks Ka/Ks Divergence (Mya)
DH002G02 5 0.005 0.229 0.022 35.2 0.008 0.299 0.027 46.0
DH085B13 15 0.051 0.285 0.179 43.8 0.093 0.280 0.332 43.1
DB038O09 4 0.064 0.305 0.210 46.9 0.112 0.435 0.257 66.9
DB009L22 2 0.025 0.209 0.120 32.2 0.071 0.232 0.306 35.7
DB038O09 11 0.059 0.279 0.211 42.9 0.061 0.380 0.161 58.5
DH037O21 12 0.033 0.131 0.252 20.2 0.078 0.219 0.356 33.7
DH037O21 5 0.088 0.276 0.319 42.5 0.105 0.313 0.335 48.2
DH037O21 23 0.031 0.249 0.124 38.3 0.033 0.403 0.082 62.0
Average 0.045 0.245 0.181 37.8 0.070 0.320 0.219 49.3
Plant Mol Biol (2009) 70:47–61 57
123
genome will allow us to determine which rice-specific
genes are shared with Brachypodium and therefore, how
many of these genes are monocot-specific genes.
Our analysis using paired BES was useful in identifying
genomic regions that may have been subjected to consid-
erable evolutionary changes. A sequence comparison of
nine Brachypodium BACs to the orthologous rice regions
identified specific sequence changes that have reshaped the
orthologous regions of Brachypodium and rice. These
sequence changes further validated the BES analysis
results, suggesting that aligning the BES to a related,
sequenced genome is an effective method to identify
divergent regions. Comparative syntenic maps among grass
species often only reveal large regions that are conserved
on the basis of gene content and order with less emphasis
on individual non-colinear genes. Our result showed that
15% of Brachypodium genes may fail to find their rice
orthologs in the colinear rice regions and that 19% of rice
genes are absent from the colinear positions in Brachypo-
dium. Among the non-colinear genes, over 90% had at least
one match in another part of the rice genome. However, it
is difficult to determine if these genes moved to different
locations or were lost in a genome-specific manner due to
the presence of paralogous copies in the genome. In maize,
at least 50% of the duplicated genes have been lost over a
short period of time (Lai et al. 2004). Despite the consid-
erable loss of duplicated genes, transposon-mediated gene
movements have also been observed (Lal et al. 2003; Jiang
et al. 2004; Lai et al. 2005), however, the importance of
gene movements to the decay microcolinearity is not
clearly understood.
The small genome of diploid Brachypodium is one of
the important characteristics that make it an ideal model for
large-genome grass species. The authoritative c value
estimate of diploid Brachypodium is 0.36–0.39 (Bennett
and Leitch 2005), and five different diploid accessions of
Brachypodium have been identified with comparable c
value (Vogel et al. 2006). Comparison to rice, with a c
value of 0.51 pg (Bennett and Leitch 2005) and an accurate
genome size of 389 Mb as determined by map-based
sequencing (IRGSP 2005), yields an estimated genome size
between 300 and 320 Mb for diploid Brachypodium. Our
study further supports that the genome size of diploid
Brachypodium is considerably smaller than that of rice.
The repetitive DNA content observed in BES and the BAC
sequences indicate that Brachypodium has less than 20%
repetitive DNA, less than the rice genome (35%) (IRGSP
2005). The gene density observed in our Brachypodium
BACs (*9.0 kb/gene) was higher than the gene density
(*14 kb/gene) in the orthologous rice regions. Assuming
that rice and Brachypodium have the same number of genes
(estimated 32,000), the estimated genome size of Brac-
hypodium would be slightly less than 300 Mb, much
smaller than the recent estimation of 389 Mb for the rice
genome (IRGSP 2005). A much better estimate of the
Brachypodium genome size will be made after completion
of the draft genome sequence (www.jgi.doe.gov). Genome
size can vary considerably, even within the same genus.
For example, two diploid Oryza species (Oryza sativa and
Oryza australiensus) have genome size that differs by 2.7-
fold (*390 Mb and *975 Mb respectively). This larger
size of Oryza australiensus genome is largely due to the
rapid amplification of three LTR-retrotransposon families
(Piegu et al. 2006). Thus, it is worth noting that Brachyp-
odium sylvaticum, a perennial species, has an estimated
genome size of 470 Mb (Foote et al. 2004), which is
considerably larger than B. distachyon genome. Previous
comparative sequence studies among wheat, rice, and
Brachypodium were conducted using the Brachypodium
sylvaticum sequence (Griffiths et al. 2006; Bossolini et al.
2007; Faris et al. 2008). In both Q gene and Lr34 resistance
gene-containing regions, it was found that intergenic dis-
tances among colinear genes between B. sylvaticum and
rice were generally larger in B. sylvaticum (Bossolini et al.
2007; Faris et al. 2008), suggesting it has a larger genome
than that of rice. The result presented here indicates that
B. distachyon has smaller intergenic regions and higher
gene density than rice due largely to lower repetitive DNA
content.
Comparative genomics improve genome annotation
Comparative genomics can complement other annotation
methods (e.g. gene-finding program, BLAST search etc.)
and help to provide a more accurate annotation (Katari et al.
2005). Comparative genomics aids discovery and annotation
of gene structures and other functionally important
sequences in both genomes. About 17% of predicted genes
in both Arabidopsis (Katari et al. 2005) and rice (http://
www.tigr.org/tdb/e2k1/osa1/riceInfo/info.shtml) were anno-
tated hypothetical genes. Some of these hypothetical genes
are artifacts of the annotation algorithms (Das et al. 1997).
Therefore, validating hypothetical genes will greatly improve
the precision of genome annotation. Katari and coworkers
(2005) have confirmed 43 out of 110 Arabidopsis hypothet-
ical proteins on the short arm of chromosome 4 by RT-PCR.
They found that 46% of the hypothetical genes conserved in
Brassica were expressed, whereas only 6% of the noncon-
served hypothetical genes were expressed in Arabidopsis.
They also pointed out that Brassica is more useful than rice in
improving the annotation of the Arabidopsis genome because
they are in the same family. The recent rice annotation project
has identified that most previously annotated rice-specific
proteins were hypothetical proteins (Itoh et al. 2007). The
sequence of Brachypodium, along with the genome sequences
from other grass species such as Sorghum, will help to verify
58 Plant Mol Biol (2009) 70:47–61
123
these hypothetical genes in the rice genome. In this study, we
identified 14 hypothetical proteins that were conserved in
Brachypodium and rice. Among these fourteen genes, three
(21.4%) had no homolog in Arabidopsis. On the other hand,
Bossolini and coworkers (2007) have found that the per-
centage of the conserved genes increased when they
re-annotated the rice region orthologous to wheat Lr34 locus
region. They concluded that the apparent degree of conser-
vation or colinearity of two compared genomes depends, in
part, on the correct annotation of the compared sequence. In
this study, 75 nonshared rice genes were removed as they
matched TE or no Arabidopsis protein hit. We also observed
the increasing percentage of the conserved genes between the
two genomes.
Potential utility of Brachypodium for wheat genomics
Brachypodium has been proposed as a new model for the
large-genome temperate grass crops because of its numerous
desirable attributes, including a close relationship with
Triticeae species. Several studies have shown that the rela-
tionship between Brachypodium and wheat is much closer
than rice and wheat (Draper et al. 2001; Griffiths et al. 2006;
Vogel et al. 2006; Bossolini et al. 2007; Huo et al. 2007).
However, can Brachypodium really serve as a model for
wheat? Bossolini et al. (2007) have doubted this because
they found that only two-thirds of the genes from five wheat
BACs on Lr34 locus were colinear with Brachypodium and
relatively lower in gene density than that in the rice orthol-
ogous region. Conversely, Griffiths et al. (2006) in the
course of mapping the wheat Ph1 candidate gene found that
wheat and Brachypodium are more conserved, and that
markers derived from Brachypodium sequences gave clear
southern hybridization signals in wheat whereas markers
made from rice sequence often failed.
We found that *77% of Brachypodium genes have
strong Triticeae EST matches (Table 2), and when matches
were identified in wheat and rice EST databases, a higher
matching score and lower E value to a wheat EST was
usually found. These results suggest that Brachypodium
sequences would be more useful for developing cross-
species markers than the rice sequences. One potential
strategy to improve wheat mapping is to identify wheat
ESTs based on the annotation of colinear Brachypodium
regions and to assess if they can be mapped onto the cor-
responding wheat genetic regions, thereby increasing the
marker density. Furthermore, although 20% of the anno-
tated Brachypodium genes have no matches in the Triticeae
EST database, we can still confirm their genetic/physical
locations in the wheat genome by directly using Brachyp-
odium markers as has been demonstrated in the fine
mapping of the complex Ph1 locus region in wheat (Grif-
fiths et al. 2006).
The ideal model for wheat should share perfect mi-
crocolinearity with regard to gene content and order within
a much compact genome. A few studies have shown the
violation of microcolinearity between Brachypodium,
wheat, and rice at local genomic regions. We can expect
that the level of colinearity will not be homogenous along
the chromosomes. For example, many resistance gene
homologs are clustered in plant genome, and regions
containing clusters of disease resistance sequences evolve
more rapidly due to the frequent sequence exchanges than
other regions containing house-keeping genes (Michelmore
and Meyers 1998; Hulbert et al. 2001). Our result also
indicated the translocation events specific in several wheat
chromosome regions could have resulted in the disruption
of colinearity between Brachypodium and wheat. The
extent that Brachypodium can serve as a model species for
genomics research on large genome grasses such as wheat
is still unknown. Comparative analysis using the complete
sequence of Brachypodium genome in the near future will
provide an unprecedented view regarding the evolution of
the grass genomes.
Acknowledgements The authors thank Roger Thilmony and Wil-
liam Belknap for the critical reading of this manuscript. This work
was supported in part by the United State Department of Agriculture,
Agriculture Research Service CRIS 532502100-000 532502100-011,
and 532521000-13.
Open Access This article is distributed under the terms of the
Creative Commons Attribution Noncommercial License which per-
mits any noncommercial use, distribution, and reproduction in any
medium, provided the original author(s) and source are credited.
References
Beckmann M, Parker D, Enot DP, Duval E, Draper J (2008) High-
throughput, nontargeted, metabolite fingerprinting using nominal
mass flow injection electrophospray mass spectrometry. Nat
Protocols 3:486–504. doi:10.1038/nprot.2007.500
Bennett MD, Leitch IJ (2005) Nuclear DNA amounts in angiosperms:
progress, problems and prospects. Ann Bot (Lond) 95:45–90.
doi:10.1093/aob/mci003
Bennetzen JL, Coleman C, Liu R, Ma J, Ramakrishna W (2004)
Consistent over-estimation of gene number in complex plant
genomes. Curr Opin Plant Biol 7:732–736. doi:10.1016/j.pbi.
2004.09.003
Bossolini E, Wicker T, Knobel PA, Keller B (2007) Comparison of
orthologous loci from small grass genomes Brachypodium and
rice: implications for wheat genomics and grass genome
annotation. Plant J 49:704–717. doi:10.1111/j.1365-313X.2006.
02991.x
Bruggmann R, Bharti AK, Gundlach H, Lai J, Young S, Pontaroli AC,
Wei F, Haberer G, Fuks G, Du C et al (2006) Uneven
chromosome contraction and expansion in the maize genome.
Genome Res 16:1241–1251. doi:10.1101/gr.5338906
Plant Mol Biol (2009) 70:47–61 59
123
Buell CR, Yuan Q, Ouyang S, Liu J, Zhu W, Wang A, Maiti R, Haas B,
Wortman J, Pertea M et al (2005) Sequence, annotation, and
analysis of synteny between rice chromosome 3 and diverged grass
species. Genome Res 15:1284–1291. doi:10.1101/gr.3869505
Das S, Yu L, Gaitatzes C, Rogers R, Freeman J, Bienkowska J,
Adams RM, Smith TF, Lindelien J (1997) Biology’s new Rosetta
stone. Nature 385:29–30. doi:10.1038/385029a0
Devos KM, Ma J, Pontaroli AC, Pratt LH, Bennetzen JL (2005)
Analysis and mapping of randomly chosen bacterial artificial
chromosome clones from hexaploid bread wheat. Proc Natl Acad
Sci USA 102:19243–19248. doi:10.1073/pnas.0509473102
Draper J, Mur LA, Jenkins G, Ghosh-Biswas GC, Bablak P, Hasterok
R, Routledge AP (2001) Brachypodium distachyon. A new
model system for functional genomics in grasses. Plant Physiol
127:1539–1555. doi:10.1104/pp.010196
Faris JD, Zhang Z, Fellers JP, Gill BS (2008) Micro-colinearity
between rice, Brachypodium, and Triticum monococcum at the
wheat domestication locus Q. Funct Integr Genomics 8:149–164.
doi:10.1007/s10142-008-0073-z
Foote TN, Griffiths S, Allouis S, Moore G (2004) Construction and
analysis of a BAC library in the grass Brachypodium sylvaticum:
its use as a tool to bridge the gap between rice and wheat in
elucidating gene content. Funct Integr Genomics 4:26–33. doi:
10.1007/s10142-003-0101-y
Fu H, Zheng Z, Dooner HK (2002) Recombination rates between
adjacent genic and retrotransposon regions in maize vary by 2
orders of magnitude. Proc Natl Acad Sci USA 99:1082–1087
Gale MD, Devos KM (1998) Comparative genetics in the grasses. Proc
Natl Acad Sci USA 95:1971–1974. doi:10.1073/pnas.95.5.1971
Garvin DF, Gu YQ, Hasterok R, Hazen SP, Jenkins G, Mockler TC,
Mur LAJ, Vogel JP (2008) Development of genetic and genomic
research resources for Brachypodium distachyon, a new model
system for grass crop research. Crop Sci 48:S69–S84. doi:
10.2135/cropsci2007.06.0332tpg
Gaut BS (2002) Evolutionary dynamics of grass genomes. New
Phytol 154:15–28. doi:10.1046/j.1469-8137.2002.00352.x
Gaut BS, Morton BR, McCaig BC, Clegg MT (1996) Substitution rate
comparisons between grasses and palms: synonymous rat
different at the nuclear gene Adh parallel rate differences at
the plastid gene rbcL. Proc Natl Acad Sci USA 93:10274–10279.
doi:10.1073/pnas.93.19.10274
Goff SA (1999) Rice as a model for cereal genomics. Curr Opin Plant
Biol 2:86–89. doi:10.1016/S1369-5266(99)80018-1
Goff SA, Ricke D, Lan TH, Presting G, Wang R, Dunn M,
Glazebrook J, Sessions A, Oeller P, Varma H et al (2002) A
draft sequence of the rice genome (Oryza sativa L. ssp.
japonica). Science 296:92–100. doi:10.1126/science.1068275
Griffiths S, Sharp R, Foote TN, Bertin I, Wanous M, Reader S, Colas
I, Moore G (2006) Molecular characterization of Ph1 as a major
chromosome pairing locus in polyploid wheat. Nature 439:749–
752. doi:10.1038/nature04434
Gu YQ, Anderson OD, Londeore CF, Kong X, Chibbar RN, Lazo GR
(2003) Structural organization of the barley D-hordein locus in
comparison with its orthologous regions of wheat genomes.
Genome 46:1084–1097. doi:10.1139/g03-071
Hulbert SH, Webb CA, Smith SM, Sun Q (2001) Resistance gene
complexes: evolution and utilization. Annu Rev Phytopathol
39:285–312. doi:10.1146/annurev.phyto.39.1.285
Huo N, Lazo GR, Vogel JP, You FM, Ma Y, Hayden DM, Coleman-
Derr D, Hill TA, Dvorak J, Anderson OD, Gu YQ (2007) The
nuclear genome of Brachypodium distachyon: analysis of BAC
end sequences. Funct Integr Genomics 8:135–147
Idziak D, Hasterok P (2008) Cytogenetic evidence of nucleolar
dominance in allotetraploid species of Brachypodium. Genome
51:387–391. doi:10.1139/G08-017
IRGSP (2005) The map-based sequence of the rice genome. Nature
436:793–800. doi:10.1038/nature03895
Itoh T, Tanaka T, Barrero RA, Yamasaki C, Fujii Y, Hilton PB,
Antonio BA, Aono H, Apweiler R, Bruskiewich R et al (2007)
Curated genome annotation of Oryza sativa ssp. japonica and
comparative genome analysis with Arabidopsis thaliana. Gen-
ome Res 17:175–183. doi:10.1101/gr.5509507
Jiang N, Bao Z, Zhang X, Eddy SR, Wessler SR (2004) Pack-MULE
transposable elements mediate gene evolution in plants. Nature
431:569–573. doi:10.1038/nature02953
Katari MS, Balija V, Wilson RK, Martienssen RA, McCombie WR
(2005) Comparing low coverage random shotgun sequence data
from Brassica oleracea and Oryza sativa genome sequence for
their ability to add to the annotation of Arabidopsis thaliana.
Genome Res 15:496–504. doi:10.1101/gr.3239105
Kazazian HH Jr (2004) Mobile elements: drivers of genome evolution.
Science 303:1626–1632. doi:10.1126/science.1089670
Keller B, Feuillet C (2000) Colinearity and gene density in grass
genomes. Trends Plant Sci 5:246–251. doi:10.1016/S1360-
1385(00)01629-0
Kellogg EA (2001) Evolutionary history of the grasses. Plant Physiol
125:1198–1205. doi:10.1104/pp.125.3.1198
Lai J, Ma J, Swigonova Z, Ramakrishna W, Linton E, Llaca V,
Tanyolac B, Park YJ, Jeong OY, Bennetzen JL, Messing J
(2004) Gene loss and movement in the maize genome. Genome
Res 14:1924–1931. doi:10.1101/gr.2701104
Lai J, Li Y, Messing J, Dooner HK (2005) Gene movement by
Helitron transposons contributes to the haplotype variability of
maize. Proc Natl Acad Sci USA 102:9068–9073. doi:10.1073/
pnas.0502923102
Lal SK, Giroux MJ, Brendel V, Vallejos CE, Hannah LC (2003) The
maize genome contains a helitron insertion. Plant Cell 15:381–
391. doi:10.1105/tpc.008375
Larkin DM, Everts-van der Wind A, Rebeiz M, Schweitzer PA,
Bachman S, Green C, Wright CL, Campos EJ, Benson LD,
Edwards J et al (2003) A cattle-human comparative map built
with cattle BAC-ends and human genome sequence. Genome
Res 13:1966–1972
Li W, Zhang P, Fellers JP, Friebe B, Gill BS (2004) Sequence
composition, organization, and evolution of the core Triticeaegenome. Plant J 40:500–511. doi:10.1111/j.1365-313X.
2004.02228.x
Li X, Weng LK, Chapple C (2008) Improvement of biomass through
lignin modification. Plant J 54:568–581. doi:10.1111/j.1365-
313X.2008.03457.x
Ling HQ, Zhu Y, Keller B (2003) High-resolution mapping of the leaf
rust disease resistance gene Lr1 in wheat and characterization of
BAC clones from the Lr1 locus. Theor Appl Genet 106:875–882
Linkiewicz AM, Qi LL, Gill BS, Ratnasiri A, Echalier B, Chao S,
Lazo GR, Hummel DD, Anderson OD, Akhunov ED et al (2004)
A 2500-locus bin map of wheat homoeologous group 5 provides
insights on gene distribution and colinearity with rice. Genetics
168:665–676. doi:10.1534/genetics.104.034835
Ma J, Bennetzen JL (2004) Rapid recent growth and divergence of
rice nuclear genomes. Proc Natl Acad Sci USA 101:12404–
12410. doi:10.1073/pnas.0403715101
Ma J, Devos KM, Bennetzen JL (2004) Analyses of LTR-retrotrans-
poson structures reveal recent and rapid genomic DNA loss in
rice. Genome Res 14:860–869. doi:10.1101/gr.1466204
Ma J, SanMiguel P, Lai J, Messing J, Bennetzen JL (2005) DNA
rearrangement in orthologous orp regions of the maize, rice and
sorghum genomes. Genetics 170:1209–1220. doi:10.1534/
genetics.105.040915
Mayor C, Brudno M, Schwartz JR, Poliakov A, Rubin EM, Frazer
KA, Pachter LS, Dubchak I (2000) VISTA: visualizing global
60 Plant Mol Biol (2009) 70:47–61
123
DNA sequence alignments of arbitrary length. Bioinformatics
16:1046–1047. doi:10.1093/bioinformatics/16.11.1046
Messing J, Bharti AK, Karlowski WM, Gundlach H, Kim HR, Yu Y,
Wei F, Fuks G, Soderlund CA, Mayer KF, Wing RA (2004)
Sequence composition and genome organization of maize. Proc
Natl Acad Sci USA 101:14349–14354. doi:10.1073/pnas.04
06163101
Meyers BC, Tingey SV, Morgante M (2001) Abundance, distribution,
and transcriptional activity of repetitive elements in the maize
genome. Genome Res 11:1660–1676. doi:10.1101/gr.188201
Michelmore RW, Meyers BC (1998) Clusters of resistance genes in
plants evolve by divergent selection and a birth-and-death
process. Genome Res 8:1113–1130
Moore G, Devos KM, Wang Z, Gale MD (1995) Cereal genome
evolution. Grasses, line up and form a circle. Curr Biol 5:737–
739. doi:10.1016/S0960-9822(95)00148-5
Nelson JC, Sorrells ME, Van Deynze AE, Lu YH, Atkinson M,
Bernard M, Leroy P, Faris JD, Anderson JA (1995) Molecular
mapping of wheat: major genes and rearrangements in homo-
eologous groups 4, 5, and 7. Genetics 141:721–731
Opanowicz M, Vain P, Draper J, Parker D, Doonan JH (2008)
Brachypodium distachyon: making hay with a wild grass. Trends
Plant Sci 13:172–177. doi:10.1016/j.tplants.2008.01.007
Ozdemir BS, Hernandez P, Filiz E, Budak H (2008) Brachypodium
genomics. Int J Plant Genomics 2008:536104
Parker D, Beckmann M, Enot DP, Overy DP, Rios ZC, Gilbert M, Talbot
N, Draper J (2008) Rice blast infection of Brachypodium distachyonas a model system to study dynamic host/pathogen interactions. Nat
Protocols 3:435–445. doi:10.1038/nprot.2007.499
Paux E, Roger D, Badaeva E, Gay G, Bernard M, Sourdille P, Feuillet
C (2006) Characterizing the composition and evolution of
homoeologous genomes in hexaploid wheat through BAC-end
sequencing on chromosome 3B. Plant J 48:463–474. doi:
10.1111/j.1365-313X.2006.02891.x
Piegu B, Guyot R, Picault N, Roulin A, Saniyal A, Kim H, Collura K,
Brar DS, Jackson S, Wing RA, Panaud O (2006) Doubling
genome size without polyploidization: dynamics of retrotrans-
position-driven genomic expansions in Oryza australiensis, a
wild relative of rice. Genome Res 16:1262–1269. doi:10.1101/
gr.5290206
Qi LL, Echalier B, Chao S, Lazo GR, Butler GE, Anderson OD,
Akhunov ED, Dvorak J, Linkiewicz AM, Ratnasiri A et al (2004)
A chromosome bin map of 16, 000 expressed sequence tag loci and
distribution of genes among the three genomes of polyploid wheat.
Genetics 168:701–712. doi:10.1534/genetics.104.034868
Randhawa HS, Dilbirligi M, Sidhu D, Erayman M, Sandhu D,
Bondareva S, Chao S, Lazo GR, Anderson OD, Miftahudin et al
(2004) Deletion mapping of homoeologous group 6-specific
wheat expressed sequence tags. Genetics 168:677–686. doi:
10.1534/genetics.104.034843
Salse J, Bolot S, Throude M, Jouffe V, Piegu B, Quraishi UM,
Calcagno T, Cooke R, Delseny M, Feuillet C (2008) Identifi-
cation and characterization of shared duplications between rice
and wheat provide new insight into grass genome evolution.
Plant Cell 20:11–24. doi:10.1105/tpc.107.056309
SanMiguel P, Tikhonov A, Jin YK, Motchoulskaia N, Zakharov D,
Melake-Berhan A, Springer PS, Edwards KJ, Lee M, Avramova
Z, Bennetzen JL (1996) Nested retrotransposons in the intergenic
regions of the maize genome. Science 274:765–768. doi:
10.1126/science.274.5288.765
Shimamoto K, Kyozuka J (2002) Rice as a model for comparative
genomics of plants. Annu Rev Plant Biol 53:399–419. doi:
10.1146/annurev.arplant.53.092401.134447
Song R, Llaca V, Messing J (2002) Mosaic organization of
orthologous sequences in grass genomes. Genome Res
12:1549–1555. doi:10.1101/gr.268302
Sorrells ME, La Rota M, Bermudez-Kandianis CE, Greene RA,
Kantety R, Munkvold JD, Miftahudin MA, Ma X, Gustafson PJ
et al (2003) Comparative DNA sequence analysis of wheat and
rice genomes. Genome Res 13:1818–1827
Spielmeyer W, Singh RP, McFadden H, Wellings CR, Huerta-Espino
J, Kong X, Appels R, Lagudah ES (2008) Fine scale genetic and
physical mapping using interstitial deletion mutants of Lr34/
Yr18: a disease resistance locus effective against multiple
pathogens in wheat. Theor Appl Genet 116:481–490. doi:
10.1007/s00122-007-0684-0
Vicient CM, Suoniemi A, Anamthawat-Jonsson K, Tanskanen J,
Beharav A, Nevo E, Schulman AH (1999) Retrotransposon
BARE-1 and its role in genome evolution in the genus Hordeum.
Plant Cell 11:1769–1784
Vogel JP, Gu YQ, Twigg P, Lazo GR, Laudencia-Chingcuanco D,
Hayden DM, Donze TJ, Vivian LA, Stamova B, Coleman-Derr
D (2006) EST sequencing and phylogenetic analysis of the
model grass Brachypodium distachyon. Theor Appl Genet
113:186–195. doi:10.1007/s00122-006-0285-3
Wei F, Coe E, Nelson W, Bharti AK, Engler F, Butler E, Kim H,
Goicoechea JL, Chen M, Lee S, Fuks G et al (2007) Physical and
genetic structure of the maize genome reflects its complex
evolutionary history. PLoS Genet 3:e123. doi:10.1371/
journal.pgen.0030123
Wu J, Maehara T, Shimokawa T, Yamamoto S, Harada C, Takazaki Y,
Ono N, Mukai Y, Koike K, Yazaki J et al (2002) A comprehensive
rice transcript map containing 6591 expressed sequence tag sites.
Plant Cell 14:525–535. doi:10.1105/tpc.010274
Yan L, Loukoianov A, Blechl A, Tranquilli G, Ramakrishna W,
SanMiguel P, Bennetzen JL, Echenique V, Dubcovsky J (2004)
The wheat VRN2 gene is a flowering repressor down-regulated
by vernalization. Science 303:1640–1644. doi:10.1126/science.
1094305
Yan L, Fu D, Li C, Blechl A, Tranquilli G, Bonafede M, Sanchez A,
Valarik M, Yasuda S, Dubcovsky J (2006) The wheat and barley
vernalization gene VRN3 is an orthologue of FT. Proc Natl Acad
Sci USA 103:19581–19586. doi:10.1073/pnas.0607142103
Yu J, Wang J, Lin W, Li S, Li H, Zhou J, Ni P, Dong W, Hu S, Zeng
C et al (2005) The genomes of Oryza sativa: a history of
duplications. PLoS Biol 3:e38. doi:10.1371/journal.pbio.
0030038
Zhao S, Shatsman S, Ayodeji B, Geer K, Tsegaye G, Krol M,
Gebregeorgis E, Shvartsbeyn A, Russell D, Overton L et al
(2001) Mouse BAC ends quality assessment and sequence
analyses. Genome Res 11:1736–1745. doi:10.1101/gr.179201
Zhao S, Shetty J, Hou L, Delcher A, Zhu B, Osoegawa K, de Jong P,
Nierman WC, Strausberg RL, Fraser CM (2004) Human, mouse,
and rat genome large-scale rearrangements: stability versus
speciation. Genome Res 14:1851–1860. doi:10.1101/gr.2663304
Plant Mol Biol (2009) 70:47–61 61
123