Isolation and characterization of wheat-rye recombinants involving chromosome arm 1DS of wheat
Upload
independentCategory
view
0download
0
BioMed CentralBMC Genomics
ss
Open AcceResearch articleA BAC-based physical map of Brachypodium distachyon and its comparative analysis with rice and wheatYong Q Gu1, Yaqin Ma2, Naxin Huo1,2, John P Vogel1, Frank M You1,2, Gerard R Lazo1, William M Nelson3, Carol Soderlund3, Jan Dvorak2, Olin D Anderson1 and Ming-Cheng Luo*2Address: 1Genomics and Gene Discovery Research Unit, USDA-ARS, Western Regional Research Center, 800 Buchanan Street, Albany, CA 94710, USA, 2Department of Plant Sciences, University of California, Davis, CA 95616, USA and 3BIO5 Institute, University of Arizona, Tucson, AZ 85721, USA
Email: Yong Q Gu - [email protected]; Yaqin Ma - [email protected]; Naxin Huo - [email protected]; John P Vogel - [email protected]; Frank M You - [email protected]; Gerard R Lazo - [email protected]; William M Nelson - [email protected]; Carol Soderlund - [email protected]; Jan Dvorak - [email protected]; Olin D Anderson - [email protected]; Ming-Cheng Luo* - [email protected]
* Corresponding author
AbstractBackground: Brachypodium distachyon (Brachypodium) has been recognized as a new model speciesfor comparative and functional genomics of cereal and bioenergy crops because it possesses manybiological attributes desirable in a model, such as a small genome size, short stature, self-pollinatinghabit, and short generation cycle. To maximize the utility of Brachypodium as a model for basic andapplied research it is necessary to develop genomic resources for it. A BAC-based physical map isone of them. A physical map will facilitate analysis of genome structure, comparative genomics, andassembly of the entire genome sequence.
Results: A total of 67,151 Brachypodium BAC clones were fingerprinted with the SNaPshot HICFfingerprinting method and a genome-wide physical map of the Brachypodium genome wasconstructed. The map consisted of 671 contigs and 2,161 clones remained as singletons. Thecontigs and singletons spanned 414 Mb. A total of 13,970 gene-related sequences were detected inthe BAC end sequences (BES). These gene tags aligned 345 contigs with 336 Mb of rice genomesequence, showing that Brachypodium and rice genomes are generally highly colinear. Divergentregions were mainly in the rice centromeric regions. A dot-plot of Brachypodium contigs against therice genome sequences revealed remnants of the whole-genome duplication caused bypaleotetraploidy, which were previously found in rice and sorghum. Brachypodium contigs wereanchored to the wheat deletion bin maps with the BES gene-tags, opening the door toBrachypodium-Triticeae comparative genomics.
Conclusion: The construction of the Brachypodium physical map, and its comparison with the ricegenome sequence demonstrated the utility of the SNaPshot-HICF method in the construction ofBAC-based physical maps. The map represents an important genomic resource for the completionof Brachypodium genome sequence and grass comparative genomics. A draft of the physical map andits comparisons with rice and wheat are available at http://phymap.ucdavis.edu/brachypodium/.
Published: 27 October 2009
BMC Genomics 2009, 10:496 doi:10.1186/1471-2164-10-496
Received: 28 April 2009Accepted: 27 October 2009
This article is available from: http://www.biomedcentral.com/1471-2164/10/496
© 2009 Gu et al; licensee BioMed Central Ltd. This is an Open Access article distributed under the terms of the Creative Commons Attribution License (http://creativecommons.org/licenses/by/2.0), which permits unrestricted use, distribution, and reproduction in any medium, provided the original work is properly cited.
Page 1 of 13(page number not for citation purposes)
BMC Genomics 2009, 10:496 http://www.biomedcentral.com/1471-2164/10/496
BackgroundModel systems play an important role in studies ofgenome structure and evolution, and are invaluable ingene isolation and functional characterization. The appli-cation of model systems toward the study of both basicand applied problems in plant biology has become rou-tine. The model dicot Arabidopsis thaliana has been used instudies ranging from nutrient uptake and metabolism toplant-pathogen interactions. Unfortunately, due to its dis-tant relationship to monocots, Arabidopsis is not an idealmodel for grasses. Rice is being currently used as a grassmodel [1], but its primary adaptation to semi-aquatic,subtropical environments limits its usefulness. The largesizes of rice plants and long generation time make experi-ments requiring large numbers of plants grown undercontrolled conditions costly. It is also challenging to growrice under the conditions prevailing in greenhouses innorthern climates.
Brachypodium distachyon has numerous attributes expectedto find in a genetic model and interest in using it as amodel system for wheat and other temperate grasses isgrowing rapidly [2-8]. Diploid B. distachyon is closelyrelated to the Triticeae [9,10] but in contrast to the Trit-iceae, it possesses a very small genome (x = 5) of approxi-mately 355 Mb [9,11]. The recent release of 8× B.distachyon genome sequence showed that the genome is271 Mb in size (assembled sequences, http://www.brachypodium.org). It is a small temperate grass with simplegrowth requirements, short generation time, and self-pol-linating habit [2,6,7,9]. Highly efficient transformation ofB. distachyon via Agrobacterium tumefaciens has been devel-oped, which will facilitate its functional genomics andbiotechnological applications [12-14]. These characteris-tics make B. distachyon superbly suitable for both func-tional and comparative genomic research.
Several genomic regions of B. distachyon and B. sylvaticum,a close relative of B. distachyon with a larger genome, havebeen compared with wheat and rice. In general, goodcolinearity was observed reflecting general conservationof synteny across the grass family [15-19]. To foster thedevelopment of B. distachyon as a grass model and coordi-nate the development of its genomics resources, the Inter-national Brachypodium Initiative was formed http://www.brachypodium.org. The Initiative placed a high pri-ority on the development of a global physical map of dip-loid B. distachyon composed of large genomic fragmentscloned in a bacterial artificial chromosome vector (BAC)http://www.brachypodium.org/node/8. A high resolutionBAC-based physical map has many genomics applicationsincluding analyzing genome structure, conductinggenome-wide comparisons, and facilitating the assemblyof B. distachyon genome sequence.
The development of a Brachypodium BAC-based physicalmap is reported here. Also reported is a global comparisonof the map with rice genome sequence [1] and wheat dele-tion bin maps [20] with the goal to obtain a clearer pictureof B. distachyon genome structure and evolutionary historyand their relationships to those of rice and wheat.
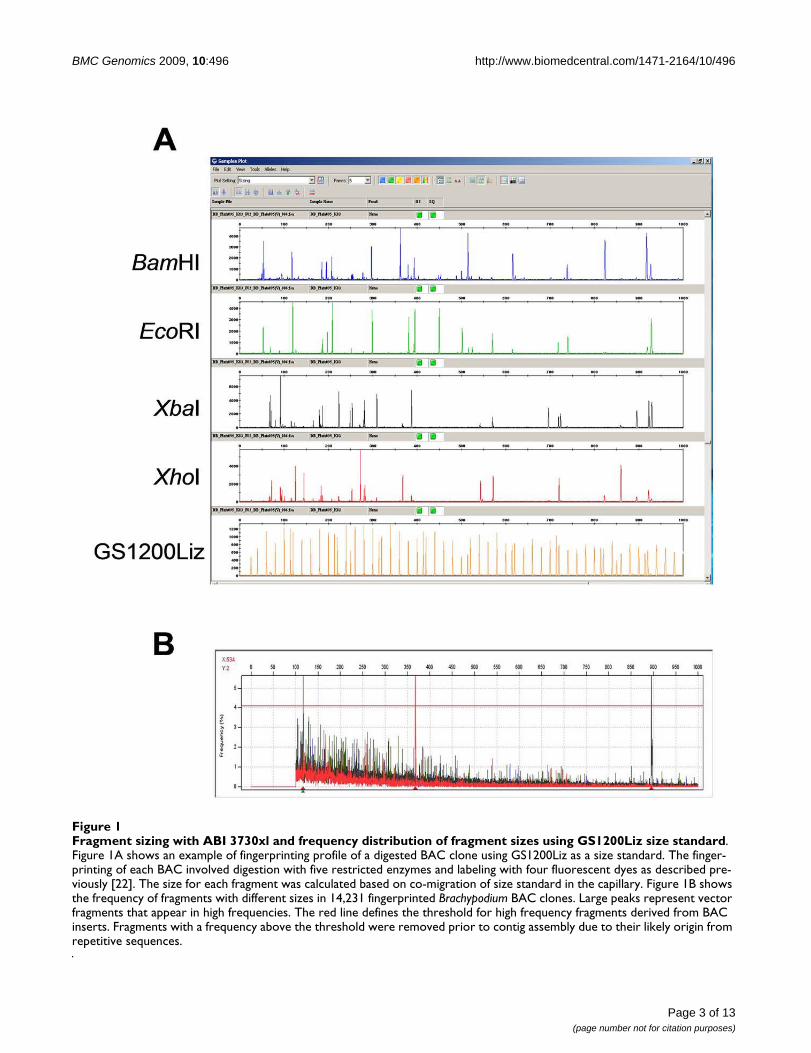
Results and DiscussionBAC source, fingerprinting, and contig assemblyA total of 67,151 clones of HindIII and BamHI BAC librar-ies developed from the diploid B. distachyon accessionBd21 [21] were fingerprinted using the SNaPshot HICFBAC fingerprinting method [22,23]. To generate moreinformation about each clone, a GS1200Liz size standard,which allows sizing of restriction fragments up to 1,000bp (Figure 1A), was used. The use of GS1200Liz necessi-tated using the 50-cm capillary array for the ABI 3730XL,instead of the standard 36-cm capillary array that is usedfor electrophoresis of fragments ranging from 50 bp to500 bp [22,24,25]. Large-size fragments are less frequentthan small-size fragments in the SNaPshot HICF profiles(Figure 1B), and are more valuable in contig assemblybecause they are less likely to be shared by chance [22].Since more large fragments could be called using theGS1200Liz as size standard, fragments with size less than100 bp were not used for contig assembly in this study.
Cross-contamination and low quality fingerprinting datainterfere with accurate contig assembly [24]. Contami-nated clones, empty clones, small insert clones, andclones with fingerprints below specified quality thresholdwere eliminated with the GenoProfiler program [26]. Ofthe 67,151 fingerprinted clones, 52,343 clones (78%)were suitable for contig assembly. An average fingerprinthad 79.4 restriction fragments in this population of fin-gerprints. Since the average insert size was 100 kb [21],there was on the average a restriction fragment every 1.26kb.
The 52,343 fingerprints representing 14× B. distachyongenome equivalents were used for an initial automatedcontig assembly using the FPC software [27]. The initialassembly was performed at a relatively high stringency (1× 10-45) to minimize faulty contig assembly of clonesfrom unrelated regions of the genome. The "DQer" func-tion was used to dissemble contigs containing more than10% questionable (Q) clones. The "End to End" FPCfunction was then repeatedly employed to merge contigswith successively less stringent Sulston score cutoff values[24,25,28]. In the end, the FPC assembly resulted in 648contigs containing a total of 50,182 BAC clones. In this"Phase I" physical map, 177 contigs had more than 100clones each, 73 contigs had 50 - 99 clones each, 72 contigshad 10 - 49 clones, and the rest had 9 clones or less. A totalof 2,161 singletons remained. The cumulative, contigu-
Page 2 of 13(page number not for citation purposes)
BMC Genomics 2009, 10:496 http://www.biomedcentral.com/1471-2164/10/496
Page 3 of 13(page number not for citation purposes)
Fragment sizing with ABI 3730xl and frequency distribution of fragment sizes using GS1200Liz size standardFigure 1Fragment sizing with ABI 3730xl and frequency distribution of fragment sizes using GS1200Liz size standard. Figure 1A shows an example of fingerprinting profile of a digested BAC clone using GS1200Liz as a size standard. The finger-printing of each BAC involved digestion with five restricted enzymes and labeling with four fluorescent dyes as described pre-viously [22]. The size for each fragment was calculated based on co-migration of size standard in the capillary. Figure 1B shows the frequency of fragments with different sizes in 14,231 fingerprinted Brachypodium BAC clones. Large peaks represent vector fragments that appear in high frequencies. The red line defines the threshold for high frequency fragments derived from BAC inserts. Fragments with a frequency above the threshold were removed prior to contig assembly due to their likely origin from repetitive sequences.
BMC Genomics 2009, 10:496 http://www.biomedcentral.com/1471-2164/10/496
ous, non-redundant fragment count across all contigs wasequivalent to approximately 410 Mb, which was 15.5%more than the estimated size of B. distachyon genome (355Mb) [9,11]; if the genome size of 271 Mb based on therecent release of 8× genome sequence assembly http://www.brachypodium.org is used, the fragment countwould be equivalent to 51.3% more of the estimatedgenome size. This indicated that many contigs actuallyoverlapped other contigs, but the overlaps were belowcontig joining threshold. Such overestimation has beenreported in physical maps of other plant genomes [25,29].
Editing of contigs by alignments with the rice genome sequenceIntegration of molecular markers into contigs is crucial fortheir anchoring on genetic maps and ultimate alignmentof a physical map and genome sequence. This task can beaccomplished by screening BAC libraries with pools oflabeled probes derived from EST clones or mappedgenetic markers or screening of multidimensional poolsof BAC clones by PCR or highly parallel Illumina Golden-Gate assays [30-33]. BAC end sequences (BESs), in addi-tion to other genomic applications [34-37], can facilitateinitial genome characterization [3,28,34,35] and anchor-ing of contigs onto the genetic map. BESs are particularlyuseful for contig anchoring in small, gene-dense genomes.Their utility is diminished in large and complex genomesdue to a low gene density. For example, in wheat, over80% of the genome consists of repetitive DNA (reviewedin [38]). Akhunov et al. [39] reported that codingsequences accounted for only 5.8, 4.5, and 4.8% of BES inT. uratu, Ae. speltoides, and Ae. tauschii BAC libraries,respectively. A total of 38 Mb of random B. distachyongenomic sequence was generated by sequencing 64,694BAC ends from the two BAC libraries, representing~14.0% of the genome sequence on the basis of a genomesize of 271 Mb http://www.brachypodium.org. This wasequivalent to one sequence tag every 4.2 kb (considering271 Mb of the genome size). A total of 25.3% of repeat-masked B. distachyon BESs had matches to the rice genomesequence (E < 10-25). Among them, 13,970 also matchedwheat ESTs [3]. Therefore, the integration of B. distachyonBES into the contigs immediately anchored a largenumber of contigs onto the rice genome sequence andwheat deletion maps (see discussion below).
BES of fingerprinted clones facilitated manual editing andcontig assembly validation. This was based on theassumption that closely related grass genomes shareextensive colinearity. The colinearity of contigs with therice genome can be used to assess quality of SNaPshot-based BAC fingerprinting technology and contig assem-bly. Brachypodium contigs with BESs allowed for directalignment of contigs with rice pseudomolecules; BLAT[40] was used for finding sequence similarities, which
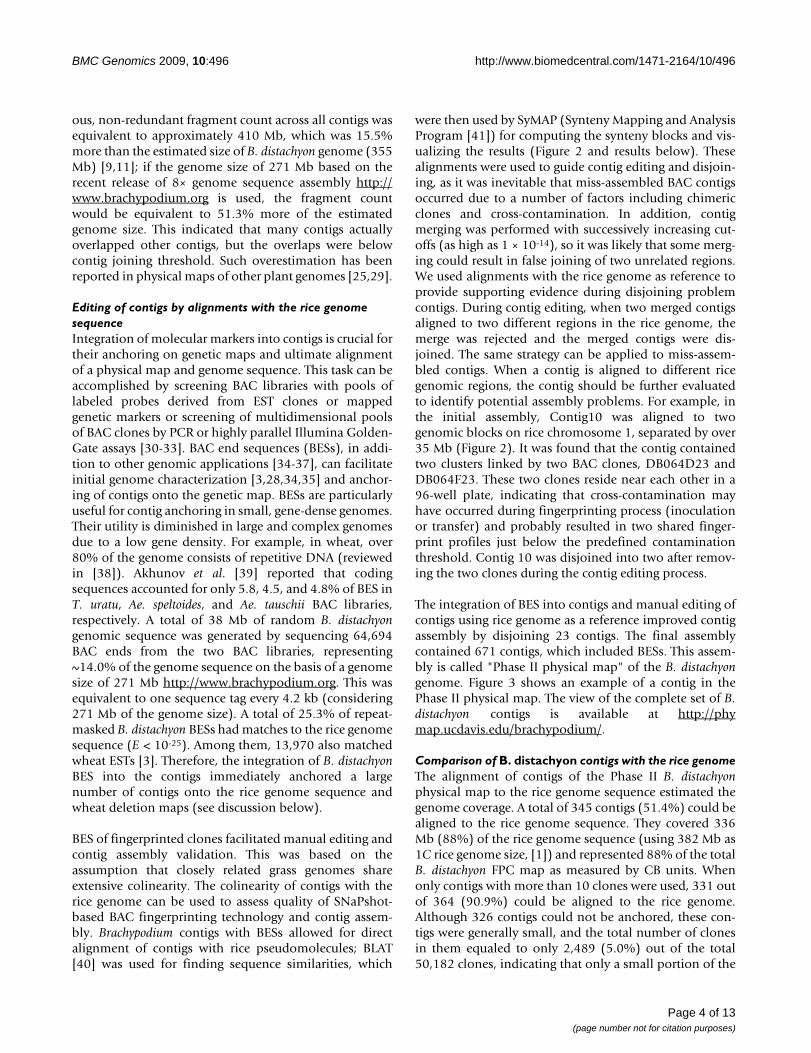
were then used by SyMAP (Synteny Mapping and AnalysisProgram [41]) for computing the synteny blocks and vis-ualizing the results (Figure 2 and results below). Thesealignments were used to guide contig editing and disjoin-ing, as it was inevitable that miss-assembled BAC contigsoccurred due to a number of factors including chimericclones and cross-contamination. In addition, contigmerging was performed with successively increasing cut-offs (as high as 1 × 10-14), so it was likely that some merg-ing could result in false joining of two unrelated regions.We used alignments with the rice genome as reference toprovide supporting evidence during disjoining problemcontigs. During contig editing, when two merged contigsaligned to two different regions in the rice genome, themerge was rejected and the merged contigs were dis-joined. The same strategy can be applied to miss-assem-bled contigs. When a contig is aligned to different ricegenomic regions, the contig should be further evaluatedto identify potential assembly problems. For example, inthe initial assembly, Contig10 was aligned to twogenomic blocks on rice chromosome 1, separated by over35 Mb (Figure 2). It was found that the contig containedtwo clusters linked by two BAC clones, DB064D23 andDB064F23. These two clones reside near each other in a96-well plate, indicating that cross-contamination mayhave occurred during fingerprinting process (inoculationor transfer) and probably resulted in two shared finger-print profiles just below the predefined contaminationthreshold. Contig 10 was disjoined into two after remov-ing the two clones during the contig editing process.
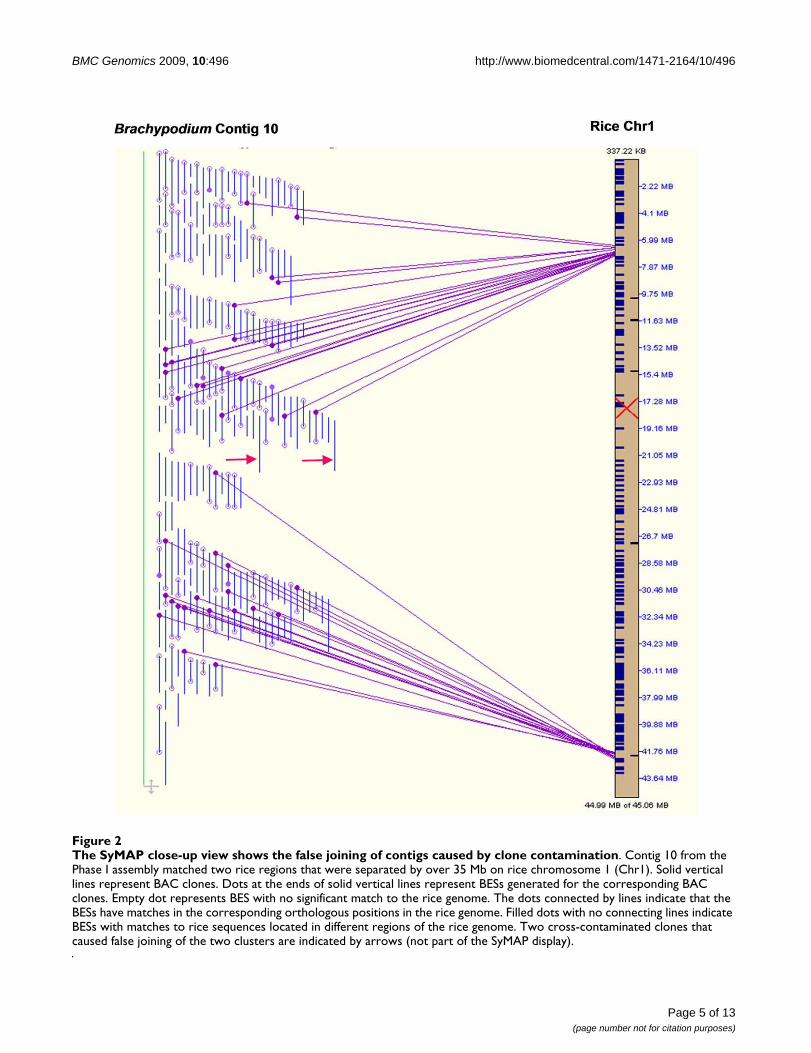
The integration of BES into contigs and manual editing ofcontigs using rice genome as a reference improved contigassembly by disjoining 23 contigs. The final assemblycontained 671 contigs, which included BESs. This assem-bly is called "Phase II physical map" of the B. distachyongenome. Figure 3 shows an example of a contig in thePhase II physical map. The view of the complete set of B.distachyon contigs is available at http://phymap.ucdavis.edu/brachypodium/.
Comparison of B. distachyon contigs with the rice genomeThe alignment of contigs of the Phase II B. distachyonphysical map to the rice genome sequence estimated thegenome coverage. A total of 345 contigs (51.4%) could bealigned to the rice genome sequence. They covered 336Mb (88%) of the rice genome sequence (using 382 Mb as1C rice genome size, [1]) and represented 88% of the totalB. distachyon FPC map as measured by CB units. Whenonly contigs with more than 10 clones were used, 331 outof 364 (90.9%) could be aligned to the rice genome.Although 326 contigs could not be anchored, these con-tigs were generally small, and the total number of clonesin them equaled to only 2,489 (5.0%) out of the total50,182 clones, indicating that only a small portion of the
Page 4 of 13(page number not for citation purposes)
BMC Genomics 2009, 10:496 http://www.biomedcentral.com/1471-2164/10/496
Page 5 of 13(page number not for citation purposes)
The SyMAP close-up view shows the false joining of contigs caused by clone contaminationFigure 2The SyMAP close-up view shows the false joining of contigs caused by clone contamination. Contig 10 from the Phase I assembly matched two rice regions that were separated by over 35 Mb on rice chromosome 1 (Chr1). Solid vertical lines represent BAC clones. Dots at the ends of solid vertical lines represent BESs generated for the corresponding BAC clones. Empty dot represents BES with no significant match to the rice genome. The dots connected by lines indicate that the BESs have matches in the corresponding orthologous positions in the rice genome. Filled dots with no connecting lines indicate BESs with matches to rice sequences located in different regions of the rice genome. Two cross-contaminated clones that caused false joining of the two clusters are indicated by arrows (not part of the SyMAP display).
BMC Genomics 2009, 10:496 http://www.biomedcentral.com/1471-2164/10/496
clones could not been anchored onto the rice genome.The data suggested a general conservation of syntenybetween rice and B. distachyon genomes, which confirmsprevious conclusions made on the basis of sequencing afew B. sylvaticum BAC clones and their sequence compari-sons with the orthologous regions in rice and wheat [15].
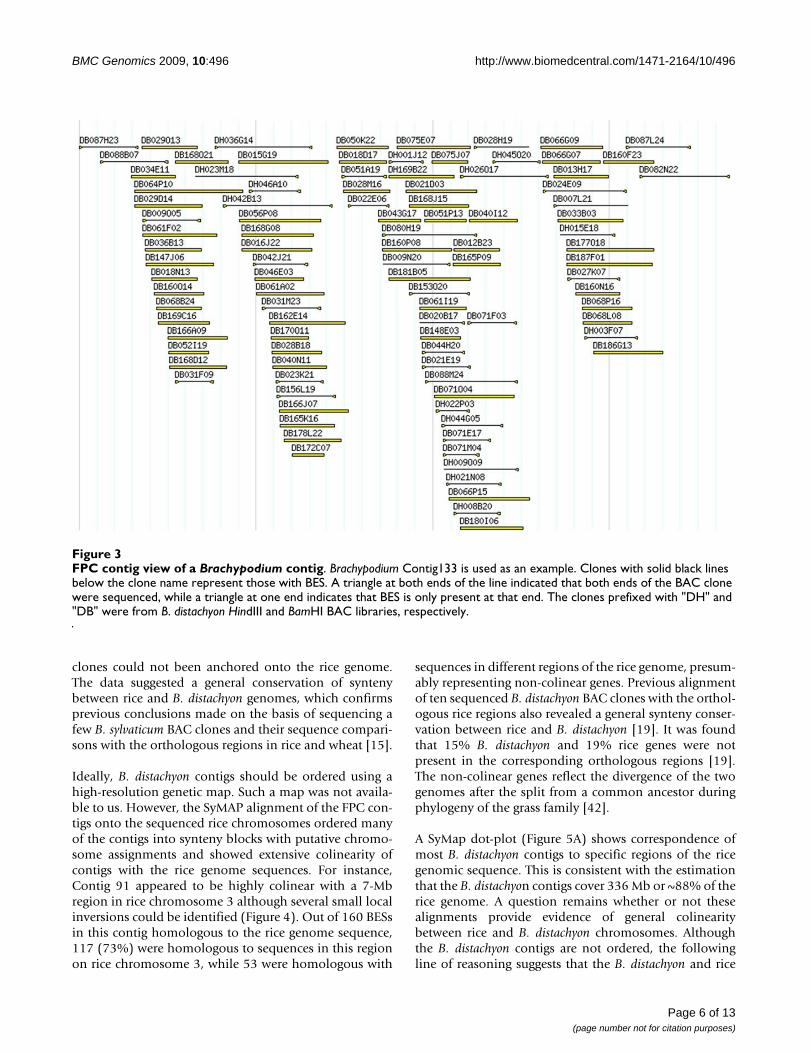
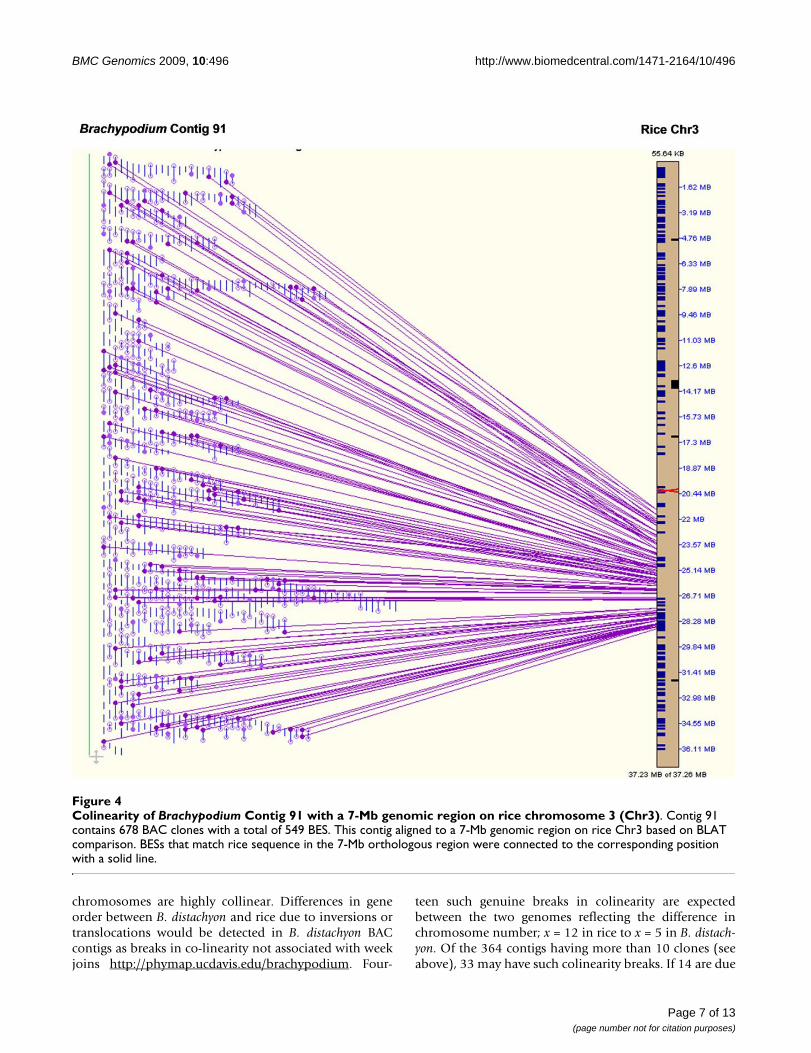
Ideally, B. distachyon contigs should be ordered using ahigh-resolution genetic map. Such a map was not availa-ble to us. However, the SyMAP alignment of the FPC con-tigs onto the sequenced rice chromosomes ordered manyof the contigs into synteny blocks with putative chromo-some assignments and showed extensive colinearity ofcontigs with the rice genome sequences. For instance,Contig 91 appeared to be highly colinear with a 7-Mbregion in rice chromosome 3 although several small localinversions could be identified (Figure 4). Out of 160 BESsin this contig homologous to the rice genome sequence,117 (73%) were homologous to sequences in this regionon rice chromosome 3, while 53 were homologous with
sequences in different regions of the rice genome, presum-ably representing non-colinear genes. Previous alignmentof ten sequenced B. distachyon BAC clones with the orthol-ogous rice regions also revealed a general synteny conser-vation between rice and B. distachyon [19]. It was foundthat 15% B. distachyon and 19% rice genes were notpresent in the corresponding orthologous regions [19].The non-colinear genes reflect the divergence of the twogenomes after the split from a common ancestor duringphylogeny of the grass family [42].
A SyMap dot-plot (Figure 5A) shows correspondence ofmost B. distachyon contigs to specific regions of the ricegenomic sequence. This is consistent with the estimationthat the B. distachyon contigs cover 336 Mb or ~88% of therice genome. A question remains whether or not thesealignments provide evidence of general colinearitybetween rice and B. distachyon chromosomes. Althoughthe B. distachyon contigs are not ordered, the followingline of reasoning suggests that the B. distachyon and rice
FPC contig view of a Brachypodium contigFigure 3FPC contig view of a Brachypodium contig. Brachypodium Contig133 is used as an example. Clones with solid black lines below the clone name represent those with BES. A triangle at both ends of the line indicated that both ends of the BAC clone were sequenced, while a triangle at one end indicates that BES is only present at that end. The clones prefixed with "DH" and "DB" were from B. distachyon HindIII and BamHI BAC libraries, respectively.
Page 6 of 13(page number not for citation purposes)
BMC Genomics 2009, 10:496 http://www.biomedcentral.com/1471-2164/10/496
chromosomes are highly collinear. Differences in geneorder between B. distachyon and rice due to inversions ortranslocations would be detected in B. distachyon BACcontigs as breaks in co-linearity not associated with weekjoins http://phymap.ucdavis.edu/brachypodium. Four-
teen such genuine breaks in colinearity are expectedbetween the two genomes reflecting the difference inchromosome number; x = 12 in rice to x = 5 in B. distach-yon. Of the 364 contigs having more than 10 clones (seeabove), 33 may have such colinearity breaks. If 14 are due
Colinearity of Brachypodium Contig 91 with a 7-Mb genomic region on rice chromosome 3 (Chr3)Figure 4Colinearity of Brachypodium Contig 91 with a 7-Mb genomic region on rice chromosome 3 (Chr3). Contig 91 contains 678 BAC clones with a total of 549 BES. This contig aligned to a 7-Mb genomic region on rice Chr3 based on BLAT comparison. BESs that match rice sequence in the 7-Mb orthologous region were connected to the corresponding position with a solid line.
Page 7 of 13(page number not for citation purposes)
BMC Genomics 2009, 10:496 http://www.biomedcentral.com/1471-2164/10/496
Page 8 of 13(page number not for citation purposes)
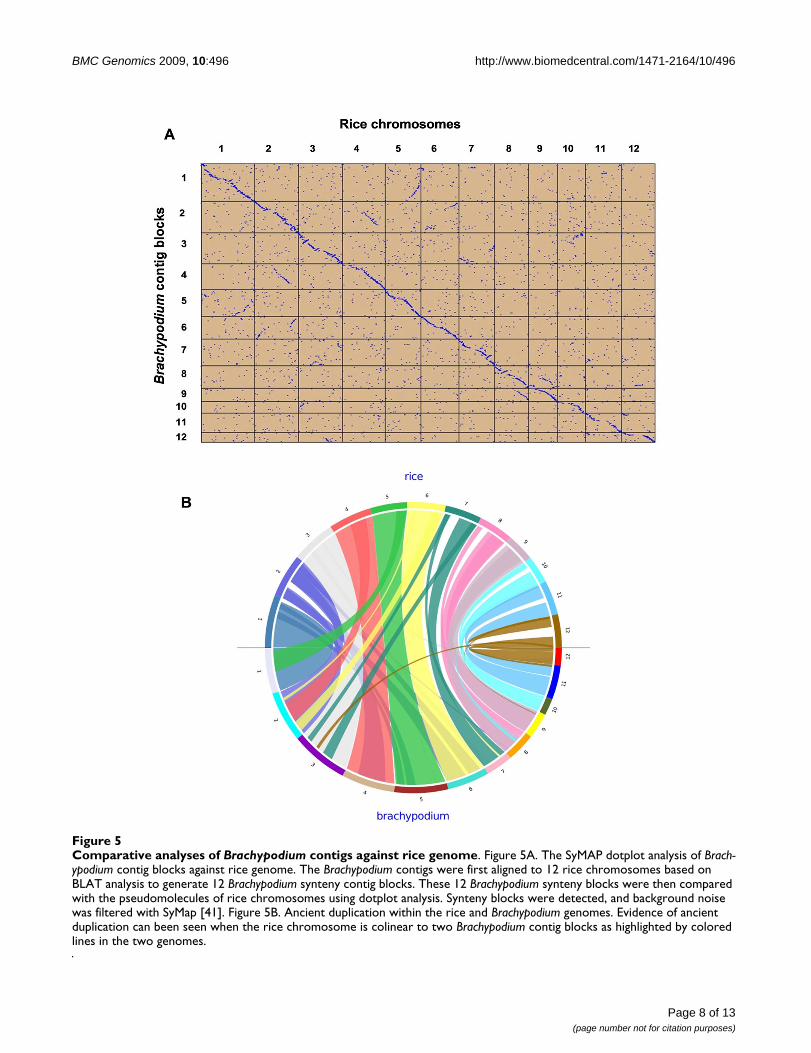
Comparative analyses of Brachypodium contigs against rice genomeFigure 5Comparative analyses of Brachypodium contigs against rice genome. Figure 5A. The SyMAP dotplot analysis of Brach-ypodium contig blocks against rice genome. The Brachypodium contigs were first aligned to 12 rice chromosomes based on BLAT analysis to generate 12 Brachypodium synteny contig blocks. These 12 Brachypodium synteny blocks were then compared with the pseudomolecules of rice chromosomes using dotplot analysis. Synteny blocks were detected, and background noise was filtered with SyMap [41]. Figure 5B. Ancient duplication within the rice and Brachypodium genomes. Evidence of ancient duplication can been seen when the rice chromosome is colinear to two Brachypodium contig blocks as highlighted by colored lines in the two genomes.
BMC Genomics 2009, 10:496 http://www.biomedcentral.com/1471-2164/10/496
to chromosome number differences, this leaves only 19contigs, or 5% of the total 364 contigs to be potentiallydue to actual or artifactual breaks in colinearity. Sincethere is no compelling reason why breaks in gene coline-arity should coincide with gaps between BAC contigs, wetherefore conclude that B. distachyon and rice chromo-somes are highly colinear and most of the neighboringcontigs on the dot-plot alignment in Figure 5A are goodcandidates for joining.
Most plant genomes are paleopolyploid with ancientwhole-genome duplications [43-48]. The radiation ofgrasses was preceded by paleotetraploidy resulting in awhole-genome duplication [46], which was followed bydiploidization by deletions. Therefore, in regions that arestill duplicated in the B. distachyon genome, a rice regionwill align strongly with one B. distachyon contig block andweakly with another. This is evident in Figure 5B, wheretwo B. distachyon syntenic contig blocks can be identifiedfor several rice chromosomes. These data show that the B.distachyon genome has a similar set of duplicationsderived from the ancient paleotetraploid as does rice.
Alignment of wheat EST deletion bin map to B. distachyon contigsThe 1C nucleus of hexaploid T. aestivum contains 16,000Mb DNA [49], which makes map-based cloning of wheatgenes very difficult. Because B. distachyon diverged fromthe wheat phylogenetic lineage only about 30 millionyears ago (MYA) [15], B. distachyon physical map and ulti-mately genome sequence can facilitate wheat map-basedcloning and other genomic applications.
A total of 7,104 expressed sequence tag (EST) unigeneswere previously mapped into 156 deletion bins, provid-ing a genome-wide framework for wheat mapping andidentifying agronomically important genes [20]. How-ever, a disadvantage of the deletion bin map is that lociare not ordered within the bins. Given the general coline-arity among the grass genomes, this problems can be par-tially overcome by in silico ordering of wheat ESTs usingrice genomic sequence [50]. Brachypodium is expected toshow better synteny with wheat than rice because itdiverged from wheat more recently than rice [3], Brachypo-dium is therefore expected to be more useful in compara-tive mapping applications than rice.
To assess the utility of B. distachyon physical map forwheat genomics, we compared the Brachypodium contigswith the wheat deletion bin map [20]. Of 7,104 deletionbin mapped wheat ESTs, 985 matched Brachypodium BESsat an e-value cutoff of 1× 10⁻¹⁰. These matches werederived from BESs associated with 216 contigs (32% oftotal Brachypodium contigs). Such analysis allowed us toalign Brachypodium contigs onto individual chromosomes
based on wheat deletion bin map data http://phymap.ucdavis.edu/brachypodium/.
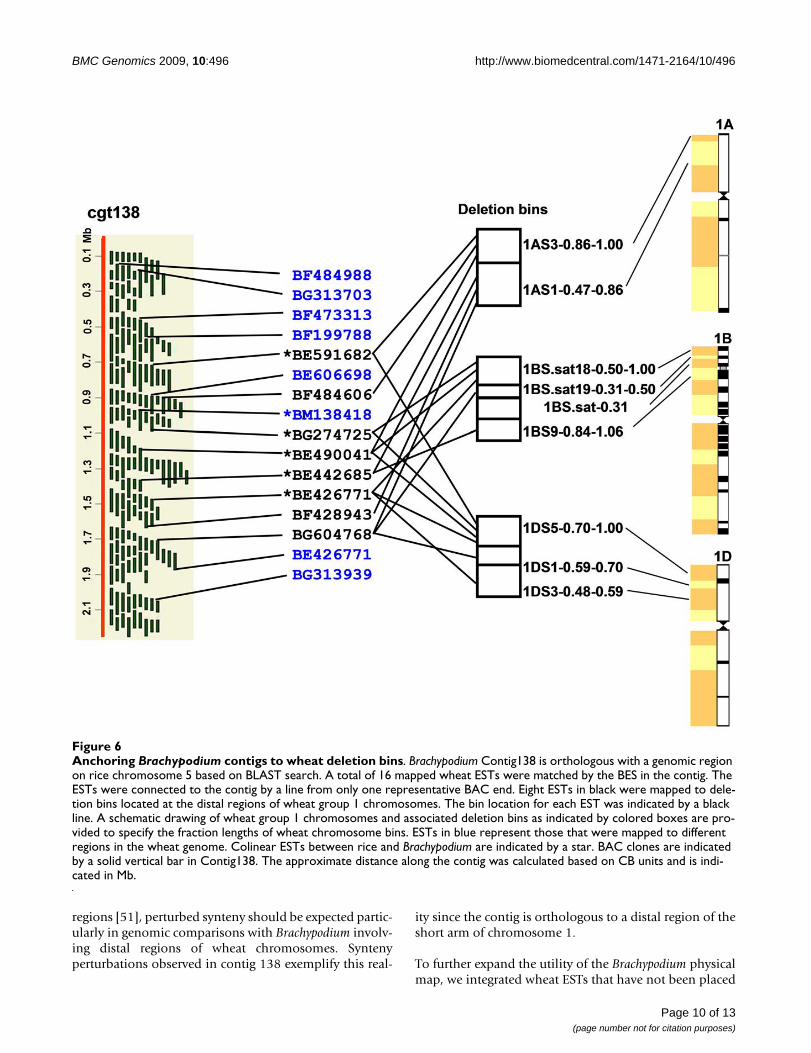
Comparison of Brachypodium contigs with the wheat dele-tion bin map and the rice genome sequence provided agenome-wide view of genome evolution among these spe-cies. Figure 6 shows an example of such a comparison.Contig138 contained 1,380 BAC clones with 1,402 BESsand spanned 2.2 Mb (estimated from a relationshipbetween CB units and Mb). A total of 16 wheat ESTs in thedeletion bins matched BESs in this contig. Eight of themwere mapped in the distal bins 1AS3-0.86-1.00, 1AS1-0.47-0.86, 1BS.sat18-0.50-1.00, 1BS.sat19-0.31.0.50,1BS.sat19-0.31-0.50, 1BS.sat-0.31, 1BS9-0.84-1.06,1DS5-0.70-1.00, 1DS1-0.59-0.70, and 1DS3-0.48-0.59 onwheat chromosomes 1A, 1B, and 1D [20] (Figure 6). Theywere distributed across two to three bins on each chromo-some, indicating that the contig spans multiple bins onwheat group 1 chromosomes (Figure 6). In most cases, theorder of BESs in a contig homologous to wheat ESTs cor-related with the order of bins along a chromosome arminto which these ESTs were mapped. These data suggestedthat Contig138 represented an orthologous region ofthese deletion bins. Alignment with rice genome indi-cated that Contig138 was colinear with a region on ricechromosome 5. Among eight colinear wheat ESTsbetween Brachypodium and wheat, three ESTs (BF484606,BF428943, and BG604768) were not colinear with therice orthologous region. BF428943 and BG604768 werehomologous to genes on rice chromosome 2, suggestinggene duplication/deletion either in rice or in the Pooideaelineage after Pooideae diverged from Ehrhartoideae butbefore divergence of Brachypodium. No match toBE484606 was found in the rice genome based on BLASTsearches.
ESTs BF473313 and BE446475 homologous to BESsequences of Contig138 also have no match in the ricegenome, but were mapped on long arms of wheat chro-mosomes of homeologous groups 1 and 7, respectively.These genes are only present in Brachypodium and wheatbut are not located in colinear positions in the twogenomes. Another EST locus, BM138418, is colinear onlybetween Brachypodium and rice since this EST was mappedto the chromosome 3B in wheat based on the wheat dele-tion bin map result. Two ESTs, BF484988 and BG313703,at the top of Contig138 were mapped to the short arm onwheat chromosomes of homeologous group 5. In rice,they matched sequences on chromosome 1. Other exam-ples of noncolinear genes among the three genomes wereobserved. Occasional perturbations of synteny betweenBrachypodium, rice and wheat must therefore be expectedand taken into account in comparative genomic applica-tions. Since synteny of wheat chromosomes has beeneroded faster in the distal regions than in proximal
Page 9 of 13(page number not for citation purposes)
BMC Genomics 2009, 10:496 http://www.biomedcentral.com/1471-2164/10/496
regions [51], perturbed synteny should be expected partic-ularly in genomic comparisons with Brachypodium involv-ing distal regions of wheat chromosomes. Syntenyperturbations observed in contig 138 exemplify this real-
ity since the contig is orthologous to a distal region of theshort arm of chromosome 1.
To further expand the utility of the Brachypodium physicalmap, we integrated wheat ESTs that have not been placed
Anchoring Brachypodium contigs to wheat deletion binsFigure 6Anchoring Brachypodium contigs to wheat deletion bins. Brachypodium Contig138 is orthologous with a genomic region on rice chromosome 5 based on BLAST search. A total of 16 mapped wheat ESTs were matched by the BES in the contig. The ESTs were connected to the contig by a line from only one representative BAC end. Eight ESTs in black were mapped to dele-tion bins located at the distal regions of wheat group 1 chromosomes. The bin location for each EST was indicated by a black line. A schematic drawing of wheat group 1 chromosomes and associated deletion bins as indicated by colored boxes are pro-vided to specify the fraction lengths of wheat chromosome bins. ESTs in blue represent those that were mapped to different regions in the wheat genome. Colinear ESTs between rice and Brachypodium are indicated by a star. BAC clones are indicated by a solid vertical bar in Contig138. The approximate distance along the contig was calculated based on CB units and is indi-cated in Mb.
Page 10 of 13(page number not for citation purposes)
BMC Genomics 2009, 10:496 http://www.biomedcentral.com/1471-2164/10/496
into wheat deletion bins into Brachypodium contigs. Thereare over one million wheat ESTs in Genbank, and theyhave been assembled into 42,848 unigene sets http://www.ncbi.nlm.nih.gov/unigene. Using BLAT, 5,421 dif-ferent unigenes were integrated to the Brachypodium con-tigs. They were homologous to a total of 5,910 BES in thephysical map. These wheat EST markers will further facil-itate comparative mapping in wheat. The comparison ofBrachypodium contigs with wheat deletion maps and inte-gration of wheat unigenes into Brachypodium contigs canbe accessed at http://phymap.ucdavis.edu/brachypodium/.
ConclusionA whole-genome, BAC-based physical map for the newgrass model species, Brachypodium, was constructed. Themap facilitated a variety of genomic applications. Com-parison of contigs with rice revealed high colinearitybetween rice and Brachypodium chromosomes. Addition-ally, many Brachypodium BAC contigs could be anchoredon the wheat deletion bin maps. Both outcomes supportthe anticipated utility of Brachypodium for wheat compar-ative genomics and practical applications in map-basedcloning of wheat genes. Another application of the physi-cal map is in the Brachypodium genome sequencingproject. The phase II physical map can be aligned withshotgun sequence contigs via BES and provide scaffoldsfor ordering shotgun sequence contigs and estimating gapsizes. The BAC-based physical map reported here was pro-vided to the Brachypodium distachyon sequence assemblyteam and has helped produce a high quality finalsequence assembly http://www.brachypodium.org/node/18. The physical map can also identify BACs spanningsequence gaps and has served as sequencing template tofill them. Brachypodium is expected to serve as a surrogateto assist gene discovery and functional characterization inthe large and complex crop genomes, such as wheat andbioenergy crops. All the data and resources developed inthis study are available at the http://phymap.ucdavis.edu/brachypodium/ website for community use.
MethodsBacterial artificial chromosomal (BAC) librariesThe B. distachyon BAC libraries used in this study were pre-viously constructed using partial digests with HindIII andBamHI restriction enzymes from an inbred diploid line ofB. distachyon, Bd21, the same line selected for completesequencing by the US Department of Energy JointGenome Institute through its "Community SequencingProgram" http://www.jgi.doe.gov/sequencing/why/51281.html[21]. These BAC libraries represent ~29.2-foldhaploid genome equivalents and were employed for BACfingerprinting and contig assembly.
BAC fingerprinting and fragment sizingThe BAC clones were fingerprinted as described by [22]with minor modifications. From each 384-well plate, four96-well blocks containing 1.2 ml of 2× YT medium plus12.5 μg/ml chloramphenicol were inoculated with a 96-well replicator. Two pins were removed from the replica-tor to allow the insertion of control clones into the 96-well plate. Two control BAC clones were inserted manu-ally in wells E07 and H12 in each 96-well block. Theplates were covered with Airpore gas permeable plate seal-ant (Qiagen) and shaken on an orbital shaker agitated at400 rpm at 37°C for 20 hours. BAC DNA was isolatedwith the Qiagen R.E.A.L 96-Prep kit (Qiagen, Valencia,California). The following minor modifications of the fin-gerprinting method were made to accommodate the useof ABI3730XL (Applied Biosystems, Foster City, Califor-nia) instead of ABI3100 for capillary electrophoresis. Themore sensitive laser of the ABI3730XL instrumentimproved fingerprinting resolution and made it possibleto reduce the amount of BAC DNA sample for electro-phoresis, thus lowering fingerprinting costs. To reducesample size, 0.5-1.2 μg instead of 1.0-2.0 μg of BAC DNAwas simultaneously digested with 2.0 instead of 5.0 unitseach BamHI, EcoRI, XbaI, XhoI and HaeIII (New EnglandBiolabs, Beverly, Massachusetts) at 37°C for 3 hrs. TheDNA was labeled with 0.4 μl instead of 1.0 μl of the SNaP-shot kit (Applied Biosystems, Foster City, California) at65°C for 1 hr and precipitated with ethanol. The labeledDNA was dissolved in 9.9 μl of Hi-Di formamide, and 0.3μl of GeneScan 1200 LIZ (Applied Biosystems, Foster City,California) was added to each sample as an internal sizestandard. Restriction fragments were sized withABI3730XL using 50 cm capillaries and POP7 (AppliedBiosystems, Foster City, California). The fragment sizecalling was accomplished with the GeneMaper software(Applied Biosystems, Foster City, California) with thehelp of FP Pipeliner http://www.bioinforsoft.com/.
Fingerprints editing and contig assemblyThe fingerprint profiles for each BAC clone were collectedby GeneMapper v3.7 (Applied Biosystems). The GeneMa-per output data was edited with the GenoProfiler program[26]. The two control BAC clones inserted in each 96-wellplate were used to check for the correct orientation of theplate. Fragments in the size range of 100 - 1,000 bp weremeasured. For the data quality control, vector bands andclones failing fingerprinting or lacking inserts wereremoved using GenoProfiler program. In addition, sam-ples with less than 40 or more than 150 fragments werealso eliminated. Fingerprints of cross-contaminated sam-ples were detected using a module in the GenoProfiler[26] and removed from the data set. The cross-contamina-tion was defined as clones residing in neighboring wellseither in 384-well format or 96-well format (quadrants)
Page 11 of 13(page number not for citation purposes)
BMC Genomics 2009, 10:496 http://www.biomedcentral.com/1471-2164/10/496
share 30% or more of the mean number of fragments, theformula is shared bands*2/(bands1 + bands2).
A total of 52,343 BAC clones that passed quality checkwere used to assemble contigs using the FPC v8.5.3 [27].The initial assembly used a Sulston score of 1× 10-45 and atolerance 0.4 bp. The contig assembly was processedthrough the DQ function of FPC to break up contigs hav-ing more than 10% Q-clones in a contig. The assemblywas further refined using "Single-to-End" and "End-to-End" merging by stepwise decreasing of assembly strin-gency of Sulston score cutoff values (down to 1× 10-14).
Alignment of FPC contig with the rice genome and wheat deletion bin mapThere were 64,697 BAC end sequences generated from thefingerprinted B. distachyon BAC clones [3] which werecompared using BLAT [40] against the rice pseudomole-cules build 4.0 http://rgp.dna.affrc.go.jp/IRGSP/Build4/build4.html. The results were used as input into SyntenyMapping and Analysis Program (SyMap) [41], whichcomputed the synteny blocks. The results can be viewedfrom the SyMAP Java based dot-plot, synteny block tochromosome, and close-up views.
To anchor B. distachyon physical contigs to the wheat dele-tion bin map, BAC-end sequence data from the B. distach-yon BACs were compared against sequences of themapped wheat EST probe sets using BLAT (parametersminScore = 50, minIdentity = 80%) and links to the wheatdeletion bin map constructed [20,52]. The BLAT align-ments and FPC anchoring were carried out using FPCmodules BSS, which is designed for this purpose [53]. TheCMAP http://gmod.org/wiki/Cmap tool allowed for com-parative analysis between the B. distachyon physical con-tigs and wheat deletion bin map.
Authors' contributionsYQG, YM, NH, and JPV isolated BAC DNA. YM generatedthe fingerprinting data. MCL, FMY, and NH analyzed fin-gerprints, assembled the physical map, and verifiedassembly. FMY, MCL, GRL, WMN, and CS developeddatabase and interfaces to display FPC results on the weband performed comparative studies. YQG and MCL con-ceived the project, supervised its execution, and draft themanuscript. JPV, JD, and ODA contributed to the plan-ning of the project and edited the manuscript. All authorsread and approved the final version of the manuscript.
AcknowledgementsThe authors thank Daniel Hayden, Devin Coleman and Theresa Hill for assistance in BAC DNA extraction; Charles H. Wang and Rana Nederi for assistance in generating BAC fingerprints. This work was supported in part by the United State Department of Agriculture, Agriculture Research Serv-ice CRIS 532502100-010, 533502100-011, and 532502100-013; and by the Department of Plant Sciences, University of California, Davis.
References1. IRGSP: The map-based sequence of the rice genome. Nature
2005, 436(7052):793-800.2. Garvin DF, Gu Y-Q, Hasterok R, Hazen SP, Jenkins G, Mockler TC,
Mur LAJ, Vogel JP: Development of genetic and genomicresearch resources for Brachypodium distachyon, a newmodel system for grass crop research. Crop Sci 2008,48(Supplement_1):S-69-84.
3. Huo N, Lazo GR, Vogel JP, You FM, Ma Y, Hayden DM, Coleman-Derr D, Hill TA, Dvorak J, Anderson OD, et al.: The nucleargenome of Brachypodium distachyon: analysis of BAC endsequences. Funct Integr Genomics 2008, 8(2):135-147.
4. Hasterok R, Marasek A, Donnison IS, Armstead I, Thomas A, King IP,Wolny E, Idziak D, Draper J, Jenkins G: Alignment of the genomesof Brachypodium distachyon and temperate cereals andgrasses using BAC landing with fluorescent in situ hybridiza-tion. Genetics 2006:349-362.
5. Foote TN, Griffiths S, Allouis S, Moore G: Construction and anal-ysis of a BAC library in the grass Brachypodium sylvaticum:its use as a tool to bridge the gap between rice and wheat inelucidating gene content. Funct Integr Genomics 2004, 4(1):26-33.
6. Draper J, Mur LA, Jenkins G, Ghosh-Biswas GC, Bablak P, HasterokR, Routledge AP: Brachypodium distachyon. A new model sys-tem for functional genomics in grasses. Plant Physiol 2001,127(4):1539-1555.
7. Opanowicz M, Vain P, Draper J, Parker D, Doonan JH: Brachypo-dium distachyon: making hay with a wild grass. Trends in PlantScience 2008, 13(4):172-177.
8. Ozdemir BS, Hernandez P, Filiz E, Budak H: Brachypodiumgenomics. Int J Plant Genomics 2008, 2008:536104.
9. Vogel J, Garvin D, Leong O, Hayden D: Agrobacterium-mediatedtransformation and inbred line development in the modelgrass Brachypodium distachyon. Plant Cell, Tissue and Organ Cul-ture 2006, 84(2):100179-100191.
10. Kellogg EA: Evolutionary History of the Grasses. Plant Physiol2001, 125(3):1198-1205.
11. Bennett MD, Leitch IJ: Nuclear DNA Amounts in Angiosperms:Progress, Problems and Prospects. Ann Bot 2005, 95(1):45-90.
12. Pacurar DI, Thordal-Christensen H, Nielsen KK, Lenk I: A high-throughput Agrobacterium-mediated transformation sys-tem for the grass model species Brachypodium distachyon L.Transgenic Res 2008, 17(5):965-975.
13. Vain P, Worland B, Thole V, McKenzie N, Alves SC, Opanowicz M,Fish LJ, Bevan MW, Snape JW: Agrobacterium-mediated trans-formation of the temperate grass Brachypodium distachyon(genotype Bd21) for T-DNA insertional mutagenesis. PlantBiotechnol J 2008, 6(3):236-245.
14. Vogel J, Hill T: High-efficiency Agrobacterium-mediated trans-formation of Brachypodium distachyon inbred line Bd21-3.Plant Cell Rep 2008, 27(3):471-478.
15. Bossolini E, Wicker T, Knobel PA, Keller B: Comparison of orthol-ogous loci from small grass genomes Brachypodium andrice: implications for wheat genomics and grass genomeannotation. Plant J 2007, 49(4):704-717.
16. Faris JD, Zhang Z, Fellers JP, Gill BS: Micro-colinearity betweenrice, Brachypodium, and Triticum monococcum at thewheat domestication locus Q. Funct Integr Genomics 2008,8(2):149-164.
17. Spielmeyer W, Singh RP, McFadden H, Wellings CR, Huerta-Espino J,Kong X, Appels R, Lagudah ES: Fine scale genetic and physicalmapping using interstitial deletion mutants of Lr34/Yr18: adisease resistance locus effective against multiple pathogensin wheat. Theor Appl Genet 2008, 116(4):481-490.
18. Griffiths S, Sharp R, Foote TN, Bertin I, Wanous M, Reader S, ColasI, Moore G: Molecular characterization of Ph1 as a majorchromosome pairing locus in polyploid wheat. Nature 2006,439(7077):749-752.
19. Huo N, Vogel JP, Lazo GR, You FM, Ma Y, McMahon S, Dvorak J,Anderson OD, Luo MC, Gu YQ: Structural characterization ofBrachypodium genome and its syntenic relationship withrice and wheat. Plant Mol Biol 2009, 70(1-2):47-61.
20. Qi LL, Echalier B, Chao S, Lazo GR, Butler GE, Anderson OD, Akhu-nov ED, Dvorak J, Linkiewicz AM, Ratnasiri A, et al.: A chromosomebin map of 16,000 expressed sequence tag loci and distribu-tion of genes among the three genomes of polyploid wheat.Genetics 2004, 168(2):701-712.
Page 12 of 13(page number not for citation purposes)
BMC Genomics 2009, 10:496 http://www.biomedcentral.com/1471-2164/10/496
Publish with BioMed Central and every scientist can read your work free of charge
"BioMed Central will be the most significant development for disseminating the results of biomedical research in our lifetime."
Sir Paul Nurse, Cancer Research UK
Your research papers will be:
available free of charge to the entire biomedical community
peer reviewed and published immediately upon acceptance
cited in PubMed and archived on PubMed Central
yours — you keep the copyright
Submit your manuscript here:http://www.biomedcentral.com/info/publishing_adv.asp
BioMedcentral
21. Huo N, Gu YQ, Lazo GR, Vogel JP, Coleman-Derr D, Luo MC, Thil-mony R, Garvin DF, Anderson OD: Construction and character-ization of two BAC libraries from Brachypodium distachyon,a new model for grass genomics. Genome 2006,49(9):1099-1108.
22. Luo MC, Thomas C, You FM, Hsiao J, Ouyang S, Buell CR, MalandroM, McGuire PE, Anderson OD, Dvorak J: High-throughput finger-printing of bacterial artificial chromosomes using the SNaP-shot labeling kit and sizing of restriction fragments bycapillary electrophoresis. Genomics 2003, 82:378-389.
23. Nelson WM, Dvorak J, Luo MC, Messing J, Wing RA, Soderlund C:Efficacy of clone fingerprinting methodologies. Genomics 2007,89(1):160-165.
24. Nelson WM, Bharti AK, Butler E, Wei F, Fuks G, Kim H, Wing RA,Messing J, Soderlund C: Whole-genome validation of high-infor-mation-content fingerprinting. Plant Physiol 2005, 139(1):27-38.
25. Mun JH, Kwon SJ, Yang TJ, Kim HS, Choi BS, Baek S, Kim JS, Jin M,Kim JA, Lim MH, et al.: The first generation of a BAC-basedphysical map of Brassica rapa. BMC Genomics 2008, 9:280.
26. You FM, Luo MC, Gu YQ, Lazo GR, Deal K, Dvorak J, Anderson OD:GenoProfiler: batch processing of high-throughput capillaryfingerprinting data. Bioinformatics 2007, 23:240-242.
27. Soderlund C, Humphray S, Dunham I, French L: Contigs built withfingerprints, markers, and FPC V4.7. Genome Res 2000,11:934-941.
28. Kim H, San Miguel P, Nelson W, Collura K, Wissotski M, Walling JG,Kim JP, Jackson SA, Soderlund C, Wing RA: Comparative physicalmapping between Oryza sativa (AA genome type) and O.punctata (BB genome type). Genetics 2007, 176(1):379-390.
29. Wu C, Sun S, Nimmakayala P, Santos FA, Meksem K, Springman R,Ding K, Lightfoot DA, Zhang HB: A BAC- and BIBAC-basedphysical map of the soybean genome. Genome Res 2004,14(2):319-326.
30. Shoemaker RC, Grant D, Olson T, Warren WC, Wing R, Yu Y, KimH, Cregan P, Joseph B, Futrell-Griggs M, et al.: Microsatellite dis-covery from BAC end sequences and genetic mapping toanchor the soybean physical and genetic maps. Genome 2008,51(4):294-302.
31. Gardiner J, Schroeder S, Polacco ML, Sanchez-Villeda H, Fang Z, Mor-gante M, Landewe T, Fengler K, Useche F, Hanafey M, et al.: Anchor-ing 9,371 maize expressed sequence tagged unigenes to thebacterial artificial chromosome contig map by two-dimen-sional overgo hybridization. Plant Physiol 2004,134(4):1317-1326.
32. Wu X, Zhong G, Findley SD, Cregan P, Stacey G, Nguyen HT:Genetic marker anchoring by six-dimensional pools fordevelopment of a soybean physical map. BMC Genomics 2008,9:28.
33. Luo MC, Xu K, Ma Y, Deal KR, Nicolet CM, Dvorak J: A high-throughput strategy for screening of bacterial artificial chro-mosome libraries and anchoring of clones on a genetic mapconstructed with single nucleotide polymorphisms. BMCGenomics 2009, 10:28.
34. Paux E, Roger D, Badaeva E, Gay G, Bernard M, Sourdille P, FeuilletC: Characterizing the composition and evolution of homoe-ologous genomes in hexaploid wheat through BAC-endsequencing on chromosome 3B. Plant J 2006, 48(3):463-474.
35. Messing J, Bharti AK, Karlowski WM, Gundlach H, Kim HR, Yu Y, WeiF, Fuks G, Soderlund CA, Mayer KFX, et al.: Sequence composi-tion and genome organization of maize. Proc Natl Acad Sci USA2004, 101(40):14349-14354.
36. Lai C, Yu Q, Hou S, Skelton R, Jones M, Lewis K, Murray J, Eustice M,Guan P, Agbayani R, et al.: Analysis of papaya BAC endsequences reveals first insights into the organization of afruit tree genome. Molecular Genetics and Genomics 2006,276(1):1-12.
37. Venter JC, Smith HO, Hood L: A new strategy for genomesequencing. Nature 1996, 381(6581):364-366.
38. Smith DB, Flavell RB: Characterization of wheat genome byrenaturation kinetics. Chromosoma 1975, 50:223-242.
39. Akhunov ED, Akhunova AR, Dvorak J: BAC libraries of Triticumurartu, Aegilops speltoides and Ae. tauschii, the diploidancestors of polyploid wheat. Theor Appl Genet 2005,111(8):1617-1622.
40. Kent WJ: BLAT--the BLAST-like alignment tool. Genome Res2002, 12(4):656-664.
41. Soderlund C, Nelson W, Shoemaker A, Paterson A: SyMAP: A sys-tem for discovering and viewing syntenic regions of FPCmaps. Genome Res 2006, 16(9):1159-1168.
42. Lai J, Ma J, Swigonova Z, Ramakrishna W, Linton E, Llaca V, TanyolacB, Park YJ, Jeong OY, Bennetzen JL, et al.: Gene loss and move-ment in the maize genome. Genome Res 2004,14(10A):1924-1931.
43. Salse J, Bolot S, Throude M, Jouffe V, Piegu B, Quraishi UM, CalcagnoT, Cooke R, Delseny M, Feuillet C: Identification and characteri-zation of shared duplications between rice and wheat pro-vide new insight into grass genome evolution. Plant Cell 2008,20(1):11-24.
44. Yu J, Wang J, Lin W, Li S, Li H, Zhou J, Ni P, Dong W, Hu S, Zeng C,et al.: The genomes of Oryza sativa: A history of duplications.PLoS Biology 2005, 3(2):e38.
45. Wei F, Coe E, Nelson W, Bharti AK, Engler F, Butler E, Kim H, Goic-oechea JL, Chen M, Lee S, et al.: Physical and genetic structure ofthe maize genome reflects its complex evolutionary history.PLoS Genetics 2007, 3(7):e123.
46. Paterson AH, Bowers JE, Chapman BA: Ancient polyploidizationpredating divergence of the cereals, and its consequences forcomparative genomics. PNAS 2004, 101(26):9903-9908.
47. Blanc G, Barakat A, Guyot R, Cooke R, Delseny M: Extensive dupli-cation and reshuffling in the Arabidopsis genome. Plant Cell2000, 12(7):1093-1101.
48. Vision TJ, Brown DG, Tanksley SD: The origins of genomic dupli-cations in Arabidopsis. Science 2000, 290(5499):2114-2117.
49. Arumuganathan K, Earle ED: Nuclear DNA content of someimportant plant species. Plant Mol Biol Reptr 1991, 9:211-215.
50. Sorrells ME, La Rota M, Bermudez-Kandianis CE, Greene RA, KantetyR, Munkvold JD, Miftahudin , Mahmoud A, Ma X, Gustafson PJ, et al.:Comparative DNA sequence analysis of wheat and ricegenomes. Genome Res 2003, 13(8):1818-1827.
51. Akhunov ED, Akhunov AR, Linkiewicz AM, Dubcovsky J, Hummel D,Lazo GL, Chao S, Anderson OD, David J, Qi L-L, Echalier B, et al.:Synteny pertubations between wheat homoeologous chro-mosomes caused by locus duplications and deletions corre-late with recombination rates. Proc Natl Acad Sci USA 2004,100:10836-10841.
52. Lazo GR, Chao S, Hummel DD, Edwards H, Crossman CC, Lui N,Matthews DE, Carollo VL, Hane DL, You FM, et al.: Developmentof an expressed sequence tag (EST) resource for wheat(Triticum aestivum L.): EST generation, unigene analysis,probe selection and bioinformatics for a 16,000-locus bin-delineated map. Genetics 2004, 168(2):585-593.
53. Nelson W, Soderlund C: Integrating sequence with FPCfinger-print maps. Nucleic Acids Res 2009, 37(5):e36.
Page 13 of 13(page number not for citation purposes)
Copyright © 2022 FDOKUMEN