Comparative DNA Sequence Analysis of Wheat and Rice Genomes
10
Comparative DNA Sequence Analysis of Wheat and Rice Genomes Mark E. Sorrells, 1,15 Mauricio La Rota, 1 Catherine E. Bermudez-Kandianis, 1 Robert A. Greene, 1 Ramesh Kantety, 1 Jesse D. Munkvold, 1 Miftahudin, 2 Ahmed Mahmoud, 2 Xuefeng Ma, 2 Perry J. Gustafson, 3 Lili L. Qi, 4 Benjamin Echalier, 4 Bikram S. Gill, 4 David E. Matthews, 5 Gerard R. Lazo, 5 Shiaoman Chao, 5 Olin D. Anderson, 5 Hugh Edwards, 6 Anna M. Linkiewicz, 6 Jorge Dubcovsky, 6 Eduard D. Akhunov, 6 Jan Dvorak, 6 Deshui Zhang, 7 Henry T. Nguyen, 2 Junhua Peng, 8 Nora L.V. Lapitan, 8 Jose L. Gonzalez-Hernandez, 9 James A. Anderson, 9 Khwaja Hossain, 10 Venu Kalavacharla, 10 Shahryar F. Kianian, 10 Dong-Woog Choi, 11 Timothy J. Close, 11 Muharrem Dilbirligi, 12 Kulvinder S. Gill, 12 Camille Steber, 12 Mary K. Walker-Simmons, 13 Patrick E. McGuire, 14 and Calvin O. Qualset 14 1 Department of Plant Breeding, Cornell University, Ithaca, New York 14853, USA; 2 Department of Agronomy, University of Missouri, Columbia, Missouri 65211, USA; 3 USDA-ARS, University of Missouri, Columbia, Missouri 65211, USA; 4 Department of Plant Pathology, Kansas State University, Manhattan, Kansas 66506, USA; 5 USDA/ARS Western Regional Research Center, Albany, California 94710, USA; 6 Department of Agronomy and Range Science, University of California, Davis, Davis, California 95616, USA; 7 Department of Plant and Soil Science, Texas Tech University, Lubbock, Texas 79409, USA; 8 Department of Soil and Crop Sciences, Colorado State University, Fort Collins, Colorado 80524, USA; 9 Department of Agronomy and Plant Genetics, University of Minnesota, Twin Cities, St. Paul, Minnesota 55108-6026, USA; 10 Department of Plant Sciences, North Dakota State University, Fargo, North Dakota 58105-5051, USA; 11 Department of Botany and Plant Science, University of California, Riverside, California 92521, USA; 12 Department of Crop and Soil Sciences, Washington State University, Pullman, Washington 99164-6420, USA; 13 USDA-ARS National Program Staff, Beltsville, Maryland 20705-5139, USA; 14 Genetic Resources Conservation Program, University of California, Davis, Davis, California 95616, USA The use of DNA sequence-based comparative genomics for evolutionary studies and for transferring information from model species to crop species has revolutionized molecular genetics and crop improvement strategies. This study compared 4485 expressed sequence tags (ESTs) that were physically mapped in wheat chromosome bins, to the public rice genome sequence data from 2251 ordered BAC/PAC clones using BLAST. A rice genome view of homologous wheat genome locations based on comparative sequence analysis revealed numerous chromosomal rearrangements that will significantly complicate the use of rice as a model for cross-species transfer of information in nonconserved regions. [Supplemental material is available online at www.genome.org and also at the GrainGenes Web site: http://wheat.pw. usda.gov/pubs/2003/Sorrells/.] Comparative genomics encompasses cross-genome comparisons of structure and function to estimate similarity of biological or- ganization. Organismal evolution often provides threads of con- tinuity that allow comparative biological analyses to link genes, proteins, genomes, and traits across species and genera. These relational patterns can lead to new knowledge, hypotheses, and predictions about related species. Research ranging from the whole organism to the DNA level has contributed much to our knowledge of genome structure and function due to the comple- mentation of research among scientists from different disciplines studying different species. Comparative genomics research has several goals: (1) to compare the organization of related genomes and infer the basic processes of genome evolution, (2) to transfer information from model species to related organisms, and (3) to integrate information on gene location and expression across species. Crop improvement programs can use comparative genet- ics to transfer information about genes from model species to their species of interest, to help identify the genes controlling traits of interest, and to assess within-species allelic diversity so that the best alleles can be identified and assembled in superior varieties. Comparative Mapping of Poaceae Comparative genomics in the grass family (Poaceae) is of particu- lar importance. The family comprises a number of economically 15 Corresponding author. E-MAIL [email protected]; FAX (607) 255-6683. Article and publication are at http://www.genome.org/cgi/doi/10.1101/ gr.1113003. Letter 1818 Genome Research 13:1818–1827 ©2003 by Cold Spring Harbor Laboratory Press ISSN 1088-9051/03 $5.00; www.genome.org www.genome.org
-
Upload
independent -
Category
Documents
-
view
0 -
download
0
Transcript of Comparative DNA Sequence Analysis of Wheat and Rice Genomes

Comparative DNA Sequence Analysis of Wheat andRice GenomesMark E. Sorrells,1,15 Mauricio La Rota,1 Catherine E. Bermudez-Kandianis,1
Robert A. Greene,1 Ramesh Kantety,1 Jesse D. Munkvold,1 Miftahudin,2
Ahmed Mahmoud,2 Xuefeng Ma,2 Perry J. Gustafson,3 Lili L. Qi,4 Benjamin Echalier,4
Bikram S. Gill,4 David E. Matthews,5 Gerard R. Lazo,5 Shiaoman Chao,5
Olin D. Anderson,5 Hugh Edwards,6 Anna M. Linkiewicz,6 Jorge Dubcovsky,6
Eduard D. Akhunov,6 Jan Dvorak,6 Deshui Zhang,7 Henry T. Nguyen,2 Junhua Peng,8
Nora L.V. Lapitan,8 Jose L. Gonzalez-Hernandez,9 James A. Anderson,9
Khwaja Hossain,10 Venu Kalavacharla,10 Shahryar F. Kianian,10 Dong-Woog Choi,11
Timothy J. Close,11 Muharrem Dilbirligi,12 Kulvinder S. Gill,12 Camille Steber,12
Mary K. Walker-Simmons,13 Patrick E. McGuire,14 and Calvin O. Qualset141Department of Plant Breeding, Cornell University, Ithaca, New York 14853, USA; 2Department of Agronomy, University ofMissouri, Columbia, Missouri 65211, USA; 3USDA-ARS, University of Missouri, Columbia, Missouri 65211, USA; 4Department ofPlant Pathology, Kansas State University, Manhattan, Kansas 66506, USA; 5USDA/ARS Western Regional Research Center,Albany, California 94710, USA; 6Department of Agronomy and Range Science, University of California, Davis, Davis, California95616, USA; 7Department of Plant and Soil Science, Texas Tech University, Lubbock, Texas 79409, USA; 8Department of Soiland Crop Sciences, Colorado State University, Fort Collins, Colorado 80524, USA; 9Department of Agronomy and Plant Genetics,University of Minnesota, Twin Cities, St. Paul, Minnesota 55108-6026, USA; 10Department of Plant Sciences, North DakotaState University, Fargo, North Dakota 58105-5051, USA; 11Department of Botany and Plant Science, University of California,Riverside, California 92521, USA; 12Department of Crop and Soil Sciences, Washington State University, Pullman, Washington99164-6420, USA; 13USDA-ARS National Program Staff, Beltsville, Maryland 20705-5139, USA; 14Genetic ResourcesConservation Program, University of California, Davis, Davis, California 95616, USA
The use of DNA sequence-based comparative genomics for evolutionary studies and for transferring informationfrom model species to crop species has revolutionized molecular genetics and crop improvement strategies. Thisstudy compared 4485 expressed sequence tags (ESTs) that were physically mapped in wheat chromosome bins, to thepublic rice genome sequence data from 2251 ordered BAC/PAC clones using BLAST. A rice genome view ofhomologous wheat genome locations based on comparative sequence analysis revealed numerous chromosomalrearrangements that will significantly complicate the use of rice as a model for cross-species transfer of informationin nonconserved regions.
[Supplemental material is available online at www.genome.org and also at the GrainGenes Web site: http://wheat.pw.usda.gov/pubs/2003/Sorrells/.]
Comparative genomics encompasses cross-genome comparisonsof structure and function to estimate similarity of biological or-ganization. Organismal evolution often provides threads of con-tinuity that allow comparative biological analyses to link genes,proteins, genomes, and traits across species and genera. Theserelational patterns can lead to new knowledge, hypotheses, andpredictions about related species. Research ranging from thewhole organism to the DNA level has contributed much to ourknowledge of genome structure and function due to the comple-mentation of research among scientists from different disciplines
studying different species. Comparative genomics research hasseveral goals: (1) to compare the organization of related genomesand infer the basic processes of genome evolution, (2) to transferinformation from model species to related organisms, and (3) tointegrate information on gene location and expression acrossspecies. Crop improvement programs can use comparative genet-ics to transfer information about genes from model species totheir species of interest, to help identify the genes controllingtraits of interest, and to assess within-species allelic diversity sothat the best alleles can be identified and assembled in superiorvarieties.
Comparative Mapping of PoaceaeComparative genomics in the grass family (Poaceae) is of particu-lar importance. The family comprises a number of economically
15Corresponding author.E-MAIL [email protected]; FAX (607) 255-6683.Article and publication are at http://www.genome.org/cgi/doi/10.1101/gr.1113003.
Letter
1818 Genome Research 13:1818–1827 ©2003 by Cold Spring Harbor Laboratory Press ISSN 1088-9051/03 $5.00; www.genome.orgwww.genome.org

important plants, such as rice (Oryza sativa L.), maize (Zea maysL.), wheat (Triticum aestivum L.), sorghum (Sorghum vulgare L.),barley (Hordeum vulgare L.), rye (Secale cereale L.), and others. Eventhough Poaceae species diverged over 65 million years ago, com-parative mapping studies have indicated that there is a high levelof gene order conservation at the macro level (e.g., Hulbert et al.1990; Ahn et al. 1993; Kurata et al. 1994; Van Deynze et al.1995a,b,c; Moore et al. 1997; Gale and Devos 1998). For the do-mesticated grasses, the conserved linkage blocks and their rela-tionships with rice linkage groups have led to hypotheses aboutthe basic organization of the ancestral grass genome (Moore et al.1995; Gale and Devos 1998; Wilson et al. 1999) and have pro-vided impetus for examining genome conservation in more de-tail. Conservation of gene content and order at the megabaselevel is critical for efficient utilization of model species for posi-tional gene cloning (Tanksley et al. 1995), development of mo-lecular markers, and for identifying the region in the model spe-cies that might contain candidate genes responsible for a trait ofinterest. Rice (2n = 24), having a small genome and great eco-nomic significance, was the first grass species selected for genomesequencing (Dickson and Cyranoski 2001; Goff et al. 2002; Yu etal. 2002). In contrast, wheat, a polyploid (2n = 6x, AA, BB, DDgenomes), with a genome size 40 times larger than that of rice(Argumuganathan and Earle 1991), 25%–30% gene duplication(Anderson et al. 1992; Dubcovsky et al. 1996; Akhunov et al.2003), and over 80% repeated DNA can clearly benefit from com-parative genomics. Hexaploid wheat has a haploid chromosomecomplement composed of three related genomes, (A, B, and D),each containing seven chromosomes. Chromosomes 4, 5, and 7are involved in a complex interchange (Naranjo et al. 1987),whereas the rest of the chromosomes in the A, B, and D genomesare largely colinear (Gale and Devos 1998).
Micro-ColinearityMicro-colinearity has been shown to be conserved in some re-gions between barley (Dunford et al. 1995) or wheat (Yan et al.2003) and rice. Investigations of the Sh2/A1 orthologous regionin rice, sorghum, and maize (Bennetzen and Ramakrishna 2002),and species in the Triticeae (Li and Gill 2002) showed that theregion was largely colinear, but some anomalies were observed: Atandem duplication of an a1 homolog in sorghum could not bedetected by linkage mapping; there was a high degree of diver-gence for intergenic sequences, and intergenic distances weremore than sevenfold greater in maize (Bennetzen and Ra-makrishna 2002) and 4- to 195-fold greater in the Triticeae (Liand Gill 2002). Furthermore, the colinearity of these loci inwheat and barley was interrupted by intergenic breakages andsegmental translocation to nonhomologous chromosomes (Liand Gill 2002). Gene composition and order were conserved inthe adh1 region of maize and sorghum, but not in rice (Tikhonovet al. 1999; Tarchini et al. 2000). Duplications of loci separated bylarge genetic distances in different regions of the same chromo-some can complicate comparative mapping, especially whenpolymorphism levels limit the number of fragments mapped in agiven population (Chen et al. 1997). Gene duplication followedby sequence divergence and small translocations of single genes(Tarchini et al. 2000), multigene families (Dubcovsky and Dvorak1995), the rapidly evolving nature of certain genes, such as dis-ease resistance genes (Leister et al. 1998; Keller and Feuillet 2000),and ectopic recombination to inter- and intrachromosomal sitescan all lead to rapid rearrangement of resistance-like genes andnonsyntenic distribution in cereal genomes (Leister et al. 1998).
Clearly, macro-colinearity does not always predict micro-colinearity, thus complicating the use of model species for mo-lecular breeding and genetics. Assessment of micro-colinearity
requires extensive investment in phenotyping and large popula-tion mapping for fine-scale analysis. Accurate characterization ofthe colinearity of the rice and wheat genomes would consider-ably improve predictability and efficiency of information transfer.
Whole Genome Comparative Mappingby Sequence MatchingSouthern hybridization using anchor probes (Van Deynze et al.1998) has been the method of choice for evaluating relationshipsamong species and genera and can detect genome fragments es-timated to be at least 80% similar. Other methods such as PCR-based fragment amplification may be an all or none reaction(dominant), may amplify nonorthologous loci, or because ofprimer specificity, inadequately sample sequence variation. Theutility of high-density comparative maps is readily apparent inany attempt to identify candidate genes and for marker-assistedselection (MAS). The density of comparative maps using DNAsequence matching is limited by the number of mapped ESTsand/or genomic sequences available for each of the species ofinterest. By manipulating sequence matching parameters, falsehits and paralogs can be identified and analyzed. For those genesthat have diverged to the point where it is difficult to identifyorthologs using DNA sequence, predicted amino acid sequencesand more sophisticated pattern matching methods can be usedto search for similarities. Comparative mapping by comparativesequence analysis can be validated by using previouslymapped andsequenced genes to estimate predictability in both animals (Band etal. 2000; Rebeiz and Lewin 2000) and plants (Sorrells 2000).
A U.S. National Science Foundation-funded wheat expressedsequence tag (EST) project has been studying the structure andfunction of the expressed portion of the wheat genome by map-ping wheat unigenes to individual chromosome regions. Repre-sentative ESTs, each belonging to one of the unigenes (http://wheat.pw.usda.gov/NSF/progress_mapping.html) were used formapping in the wheat genome utilizing 101 wheat deletionstocks, each of which contain a deletion of a defined part of achromosome (Endo and Gill 1996), referred to as deletion map-ping. As of November 2002, over 100,000 ESTs from various tis-sues of wheat at different stages of development have been se-quenced, and 4485 wheat unigenes have been deletion mappedby this project.
The availability of rice genome DNA sequence data frommultiple sources (Dickson and Cyranoski 2001; Goff et al. 2002;Yu et al. 2002) has allowed for an in-depth comparison of genesin the Poaceae and beyond. The portion of the rice genome se-quence that could be accurately ordered was used to directlyassess the colinearity of genes with those that have been bin-mapped in wheat. This report provides an overview of the struc-tural relationships between the rice and wheat genomes giventhe present state of knowledge and available data. Data, figures,and supporting analyses for this research can be obtained fromGrainGenes (http://wheat.pw.usda.gov/pubs/2003/Sorrells). Thepurpose of this study was to construct sequence-based compara-tive maps between rice and wheat using mapped wheat ESTs andrice genome sequence data. High-resolution, sequence-basedmaps can be used to transfer information from model species torelated organisms, integrate information on gene location andexpression across species, compare genome structure, and inferevolutionary processes.
METHODS
Source of SequencesGenetic map and cDNA information was obtained from Grain-Genes (http://wheat.pw.usda.gov/), RiceGenes (now Gramene;
Comparative Analysis of Wheat and Rice Genomes
Genome Research 1819www.genome.org

http://www.gramene.org/), MaizeDB (http://www.agron.missouri.edu/), and the Japan rice genome project (RGP; http://rgp.dna.affrc.go.jp) databases. BAC/PAC sequences available inMay 2002 were downloaded from NCBI Entrez (http://www.ncbi.nlm.nih.gov). The sequence and related information of155,726 wheat ESTs, along with 638 wheat mRNA sequences and497 sequenced and mapped cDNA clones were downloaded fromdbEST/Entrez or from the plant division of GenBank. Two localdatabases were designed to hold all the wheat EST and rice ge-nomic sequence information, sequences of genetically mappedmarkers, and all the analysis results. A local mirror of the wESTdatabase (http://wheat.pw.usda.gov/wEST/) contained all thewheat EST deletion mapping results. Only ESTs with knownphysical locations in wheat were included (Figs. 1, 2). The ESTswere selected from unigene contigs that were based on a Phrapassembly of 7929 contigs using penalty �5, minmatch 50, andminscore 100 as parameters. Because the majority of the ESTsused for generating the unigene set was from 5� sequencing,clones from putative unigene contigs were 3� sequenced and sub-mitted to the Cross-Match program for identification of dupli-cate contigs more than 90% similar over 100 bases or more(http://wheat.pw.usda.gov/NSF/curator/assembly.html). At thetime of download, the percentage of each of the rice chromo-somes sequenced ranged from 15% to 123% (Table 1). The per-cent completion included overlapping BAC sequences, thus re-sulting in numbers exceeding 100%.
Deletion MappingDeletion mapping was performed by hybridizing the cDNA clonecorresponding to each EST to a Southern blot of DNA from apanel of wheat genetic stocks, each missing a different terminalportion of a chromosome arm (Qi et al. 2003). Absence of aparticular restriction fragment in the lane for a particular stockindicates that the locus is distal to the corresponding deletionbreakpoint (Fig. 2). The regions between adjacent breakpoints arereferred to as bins. The deletion mapping of 4485 ESTs represen-tative of unigenes (http://wheat.pw.usda.gov/NSF/progress_mapping.html) in hexaploid wheat utilized 101 wheat geneticstocks with specific regions of chromatin deleted (Fig. 2; Endoand Gill 1996; Qi et al. 2003) obtained from B.S. Gill (KansasState University) and the nulli-tetrasomic and ditelosomic aneu-ploids (Sears 1954; Sears and Sears 1978) obtained from theUSDA-Sears collection of wheat genetic stocks (University of Mis-souri). These genetic stocks allowed for the assignment of frag-ments to specific bins delineated by the deletion breakpoints onindividual chromosomes.
Ordering of Rice BAC/PAC ClonesThe correct ordering of rice BAC/PACs was critical for analyzingthe rice-to-wheat relationship. No single source among the mem-bers of the international rice genome sequencing effort providedan order for all of the BAC/PACs and their overlaps. To estimatethe correct ordering of the clones, the following sources of infor-mation were used along with manual checking of incongruities:(1) chromosome assignment of BAC/PAC clones provided by theInternational Rice Genome Sequencing Project (IRGSP) consor-tium (http://www.tigr.org/tdb/e2k1/osa1/sequencing.shtml), (2)fingerprinting data for the BAC/PAC clones, (3) similarity to se-quenced cDNA probes from the genetic map from RGP obtainedfrom The Institute for Genomic Research (TIGR), and (4) BAC/PAC sequence overlaps based on similarity searches of the data-base against itself. The physical map of the rice cultivar ‘Nippon-bare’ genome based on clone fingerprinting was downloadedfrom the Clemson University Genomics Initiative (CUGI; http://www.genome.clemson.edu/projects/rice/fpc/; Chen et al. 2002),who provided in silico digest fingerprints for the sequenced BAC/PACs in their rice fingerprinted contig (FPC) file. This file wasparsed, and the information for assignment of BAC/PAC coordi-nates within the contigs was entered into SQL tables. Both TIGR
and RGP provided tables of sequence matches of BAC/PACs tosequences of genetically mapped cDNAs, and based on the ge-netic map, centimorgan locations were assigned to the BAC/PACs. This gave an approximate location to the BAC/PACs, thatwhen combined with the ordering, within FPC contigs, provideda framework for ordering the clones. On a finer scale, the se-quence overlap between BACs provided the ultimate order. NCBIMegaBLAST was used to scan all 2251 BAC/PACs against them-selves, and the results were imported into SQL tables. Specificqueries were made to filter true end-to-end overlaps from othertypes of matches among the BAC/PACs. Overlaps between BAC/PACs were used to resolve discrepancies between the other infor-mation sources, but were insufficient alone to order all of theclones. Some overlaps provided extra information for linkingFPC contigs that the digest-based fingerprinting failed to join.BAC/PAC clones that were completely contained within theoverlap of adjacent clones were eliminated. Applying this meth-odology to the available sequence data enabled the relative or-dering of the available BAC/PACs into a partial tiling path foreach of the rice chromosomes, though many sequence gaps re-mained in the unfinished chromosomes.
Sequence ComparisonsA total of 4485 deletion-mapped ESTs were compared against thesequences from 2251 rice BAC/PACs using NCBI BLAST. WheatESTs that were not mapped or were only located to chromosomeor arm did not provide a wheat chromosome bin location andwere not used in the analyses. The procedure used to filter andsummarize the BLAST results was as follows: High-scoring pairs(HSPs) with an E-value greater than 1E�15 were rejected. Giventhat a cDNA probe sequence may match and align to severalcontiguous but interrupted regions in the genomic sequence, theBLAST algorithm reported individual matching regions betweena probe-BAC pair as independent HSPs. The statistics, such assum of the bit-scores, total alignment length, and percent iden-tity in the total matched region (%ID) of all the HSPs for anygiven query-subject pair were calculated and summarized. Thequery-subject pairs with greater than 80%ID over greater than50% of the length of the query sequence, but not less than 100bases, were considered significant matches and used for furtheranalysis. Significance of homology between each wheat bin andrice chromosomes was evaluated using a �2 test where the num-ber of ESTs with homology to a particular rice chromosome ver-sus other chromosomes was compared to 1:11, observed:ex-pected, for a random distribution. Bins with class sizes less than4 were not analyzed.
Genome ComparisonsA table was constructed to display the rice BAC/PAC sequencemost similar to each of the mapped wheat ESTs as well as se-quenced and mapped probes. This allowed us to connect thephysical and genetic maps of wheat to the genomic sequence ofrice. The rice BAC/PACs with significant matches to wheat se-quences are shown in order with the wheat chromosome loca-tion for the matching sequence color-coded (Fig. 1). The A, B,and D wheat genomes were used as a single consensus wheatgenome for constructing Figure 1. Rice BAC/PAC clones that didnot match any wheat sequence were omitted from the figure.Figure 1 was trimmed to eliminate redundant information wheremore than one mapped wheat EST matched the same rice BAC/PAC region without providing additional information regardingwheat chromosome location. Identical matches of any wheat se-quence to overlapping regions of two or more BAC/PACs wererepresented as only one match. A reciprocal view (Fig. 2) wasconstructed with the three homologous wheat genomes as inde-pendent sources of genome location. The rice location of all se-quence matches was compiled and displayed according to thedeletion bin location of only single-bin (putative single copy)wheat ESTs, where single-bin/copy genes are those that were
Sorrells et al.
1820 Genome Researchwww.genome.org

Figure 1 Rice–wheat genome relationships. Rice genome view showing the wheat chromosome arm location for the most similar wheat genesequences. Each colored box represents a rice–wheat gene sequence match at � 80% identity. When the wheat EST mapped to more than one wheatchromosome, the other color-coded locations are positioned adjacent to the first. Homologous wheat chromosome locations are grouped together. RiceBAC/PAC sequences that did not match any wheat sequence as well as redundant matches are omitted. The rice centromere location is indicatedby ‘C’.
Comparative Analysis of Wheat and Rice Genomes
Genome Research 1821www.genome.org

Figure 2 Wheat–rice genome relationships. (Left) The wheat C-banding karyotype indicating the positions of deletion breakpoints. (Right) Eachdeletion bin is color-coded according to the rice chromosome matching a significant number (�2 P < 0.01) of wheat ESTs mapped to that bin. Thenumber of those matches is indicated inside the colored rectangle, and the number of matches to all other rice chromosomes is adjacent. Nonsignificantassociation with a rice chromosome or insufficient data is indicated by “ns” adjacent to the bin.
Sorrells et al.
1822 Genome Researchwww.genome.org

mapped to no more than one bin in each of the three homo-logous chromosomes in a group.
Sequence Analysis and Genome CoverageAt the time the rice genome sequence was accessed for this analy-sis (May 2002), approximately 60% of the rice genome had beensequenced by the public sequencing consortium (Table 1). Somenumbers exceeded 100% because the percent completion in-cluded overlapping BAC sequences. Except for rice chromosomes9 and 11, the distribution of sequenced clones along the chro-mosomes was fairly homogenous. Using all available wheat se-quences, best-matches between 63,928 EST/mRNAs and 1828 riceBAC/PACs were compiled, where the average alignment was 386base pairs (std. dev. 394 bp). Because of EST redundancy, some ofthe BAC/PACs had many wheat matches (up to 1473). Amongthe matched BAC/PACs, the overall mean and median were 36and 21, respectively. Highly expressed wheat sequences includedhistones, translation factors, chlorophyll binding protein, heatshock proteins, ribosomal proteins, and rubisco. These filteringcriteria resulted in an overall percent similarity between thewheat and rice sequences of 89.5%. More than half of the wheatEST sequences (90,619 out of 155,726) did not match any ricesequence within the specified parameters. Reasons for not iden-tifying a matching sequence included (1) those portions of therice genome that had not been sequenced, (2) wheat sequencesmay be derived from a less-conserved noncoding region, (3) shortsequences may be adjacent to a masked repeat, (4) stringent fil-tering, and (5) rapid sequence divergence. Similarly, of the 2251rice BAC/PAC clones, 423 (19%) did not have any significantmatching wheat sequence. These BAC/PAC clones were locatedon all rice chromosomes.
To avoid EST redundancy, further work utilized 4485mapped ESTs representative of unigenes. These ESTs consisted of3358 putative single-copy (defined as those assigned to a maxi-mum of one bin per wheat homologous chromosome group) and1127 multiple-copy genes (25%) that were mapped on all 21wheat chromosomes. Mapped wheat sequences identifying a riceBAC/PAC sequence at greater than 80% similarity were utilized toconstruct a comparative sequence map (Fig. 1). For 1247 single-bin mapped wheat ESTs, the corresponding sequences identifiedin rice ranged from 15 matches to 11 BAC/PACs on rice chromo-some (R) R11 (with little genomic sequence available) to 249matches to 170 BAC/PACs on R1 (Fig. 2). Map locations of wheatcDNAs were based either on linkage analyses of segregatingpopulations or on physical location derived from deletion lines.A total of 217 cDNAs with linkage map location that matchedrice genome sequence were sorted with those mapped to deletionbins, thus providing a second framework for comparing colin-earity. A total of 2872 deletion-mapped wheat unigenes did not
match any rice sequence and were well distributed among thewheat chromosomes in the three genomes, with a higher pro-portion mapping near the ends of the chromosomes.
RESULTS AND DISCUSSION
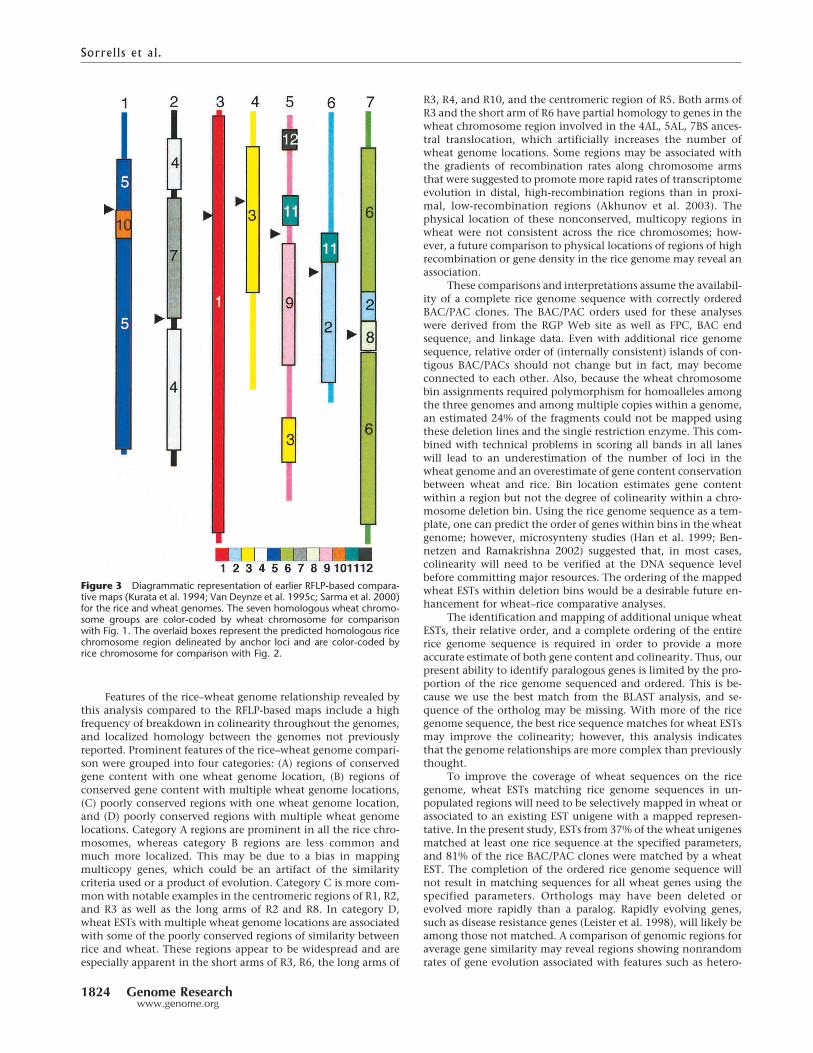
Comparative Analysis of Wheat Gene Locationsin the Rice GenomeConservation of gene identity and colinearity between wheatand rice will depend on the rate of genome/gene evolution andrearrangement in both species. Figure 1 provides an overview,from the rice genome perspective, of the genome relationshipsbetween rice and wheat at the resolution of the wheat chromo-some arm. There are a number of interesting features that be-come apparent in this rice genome view of the homologous re-gions of the wheat genome (Fig. 1). The structural relationshipsbetween the genomes indicate that for most individual rice chro-mosomes there is a preponderance of wheat genes from one ortwo wheat homologous groups. For example, wheat ESTs match-ing sequences on rice chromosome 1 are largely fromwheat chro-mosome group (W) W3, whereas R2 and R3 are generally relatedto W6 and W4. For some wheat chromosomes there is homologyto two rice chromosomes. R4 and R7 are related to W2, R5 andR10 to W1, and R6 and R8 to W7. Although there are regions ofgene content conservation that are apparent in all rice chromo-somes, some contain regions related to more than one wheatchromosome. Rice centromere locations are shown; however, formost of the rice chromosomes, the centromere locations did notcorrespond well with centromere locations in wheat (data notshown). Most of these genome relationships were apparent fromearlier RFLP-based comparative maps (Fig. 3; Kurata et al. 1994;Van Deynze et al. 1995a,b,c; Sarma et al. 2000). Rice homology togenes on the long arms of wheat chromosomes predominate,presumably because there are more expressed genes on long ver-sus short arms (Table 1). For R1, R2, and R3, which are mostlyrelated to one wheat chromosome, 39%, 30%, and 36% of theESTs mapped to the short arms of wheat, respectively. Rice chro-mosomes 4 and 7 complement their relationship to W2 with11% and 62% homology to wheat short arms, respectively.Whereas R5 and R10 were related to W1, homology to short armswas only 28% and 17%. Rice chromosomes 6 and 8 were com-parable with 36% and 38% homology to wheat short arms. Thelimited sequence data available for R9, R11, and R12 precludeddetailed analyses of their relationship to wheat.
Table 1. Total Number of BAC/PAC Clones Analyzed, BAC/PAC Clones With Mapped Wheat EST Sequences, Percent Sequenced forEach of the Rice Chromosomes, and Percent Short Arm Wheat ESTs Represented
Ricechromosome
Percentsequenced
Number of BAC/PAC clones
Percent shortarm wheat ESTsTotal
Totalordered
With mappedESTs
With single-binESTs
1 122 420 394 240 170 392 80 284 235 152 120 303 47 162 155 109 90 364 123 229 218 99 88 115 44 126 125 71 53 286 86 231 199 112 82 367 73 227 172 84 73 628 74 204 164 76 66 389 15 27 27 20 13 1510 115 189 146 54 53 1711 16 29 29 11 11 6012 46 82 72 27 27 50
Comparative Analysis of Wheat and Rice Genomes
Genome Research 1823www.genome.org
Features of the rice–wheat genome relationship revealed bythis analysis compared to the RFLP-based maps include a highfrequency of breakdown in colinearity throughout the genomes,and localized homology between the genomes not previouslyreported. Prominent features of the rice–wheat genome compari-son were grouped into four categories: (A) regions of conservedgene content with one wheat genome location, (B) regions ofconserved gene content with multiple wheat genome locations,(C) poorly conserved regions with one wheat genome location,and (D) poorly conserved regions with multiple wheat genomelocations. Category A regions are prominent in all the rice chro-mosomes, whereas category B regions are less common andmuch more localized. This may be due to a bias in mappingmulticopy genes, which could be an artifact of the similaritycriteria used or a product of evolution. Category C is more com-mon with notable examples in the centromeric regions of R1, R2,and R3 as well as the long arms of R2 and R8. In category D,wheat ESTs with multiple wheat genome locations are associatedwith some of the poorly conserved regions of similarity betweenrice and wheat. These regions appear to be widespread and areespecially apparent in the short arms of R3, R6, the long arms of
R3, R4, and R10, and the centromeric region of R5. Both arms ofR3 and the short arm of R6 have partial homology to genes in thewheat chromosome region involved in the 4AL, 5AL, 7BS ances-tral translocation, which artificially increases the number ofwheat genome locations. Some regions may be associated withthe gradients of recombination rates along chromosome armsthat were suggested to promote more rapid rates of transcriptomeevolution in distal, high-recombination regions than in proxi-mal, low-recombination regions (Akhunov et al. 2003). Thephysical location of these nonconserved, multicopy regions inwheat were not consistent across the rice chromosomes; how-ever, a future comparison to physical locations of regions of highrecombination or gene density in the rice genome may reveal anassociation.
These comparisons and interpretations assume the availabil-ity of a complete rice genome sequence with correctly orderedBAC/PAC clones. The BAC/PAC orders used for these analyseswere derived from the RGP Web site as well as FPC, BAC endsequence, and linkage data. Even with additional rice genomesequence, relative order of (internally consistent) islands of con-tigous BAC/PACs should not change but in fact, may becomeconnected to each other. Also, because the wheat chromosomebin assignments required polymorphism for homoalleles amongthe three genomes and among multiple copies within a genome,an estimated 24% of the fragments could not be mapped usingthese deletion lines and the single restriction enzyme. This com-bined with technical problems in scoring all bands in all laneswill lead to an underestimation of the number of loci in thewheat genome and an overestimate of gene content conservationbetween wheat and rice. Bin location estimates gene contentwithin a region but not the degree of colinearity within a chro-mosome deletion bin. Using the rice genome sequence as a tem-plate, one can predict the order of genes within bins in the wheatgenome; however, microsynteny studies (Han et al. 1999; Ben-netzen and Ramakrishna 2002) suggested that, in most cases,colinearity will need to be verified at the DNA sequence levelbefore committing major resources. The ordering of the mappedwheat ESTs within deletion bins would be a desirable future en-hancement for wheat–rice comparative analyses.
The identification and mapping of additional unique wheatESTs, their relative order, and a complete ordering of the entirerice genome sequence is required in order to provide a moreaccurate estimate of both gene content and colinearity. Thus, ourpresent ability to identify paralogous genes is limited by the pro-portion of the rice genome sequenced and ordered. This is be-cause we use the best match from the BLAST analysis, and se-quence of the ortholog may be missing. With more of the ricegenome sequence, the best rice sequence matches for wheat ESTsmay improve the colinearity; however, this analysis indicatesthat the genome relationships are more complex than previouslythought.
To improve the coverage of wheat sequences on the ricegenome, wheat ESTs matching rice genome sequences in un-populated regions will need to be selectively mapped in wheat orassociated to an existing EST unigene with a mapped represen-tative. In the present study, ESTs from 37% of the wheat unigenesmatched at least one rice sequence at the specified parameters,and 81% of the rice BAC/PAC clones were matched by a wheatEST. The completion of the ordered rice genome sequence willnot result in matching sequences for all wheat genes using thespecified parameters. Orthologs may have been deleted orevolved more rapidly than a paralog. Rapidly evolving genes,such as disease resistance genes (Leister et al. 1998), will likely beamong those not matched. A comparison of genomic regions foraverage gene similarity may reveal regions showing nonrandomrates of gene evolution associated with features such as hetero-
Figure 3 Diagrammatic representation of earlier RFLP-based compara-tive maps (Kurata et al. 1994; Van Deynze et al. 1995c; Sarma et al. 2000)for the rice and wheat genomes. The seven homologous wheat chromo-some groups are color-coded by wheat chromosome for comparisonwith Fig. 1. The overlaid boxes represent the predicted homologous ricechromosome region delineated by anchor loci and are color-coded byrice chromosome for comparison with Fig. 2.
Sorrells et al.
1824 Genome Researchwww.genome.org

chromatin or recombination hot spots, all of which should betaken into account for an accurate comparative map.
Comparative Analysis of Rice Gene Locationsin the Wheat GenomeA reciprocal view of Figure 1 shows the relationship between thewheat and rice genomes revealing the conservation of gene con-tent and order at the resolution conferred by the chromosomedeletions in the wheat genome (Fig. 2). Deletion lines used formapping in this project provided five to 12 physical locations perchromosome, but within deletion bins, gene order cannot beascertained directly. Comparisons of gene complement acrossthe three genomes will not be accurate, because the size of thedeletion bins varied among the homologs and because suchcomparisons are sensitive to mapping errors. Only single-bingenes (maximum of three loci mapped in a single homologouschromosome group of wheat) are shown in Figure 2; thus, manymore rice chromosomes will contain homologous sequences forgenes mapped to these deletion bins when the multiple-copygenes are included. The relative order of genes within bins couldbe inferred from a comparison to the rice genome sequence butwould require verification in wheat using other methods.
In Figure 2, the rice chromosome(s) with the largest numberof homologous sequences for ESTs in each wheat bin are color-coded, and the number of ESTs matching sequences on other ricechromosomes is shown adjacent to the bin. Although the previ-ous chromosome relationships (Fig. 1) are apparent, in this fig-ure, the heterogeneity in gene content and homology along thechromosomes reveal the complexity of evolutionary divergencebetween wheat and rice. It is clear that patterns of conservationdiffer within and among chromosomes. The long arm of W2 ismore closely related to R4, whereas the short arm of W2 is relatedto R7. Wheat 7 is related to R6 and R8 but the conservationpatterns are quite different. Wheat 7 genes from both arms arehomologous to sequences on both R6 and R8, but R8 is largelycentromeric whereas R6 is distal. A similar pattern was observedfor W1 with R10 being proximal and R5 distal. Wheat group 5appeared to be the least conserved, with genes scattered across allrice chromosomes represented; however, some regions of homol-ogy to R3, R9, and R12 are evident across all three homologs.Because little sequence was available from R9 and R11, morewheat ESTs mapping to W5 will probably match those two ricechromosomes with additional sequence data. A similar relation-ship betweenW5 and rice based on RFLP was previously reported(Sarma et al. 2000). Genes mapped to wheat group 4 are mostlyrelated to R3, although in this analysis, the ancestral 4AL, 5AL,7BS translocation in wheat shows up on 4AL as being related toR6 and R3. Wheat groups 3 and 6 showed the best conservationof gene order and content with highly significant associations toR1 and R2, respectively. Over all wheat chromosomes, even inthe most conserved regions, deletion bins containing only se-quences from one rice chromosome are rare, and they tend to bein the centromeric region, where few genes have been mapped inwheat so far. These data suggest that during cereal evolutionthere has been an abundance of rearrangements, insertions, de-letions, and duplications that will complicate the utilization ofmany regions of the rice genome for cross-species transfer ofinformation. This disruption in the colinearity of genes willgreatly complicate map-based cloning and the selection of linkedmarkers. The concentration of mapped genes in many distal de-letion bins of wheat chromosomes concurs with previous inves-tigations showing that gene-rich regions are predominantly nearthe ends of many wheat chromosomes (for review, see Moore2000). However, this assumes that genes in all regions aremapped in equal proportions. Previous sequencing studies have
reported gene densities of about one gene every 40 kb in wheat orwheat relatives (Keller and Feuillet 2000; San Miguel et al. 2002).However, the observed gene densities in wheat and barley are stillgreater than the expected average gene density of one gene per220 kb (Lagudah et al. 2001), as predicted based on cDNA map-ping of wheat deletion lines (Gill et al. 1996; Faris et al. 2000).These results suggest that most Triticeae genes might be associ-ated with gene-rich regions. Gene-rich regions are prime candi-dates for large-scale wheat genomic sequencing projects that willlikely be necessary for fully exploiting the information in thewheat genome.
Comparisons to Previous Comparative MapsPrevious comparative maps between wheat and rice (Ahn et al.1993; Kurata et al. 1994; Van Deynze et al. 1995a,b,c; Devos andGale 1997) were based largely on linkage analysis and utilizedanchor probes (Van Deynze et al. 1998) mapped to multiple spe-cies. Such maps have been necessarily low-resolution and impre-cise due to the small number of common markers. A diagram-matic representation of a wheat–rice comparative map based onSouthern analysis (Fig. 3) illustrates the general chromosome re-lationships for wheat and rice reported earlier (Kurata et al. 1994;Van Deynze et al. 1995a,b,c; Sarma et al. 2000). There are strikingsimilarities and differences between existing low-resolution com-parative maps based on RFLPs and the DNA sequence-based com-parative map described above (Figs. 1,2). The primary differencesare the number of points for comparison and the precision im-parted by the DNA sequence analyses. When comparing wheat–rice relationships in Figure 3 to the deletion bin map in Figure 2,it is important to remember that linkage distances will differsubstantially from physical distances. Rice chromosome 1 wasthe most complete in terms of sequence available and ordering ofthe BAC/PAC clones. As predicted by earlier maps, this chromo-some appeared to be the most conserved relative to wheat andwas composed largely of genes that are homologous to W3. Pre-vious maps did not reveal the high level of conservation betweenW6 and R2, nor the complexity of the relationships between W5and rice chromosomes.
The large number of wheat genes within bins that had ho-mology to several rice chromosomes is contradictory to RFLP-based comparative maps that indicated a high degree of conser-vation. In a review of comparative mapping studies, Gaut (2002)re-analyzed published comparative map data and calculated astatistic called “synteny probability” that is based on the oddsthat moving in either direction along the chromosome, adjacentmarkers will be colinear. Using this statistic, estimates of theconservation of gene order among grass genomes were muchlower than reported earlier (Van Deynze et al. 1995a,b,c; Devos etal. 1998; Wilson et al. 1999). Gaut concluded that grass genomesare evolutionarily labile and less conserved that previouslythought. This was supported by recent comparisons of the ricesubspecies genomic sequences for indica and japonica (Feng et al.2002) as well as genomic sequences from two distantly relatedmaize inbred lines (Fu and Dooner 2002). The high frequency ofinsertions and deletions reported for rice and maize are consis-tent with the results of the present study, and suggests that thesegenomes are more fluid at the DNA sequence level than indicatedby Southern analyses.
These results can be extended to other members of the Poa-ceae by comparing cDNA clones that have been mapped andsequenced in those species. One approach has been illustratedusing a concentric circle diagram that arranges various grass spe-cies by genome size (Gale and Devos 1998). If common genesequences are mapped in each of the species, the genomes can becross-referenced at those points for general comparisons. The
Comparative Analysis of Wheat and Rice Genomes
Genome Research 1825www.genome.org

concentric circles highlight the genome size differences and fa-cilitate multiple species comparisons; however, the utility of thisrepresentation is limited for complex genome relationships. Fur-ther extension of these results to other species would require ESTsfor sequence comparisons with rice and wheat. The enhancedresolution afforded by comparative sequence analyses facilitatescross-referencing of various kinds of information such as quan-titative trait loci, mutants, and gene expression. The greater reso-lution of the comparative DNA sequence-based analysis is mostcritical for transferring information about the location of specificgenes, whereas the greater precision for comparing gene structureand function will greatly benefit evolutionary studies. All specieslinked in such a way contribute unique and valuable informa-tion, because of the wide range of variation in adaptation andevolution as well as the collective intellectual contributions frommore scientists bridging many disciplines.
ConclusionsThe comparative sequence analysis described herein substanti-ates much of the gene content and order in earlier comparativemaps but at a much finer resolution. However, the increasedresolution afforded by sequence analysis of 4485 mapped wheatunigenes revealed numerous discontinuities in gene order be-tween wheat and rice that will complicate any transfer of infor-mation and markers between these species. Resolution of se-quence similarity among species, genomes, and paralogs is vari-able among different genes due to evolutionary pressures as wellas their respective physical genome location. A completely or-dered rice genome sequence and additional analyses are requiredto resolve orthology/paralogy, rearrangements, and duplicationsbetween the wheat and rice genomes. Our results support theview that grass genomes are labile, rapidly evolving entities andthat structural and functional relationships are complex. Thesesequence-based maps will facilitate the use of rice for locatinggenes of interest in wheat; however, most applications will re-quire extensive cross-species mapping, sequencing, and analysisat the BAC level.
ACKNOWLEDGMENTSThis publication is based upon work supported by the NationalScience Foundation under Cooperative Agreement No. DBI-9975989 and USDA/NRI project No. 2001-35301-10612.
The publication costs of this article were defrayed in part bypayment of page charges. This article must therefore be herebymarked “advertisement” in accordance with 18 USC section 1734solely to indicate this fact.
REFERENCESAhn, S., Anderson, J.A., Sorrells, M.E., and Tanksley, S.D. 1993.
Homoeologous relationships of rice, wheat and maize chromosomes.Mol. Gen. Genet. 241: 483–490.
Akhunov, E.D., Goodyear, J.A., Geng, S., Qi, L., Echalier, B., Gill, B.S.,Lazo, G., Chao, S., Anderson, O.D., Linkiewicz, A.M., et al. 2003.The organization and rate of evolution of the wheat genomes arecorrelated with recombination rates along chromosome arms.Genome Res. 5: 753–763.
Anderson, J.A., Ogihara, Y., Sorrells, M.E., and Tanksley, S.D. 1992.Development of a chromosomal arm map for wheat based on RFLPmarkers. Theor. Appl. Genet. 83: 1035–1043.
Argumuganathan, K. and Earle, E.D. 1991. Nuclear DNA content ofsome important plant species. Plant Mol. Biol. Rep. 9: 208.
Band, M.R., Larson, J.H., Rebeiz, M., Green, C.A., Heyen, D.W.,Donovan, J., Windish, R., Steining, C., Mahyuddin, P., Womack,J.E., et al. 2000. An ordered comparative map of the cattle andhuman genomes. Genome Res. 10: 1359–1368.
Bennetzen, J.L. and Ramakrishna, W. 2002. Numerous smallrearrangements of gene content, order, and orientation differentiategrass genomes. Plant Mol. Biol. 48: 821–827.
Chen, M., SanMiguel, P., DeOliveira, A.C., Woo, S.S., Zhang, H., Wing,R.A., and Bennetzen, J.L. 1997. Microcolinearity in sh2-homologous
regions of the maize, rice, and sorghum genomes. Proc. Natl. Acad.Sci. 94: 3431–3435.
Chen, M., Presting, G., Barbazuk, W.B., Goicoechea, J.L., Blackmon, B.,Fang, G., Kim, H., Frisch, D., Yu, Y., Sun, S., et al. 2002. Anintegrated physical and genetic map of the rice genome. The PlantCell 14: 521–523.
Devos, K.M. and Gale, M.D. 1997. Comparative genetics in the grasses.Plant Mol. Biol. 35: 3–15.
Devos, K.M., Wang, Z.M., Beales, J., Sasaki, Y., and Gale, M.D. 1998.Comparative genetic maps of foxtail millet (Setaria italica) and rice(Oryza sativa). Theor. Appl. Genet. 96: 63–68.
Dickson, D. and Cyranoski, D. 2001. Commercial sector scores successwith whole rice genome. Nature 409: 551.
Dubcovsky, J. and Dvorak, J. 1995. Ribosomal RNA loci: Nomads in theTriticeae genomes. Genetics 140: 1367–1377.
Dubcovsky, J., Luo, M.-C., Zhong, G.-Y., Bransteiter, R., Desai, A., Kilian,A., Kleinhofs, A., and Dvorak, J. 1996. Genetic map of diploidwheat, Triticum monococcum L., and its comparison with maps ofHordeum vulgare L. Genetics 143: 983–999.
Dunford, R.P., Kurata, N., Laurie, D.A,. Money, T.A., Minobe, Y., andMoore, G. 1995. Conservation of fine-scale DNA marker order in thegenomes of rice and the Triticeae. Nucleic Acids Res. 23: 2724–2728.
Endo, T.R. and Gill, B.S. 1996. The deletion stocks of common wheat. J.Hered. 87: 295–307.
Faris, J.D., Haen, K.M., and Gill, B.S. 2000. Saturation mapping of agene-rich recombination hot spot region in wheat. Genetics 154:823–835.
Feng, Q., Zhang, Y., Hao, P., Wang, S., Fu, G., Huang, Y., Li, Y., Zhu, J.,Liu, Y., Hu, X. et al. 2002. Sequence analysis of rice chromosome 4.Nature 420: 316–320.
Fu, H. and Dooner, H.K. 2002. Intraspecific violation of colinearity andits implications in maize. Proc. Natl. Acad. Sci. 99: 9573–9578.
Gale, M.D. and Devos, K.M. 1998. Comparative genetics in the grasses.Proc. Natl. Acad. Sci. 95: 1971–1974.
Gaut, B.S. 2002. Evolutionary dynamics of grass genomes. New Phytol.154: 15–28.
Gill, K.S., Gill, B.S., Endo, T.R., and Boyko, E.V. 1996. Identification andhigh-density mapping of gene-rich regions in chromosome Group 5of wheat. Genetics 143: 1001–1012.
Goff, S.A., Ricke, D., Lan, T.-H., Presting, G., Wang, R., Dunn, M.,Glazebrook, J., Sessions, A., Oeller, P., Varma, H., et al. 2002. A draftsequence of the rice genome (Oryza sativa L. ssp. japonica). Science296: 92–100.
Han, F., Kilian, A., Chao, J.P., Kudrna, D., Steffenson, B., Yamamoto, K.,Matsumoto, T., Sasaki, T., and Kleinhofs, A. 1999. Sequence analysisof a rice BAC covering the syntenous barley Rpg1 region. Genome 42:1071–1076.
Hulbert, S.H., Richter, T.E., Axtell, J.D., and Bennetzen, J.L. 1990.Genetic mapping and characterization of sorghum and related cropsby means of maize DNA probes. Proc. Natl. Acad. Sci. 87: 4251–4255.
Keller, B. and Feuillet, C. 2000. Colinearity and gene density in grassgenomes. Trends Plant Sci. 5: 246–251.
Kurata, N., Moore, G., Nagamura, Y., Foote, T., Yano, M., Minobe, Y.,and Gale, M. 1994. Conservation of genomic structure between riceand wheat. Bio. Technol. 12: 276–278.
Lagudah, E., Dubcovsky, J., and Powell, W. 2001. Wheat genomics. PlantPhysiol. Biochem 39: 335–344.
Leister, D., Kurth, J., Laurie, D.A., Yano, M., Sasaki, T., Devos, K.,Graner, A., and Schulze-Lefert, P. 1998. Rapid reorganization ofresistance gene homologues in cereal genomes. Proc. Natl. Acad. Sci.95: 370–375.
Li, W. and Gill, B.S. 2002. The colinearity of the Sh2/A1 orthologousregion in rice sorghum and maize is interrupted and accompaniedby genome expansion in the Triticeae. Genetics 160: 1153–1162.
Moore, G. 2000. Cereal chromosome structure, evolution, and pairing.Annu. Rev. Plant Physiol. Plant Mol. Biol. 51: 195–222.
Moore, G., Devos, K.M., Wang, Z., and Gale, M.D. 1995. Grasses, line upand form a circle. Curr. Biol. 5: 737.
Moore, G., Roberts, M., Aragon-Alcaide, L., and Foote, T. 1997.Centromeric sites and cereal chromosome evolution. Chromosoma35: 17–23.
Naranjo, T., Roca, P., Goicoechea, P.G., and Giraldez, R. 1987. Armhomology of wheat and rye chromosomes. Genome 29: 873–882.
Qi, L., Echalier, B., Friebe, B., and Gill, B.S. 2003. Molecularcharacterization of a set of wheat deletion stocks for use inchromosome bin mapping of ESTs. Funct. Integr. Genomics. 3: 39–55.
Rebeiz, M. and Lewin, H.A. 2000. COMPASS of 47,787 cattle ESTs. Anim.Biotechnol. 11: 75–241.
SanMiguel, P., Ramakrishna, W., Bennetzen, J.L., Busso, C.S., andDubcovsky, J. 2002. Transposable elements, genes andrecombination in a 215-kb contig from wheat chromosome 5A.Funct. Integr. Genomics 2: 70–80.
Sorrells et al.
1826 Genome Researchwww.genome.org
Sarma, R.N., Fish, L., Gill, B.S., and Snape, J.W. 2000. Physicalcharacterization of the homologous Group 5 chromosomes of wheatin terms of rice linkage blocks, and physical mapping of someimportant genes. Genome 43: 191–198.
Sears, E.R. 1954. The aneuploids of common wheat. Missouri AgriculturalExperiment Station Research Bulletin No. 572.
Sears, E.R. and Sears, L.M. 1978. The telocentric chromosomes ofcommon wheat. Proc. 5th Int. Wheat Genet. Symp., New Delhi 389–407.
Sorrells, M.E. 2000. The evolution of comparative plant genetics. InGenomes. Proc. 22nd Stadler Symp., June 6–8, 1998, Columbia, MO (ed.J.P. Gustafson), pp. 183–195. Kluwer Academic Publishers, MA.
Tanksley, S.D., Ganal, M.W., and Martin, G.B. 1995. Chromosomelanding: A paradigm for map-based gene cloning in plants with largegenomes. Trends Genet. 11: 63–68.
Tarchini, R., Biddle, P., Wineland, R., Tingey, S., and Rafalski, A. 2000.The complete sequence of 340 kb of DNA around the riceAdh1-Adh2 region reveals interrupted colinearity with maizechromosome 4. The Plant Cell 12: 381–391.
Tikhonov, A.P., SanMiguel, P.J., Nakajima, Y., Gorenstein, N.M.,Bennetzen, J.L., and Avramova, Z. 1999. Colinearity and itsexceptions in orthologous adh regions of maize and sorghum. Proc.Natl. Acad. Sci. 96: 7409–7414.
VanDeynze, A.E., Dubcovsky, J., Gill, K.S., Nelson, J.C., Sorrells, M.E.,Dvorak, J., Gill, B.S., Lagudah, E.S., McCouch, S.R., and Appels, R.1995a. Molecular-genetic maps for group 1 chromosomes ofTriticeae species and their relation to chromosomes in rice and oat.Genome 38: 45–59.
VanDeynze, A.E., Nelson, J.C., O’Donoughue, J.S., Ahn, S.N.,Siripoonwiwat, W., Harrington, S.E., Ylesias, E.S., Braga, D.P.,McCouch, S.R., and Sorrells, M.E. 1995b. Comparative mapping ingrasses. Oat relationships. Mol. Gen. Genet. 249: 349–356.
VanDeynze, A.E., Nelson, J.C., Yglesias, E.S., Harrington, S.E., Braga,D.P., McCouch, S.R., and Sorrells, M.E. 1995c. Comparative mappingin grasses. Wheat relationships. Mol. Gen. Genet. 248: 744–754.
VanDeynze, A.E., Sorrells, M.E., Park, W.D., Ayres, N.M., Fu, H.,
Cartinhour, S.W., Paul, E., and McCouch, S.R. 1998. Anchor probesfor comparative mapping of grass genera. Theor. Appl. Genet. 97:356–369.
Wilson, W.A., Harrington, S.E., Woodman, W.L., Lee, M., Sorrells, M.E.,and McCouch, S.R. 1999. Can we infer the genome structure ofprogenitor maize through comparative analysis of rice, maize, andthe domesticated panicoids? Genetics 153: 453–473.
Yan, L., Loukoianov, A., Tranquilli, G., Helguera, M., Fahima, T., andDubcovsky, J. 2003. Positional cloning of wheat vernalization geneVRN1. Proc. Natl. Acad. Sci. 100: 6263–6268.
Yu, J., Hu, S., Wang, J., Wong, G.K.-S., Li, S., Liu, B., Deng, Y., Dai, L.,Zhou, Y., Zhang, X., et al. 2002. A draft sequence of the rice genome(Oryza sativa L. ssp. indica). Science 296: 79–92.
WEB SITE REFERENCEShttp://wheat.pw.usda.gov/pubs/2003/Sorrells/; Supplementary materials
for this publication.http://wheat.pw.usda.gov/NSF/progress_mapping.html; U.S. National
Science Foundation Wheat Genome Mapping Progress.http://wheat.pw.usda.gov/; GrainGenes home page.http://wheat.pw.usda.gov/NSF/curator/assembly.html; NSF Wheat
Genome Project—Description of unigene assembly protocol.http://www.gramene.org/; Gramene home page.http://www.agron.missouri.edu/; MaizeDB home page.http://rgp.dna.affrc.go.jp; Japan Rice Genome Project home page.http://www.ncbi.nlm.nih.gov; NCBI Entrez home page.http://wheat.pw.usda.gov/wEST/; GrainGenes Wheat EST database.http://www.tigr.org/tdb/e2k1/osa1/sequencing.shtml; TIGR Web site for
the International Rice Genome Sequencing Project Consortium.http://www.genome.clemson.edu/projects/rice/fpc/; Clemson University
Genomics Initiative Web site for rice BAC fingerprinting data.
Received December 19, 2002; accepted in revised form June 4, 2003.
Comparative Analysis of Wheat and Rice Genomes
Genome Research 1827www.genome.org