DNA Free Energy-Based Promoter Prediction and Comparative Analysis of Arabidopsis and Rice Genomes
27
Bioinformatics DNA Free Energy-Based Promoter Prediction and Comparative Analysis of Arabidopsis and Rice Genomes 1[C][W][OA] Czuee Morey, Sushmita Mookherjee, Ganesan Rajasekaran, and Manju Bansal* Indian Institute of Science, Bangalore 560 012, India The cis-regulatory regions on DNA serve as binding sites for proteins such as transcription factors and RNA polymerase. The combinatorial interaction of these proteins plays a crucial role in transcription initiation, which is an important point of control in the regulation of gene expression. We present here an analysis of the performance of an in silico method for predicting cis- regulatory regions in the plant genomes of Arabidopsis (Arabidopsis thaliana) and rice (Oryza sativa) on the basis of free energy of DNA melting. For protein-coding genes, we achieve recall and precision of 96% and 42% for Arabidopsis and 97% and 31% for rice, respectively. For noncoding RNA genes, the program gives recall and precision of 94% and 75% for Arabidopsis and 95% and 90% for rice, respectively. Moreover, 96% of the false-positive predictions were located in noncoding regions of primary transcripts, out of which 20% were found in the first intron alone, indicating possible regulatory roles. The predictions for orthologous genes from the two genomes showed a good correlation with respect to prediction scores and promoter organization. Comparison of our results with an existing program for promoter prediction in plant genomes indicates that our method shows improved prediction capability. Sequencing and annotation of a large number of eukaryotic genomes has made available an enormous amount of information regarding genetic coding se- quences (CDS). These data can be effectively utilized for studying and modifying the expression of genes if the location and contribution of cis-regulatory regions, which control spatial and temporal regulation of gene expression, are available. However, the precise anno- tation of regulatory regions is difficult as compared with the identification of genes, primarily because regulatory regions do not code for an identifiable prod- uct. In fact, regulatory regions are bound by proteins such as transcription factors, which bring about tran- scription and its regulation. Determining transcription factor-binding sites (TFBSs) from chromatin immuno- precipitation methods has limitations and requires a lot of downstream data processing (Farnham, 2009). Moreover, the mere binding of a transcription factor at a particular site does not warrant its involvement in the regulation of a gene. Development of compu- tational approaches that enable accurate prediction of cis-regulatory sites could thus greatly aid in deci- phering the regulatory mechanisms at the genome level. The preponderance of noncoding DNA in the eu- karyotic genome makes it difficult to identify pro- moter regions. Most efforts toward the prediction of regulatory regions have traditionally focused on the detection of consensus sequences for the TATA box, Initiator elements, TFBSs, etc. Such sequence-based prediction of short motifs might be inadequate be- cause a large number of false hits are possible by chance. Moreover, there is increasing evidence to suggest that consensus sequences vary greatly and are even absent in many cases. The TATA box, which is considered as the signature sequence for promoters, is not found in a majority of core promoters in eukary- otes (Cooper et al., 2006; ENCODE Project Consor- tium, 2007), and TATA-binding protein can recognize the core promoter irrespective of the underlying se- quence with the help of additional factors (Pugh, 2000). A recent study on nucleosomal positioning in Schizosaccharomyces pombe shows that nucleosome- depleted regions at promoters do not show the se- quence characteristics (poly[A+T] tracts) that are crucial for nucleosome depletion in Saccharomyces cerevisiae, thus raising questions about sequence con- servation at these sites (Lantermann et al., 2010). The view that structural features of DNA (rather than sequence) might be able to give a better under- standing of the regulatory landscape was first sug- gested by Pedersen et al. (1999) and is slowly gaining ground. DNA at promoter sites may have special features that play a major role in transcription by allowing protein-DNA interactions and communica- 1 This work was supported by grants from the Monsanto Com- pany and the Department of Biotechnology, India. * Corresponding author; e-mail [email protected]. The author responsible for distribution of materials integral to the findings presented in this article in accordance with the policy described in the Instructions for Authors (www.plantphysiol.org) is: Manju Bansal ([email protected]). [C] Some figures in this article are displayed in color online but in black and white in the print edition. [W] The online version of this article contains Web-only data. [OA] Open Access articles can be viewed online without a sub- scription. www.plantphysiol.org/cgi/doi/10.1104/pp.110.167809 1300 Plant Physiology Ò , July 2011, Vol. 156, pp. 1300–1315, www.plantphysiol.org Ó 2011 American Society of Plant Biologists www.plant.org on June 10, 2015 - Published by www.plantphysiol.org Downloaded from Copyright © 2011 American Society of Plant Biologists. All rights reserved. www.plant.org on June 10, 2015 - Published by www.plantphysiol.org Downloaded from Copyright © 2011 American Society of Plant Biologists. All rights reserved. www.plant.org on June 10, 2015 - Published by www.plantphysiol.org Downloaded from Copyright © 2011 American Society of Plant Biologists. All rights reserved. www.plant.org on June 10, 2015 - Published by www.plantphysiol.org Downloaded from Copyright © 2011 American Society of Plant Biologists. All rights reserved. www.plant.org on June 10, 2015 - Published by www.plantphysiol.org Downloaded from Copyright © 2011 American Society of Plant Biologists. All rights reserved. www.plant.org on June 10, 2015 - Published by www.plantphysiol.org Downloaded from Copyright © 2011 American Society of Plant Biologists. All rights reserved. www.plant.org on June 10, 2015 - Published by www.plantphysiol.org Downloaded from Copyright © 2011 American Society of Plant Biologists. All rights reserved. www.plant.org on June 10, 2015 - Published by www.plantphysiol.org Downloaded from Copyright © 2011 American Society of Plant Biologists. All rights reserved. www.plant.org on June 10, 2015 - Published by www.plantphysiol.org Downloaded from Copyright © 2011 American Society of Plant Biologists. All rights reserved. www.plant.org on June 10, 2015 - Published by www.plantphysiol.org Downloaded from Copyright © 2011 American Society of Plant Biologists. All rights reserved. www.plant.org on June 10, 2015 - Published by www.plantphysiol.org Downloaded from Copyright © 2011 American Society of Plant Biologists. All rights reserved. www.plant.org on June 10, 2015 - Published by www.plantphysiol.org Downloaded from Copyright © 2011 American Society of Plant Biologists. All rights reserved. www.plant.org on June 10, 2015 - Published by www.plantphysiol.org Downloaded from Copyright © 2011 American Society of Plant Biologists. All rights reserved.
Transcript of DNA Free Energy-Based Promoter Prediction and Comparative Analysis of Arabidopsis and Rice Genomes
Bioinformatics
DNA Free Energy-Based Promoter Prediction andComparative Analysis of Arabidopsis andRice Genomes1[C][W][OA]
Czuee Morey, Sushmita Mookherjee, Ganesan Rajasekaran, and Manju Bansal*
Indian Institute of Science, Bangalore 560 012, India
The cis-regulatory regions on DNA serve as binding sites for proteins such as transcription factors and RNA polymerase. Thecombinatorial interaction of these proteins plays a crucial role in transcription initiation, which is an important point of controlin the regulation of gene expression. We present here an analysis of the performance of an in silico method for predicting cis-regulatory regions in the plant genomes of Arabidopsis (Arabidopsis thaliana) and rice (Oryza sativa) on the basis of free energyof DNA melting. For protein-coding genes, we achieve recall and precision of 96% and 42% for Arabidopsis and 97% and 31%for rice, respectively. For noncoding RNA genes, the program gives recall and precision of 94% and 75% for Arabidopsis and95% and 90% for rice, respectively. Moreover, 96% of the false-positive predictions were located in noncoding regions ofprimary transcripts, out of which 20% were found in the first intron alone, indicating possible regulatory roles. The predictionsfor orthologous genes from the two genomes showed a good correlation with respect to prediction scores and promoterorganization. Comparison of our results with an existing program for promoter prediction in plant genomes indicates that ourmethod shows improved prediction capability.
Sequencing and annotation of a large number ofeukaryotic genomes has made available an enormousamount of information regarding genetic coding se-quences (CDS). These data can be effectively utilizedfor studying and modifying the expression of genes ifthe location and contribution of cis-regulatory regions,which control spatial and temporal regulation of geneexpression, are available. However, the precise anno-tation of regulatory regions is difficult as comparedwith the identification of genes, primarily becauseregulatory regions do not code for an identifiable prod-uct. In fact, regulatory regions are bound by proteinssuch as transcription factors, which bring about tran-scription and its regulation. Determining transcriptionfactor-binding sites (TFBSs) from chromatin immuno-precipitation methods has limitations and requires alot of downstream data processing (Farnham, 2009).Moreover, the mere binding of a transcription factorat a particular site does not warrant its involvementin the regulation of a gene. Development of compu-tational approaches that enable accurate prediction of
cis-regulatory sites could thus greatly aid in deci-phering the regulatory mechanisms at the genomelevel.
The preponderance of noncoding DNA in the eu-karyotic genome makes it difficult to identify pro-moter regions. Most efforts toward the prediction ofregulatory regions have traditionally focused on thedetection of consensus sequences for the TATA box,Initiator elements, TFBSs, etc. Such sequence-basedprediction of short motifs might be inadequate be-cause a large number of false hits are possible bychance. Moreover, there is increasing evidence tosuggest that consensus sequences vary greatly andare even absent in many cases. The TATA box, which isconsidered as the signature sequence for promoters, isnot found in a majority of core promoters in eukary-otes (Cooper et al., 2006; ENCODE Project Consor-tium, 2007), and TATA-binding protein can recognizethe core promoter irrespective of the underlying se-quence with the help of additional factors (Pugh,2000). A recent study on nucleosomal positioning inSchizosaccharomyces pombe shows that nucleosome-depleted regions at promoters do not show the se-quence characteristics (poly[A+T] tracts) that arecrucial for nucleosome depletion in Saccharomycescerevisiae, thus raising questions about sequence con-servation at these sites (Lantermann et al., 2010).
The view that structural features of DNA (ratherthan sequence) might be able to give a better under-standing of the regulatory landscape was first sug-gested by Pedersen et al. (1999) and is slowly gainingground. DNA at promoter sites may have specialfeatures that play a major role in transcription byallowing protein-DNA interactions and communica-
1 This work was supported by grants from the Monsanto Com-pany and the Department of Biotechnology, India.
* Corresponding author; e-mail [email protected] author responsible for distribution of materials integral to the
findings presented in this article in accordance with the policydescribed in the Instructions for Authors (www.plantphysiol.org) is:Manju Bansal ([email protected]).
[C] Some figures in this article are displayed in color online but inblack and white in the print edition.
[W] The online version of this article contains Web-only data.[OA] Open Access articles can be viewed online without a sub-
scription.www.plantphysiol.org/cgi/doi/10.1104/pp.110.167809
1300 Plant Physiology�, July 2011, Vol. 156, pp. 1300–1315, www.plantphysiol.org � 2011 American Society of Plant Biologists www.plant.org on June 10, 2015 - Published by www.plantphysiol.orgDownloaded from
Copyright © 2011 American Society of Plant Biologists. All rights reserved. www.plant.org on June 10, 2015 - Published by www.plantphysiol.orgDownloaded from
Copyright © 2011 American Society of Plant Biologists. All rights reserved. www.plant.org on June 10, 2015 - Published by www.plantphysiol.orgDownloaded from
Copyright © 2011 American Society of Plant Biologists. All rights reserved. www.plant.org on June 10, 2015 - Published by www.plantphysiol.orgDownloaded from
Copyright © 2011 American Society of Plant Biologists. All rights reserved. www.plant.org on June 10, 2015 - Published by www.plantphysiol.orgDownloaded from
Copyright © 2011 American Society of Plant Biologists. All rights reserved. www.plant.org on June 10, 2015 - Published by www.plantphysiol.orgDownloaded from
Copyright © 2011 American Society of Plant Biologists. All rights reserved. www.plant.org on June 10, 2015 - Published by www.plantphysiol.orgDownloaded from
Copyright © 2011 American Society of Plant Biologists. All rights reserved. www.plant.org on June 10, 2015 - Published by www.plantphysiol.orgDownloaded from
Copyright © 2011 American Society of Plant Biologists. All rights reserved. www.plant.org on June 10, 2015 - Published by www.plantphysiol.orgDownloaded from
Copyright © 2011 American Society of Plant Biologists. All rights reserved. www.plant.org on June 10, 2015 - Published by www.plantphysiol.orgDownloaded from
Copyright © 2011 American Society of Plant Biologists. All rights reserved. www.plant.org on June 10, 2015 - Published by www.plantphysiol.orgDownloaded from
Copyright © 2011 American Society of Plant Biologists. All rights reserved. www.plant.org on June 10, 2015 - Published by www.plantphysiol.orgDownloaded from
Copyright © 2011 American Society of Plant Biologists. All rights reserved. www.plant.org on June 10, 2015 - Published by www.plantphysiol.orgDownloaded from
Copyright © 2011 American Society of Plant Biologists. All rights reserved.

tion between factors bound at distal promoters. Struc-tural features of DNA, such as GC skew, bendability,topography, free energy, curvature, nucleosome posi-tioning, base stacking, relative entropy of nucleotides,etc., have been shown to give characteristic patterns atthe transcription start site (TSS) and functional non-coding regions such as promoters (Florquin et al., 2005;Fujimori et al., 2005; Kanhere and Bansal, 2005a, 2005b;Alexandrov et al., 2006; Lee et al., 2007; Abeel et al.,2008a; Cao et al., 2009; Parker et al., 2009; Rangannanand Bansal, 2009; Tanaka et al., 2009). Although theseproperties are inherently sequence dependent, theygive additional insight into long-range interactionsthat might not be evident from sequence alone. More-over, the structural features found at promoter regionsare sometimes conserved across species (Fujimoriet al., 2005; Kanhere and Bansal, 2005a; Abeel et al.,2008a). Thus, a prediction program that effectivelycaptures the structural patterns at promoters couldhelp in predicting regulatory regions across genomesirrespective of the availability of training data.The majority of the currently available promoter
prediction programs (PPPs) such as ARTS, Eponine,and ProSOM focus on promoter prediction in the hu-man genome or related genomes (Down andHubbard,
2002; Sonnenburg et al., 2006; Abeel et al., 2008b, 2009)for which processed experimental data and detailedannotation, such as from deepCAGE sequencing, arealready available. Since these programs require pre-training on the genome, they cannot be readily appliedto other genomes, such as plants. CpG island predic-tors cannot be used for plants, since a suitable predic-tion criterion is unavailable (Rombauts et al., 2003) andthey are purported to be absent in plant genomes(Yamamoto et al., 2007b). Sequence-based PPPs forplants are either repositories of TFBSs and cis-regula-tory elements reported in individual studies, such asPLACE (Higo et al., 1999), Osiris (Morris et al., 2008),and AGRIS (Davuluri et al., 2003), or in silico analysisof overrepresented k-mers at promoters (Molina andGrotewold, 2005; Yamamoto et al., 2007a; Lichtenberget al., 2009). EP3 (Abeel et al., 2008a) is the only PPPavailable currently that predicts extended promoterregions in plant genomes. However, the promoterprediction property (base stacking) used in EP3 isselected based on analysis in the human genome only.Also, some minimal training is apparently involved inthe EP3 program as well, since different thresholds areused for different organisms (Arabidopsis [Arabidopsisthaliana], 0.0583; rice [Oryza sativa], 0.1394). Many
Table I. Comparison of Arabidopsis and rice genomes
The sequence data for five chromosomes of Arabidopsis (approximately 119 Mb) and 12 chromosomesof rice (approximately 382 Mb) were analyzed for their genome characteristics.
Feature Arabidopsis Rice
Characteristica
Gene density (genes Mb21) Approximately 238.8 Approximately 63.4Transcribed region (% of genome length) 40.0% 21.8%Exon coverage 20.3% 6.3%Protein-coding genes 27,169 (28,289b,c) 23,057ncRNA genes 1,243 (1,263b) 1,527ncRNA genes (median length in nucleotides) 82 74Average GC content 36% 42.4%
Median length (nucleotides) of various regionsin protein-coding genes (% of primarytranscript length)Primary transcript 2,095 3,163Intergenic 924 5,3005# UTR 105 (6.1%) 106 (9.1%)3# UTR 208 (9.5%) 260 (13.5%)Intron 100 (33.6%) 96 (47.8%)CDS 129 (50.8%) 132 (29.7%)
Average GC percentage of various regions inprotein-coding genesPrimary transcript 39.2 6 3.0 47.5 6 8.3Intergenic 31.9 6 4.9 41.9 6 5.65# UTR 37.7 6 8.0 55 6 15.53# UTR 31.7 6 4.8 40.6 6 7.2Intron 32.6 6 4.2 38.6 6 7.9CDS 44.9 6 3.2 51.1 6 11.3
aExcluding mitochondrial and chloroplast chromosomes, transposons, and pseudogenes. bGenemodels from TAIR that were considered for analysis (see “Materials and Methods”). cProtein-codinggene models with TSS information considered for analysis: 20,094; non-protein-coding transcripts in ricewere also considered for analysis: 1,152.
Promoter Prediction in Plants Using DNA Free Energy Criteria
Plant Physiol. Vol. 156, 2011 1301 www.plant.org on June 10, 2015 - Published by www.plantphysiol.orgDownloaded from
Copyright © 2011 American Society of Plant Biologists. All rights reserved.

plant genomes have been recently sequenced (Minget al., 2008; Rensing et al., 2008; International Brachy-podium Initiative, 2010; Schmutz et al., 2010), and alarge number of genomes are in the sequencing pipe-line, such as the multinational Brassica rapa sequencingproject (for a full list, see National Center for Biotech-nology Information Genome Projects). A promoterprediction tool suited for plant genomes could helpin the annotation of putative cis-regulatory regions aswell as in finding new genes for these newly se-quenced genomes.
We present here a detailed analysis of the perfor-mance of the program PromPredict, a simple programthat captures the free energy pattern at promoterregions from DNA sequence information without re-quiring any pretraining, for the model monocot andeudicot plant genomes of rice (cv Nipponbare; RiceAnnotation Project, 2008) and Arabidopsis (Arabidop-sis Genome Initiative, 2000). PromPredict was origi-nally developed to predict putative promoters usingthe whole-genome percentage GC of select bacterialgenomes to define the baseline cutoffs for relative freeenergy of promoter regions (Rangannan and Bansal,2009). It has now been generalized for genome pre-diction using 1,000-nucleotide fragments with 20% to80% GC (Rangannan and Bansal, 2010). It should benoted that the promoters are not predicted on the basisof motif composition or organization of cis-regulatorymodules but solely on the basis of relative free energyof adjoining sequences. We compare and contrast thegenomic features and prediction characteristics in thetwo plant genomes to highlight the similarities anddifferences in their genome architecture. Such a com-parison can shed light on the evolution of monocotand dicot lineages of flowering plants. The predictionsare assigned to five different score classes to indicatetheir relative strength (as discussed below). We alsocompare the performance of PromPredict with the EP3program.
RESULTS
A comparison of the annotated genomes (excludingmitochondrial and chloroplast chromosomes) of riceand Arabidopsis gave some interesting insights intothe genome composition of the two plants. Arabidop-sis has a small and compact genome with gene density1 order of magnitude higher than that for the ricegenome (Table I). The length of the Arabidopsis ge-nome is less than half the length of the rice genome,but it has 40% of its genome being transcribed ascompared with approximately 22% in rice at thecurrent state of annotation. However, the rice genomehas longer primary transcripts, and introns contributeto a majority of the primary transcript length (Table I).Moreover, the rice genome has a higher average GCcontent and a greater GC variation, which is alsoreflected in the various regions of the gene (Table I;Supplemental Fig. S1).
Figure 1. A and B, AFE profiles in the vicinity of the TSS for all fivechromosomes of Arabidopsis (A) and six representative (even num-bered) chromosomes of rice (B). The AFE values for upstream, down-stream, and full-length shuffled sequences are shown as dashed lines.C, Comparison of free energy profiles (shown in red) and percentage AToccurrence (shown in green) over the region 2500 to +500 bp withrespect to (w.r.t.) TSS for chromosome 1 of Arabidopsis and rice.
Morey et al.
1302 Plant Physiol. Vol. 156, 2011 www.plant.org on June 10, 2015 - Published by www.plantphysiol.orgDownloaded from
Copyright © 2011 American Society of Plant Biologists. All rights reserved.

Average Free Energy Profile
Distortion of the DNA double helix, such as sepa-ration of strands and bending of DNA, is necessary forbinding of RNA polymerase and transcription factorsat the promoter site. The free energy of DNAmelting isa dinucleotide sequence-dependent secondary struc-ture property that comprises not only hydrogen bond-ing energy but also base stacking energy and hence isslightly different from mere ATor GC contents. Figure1, A and B, shows the average free energy (AFE)profiles for Arabidopsis and rice genomes in thevicinity of the TSS. The details of calculating the AFEprofile are mentioned in “Materials and Methods.”Both plants show similar free energy profiles with asignificant difference between upstream and down-stream regions and a peak just upstream of the TSS.Overall, the profiles show a less stable upstreamregion followed by a relatively stable downstreamregion. However, the difference in stability is muchgreater for rice (approximately 3.5 kcal mol21) ascompared with Arabidopsis (approximately 1.5 kcalmol21), as seen in Figure 1C. It should be noted herethat AT-rich sequences tend to be less stable, eventhough the correlation is not exact and depends ontheir dinucleotide frequencies as seen in the vicinity ofthe TSS. The Arabidopsis profile has a higher freeenergy (less stability) than rice owing to its AT-richgenome. Similarly, the AFE profiles shift with varia-tion in GC content of the sequences (Supplemental Fig.S2). In conclusion, the promoter region is character-ized by relative instability when compared with thedownstream stable region for both the plant genomes.This characteristic can be used to identify promoterregions, as shown by Rangannan and Bansal (2007,2009) for prokaryotes and by Abeel et al. (2008a) foreukaryotes.The high stability trough in the profiles is found
around 100 to 200 nucleotides downstream of the TSS.
This region is beyond the 5# untranslated region (5#UTR)of most genes in both Arabidopsis and rice (Table I)and hence overlaps with the first CDS. Moreover, the5# UTR and CDS in rice also have higher average GCcontents than those of the primary transcript (Table I).The GC richness of the region immediately down-stream of the TSS is more pronounced in rice than inArabidopsis (Supplemental Fig. S1). These observa-tions could account for the presence of GC contentgradients previously reported in monocots (Wonget al., 2002).
Performance of PromPredict on Plant Genomes
We tested the latest version of the program Prom-Predict (Rangannan and Bansal, 2010) on rice andArabidopsis genomes in order to find cis-regulatorysites (see “Web Resources” below). The program de-tects relative differences in free energy and applies
Figure 2. Percentage frequency distribution plots showing the distanceof promoter predictions from TSS in 50-nucleotide bins for protein-coding genes (A) and ncRNA genes (B). For protein-coding genes, thepredictions within2500 to +100 bp with respect to (w.r.t.) TSS, and forncRNA genes, predictions within 21,000 to 0 bp with respect to TSS,are considered where position 0 corresponds to the TSS. [See onlinearticle for color version of this figure.]
Table II. PromPredict performance on Arabidopsis and rice genomes
For protein-coding genes, the region considered for determining truepositives was 2500 to +100 bp in the vicinity of the TSS. For ncRNAgenes and protein-coding genes with only TLS information, the regionconsidered for determining true positives was 21,000 to 0 bp of thestart site.
Gene Type No. of Genes Recall Precision
ArabidopsisProtein-coding genes 20,094 0.92 0.33Protein-coding genes,
TLSa8,195 0.96 0.51
ncRNA genes 1,263 0.93 0.76Rice
Protein-coding genes 23,057 0.92 0.24ncRNA genes 1,527 0.95 0.90Non-protein-coding
transcripts1,152 0.96 0.47
aProtein-coding genes with only TLS information.
Promoter Prediction in Plants Using DNA Free Energy Criteria
Plant Physiol. Vol. 156, 2011 1303 www.plant.org on June 10, 2015 - Published by www.plantphysiol.orgDownloaded from
Copyright © 2011 American Society of Plant Biologists. All rights reserved.

cutoffs based on the GC content of a sequence. Itcompares the free energy of two adjacent sequencesand predicts a cis-regulatory region at the upstreamsequence if the two criteria, (1) free energy of theupstream sequence (E1 value) and (2) the differencein free energy between the two sequences (D value),are greater than predetermined cutoff values (Sup-plemental Protocol S1; Supplemental Fig. S3; Sup-plemental Table S1; see “Materials and Methods”).The predictions are directional, depending on theorientation of the input sequence: forward or reversestrand.
The whole-genome prediction performance of theprogram is presented in Table II in terms of the recalland precision values for the various gene data sets (forprecision and recall calculations, see “Materials andMethods”). The region2500 to +100 bp with respect tothe TSS (true-positive region [TP region]) was consid-ered for determining true positives in protein-codinggenes, as this covers the upstream region as well asmost 5# UTRs. The region 21,000 to 0 bp was consid-ered for noncoding RNA (ncRNA) genes and forprotein-coding genes with only translation start site(TLS) information. The predictions obtained withinthe gene beyond the true-positive region are consid-ered as false positives (FPpred.). Overall, more than 92%of genes (henceforth referred to as TPgenes) have a true-
positive prediction (TPpred.) within 2500 to +100 bp.Both the genomes have approximately 1.5 TPpred.per TPgene on average. As expected, the longer protein-coding genes have more FPpred., thus leading to lowervalues of precision as compared with that for ncRNAgenes.
Although a gene might have more than one predic-tion in the TP region, the prediction nearest to the TSSwill correspond to the core promoter. A frequency plotfor distance of the nearest prediction from the TSS (Fig.2A) shows that the majority of the TPpred. obtained areproximal to the TSS: 70% of predictions for Arabidop-sis and 63% of predictions for rice are within 2200 to+100 bp of the TSS. For ncRNA genes, the region2500to 0 bp of the TSS contains 92% to 93% of the predic-tions for both Arabidopsis and rice genomes (Fig. 2B).However, a significant number of predictions are alsoobtained farther away from the TSS, especially in rice.Interestingly, Arabidopsis predictions are clusteredcloser to the TSS (0 to 2100 bp of the TSS), while ricepredictions show an almost uniform distribution over0 to2200 bp relative to the TSS in both protein-codingand ncRNA genes.
If the closest prediction for a gene is found near theTSS (2100 to +50 bp), it might correspond to the corepromoter and hence have a stronger signal. The freeenergy difference with respect to the downstream
Figure 3. AFE plots for sequences fromeach frequency class from Figure 2 forArabidopsis (A) and rice (B). It is seenthat the predictions occurring in eachfrequency class correspond to peaks inAFE profiles at a particular distance fromthe TSS. The plots depict the AFE for se-quences with the closest prediction pres-ent at a given distance (2500 to +100 bpwith respect to [w.r.t.]). The color codeused to depict the AFE profile, for se-quences with predictions in each 50-nucleotide bin, is indicated in the boxat right.
Morey et al.
1304 Plant Physiol. Vol. 156, 2011 www.plant.org on June 10, 2015 - Published by www.plantphysiol.orgDownloaded from
Copyright © 2011 American Society of Plant Biologists. All rights reserved.

sequence would be greater for these predictions ascompared with those present distally. However, wefound that this is not true. We calculated the AFEprofiles for 1001-nucleotide sequences clustered ac-cording to the proximity of the closest prediction to theTSS (50-nucleotide bins from Fig. 2). The AFE plots inFigure 3 have a broad low-stability region correspond-ing to the 50-nucleotide bin where the closest predic-tion lies and another peak at the 235 region. The firstpeak is expected because the algorithm recognizes thisfeature for prediction. The difference in AFE for up-stream and downstream regions is almost constant forall plots irrespective of the distance of the instabilitypeak from the TSS. The AFE for the peaks is less (by1.5–2 kcal mol21) than the AFE observed at the sameposition in Figure 1, but the peaks follow the generaltrend of the overall profile. We propose that such aprofile might be a characteristic of cis-regulatory sitesspread over a longer region upstream of the TSS.The second sharper peak found ubiquitously at the
235 position might indicate the presence of a TATAbox at this region. However, Web logos for this regiondid not show any strong consensus TATA sequence(data not shown). A comparison of tetramer frequen-cies in the 250- to 220-bp region and the 2500- to+500-bp region shows a relatively high occurrence ofTATA and AAAA tetramers in the core promoterregion for both Arabidopsis and rice (SupplementalFig. S5). Interestingly, while several AT-containingtetramers are preferentially located at the upstream235 region in Arabidopsis, some C-rich sequencesalso show overrepresentation in this region for ricepromoters.An analysis for the overlap of predictions with 92
TFBSs in rice as obtained from Osiris (Morris et al.,2008) was carried out. Fifty-six percent of TPpred. con-tained within them entire TFBS motifs, while 98% of
TPpred. overlapped with at least half of the TFBSsequence. Ninety-one percent of the reported TFBSsoverlapped at least partially (half or more) with TPpred.,out of which 58% were found to overlap completely.Although a substantial number of TPpred. were foundto contain AT-rich TFBSs, a significant number of GC-rich TFBSs were also found to occur within the pre-dictions.
Prediction Score
We categorized the predictions on the basis of thedifference in free energy between a prediction and itsdownstream region, denoted as the D value. The scoreclasses are formed on the basis of the maximum Dvalue (Dmax) of predictions and the GC content rangeof the surrounding 1001-nucleotide sequence (for de-tails of categorization, see “Materials and Methods”and Supplemental Fig. S4). Table III shows that mostof the predictions in the higher score categories areTPpred., whereas the FPpred. show a preponderance
Table III. Variable prediction cutoffs
If the cutoff values for prediction are increased to mean2 SD, mean, mean + SD, and mean + 2 SD, the precision and recall values change as shownin the rows Medium to Highest from bottom to top. Hence, predictions can be chosen according to the precision and recall desired. The TPpred. andFPpred. are categorized according to their Dmax scores. The highest Dmax score for TPpred. of a TPgene is considered as the score for that gene and is usedto categorize the TPgenes in the score classes.
Score Class TPpred. TPpred. FPpred. FPpred. TPgenes TPgenes Recall Precision F Value
% % %
ArabidopsisHighest 1,100 3.98 772 1.38 1,076 5.84 0.05 0.59 0.09Very high 3,738 13.53 2,974 5.32 3,497 18.99 0.23 0.56 0.33High 8,723 31.57 13,160 23.52 7,073 38.4 0.58 0.45 0.51Medium 12,075 43.7 31,944 57.09 6,168 33.49 0.89 0.34 0.49Low 1,993 7.21 7,102 12.69 604 3.28 0.92 0.33 0.49Total 27,629 100 55,952 100 18,418 100 0.92 0.33 0.49
RiceHighest 3,651 11.18 2,846 2.75 3,482 16.57 0.15 0.56 0.24Very high 6,439 19.72 7,202 6.96 5,609 26.69 0.39 0.5 0.44High 10,491 32.13 25,350 24.5 7,379 35.11 0.71 0.37 0.48Medium 9,872 30.23 54,706 52.87 4,125 19.63 0.89 0.25 0.39Low 2,198 6.73 13,365 12.92 424 2.02 0.91 0.24 0.38
Total 32,651 100 103,469 100 21,019 100 0.91 0.24 0.38
Table IV. Percentage distribution of FPpred.
The location of FPpred. in coding and noncoding regions of primarytranscripts as a percentage of the total FPpred. is shown.
Region Arabidopsis Rice
5# UTR 7.3% 6.6%3# UTR 14.3% 9.1%Introns 71.7% 78.4%First introna 20.4% 21%CDS 6.7% 5.9%
aThe nearest intron from the TSS that has length greater than 50nucleotides is considered as the first intron irrespective of its locationin the UTR or the coding region.
Promoter Prediction in Plants Using DNA Free Energy Criteria
Plant Physiol. Vol. 156, 2011 1305 www.plant.org on June 10, 2015 - Published by www.plantphysiol.orgDownloaded from
Copyright © 2011 American Society of Plant Biologists. All rights reserved.

toward the lower score categories. The D value cutoffsused for relative score categorization of predictions aresimilar to the cutoffs applied for promoter prediction.Both are dependent on GC content of the flanking1,001-nucleotide sequence and the frequency of ob-taining a prediction in a particular GC range. If weraise the cutoff for promoter prediction to the categoryclassification cutoffs, the precision can be improved.However, the number of TPgenes is reduced as a con-sequence and recall decreases. A segregation of thepredicted signals according to their score thus allowsuser-defined stringency settings. We suggest that thethree highest classes should be considered wheremultiple predictions are obtained.
Distribution of False-Positive Predictions in
Primary Transcript
The PromPredict program is able to predict cis-regulatory elements for more than 90% of the anno-tated genes (considering all score classes). However,on applying the lowest cutoffs, the precision of pre-diction is lower (i.e. a substantial number of predic-tions are found in the primary transcript region [FPregion]). An analysis of the locations and relativescores of FPpred. (Table IV) showed that the majorityof FPpred. were obtained in the noncoding regions ofthe primary transcript (i.e. introns and UTRs). Wefound that approximately 20% of FPpred. were found inthe first intron alone, which could be a putative cis-regulatory region. If we consider the predictions in thefirst intron as TPpred., the precision increases to 0.47 forArabidopsis and 0.40 for rice. Interestingly, the medianlength for the first intron (177 nucleotides for Arabi-dopsis and 1,176 nucleotides for rice) is greater thanthat for all introns (100 nucleotides for Arabidopsisand 96 nucleotides for rice). Only a few FPpred. werefound in the CDS region (approximately 6%), althoughit constitutes a substantial length of the primary tran-script (50.8% in Arabidopsis and 29.7% in rice). If thesepredictions are considered as FPpred., the precisionincreases to 0.96 for both Arabidopsis and rice.
We also categorized FPpred. in score classes andaccording to their location in the primary transcript.The distribution is presented in Figure 4 as a percent-age of FPpred. for each score class. Although intronsdominate in all score classes, there is an increasingtrend of predictions toward higher score categories(68% level of significance for the highest frequency).The same trend is observed in 5# UTRs, although thenumber of FPpred. is low. On the other hand, in exonsand 3#UTRs, there is an increasing trend toward lowerscore categories (68% level of significance for thehighest frequency).
Analysis of False Negatives
There are very few genes (8%–9%) that do not haveany predictions between 2500 and +100 bp relative tothe TSS, termed as false-negative genes (FNgenes). A
comparison of the AFE profiles for these genes withthe profiles for all TSSs from a representative chromo-some (Fig. 5) showed that the distinct difference be-tween upstream and downstream regions is absent inFNgenes. The immediate upstream region has higherstability while the immediate downstream region haslower stability in the FNgene profile than those ob-served for the corresponding regions in the profile ofall TSSs. The Gene Ontology (GO) categorization ofArabidopsis and rice genes (Supplemental Protocol S2;Supplemental Table S3; Supplemental Fig. S6) does notshow a preponderance of FNgenes in any particular GOcategory. However, slight differences are seen in thevarious categories, especially the presence of a greaterpercentage of FNgenes with unknown functions, pro-cesses, and cellular locations as well as the absence ofFNgenes corresponding to vital processes such as DNAintegration and chromatin assembly.
Correlation of Prediction Score with Gene Expression
Interspecies homology is routinely used for thecharacterization of gene functions. Thus, it would beinteresting to see if orthologous genes from rice and
Figure 4. FP prediction distribution. The frequency distribution ofFPpred. is shown from each score category found in various regions ofthe primary transcript as a percentage of the total FPpred. in eachcategory for Arabidopsis (A) and rice (B) genomes. The majority ofpredictions for each category lie in the intronic region.
Morey et al.
1306 Plant Physiol. Vol. 156, 2011 www.plant.org on June 10, 2015 - Published by www.plantphysiol.orgDownloaded from
Copyright © 2011 American Society of Plant Biologists. All rights reserved.
Arabidopsis show similarity in their promoter organi-zation as well. An analysis of the prediction scorecorrelation in all orthologous gene pairs from rice andArabidopsis was carried out. A total of 12,780 Arab-idopsis orthologs and 12,615 rice orthologs wereobtained (only protein-coding genes with TSS infor-mation was considered) using the g:Orth program ofthe g:profiler software (Reimand et al., 2007), whichuses the Plant Ensembl database (Kersey et al., 2010).Of these, 11,941 (93.4%) and 11,554 (91.6%) genes wereTPgenes in Arabidopsis and rice, respectively, and theremaining were FNgenes. Since there were multipleArabidopsis orthologs for certain rice genes and viceversa, 12,359 pairs of orthologous genes were formed.The Dmax prediction scores for the orthologous genepairs (see “Materials andMethods”) have been plottedin Figure 7 and give a correlation coefficient of 0.23.However, if only the ortholog pairs for which theprediction scores from the two genomes are from thesame score class or differ by one level are considered(81% of total pairs; shown as blue +), the correlationcoefficient is 0.51.A comparison of the relative positions and scores of
predictions in the promoter regions of certain ortho-
logous gene pairs (gene IDs are given in SupplementalTable S4) showed that predictions of comparablestrength and relative position are found in most cases(Fig. 8). Arabidopsis genes FAD2 (Kim et al., 2006) andPRF1 (Jeong et al., 2006), which have regulatory firstintrons, were also studied along with their rice ortho-logs. For FAD2 (Fig. 8E), intronic predictions wereobserved in the first intron of both Arabidopsis andrice. In addition, a ncRNA gene overlapping the firstintron was found in the rice genome. The first intron ofPRF1 (Fig. 8F) in Arabidopsis is long and covers thesame length as two short introns in the rice homolog.The prediction for rice was found in the second shortintron but at the same position from the TSS as theintronic prediction in Arabidopsis.
As mentioned earlier, the Dmax score of a predictiongives the relative difference in free energy betweenadjacent regions. The question then arises, can thescore give an idea of the “strength” of the predictedpromoter? For example, it has been shown that CpGislands are generally found upstream of housekeepinggenes, whereas tissue-specific genes have strong pro-moters usually containing a TATA box. It would beinteresting to see if the relative differences in DNA free
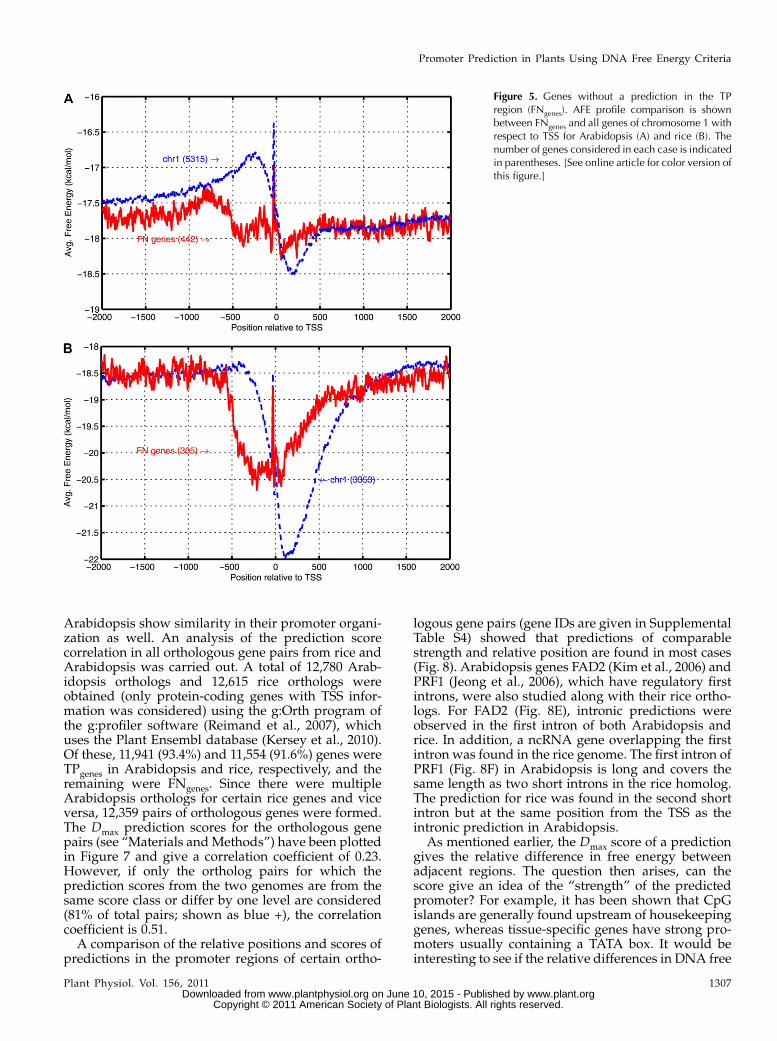
Figure 5. Genes without a prediction in the TPregion (FNgenes). AFE profile comparison is shownbetween FNgenes and all genes of chromosome 1 withrespect to TSS for Arabidopsis (A) and rice (B). Thenumber of genes considered in each case is indicatedin parentheses. [See online article for color version ofthis figure.]
Promoter Prediction in Plants Using DNA Free Energy Criteria
Plant Physiol. Vol. 156, 2011 1307 www.plant.org on June 10, 2015 - Published by www.plantphysiol.orgDownloaded from
Copyright © 2011 American Society of Plant Biologists. All rights reserved.

energy can capture the promoter strength. We catego-rized the TPgenes from certain families, metabolic path-ways (Mueller et al., 2003; Jaiswal et al., 2006), and GOterms (Gene Ontology Consortium, 2000) according totheir score categories (Fig. 6). Most of the gene setsstudied showed similar score distributions in the twogenomes. For example, about 50% of genes involved ininflorescence had “very high” and “highest” scores inboth genomes, which might indicate their tissue-specificroles. Also, 60% to 80% of predictions for heat shockproteins fall into the top three score categories. However,constitutively expressed genes such as ubiquitin andtubulin did not show such similarities, possibly owing todifferent expression rates for the protein isoforms.
Comparison of PromPredict Performance with EP3
We compared the programs PromPredict and EP3for whole-genome prediction in Arabidopsis and rice(Table V). For both programs, we considered thepredictions within 2500 to +500 bp for determiningtrue positives, since that is the criterion used in EP3.The F value (harmonic mean of the recall and preci-sion) calculated shows that PromPredict gives betterprediction performance than EP3. However, the EP3program gives slightly higher F values in the ricegenome for protein-coding genes. Interestingly, Prom-Predict is able to predict cis-regulatory sites for ncRNAgenes with much higher sensitivity and precision thanEP3. It should be noted that all PromPredict predic-tions within 2500 to +500 bp are considered irrespec-tive of their score. If only the three higher score classesare considered, the F value would improve, as seen inTable III.
We believe that the recall and precision values donot give a complete picture of the prediction quality. Inorder to be useful in guiding experimental analysisand annotation, it is important to have predictions ofappropriate length. One of themajor drawbacks of EP3is that it uses nonoverlapping windows of fixed 400-nucleotide length for prediction. As a result, largechunks of the genome are predicted that might not beamenable to experimental validation. PromPredict, onthe other hand, calculates free energy over overlap-ping windows of 100-nucleotide length and assigns itto the midpoint of the window. Thus, the predictionlength varies (maximum of 300 nucleotides) depend-ing on the local free energy in adjacent windows. Theprediction coverage of the TP and FP regions indicatesthe percentage length of the region that is predicted tobe “true.” The overall percentage of genome lengthcovered by TP and FP predictions is significantlylower for PromPredict as compared with EP3. Overall,PromPredict gives a better performance for promoterprediction in plants than EP3.
DISCUSSION
The program PromPredict gives relatively good per-formance for the plant genomes of Arabidopsis andrice, although its cutoffs have been derived from pro-karyotic analysis. The AFE profiles for plant genomes(Fig. 1) and prokaryotes (Rangannan and Bansal,2009) are not identical, but the difference in free en-ergy between upstream and downstream sequencesis seen in both profiles, which is the prediction cri-terion used by PromPredict. Interestingly, the cutoffs
Figure 6. Classification of gene families, metabolic pathway genes, and genes from specific GO terms for Arabidopsis (A) andrice (B) according to the TP with the highest prediction score present within2500 to +100 bp of the TSS. The distribution of thescore categories is presented as a percentage of the TPgenes present in that category. The number adjacent to each bar indicates thenumber of TPgenes. [See online article for color version of this figure.]
Morey et al.
1308 Plant Physiol. Vol. 156, 2011 www.plant.org on June 10, 2015 - Published by www.plantphysiol.orgDownloaded from
Copyright © 2011 American Society of Plant Biologists. All rights reserved.

derived by training on prokaryotes show good per-formance for eukaryotes (as shown here for plantgenomes). However, slightly tweaking the cutoffsmight give better predictions for each genome, and theprediction score classes outlined in Table III can serveas alternative cutoffs for achieving the required per-formance.We compared the performance parameters of Prom-
Predict with EP3, which is the only other program thatpredicts extended promoters in plant genomes (TableV). PromPredict gave better F values than EP3 exceptfor protein-coding genes in rice. However, precisionand recall parameters take only the number of predic-tions into consideration and ignore their length. Lon-ger predictions could (wrongly) give better values forthese parameters but would, in turn, increase theamount of experimental testing required. The EP3algorithm gives longer and fixed length predictionsthat contribute significantly to the TP and FP regionsas compared with PromPredict. PromPredict gives amuch better performance for ncRNA genes than EP3for both plant genomes, even though EP3 is based onsimilar parameters. Most motif searching and trainedalgorithms such as ARTS, Eponine, and ProSOM thatlook for consensus sequences or patterns are alsoexpected to give a poor performance for ncRNA genes,because the organization of PolII promoters differsfrom PolI (Russell and Zomerdijk, 2005) and PolIII(Geiduschek and Kassavetis, 2001) promoters.The two plant genomes were compared with respect
to genome characteristics as well as prediction char-
acteristics. The precision value obtained for rice waslower than for Arabidopsis due to the presence ofhigher FPpred.. However, this might be a result oflonger primary transcripts in the rice genome, whichhave a preponderance of intronic regions. Predictionsobtained in the primary transcript, especially in non-coding regions, cannot be ignored, as these might bealternative promoters or promoters for downstreamgenes. Yang (2009) has shown that broadly expressedgenes in Arabidopsis and rice have longer noncodingregions, which might play a regulatory role. Carninciet al. (2006) have shown that alternative promoterspresent within primary transcripts are responsiblefor tissue-specific expression in humans. Forty-eightpercent of oligo(dT)-primed CAGE libraries and 34%of random-primed CAGE libraries have at least onealternative promoter overlapping the sequence ofknown or predicted transcripts. Also, TSSs have beenfound in the 3# UTR of certain protein-coding genes,which may code for transcripts that regulate down-stream genes on the same or opposite strands. More-over, regions located downstream of the TSS, such asintrons (Rose, 2008; Rose et al., 2008) and 5# UTRs (Luet al., 2008), have been shown to be involved in theregulation of transcription by acting as enhancers orthrough mechanisms such as intron-mediated en-hancement. Noncoding regions might also be involvedin replication, transcription of regulatory ncRNAs,and transposition. Zhu et al. (2010) have shown thatshort conserved introns (50–150 nucleotides) in hu-man and mouse show preferential location (3# UTRs
Table V. Comparison of PromPredict with EP3 (Abeel et al., 2008a)
In Arabidopsis, 20,094 (protein-coding) and 1,263 (RNA-coding) TSSs were considered for analysis. Inrice, 23,057 (protein-coding) and 1,527 (RNA-coding) TSSs were considered for analysis. For Arabidopsis,PromPredict gave 386,264 predictions while EP3 gave 594,559 predictions. PromPredict predicted1,284,547 signals and EP3 predicted 1,611,598 signals in the rice genome. The region considered fordetermining true positives is 2500 to +500 bp of the TSS for protein-coding genes and 21,000 to 0 bp ofthe TSS for ncRNA genes.
FeaturePromPredict EP3
Protein RNA Protein RNA
ArabidopsisRecall 0.96 0.94 0.48 0.28Precision 0.42 0.75 0.49 0.51F value 0.58 0.83 0.48 0.37TPpred. length (nucleotides)a 71.6 6 47.8 64.6 6 45 400 400FPpred. length (nucleotides)a 53.9 6 38.9 61.6 6 41.9 400 400TP coverage (%) 13.9 12.7 50.7 46FP coverage (%) 7.5 7.6 13.2 24.5
RiceRecall 0.97 0.95 0.77 0.15Precision 0.31 0.9 0.62 0.86F value 0.47 0.92 0.53 0.26TPpred. length (nucleotides)a 94.6 6 60.1 66.2 6 48.8 400 400FPpred. length (nucleotides)a 60.7 6 44.5 45.8 6 36.2 400 400TP coverage (%) 17.9 14.2 51.8 7.6FP coverage (%) 8.5 6 10.4 6.7
aIn PromPredict, the midpoint of a 100-nucleotide window is considered as a prediction if it satisfies thecutoffs. In EP3, the entire 400-nucleotide window is considered as a prediction if it satisfies the cutoffs.
Promoter Prediction in Plants Using DNA Free Energy Criteria
Plant Physiol. Vol. 156, 2011 1309 www.plant.org on June 10, 2015 - Published by www.plantphysiol.orgDownloaded from
Copyright © 2011 American Society of Plant Biologists. All rights reserved.

of universally expressed housekeeping genes) andnonrandom chromosomal distribution. They specu-late that these introns might play regulatory roles ingene expression and nucleocytoplasmic transcriptexport.
Our analysis showed that about 95% to 96% ofpredictions were found in the noncoding region of theprimary transcript, a majority of which were found inthe introns and may be valid TSSs or cis-regulatorysites (Table IV). Also, we analyzed 24 introns that havebeen experimentally shown to regulate expression inArabidopsis and rice (Table VI), out of which 21 weredetected by PromPredict to contain a promoter signal.The introns closest to the TSS are suggested to be mostimportant for the regulation of transcription, andinterestingly, 20% of our FPpred. are found in the firstintron alone. The remaining intronic predictions (50%of total FPpred.) might be signals for other processes,such as splicing in RNAs.
In order to determine the core promoters, the pre-dictions closest to the TSS were considered for bothprotein-coding and ncRNA genes (Fig. 2). The predic-tions in Arabidopsis are concentrated closer to the TSSthan in rice. However, the free energy of distal predic-tions is comparable to that of proximal predictions(Fig. 3), indicating that these might be putative corepromoters and not prediction artifacts. Thus, it seemsthat free energy peaks might be present at different
positions relative to the TSS for eukaryotic genes, incontrast to prokaryotic genes, where the peak is onlylocalized close to the TSS (Rangannan and Bansal,2009).
A genome-wide analysis of prediction scores inorthologous gene pairs gave a good correlation be-tween the highest score TPpred. for each ortholog mem-ber (Fig. 7). A finer analysis of promoter organizationin certain ortholog pairs further showed that thepredictions in the vicinity of the TSS not only havecomparable scores but also similar locations with re-spect to TSS (Fig. 8). Hence, there seems to be a goodrelationship between the promoter predictions inorthologous genes, and we propose that our predic-tions can also be used for studying promoter regions inthese genes.
The AFE for FNgenes showed a different profile thanthat observed for all genes, especially in rice (Fig. 5).The presence of alternative structural profiles forbendability in human promoters has been reported(Florquin et al., 2005; Zeng et al., 2009). The presenceof such alternative structural profiles might pointtoward different regulatory architectures that enablespatiotemporal expression specificity in eukaryotes.Hence, alternative free energy profiles (and otherstructural profiles) could be explored in plants to gaina better understanding of the promoter region andregulation.
Table VI. Regulatory introns and predictions
Some Arabidopsis and rice introns are known to regulate expression. The majority of these have an overlapping PromPredict prediction. The firstintron in all the genes was involved in regulation, except for TWN2, where the first two introns were involved.
Gene Prediction Strength Reference
ArabidopsisRHD3 (At3g13870) No prediction Wang et al. (2002)Histone H3 (At4g40040) Medium Chaubet-Gigot et al. (2001)Histone H3 (At4g40030) Low Chaubet-Gigot et al. (2001)EF-1a A1 (At1g07920) Very high/medium Curie et al. (1993)EF-1a A3 (At1g07940) High/medium Chung et al. (2006)eEF-1b (At2g18110) Medium Gidekel et al. (1996)TWN2 intron 1 (At1g14610) No prediction Zhang and Somerville (1997)TWN2 intron 2 (At1g14610) High Zhang and Somerville (1997)Cox5c-1 (At2g47380) Medium Curi et al. (2005)Cox5c-2 (At3g62400) High/medium Curi et al. (2005)ACT1 (At2g37620) High/medium Vitale et al. (2003)KC01 (At5g55630) Medium Czempinski et al. (2002)PRF1 (At2g19760) High Jeong et al. (2006)PRF2 (At4g29350) Medium Jeong et al. (2006)ADF1 (At3g46010) High Jeong et al. (2006)FAD2 (At3g12120) High/medium Kim et al. (2006)SUVH3 (At1g73100) Medium Casas-Mollano et al. (2006)ATMHX (At2g47600) No prediction David-Assael et al. (2006)UBQ3 (At5g03240) Medium Norris et al. (1993)UBQ10 (At4g05320) High Norris et al. (1993)ATPK1 (At3g08730) High/medium Zhang et al. (1994)
RiceTPI (Os01g0147900 Medium Xu et al. (1994), Snowden et al. (1996)GAMyb (Os01g0812000) Medium Washio and Morikawa (2006)RPBF (Os02g0252400) Highest/very high/medium Washio and Morikawa (2006)
Morey et al.
1310 Plant Physiol. Vol. 156, 2011 www.plant.org on June 10, 2015 - Published by www.plantphysiol.orgDownloaded from
Copyright © 2011 American Society of Plant Biologists. All rights reserved.

CONCLUSION
We show here that the program PromPredict per-forms quite well in predicting cis-regulatory regions inplant genomes. This is indeed surprising, since theprogram has been trained on prokaryotes. It seemsthat the relative free energy difference criterion used inthis program is a general property found in the vicinityof the TSS, as shown in the human genome by Abeelet al. (2008a). Hence, PromPredict might also be ex-pected to perform well for other plants and eukary-otes.The program is based on simple prediction criteria
that are easy to program, and further enhancement ofthe program with other features might give betterresults. Since PromPredict predictions are biased to-ward unstable and hence AT-rich regions, comple-menting the programwith other motifs like the Ypatchor GA motif (Yamamoto et al., 2009) could be benefi-cial.As our understanding of transcription develops, the
actual complexity of the processes involved in generegulation is revealed. Determination of putative reg-ulatory sites where transcription factors could bind isbut a small step in trying to understand the hugeorchestra of regulatory mechanisms involved. It isdifficult to make a one-to-one correlation between thecis-regulatory region and the corresponding regulatedgene. In eukaryotic genomes, the sites involved in theregulation of a gene may vary in different tissues,adding to the complexity of the problem. This isfurther complicated by factors such as combinatorialregulation, nucleosome binding, and epigenetic mod-ifications. Yet, common themes and patterns of regu-lation can be observed, as seen in this study. A
combinatorial approach involving sequence and struc-tural studies, both theoretical and experimental,would be most useful to further explore the mecha-nisms of transcription regulation.
MATERIALS AND METHODS
Data Sets
The Arabidopsis (Arabidopsis thaliana) genome and annotation data were
extracted from the TAIR9 release of The Arabidopsis Information Resource
(TAIR; Arabidopsis Genome Initiative, 2000; Rhee et al., 2003). The TAIR9
release contains multiple gene models for certain genes. Since we are consid-
ering the TSS positions in our analysis, gene models with overlapping or
proximal TSSs will result in misrepresentation of the results. Hence, for TSSs
(of the same gene) within 100 nucleotides of each other, only the most
upstream TSS is considered. Applying this constraint, we have a data set of
20,094 protein-coding gene models with TSS information and 1,263 ncRNA
gene models. Also, gene models with only TLS information were sorted so
that gene models with TLSs at least 100 nucleotides apart are selected for a
particular gene, to give the TLS data set of 8,195 genes. The Web browser for
visualizing predictions shows all the gene models.
The rice (Oryza sativa ssp. japonica ‘Nipponbare’) genome was extracted
from the Rice Annotation Project Database (RAPDB) Build 4 (Rice Annotation
Project, 2007, 2008). The protein-coding genes with TSS information (23,057
genes) and ncRNA genes (1,527 genes) were considered for analysis. A total of
1,152 non-protein-coding primary transcripts were also considered for anal-
ysis. The latest build of RAPDB (Build 5) has 31,232 protein-coding genes and
1,515 noncoding primary transcripts.
AFE Profile
For calculating the AFE, dinucleotide parameters based on the model
proposed by Allawi and Santalucia (1997) and Santalucia (1998) were used.
Sequences of the same length were aligned with the TSS at the 0 position. An
average profile is obtained by calculating the mean value of free energy at each
position over all the sequences. The dinucleotide parameters averaged over a
moving window of 15 nucleotides (frameshift of one nucleotide) were
assigned to the midpoint of each window in order to reduce noise.
Figure 7. Correlation between prediction scoresfor orthologous genes. The highest predictionscores corresponding to 11,941 TPgenes in Arabi-dopsis have been plotted against the scores fortheir 10,275 TPgene orthologs in rice. Since there ismore than one Arabidopsis gene ortholog forsome rice genes, 12,359 pairs of orthologousgenes were formed. The 9,976 orthologous genepairs with scores in the same class or differing byone level in the two genomes (crosses) give aPearson correlation coefficient of 0.51 (dotted-dashed best fit line), while a value of 0.23 isobtained for all gene pairs (crosses and dots; solidbest fit line). [See online article for color versionof this figure.]
Promoter Prediction in Plants Using DNA Free Energy Criteria
Plant Physiol. Vol. 156, 2011 1311 www.plant.org on June 10, 2015 - Published by www.plantphysiol.orgDownloaded from
Copyright © 2011 American Society of Plant Biologists. All rights reserved.

PromPredict Program
The PromPredict program was first written to predict promoter regions in
prokaryotes (Kanhere and Bansal, 2005b; Rangannan and Bansal, 2007, 2009).
The program is built to predict cis-regulatory regions in a given input
sequence on the basis of relative free energy of neighboring regions in a
1,001-nucleotide-long fragment and does not require any genome-specific
training. Hence, the program can be readily used for newly sequenced
genomes for which gene and promoter information is scarce. Supplemental
Figure S3A shows the AFE values in the 22,000 to +2,000 regions relative to
TSS in Arabidopsis and rice. Supplemental Figure S3B shows the AFE values
used as cutoffs to define the promoter regions in PromPredict and the AFE
values in upstream (2500 to 0) and downstream (0 to +500) regions of
Arabidopsis and rice. The values for Arabidopsis match well with the
PromPredict cutoffs. The proximal downstream regions in rice are unusually
GC rich, leading to lower AFE values, but in general, the AFE values for
nonpromoter regions (+500 to +1,000) farther away from TSSs are similar to
the cutoffs used in PromPredict.
PromPredict considers (1) the absolute free energy (E1) averaged over each
overlapping window of a 100-nucleotide sequence (frameshift of one nucle-
otide) and (2) the relative free energy difference (D) of E1with the free energy
(E2) averaged over a downstream 100-nucleotide sequence separated by 50
nucleotides in the 5#/3# direction. The free energy is calculated using the
dinucleotide parameters based on the model proposed by Allawi and
Santalucia (1997) and Santalucia (1998) as a sum over 15 nucleotides. The
parameters E1 and D are then compared with predefined cutoff values
(Supplemental Table S1). A sliding superwindow of 1,001 nucleotides (with a
frameshift of 750 nucleotides) is used to determine the average GC content
range used for cutoff values for each 100-nucleotide window within this
superwindow. Further details of the algorithm are given in Supplemental
Protocol S1. We have used the latest version of the program described by
Rangannan and Bansal (2010).
Performance Evaluation and Comparison
The performance of PromPredict on rice and Arabidopsis genomes was
evaluated using the distance-based cutoff as described by Bajic et al. (2004)
and Abeel et al. (2009). It is obvious that the performance of a program would
improve if the region considered for determining true positives was increased.
However, the cis-regulatory regions are generally found within a particular
distance upstream of the TSS/TLS and in some regions within the primary
transcript, such as the 5# UTR. The optimal length of this region largely
depends on the organism under study. Previous analyses have considered a
TP region of 2150 to +50 bp for prokaryotes (Rangannan and Bansal, 2009),
2500 to +500 bp for eukaryotes (Abeel et al., 2008a, 2009) with respect to TSS,
and2500 to 0 bp for prokaryotes with respect to TLS (Rangannan and Bansal,
2009), where the 0 position corresponds to the TSS/TLS. For rice and
Arabidopsis, we found that approximately 50% of the genes have a 5# UTR
length of 100 nucleotides or less (Table I). Hence, in our analysis, we
considered the region2500 to +100 bp with respect to the TSS for determining
true positives in protein-coding genes while the region 21,000 to 0 bp of the
TSS/TLS was considered for ncRNA genes and for genes with only TLS
information. For comparison of our results with EP3, we considered the region
2500 to +500 bp with respect to the TSS for protein-coding genes and 21,000
to 0 bp of the TSS for ncRNA genes.
The least stable position of a prediction was considered as a single-
nucleotide metric for defining true and false predictions to avoid ambiguity
due to overlapping with the TP region. Therefore, any prediction with its least
stable position lying within the TP region was considered as a TPpred., while
any prediction (least stable position) lying within the transcribing region of a
gene but not within the TP region (FP region) was considered as a FPpred.. The
genes that have at least one TPpred. within the TP region of its TSS were
considered as TPgenes. The genes that did not have any predictions within the
TP region were considered as FNgenes. The performance parameters were
defined as follows:
Figure 8. Promoter predictions for six orthologous genes are shown for Arabidopsis (blue) and rice (red). The TSSs of theorthologs are aligned and correspond to nucleotide position 0 on the x axis. The orthologous genes are shown schematically atthe bottom. Gray bars represent UTRs, thin black bars correspond to introns, and brown bars represent exons. The y axis indicatesthe Dmax score of the prediction. Only predictions within 2500 to +100 bp of the TSS are true positives in each case. The sixrepresentative genes shown are Asp aminotransferase (A), copper/zinc (Cu/Zn) superoxide dismutase (B), Dof gene family (C),P-type ATPase (D), FAD2 (E), and PRF1 (F). The first intron for Arabidopsis genes in E and F has been shown to have regulatoryfunctions. A ncRNA gene coincides with the first intron of the rice FAD2 gene as shown in E.
Morey et al.
1312 Plant Physiol. Vol. 156, 2011 www.plant.org on June 10, 2015 - Published by www.plantphysiol.orgDownloaded from
Copyright © 2011 American Society of Plant Biologists. All rights reserved.

Precision ¼ TPpred:
TPpred: þ FPpred:
Recall ¼ TPgenes
TPgenes þ FNgenes
F value ¼ 23Precision3Recall
Precision þ Recall
We also mention the average prediction length and the percentage pre-
diction coverage of the TP region and FP region when comparing programs.
The latter statistic indicates the percentage length of the TP or FP region that a
program predicts to be true.
Prediction Score Categorization
The D value of a prediction reflects the difference in free energy of a
prediction from its downstream region. Since an unstable region in a com-
paratively stable environment in DNA is a characteristic of promoter regions,
we used the D value to determine the relative score of predictions. The Dmax
for all predictions in Arabidopsis and rice were pooled, and the mean and SD
for these data were calculated. Dmax cutoffs for categorizing predictions
(Supplemental Table S2) were calculated on the basis of the GC content of a
1,001-nucleotide fragment (superwindow) containing the prediction. One of
the following five score classes was assigned to each prediction depending on
the score of theDmax value of a prediction: (1) highest (Dmax .mean + 2 SD); (2)
very high (mean + SD ,Dmax ,mean + 2 SD); (3) high (mean, Dmax ,mean +
SD); (4) medium (mean2 SD ,Dmax ,mean); (5) low (cutoff,Dmax ,mean2SD). Also, the genes were categorized according to the score class of the
prediction with the highest score present within2500 to +100 bp of its TSS. All
the predictions thus categorized according to their scores can be browsed
online in the genome browser PlantcisProm constructed using Bioperl (Stein
et al., 2002) along with annotated genes (see below).
Web Resources
The PlantcisProm genome browser (http://nucleix.mbu.iisc.ernet.in/
plantcisprom) can be used to browse the whole-genome promoter predictions
along with gene annotations for Arabidopsis and rice genomes. The Prom-
Predict Web server (http://nucleix.mbu.iisc.ernet.in/prompredict/prompredict.
html) can be used to predict promoter regions in the input sequence. Down-
loadable versions of the program are available for short (less than 10 Mb) and
long (more than 10 Mb) genomic sequences.
Supplemental Data
The following materials are available in the online version of this article.
Supplemental Figure S1. GC content distribution for Arabidopsis and rice
sequences in the vicinity of the TSS.
Supplemental Figure S2. AFE profile variation with GC content for
sequences in the vicinity of the TSS.
Supplemental Figure S3. Comparison of AFE values in the vicinity of the
TSS with cutoff values used in PromPredict.
Supplemental Figure S4. Derivation of cutoff values for prediction score
categories of Arabidopsis and rice predictions.
Supplemental Figure S5. Percentage frequency distribution of tetramers
in the core promoter and the 1,001-nucleotide region surrounding the
TSS.
Supplemental Figure S6. GO categorization of all genes and TPgenes from
rice chromosome 1.
Supplemental Table S1. Cutoff values for PromPredict.
Supplemental Table S2. Cutoff values for prediction score categories.
Supplemental Table S3. GO categorization of TPgenes and FNgenes from
Arabidopsis.
Supplemental Table S4. Gene IDs for orthologous genes.
Supplemental Protocol S1. Details of the PromPredict algorithm.
Supplemental Protocol S2. GO SLIM categories
ACKNOWLEDGMENTS
We thank the RAPDB and TAIR teams for providing information on
annotation queries.
Received October 19, 2010; accepted April 21, 2011; published April 29, 2011.
LITERATURE CITED
Abeel T, Saeys Y, Bonnet E, Rouze P, Van De Peer Y (2008a) Generic
eukaryotic core promoter prediction using structural features of DNA.
Genome Res 18: 310–323
Abeel T, Saeys Y, Rouze P, Van De Peer Y (2008b) ProSOM: core promoter
prediction based on unsupervised clustering of DNA physical profiles.
Bioinformatics 24: i24–i31
Abeel T, Van De Peer Y, Saeys Y (2009) Toward a gold standard for
promoter prediction evaluation. Bioinformatics 25: i313–i320
Alexandrov N, Troukhan M, Brover V, Tatarinova T, Flavell R, Feldmann
K (2006) Features of Arabidopsis genes and genome discovered using
full-length cDNAs. Plant Mol Biol 60: 69–85
Allawi HT, Santalucia J (1997) Thermodynamics and NMR of internal G-T
mismatches in DNA. Biochemistry 36: 10581–10594
Arabidopsis Genome Initiative (2000) Analysis of the genome sequence of
the flowering plant Arabidopsis thaliana. Nature 408: 796–815
Bajic VB, Tan SL, Suzuki Y, Sugano S (2004) Promoter prediction analysis
on the whole human genome. Nat Biotechnol 22: 1467–1473
Cao X, Zeng J, Yan H (2009) Physical signals for protein-DNA recognition.
Phys Biol 6: 036012–036021
Carninci P, Sandelin A, Lenhard B, Katayama S, Shimokawa K, Frith
MC, Ponjavic J, Semple CAM, Taylor MS, Forrest ARR, et al (2006)
Genome-wide analysis of mammalian promoter architecture and evo-
lution. Nat Genet 38: 626–635
Casas-Mollano J, Lao N, Kavanagh T (2006) Intron-regulated expression of
SUVH3, an Arabidopsis Su(var)3-9 homologue. J Exp Bot 57: 3301–3311
Chaubet-Gigot N, Kapros T, Flenet M, Kahn K, Gigot C, Waterborg J
(2001) Tissue-dependent enhancement of transgene expression by in-
trons of replacement histone H3 genes of Arabidopsis. Plant Mol Biol 45:
17–30
Chung B, Simons C, Firth A, Brown C, Hellens R (2006) Effect of 5#UTR
introns on gene expression in Arabidopsis thaliana. BMC Genomics 7: 120
Cooper SJ, Trinklein ND, Anton ED, Nguyen L, Myers RM (2006)
Comprehensive analysis of transcriptional promoter structure and
function in 1% of the human genome. Genome Res 16: 1–10
Curi GC, Chan RL, Gonzalez DH (2005) The leader intron of Arabidopsis
thaliana genes encoding cytochrome c oxidase subunit 5c promotes high-
level expression by increasing transcript abundance and translation
efficiency. J Exp Bot 56: 2563–2571
Curie C, Axelos M, Bardet C, Atanassova R, Chaubet N, Lescure B (1993)
Modular organization and development activity of an Arabidopsis
thaliana EF-1a gene promoter. Mol Genet Genomics 238: 428–436
Czempinski K, Frachisse J, Maurel C, Barbier-Brygoo H, Mueller-Roeber
B (2002) Vacuolar membrane localization of the Arabidopsis ‘two-pore’
K+ channel KCO1. Plant J 29: 809–820
David-Assael O, Berezin I, Shoshani-Knaai N, Saul H, Mizrachy-Dagri T,
Chen J, Brook E, Shaul O (2006) AtMHX is an auxin and ABA-regulated
transporter whose expression pattern suggests a role in metal homeo-
statis in tissues with photosynthetic potential. Funct Plant Biol 33:
661–672
Davuluri R, Sun H, Palaniswamy S, Matthews N, Molina C, Kurtz M,
Grotewold E (2003) AGRIS: Arabidopsis Gene Regulatory Information
Server, an information resource of Arabidopsis cis-regulatory elements
and transcription factors. BMC Bioinformatics 4: 25
Down TA, Hubbard TJP (2002) Computational detection and location of
transcription start sites in mammalian genomic DNA. Genome Res 12:
458–461
ENCODE Project Consortium (2007) Identification and analysis of
Promoter Prediction in Plants Using DNA Free Energy Criteria
Plant Physiol. Vol. 156, 2011 1313 www.plant.org on June 10, 2015 - Published by www.plantphysiol.orgDownloaded from
Copyright © 2011 American Society of Plant Biologists. All rights reserved.

functional elements in 1% of the human genome by the ENCODE pilot
project. Nature 447: 799–816
Farnham PJ (2009) Insights from genomic profiling of transcription factors.
Nat Rev Genet 10: 605–616
Florquin K, Saeys Y, Degroeve S, Rouze P, Van de Peer Y (2005) Large-
scale structural analysis of the core promoter in mammalian and plant
genomes. Nucleic Acids Res 33: 4255–4264
Fujimori S, Washio T, Tomita M (2005) GC-compositional strand bias
around transcription start sites in plants and fungi. BMC Genomics 6: 26
Geiduschek EP, Kassavetis GA (2001) The RNA polymerase III transcrip-
tion apparatus. J Mol Biol 310: 1–26
Gene Ontology Consortium (2000) Gene Ontology: tool for the unification
of biology. Nat Genet 25: 25–29
Gidekel M, Jimenez B, Herrera-estrella L (1996) The first intron of the
Arabidopsis thaliana gene coding for elongation factor 1-b contains an
enhancer-like element. Gene 170: 201–206
Higo K, Ugawa Y, Iwamoto M, Korenaga T (1999) Plant cis-acting regu-
latory DNA elements (PLACE) database: 1999. Nucleic Acids Res 27:
297–300
International Brachypodium Initiative (2010) Genome sequencing and
analysis of the model grass Brachypodium distachyon. Nature 463:
763–768
Jaiswal P, Ni J, Yap I, Ware D, Spooner W, Youens-Clark K, Ren L, Liang
C, Zhao W, Ratnapu K, et al (2006) Gramene: a bird’s eye view of cereal
genomes. Nucleic Acids Res 34: D717–D723
Jeong Y, Mun J, Lee I, Woo J, Hong C, Kim S (2006) Distinct roles of the first
introns on the expression of Arabidopsis profilin gene family members.
Plant Physiol 140: 196–209
Kanhere A, Bansal M (2005a) A novel method for prokaryotic promoter
prediction based on DNA stability. BMC Bioinformatics 6: 1–10
Kanhere A, Bansal M (2005b) Structural properties of promoters: similar-
ities and differences between prokaryotes and eukaryotes. Nucleic
Acids Res 33: 3165–3175
Kersey PJ, Lawson D, Birney E, Derwent PS, Haimel M, Herrero J,
Keenan S, Kerhornou A, Koscielny G, Kahari A, et al (2010) Ensembl
Genomes: extending Ensembl across the taxonomic space. Nucleic
Acids Res 38: D563–D569
Kim M, Kim H, Shin J, Chung C, Ohlrogge J, Suh M (2006) Seed-specific
expression of sesame microsomal oleic acid desaturase is controlled by
combinatorial properties between negative cis-regulatory elements in
the SeFAD2 promoter and enhancers in the 5#-UTR intron. Mol Genet
Genomics 276: 351–368
Lantermann AB, Straub T, Stralfors A, Yuan G-C, Ekwallkarl K, Korber P
(2010) Schizosaccharomyces pombe genome-wide nucleosome mapping
reveals positioning mechanisms distinct from those of Saccharomyces
cerevisiae. Nat Struct Mol Biol 17: 251–257
Lee W, Tillo D, Bray N, Morse RH, Davis RW, Hughes TR, Nislow C
(2007) A high-resolution atlas of nucleosome occupancy in yeast. Nat
Genet 39: 1235–1244
Lichtenberg J, Yilmaz A, Welch J, Kurz K, Liang X, Drews F, Ecker K, Lee
S, Geisler M, Grotewold E, et al (2009) The word landscape of the non-
coding segments of the Arabidopsis thaliana genome. BMC Genomics
10: 463
Lu J, Sivamani E, Azhakanandam K, Samadder P, Li X, Qu R (2008) Gene
expression enhancement mediated by the 5# UTR intron of the rice rubi3
gene varied remarkably among tissues in transgenic rice plants. Mol
Genet Genomics 279: 563–572
Ming R, Hou S, Feng Y, Yu Q, Dionne-Laporte A, Saw JH, Senin P, Wang
W, Ly BV, Lewis KLT, et al (2008) The draft genome of the transgenic
tropical fruit tree papaya (Carica papaya Linnaeus). Nature 452: 991–996
Molina C, Grotewold E (2005) Genome wide analysis of Arabidopsis core
promoters. BMC Genomics 6: 25–36
Morris RT, O’Connor TR, Wyrick JJ (2008) Osiris: an integrated promoter
database for Oryza sativa L. Bioinformatics 24: 2915–2917
Mueller LA, Zhang P, Rhee SY (2003) AraCyc: a biochemical pathway
database for Arabidopsis. Plant Physiol 132: 453–460
Norris S, Meyer S, Callis J (1993) The intron of Arabidopsis thaliana
polyubiquitin genes is conserved in location and is a quantitative
determinant of chimeric gene expression. Plant Mol Biol 21: 895–906
Parker SCJ, Hansen L, Abaan HO, Tullius TD, Margulies EH (2009) Local
DNA topography correlates with functional noncoding regions of the
human genome. Science 324: 389–392
Pedersen AG, Baldi P, Chauvin Y, Brunak S (1999) The biology of
eukaryotic promoter prediction: a review. Comput Chem 23: 191–207
Pugh BF (2000) Control of gene expression through regulation of the TATA-
binding protein. Gene 255: 1–14
Rangannan V, Bansal M (2007) Identification and annotation of promoter
regions in microbial genome sequences on the basis of DNA stability. J
Biosci 32: 851–862
Rangannan V, Bansal M (2009) Relative stability of DNA as a generic
criterion for promoter prediction: whole genome annotation of micro-
bial genomes with varying nucleotide base composition. Mol Biosyst 5:
1758–1769
Rangannan V, Bansal M (2010) High quality annotation of promoter
regions for 913 bacterial genomes. Bioinformatics 26: 3043–3050
Reimand J, Kull M, Peterson H, Hansen J, Vilo J (2007) g:Profiler: a Web-
based toolset for functional profiling of gene lists from large-scale
experiments. Nucleic Acids Res 35: W193–W200
Rensing SA, Lang D, Zimmer AD, Terry A, Salamov A, Shapiro H,
Nishiyama T, Perroud P-F, Lindquist EA, Kamisugi Y, et al (2008) The
Physcomitrella genome reveals evolutionary insights into the conquest
of land by plants. Science 319: 64–69
Rhee S, Beavis W, Berardini TZ, Chen G, Dixon D, Doyle A, Garcia-
Hernandez M, Huala E, Lander G, Montoya M, et al (2003) The
Arabidopsis Information Resource (TAIR): a model organism database
providing a centralized, curated gateway to Arabidopsis biology, re-
search materials and community. Nucleic Acids Res 31: 224–228
Rice Annotation Project (2007) Curated genome annotation of Oryza sativa
ssp. japonica and comparative genome analysis with Arabidopsis thaliana.
Genome Res 17: 175–183
Rice Annotation Project (2008) The Rice Annotation Project Database
(RAP-DB): 2008 update. Nucleic Acids Res 36: D1028–D1033
Rombauts S, Florquin K, Lescot M, Marchal K, Rouze P, Peer YVD (2003)
Computational approaches to identify promoters and cis-regulatory
elements in plant genomes. Plant Physiol 132: 1162–1176
Rose AB (2008) Intron-mediated regulation of gene expression. Curr Top
Microbiol Immunol 326: 277–290
Rose AB, Elfersi T, Parra G, Korf I (2008) Promoter-proximal introns in
Arabidopsis thaliana are enriched in dispersed signals that elevate gene
expression. Plant Cell 20: 543–551
Russell J, Zomerdijk JCBM (2005) RNA-polymerase-I-directed rDNA
transcription, life and works. Trends Biochem Sci 30: 87–96
Santalucia J (1998) A unified view of polymer, dumbbell, and oligonucle-
otide DNA nearest-neighbor thermodynamics. Proc Natl Acad Sci USA
95: 1460–1465
Schmutz J, Cannon SB, Schlueter J, Ma J, Mitros T, Nelson W, Hyten DL,
Song Q, Thelen JJ, Cheng J, et al (2010) Genome sequence of the
palaeopolyploid soybean. Nature 463: 178–183
Snowden KC, Buchhholz WG, Hall TC (1996) Intron position affects
expression from the tpi promoter in rice. Plant Mol Biol 31: 689–692
Sonnenburg S, Zien A, Ratsch G (2006) ARTS: accurate recognition of
transcription starts in human. Bioinformatics 22: e472–e480
Stein LD, Mungall C, Shu S, Caudy M, Mangone M, Day A, Nickerson E,
Stajich JE, Harris TW, Arva A, et al (2002) The Generic Genome
Browser: a building block for a model organism system database.
Genome Res 12: 1599–1610
Tanaka T, Koyanagi KO, Itoh T (2009) Highly diversified molecular
evolution of downstream transcription start sites in rice and Arabidop-
sis. Plant Physiol 149: 1316–1324
Vitale A, We RJ, Cheng Z, Meagher RB (2003) Multiple conserved 5#elements are required for high-level pollen expression of the Arabidop-
sis reproductive actin ACT1. Plant Mol Biol 52: 1135–1151
Wang H, Lee MM, Schiefelbein JW (2002) Regulation of the cell expan-
sion gene RHD3 during Arabidopsis development. Plant Physiol 129:
638–649
Washio K, Morikawa M (2006) Common mechanisms regulating expres-
sion of rice aleurone genes that contribute to the primary response for
gibberellin. Biochim Biophys Acta 1759: 478–490
Wong GK-S, Wang J, Tao L, Tan J, Zhang J, Passey DA, Yu J (2002)
Compositional gradients in Gramineae genes. Genome Res 12: 851–856
Xu Y, Yu H, Hall TC (1994) Rice triosephosphate isomerase gene 5#sequence directs b-glucuronidase activity in transgenic tobacco but
requires an intron for expression in rice. Plant Physiol 106: 459–467
Yamamoto Y, Ichida H, Matsui M, Obokata J, Sakurai T, Satou M, Seki M,
ShinozakiK, Abe T (2007a) Identification of plant promoter constituents
Morey et al.
1314 Plant Physiol. Vol. 156, 2011 www.plant.org on June 10, 2015 - Published by www.plantphysiol.orgDownloaded from
Copyright © 2011 American Society of Plant Biologists. All rights reserved.

by analysis of local distribution of short sequences. BMC Genomics
8: 67
Yamamoto YY, Ichida H, Abe T, Suzuki Y, Sugano S, Obokata J (2007b)
Differentiation of core promoter architecture between plants and mam-
mals revealed by LDSS analysis. Nucleic Acids Res 35: 6219–6226
Yamamoto YY, Yoshitsugu T, Sakurai T, Seki M, Shinozaki K, Obokata J
(2009) Heterogeneity of Arabidopsis core promoters revealed by high-
density TSS analysis. Plant J 60: 350–362
Yang H (2009) In plants, expression breadth and expression level distinctly
and nonlinearly correlate with gene structure. Biol Direct 4: 45–60
Zeng J, Cao X-Q, Zhao H, Yan H (2009) Finding human promoter groups
based on DNA physical properties. Phys Rev E Stat Nonlin Soft Matter
Phys 80: 041917
Zhang JZ, Somerville CR (1997) Suspensor-derived poly-embryony
caused by altered expression of valyl-tRNA synthetase in the twn2
mutant of Arabidopsis. Proc Natl Acad Sci USA 94: 7349–7355
Zhang S-h, Lawton MA, Hunter T, Lamb CJ (1994) atpk1, a novel
ribosomal protein kinase gene from Arabidopsis. J Biol Chem 269:
17586–17592
Zhu J, He F, Wang D, Liu K, Huang D, Xiao J, Wu J, Hu S, Yu J (2010) A
novel role for minimal introns: routing mRNAs to the cytosol. PLoS
ONE 5: e10144
Promoter Prediction in Plants Using DNA Free Energy Criteria
Plant Physiol. Vol. 156, 2011 1315 www.plant.org on June 10, 2015 - Published by www.plantphysiol.orgDownloaded from
Copyright © 2011 American Society of Plant Biologists. All rights reserved.
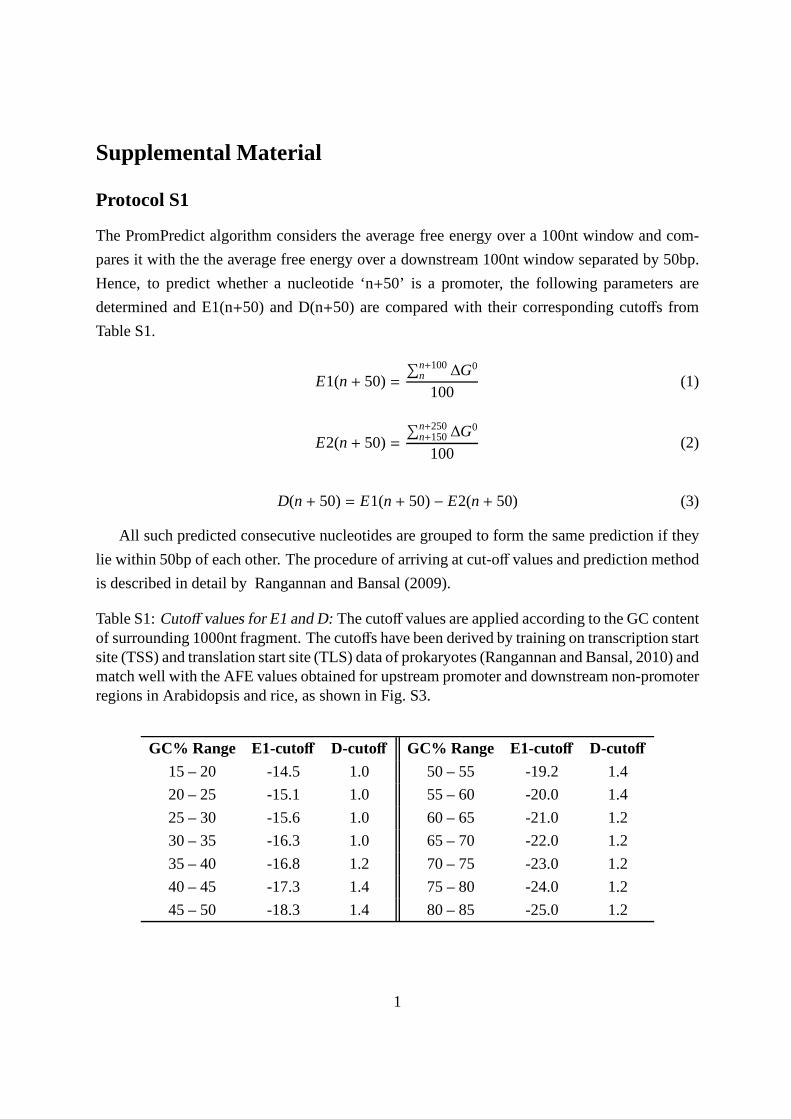
Supplemental Material
Protocol S1
The PromPredict algorithm considers the average free energy over a 100nt window and com-
pares it with the the average free energy over a downstream 100nt window separated by 50bp.
Hence, to predict whether a nucleotide ‘n+50’ is a promoter, the following parameters are
determined and E1(n+50) and D(n+50) are compared with their corresponding cutoffs from
Table S1.
E1(n + 50)=
∑n+100n ∆G0
100(1)
E2(n + 50)=
∑n+250n+150∆G0
100(2)
D(n + 50)= E1(n + 50)− E2(n + 50) (3)
All such predicted consecutive nucleotides are grouped to form the same prediction if they
lie within 50bp of each other. The procedure of arriving at cut-off values and prediction method
is described in detail by Rangannan and Bansal (2009).
Table S1:Cutoff values for E1 and D:The cutoff values are applied according to the GC contentof surrounding 1000nt fragment. The cutoffs have been derived by training on transcription startsite (TSS) and translation start site (TLS) data of prokaryotes (Rangannan and Bansal, 2010) andmatch well with the AFE values obtained for upstream promoter and downstream non-promoterregions in Arabidopsis and rice, as shown in Fig. S3.
GC% Range E1-cutoff D-cutoff GC% Range E1-cutoff D-cutoff
15 – 20 -14.5 1.0 50 – 55 -19.2 1.4
20 – 25 -15.1 1.0 55 – 60 -20.0 1.4
25 – 30 -15.6 1.0 60 – 65 -21.0 1.2
30 – 35 -16.3 1.0 65 – 70 -22.0 1.2
35 – 40 -16.8 1.2 70 – 75 -23.0 1.2
40 – 45 -17.3 1.4 75 – 80 -24.0 1.2
45 – 50 -18.3 1.4 80 – 85 -25.0 1.2
1

10 20 30 40 50 60 70 80 900
500
1000
1500
2000
2500
GC% range
Fre
quen
cy
10 20 30 40 50 60 70 80 900
200
400
600
800
1000
GC% range
Fre
quen
cy
−500 to +500bp−500 to −100bp−80 to +20bp+100 to +500bp
A
B
Figure S1:GC content distribution for (A) Arabidopsis and (B) rice sequences in the vicinityof transcription start site (TSS):The frequency distribution of GC content in a 1000bp seg-ment (−500bp to+500bp) around TSS, upstream sequence (−500bp to−100bp), downstreamsequence (+100bp to+500bp) and sequence adjacent to the TSS (−80bp to+20bp) are shown.The GC content of Arabidopsis promoters shows a narrow rangewithin each subclass and smalldifferences between the subclasses. The GC content for the rice promoters shows a broad rangewith large differences between subclasses especially upstream and downstream regions.
2
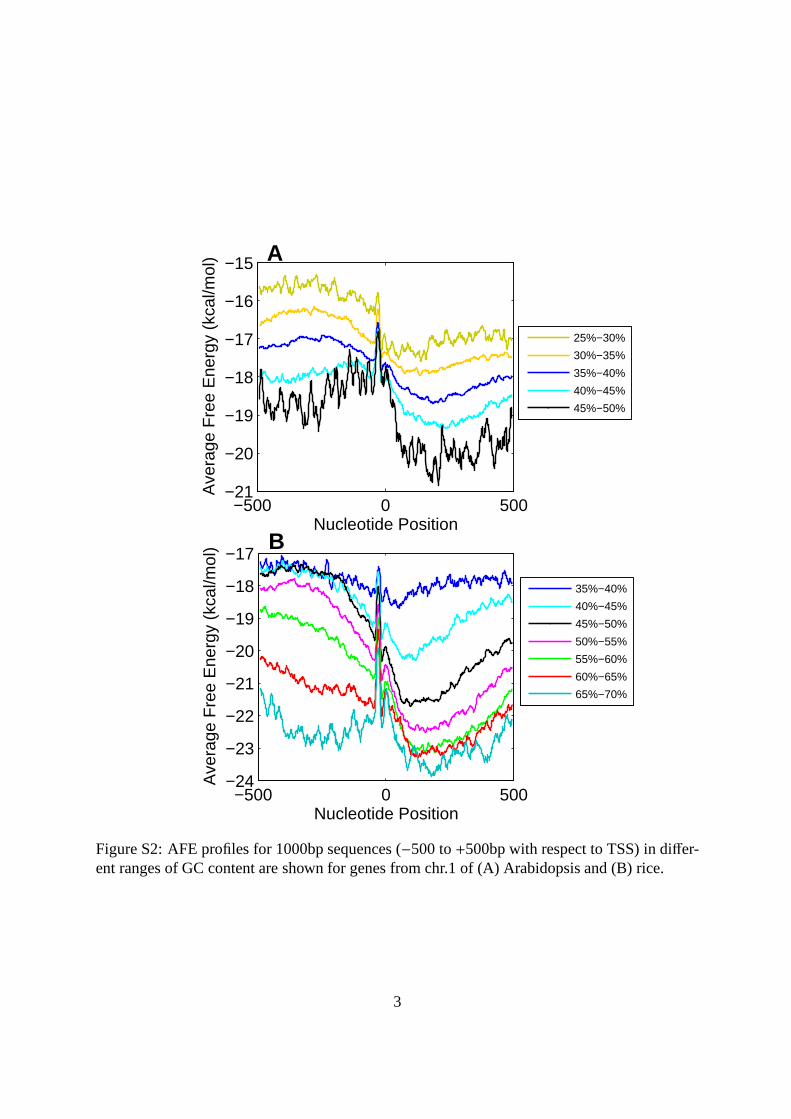
−500 0 500−21
−20
−19
−18
−17
−16
−15
Nucleotide Position
Ave
rage
Fre
e E
nerg
y (k
cal/m
ol)
−500 0 500−24
−23
−22
−21
−20
−19
−18
−17
Nucleotide Position
Ave
rage
Fre
e E
nerg
y (k
cal/m
ol)
35%−40%
40%−45%
45%−50%
50%−55%
55%−60%
60%−65%
65%−70%
25%−30%
30%−35%
35%−40%
40%−45%
45%−50%
A
B
Figure S2: AFE profiles for 1000bp sequences (−500 to+500bp with respect to TSS) in differ-ent ranges of GC content are shown for genes from chr.1 of (A) Arabidopsis and (B) rice.
3

Figure S3: (A) AFE profiles in the region−2000bp to+2000bp in the vicinity of the TSS forchr1 Arabidopsis and rice. (B) The threshold values of free energy used to predict promotersin genomic DNA with GC content varying between 20 to 80% as derived from prokaryoticgenomic data are shown in black. The filled circles correspond to the minimal free energythreshold (E1) for a particular fragment and hollow circlesto the free energy (E2) in its down-stream region, for it to be assigned as a putative promoter. The average free energy values ina representative set of 1001 nt long sequences flanking the TSSs in Arabidopsis and rice areshown as red and green squares respectively. The AFE values for the+500 to+1000 down-stream regions in Arabidopsis and rice are shown as hollow squares connected by a dashedlines.
4

20 30 40 50 60 70 800
2
4
6
8
10
12
GC % of 1000nt fragment
Dm
ax v
alue
Mean
Mean+S.D
Mean+2S.D
Mean−S.D.
Rice chr1 pred (74762)Arabidopsis chr1 pred (49706)
Figure S4: Cutoffs values for score classes were determined from the mean and standard devi-ation of Dmax values from Arabidopsis and rice predictions.
Table S2: Cutoff values based on mean and standard deviation of maximum D value of Ara-bidopsis and rice predictions
GC% Range No. of seqa Dmax cutoff
Mean−S.D. Mean Mean+S.D. Mean+ 2S.D.
15-20 113 1.14 2.00 2.86 3.73
20-25 1789 1.20 2.08 2.95 3.83
25-30 9405 1.28 2.23 3.19 4.14
30-35 26073 1.30 2.34 3.37 4.41
35-40 37942 1.41 2.46 3.51 4.56
40-45 20018 1.60 2.87 4.15 5.42
45-50 11709 1.66 3.26 4.85 6.45
50-55 7195 1.94 3.66 5.39 7.11
55-60 4725 2.16 3.90 5.64 7.37
60-65 2903 1.88 3.66 5.45 7.23
65-70 1836 1.50 3.06 4.62 6.19
70-75 726 1.38 2.52 3.66 4.80
75-80 24 1.30 2.71 4.12 5.54
a: Sequences pooled from both rice and Arabidopsis predictions
5

0 0.5 1 1.5 2 2.5 30
0.5
1
1.5
2
2.5
3
AAAA
AAAC
AAAT
AACA AAGA
AATA
AATC
AATT
AGAA
ATAAATAT
ATTA
ATTT
TAAA
TAAT
TATA
TCTTTTAATTAT
TTTA
TTTT
0 0.5 1 1.50
0.5
1
1.5
%Frequency of tetramer in -500 to +500 bp of TSS
%F
requency o
f te
tram
er
in -
50 to -
20 b
p o
fT
SS
AAAA
AAAC
AAAG
AAAT
AACC ACCA
ATAA
ATAT
CAAA
CACCCCAC
CCCA
CCCC
CCGC
CCTC
CGCC
CTCC
CTCT
CTTC
TAAA
TATA
TCCA
TCCCTCCT
TCTC
TCTT
TTTT
ATTTCGCG
CGGC
GAGG
GCCGGCGC
GCGG
B
A
Figure S5: Percentage frequency of occurrence of tetramersin core promoter (−50 to−20 bp)as compared to that in the 1000nt (−500 to+500 bp) region in the vicinity of TSS for (A)Arabidopsis and (B) rice.
6

Protocol S2
Gene Ontology: The genes categorized in the Gene Ontology GOSLIM categories were down-
loaded from TAIR (http://www.arabidopsis.org) for Arabidopsis and AmiGO (The Gene On-
tology Consortium, 2000; Carbon et al., 2009) for rice. The percentage of genes that have TP
predictions in region−500 to+100bp with respect to the TSS (T Pgenes) and that don’t have any
predictions in this region (FPgenes) were determined.
7

405
517
48
89
63
238
245
154
339
164
0 2 4 6 8 10 12 14 16
GO_class(gene-no:5-9)
GO_class(gene-no:1-4)
apoptosis
carbohydrate_metabolic_process
chroma n_assembly_or_disassembly
DNA_integra on
metabolic_process
oxida on_reduc on
proteolysis
regula on_of_transcrip on
Chr 1 (TPgenes) Chr 1
358
628
204
471
270
587
145
567
242
481
250
0 5 10 15 20
GO_class(gene-no:5-9)
GO_class(gene-no:1-4)
aspar c-type_endopep dase_ac vity
ATP_binding
cataly c_ac vity
DNA_binding
kinase_ac vity
nucleic_acid_binding
protein_binding
zinc_ion_binding
RNA_binding
93
159
86
285
176
294
389
44
35
56
0 5 10 15 20
GO_class(gene-no:5-9)
GO_class(gene-no:1-4)
cytoplasm
integral_to_membrane
intracellular
membrane
nucleus
plas d
ac n_cytoskeleton
extracellular_region
A
B
C
% of genes from whole genome
% of genes from whole genome
% of genes fro m whole genome
Figure S6: Gene representation in GO categories for (A) Biological Process, (B) MolecularFunction and (C) Cellular Component. The figure shows genes from rice chr 1 for each GOcategory as a percentage of the genes in the whole genome present in that category. The redbar indicates the TP genes while the blue bar indicates all genes. The number of chr 1 genesassigned to each category are mentioned adjacent to each bar.
8

Table S3: Distribution of Arabidopsis TP and FN genes in GO categories as a percentage of thetotal genes in the genome present in that category.
Functional Category Total genes TP: % of Total FN: % of Total
Cellular Component
extracellular 359 95.265 4.178
cell wall 485 94.639 5.361
other cellular components 2406 93.724 6.359
plasma membrane 1827 93.596 6.568
nucleus 2079 93.362 6.590
plastid 969 92.570 7.946
other membranes 2528 92.366 7.872
Golgi apparatus 207 92.271 9.179
chloroplast 2635 91.879 8.008
ER 348 91.667 7.759
other cytoplasmic components 2696 91.320 8.828
other intracellular components 3415 91.274 8.726
cytosol 664 91.114 9.337
unknown cellular components 5050 91.030 8.772
mitochondria 881 90.919 9.535
ribosome 388 86.856 13.402
Molecular Function
transcription factor activity 1188 94.737 5.343
nucleic acid binding 615 94.181 5.360
other enzyme activity 2481 93.764 6.652
other binding 2579 93.748 6.361
hydrolase activity 1700 93.253 6.802
transporter activity 864 93.204 6.580
other molecular functions 998 93.010 6.710
transferase activity 1775 92.641 8.038
nucleotide binding 1443 92.322 7.550
DNA or RNA binding 1428 92.248 8.075
kinase activity 877 92.122 8.298
protein binding 1787 91.735 8.419
receptor binding or activity 118 91.473 6.977
unknown molecular functions 5108 91.443 8.342
structural molecule activity 387 87.755 12.245
Biological Process
transcription 1231 94.801 5.280
signal transduction 771 94.034 6.096
other biological processes 1396 93.625 6.734
response to stress 1529 93.525 6.867
response to abiotic or biotic stimulus 1487 93.208 7.061
developmental processes 1386 92.857 7.937
other metabolic processes 6503 92.773 7.335
other cellular processes 6949 92.488 7.541
protein metabolism 2378 92.010 7.906
transport 1364 91.862 7.478
cell organization and biogenesis 976 91.496 7.992
unknown biological processes 6499 91.429 8.340
electron transport or energy pathways 220 91.364 9.545
DNA or RNA metabolism 271 90.775 8.487
9
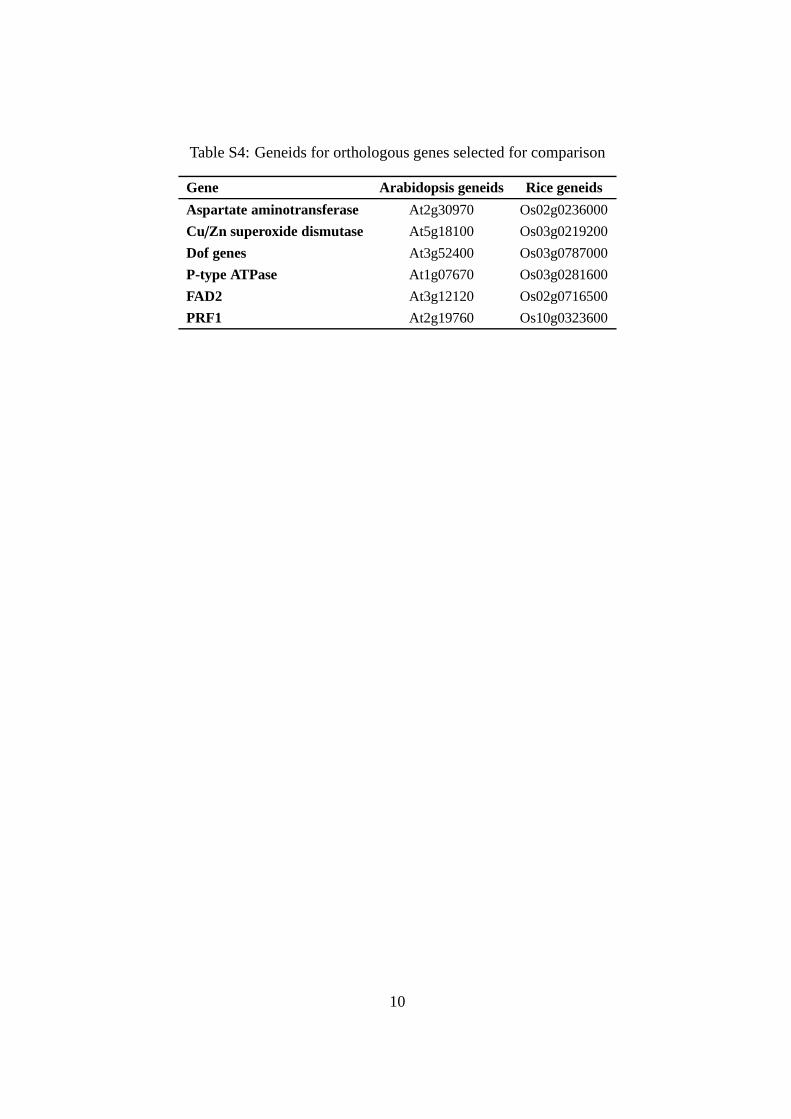
Table S4: Geneids for orthologous genes selected for comparison
Gene Arabidopsis geneids Rice geneids
Aspartate aminotransferase At2g30970 Os02g0236000
Cu/Zn superoxide dismutase At5g18100 Os03g0219200
Dof genes At3g52400 Os03g0787000
P-type ATPase At1g07670 Os03g0281600
FAD2 At3g12120 Os02g0716500
PRF1 At2g19760 Os10g0323600
10

References
Carbon, S., Ireland, A., Mungall, C. J., Shu, S., Marshall, B., Lewis, S., the AmiGO Hub, and
the Web Presence Working Group (2009). AmiGO: online accessto ontology and annotation
data.Bioinformatics, 25:288–9.
Rangannan, V. and Bansal, M. (2009). Relative stability of DNA as a generic criterion for pro-
moter prediction: whole genome annotation of microbial genomes with varying nucleotide
base composition.Mol. Biosyst., 5:1758–69.
Rangannan, V. and Bansal, M. (2010). High quality annotation of promoter regions for 913
bacterial genomes.Bioinformatics, 26:3043–50.
The Gene Ontology Consortium (2000). Gene ontology: tool for the unification of biology.
Nat. Genet., 25:25–9.
11