Information Asymmetry in Stock Trading, Economic ... - SciELO
Upload
independentCategory
view
0download
0
New Views on Strand Asymmetry in Insect MitochondrialGenomesShu-Jun Wei1,2, Min Shi1, Xue-Xin Chen1*, Michael J. Sharkey3, Cornelis van Achterberg4, Gong-Yin Ye1,
Jun-Hua He1
1 State Key Laboratory of Rice Biology and Ministry of Agriculture Key Laboratory of Molecular Biology of Crop Pathogens and Insects, Institute of Insect Sciences,
Zhejiang University, Hangzhou, China, 2 Institute of Plant and Environmental Protection, Beijing Academy of Agriculture and Forestry Sciences, Beijing, China,
3 Department of Entomology, University of Kentucky, Lexington, Kentucky, United States of America, 4 Department of Entomology, Nationaal Natuurhistorisch Museum,
Leiden, The Netherlands
Abstract
Strand asymmetry in nucleotide composition is a remarkable feature of animal mitochondrial genomes. Understanding themutation processes that shape strand asymmetry is essential for comprehensive knowledge of genome evolution,demographical population history and accurate phylogenetic inference. Previous studies found that the relativecontributions of different substitution types to strand asymmetry are associated with replication alone or both replicationand transcription. However, the relative contributions of replication and transcription to strand asymmetry remain unclear.Here we conducted a broad survey of strand asymmetry across 120 insect mitochondrial genomes, with special reference tothe correlation between the signs of skew values and replication orientation/gene direction. The results show that the signof GC skew on entire mitochondrial genomes is reversed in all species of three distantly related families of insects,Philopteridae (Phthiraptera), Aleyrodidae (Hemiptera) and Braconidae (Hymenoptera); the replication-related elements inthe A+T-rich regions of these species are inverted, confirming that reversal of strand asymmetry (GC skew) was caused byinversion of replication origin; and finally, the sign of GC skew value is associated with replication orientation but not withgene direction, while that of AT skew value varies with gene direction, replication and codon positions used in analyses.These findings show that deaminations during replication and other mutations contribute more than selection on aminoacid sequences to strand compositions of G and C, and that the replication process has a stronger affect on A and T contentthan does transcription. Our results may contribute to genome-wide studies of replication and transcription mechanisms.
Citation: Wei S-J, Shi M, Chen X-X, Sharkey MJ, van Achterberg C, et al. (2010) New Views on Strand Asymmetry in Insect Mitochondrial Genomes. PLoS ONE 5(9):e12708. doi:10.1371/journal.pone.0012708
Editor: M. Thomas P. Gilbert, Natural History Museum of Denmark, Denmark
Received October 5, 2009; Accepted August 20, 2010; Published September 15, 2010
Copyright: � 2010 Wei et al. This is an open-access article distributed under the terms of the Creative Commons Attribution License, which permits unrestricteduse, distribution, and reproduction in any medium, provided the original author and source are credited.
Funding: Funding for this study was provided jointly by the National Science Fund for Distinguished Young Scholars (30625006), the 973 Program(2006CB102005), the National Science Foundation of China (30970384, 30700063 and 30499341), the National Special Basic Research Funds (2006FY110500-3,2006FY120100), Special Fund for Agro-Scientific Research of the Public Interest (200803005-04) and Zhejiang Key Program of Agriculture (2009C12048) to XXC,and the NSF (EF-0337220) to MJS. The funders had no role in study design, data collection and analysis, decision to publish, or preparation of the manuscript.
Competing Interests: The authors have declared that no competing interests exist.
* E-mail: [email protected]
Introduction
Most animal mitochondrial genomes are about 16 Kb in size
and contain 37 genes: 13 protein-coding genes, 22 transfer RNA
genes (tRNA) and two ribosomal RNA genes (rRNA) [1].
Additionally, there is an A+T-rich region which contains essential
regulatory elements for the initiation of transcription and
replication, and is therefore referred to the control region [2].
Features of highly economized organization, lack of recombina-
tion, maternal inheritance and a high mutation rate relative to the
nuclear genome have resulted in the wide use of mitochondrial
genomes in studies of genome evolution, population genetic
structure and phylogenetic inference [3].
A remarkable feature of mitochondrial DNA is the violation of
Chargaff’s second parity rule, called strand asymmetry (strand
compositional bias) [4,5]. Strand asymmetry is usually reflected by
AT skew, as expressed by (A2T)/(A+T), and GC skew, as
expressed by (G2C)/(G+C) [6]. Positive AT skew values indicate
more A than T on the target strand, and positive GC skew values
indicate more G than C, and vice versa. In insect mitochondrial
genomes, the two DNA strands are referred to as the majority
strand (light strand in mammal mitochondrial genomes), on which
more genes are coded, and the minority strand (heavy strand in
mammal mitochondrial genomes) [7]. Additionally, there is
usually more A than T and more C than G on the majority
strand. However, in some arthropods [8,9,10,11,12], flatworms
[13], brachiopods [14], echinoderms [15] and fish [16], strand
asymmetry is reversed and there is less A than T and less C than G
on the majority strand.
Replication and transcription processes, during which one
strand is transiently in a single-stranded state and thereby exposed
to more DNA damage, has been widely considered to bias the
occurrence of mutations between the two complementary DNA
strands [9,17]. Therefore, inversion of the replication origin
located in the A+T-rich region would change the replication order
of two mitochondrial DNA strands and consequently lead to
reversal of strand asymmetry [9]. It has been demonstrated in a
crustacean [10] and in two vertebrates that replication order is
responsible for the reversal of strand asymmetry [18]. Moreover, it
has been demonstrated in experiments that rates of spontaneous
PLoS ONE | www.plosone.org 1 September 2010 | Volume 5 | Issue 9 | e12708

deamination of A and C nucleotides are higher in single-stranded
DNA than in double-stranded DNA [19,20,21]. Deamination of A
yields a base, hypoxanthine, that pairs with C rather than T, while
deamination of C yields a base, uracil, that pairs with A instead of
G [22].
In order to decipher the underlying mutation processes causing
strand asymmetry in mitochondrial genomes, much research has
gone into assessing the contributions of different substitution types
associated with replication. C deamination that promotes C:G to
T:A transitions was shown to be the major source of mutation in
vertebrate mitochondrial DNA [23,24,25]. Additionally, genes
closer to the replication origin of leading strands remain exposed
to mutation for a longer period of time during replication and this
should result in a positive correlation between strand asymmetry
and duration of time spent in the single-stranded state (DssH) [23].
However, different types of mutation were found to respond
differently to DssH gradients [25]. There is no direct evidence to
demonstrate the existence of transcription-associated mutational
asymmetry in mitochondrial genomes although this phenomenon
has been observed in enterobacteria [26,27,28] and in the nuclear
DNA of eukaryotes [29,30]. Another way to examine the mutation
spectrum in mitochondrial DNA is to directly estimate the rates of
different substitution types without discerning the processes of
replication and transcription. In fruit fly and mouse mitochondrial
DNA, transition of G:C to A:T is the dominating mutation
[31,32], but in a nematode A:T to G:C [33] is dominant,
indicating that the spectrum of mitochondrial mutations varies
across taxa [34]. In summary, the relative contributions of
replication and transcription on strand asymmetry are still unclear.
Here, we conduct a broad survey of strand asymmetry in 120
insect mitochondrial genomes, with special reference to the
correlation between skew values and gene direction/replication
orientation.
Results
Reversal of strand asymmetry in insect mitochondrialgenomes
We calculated the AT and GC skews for the entire majority
strand of 120 insect mitochondrial genomes. Most species have
positive AT skews and negative GC skews, i.e., most have a strand
asymmetry characterized by an excess of A relative to T and an
excess of C relative to G. However, ten species, i.e., two species in
Braconidae (Hymenoptera), two species in Philopteridae (Phthir-
aptera) and six species in Aleyrodidae (Hemiptera), showed
negative AT skews and positive GC skews (Figure 1), implying
that these species have strand asymmetry reversal on the entire
majority strand, with less A than T and less C than G (Figure 1,
Table S1). All species with sequenced mitochondrial genomes in
the above three families showed reversal of strand asymmetry,
suggesting that reversal of strand asymmetry may have occurred in
basal members of these taxa and be phylogeneticly associated.
A+T rich region and reversal of strand asymmetryStrand asymmetry is presumed to be predominantly due to the
commonality of deamination of A and C in single-stranded DNA
during replication and transcription, although the relative
contributions of these two processes is uncertain [17,35]. Based
Figure 1. Scatterplots of skews values calculated for whole majority strand of 120 insect mitochondrial genomes. Reversal of both ATand GC skew are found in all species with a sequenced mitochondrial genome of in the families Philopteridae (Bothriometopus macrocnemis,Campanulotes bidentatus), Aleyrodidae (Aleurochiton aceris, Aleurodicus dugesii, Bemisia tabaci, Neomaskellia andropogonis, Tetraleurodes acaciae,Trialeurodes vaporariorum) and Braconidae (Cotesia vestalis, Spathius agrili). Reversal of AT skew was found in 10 unrelated species: Onychiurusorientalis (Collembola: Onychiuridae), Bilobella aurantiaca (Collembola: Neanuridae), Heterodoxus macropus (Phthiraptera: Boopidae), Antheraea pernyi(Lepidoptera: Saturniidae), Coreana raphaelis (Lepidoptera: Lycaenidae), Manduca sexta (Lepidoptera: Sphingidae), Saturnia boisduvalii (Lepidoptera:Saturniidae), Simosyrphus grandicornis (Diptera: Syrphidae), Polystoechotes punctatus (Neuroptera: Polystoechotidae) and Abispa ephippium(Hymenoptera: Eumenidae).doi:10.1371/journal.pone.0012708.g001
Mt DNA Strand Asymmetry
PLoS ONE | www.plosone.org 2 September 2010 | Volume 5 | Issue 9 | e12708

on replication theory, inversion of replication origin located in the
A+T-rich region would lead to reversal of strand asymmetry
[9,10,18]. However, it is not easy to detect an inversion of the
A+T-rich region because this is the most variable region of the
mitochondrial genome, making it impossible to align between
distant species. Consequently, the orientation of the control region
cannot be determined by simple sequence comparisons [12]. The
direction of the A+T-rich region was determined in the 10 species
with reversal of strand asymmetry on the entire majority strand by
examination of the elements related to the regulation of
transcription and control of DNA replication [2] (Figure 2, and
Figure 2A and 2C in [36]).
For the family Braconidae, the A+T-rich region is located
between trnM and trnQ both in Cotesia vestalis and Spathius agrili. Apart
from the conserved elements in insect A+T-rich region, tandem
repetition was also found to be a characteristic of A+T-rich regions
[2]. In S. agrili, a repeat sequence is present at the 39-end upstream of
the trnQ. In both species, all elements related to the regulation of
transcription and control of DNA replication in the A+T-rich region
were present and arranged in the conserved order, except for the
G+A-rich sequence downstream of the stem and loop structure, and
an A[TA(A)]n-like stretch in S. agrili. However, all of these elements
are in opposite directions and strands compared to those of other
insects [2,37], revealing an inversion of the A+T-rich region in these
two species of Braconidae [10,36].
Amongst Aleyrodidae, all species have one A+T-rich region
except Bemisia tabaci, which has two, one small and one large.
Tandem repeat sequences were found in the A+T-rich region of
all species except for in the small one in B. tabaci [38]. All of these
repeat regions are located at the 39-end of the A+T-rich regions
except for that of Neomaskellia andropogonis. Replication and
transcription related elements in the A+T-rich regions are present
in conserved order in all species except for N. andropogonis and
Tetraleurodes acaciae. In B. tabaci, conserved elements were found in
both A+T-rich regions. In Trialeurodes vaporariorum all conserved
elements were found in each of five repeat sequences of the A+T-
rich region, indicating that these elements were repeated five
times. In T. acaciae, a long polyT stretch is present in the middle of
the A+T-rich region upstream of the tandem repeat region. These
elements are in opposite directions and strands as in two braconid
species, indicating that the mitochondrial genomes of aleyrodid
species also have an inversion of the A+T-rich region.
For the Philopteridae, there are several A+T-rich regions in
each species and the inferred stem-loop structures in each A+T-
rich region are located on the majority strand [8,39], which might
indicate reversals of the A+T-rich regions.
In summary, examination of regulatory elements in A+T-rich
regions directly supports the hypothesis that the reversal of strand
asymmetry is caused by inversion of replication origin.
Gene arrangement and reversal of strand asymmetryMitochondrial gene arrangement is highly conserved in most
animals [1], though there are exceptions. The 10 species with
reversal of strand asymmetry over the entire mitochondrial genome
were found to have accelerated gene rearrangement rates [8,38,40].
However, species that have accelerated gene rearrangement rates
do not always show a reversal of strand asymmetry, e.g., three
Nasonia species (Insecta: Hymenoptera) [41] and Thrips imaginis
(Insecta: Thysanoptera) [42]. Below, we explore the relationship
between gene arrangement and strand asymmetry in species with
reversal of strand asymmetry over the entire mitochondrial majority
strand following the traditional classification of rearrangement
events: translocation, local inversion (inverted in the local position),
shuffling and remote inversion (translocated and inverted) [43].
For these 10 species, gene rearrangement varied greatly both
among and within families (Figure 3). In Braconidae, the S. agrili
mitochondrial genome is relatively conserved in gene arrangement
with five tRNA genes rearranged. However, in C. vestalis, the
mitochondrial genes are highly rearranged with 15 tRNA and
seven protein-coding genes inverted, representing 5968 bp, more
than one third of the genome [36]. As discussed in Wei et al. [36],
it is more parsimonious to suggest that the A+T-rich region, trnI
and trnM were inverted simultaneously in Braconidae.
Extensive gene rearrangements occur in the two species of
Philopteridae. All mitochondrial genes coded on the minority
strand are inverted in both species, forming novel patterns, with all
genes coded on the majority strand except for trnQ in Campanulotes
bidentatus. Thus, A+T-rich regions are probably inverted indepen-
dent of the rearrangements of other genes in Philopteridae.
Amongst Aleyrodidae, Aleurodicus dugesii and T. vaporariorum the
tRNAs are rearranged and largely restricted to the tRNA clusters
between the A+T-rich region and nad2, nad2 and cox1. In the
mitochondrial genomes of the other four species, a large segment
containing at least cox3, trnG and nad3 is remotely inverted.
Based on our analyses of the structures of A+T-rich regions and
gene arrangement patterns, inversion of the A+T-rich region is the
only character state unique to these 10 species. In both Braconidae
and Aleyrodidae, some species show conserved mitochondrial
gene arrangement whereas others are extensively rearranged.
Thus, the inversion of the A+T-rich region may have occurred
prior to extensive gene rearrangements in, at least, some species.
In C. vestalis, Bothriometopus macrocnemis and C. bidentatus, protein-
coding genes are extensively inverted. Since replication and
transcription processes have been widely considered to bias the
occurrence of mutations between two complementary DNA
strands [9,17], the inversion of large number of protein-coding
genes should have counteracted some of the affect of reversed
replication origin on strand asymmetry.
In eukaryotes, many non-coding regions can be used for the
comparison of strand asymmetry between transcribed and
untranscribed regions [29,30]; however, most animal mitochon-
drial genomes are highly economized with few non-coding regions
to facilitate the study of transcription-associated strand asymmetry
[44]. Fortunately, in the putative ancestral insect mitochondrial
genome, four of the 13 protein-coding genes are located on the
minority strand and the total length of protein-coding genes coded
on the minority strand accounts for about 2/3 of those of the
entire mitochondrial genome. This provided us with the
opportunity to compare the strand asymmetry of genes coded on
different strands. Contrastingly, in mammal mitochondrial
genomes, which are frequently used models for studies of strand
asymmetry, only one protein-coding gene is coded on the minority
strand, and this gene has been excluded from many [23,45] but
not all [25] studies. Here, we analyzed strand asymmetry for
individual protein-coding genes in 120 insect mitochondrial
genomes with special reference to the relationship between strand
asymmetry and gene direction/genome replication orientation.
Strand asymmetry on single protein-coding genesThird codon positions are less affected by selection on amino
acids, but many third codon positions are not free of change
because of the existence of two-fold redundant codon positions.
Four-fold third codon positions, which can freely alternate
between all nucleotides without changing the resulting amino
acid, are considered to have little or no affect on selection. Here,
we calculated AT and GC skews for all codon positions, third
codon positions, two-fold redundant third codon positions, and
Mt DNA Strand Asymmetry
PLoS ONE | www.plosone.org 3 September 2010 | Volume 5 | Issue 9 | e12708

Figure 2. Predicted structural elements for A+T-rich region of 10 species with reversal of strand asymmetry.doi:10.1371/journal.pone.0012708.g002
Mt DNA Strand Asymmetry
PLoS ONE | www.plosone.org 4 September 2010 | Volume 5 | Issue 9 | e12708

four-fold redundant third codon positions for individual protein-
coding genes (Figure 4, Figure S1 and Table S1).
At all codon positions and two-fold redundant third codon
positions, most genes coded on the minority strand show positive
AT skew values, whereas most genes coded on the majority strand
show negative AT skew values. This is the case in all analyzed
insects with normal replication origins and inverted replication
origins, except for six Aleyrodidae species with inverted replication
origins. In these, some genes coded on the minority strand showed
negative AT skew values. Other exceptions are mostly restricted to
specific taxa or genes. At all codon positions, genes which coded on
the majority strand in all Japygoidea (Diplura), Isoptera, Acrididae
(Orthoptera), Archostemata (Coleoptera), Elateriformia (Coleop-
tera), and Archaeognatha showed positive AT skew values. All genes
coded on the majority strand of all Oedipodinae have negative AT
skew values. At two-fold redundant third codon positions, nad4L,
coded on the minority strand, showed negative AT skew values in
most species unlike other genes coded on the minority strand. At
third codon positions and four-fold redundant third codon positions,
most genes coded on the minority strand showed positive AT skew
values, however, genes coded on the majority strand showed either
positive or negative AT skew values (Figure 4A and Figure S1).
Most genes coded on both the majority and minority strands have
negative GC skew values in genomes with normal replication origin
(Figure 4B and Figure S1); whereas most genes coded on both the
majority and the minority strands show positive GC skew values in
the genomes of the 10 species with reversed strand asymmetry over
the entire majority strand (Figure 4C and Figure S1).
We tested the correlation between the sign of skew values on
individual genes and gene direction/genome replication orientation
using contingency table and chi-square test. The results support the
idea that the sign of AT skew on individual genes is associated with
gene direction, but the sign of GC skew on individual genes is not
associated with gene direction at third codon positions and four-fold
redundant third codon positions. The p-values support the
correlation between the sign of GC skews of individual gene and
gene direction at all codon positions and two-fold redundant third
codon positions, however, the chi-square values were lower than
that for AT skew. The sign of both AT and GC skew values are
associated with replication origin, however, the chi-square values
were lower for AT skew than for GC skew (Table 1). In conclusion,
the sign of GC skew is associated with replication orientation but not
associated with gene direction. The sign of AT skew varies with gene
direction, replication and codon position.
Discussion
Reversal of strand asymmetry in insect mitochondrialgenomes
We conducted a broad survey of strand asymmetry in 120 insects
and showed that reversal of GC skew sign over the entire majority
strand evolved three times in insects. Further we demonstrated that
Figure 3. Gene arrangement of the mitochondrial genome of 10 species with reversal of strand asymmetry. Genes are showed inboxes. Box with underscore indicates that the gene is encoded on minority strand while box without underscore indicates that the gene is encodedon majority strand. Rearranged genes compared to the ancestral mitochondrial genome arrangement were marked with colours. Green indicates thatthe gene was inverted or remotely inverted, while brown indicates that the gene was translocated or shuffled. AT indicates the A+T-rich region. A+T-rich regions of all species were inverted and marked in green. AN: Ancestral arrangement; CV: Cotesia vestalis; SA: Spathius agrili; BM: Bothriometopusmacrocnemis; CB: Campanulotes bidentatus; AA: Aleurochiton aceris; AD: Aleurodicus dugesii; BT: Bemisia tabaci; NA: Neomaskellia andropogonis; TA:Tetraleurodes acacia; TV: Trialeurodes vaporariorum.doi:10.1371/journal.pone.0012708.g003
Mt DNA Strand Asymmetry
PLoS ONE | www.plosone.org 5 September 2010 | Volume 5 | Issue 9 | e12708
Mt DNA Strand Asymmetry
PLoS ONE | www.plosone.org 6 September 2010 | Volume 5 | Issue 9 | e12708

reversal of GC skew sign over the entire majority strand appears to
be correlated phylogeneticly. This is in contrast with other animal
taxa, in which reversal of strand asymmetry is randomly distributed
[12,18], though fewer species across a larger phylogenetic space
have been sampled. More mitochondrial genomes sequences are
needed to confirm the correlation between the reversal of strand
asymmetry in mitochondrial genomes and taxonomic groups. That
reversal of strand asymmetry was caused by inversion of replication
origin was demonstrated by the examination of replication-related
elements in the A+T-rich region [12,18]. All species with reversal of
strand asymmetry over the entire mitochondrial genome were
found to have accelerated gene rearrangement rates, whereas
species with accelerated mitochondrial genomes rearrangement did
not always show reversal of strand asymmetry. This may indicate
that inversion of the A+T-rich region, leading to reversal of strand
asymmetry, is a type of gene rearrangement event unique to
mitochondrial genomes. The causes of frequent gene rearrange-
ments in mitochondrial genomes have yet to be examined [46].
Skew values of entire mitochondrial genomes andindividual genes
By comparing six protein-coding genes in 49 metazoan
mitochondrial genomes, Hassanin et al. (2005) found that absolute
values for GC are always higher than those of AT skews at all
codon positions and suggested that strand asymmetry is best
reflected in the GC skew. Skew values on individual genes for all
codon positions could help to explain this phenomenon. GC skews
of different genes coded on the same strand are all positive or
negative, whereas the AT skews of different genes coded on the
same strand are either positive or negative depending on the
direction of the gene, thus the GC skew on a strand is the
accumulative effect of all genes, and the AT skew on a strand is the
homogenized result of those AT skews with different signs on
individual genes. Our conclusion is that the criterion for detecting
reversal of strand asymmetry on mitochondrial genomes should be
the sign of GC skew values not AT skew values.
Strand asymmetry and genome replication/genetranscription
Strand asymmetry is the consequence of selection and
asymmetric patterns of mutation between the two strands
[47,48]. Two processes are widely accepted to bias mutations,
i.e., replication and transcription. It is well supported that the
deamination of A and C at exposed single-stranded regions results
in an increase of C and A content on the complementary
sequences [8,9,17].
Although some [23] but not all [25] previous analyses excluded
genes encoded on the minority strand or genes with short length,
and limited to the positions with weakest selection pressure
[23,25], the results on vertebrate mitochondrial genomes show
that different types of mutations respond differently to DssH
gradient [25], indicating that mutation patterns in mitochondrial
DNA were more complicated than previously thought.
Under the widely accepted ‘‘strand-displacement model’’ of
animal mitochondrial genome replication [49,50,51,52], the
parent majority strand is first used as a template to synthesize
the nascent minority strand, i.e., the leading strand, with the
parent minority strand left single-stranded, and consequently
experienced more A and C deaminations. Thus, the synthesized
nascent majority strand, i.e., lagging strand, using parent minority
strand as a template, has more A and C than the leading strand.
This replication theory is congruent with our observations that
more A and C are present on the entire majority strand in most
mitochondrial genomes with normal replication origin; whereas
there is less A and C on the entire majority strand in most genomes
with inverted replication origin. On a protein-coding gene
sequence, all positions should be affected by both selection and
mutation, except for four-fold third codon positions. In our study,
the sign of GC skew values on individual protein-coding genes was
almost identical among analysis for four different partitions of gene
sequences, indicating that deaminations occurring during replica-
tion, in addition to other mutations, contributed more than
selection on amino acid sequences to the strand composition of G
and C. This is congruent with the hypothesis, for mammalian
mitochondrial genomes and nuclear DNA, that one of the crucial
processes for the origin of strand asymmetry is the spontaneous
deamination of C and A in the H-strand (referred to as the
‘‘minority strand’’ in insects) during replication, with deamination
of C being twofold higher than deamination of A [22,23,24].
Under the transcription model, while RNA is being synthesized
on the transcribed strand of DNA, the nontranscribed DNA strand
remains transiently single stranded. It has been shown experimen-
Table 1. Contingency table and chi-square test for gene direction/replication orientation and sign of skew value.
Factors All codon positions Third codon position R2P3 R4P3
X2 P X2 P X2 P X2 P
RO6AT 37.8846 0.0001 170.8983 0.0001 33.5929 0.0001 332.2560 0.0001
RO6GC 1032.0096 0.0001 1046.7640 0.0001 459.8712 0.0001 351.8618 0.0001
GD6AT 784.6107 0.0001 130.7445 0.0001 263.3359 0.0001 5.2118 0.0224
GD6GC 5.6456 0.0175 0.0676 0.7948 102.6981 0.0001 0.1481 0.7004
All mitochondrial genomes used in this study were included in analysis. R2P3, two-fold redundant third codon positions; R4P3, four-fold redundant third codonpositions; P, significant value; X2, Chi-square value; RO6AT, replication orientation and sign of AT skew; RO6GC, replication orientation and sign of GC skew; GD6AT,gene direction and sign of AT skew; GD6GC, gene direction and sign of GC skew.doi:10.1371/journal.pone.0012708.t001
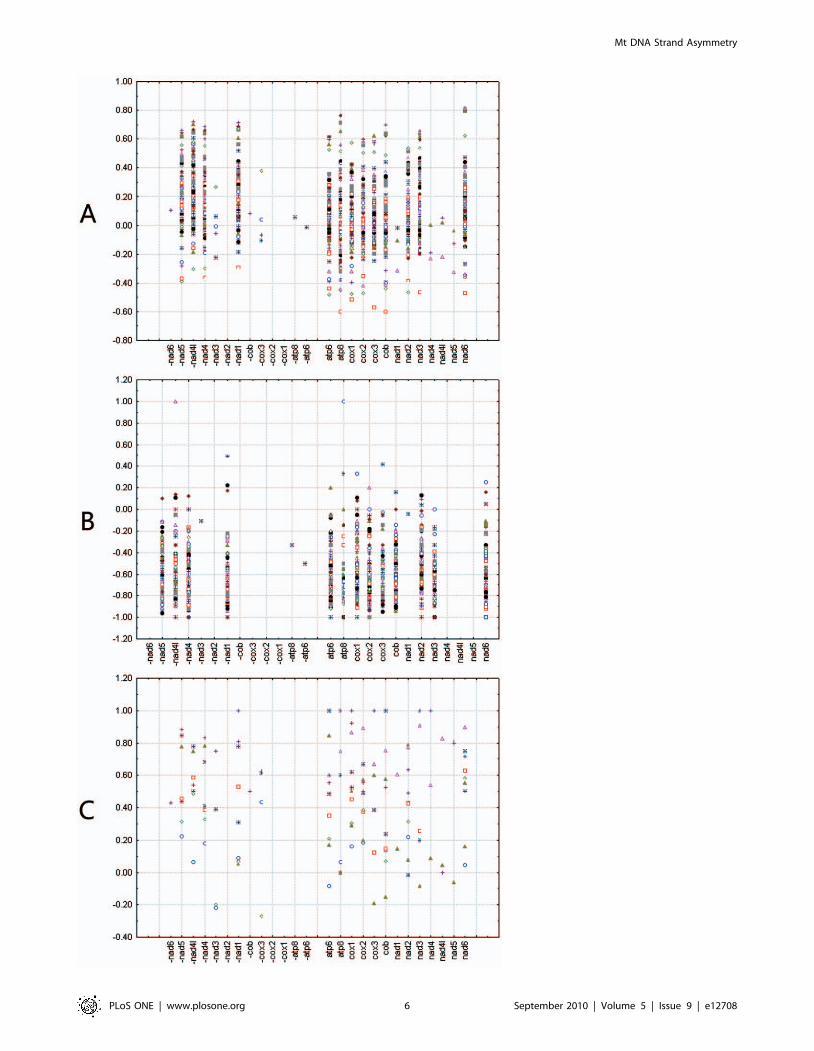
Figure 4. Scatterplots of skews values calculated for third codon positions of individual protein-coding genes. (A) Relationship of ATskew on third codon position of individual gene and gene direction in 120 insect species. (B) Relationship of GC skew on individual gene and genedirection in 110 insect mitochondrial genomes with normal replication origin. (C) Relationship of GC skew on individual gene and gene direction in 10insect mitochondrial genomes with inverted replication origin. Gene name with minus indicates that the gene is encoded on minority strand, whilewithout minus indicates on majority strand.doi:10.1371/journal.pone.0012708.g004
Mt DNA Strand Asymmetry
PLoS ONE | www.plosone.org 7 September 2010 | Volume 5 | Issue 9 | e12708

tally that transcription biases the mutational patterns between the
transcribed and nontranscribed strands [53]. In mammalian
mitochondria, both strands are transcribed as a single polycistronic
precursor RNA [54]. Therefore, Hassanin et al. (2005) suggested
that transcription can be considered to be an asymmetric process,
because the L-strand (named as ‘‘majority strand’’ in insects) is
transcribed two or three times more frequently than the H-strand
(named as ‘‘minority strand’’ in insects), and the H-strand is expected
to be more prone to deamination and transcription-coupled repair
mutations due to its single-stranded state during transcription of the
L-strand. Thus, regions on the same strand have the same tendency
of A and C content variation produced by transcription. However,
this model does not explain the variation of AT skew values
depending on gene direction examined at all codon positions.
It is likely that there is a second initiation site for H-strand
transcription in mammalian mitochondria, one that produces RNA
transcript spanning the rDNA region [55]. Furthermore, an
alternative model of transcription in Drosophila proposed that four
major blocks of genes, coded on the same strand, have unique
transcription initiation sites upstream of their coding region [56,57]
This implies that transcription of one coding region is possible [8].
We suggest that similar multiple polycistronic transcription models
may exist in insect mitochondria, under which each block of genes
coded on the same strand are transcribed in at least one transcript,
resulting in only antisense strands being transcribed. Thus, antisense
strands are paired with nascent mRNA, and sense strands are
exposed in a single-stranded state, and more A and C deamination
occurs during transcription. This leads to the increase of A and C
content on the nascent antisense strand, but hardly affects A and C
content on the nascent sense strand. At all codon positions there is
more A than T in genes coded on minority strand while more T
than A in genes coded on majority strand both with normal and
inverted replication origin, indicating that selection on amino acid
sequence, in addition to mutation during transcription, is stronger
than mutation during replication. At four-fold redundant third
codon positions, where selection has little or no effect on nucleotide
composition, AT skew values for most genes, coded on both
majority and minority strand in mitochondrial genomes with
normal replication origin, are positive. Contrastingly, those with
inverted replication origin are negative, indicating that replication
process has a stronger affect on A and T content than transcription.
In a previous study, Faith and Polleck also concluded that
transcription plays no detectable role in producing the gradients
of asymmetry at redundant sites by separately analysing the four-
fold redundant sites in nad6, the only gene transcribed on the
minority strand in vertebrate mitochondrial genome [25].
In conclusion, we hope to have demonstrated the relative
contributions of selection on amino acid sequences and mutations
during replication and transcription to strand asymmetry in
animal mitochondrial DNA. Further we show that replication
plays a key role in generating strand asymmetry, and that the
relative contribution of selection and mutation varies among
nucleotides. This, in turn, indicates that multifactorial studies on
mutation patterns are necessary to uncover mutation processes in
insect mitochondrial genomes.
Our results not only shed significant light on the mechanisms
underlying strand asymmetry, but may also contribute to genome-
wide studies of replication and transcription mechanisms.
Materials and Methods
Genome and gene acquisitionOne hundred and twenty insect mitochondrial genomes were
used for strand asymmetry analyses, belonging to 20 orders in
three classes of insects (Table S1), including all those available in
GenBank at the inception of this study and two recently sequenced
ones [36]. Sequences of whole mitochondrial genome strands and
individual protein-coding genes were downloaded from the
Mitome database [58].
Calculation of skew valuesFor each mitochondrial genome, AT and GC skews were
calculated for the majority strand, all codon positions, third codon
positions, two-fold redundant third codon positions and four-fold
redundant third codon positions of protein-coding genes. If a gene
was coded on the majority strand, the sense strand was used,
whereas if the gene was coded on the minority strand, the
antisense strand was used for calculation.
Statistical analyses were conducted in DPS version 9.50 [59].
Contingency table and Chi-square tests for categorical data were
used to estimate the association between gene direction and the
sign of AT and GC skews, as well as between the replication
orientation and the sign of AT and GC skews.
Supporting Information
Table S1 Mitochondrial genomes used in strand asymmetry
analyses and skew values calculated for the whole mitochondrial
genomes and individual protein-coding genes. All-AT, AT skew
values for all codon positions of individual genes; All-GC, GC
skew values for all codon positions of individual genes; P3-AT, AT
skew values for third codon positions of individual genes; P3-GC,
GC skew values for third codon positions of individual genes;
R2P3-AT, AT skew values for two-fold redundant third codon
positions of individual genes; R2P3-GC, GC skew values for two-
fold redundant third codon positions of individual genes; R4P3-
AT, AT skew values for four-fold redundant third codon positions
of individual genes; R2P3-GC, GC skew values for four-fold
redundant third codon positions of individual genes.
Found at: doi:10.1371/journal.pone.0012708.s001 (2.82 MB
XLS)
Figure S1 Scatterplots of AT and GC skews values calculated
for all codon positions, two-fold redundant third codon positions
and four-fold redundant third codon positions of individual
protein-coding genes in insect mitochondrial genomes. A.
Scatterplots of AT skews values calculated for all codon positions
of individual protein-coding genes in 120 insect mitochondrial
genomes. B. Scatterplots of AT skews values calculated for two-
fold redundant third codon positions of individual protein-coding
genes in 120 insect mitochondrial genomes. C. Scatterplots of AT
skews values calculated for four-fold redundant third codon
positions of individual protein-coding genes in 120 insect
mitochondrial genomes. D. Scatterplots of GC skews values
calculated for all codon positions of individual protein-coding
genes in 10 insect mitochondrial genomes with inverted replication
origin. E. Scatterplots of GC skews values calculated for all codon
positions of individual protein-coding genes in 110 insect
mitochondrial genomes with normal replication origin. F.
Scatterplots of GC skews values calculated for two-fold redundant
third codon positions of individual protein-coding genes in 10
insect mitochondrial genomes with inverted replication origin. G.
Scatterplots of GC skews values calculated for two-fold redundant
third codon positions of individual protein-coding genes in 110
insect mitochondrial genomes with normal replication origin. H.
Scatterplots of GC skews values calculated for four-fold redundant
third codon positions of individual protein-coding genes in 10
insect mitochondrial genomes with inverted replication origin. I.
Scatterplots of GC skews values calculated for four-fold redundant
Mt DNA Strand Asymmetry
PLoS ONE | www.plosone.org 8 September 2010 | Volume 5 | Issue 9 | e12708

third codon positions of individual protein-coding genes in 110
insect mitochondrial genomes with normal replication origin.
Gene name with minus indicates that the gene is coded on
minority strand, while without minus indicates on majority strand.
Found at: doi:10.1371/journal.pone.0012708.s002 (0.06 MB
PDF)
Acknowledgments
We thank Professor Qi-yi Tang (Zhejiang University) for his helping in
statistical analysis during the study. We also thank two anonymous
reviewers for their important comments on the manuscript.
Author Contributions
Conceived and designed the experiments: SJW MS XXC. Performed the
experiments: SJW MS. Analyzed the data: SJW MS. Contributed
reagents/materials/analysis tools: XXC. Wrote the paper: SJW XXC.
Intellectual contributions during the design and implementation of this
study: XXC MS. Intellectual contributions during the writing of the
manuscript: XXC MS CvA GYY JHH. Provided funds in support of this
study: XXC.
References
1. Boore JL (1999) Animal mitochondrial genomes. Nucleic Acids Research 27:
1767–1780.
2. Zhang DX, Hewitt GM (1997) Insect mitochondrial control region: a review of
its structure, evolution and usefulness in evolutionary studies. Biochemical
Systematics and Ecology 25: 99–120.
3. Ballard JWO, Whitlock MC (2004) The incomplete natural history of
mitochondria. Molecular Ecology 13: 729–744.
4. Nikolaou C, Almirantis Y (2006) Deviations from Chargaff’s second parity rule
in organellar DNA - insights into the evolution of organellar genomes. Gene 381:
34–41.
5. Albrecht-Buehler G (2006) Asymptotically increasing compliance of genomes
with Chargaff’s second parity rules through inversions and inverted transposi-
tions. Proceedings of the National Academy of Sciences of the United States of
America 103: 17828–17833.
6. Perna NT, Kocher TD (1995) Patterns of nucleotide composition at fourfold
degenerate sites of animal mitochondrial genomes. Journal of Molecular
Evolution 41: 353–358.
7. Simon C, Frati F, Beckenbach A, Crespi B, Liu H, et al. (1994) Evolution,
weighting, and phylogenetic utility of mitochondrial gene sequences and a
compilation of conserved polymerase chain reaction primers. Annals of the
Entomological Society of America 87: 651–701.
8. Cameron SL, Johnson KP, Whiting MF (2007) The mitochondrial genome of
the screamer louse Bothriometopus (Phthiraptera: Ischnocera): effects of extensive
gene rearrangements on the evolution of the genome. Journal of Molecular
Evolution 65: 589–604.
9. Hassanin A, Leger N, Deutsch J (2005) Evidence for multiple reversals of
asymmetric mutational constraints during the evolution of the mitochondrial
genome of Metazoa, and consequences for phylogenetic inferences. Systematic
Biology 54: 277–298.
10. Kilpert F, Podsiadlowski L (2006) The complete mitochondrial genome of the
common sea slater, Ligia oceanica (Crustacea, Isopoda) bears a novel gene order
and unusual control region features. BMC Genomics 7: doi:10.1186/1471-
2164-1187-1241.
11. Masta SE, Longhorn SJ, Boore JL (2009) Arachnid relationships based on
mitochondrial genomes: Asymmetric nucleotide and amino acid bias affects
phylogenetic analyses. Molecular Phylogenetics and Evolution 50: 117–128.
12. Hassanin A (2006) Phylogeny of Arthropoda inferred from mitochondrial
sequences: strategies for limiting the misleading effects of multiple changes in
pattern and rates of substitution. Molecular Phylogenetics and Evolution 38:
100–116.
13. Min XJ, Hickey DA (2007) DNA asymmetric strand bias affects the amino acid
composition of mitochondrial proteins. DNA Research 14: 201–206.
14. Helfenbein KG, Brown WM, Boore JL (2001) The complete mitochondrial
genome of the articulate brachiopod Terebratalia transversa. Molecular Biology and
Evolution 18: 1734–1744.
15. Scouras A, Smith MJ (2006) The complete mitochondrial genomes of the sea lily
Gymnocrinus richeri and the feather star Phanogenia gracilis: signature nucleotide bias
and unique nad4L gene rearrangement within crinoids. Molecular Phylogenetics
and Evolution 39: 323–334.
16. Wang XZ, Wang J, He SP, Mayden RL (2007) The complete mitochondrial
genome of the Chinese hook snout carp Opsariichthys bidens (Actinopterygii:
Cyprinifonnes) and an altemative pattem of mitogenomic evolution in
vertebrate. Gene 399: 11–19.
17. Francino MP, Ochman H (1997) Strand asymmetries in DNA evolution. Trends
in Genetics 13: 240–245.
18. Fonseca MM, Posada D, Harris DJ (2008) Inverted replication of vertebrate
mitochondria. Molecular Biology and Evolution 25: 805–808.
19. Nikolaou C, Almirantis Y (2005) A study on the correlation of nucleotide skews
and the positioning of the origin of replication: different modes of replication in
bacterial species. Nucleic Acids Research 33: 6816.
20. Sancar A, Sancar GB (1988) DNA repair enzymes. Annual Reviews in
Biochemistry 57: 29–67.
21. Frederico LA, Kunkel TA, Shaw BR (1990) A sensitive genetic assay for the
detection of cytosine deamination: determination of rate constants and the
activation energy. Biochemistry 29: 2532–2537.
22. Lindahl T (1993) Instability and decay of the primary structure of DNA. Nature
362: 709–715.
23. Reyes A, Gissi C, Pesole G, Saccone C (1998) Asymmetrical directional
mutation pressure in the mitochondrial genome of mammals. Molecular Biologyand Evolution 15: 957–966.
24. Tanaka M, Ozawa T (1994) Strand asymmetry in human mitochondrial DNA
mutations. Genomics 22: 327.
25. Faith JJ, Pollock DD (2003) Likelihood analysis of asymmetrical mutation bias
gradients in vertebrate mitochondrial genomes. Genetics 165: 735–745.
26. Francino MP, Chao L, Riley MA, Ochman H (1996) Asymmetries generated by
transcription-coupled repair in enterobacterial genes. Science 272: 107–109.
27. Beletskii A, Bhagwat AS (1998) Correlation between transcription and C to T
mutations in the non-transcribed DNA strand. Biological Chemistry Hoppe-
Seyler 379: 549–551.
28. Francino MP, Ochman H (2001) Deamination as the basis of strand-asymmetric
evolution in transcribed Escherichia coli sequences. Molecular Biology andEvolution 18: 1147–1150.
29. Green P, Ewing B, Miller W, Thomas PJ, Green ED, et al. (2003) Transcription-associated mutational asymmetry in mammalian evolution. Nature Genetics 33:
514–517.
30. Touchon M, Arneodo A, d’Aubenton-Carafa Y, Thermes C (2004) Transcrip-tion-coupled and splicing-coupled strand asymmetries in eukaryotic genomes.
Nucleic acids research 32: 4969.
31. Haag-Liautard C, Coffey N, Houle D, Lynch M, Charlesworth B, et al. (2008)
Direct estimation of the mitochondrial DNA mutation rate in Drosophila
melanogaster. PLoS Biology 6: e204.
32. Stewart JB, Freyer C, Elson JL, Wredenberg A, Cansu Z, et al. (2008) Strong
purifying selection in transmission of mammalian mitochondrial DNA. PLoSBiology 6: e10.
33. Denver DR, Morris K, Lynch M, Vassilieva LL, Thomas WK (2000) Highdirect estimate of the mutation rate in the mitochondrial genome of Caenorhabditis
elegans. Science 289: 2342–2344.
34. Montooth KL, Rand DM (2008) The spectrum of mitochondrial mutation
differs across species. PLoS Biology 6: e213.
35. Rocha EPC, Touchon M, Feil EJ (2006) Similar compositional biases are causedby very different mutational effects. Genome Research 16: 1537.
36. Wei SJ, Min S, Sharkey MJ, Achterberg C, Chen XX (2010) Comparativemitogenomics of Braconidae (Insecta: Hymenoptera) and the phylogenetic utility
of mitochondrial genomes with special reference to Holometabolous insects.
BMC Genomics 11: 371.
37. Cha SY, Yoon HJ, Lee EM, Yoon MH, Hwang JS, et al. (2007) The complete
nucleotide sequence and gene organization of the mitochondrial genome of thebumblebee, Bombus ignitus (Hymenoptera: Apidae). Gene 392: 206–220.
38. Thao M, Baumann L, Baumann P (2004) Organization of the mitochondrialgenomes of whiteflies, aphids, and psyllids (Hemiptera, Sternorrhyncha). BMC
Evolutionary Biology 4: doi:10.1186/1471-2148-1184-1125.
39. Covacin C, Shao R, Cameron S, Barker SC (2006) Extraordinary number ofgene rearrangements in the mitochondrial genomes of lice (Phthiraptera:
Insecta). Insect Molecular Biology 15: 63–68.
40. Wei SJ, Shi M, He JH, Sharkey MJ, Chen XX (2009) The complete
mitochondrial genome of Diadegma semiclausum (Hymenoptera: Ichneumonidae)indicates extensive independent evolutionary events. Genome 52: 308–319.
41. Oliveira D, Raychoudhury R, Lavrov DV, Werren JH (2008) Rapidly evolving
mitochondrial genome and directional selection in mitochondrial genes in theparasitic wasp Nasonia (Hymenoptera: Pteromalidae). Molecular Biology and
Evolution 25: 2167–2180.
42. Shao RF, Barker SC (2003) The highly rearranged mitochondrial genome of the
plague thrips, Thrips imaginis (Insecta: Thysanoptera): convergence of two novelgene boundaries and an extraordinary arrangement of rRNA genes. Molecular
Biology and Evolution 20: 362–370.
43. Dowton M, Castro LR, Campbell SL, Bargon SD, Austin AD (2003) Frequentmitochondrial gene rearrangements at the hymenopteran nad3-nad5 junction.
Journal of Molecular Evolution 56: 517–526.
44. Jermiin LS, Graur D, Crozier RH (1995) Evidence from analyses of intergenic
regions for strand-specific directional mutation pressure in metazoan mitochon-drial DNA. Molecular Biology and Evolution 12: 558–563.
Mt DNA Strand Asymmetry
PLoS ONE | www.plosone.org 9 September 2010 | Volume 5 | Issue 9 | e12708

45. Raina SZ, Faith JJ, Disotell TR, Seligmann H, Stewart CB, et al. (2005)
Evolution of base-substitution gradients in primate mitochondrial genomes.
Genome Research 15: 665–673.
46. Dowton M, Castro LR, Austin AD (2002) Mitochondrial gene rearrangements
as phylogenetic characters in the invertebrates: the examination of genome
‘morphology’. Invertebrate Systematics 16: 345–356.
47. Lobry JR (1995) Properties of a general model of DNA evolution under no-
strand-bias conditions. Journal of molecular evolution 40: 326–330.
48. Morton RA, Morton BR (2007) Separating the effects of mutation and selection
in producing DNA skew in bacterial chromosomes. BMC Genomics 8: 369.
49. Bogenhagen DF, Clayton DA (2003) The mitochondrial DNA replication
bubble has not burst. Trends in Biochemical Sciences 28: 357–360.
50. Clayton DA (1982) Replication of animal mitochondrial DNA. Cell 28:
693–705.
51. Miyako K, Irie T, Muta T, Umeda S, Kai Y, et al. (1999) 1-methyl-4-
phenylpyridinium ion (MPP+) selectively inhibits the replication of mitochon-
drial DNA. European Journal of Biochemistry 259: 412–418.
52. Brown TA, Cecconi C, Tkachuk AN, Bustamante C, Clayton DA (2005)
Replication of mitochondrial DNA occurs by strand displacement with
alternative light-strand origins, not via a strand-coupled mechanism. Genes &
Development 19: 2466–2476.
53. Beletskii A, Bhagwat AS (1996) Transcription-induced mutations: increase in C
to T mutations in the nontranscribed strand during transcription in Escherichia
coli. Proceedings of the National Academy of Sciences of the United States of
America 93: 13919–13924.
54. Taanman JW (1999) The mitochondrial genome: structure, transcription,translation and replication. Biochimica Et Biophysica Acta-Bioenergetics 1410:
103–123.55. Gaspari M, Larsson NG, Gustafsson CM (2004) The transcription machinery in
mammalian mitochondria. Biochimica Et Biophysica Acta-Bioenergetics 1659:
148–152.56. Roberti M, Polosa PL, Bruni F, Musicco C, Gadaleta MN, et al. (2003)
DmTTF, a novel mitochondrial transcription termination factor that recognisestwo sequences of Drosophila melanogaster mitochondrial DNA. Nucleic Acids
Research 31: 1597–1604.57. Roberti M, Bruni F, Polosa PL, Gadaleta MN, Cantatore P (2006) The
Drosophila termination factor DmTTF regulates in vivo mitochondrial transcrip-
tion. Nucleic Acids Research 34: 2109–2116.58. Lee YS, Oh J, Kim YU, Kim N, Yang S, et al. (2008) Mitome: dynamic and
interactive database for comparative mitochondrial genomics in metazoananimals. Nucleic Acids Research 36: D938–D942.
59. Tang QY, Feng MG (2006) DPS Data Processing System—Experimental
design, statistical analysis and data mining. Beijing: Science Press. 1100 p.
Mt DNA Strand Asymmetry
PLoS ONE | www.plosone.org 10 September 2010 | Volume 5 | Issue 9 | e12708
Copyright © 2022 FDOKUMEN