The organization and rate of evolution of wheat genomes are correlated with recombination rates...
11
The Organization and Rate of Evolution of Wheat Genomes Are Correlated With Recombination Rates Along Chromosome Arms Eduard D. Akhunov, 1 Andrew W. Goodyear, 1 Shu Geng, 1 Li-Li Qi, 2 Benjamin Echalier, 2 Bikram S. Gill, 2 Miftahudin, 3 J. Perry Gustafson, 4 Gerard Lazo, 5 Shiaoman Chao, 5 Olin D. Anderson, 5 Anna M. Linkiewicz, 1 Jorge Dubcovsky, 1 Mauricio La Rota, 6 Mark E. Sorrells, 6 Deshui Zhang, 7 Henry T. Nguyen, 3 Venugopal Kalavacharla, 8 Khwaja Hossain, 8 Shahryar F. Kianian, 8 Junhua Peng, 9 Nora L.V. Lapitan, 9 Jose L. Gonzalez-Hernandez, 10 James A. Anderson, 10 Dong-Woog Choi, 11 Timothy J. Close, 11 Muharrem Dilbirligi, 12 Kulvinder S. Gill, 12 M. Kay Walker-Simmons, 13 Camille Steber, 14 Patrick E. McGuire, 15 Calvin O. Qualset, 15 and Jan Dvorak 1,16 1 Department of Agronomy and Range Science, University of California, Davis, California 95616, USA; 2 Department of Plant Pathology, Throckmorton Hall, Kansas State University, Manhattan, Kansas 66506, USA; 3 Department of Agronomy, University of Missouri, Columbia, Missouri 65211, USA; 4 USDA-ARS, University of Missouri, Columbia, Missouri 65211, USA; 5 USDA/ARS Western Regional Research Center, Albany, California 94710, USA; 6 Department of Plant Breeding, Cornell University, Ithaca, New York 14853, USA; 7 Department of Plant and Soil Science, Texas Tech University, Lubbock, Texas 79409, USA; 8 Department of Plant Sciences, Loftsgard Hall, North Dakota State University, Fargo, North Dakota 58105–5051, USA; 9 Department of Soil and Crop Sciences, Colorado State University, Fort Collins, Colorado 80524, USA; 10 Department of Agronomy and Plant Genetics, University of Minnesota, Twin Cities, St. Paul, Minnesota 55108–6026, USA; 11 Department of Botany and Plant Science, University of California, Riverside, California 92521, USA; 12 Department of Crop and Soil Sciences, Washington State University, Pullman, Washington 99164–6420, USA; 13 USDA-ARS National Program Staff, Beltsville, Maryland 20705–5139, USA; 14 USDA-ARS, Department of Crop and Soil Sciences, Washington State University, Pullman, Washington 99164–6420, USA; 15 Genetic Resources Conservation Program, University of California, Davis, California 95616, USA. Genes detected by wheat expressed sequence tags (ESTs) were mapped into chromosome bins delineated by breakpoints of 159 overlapping deletions. These data were used to assess the organizational and evolutionary aspects of wheat genomes. Relative gene density and recombination rate increased with the relative distance of a bin from the centromere. Single-gene loci present once in the wheat genomes were found predominantly in the proximal, low-recombination regions, while multigene loci tended to be more frequent in distal, high-recombination regions. One-quarter of all gene motifs within wheat genomes were represented by two or more duplicated loci (paralogous sets). For 40 such sets, ancestral loci and loci derived from them by duplication were identified. Loci derived by duplication were most frequently located in distal, high-recombination chromosome regions whereas ancestral loci were most frequently located proximal to them. It is suggested that recombination has played a central role in the evolution of wheat genome structure and that gradients of recombination rates along chromosome arms promote more rapid rates of genome evolution in distal, high-recombination regions than in proximal, low-recombination regions. The haploid chromosome complement of hexaploid wheat, Triticum aestivum L. (2n =6x = 42), consists of three genomes, designated A, B, and D, each including seven metacentric or submetacentric chromosomes. The genomes were contrib- uted by three diploid species: T. urartu Thum. (the source of the A genome), Aegilops speltoides (Tausch) Gren. or a closely related species (the source of the B genome), and Ae. tauschii Coss. (the source of the D genome). Cytogenetic studies and comparative mapping indicated that, except for chromo- somes 4A, 5A, and 7B, the T. aestivum homoeologous chro- mosomes are to a large extent homosequential and preserve the chromosome organization of wheat ancestors (Naranjo et 16 Corresponding author. E-MAIL [email protected]; FAX (530) 752-4361. Article and publication are at http://www.genome.org/cgi/doi/10.1101/ gr.808603. Article published online before print in April 2003. Article 13:753–763 ©2003 by Cold Spring Harbor Laboratory Press ISSN 1088-9051/03 $5.00; www.genome.org Genome Research 753 www.genome.org
Transcript of The organization and rate of evolution of wheat genomes are correlated with recombination rates...

The Organization and Rate of Evolution of WheatGenomes Are Correlated With RecombinationRates Along Chromosome ArmsEduard D. Akhunov,1 Andrew W. Goodyear,1 Shu Geng,1 Li-Li Qi,2
Benjamin Echalier,2 Bikram S. Gill,2 Miftahudin,3 J. Perry Gustafson,4 Gerard Lazo,5
Shiaoman Chao,5 Olin D. Anderson,5 Anna M. Linkiewicz,1 Jorge Dubcovsky,1
Mauricio La Rota,6 Mark E. Sorrells,6 Deshui Zhang,7 Henry T. Nguyen,3
Venugopal Kalavacharla,8 Khwaja Hossain,8 Shahryar F. Kianian,8 Junhua Peng,9
Nora L.V. Lapitan,9 Jose L. Gonzalez-Hernandez,10 James A. Anderson,10
Dong-Woog Choi,11 Timothy J. Close,11 Muharrem Dilbirligi,12 Kulvinder S. Gill,12
M. Kay Walker-Simmons,13 Camille Steber,14 Patrick E. McGuire,15
Calvin O. Qualset,15 and Jan Dvorak1,16
1Department of Agronomy and Range Science, University of California, Davis, California 95616, USA; 2Department of PlantPathology, Throckmorton Hall, Kansas State University, Manhattan, Kansas 66506, USA; 3Department of Agronomy,University of Missouri, Columbia, Missouri 65211, USA; 4USDA-ARS, University of Missouri, Columbia, Missouri 65211, USA;5USDA/ARS Western Regional Research Center, Albany, California 94710, USA; 6Department of Plant Breeding, CornellUniversity, Ithaca, New York 14853, USA; 7Department of Plant and Soil Science, Texas Tech University, Lubbock, Texas79409, USA; 8Department of Plant Sciences, Loftsgard Hall, North Dakota State University, Fargo, North Dakota58105–5051, USA; 9Department of Soil and Crop Sciences, Colorado State University, Fort Collins, Colorado 80524, USA;10Department of Agronomy and Plant Genetics, University of Minnesota, Twin Cities, St. Paul, Minnesota 55108–6026,USA; 11Department of Botany and Plant Science, University of California, Riverside, California 92521, USA; 12Department ofCrop and Soil Sciences, Washington State University, Pullman, Washington 99164–6420, USA; 13USDA-ARS NationalProgram Staff, Beltsville, Maryland 20705–5139, USA; 14USDA-ARS, Department of Crop and Soil Sciences, WashingtonState University, Pullman, Washington 99164–6420, USA; 15Genetic Resources Conservation Program, University ofCalifornia, Davis, California 95616, USA.
Genes detected by wheat expressed sequence tags (ESTs) were mapped into chromosome bins delineated bybreakpoints of 159 overlapping deletions. These data were used to assess the organizational and evolutionaryaspects of wheat genomes. Relative gene density and recombination rate increased with the relative distance of abin from the centromere. Single-gene loci present once in the wheat genomes were found predominantly in theproximal, low-recombination regions, while multigene loci tended to be more frequent in distal, high-recombinationregions. One-quarter of all gene motifs within wheat genomes were represented by two or more duplicated loci(paralogous sets). For 40 such sets, ancestral loci and loci derived from them by duplication were identified.Loci derived by duplication were most frequently located in distal, high-recombination chromosome regionswhereas ancestral loci were most frequently located proximal to them. It is suggested that recombination hasplayed a central role in the evolution of wheat genome structure and that gradients of recombination ratesalong chromosome arms promote more rapid rates of genome evolution in distal, high-recombination regionsthan in proximal, low-recombination regions.
The haploid chromosome complement of hexaploid wheat,Triticum aestivum L. (2n = 6x = 42), consists of three genomes,designated A, B, and D, each including seven metacentric orsubmetacentric chromosomes. The genomes were contrib-
uted by three diploid species: T. urartu Thum. (the source ofthe A genome), Aegilops speltoides (Tausch) Gren. or a closelyrelated species (the source of the B genome), and Ae. tauschiiCoss. (the source of the D genome). Cytogenetic studies andcomparative mapping indicated that, except for chromo-somes 4A, 5A, and 7B, the T. aestivum homoeologous chro-mosomes are to a large extent homosequential and preservethe chromosome organization of wheat ancestors (Naranjo et
16Corresponding author.E-MAIL [email protected]; FAX (530) 752-4361.Article and publication are at http://www.genome.org/cgi/doi/10.1101/gr.808603. Article published online before print in April 2003.
Article
13:753–763 ©2003 by Cold Spring Harbor Laboratory Press ISSN 1088-9051/03 $5.00; www.genome.org Genome Research 753www.genome.org
al. 1987; Gale et al. 1993). Inferences on T. aestivum genomeorganization and evolution are therefore directly applicableto diploid relatives of wheat.
Comparisons of wheat linkage and deletion maps sug-gested that wheat chromosomes are subdivided into regionsdiffering in relative gene density (Gill et al. 1993; Hohmann etal. 1994; Delaney et al. 1995a,b; Mickelson-Young et al. 1995;Gill et al. 1996a,b; Sandhu and Gill 2002). This is consistentwith other lines of evidence suggesting that the chromosomesof most plants and animals are subdivided into gene-rich andgene-poor isochors (Sabeur et al. 1993; Bernardi 1996; Barakatet al. 1997; Bernardi et al. 1997; Carels et al. 1998; Bernardi1999).
Recombination rates along wheat chromosomes are alsonot uniform. Recombination in the wheat genomes occurspreferentially in distal chromosome regions (Dvorak andChen 1984; Kota et al. 1993; Lukaszewski and Curtis 1993;Hohmann et al. 1994; Delaney et al. 1995a,b; Mickelson-Young et al. 1995; Gill et al. 1996b; Dvorak et al. 1998).
These observations provoke the following questions: Isthere some underlying order in the position of genes relativeto recombination rates that has evolutionary significance forthe organization of genomes? Conventional biological wis-dom teaches that the function of biological organization of-ten becomes apparent only if examined in evolutionary con-texts. If there were an underlying order in the wheat genomes,what would be the causes and effects between evolutionaryprocesses and this order? Would these evolutionary processeshave homogeneous effects along chromosomes or would theycause chromosomes to differentiate (lose synteny) unevenlyalong their lengths?
To investigate these and other questions critical for theunderstanding of the organization and evolution of wheatgenomes, a large population of wheat expressed sequence tags(ESTs) was developed, contigs were constructed, and genesdetected by a representative cDNA clone from each contigwere mapped. To map thousands of gene loci, a collaborativemapping strategy was developed that exploited the existenceof numerous deletion lines in the nearly isogenic backgroundof ‘Chinese Spring’ wheat (Endo and Gill 1996). A total of 159homozygous terminal deletions were selected from this poolso that the breakpoints provided extensive coverage of the 21wheat chromosomes. The positions of the breakpoints of the159 deletions can be seen at http://wheat.pw.usda.gov/west/binmaps. The ten collaborating laboratories shared this set ofdeletions for the mapping of loci detected by Southern hy-bridization of cDNA clones utilizing digestion of genomicDNAs with the EcoR I restriction endonuclease.
By deletion mapping, loci were placed into bins delin-eated by the breakpoints of neighboring deletions (http://wheat.pw.usda.gov/west/binmaps and http://wheat.pw.usda.gov/cgi-bin/westsql/map_locus.cgi). The only prerequi-site for this technique to be fully successful was that restric-tion fragments hybridizing with a probe were of differentlengths at each locus detected by a probe. Since this require-ment was generally satisfied, it was often possible to map allor nearly all loci detected by a probe. This strategy thereforeallowed for a routine mapping of all genes in a genome cor-responding to a specific gene motif.
A database that was constructed is briefly described inMethods and will be fully described elsewhere. Data in thedatabase were used to assess the level of gene redundancy,variation in relative gene density along chromosome arms,distribution of specific classes of genes along chromosome
arms, and differentiation between homoeologous chromo-somes along chromosome arms. Additionally, recombinationrates per bin were derived from published wheat linkage mapsand bin sizes. Finally, these findings were used to investigaterelationships between recombination rate and the various pa-rameters of gene distribution along chromosome arms.
RESULTS
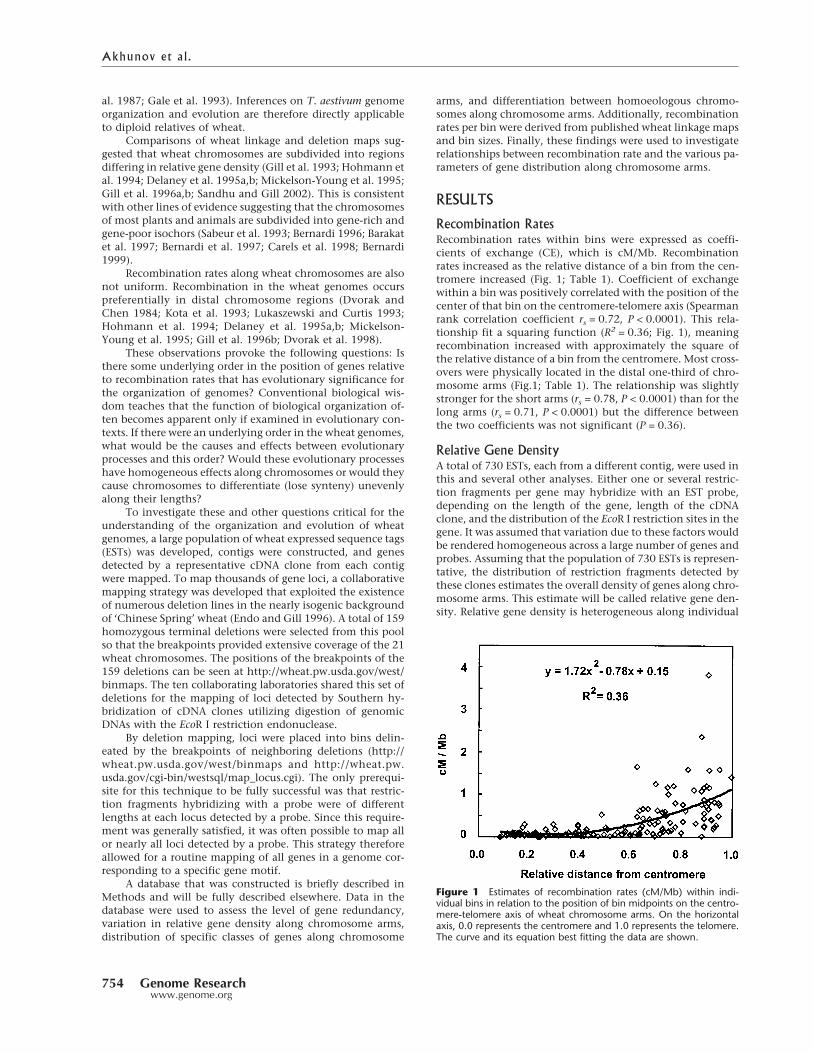
Recombination RatesRecombination rates within bins were expressed as coeffi-cients of exchange (CE), which is cM/Mb. Recombinationrates increased as the relative distance of a bin from the cen-tromere increased (Fig. 1; Table 1). Coefficient of exchangewithin a bin was positively correlated with the position of thecenter of that bin on the centromere-telomere axis (Spearmanrank correlation coefficient rs = 0.72, P < 0.0001). This rela-tionship fit a squaring function (R2 = 0.36; Fig. 1), meaningrecombination increased with approximately the square ofthe relative distance of a bin from the centromere. Most cross-overs were physically located in the distal one-third of chro-mosome arms (Fig.1; Table 1). The relationship was slightlystronger for the short arms (rs = 0.78, P < 0.0001) than for thelong arms (rs = 0.71, P < 0.0001) but the difference betweenthe two coefficients was not significant (P = 0.36).
Relative Gene DensityA total of 730 ESTs, each from a different contig, were used inthis and several other analyses. Either one or several restric-tion fragments per gene may hybridize with an EST probe,depending on the length of the gene, length of the cDNAclone, and the distribution of the EcoR I restriction sites in thegene. It was assumed that variation due to these factors wouldbe rendered homogeneous across a large number of genes andprobes. Assuming that the population of 730 ESTs is represen-tative, the distribution of restriction fragments detected bythese clones estimates the overall density of genes along chro-mosome arms. This estimate will be called relative gene den-sity. Relative gene density is heterogeneous along individual
Figure 1 Estimates of recombination rates (cM/Mb) within indi-vidual bins in relation to the position of bin midpoints on the centro-mere-telomere axis of wheat chromosome arms. On the horizontalaxis, 0.0 represents the centromere and 1.0 represents the telomere.The curve and its equation best fitting the data are shown.
Akhunov et al.
754 Genome Researchwww.genome.org
chromosome arms in wheat (Sandhu and Gill 2002), and eacharm may show its own unique pattern. The critical questionfor this study was whether or not there is an overall pattern ingene density along the centromere-telomere axis that is su-perimposed on any chromosome-specific patterns.
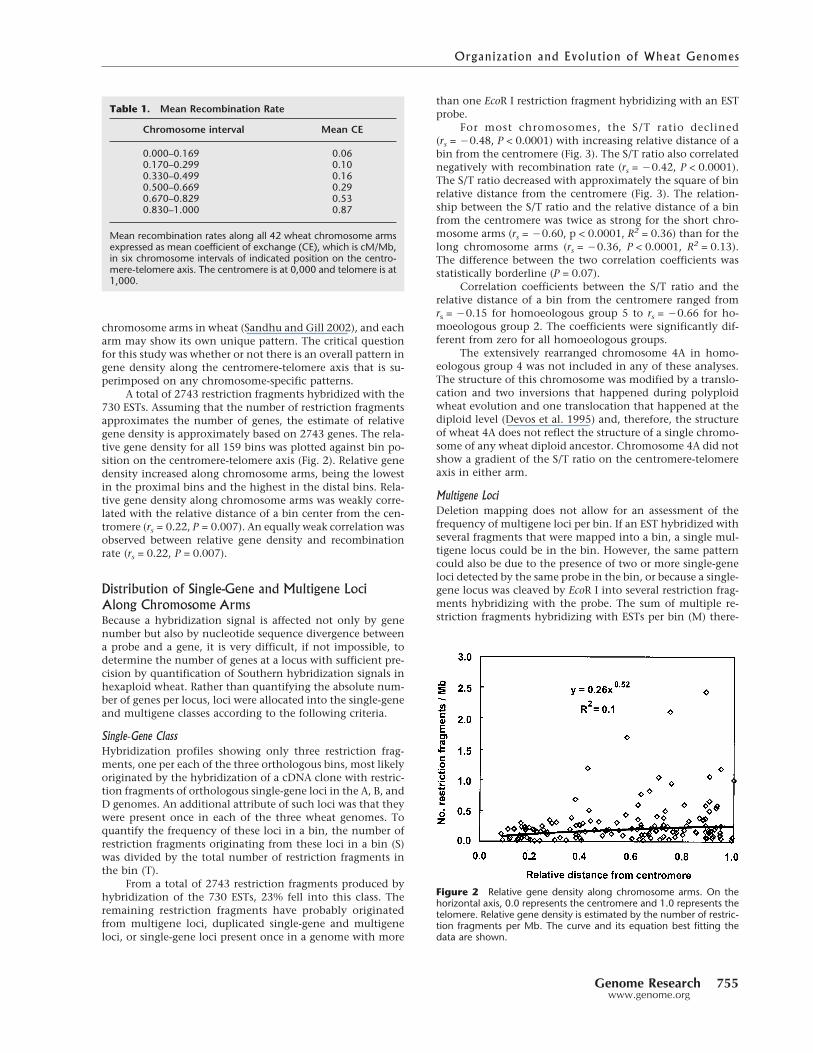
A total of 2743 restriction fragments hybridized with the730 ESTs. Assuming that the number of restriction fragmentsapproximates the number of genes, the estimate of relativegene density is approximately based on 2743 genes. The rela-tive gene density for all 159 bins was plotted against bin po-sition on the centromere-telomere axis (Fig. 2). Relative genedensity increased along chromosome arms, being the lowestin the proximal bins and the highest in the distal bins. Rela-tive gene density along chromosome arms was weakly corre-lated with the relative distance of a bin center from the cen-tromere (rs = 0.22, P = 0.007). An equally weak correlation wasobserved between relative gene density and recombinationrate (rs = 0.22, P = 0.007).
Distribution of Single-Gene and Multigene LociAlong Chromosome ArmsBecause a hybridization signal is affected not only by genenumber but also by nucleotide sequence divergence betweena probe and a gene, it is very difficult, if not impossible, todetermine the number of genes at a locus with sufficient pre-cision by quantification of Southern hybridization signals inhexaploid wheat. Rather than quantifying the absolute num-ber of genes per locus, loci were allocated into the single-geneand multigene classes according to the following criteria.
Single-Gene ClassHybridization profiles showing only three restriction frag-ments, one per each of the three orthologous bins, most likelyoriginated by the hybridization of a cDNA clone with restric-tion fragments of orthologous single-gene loci in the A, B, andD genomes. An additional attribute of such loci was that theywere present once in each of the three wheat genomes. Toquantify the frequency of these loci in a bin, the number ofrestriction fragments originating from these loci in a bin (S)was divided by the total number of restriction fragments inthe bin (T).
From a total of 2743 restriction fragments produced byhybridization of the 730 ESTs, 23% fell into this class. Theremaining restriction fragments have probably originatedfrom multigene loci, duplicated single-gene and multigeneloci, or single-gene loci present once in a genome with more
than one EcoR I restriction fragment hybridizing with an ESTprobe.
For most chromosomes, the S/T ratio declined(rs = �0.48, P < 0.0001) with increasing relative distance of abin from the centromere (Fig. 3). The S/T ratio also correlatednegatively with recombination rate (rs = �0.42, P < 0.0001).The S/T ratio decreased with approximately the square of binrelative distance from the centromere (Fig. 3). The relation-ship between the S/T ratio and the relative distance of a binfrom the centromere was twice as strong for the short chro-mosome arms (rs = �0.60, p < 0.0001, R2 = 0.36) than for thelong chromosome arms (rs = �0.36, P < 0.0001, R2 = 0.13).The difference between the two correlation coefficients wasstatistically borderline (P = 0.07).
Correlation coefficients between the S/T ratio and therelative distance of a bin from the centromere ranged fromrs = �0.15 for homoeologous group 5 to rs = �0.66 for ho-moeologous group 2. The coefficients were significantly dif-ferent from zero for all homoeologous groups.
The extensively rearranged chromosome 4A in homo-eologous group 4 was not included in any of these analyses.The structure of this chromosome was modified by a translo-cation and two inversions that happened during polyploidwheat evolution and one translocation that happened at thediploid level (Devos et al. 1995) and, therefore, the structureof wheat 4A does not reflect the structure of a single chromo-some of any wheat diploid ancestor. Chromosome 4A did notshow a gradient of the S/T ratio on the centromere-telomereaxis in either arm.
Multigene LociDeletion mapping does not allow for an assessment of thefrequency of multigene loci per bin. If an EST hybridized withseveral fragments that were mapped into a bin, a single mul-tigene locus could be in the bin. However, the same patterncould also be due to the presence of two or more single-geneloci detected by the same probe in the bin, or because a single-gene locus was cleaved by EcoR I into several restriction frag-ments hybridizing with the probe. The sum of multiple re-striction fragments hybridizing with ESTs per bin (M) there-
Figure 2 Relative gene density along chromosome arms. On thehorizontal axis, 0.0 represents the centromere and 1.0 represents thetelomere. Relative gene density is estimated by the number of restric-tion fragments per Mb. The curve and its equation best fitting thedata are shown.
Table 1. Mean Recombination Rate
Chromosome interval Mean CE
0.000–0.169 0.060.170–0.299 0.100.330–0.499 0.160.500–0.669 0.290.670–0.829 0.530.830–1.000 0.87
Mean recombination rates along all 42 wheat chromosome armsexpressed as mean coefficient of exchange (CE), which is cM/Mb,in six chromosome intervals of indicated position on the centro-mere-telomere axis. The centromere is at 0,000 and telomere is at1,000.
Organization and Evolution of Wheat Genomes
Genome Research 755www.genome.org
fore only approximates the number of genes located atmultigene loci in a bin. The M/T ratio was generally higherin the distal bins than in the proximal bins (rs = 0.29,P = 0.0004). Because the estimate of M was crude, no furthercharacterization of the distribution of multigene loci was pur-sued.
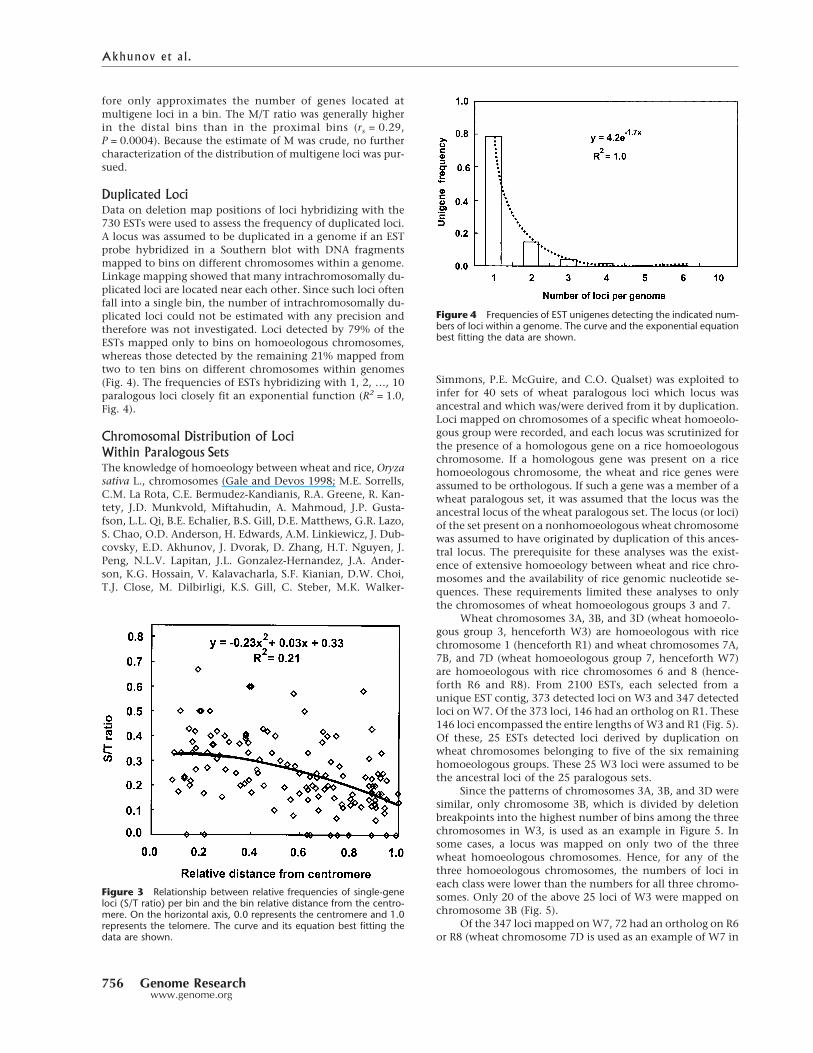
Duplicated LociData on deletion map positions of loci hybridizing with the730 ESTs were used to assess the frequency of duplicated loci.A locus was assumed to be duplicated in a genome if an ESTprobe hybridized in a Southern blot with DNA fragmentsmapped to bins on different chromosomes within a genome.Linkage mapping showed that many intrachromosomally du-plicated loci are located near each other. Since such loci oftenfall into a single bin, the number of intrachromosomally du-plicated loci could not be estimated with any precision andtherefore was not investigated. Loci detected by 79% of theESTs mapped only to bins on homoeologous chromosomes,whereas those detected by the remaining 21% mapped fromtwo to ten bins on different chromosomes within genomes(Fig. 4). The frequencies of ESTs hybridizing with 1, 2, …, 10paralogous loci closely fit an exponential function (R2 = 1.0,Fig. 4).
Chromosomal Distribution of LociWithin Paralogous SetsThe knowledge of homoeology between wheat and rice, Oryzasativa L., chromosomes (Gale and Devos 1998; M.E. Sorrells,C.M. La Rota, C.E. Bermudez-Kandianis, R.A. Greene, R. Kan-tety, J.D. Munkvold, Miftahudin, A. Mahmoud, J.P. Gusta-fson, L.L. Qi, B.E. Echalier, B.S. Gill, D.E. Matthews, G.R. Lazo,S. Chao, O.D. Anderson, H. Edwards, A.M. Linkiewicz, J. Dub-covsky, E.D. Akhunov, J. Dvorak, D. Zhang, H.T. Nguyen, J.Peng, N.L.V. Lapitan, J.L. Gonzalez-Hernandez, J.A. Ander-son, K.G. Hossain, V. Kalavacharla, S.F. Kianian, D.W. Choi,T.J. Close, M. Dilbirligi, K.S. Gill, C. Steber, M.K. Walker-
Simmons, P.E. McGuire, and C.O. Qualset) was exploited toinfer for 40 sets of wheat paralogous loci which locus wasancestral and which was/were derived from it by duplication.Loci mapped on chromosomes of a specific wheat homoeolo-gous group were recorded, and each locus was scrutinized forthe presence of a homologous gene on a rice homoeologouschromosome. If a homologous gene was present on a ricehomoeologous chromosome, the wheat and rice genes wereassumed to be orthologous. If such a gene was a member of awheat paralogous set, it was assumed that the locus was theancestral locus of the wheat paralogous set. The locus (or loci)of the set present on a nonhomoeologous wheat chromosomewas assumed to have originated by duplication of this ances-tral locus. The prerequisite for these analyses was the exist-ence of extensive homoeology between wheat and rice chro-mosomes and the availability of rice genomic nucleotide se-quences. These requirements limited these analyses to onlythe chromosomes of wheat homoeologous groups 3 and 7.
Wheat chromosomes 3A, 3B, and 3D (wheat homoeolo-gous group 3, henceforth W3) are homoeologous with ricechromosome 1 (henceforth R1) and wheat chromosomes 7A,7B, and 7D (wheat homoeologous group 7, henceforth W7)are homoeologous with rice chromosomes 6 and 8 (hence-forth R6 and R8). From 2100 ESTs, each selected from aunique EST contig, 373 detected loci on W3 and 347 detectedloci onW7. Of the 373 loci, 146 had an ortholog on R1. These146 loci encompassed the entire lengths ofW3 and R1 (Fig. 5).Of these, 25 ESTs detected loci derived by duplication onwheat chromosomes belonging to five of the six remaininghomoeologous groups. These 25 W3 loci were assumed to bethe ancestral loci of the 25 paralogous sets.
Since the patterns of chromosomes 3A, 3B, and 3D weresimilar, only chromosome 3B, which is divided by deletionbreakpoints into the highest number of bins among the threechromosomes in W3, is used as an example in Figure 5. Insome cases, a locus was mapped on only two of the threewheat homoeologous chromosomes. Hence, for any of thethree homoeologous chromosomes, the numbers of loci ineach class were lower than the numbers for all three chromo-somes. Only 20 of the above 25 loci of W3 were mapped onchromosome 3B (Fig. 5).
Of the 347 loci mapped onW7, 72 had an ortholog on R6or R8 (wheat chromosome 7D is used as an example of W7 in
Figure 3 Relationship between relative frequencies of single-geneloci (S/T ratio) per bin and the bin relative distance from the centro-mere. On the horizontal axis, 0.0 represents the centromere and 1.0represents the telomere. The curve and its equation best fitting thedata are shown.
Figure 4 Frequencies of EST unigenes detecting the indicated num-bers of loci within a genome. The curve and the exponential equationbest fitting the data are shown.
Akhunov et al.
756 Genome Researchwww.genome.org
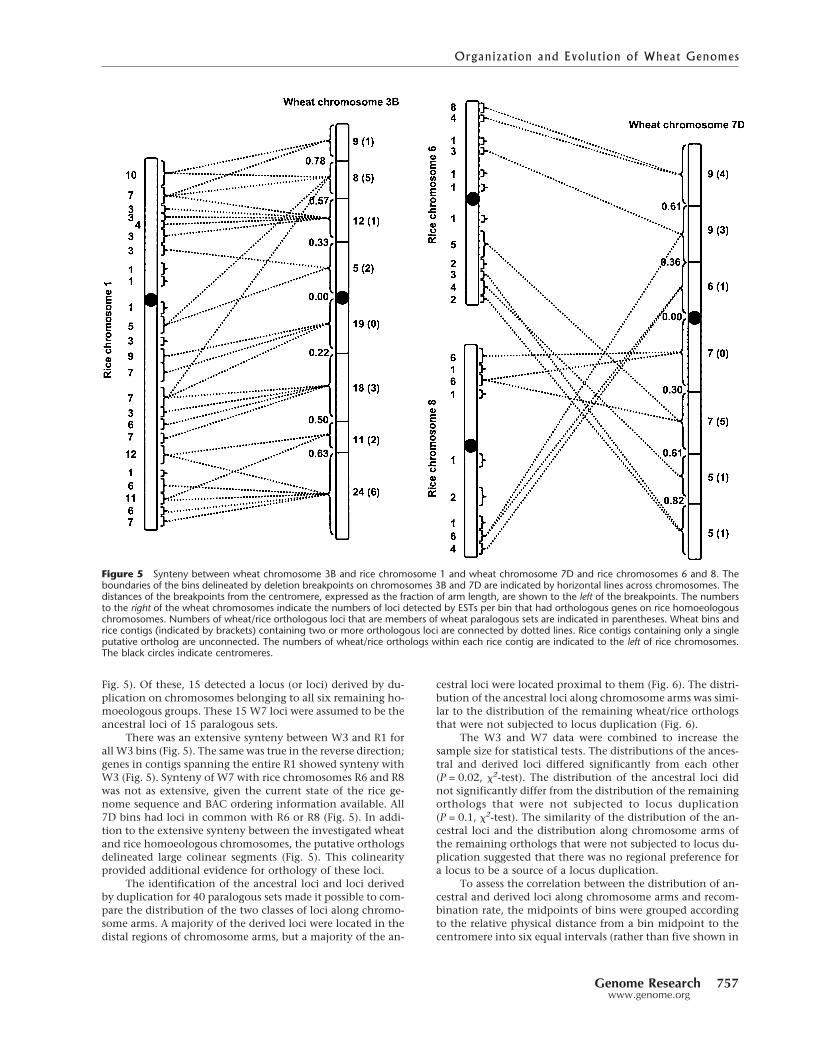
Fig. 5). Of these, 15 detected a locus (or loci) derived by du-plication on chromosomes belonging to all six remaining ho-moeologous groups. These 15 W7 loci were assumed to be theancestral loci of 15 paralogous sets.
There was an extensive synteny between W3 and R1 forall W3 bins (Fig. 5). The same was true in the reverse direction;genes in contigs spanning the entire R1 showed synteny withW3 (Fig. 5). Synteny of W7 with rice chromosomes R6 and R8was not as extensive, given the current state of the rice ge-nome sequence and BAC ordering information available. All7D bins had loci in common with R6 or R8 (Fig. 5). In addi-tion to the extensive synteny between the investigated wheatand rice homoeologous chromosomes, the putative orthologsdelineated large colinear segments (Fig. 5). This colinearityprovided additional evidence for orthology of these loci.
The identification of the ancestral loci and loci derivedby duplication for 40 paralogous sets made it possible to com-pare the distribution of the two classes of loci along chromo-some arms. A majority of the derived loci were located in thedistal regions of chromosome arms, but a majority of the an-
cestral loci were located proximal to them (Fig. 6). The distri-bution of the ancestral loci along chromosome arms was simi-lar to the distribution of the remaining wheat/rice orthologsthat were not subjected to locus duplication (Fig. 6).
The W3 and W7 data were combined to increase thesample size for statistical tests. The distributions of the ances-tral and derived loci differed significantly from each other(P = 0.02, �2-test). The distribution of the ancestral loci didnot significantly differ from the distribution of the remainingorthologs that were not subjected to locus duplication(P = 0.1, �2-test). The similarity of the distribution of the an-cestral loci and the distribution along chromosome arms ofthe remaining orthologs that were not subjected to locus du-plication suggested that there was no regional preference fora locus to be a source of a locus duplication.
To assess the correlation between the distribution of an-cestral and derived loci along chromosome arms and recom-bination rate, the midpoints of bins were grouped accordingto the relative physical distance from a bin midpoint to thecentromere into six equal intervals (rather than five shown in
Figure 5 Synteny between wheat chromosome 3B and rice chromosome 1 and wheat chromosome 7D and rice chromosomes 6 and 8. Theboundaries of the bins delineated by deletion breakpoints on chromosomes 3B and 7D are indicated by horizontal lines across chromosomes. Thedistances of the breakpoints from the centromere, expressed as the fraction of arm length, are shown to the left of the breakpoints. The numbersto the right of the wheat chromosomes indicate the numbers of loci detected by ESTs per bin that had orthologous genes on rice homoeologouschromosomes. Numbers of wheat/rice orthologous loci that are members of wheat paralogous sets are indicated in parentheses. Wheat bins andrice contigs (indicated by brackets) containing two or more orthologous loci are connected by dotted lines. Rice contigs containing only a singleputative ortholog are unconnected. The numbers of wheat/rice orthologs within each rice contig are indicated to the left of rice chromosomes.The black circles indicate centromeres.
Organization and Evolution of Wheat Genomes
Genome Research 757www.genome.org
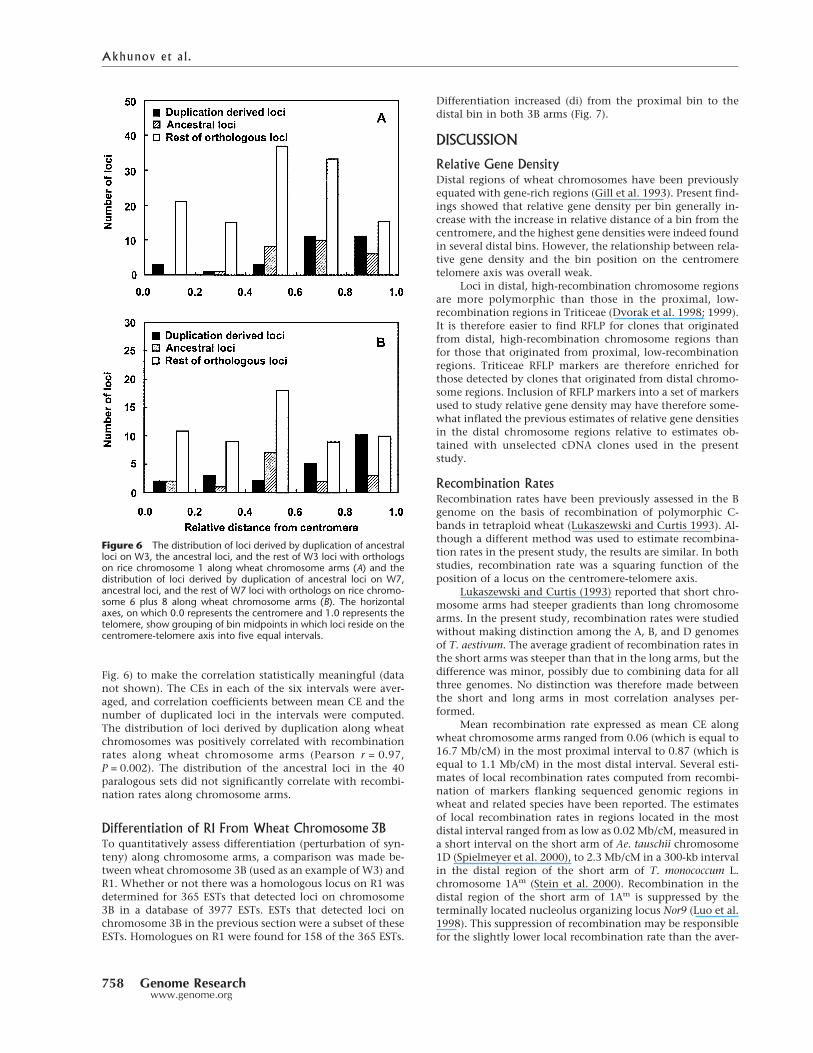
Fig. 6) to make the correlation statistically meaningful (datanot shown). The CEs in each of the six intervals were aver-aged, and correlation coefficients between mean CE and thenumber of duplicated loci in the intervals were computed.The distribution of loci derived by duplication along wheatchromosomes was positively correlated with recombinationrates along wheat chromosome arms (Pearson r = 0.97,P = 0.002). The distribution of the ancestral loci in the 40paralogous sets did not significantly correlate with recombi-nation rates along chromosome arms.
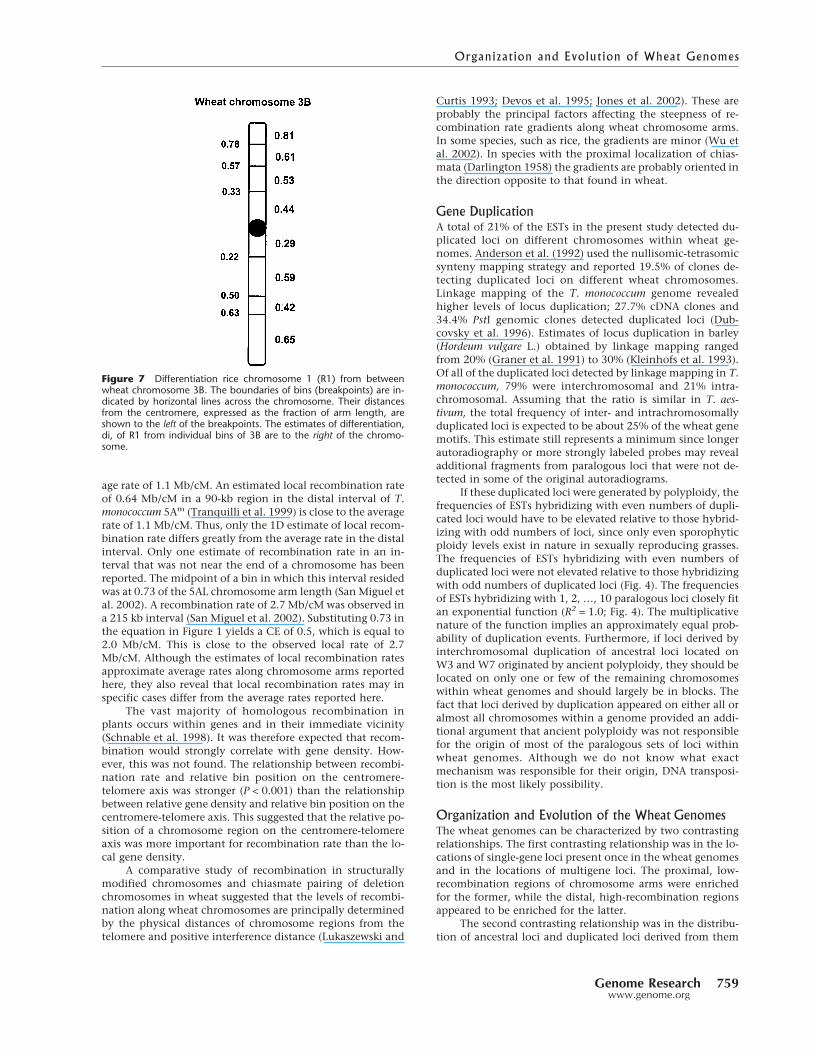
Differentiation of R1 From Wheat Chromosome 3BTo quantitatively assess differentiation (perturbation of syn-teny) along chromosome arms, a comparison was made be-tween wheat chromosome 3B (used as an example of W3) andR1. Whether or not there was a homologous locus on R1 wasdetermined for 365 ESTs that detected loci on chromosome3B in a database of 3977 ESTs. ESTs that detected loci onchromosome 3B in the previous section were a subset of theseESTs. Homologues on R1 were found for 158 of the 365 ESTs.
Differentiation increased (di) from the proximal bin to thedistal bin in both 3B arms (Fig. 7).
DISCUSSION
Relative Gene DensityDistal regions of wheat chromosomes have been previouslyequated with gene-rich regions (Gill et al. 1993). Present find-ings showed that relative gene density per bin generally in-crease with the increase in relative distance of a bin from thecentromere, and the highest gene densities were indeed foundin several distal bins. However, the relationship between rela-tive gene density and the bin position on the centromeretelomere axis was overall weak.
Loci in distal, high-recombination chromosome regionsare more polymorphic than those in the proximal, low-recombination regions in Triticeae (Dvorak et al. 1998; 1999).It is therefore easier to find RFLP for clones that originatedfrom distal, high-recombination chromosome regions thanfor those that originated from proximal, low-recombinationregions. Triticeae RFLP markers are therefore enriched forthose detected by clones that originated from distal chromo-some regions. Inclusion of RFLP markers into a set of markersused to study relative gene density may have therefore some-what inflated the previous estimates of relative gene densitiesin the distal chromosome regions relative to estimates ob-tained with unselected cDNA clones used in the presentstudy.
Recombination RatesRecombination rates have been previously assessed in the Bgenome on the basis of recombination of polymorphic C-bands in tetraploid wheat (Lukaszewski and Curtis 1993). Al-though a different method was used to estimate recombina-tion rates in the present study, the results are similar. In bothstudies, recombination rate was a squaring function of theposition of a locus on the centromere-telomere axis.
Lukaszewski and Curtis (1993) reported that short chro-mosome arms had steeper gradients than long chromosomearms. In the present study, recombination rates were studiedwithout making distinction among the A, B, and D genomesof T. aestivum. The average gradient of recombination rates inthe short arms was steeper than that in the long arms, but thedifference was minor, possibly due to combining data for allthree genomes. No distinction was therefore made betweenthe short and long arms in most correlation analyses per-formed.
Mean recombination rate expressed as mean CE alongwheat chromosome arms ranged from 0.06 (which is equal to16.7 Mb/cM) in the most proximal interval to 0.87 (which isequal to 1.1 Mb/cM) in the most distal interval. Several esti-mates of local recombination rates computed from recombi-nation of markers flanking sequenced genomic regions inwheat and related species have been reported. The estimatesof local recombination rates in regions located in the mostdistal interval ranged from as low as 0.02 Mb/cM, measured ina short interval on the short arm of Ae. tauschii chromosome1D (Spielmeyer et al. 2000), to 2.3 Mb/cM in a 300-kb intervalin the distal region of the short arm of T. monococcum L.chromosome 1Am (Stein et al. 2000). Recombination in thedistal region of the short arm of 1Am is suppressed by theterminally located nucleolus organizing locus Nor9 (Luo et al.1998). This suppression of recombination may be responsiblefor the slightly lower local recombination rate than the aver-
Figure 6 The distribution of loci derived by duplication of ancestralloci on W3, the ancestral loci, and the rest of W3 loci with orthologson rice chromosome 1 along wheat chromosome arms (A) and thedistribution of loci derived by duplication of ancestral loci on W7,ancestral loci, and the rest of W7 loci with orthologs on rice chromo-some 6 plus 8 along wheat chromosome arms (B). The horizontalaxes, on which 0.0 represents the centromere and 1.0 represents thetelomere, show grouping of bin midpoints in which loci reside on thecentromere-telomere axis into five equal intervals.
Akhunov et al.
758 Genome Researchwww.genome.org
age rate of 1.1 Mb/cM. An estimated local recombination rateof 0.64 Mb/cM in a 90-kb region in the distal interval of T.monococcum 5Am (Tranquilli et al. 1999) is close to the averagerate of 1.1 Mb/cM. Thus, only the 1D estimate of local recom-bination rate differs greatly from the average rate in the distalinterval. Only one estimate of recombination rate in an in-terval that was not near the end of a chromosome has beenreported. The midpoint of a bin in which this interval residedwas at 0.73 of the 5AL chromosome arm length (San Miguel etal. 2002). A recombination rate of 2.7 Mb/cM was observed ina 215 kb interval (San Miguel et al. 2002). Substituting 0.73 inthe equation in Figure 1 yields a CE of 0.5, which is equal to2.0 Mb/cM. This is close to the observed local rate of 2.7Mb/cM. Although the estimates of local recombination ratesapproximate average rates along chromosome arms reportedhere, they also reveal that local recombination rates may inspecific cases differ from the average rates reported here.
The vast majority of homologous recombination inplants occurs within genes and in their immediate vicinity(Schnable et al. 1998). It was therefore expected that recom-bination would strongly correlate with gene density. How-ever, this was not found. The relationship between recombi-nation rate and relative bin position on the centromere-telomere axis was stronger (P < 0.001) than the relationshipbetween relative gene density and relative bin position on thecentromere-telomere axis. This suggested that the relative po-sition of a chromosome region on the centromere-telomereaxis was more important for recombination rate than the lo-cal gene density.
A comparative study of recombination in structurallymodified chromosomes and chiasmate pairing of deletionchromosomes in wheat suggested that the levels of recombi-nation along wheat chromosomes are principally determinedby the physical distances of chromosome regions from thetelomere and positive interference distance (Lukaszewski and
Curtis 1993; Devos et al. 1995; Jones et al. 2002). These areprobably the principal factors affecting the steepness of re-combination rate gradients along wheat chromosome arms.In some species, such as rice, the gradients are minor (Wu etal. 2002). In species with the proximal localization of chias-mata (Darlington 1958) the gradients are probably oriented inthe direction opposite to that found in wheat.
Gene DuplicationA total of 21% of the ESTs in the present study detected du-plicated loci on different chromosomes within wheat ge-nomes. Anderson et al. (1992) used the nullisomic-tetrasomicsynteny mapping strategy and reported 19.5% of clones de-tecting duplicated loci on different wheat chromosomes.Linkage mapping of the T. monococcum genome revealedhigher levels of locus duplication; 27.7% cDNA clones and34.4% PstI genomic clones detected duplicated loci (Dub-covsky et al. 1996). Estimates of locus duplication in barley(Hordeum vulgare L.) obtained by linkage mapping rangedfrom 20% (Graner et al. 1991) to 30% (Kleinhofs et al. 1993).Of all of the duplicated loci detected by linkage mapping in T.monococcum, 79% were interchromosomal and 21% intra-chromosomal. Assuming that the ratio is similar in T. aes-tivum, the total frequency of inter- and intrachromosomallyduplicated loci is expected to be about 25% of the wheat genemotifs. This estimate still represents a minimum since longerautoradiography or more strongly labeled probes may revealadditional fragments from paralogous loci that were not de-tected in some of the original autoradiograms.
If these duplicated loci were generated by polyploidy, thefrequencies of ESTs hybridizing with even numbers of dupli-cated loci would have to be elevated relative to those hybrid-izing with odd numbers of loci, since only even sporophyticploidy levels exist in nature in sexually reproducing grasses.The frequencies of ESTs hybridizing with even numbers ofduplicated loci were not elevated relative to those hybridizingwith odd numbers of duplicated loci (Fig. 4). The frequenciesof ESTs hybridizing with 1, 2, …, 10 paralogous loci closely fitan exponential function (R2 = 1.0; Fig. 4). The multiplicativenature of the function implies an approximately equal prob-ability of duplication events. Furthermore, if loci derived byinterchromosomal duplication of ancestral loci located onW3 and W7 originated by ancient polyploidy, they should belocated on only one or few of the remaining chromosomeswithin wheat genomes and should largely be in blocks. Thefact that loci derived by duplication appeared on either all oralmost all chromosomes within a genome provided an addi-tional argument that ancient polyploidy was not responsiblefor the origin of most of the paralogous sets of loci withinwheat genomes. Although we do not know what exactmechanism was responsible for their origin, DNA transposi-tion is the most likely possibility.
Organization and Evolution of the Wheat GenomesThe wheat genomes can be characterized by two contrastingrelationships. The first contrasting relationship was in the lo-cations of single-gene loci present once in the wheat genomesand in the locations of multigene loci. The proximal, low-recombination regions of chromosome arms were enrichedfor the former, while the distal, high-recombination regionsappeared to be enriched for the latter.
The second contrasting relationship was in the distribu-tion of ancestral loci and duplicated loci derived from them
Figure 7 Differentiation rice chromosome 1 (R1) from betweenwheat chromosome 3B. The boundaries of bins (breakpoints) are in-dicated by horizontal lines across the chromosome. Their distancesfrom the centromere, expressed as the fraction of arm length, areshown to the left of the breakpoints. The estimates of differentiation,di, of R1 from individual bins of 3B are to the right of the chromo-some.
Organization and Evolution of Wheat Genomes
Genome Research 759www.genome.org

within paralogous sets of loci. While the majority of the an-cestral loci of the investigated paralogous sets were locatedproximally, the majority of loci derived from them by dupli-cation were located distally.
These two contrasting relationships are probably interre-lated. Loci derived by duplication should represent more thanone-quarter of all gene loci present in the wheat genomessince 25% or more of all wheat gene motifs are represented byparalogous sets, often containing more than one duplicatedlocus. For the 40 paralogous sets investigated, 61% of the lociderived by duplication were physically located in the distalone-third of chromosome arms. Therefore, a large proportionof all loci in the distal one-third of wheat chromosome armswere probably derived by gene duplication. This accumula-tion of duplicated genes in the distal chromosome regionsmust have influenced the distribution of genes along chro-mosome arms during the evolution of wheat genomes by in-creasing the absolute gene density in the high-recombinationregions but reducing the relative proportion of genes thatwere originally located in the high-recombination regions.Therefore, the density of single-gene loci present once in thewheat genomes, i.e., those that were not subjected to dupli-cation, should be the highest in the low-recombination re-gions, which was found. Single-gene loci present once in thegenome should represent the ancient component of the ge-nome. In chromosome 3B, used as an example of wheat ho-moeologous group 3, 56% and 71% of genes in the mostproximal 3B bins were shared with R1. In contrast, only 35%and 19% of genes in the most distal 3B bins were shared withR1. Although differentiation of homoeologous chromosomesalong their lengths has been investigated in only one of theseven wheat homoeologous groups, the finding is consistentwith the prediction that the proximal regions of wheat chro-mosome arms may retain the largest proportion of ancientgenes.
Recombination Rates Drive the Rates of Evolutionof the Wheat GenomesDuplicated loci that are selectively neutral are analogous toother neutral DNA insertions responsible for RFLP in wheatand related diploid species. The levels of RFLP along chromo-some arms are positively correlated with recombination ratesalong chromosome arms in wheat and its diploid relativesand other plants (Dvorak et al. 1998; 1999; Kraft et al. 1998;Stephan and Langley 1998). This relationship has been attrib-uted to indirect positive selection, i.e., hitchhiking of neutralpolymorphism with genes selected for by natural selection(Maynard Smith and Haigh 1974) or indirect negative selec-tion, i.e., background selection against mildly deleteriousgenes (Charlesworth 1994). In both scenarios, there is agreater chance for neutral polymorphism and, by extension,polymorphism for loci derived by duplication, to be elimi-nated in low-recombination regions than in high-recom-bination regions. This differential chance of survival of poly-morphism for duplicated loci in low- and high-recombinationregions may account for the accumulation of loci derived byduplication in high-recombination regions of chromosomearms.
The same pattern would also emerge if the mechanism(s)responsible for transposition of genes were to target preferen-tially chromosome regions with high levels of homologousrecombination. We are not aware of such a mechanism. Mo-bile genetic elements are known to target preferentially gene
neighborhoods (Cresse et al. 1995). In that case, however, thedistribution of loci derived by duplication would have to besimilar to that of other genes, which it is not.
Present findings suggest that the higher incidence ofgenes derived by duplication in the distal chromosome re-gions, diluting the relative proportion of ancestral loci andsingle-gene loci present only once in the wheat genomesproximally, is causally related to high recombination rates indistal chromosome regions in the wheat genomes. Assumingthat this causality is true, the distribution of these variousclasses of genes along the chromosome arms would dependon the steepness of recombination rate gradients along chro-mosome arms and would likely be in a dynamic state reflect-ing changes in recombination rate gradients along chromo-some arms during genome evolution.
Gene duplication is the principal path of new gene evo-lution (Ohno 1970; Ohta 1990; Hughes 1994; Walsh 1995;Force et al. 1999; Lynch and Force 2000). Many duplicatedgenes are inactive pseudogenes (Hollis et al. 1982; Rogers1985). Dispersed duplicated genes that retain activity have agreater chance to evolve new function than tandem dupli-cated genes because they have a reduced chance for gene con-version and are not subjected to homogenization by unequalcrossover, as are duplicated genes within a locus. Addition-ally, retroposition and other mechanisms of transposition ofgenes and gene fragments may occasionally generate novel,chimeric genes (Long and Langley 1993; Gilbert et al. 1997).The accumulation of dispersed copies of genes and gene frag-ments in the high-recombination regions may therefore in-crease the probability of the evolution of novel genes in thoseregions and faster differentiation of genomes in the high-recombination regions than in the low-recombination re-gions of chromosomes.
Correlations described earlier suggest that homoeolo-gous chromosome differentiate (lose synteny) from eachother faster in high-recombination regions than in low-recombination regions. Differentiation between homoeolo-gous chromosomes 3B and R1 is consistent with this predic-tion: synteny of wheat chromosome 3B with its rice homoeo-log declined from the proximal, low-recombination region tothe distal high-recombination region in both arms. Unfortu-nately, the current state of rice genome sequencing and ex-tensive structural differentiation between most of the wheatand rice homoeologous chromosomes allowed testing thisprediction only in a single of the seven wheat homoeologousgroups. In another analysis of the wheat EST database, differ-entiation along chromosome arms in relation to the recom-bination rate gradient was investigated between wheat ho-moeologous chromosomes of the A, B, and D genomes (E.D.Akhunov and J. Dvorak, unpubl.). The patterns were identicalto that described here between chromosome 3B and R1;wheat homoeologous chromosomes were more differentiatedfrom each other in distal, high-recombination regions than inproximal, low-recombination regions.
In Caenorhabditis elegans chromosomes I and V, geneswith lethal mutant phenotype tend to be located predomi-nantly in the low-recombination regions (Johnsen et al.2000). Assuming that essential genes represent the conserva-tive component of the genome, these findings would be con-sistent with the prediction that low-recombination regionstend to conserve ancient genes more than the high-recombination regions in genomes with steep recombinationgradients along chromosomes.
Selecting wheat for the investigation of questions posed
Akhunov et al.
760 Genome Researchwww.genome.org
in the introductory paragraphs was a fortunate choice. Wheathas steep gradients of recombination rates along chromosomearms and its large genomes have been subjected to extensivegene duplication and dispersion of duplicated genes. We wereconsequently able to observe an evolutionary process that hasnot been observed in studies of model organisms. Experimen-tal evidence was obtained for the first time indicating thatthere may be a causal relationship between heterogeneity inrecombination rates along chromosome arms and the under-lying order in the position of genes in the chromosomes. Thegradient of recombination rates on the centromere-telomereaxis appears to be the causal factor in these relationships.Furthermore, evidence was obtained indicating that the rateswith which genomes differentiate may not be constant alongchromosome arms. Variation in recombination rates alongchromosomes is again seen as the causal factor.
METHODS
ESTsFrom 1000 to 11,000 clones were randomly selected fromeach of 41 cDNA libraries comprising most organs and devel-opmental phases of the wheat plant. An average of 460 bp of80,000 cDNA clones have been sequenced and deposited inGenBank (www.ncbi.nlm.nih.gov). ESTs, their characteristics,and mapping status can be viewed at http://wheat.pw.usda.gov/NSF/progress_est.html.
DatabaseBy September, 2002, a total of 3977 ESTs selected from differ-ent EST contigs had been hybridized with DNAs of deletionlines and other mapping stocks. Mapping data and images ofautoradiograms were deposited in a database (http://wheat.pw.usda.gov/cgi-bin/westsql/map_locus.cgi). Thenumbers of ESTs in the database were steadily increasing dur-ing the studies reported here, and, therefore, the variousanalyses reported here had to utilize different numbers ofESTs. For analyses, the database was queried to obtain thenumber of restriction fragments with which an EST probehybridized and chromosome and bin location for eachmapped fragment. Links from each EST in the database toGenBank were used to obtain nucleotide sequences whenneeded.
Deletion MappingA total of 101 T. aestivum “Chinese Spring” deletion stocks,comprising 159 deletions, and 24 ditelosomic stocks and 21nullisomic-tetrasomic stocks were used in EST mapping. Thebreakpoint of each deletion was expressed as a fraction of thechromosome arm length. Overlapping deletions delimited aphysical region on a chromosome arm called a bin. The mostproximal bin in each arm was delimited by the most proximalbreakpoint and by the centromeric breakpoint in the relevantChinese Spring ditelosome. A total of 159 bins were delimitedby the breakpoints in the 21 wheat chromosomes. DNA wasisolated from plants of the deletion stocks, nulli-tetrasomicstocks, and ditelosomic stocks, digested with EcoR I and frac-tionated in 1% agarose gels. DNA was depurinated with 0.25M HCl for 25 min, and rinsed twice in distilled water followedby neutralization in 0.4 M NaOH for 20 min. Denatured DNAwas transferred to Hybond N+ nylon membranes (Amersham)by capillary transfer in 0.4 M NaOH overnight. The mem-branes were then rinsed for 5 min in 2� SSC and immediatelyprehybridized in either 6� SSPE (1� SSPE is 0.15 M NaCl,0.01 M NaH2PO4, and 0.001EDTA), 5� Denhart’s solution,0.5% sodium dodecyl sulfate (SDS), 50 µg/mL sheared, single-stranded salmon sperm DNA for at least 6 h, or 2.5� SSPE, 1%
SDS, 0.01% sodium pyrophosphate, and 0.1% polyanethol-sulphonic acid for at least 30 min. cDNA inserts were poly-merase chain reaction (PCR)-amplified usingM13 Reverse andUniversal primers. The products were sequenced and com-pared with the nucleotide sequence of each EST in the Gen-Bank database to verify the authenticity of the PCR products.The products were labeled with 32P using the random primermethod. Hybridization was performed at 65°C overnight ineither 6� SSPE, 5� Denhart’s solution, 0.5% SDS or 7% SDS,0.29M Na2HPO4, 0.22M NaH2PO4, and 5mM EDTA. Themembranes were washed in 2� SSC or SSPE and 0.5% SDS for30 min at 65°C, 1� SSPE or SSC and 0.5% SDS for 30 min at65°C, and 0.5� SSPE or SSC and 0.5% SDS for 10 to 30 min.at 65°C. The profiles of ESTs mapped into a bin were system-atically compared with each other and duplicates were elimi-nated.
Recombination RateRecombination rates were expressed as CEs (Lindsley andSandler 1977). To compute CE for each bin, the genetic dis-tances in cM between loci and their locations in a bin weredetermined from published wheat linkage and deletion maps(Devos et al. 1992; 1993; Devos and Gale 1993; Gill et al.1993; 1996a,b; Hohmann et al. 1994; Delaney et al. 1995a,b;Mickelson-Young et al. 1995; Nelson et al. 1995a,b; Van Dey-nze et al. 1995; Dubcovsky et al. 1996; Jia et al. 1996; Marinoet al. 1996). The physical distance in terms of the fraction ofchromosome arm length between the centers of bins flankinga specific bin (http://wheat.pw.usda.gov/west/binmaps) wasconverted to megabase pairs as described earlier (Dvorak et al.1998). For the most proximal bins, the physical distance wasfrom the centromere to the center of the flanking bin. For themost distal bin, the physical distance was from the telomereto the center of the flanking bin. The estimate of genetic dis-tance in cM was divided by the estimate of the length in Mb.The resulting fraction, cM/Mb, is defined as the CE within abin.
Identification of Wheat/Rice Orthologous GenesThe locations of the ancestral loci and those derived by du-plication were determined for 40 paralogous sets. For all sets,the ancestral locus was on wheat homoeologous group 3 (W3)or homoeologous group 7 (W7). For W7, the distal portion ofthe short arm of chromosome 7B was not considered sincethat region was involved in a translocation with chromosome4A, and does not represent the chromosome structure ofwheat diploid ancestors. The following strategy was used toidentify paralogous sets of loci with ancestral loci on W3 orW7. The hybridization patterns of ESTs mapped on W3 andW7 were examined. ESTs producing from one to three frag-ments for each of the orthologous bins of W3 or W7 wereselected. The list of ordered BAC/PAC clones representing thefull genomic sequence of rice chromosomes 1, 6, and 8 wasdownloaded from TIGR (http://www.tigr.org). The nucleotidesequences of those clones were retrieved from the GenBankdatabase (http://www.ncbi.nlm.nih.gov) and used for theBLASTN (Altschul et al. 1990) search against wheat ESTnucleotide sequences. The nucleotide sequences of the ESTswere used for BLASTN search with a threshold probability ofe�10 against the genomic sequence of rice homoeologs. Thepresence of a homologous sequence on the rice homoeologsuggested the existence of putative orthologous genes on ho-moeologs.
Correlation Between the Distribution of AncestralLoci, Derived Loci, and Recombination RatesBins were grouped according to the distances of their mid-points from the centromere into six equal intervals alongchromosome arms. Because means of the intervals were used
Organization and Evolution of Wheat Genomes
Genome Research 761www.genome.org
as variables in the correlation analysis, six rather than fiveintervals were used to make the correlation analysis statisti-cally valid. The CEs in each of the six intervals were averagedand Pearson correlation coefficients were computed for themean CE and the number of duplicated loci in the interval.
Differentiation of R1 From Wheat Chromosome 3BFrom a population of 3977 ESTs present in the database byAugust, 2002, 365 ESTs detected loci on chromosome 3B.Nucleotide sequences of these 365 ESTs were used for aBLASTN search against the genomic sequence of rice chromo-some 1 using NCBI BLASTN 2.0. Sequences having e-valueslower than e�10 and alignment length greater than 100 bpwere considered homologous. The differentiation of R1 from3B in the ith 3B bin (di) was computed as follows:
di = 1 −ni
Ni,
where ni is the number of EST clones that hybridized with lociin the ith 3B bin and had a homologs on R1 and Ni is the totalnumber of EST clones that hybridized with loci in the ith 3Bbin.
Curve FittingThe following types of functions were used to fit curves todata: linear, logarithmic, polynomial, exponential, andpower. The fit showing the largest R2 was chosen as the best fitfor each set of data.
ACKNOWLEDGMENTSThis publication is based upon work supported by the Na-tional Science Foundation under Cooperative Agreement No.DBI-9975989.
The publication costs of this article were defrayed in partby payment of page charges. This article must therefore behereby marked “advertisement” in accordance with 18 USCsection 1734 solely to indicate this fact.
REFERENCESAltschul, S.F., Gish, W., Miller, W., Myers, E.W., and Lipman, D.J.
1990. Basic local alignment search tool. J. Mol. Biol.215: 403–410.
Anderson, J.A., Ogihara, Y., Sorrells, M.E., and Tanksley, S.D. 1992.Development of a chromosomal arm map for wheat based onRFLP markers. Theor. Appl. Genet. 83: 1035–1043.
Barakat, A., Carels, N., and Bernardi, G. 1997. The distribution ofgenes in the genomes of Gramineae. Proc. Natl. Acad. Sci.94: 6857–6861.
Bernardi, G. 1996. The organization of the human genome.Chemicke Listy 90: 549–553.
Bernardi, G., Hughes, S., and Mouchiroud, D. 1997.The majorcompositional transitions in the vertebrate genome. J. Mol. Evol.44: S44–S51.
Bernardi, G. 1999. The genome organization in plants. In Plant andAnimal Genome VII (ed. S.R. Heller), p. 131. Scherago Intl. Inc.San Diego, CA. abstract, www.intl-pag.org
Carels, N., Hatey, P., Jabbari, K., and Bernardi, G. 1998.Compositional properties of homologous coding sequences fromplants. J. Mol. Evol. 46: 45–53.
Charlesworth, B. 1994. The effect of background selection againstdeleterious mutations on weakly selected, linked variants. Genet.Res. Cambridge 63: 213–227.
Cresse, A.D., Hulbert, S.H., Brown, W.E., Lucas, J.R., and Bennetzen,J.L. 1995. µ1-related transposable elements of maizepreferentially inserted into low copy number DNA. Genetics140: 315–324.
Darlington, C.D. 1958. Evolution of genetic systems. Oliver and Boyd,Edinburgh, Scotland.
Delaney, D., Nasuda, E.S., Endo, T.R., Gill, B.S., and Hulbert, S.H.1995a. Cytologically-based physical maps of the group-2chromosomes of wheat. Theor. Appl. Genet. 91: 568–573.
Delaney, D., Nasuda, E.S., Endo, T.R., Gill, B.S., and Hulbert, S.H.
1995b. Cytologically-based physical maps of the group 3chromosomes of wheat. Theor. Appl. Genet. 91: 780–782.
Devos, K.M., Atkinson, M.D., Chinoy, C.N., Liu, C., and Gale, M.D.1992. RFLP based genetic maps of the homoeologous group 3chromosomes of wheat and rye. Theor. Appl. Genet. 83: 931–939.
Devos, K.M. and Gale, M.D. 1993. Extended genetic maps of thehomoeologous group 3 chromosomes of wheat, rye, and barley.Theor. Appl. Genet. 85: 649–652.
Devos, K.M., Milan, T., and Gale, M.D. 1993. Comparative RFLPmaps of the homoeologous group-2 chromosomes of wheat, rye,and barley. Theor. Appl. Genet. 85: 784–792.
Devos, K.M., Dubcovsky, J., Dvorak, J., Chinoy, C.N., and Gale, M.D.1995. Structural evolution of wheat chromosomes 4A, 5A, and7B and its impact on recombination. Theor. Appl. Genet.91: 282–288.
Dubcovsky, J., Luo, M.C., Zhong, G.Y., Bransteitter, R., Desai, A.,Kilian, A., Kleinhofs, A., and Dvorak. J. 1996. Genetic map ofdiploid wheat, Triticum monococcum L., and its comparison withmaps of Hordeum vulgare L. Genetics 143: 983–999.
Dvorak, J. and Chen, K.-C. 1984. Distribution of nonstructuralvariation between wheat cultivars along chromosome arm 6Bp:Evidence from the linkage map and physical map of the arm.Genetics 106: 325–333.
Dvorak, J., Luo, M.-C., and Yang, Z.-L. 1998. Restriction fragmentlength polymorphism and divergence in the genomic regions ofhigh and low recombination in self-fertilizing andcross-fertilizing Aegilops species. Genetics 148: 423–434.
Dvorak, J., Yang, Z.-L., and Luo, M.-C. 1999. Genetic variation,recombination and divergence along chromosomes. In Plant andAnimal Genome VII (ed. S.R. Heller) p. 126. Scherago Intl. Inc.San Diego, CA. abstract, www.intl-pag.org
Endo, T.R. and Gill, B.S. 1996. The deletion stocks of commonwheat. J. Hered. 87: 295–307.
Force, A., Lynch, M., Pickett, F.B., Amores, A., Yan, Y.L., andPostlethwait, J. 1999. Preservation of duplicate genes bycomplementary, degenerative mutations. Genetics151: 1531–1545.
Gale, M.D., Atkinson, M.D., Chinoy, C.N., Harcourt, R.L., Jia, J., Li,Q.Y., and Devos, K.M. 1993. Genetic maps of hexaploid wheat.In 8th International Genetic Symposium (eds. Z.S. Li and Z.Y. Xin),pp. 29–40. China Agricultural Scientech Press, Beijing, China.
Gale, M.D. and Devos. K.M. 1998. Comparative genetics in thegrasses. Proc. Natl. Acad. Sci. 95: 1971–1974.
Gilbert, W., deSouza, S.J., and Long, M.Y. 1997. Origin of genes.Proc. Natl. Acad. Sci. 94: 7698–7703.
Gill, K.S., Gill, B.S., and Endo, T.R. 1993. A chromosomeregion-specific mapping strategy reveals gene-rich telomeric endsin wheat. Chromosoma 102: 374–381.
Gill, K.S., Gill, B.S., Endo, T.R., and Boyko, E.V. 1996a. Identificationand high-density mapping of gene-rich regions in chromosomegroup 5 of wheat. Genetics 143: 1001–1012.
Gill, K.S., Gill, B.S., Endo, T.R., and Taylor, T. 1996b. Identificationand high-density mapping of gene rich regions in chromosomegroup 1 of wheat. Genetics 144: 1883–1891.
Graner, A., Jahoor, A., Schondelmeier, J., Siedler, H., Pillen, K.,Fischbeck, G., Wenzel, G., and Herrman, R.G. 1991.Construction of an RFLP map of barley. Theor. Appl. Genet.83: 250–256.
Hohmann, U., Endo, T.R., Gill, K.S., and Gill, B.S. 1994. Comparisonof genetic and physical maps of group 7 chromosomes fromTriticum aestivum L. Mol. Gen. Genet. 245: 644–653.
Hollis, G.F., Hieter, P.A., McBride, O.W., Swan, D., and Leder, P.1982. Processed genes: A dispersed human immunoglobulin genebearing evidence of RNA-type processing. Nature 296: 321–325.
Hughes, A.L. 1994. The evolution of functionally novel proteinsafter gene duplication. Proc. Royal Soc. Lond. Ser. B. Biol. Sci.256: 119–124.
Jia, J., Devos, K.M., Chao, S., Miller, T.E., Reader, S.M., and Gale,M.D. 1996. RFLP-based maps of the homoeologous group-6chromosomes of wheat and their application in the tagging ofPm12, a powdery mildew resistance gene transferred fromAegilops speltoides to wheat. Theor. Appl. Genet. 92: 559–565.
Johnsen, R.C., Jones, S.J.M., and Rose, A.M. 2000. Mutationalaccessibility of essential genes on chromosome I (left) inCaenorhabditis elegans. Mol. Gen. Genet. 263: 239–252.
Jones, L.E., Rybka, K., and Lukaszewski, A.J. 2002. The effect of adeficiency and a deletion on recombination in chromosome 1BLin wheat. Theor. Appl. Genet. 104: 1204–1208.
Kleinhofs, A., Kilian, A., Maroof, M.A.S., Biyashev, R.M., Hayes, P.,Chen, F.Q., Lapitan, N., Fenwick, A., Blake, T.K., Kanazin, V., et
Akhunov et al.
762 Genome Researchwww.genome.org
al. 1993. A molecular, isozyme and morphological map of thebarley (Hordeum vulgare) genome. Theor. Appl. Genet.86: 705–712.
Kota, R.S., Gill, K.S., Gill, B.S., and Endo, T.R. 1993. Acytogenetically based physical map of chromosome-1B incommon wheat. Genome 36: 548–554.
Kraft, T., Sall, T., Magnusson Rading, I., Nilsson, N.O., and Hallden,C. 1998. Positive correlation between recombination rates andlevels of genetic variation in natural populations of sea beet (Betavulgaris subsp. maritima). Genetics 150: 1239–1244.
Lindsley, D.L. and Sandler, L. 1977. The genetic analysis of meiosisin female Drosophila melanogaster. Phil. Transact. Royal Soc. Lond.B 277: 295–312.
Long, M.Y. and Langley, C.H. 1993. Natural selection and the originof Jingwei, a chimeric processed functional gene in Drosophila.Science 260: 91–95.
Lukaszewski, A.J. and Curtis, C.A. 1993. Physical distribution ofrecombination in B-genome chromosomes of tetraploid wheat.Theor. Appl. Genet. 84: 121–127.
Luo, M.C., Yang, Z.L., and Dvorak, J. 1998. Position effects ofribosomal RNA multigene loci on meiotic recombination inwheat. Genetics 149: 1105–1113.
Lynch, M. and Force, A. 2000. The probability of duplicate genepreservation by subfunctionalization. Genetics 154: 459–473.
Marino, C.L., Nelson, Y.H., Lu, Y.H., Sorrells, M.E., Leroy, P., Tuleen,N.A., Lopes, C.R., and Hart, G.E. 1996. Molecular genetic mapsof the group 6 chromosomes of hexaploid wheat (Triticumaestivum L. mend. Thell.). Genome 39: 359–366.
Maynard Smith, J. and Haigh, J. 1974. The hitchhiking effect of afavorable gene. Genetic Res. Cambridge 23: 23–35.
Mickelson-Young, L., Endo, T.R., and Gill. B.S. 1995. A cytogeneticladder-map of the wheat homoeologous group-4 chromosomes.Theor. Appl. Genet. 90: 1007–1011.
Naranjo, T., Roca, A., Goicoechea, P.G., and Giraldez, R. 1987. Armhomoeology of wheat and rye chromosomes. Genome29: 873–882.
Nelson, J.C., VanDeynze, A.E., Autrique, E., Sorrells, M.E., Lu, Y.H.,Merlino, M., Atkinson, M., and Leroy, P. 1995a. Molecularmapping of wheat. Homoeologus group 2. Genome 38: 525–533.
Nelson, J.C., Vandeynze, A.E., Autrique, E., Sorrells, M.E., Lu, Y.H.,Negre, S., Bernard, M., and Leroy, P. 1995b. Molecular mappingof wheat. Homoeologous group 3. Genome 38: 525–533.
Ohno, S. 1970. Evolution by gene duplication. Springer, Berlin,Germany.
Ohta, T. 1990. How gene families evolve. Theor. Pop. Biol.37: 213–219.
Rogers, J.H. 1985. The origin and evolution retroposons. Intl. Rev.Cyto. 93: 187–279.
Sabeur, G., Macaya, G., Kadi, F., and Bernardi, G. 1993. The isochorepatterns of mammalian genomes and their phylogeneticimplications. J. Mol. Evol. 37: 93–108.
Sandhu, D. and Gill, K.S. 2002. Gene-containing regions of wheat
and the other grass genomes. Plant Physiol. 128: 803–811.San Miguel, P.J., Ramakrishna, W., Bennetzen, J.L., Busso, C.S., and
Dubcovsky, J. 2002. Transposable elements, genes andrecombination in a 215-kb contig from wheat chromosome5Am. Funct. Integr. Genomics 2: 70–80.
Schnable, P.S., Hsia, A.P., and Nikolau. B.J. 1998. Geneticrecombination in plants. Curr. Opin. Plant Biol. 1: 123–129.
Spielmeyer, W., Moullet, O., Laroche, A., and Lagudah, E.S. 2000.Highly recombinogenic regions at seed storage protein loci onchromosome 1DS of Aegilops tauschii, the D-genome donor ofwheat. Genetics 155: 361–367.
Stein, N., Feuillet, C., Wicker, T., Schlagenhauf, E., and Keller, B.2000. Subgenome chromosome walking in wheat: A 450-kbphysical contig in Triticum monococcum L. spans the Lr10resistance locus in hexaploid wheat (Triticum aestivum L.). Proc.Natl. Acad. Sci. 97: 13436–13441.
Stephan, W. and Langley, C.H. 1998. DNA polymorphism inLycopersicon and crossing-over per physical length. Genetics150: 1585–1593.
Tranquilli, G., Lijavetzky, D., Muzzi, G., and Dubcovsky, J. 1999.Genetic and physical characterization of grain texture-relatedloci in diploid wheat. Mol. Gen. Genet. 262: 846–850.
Van Deynze, A.E., Dubcovsky, J., Gill, K.S., Nelson, J.C., Sorrells,M.E., Dvorak, J., Gill, B.S., Lagudah, E.S., McCouch, S.R., andAppels, R. 1995. Molecular-genetic maps for group 1chromosomes of Triticeae species and their relation tochromosomes in rice and oat. Genome 38: 45–59.
Walsh, J.B. 1995. How often do duplicated genes evolve newfunctions? Genetics 139: 421–428.
Wu, J.Z., Maehara, T., Shimokawa, T., Yamamoto, S., Harada, C.,Takazaki, Y., Ono, N., Mukai, Y., Koike, K., Yazaki, J., et al. 2002.A comprehensive rice transcript map containing 6591 expressedsequence tag sites. Plant Cell 14: 525–535.
WEB SITE REFERENCEShttp://www.tigr.org; The Institute for Genomic Research (TIGR).http://www.ncbi.nlm.nih.gov; GenBank database at National Center
for Biotechnology Information.http://wheat.pw.usda.gov/wEST/; wEST database (wheat EST) at
USDA-ARS Western Regional Research Center server.http://wheat.pw.usda.gov/west/binmaps; A database of bins
delineated by deletion breakpoints at USDA-ARS WesternRegional Research Center server.
http://wheat.pw.usda.gov/cgi-bin/westsql/map_locus.cgi; A databaseof mapped loci in the bins at USDA-ARS Western RegionalResearch Center server.
Received September 16, 2002; accepted in revised form February 18, 2003.
Organization and Evolution of Wheat Genomes
Genome Research 763www.genome.org