Differential molecular responses of rice and wheat coleoptiles to anoxia reveal novel metabolic...
19
Differential Molecular Responses of Rice and Wheat Coleoptiles to Anoxia Reveal Novel Metabolic Adaptations in Amino Acid Metabolism for Tissue Tolerance 1[W][OA] Rachel N. Shingaki-Wells, Shaobai Huang, Nicolas L. Taylor, Adam J. Carroll, Wenxu Zhou, and A. Harvey Millar* Australian Research Council Centre of Excellence for Plant Energy Biology (R.N.S.-W., S.H., N.L.T., W.Z., A.H.M.), Centre for Comparative Analysis of Biomolecular Networks (R.N.S.-W., S.H., N.L.T., A.H.M.), and Centre of Excellence for Plant Metabolomics (W.Z.), University of Western Australia, Crawley, Western Australia 6009, Australia; and Australian Research Council Centre of Excellence for Plant Energy Biology, Australian National University, Canberra, Australian Capital Territory 2601, Australia (A.J.C.) Rice (Oryza sativa) and wheat (Triticum aestivum) are the most important starch crops in world agriculture. While both germinate with an anatomically similar coleoptile, this tissue defines the early anoxia tolerance of rice and the anoxia intolerance of wheat seedlings. We combined protein and metabolite profiling analysis to compare the differences in response to anoxia between the rice and wheat coleoptiles. Rice coleoptiles responded to anoxia dramatically, not only at the level of protein synthesis but also at the level of altered metabolite pools, while the wheat response to anoxia was slight in comparison. We found significant increases in the abundance of proteins in rice coleoptiles related to protein translation and antioxidant defense and an accumulation of a set of enzymes involved in serine, glycine, and alanine biosynthesis from glyceraldehyde-3- phosphate or pyruvate, which correlates with an observed accumulation of these amino acids in anoxic rice. We show a positive effect on wheat root anoxia tolerance by exogenous addition of these amino acids, indicating that their synthesis could be linked to rice anoxia tolerance. The potential role of amino acid biosynthesis contributing to anoxia tolerance in cells is discussed. Rice (Oryza sativa) and wheat (Triticum aestivum) are economically important crops that are adversely af- fected by multiple environmental stresses. Both these monocotyledon grasses operate similar central meta- bolic processes yet notably differ in aspects of their development and anatomy as well as in their optimal growth conditions: rice is typically cultivated in trop- ical regions on flooded/anaerobic soils, whereas wheat is almost exclusively a dry-land winter crop (Nagai and Makino, 2009). Despite these differences, their critical role as the main source of nutrition for humanity makes the comparative study of these crops under yield-reducing stresses important. Furthermore, the study of two species, as opposed to two cultivars of the same species, may be useful in highlighting mecha- nisms of anoxia adaptation in plants differing in the contexts of their domestication. Rice is an ideal model species for elucidating the mechanisms of anoxia toler- ance in plants; its full genome sequence is available (Yu et al., 2002), it can survive under prolonged anoxia, and it can even display elongation of its coleoptiles under anoxic conditions (Menegus et al., 1991; Perata et al., 1997). A critical aspect of rice anoxia tolerance is the induction of the starch-degrading enzyme a-amylase under anoxia, providing a continuing supply of sub- strates for metabolism (Perata et al., 1992). Rice growth under anoxia is largely restricted to the coleoptile, with root and leaf development halted in the absence of oxygen (O ¨ pik, 1973). From an evolutionary perspec- tive, successful coleoptile growth under anoxia pro- vides rice seedlings with the opportunity to reach more air-saturated conditions above anaerobic mud or stand- ing water (Kordan, 1974), thus increasing the chance of survival. In some regions of the world, wheat also en- counters waterlogging, causing oxygen deficiency, but unlike rice, this normally leads to major or even total yield losses (Setter and Waters, 2003). Compared with rice seedlings, wheat seedlings are widely considered to be anoxia intolerant, despite possessing an anatom- 1 This work was supported by the Grains Research and Devel- opment Corporation and an Australian Postgraduate Award Ph.D. scholarship (to R.N.S.-W.), by a University of Western Australia Research Development Award (to S.H.), by the Australian Research Council through the Australian Research Council Centre of Excel- lence in Plant Energy Biology (grant no. CE0561495), and by an Australian Research Council Australian Professorial Fellowship (to A.H.M.). * Corresponding author; e-mail [email protected]. The author responsible for distribution of materials integral to the findings presented in this article in accordance with the policy described in the Instructions for Authors (www.plantphysiol.org) is: A. Harvey Millar ([email protected]). [W] The online version of this article contains Web-only data. [OA] Open Access articles can be viewed online without a sub- scription. www.plantphysiol.org/cgi/doi/10.1104/pp.111.175570 1706 Plant Physiology Ò , August 2011, Vol. 156, pp. 1706–1724, www.plantphysiol.org Ó 2011 American Society of Plant Biologists www.plant.org on June 17, 2014 - Published by www.plantphysiol.org Downloaded from Copyright © 2011 American Society of Plant Biologists. All rights reserved.
Transcript of Differential molecular responses of rice and wheat coleoptiles to anoxia reveal novel metabolic...

Differential Molecular Responses of Rice and WheatColeoptiles to Anoxia Reveal Novel MetabolicAdaptations in Amino Acid Metabolism forTissue Tolerance1[W][OA]
Rachel N. Shingaki-Wells, Shaobai Huang, Nicolas L. Taylor, Adam J. Carroll,Wenxu Zhou, and A. Harvey Millar*
Australian Research Council Centre of Excellence for Plant Energy Biology (R.N.S.-W., S.H., N.L.T., W.Z.,A.H.M.), Centre for Comparative Analysis of Biomolecular Networks (R.N.S.-W., S.H., N.L.T., A.H.M.), andCentre of Excellence for Plant Metabolomics (W.Z.), University of Western Australia, Crawley, WesternAustralia 6009, Australia; and Australian Research Council Centre of Excellence for Plant Energy Biology,Australian National University, Canberra, Australian Capital Territory 2601, Australia (A.J.C.)
Rice (Oryza sativa) and wheat (Triticum aestivum) are the most important starch crops in world agriculture. While bothgerminate with an anatomically similar coleoptile, this tissue defines the early anoxia tolerance of rice and the anoxiaintolerance of wheat seedlings. We combined protein and metabolite profiling analysis to compare the differences in responseto anoxia between the rice and wheat coleoptiles. Rice coleoptiles responded to anoxia dramatically, not only at the level ofprotein synthesis but also at the level of altered metabolite pools, while the wheat response to anoxia was slight in comparison.We found significant increases in the abundance of proteins in rice coleoptiles related to protein translation and antioxidantdefense and an accumulation of a set of enzymes involved in serine, glycine, and alanine biosynthesis from glyceraldehyde-3-phosphate or pyruvate, which correlates with an observed accumulation of these amino acids in anoxic rice. We show a positiveeffect on wheat root anoxia tolerance by exogenous addition of these amino acids, indicating that their synthesis could be linkedto rice anoxia tolerance. The potential role of amino acid biosynthesis contributing to anoxia tolerance in cells is discussed.
Rice (Oryza sativa) and wheat (Triticum aestivum) areeconomically important crops that are adversely af-fected by multiple environmental stresses. Both thesemonocotyledon grasses operate similar central meta-bolic processes yet notably differ in aspects of theirdevelopment and anatomy as well as in their optimalgrowth conditions: rice is typically cultivated in trop-ical regions on flooded/anaerobic soils, whereas wheatis almost exclusively a dry-land winter crop (Nagai andMakino, 2009). Despite these differences, their criticalrole as the main source of nutrition for humanity
makes the comparative study of these crops underyield-reducing stresses important. Furthermore, thestudy of two species, as opposed to two cultivars of thesame species, may be useful in highlighting mecha-nisms of anoxia adaptation in plants differing in thecontexts of their domestication. Rice is an ideal modelspecies for elucidating the mechanisms of anoxia toler-ance in plants; its full genome sequence is available (Yuet al., 2002), it can survive under prolonged anoxia, andit can even display elongation of its coleoptiles underanoxic conditions (Menegus et al., 1991; Perata et al.,1997). A critical aspect of rice anoxia tolerance is theinduction of the starch-degrading enzyme a-amylaseunder anoxia, providing a continuing supply of sub-strates for metabolism (Perata et al., 1992). Rice growthunder anoxia is largely restricted to the coleoptile,with root and leaf development halted in the absenceof oxygen (Opik, 1973). From an evolutionary perspec-tive, successful coleoptile growth under anoxia pro-vides rice seedlings with the opportunity to reach moreair-saturated conditions above anaerobic mud or stand-ing water (Kordan, 1974), thus increasing the chance ofsurvival. In some regions of the world, wheat also en-counters waterlogging, causing oxygen deficiency, butunlike rice, this normally leads to major or even totalyield losses (Setter and Waters, 2003). Compared withrice seedlings, wheat seedlings are widely consideredto be anoxia intolerant, despite possessing an anatom-
1 This work was supported by the Grains Research and Devel-opment Corporation and an Australian Postgraduate Award Ph.D.scholarship (to R.N.S.-W.), by a University of Western AustraliaResearch Development Award (to S.H.), by the Australian ResearchCouncil through the Australian Research Council Centre of Excel-lence in Plant Energy Biology (grant no. CE0561495), and by anAustralian Research Council Australian Professorial Fellowship (toA.H.M.).
* Corresponding author; e-mail [email protected] author responsible for distribution of materials integral to the
findings presented in this article in accordance with the policydescribed in the Instructions for Authors (www.plantphysiol.org) is:A. Harvey Millar ([email protected]).
[W] The online version of this article contains Web-only data.[OA] Open Access articles can be viewed online without a sub-
scription.www.plantphysiol.org/cgi/doi/10.1104/pp.111.175570
1706 Plant Physiology�, August 2011, Vol. 156, pp. 1706–1724, www.plantphysiol.org � 2011 American Society of Plant Biologists www.plant.org on June 17, 2014 - Published by www.plantphysiol.orgDownloaded from
Copyright © 2011 American Society of Plant Biologists. All rights reserved.

ically similar coleoptile tissue under normal growthconditions (Menegus et al., 1991). Although wheatseeds are starchy like rice, they cannot germinate andgrow a coleoptile under anoxia due to an absence ofthe starch-degrading enzyme a-amylase in anaerobicseeds (Perata et al., 1992).Without oxygen, the glycolytic pathway that is linked
with ethanolic fermentation is the predominant mech-anism of energy production in plants (Gibbs et al., 2000;Bailey-Serres and Voesenek, 2008). However, there isstill much less energy production during anoxia thanin aeration per unit of carbohydrate metabolized. As aconsequence, the synthesis rate of macromoleculessuch as proteins decreases well below that seen inaerated tissues (Alpi and Beevers, 1983). Even so, ricecoleoptiles still exhibit a complex pattern of newlysynthesized proteins under anoxia (Mocquot et al.,1981; Ricard and Pradet, 1989; Huang et al., 2005).Along with the classical anaerobic proteins first re-ported in maize (Zea mays; Sachs et al., 1996), anoxicrice coleoptiles also synthesize a range of proteins withunknown functions (Huang et al., 2005). To date, theidentified anoxically synthesized protein data set in ricedoes not form complete biochemical pathways (Ricardet al., 1991; Huang et al., 2005). Evidently missing fromthis set are a range of enzymes in glycolysis and theenzymes that could explain the observed amino acidaccumulation in rice coleoptiles under anoxia (Fanet al., 1997; Kato-Noguchi and Ohashi, 2006). It remainsunclear whether these dramatically induced amino acidpools are derived from specific protein degradationunder anoxia or de novo amino acid synthesis. Withthe improved techniques in protein identification us-ing peptide mass spectrometry, it is feasible to analyzeproteins on a large scale using combinations of gel-based or non-gel-basedmethods to address these issuesand provide an in-depth understanding of the mech-anism(s) of anoxia tolerance. Direct comparisons ofproteome responses that occur during anoxia in toler-ant rice coleoptiles and intolerant wheat coleoptilesalso provide an opportunity to differentiate proteomechanges under anoxia associated with cellular stressand damage from those associated with continuedgrowth and adaptation.At the metabolite level, the accumulation of fermen-
tation end products such as ethanol, lactate, and Alahas been extensively studied in plants responding tooxygen deprivation (Raymond et al., 1985; Meneguset al., 1989, 1991; Gibbs and Greenway, 2003). A recentmetabolomic analysis of Lotus japonicus suggests thatthe accumulation of succinate and Ala under lowoxygen might function to generate ATP that is addi-tional to what the glycolytic pathway offers (Rochaet al., 2010). In rice coleoptiles, the anaerobic assimila-tion of inorganic nitrogen into amino acids, particularlyAla and g-aminobutyrate/Glu, may serve to supple-ment ethanolic fermentation in sustaining glycolyticenergy production (Fan et al., 1997). There are alsoseveral studies that report changes of carbohydrates(Suc, Glc, Fru) and sugar phosphates in coleoptiles and
shoots (composed of both leaves and coleoptiles) ofrice seedlings in response to anoxia (Menegus et al.,1991; Guglielminetti et al., 1995; Huang et al., 2003). Ananalysis of the early germination stages of rice embryosat the metabolite level highlighted sets of 10 and 13metabolites, respectively, as aerobic and anaerobic re-sponders (Narsai et al., 2009). However, a broad pic-ture of the changes of metabolites in the anoxic ricecoleoptile itself remains unclear, and measuring only afew compounds, as has been reported in most of theearlier studies (Menegus et al., 1989, 1991), makes it hardto understand the flow of both carbon and nitrogen be-tweenmetabolic pools under anoxia. Furthermore, thereare no reported studies on how wheat coleoptiles re-spond to anoxia across a broad set of metabolite pools.
In this study, we combined protein and metabolite-profiling analyses to compare the differences in responseto anoxia between anoxia-tolerant rice coleoptiles andanoxia-intolerant wheat coleoptiles. Rice coleoptiles,but not wheat coleoptiles, responded to anoxia dra-matically, not only at the level of new protein synthesisbut also at the level of altered metabolite pools. Wealso found significant increases in anoxic rice coleop-tile proteins related to protein translation, such as 40Sribosomal proteins and elongation factors. The possi-bility of selected mRNA translation and protein turn-over in anoxic rice coleoptiles, but not in anoxic wheatcoleoptiles, which are remarkably unchanged, is dis-cussed in light of the observed low correlation betweenprotein abundance and reported gene expression data.A set of enzymes that increased in abundance in anoxicrice, a change that was not apparent in wheat, are in-volved in Ser, Gly, and Ala biosynthesis from glyco-lytic metabolites. This correlates with the observedaccumulation of these amino acids in anoxic rice cole-optiles. The potential role of amino acid biosynthesiscontributing to anoxia tolerance is discussed, and weshow a positive effect on tolerance upon exogenoussupplementation of these amino acids in wheat butnot in rice.
RESULTS
Physiological Analyses Highlight Differences betweenResponses of Rice and Wheat Seedlings to Anoxia
Germination of the rice and wheat seeds used in thisstudy under anoxic conditions replicated widely re-ported differences that rice can germinate and grow itscoleoptile under anoxia while wheat seeds fail to ger-minate under similar conditions (Alpi and Beevers,1983; Supplemental Fig. S1A). We compared rice cole-optiles from seedlings germinated and grown underanoxia for 6 d with those under aeration for 4 d tocharacterize rice metabolism under prolonged anoxia.Rice coleoptiles from seedlings grown under aerationfor 4 d followed by a 1-d switch to anoxia were alsostudied. This allowed a comparison to be made be-tween prolonged protein changes from germination
Rice and Wheat Anoxia Responses
Plant Physiol. Vol. 156, 2011 1707 www.plant.org on June 17, 2014 - Published by www.plantphysiol.orgDownloaded from
Copyright © 2011 American Society of Plant Biologists. All rights reserved.

and more rapid changes associated with the loss ofoxygen from aerobic tissue. The treatment involving aswitch to anoxia also generated a data set comparableto publicly available microarray data characterizingcoleoptiles from 4-d-old anoxically germinated riceseedlings (Lasanthi-Kudahettige et al., 2007). As theyare unable to germinate under anoxia, we were con-strained to studying wheat seedlings that were germi-nated and grown under aeration for 4 d and thenswitched to 1 d of anoxia. By using the Evans blue vi-ability stain, a distinction in the anoxia tolerance of riceand wheat was confirmed in that the viability of ricerootswasmuch greater than that of wheat after a switchfrom aeration to anoxia (Supplemental Fig. S1B).
Detailed study of the 24-h anoxic response in riceandwheat coleoptiles was performed tracking growth,sugar content, and metabolic activities (Table I). Thisshowed that aerobically grown rice coleoptiles, but notwheat coleoptiles, displayed significant elongation after1 d of anoxia (Table I). Sugars are the primary carbonsource for energy production via glycolysis and etha-nolic fermentation. The sugar content of rice coleoptilesunder anoxia for 6 d was considerably lower than thatmeasured in 4-d-old aerobic coleoptiles (Table I). Thesugar content of coleoptiles, leaves, and roots of bothrice and wheat seedlings was also significantly lowereven after a 1-d switch from aeration to anoxia (Table I).Induction of alcohol dehydrogenase (ADH) is a keystep in the switch to anaerobic energy production, forit is ethanolic fermentation that regenerates NAD+, anoxidant necessary for the continuation of glycolysis. Inboth anoxic rice and wheat coleoptiles, ADH activitywas induced compared with the aerated control (Table
I). However the apparent inducibility of ADH activityduring anoxia was greater in coleoptiles of rice (3.4-fold) than those of wheat (2.4-fold; Table I). The highestADH activity recorded was observed in rice coleoptilesafter 6 d under anoxia (Table I). In the leaves and rootsof both rice and wheat seedlings, ADH activities werealso induced by anoxia, but the final specific activity ofADH was 5- to 10-fold higher in rice than in wheat(Table I).
The 6-d-old anoxic rice coleoptiles were shorter thanthose from seedlings germinated and grown underaeration for 4 d (Table I). This contrasts with previousreports that rice coleoptiles grown under anoxia weremuch longer than aerated ones (Atwell et al., 1982; Alpiand Beevers, 1983). The explanation for this differencecould be the different cultivars used or the use of N2bubbling as a means to achieve anoxia, rather than thestagnant conditions used in other studies (Magneschiet al., 2009). Bubbling removes other gases such as CO2and even ethylene produced by coleoptiles if traceamounts of oxygen are available, reducing the com-plexity of comparing anoxic and aerated conditions.
We also monitored the capacity for mitochondrialrespiratory function by measuring tissue oxygen con-sumption rate. The rate of oxygen consumption incoleoptiles from seedlings continuously grown underanoxia, but returned to aeration for the measurements,was significantly less than that of continuously aeratedcoleoptiles (Table I). This is consistent with the needfor oxygen for the biosynthesis of heme groups for thecytochromes of the plant respiratory chain (Millaret al., 2004). The oxygen consumption rate capacityin roots and leaves from rice and wheat seedlings was
Table I. Growth, sugar concentration, oxygen consumption rate, and ADH activity of coleoptiles from rice and wheat seedlings exposed toaeration or anoxia
Rice seeds were germinated and grown under aeration for 4 d (control), anoxia for 6 d (anoxically germinated; 6 d N2), or subsequently switchedto 1 d of anoxia (anoxically switched; 4 d air + 1 d N2) or 1 d of air (aerobically switched; 6 d N2 + 1 d air). Wheat seeds were treated withcontrol conditions or were anoxically switched.
Parameters TreatmentsRice Wheat
Coleoptiles Leaves Roots Coleoptiles Leaves Roots
Growth (mm) 4 d air 11.9 6 0.9 – – 28.1 6 2.7 – –4 d air + 1 d N2 14.2 6 1.0a – – 26.2 6 1.5 – –
6 d N2 7.1 6 0.7a – – – – –6 d N2 + 1 d air 9.7 6 0.7b – – – – –
Sugar concentration(mg hexose g21
4 d air 44.8 6 1.4 55.8 6 2.1 28.0 6 2.8 37.0 6 0.7 64.9 6 2.5 12.4 6 1.24 d air + 1 d N2 21.6 6 0.9a 31.3 6 0.7a 13.5 6 0.7a 26.4 6 1.2a 40.4 6 1.0a 3.4 6 0.3a
fresh wt) 6 d N2 3.5 6 0.2a – – – – –6 d N2 + 1 d air 7.7 6 1.1b – – – – –
Oxygen consumptionrate (nmol min21
4 d air 126.3 6 5.1 302.2 6 10.8 398.8 6 20.2 140.6 6 6.0 478.8 6 36.2 436.8 6 14.44 d air + 1 d N2 104.7 6 2.8a 132.7 6 20.0a 82.1 6 1.2a 146.1 6 8.9 336.7 6 10.1 177.3 6 1.0a
g21 fresh wt) 6 d N2 67.4 6 6.0a – – – – –6 d N2 + 1 d air 134.0 6 11.8b – – – – –
ADH activity (unitsmg21 protein)
4 d air 0.75 6 0.06 0.94 6 0.07 0.94 6 0.05 0.25 6 0.01 0.09 6 0.01 0.32 6 0.024 d air + 1 d N2 2.68 6 0.13a 3.42 6 0.04a 5.22 6 0.70a 0.59 6 0.01a 0.28 6 0.01a 1.08 6 0.01a
6 d N2 6.61 6 0.48a – – – – –6 d N2 + 1 d air 4.38 6 0.24b – – – – –
aThe value of continuously anoxic/anoxically switched samples is P , 0.05 when compared with continuously aerated samples. bThe value ofaerobically switched samples is P , 0.05 when compared with continuously anoxic samples.
Shingaki-Wells et al.
1708 Plant Physiol. Vol. 156, 2011 www.plant.org on June 17, 2014 - Published by www.plantphysiol.orgDownloaded from
Copyright © 2011 American Society of Plant Biologists. All rights reserved.
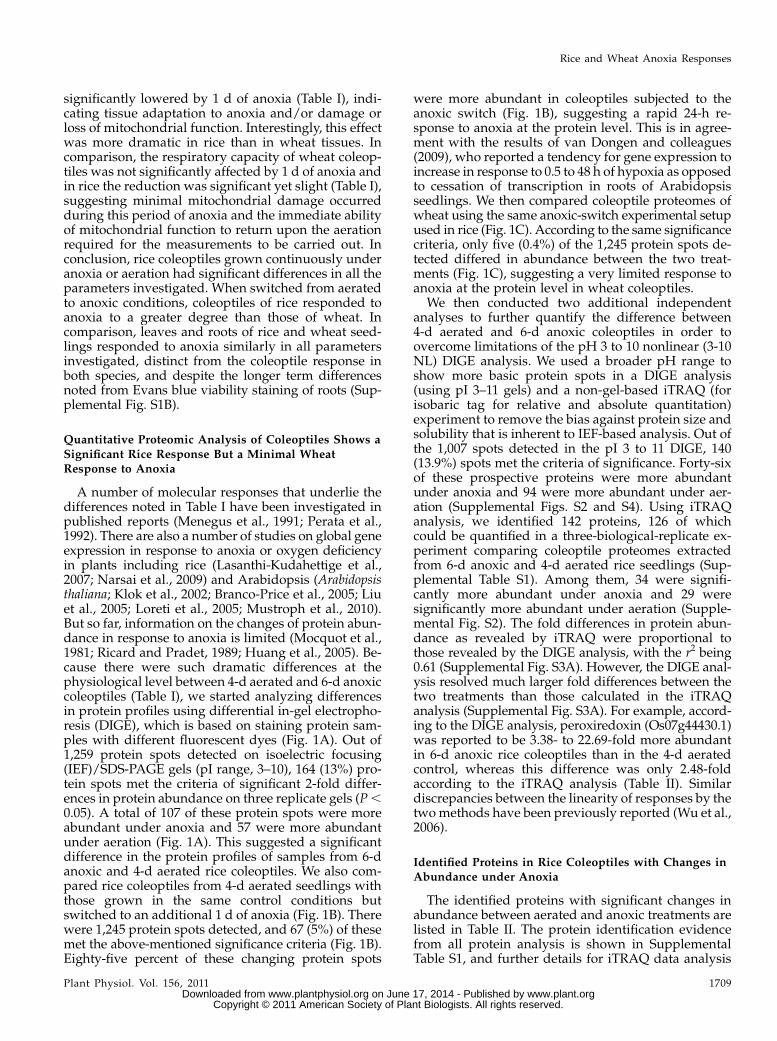
significantly lowered by 1 d of anoxia (Table I), indi-cating tissue adaptation to anoxia and/or damage orloss of mitochondrial function. Interestingly, this effectwas more dramatic in rice than in wheat tissues. Incomparison, the respiratory capacity of wheat coleop-tiles was not significantly affected by 1 d of anoxia andin rice the reduction was significant yet slight (Table I),suggesting minimal mitochondrial damage occurredduring this period of anoxia and the immediate abilityof mitochondrial function to return upon the aerationrequired for the measurements to be carried out. Inconclusion, rice coleoptiles grown continuously underanoxia or aeration had significant differences in all theparameters investigated. When switched from aeratedto anoxic conditions, coleoptiles of rice responded toanoxia to a greater degree than those of wheat. Incomparison, leaves and roots of rice and wheat seed-lings responded to anoxia similarly in all parametersinvestigated, distinct from the coleoptile response inboth species, and despite the longer term differencesnoted from Evans blue viability staining of roots (Sup-plemental Fig. S1B).
Quantitative Proteomic Analysis of Coleoptiles Shows a
Significant Rice Response But a Minimal WheatResponse to Anoxia
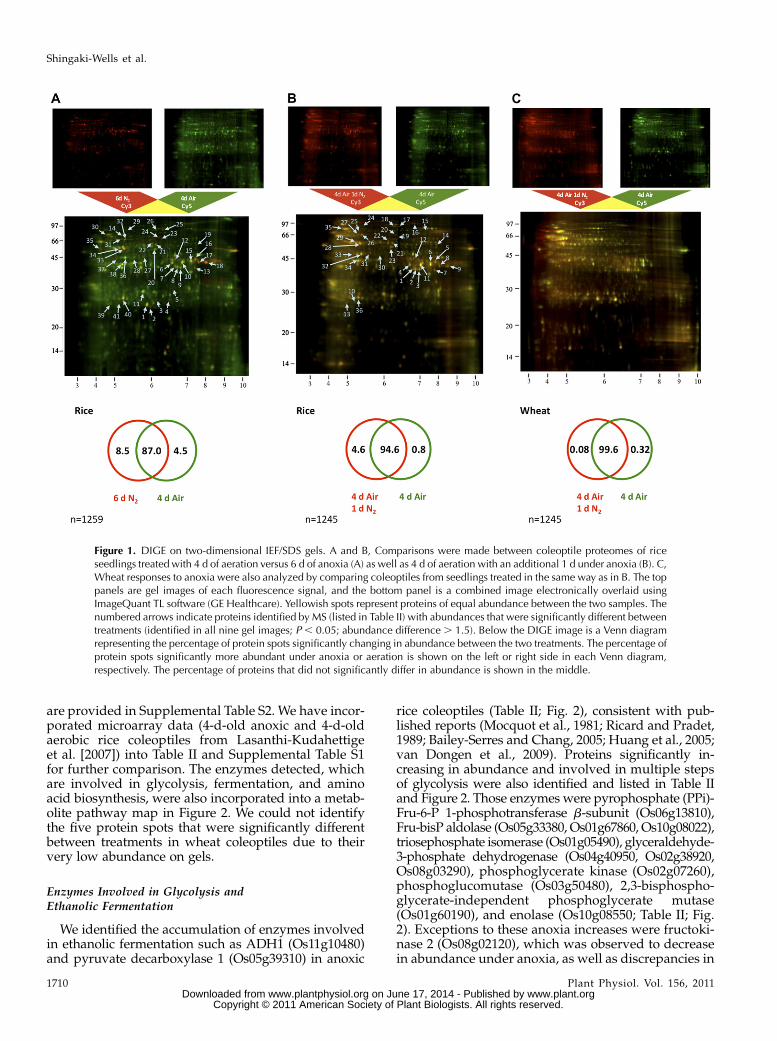
A number of molecular responses that underlie thedifferences noted in Table I have been investigated inpublished reports (Menegus et al., 1991; Perata et al.,1992). There are also a number of studies on global geneexpression in response to anoxia or oxygen deficiencyin plants including rice (Lasanthi-Kudahettige et al.,2007; Narsai et al., 2009) and Arabidopsis (Arabidopsisthaliana; Klok et al., 2002; Branco-Price et al., 2005; Liuet al., 2005; Loreti et al., 2005; Mustroph et al., 2010).But so far, information on the changes of protein abun-dance in response to anoxia is limited (Mocquot et al.,1981; Ricard and Pradet, 1989; Huang et al., 2005). Be-cause there were such dramatic differences at thephysiological level between 4-d aerated and 6-d anoxiccoleoptiles (Table I), we started analyzing differencesin protein profiles using differential in-gel electropho-resis (DIGE), which is based on staining protein sam-ples with different fluorescent dyes (Fig. 1A). Out of1,259 protein spots detected on isoelectric focusing(IEF)/SDS-PAGE gels (pI range, 3–10), 164 (13%) pro-tein spots met the criteria of significant 2-fold differ-ences in protein abundance on three replicate gels (P,0.05). A total of 107 of these protein spots were moreabundant under anoxia and 57 were more abundantunder aeration (Fig. 1A). This suggested a significantdifference in the protein profiles of samples from 6-danoxic and 4-d aerated rice coleoptiles. We also com-pared rice coleoptiles from 4-d aerated seedlings withthose grown in the same control conditions butswitched to an additional 1 d of anoxia (Fig. 1B). Therewere 1,245 protein spots detected, and 67 (5%) of thesemet the above-mentioned significance criteria (Fig. 1B).Eighty-five percent of these changing protein spots
were more abundant in coleoptiles subjected to theanoxic switch (Fig. 1B), suggesting a rapid 24-h re-sponse to anoxia at the protein level. This is in agree-ment with the results of van Dongen and colleagues(2009), who reported a tendency for gene expression toincrease in response to 0.5 to 48 h of hypoxia as opposedto cessation of transcription in roots of Arabidopsisseedlings. We then compared coleoptile proteomes ofwheat using the same anoxic-switch experimental setupused in rice (Fig. 1C). According to the same significancecriteria, only five (0.4%) of the 1,245 protein spots de-tected differed in abundance between the two treat-ments (Fig. 1C), suggesting a very limited response toanoxia at the protein level in wheat coleoptiles.
We then conducted two additional independentanalyses to further quantify the difference between4-d aerated and 6-d anoxic coleoptiles in order toovercome limitations of the pH 3 to 10 nonlinear (3-10NL) DIGE analysis. We used a broader pH range toshow more basic protein spots in a DIGE analysis(using pI 3–11 gels) and a non-gel-based iTRAQ (forisobaric tag for relative and absolute quantitation)experiment to remove the bias against protein size andsolubility that is inherent to IEF-based analysis. Out ofthe 1,007 spots detected in the pI 3 to 11 DIGE, 140(13.9%) spots met the criteria of significance. Forty-sixof these prospective proteins were more abundantunder anoxia and 94 were more abundant under aer-ation (Supplemental Figs. S2 and S4). Using iTRAQanalysis, we identified 142 proteins, 126 of whichcould be quantified in a three-biological-replicate ex-periment comparing coleoptile proteomes extractedfrom 6-d anoxic and 4-d aerated rice seedlings (Sup-plemental Table S1). Among them, 34 were signifi-cantly more abundant under anoxia and 29 weresignificantly more abundant under aeration (Supple-mental Fig. S2). The fold differences in protein abun-dance as revealed by iTRAQ were proportional tothose revealed by the DIGE analysis, with the r2 being0.61 (Supplemental Fig. S3A). However, the DIGE anal-ysis resolved much larger fold differences between thetwo treatments than those calculated in the iTRAQanalysis (Supplemental Fig. S3A). For example, accord-ing to the DIGE analysis, peroxiredoxin (Os07g44430.1)was reported to be 3.38- to 22.69-fold more abundantin 6-d anoxic rice coleoptiles than in the 4-d aeratedcontrol, whereas this difference was only 2.48-foldaccording to the iTRAQ analysis (Table II). Similardiscrepancies between the linearity of responses by thetwomethods have been previously reported (Wu et al.,2006).
Identified Proteins in Rice Coleoptiles with Changes inAbundance under Anoxia
The identified proteins with significant changes inabundance between aerated and anoxic treatments arelisted in Table II. The protein identification evidencefrom all protein analysis is shown in SupplementalTable S1, and further details for iTRAQ data analysis
Rice and Wheat Anoxia Responses
Plant Physiol. Vol. 156, 2011 1709 www.plant.org on June 17, 2014 - Published by www.plantphysiol.orgDownloaded from
Copyright © 2011 American Society of Plant Biologists. All rights reserved.
are provided in Supplemental Table S2. We have incor-porated microarray data (4-d-old anoxic and 4-d-oldaerobic rice coleoptiles from Lasanthi-Kudahettigeet al. [2007]) into Table II and Supplemental Table S1for further comparison. The enzymes detected, whichare involved in glycolysis, fermentation, and aminoacid biosynthesis, were also incorporated into a metab-olite pathway map in Figure 2. We could not identifythe five protein spots that were significantly differentbetween treatments in wheat coleoptiles due to theirvery low abundance on gels.
Enzymes Involved in Glycolysis andEthanolic Fermentation
We identified the accumulation of enzymes involvedin ethanolic fermentation such as ADH1 (Os11g10480)and pyruvate decarboxylase 1 (Os05g39310) in anoxic
rice coleoptiles (Table II; Fig. 2), consistent with pub-lished reports (Mocquot et al., 1981; Ricard and Pradet,1989; Bailey-Serres and Chang, 2005; Huang et al., 2005;van Dongen et al., 2009). Proteins significantly in-creasing in abundance and involved in multiple stepsof glycolysis were also identified and listed in Table IIand Figure 2. Those enzymes were pyrophosphate (PPi)-Fru-6-P 1-phosphotransferase b-subunit (Os06g13810),Fru-bisP aldolase (Os05g33380, Os01g67860, Os10g08022),triosephosphate isomerase (Os01g05490), glyceraldehyde-3-phosphate dehydrogenase (Os04g40950, Os02g38920,Os08g03290), phosphoglycerate kinase (Os02g07260),phosphoglucomutase (Os03g50480), 2,3-bisphospho-glycerate-independent phosphoglycerate mutase(Os01g60190), and enolase (Os10g08550; Table II; Fig.2). Exceptions to these anoxia increases were fructoki-nase 2 (Os08g02120), which was observed to decreasein abundance under anoxia, as well as discrepancies in
Figure 1. DIGE on two-dimensional IEF/SDS gels. A and B, Comparisons were made between coleoptile proteomes of riceseedlings treated with 4 d of aeration versus 6 d of anoxia (A) as well as 4 d of aeration with an additional 1 d under anoxia (B). C,Wheat responses to anoxia were also analyzed by comparing coleoptiles from seedlings treated in the same way as in B. The toppanels are gel images of each fluorescence signal, and the bottom panel is a combined image electronically overlaid usingImageQuant TL software (GE Healthcare). Yellowish spots represent proteins of equal abundance between the two samples. Thenumbered arrows indicate proteins identified by MS (listed in Table II) with abundances that were significantly different betweentreatments (identified in all nine gel images; P , 0.05; abundance difference . 1.5). Below the DIGE image is a Venn diagramrepresenting the percentage of protein spots significantly changing in abundance between the two treatments. The percentage ofprotein spots significantly more abundant under anoxia or aeration is shown on the left or right side in each Venn diagram,respectively. The percentage of proteins that did not significantly differ in abundance is shown in the middle.
Shingaki-Wells et al.
1710 Plant Physiol. Vol. 156, 2011 www.plant.org on June 17, 2014 - Published by www.plantphysiol.orgDownloaded from
Copyright © 2011 American Society of Plant Biologists. All rights reserved.

Table II. Proteomic analysis of rice coleoptiles in response to anoxia or switch from air to anoxia
Proteins selected from DIGE corresponding to Figure 1, A and B, and iTRAQ (Supplemental Table S2) were identified by MS/MS (Protein ID) withcorresponding rice gene numbers (Os Gene No.). Details of the matched protein size, number of peptides identified, and percentage coverage areshown in Supplemental Table S1. Transcript abundance differences between anoxic (4 d) and aerated (4 d) rice coleoptiles derived from independentmicroarray data (Lasanthi-Kudahettige et al., 2007) have been incorporated (significant increase [positive, boldface], significant decrease [negative,boldface italic]). Protein spots chosen for MS/MS analysis met the following criteria in at least one analysis: a protein abundance difference of 1.5 orgreater where proteins were higher in anoxic samples (positive, boldface) and those higher in aeration (negative, boldface italic), P , 0.05, and anabundance high enough on preparative gels for subsequent MS identification. FAD, Fold abundance difference; GAPDH, glyceraldehyde-3-phosphate dehydrogenase; iPGAM, 2,3-bisphosphoglycerate-independent phosphoglycerate mutase; MetSyn, cobalamin-independent Met syn-thase; N/S, not significant; 3-PGDH, D-3-phosphoglycerate dehydrogenase; PSAT, phospho-Ser aminotransferase; S, significant; SHMT, Serhydroxymethyltransferase; Sig., significantly different from 1 or not; TGM, transformed geometric mean; X, no data.
Functional
CategoryOs Gene No. Protein ID
DIGE: 3-10NL DIGE: 3-11NL DIGE: 3-10NL iTRAQ Array
6 d N2/4 d Air 6 d N2/4 d Air 4 d Air 1 d N2/4 d Air 6 d N2/4 d Air 4 d N2/4 d Air
Spot FAD P Spot FAD P Spot FAD P TGM Sig. FAD
Sugar metabolism, Os03g28330.1 Suc synthase – X X – X X – X X 1.6 S 2
glycolysis, Os06g09450.1 Suc synthase – X X – X X – X X 1.7 S 2
fermentation, Os01g60190.1 iPGAM 31 3.3 4.E-04 20 5.7 5.E-04 27 1.3 1.E-01 21.0 N/S 2
and TCA cycle Os01g60190.1 iPGAM 32 4.3 4.E-06 21 6.1 3.E-05 26 1.5 9.E-03 21.0 N/S 2
Os10g08550.1 Enolase 33 7.5 5.E-09 18 5.7 9.E-04 28 2.4 7.E-04 1.2 S 2
Os10g08550.1 Enolase 34 2.2 3.E-05 19 2.8 2.E-03 29 1.5 8.E-04 1.2 S 2
Os08g02120.1 Fructokinase-2 – X X – X X – X X 22.2 S 22
Os05g33380.1 Aldolase 16 4.7 5.E-06 – X X 5 2.1 3.E-04 2.0 S N/S
Os01g67860.1 Aldolase – X X – X X – X X 2.2 S N/S
Os10g08022.1 Aldolase – X X – X X – X X 2.3 S X
Os04g40950.1 GAPDH 6 2.2 7.E-04 6 2.4 2.E-03 4 1.1 8.E-02 1.4 S N/S
Os04g40950.1 GAPDH 10 3.6 7.E-05 – X X 11 1.0 7.E-01 1.4 S N/S
Os04g40950.1 GAPDH – X X 8 2.6 1.E-03 – X X 1.4 S N/S
Os02g38920.1 GAPDH 18 13.2 5.E-06 – X X 9 1.7 2.E-03 1.8 S 3
Os02g38920.1 GAPDH 17 6.7 4.E-08 – X X 8 1.7 1.E-02 1.8 S 3
Os08g03290.1 GAPDH 15 2.5 6.E-04 – X X 6 1.2 4.E-02 X X N/S
Os08g03290.2 GAPDH – X X – X X – X X 1.3 S N/S
Os03g50480.1 Phosphoglucomutase 14 6.3 2.E-05 – X X 25 2.7 2.E-03 21.1 S N/S
Os02g07260.1 Phosphoglycerate kinase 28 5.3 1.E-04 – X X 31 2.4 1.E-02 1.2 S 2
Os01g05490.1 Triosephosphate isomerase 40 2.9 5.E-05 – X X 36 1.2 9.E-03 1.4 S 4 and N/S
Os06g13810.1 PPi-phosphofructokinase 23 2.8 2.E-02 – X X 19 2.1 9.E-04 1.4 S 2
Os05g39310.1 Pyruvate decarboxylase 1 – X X – X X – X X 2.0 S 594
Os11g10480.1 ADH1 12 6.0 2.E-05 – X X 12 3.6 4.E-05 2.2 S 4
Os01g46070.1 Malate dehydrogenase – X X – X X – X X 21.1 S N/S
Amino acid
synthesis
Os02g50240.1 Gln synthetase 38 22.3 7.E-05 – X X 34 21.3 3.E-04 22.3 N/S 22
Os12g42884.1 MetSyn – X X – X X – X X 21.7 S 22 and N/S
Os12g42876.1 MetSyn 25 2.3 2.E-03 – X X 17 3.3 2.E-03 21.7 S X
Os12g42876.1 MetSyn 26 1.1 6.E-01 – X X 18 2.7 3.E-03 21.7 S X
Os03g06200.1 PSAT 5 4.7 9.E-07 5 6.5 1.E-03 – X X 1.7 N/S 5
Os03g06200.1 PSAT – X X 9 5.6 1.E-03 – X X 1.7 N/S 5
Os12g22030.1 SHMT 19 1.6 9.E-02 – X X 14 2.0 4.E-04 X X N/S
Os04g55720.1 3-PGDH 24 5.8 2.E-05 – X X 20 2.0 1.E-03 1.9 S 4
Os10g25130.1 Ala aminotransferase – X X 15 2.5 4.E-03 – X X X X N/S
Stress responsive Os07g44430.1 Peroxiredoxin 4 5.5 6.E-05 4 11.0 5.E-05 – X X 2.5 S 32
Os07g44430.1 Peroxiredoxin 3 3.4 2.E-03 3 22.7 1.E-06 – X X 2.5 S 32
Os05g25850.1 Manganese-superoxide dismutase 1 1.6 1.E-02 1 1.9 1.E-02 – X X 1.4 N/S N/S
Os03g17690.1 Ascorbate peroxidase 39 24.6 3.E-06 – X X 13 22.3 1.E-04 21.8 S N/S
Os07g49400.1 Ascorbate peroxidase – X X – X X – X X 21.9 S N/S
Os03g07180.1 Embryotic protein DC-8 – X X 10 3.5 4.E-05 – X X X X X
Os03g07180.1 Embryotic protein DC-8 – X X 11 3.9 3.E-05 – X X X X X
Os03g07180.1 Embryotic protein DC-8 – X X 12 3.6 4.E-05 – X X X X X
Os03g07180.1 Embryotic protein DC-8 – X X 13 4.7 1.E-04 – X X X X X
Os05g46480.1 LEA group 3 2 4.1 7.E-07 2 7.1 2.E-04 – X X X X 22
Os02g15250.1 LEA domain containing – X X 14 5.9 8.E-05 – X X – X X
Translation Os03g14530.1 S10/S20 ribosomal protein – X X – X X – X X 1.3 S 2
Os11g29190.1 40S ribosomal protein S5 – X X – X X – X X 21.3 S 2
Os03g08010.1 Elongation factor 1-a – X X – X X – X X 1.3 S N/S
Os01g52470.1 Elongation factor – X X – X X – X X 1.4 S X
Os02g32030.1 Elongation factor – X X – X X – X X 21.1 S N/S
Miscellaneous Os08g04210.1 Protein kinase – X X – X X – X X 3.2 S 1,007
Os08g04250.1 Protein kinase – X X – X X – X X 2.3 S 248
Os08g04240.1 Protein kinase – X X – X X – X X 2.8 S 525
Os04g56430.1 CRK5 – X X – X X – X X 21.9 S 3
Os01g03340.1 BBTI4 11 26.0 2.E-06 – X X – X X 21.9 S 23 and 22
Os01g03360.1 BBTI5 – X X – X X – X X 1.1 S 22
Os03g62060.1 IAA-amino acid hydrolase 36 25.3 3.E-04 17 24.6 6.E-03 32 21.0 4.E-01 23.0 S 2271
Os05g04510.1 S-Adenosyl-Met synthetase – X X – X X – X X 21.6 S N/S
Rice and Wheat Anoxia Responses
Plant Physiol. Vol. 156, 2011 1711 www.plant.org on June 17, 2014 - Published by www.plantphysiol.orgDownloaded from
Copyright © 2011 American Society of Plant Biologists. All rights reserved.

the direction of change for phosphoglucomutase(Os03g50480) between the DIGE and iTRAQ analyses.
We also identified two Suc synthase enzymes(Os03g28330, Os06g09450) that were significantly moreabundant in rice coleoptiles of anoxically germinatedseedlings (Table II). Our data agree with reports thatunder anoxia, there is a switch from invertase to Sucsynthase as a means of degrading Suc into sugars thatcan then enter the glycolytic pathway (Guglielminettiet al., 1995).
These observations reinforced the evidence for gen-eral enhancement of glycolysis and ethanolic fermen-tation for rice coleoptiles during adaptation to anoxiaand highlight the gene-specific identification of chang-ing proteins that would promote a Pasteur effect. Onlyabout two-thirds of the transcripts for these glycolyticproteins are transcriptionally more abundant underanoxia in rice (Lasanthi-Kudahettige et al., 2007). Butnotably, the decreased abundance of fructokinase 2 wasalso seen at the transcript level under anoxia (Table II).
Figure 2. Effect of prolonged anoxia on carbohydrate metabolism, glycolysis, fermentation, amino acid metabolism, and theTCA cycle in rice coleoptiles. Rice seeds were germinated and grown under anoxia for 6 d or aeration for 4 d. The green and redboxes represent metabolites significantly more abundant under aeration and anoxia, respectively (P , 0.05). The yellow boxesrepresent metabolites whose abundances are unchanged. Enzyme names on arrows are also colored in this fashion. The numberson the top left side of each box represent the response value (RV) of the corresponding metabolite (anoxic/aerated) in ricecoleoptiles. All data were extracted from Tables II and III. Metabolite abbreviations are as follows: DHAP, dihydroxyacetone-phosphate; GABA, g-aminobutyrate; G-3-P, glyceraldehyde-3-phosphate; PEP, phosphoenolpyruvate; 1,3-PGA, 1,3-bisphos-phoglycerate; 2-PGA, 2-phosphoglycerate; 3-PGA, 3-phosphoglycerate; SSA, succinic semialdehyde. Protein abbreviations areas follows: ADH, alcohol dehydrogenase; AlaAT, Ala aminotransferase; aldolase, Fru-bisP aldolase; FK, fructokinase; GAPDH,glyceraldehyde-3-phosphate dehydrogenase; GlnSyn, Gln synthetase; iPGAM, 2,3-bisphosphoglycerate-independent phos-phoglycerate mutase; MDH, malate dehydrogenase; MetSyn, 5-methyltetrahydropteroyltri-Glu-homo-Cys methyltransferase(cobalamin-independent Met synthase); PDC, pyruvate decarboxylase; PFK-PPi, PPi-Fru-6-P 1-phosphotransferase; 3-PGDH,D-3-phosphoglycerate dehydrogenase; PGK, phosphoglycerate kinase; PGM, phosphoglucomutase; PSAT, phospho-Ser amino-transferase; SHMT, Ser hydroxymethyltransferase; SS, Suc synthase; TPI, triosephosphate isomerase.
Shingaki-Wells et al.
1712 Plant Physiol. Vol. 156, 2011 www.plant.org on June 17, 2014 - Published by www.plantphysiol.orgDownloaded from
Copyright © 2011 American Society of Plant Biologists. All rights reserved.
Enzymes Involved in Amino Acid Metabolism
We identified several enzymes involved in the syn-thesis of Ser and Gly that increased in abundance underanoxic stress, notably, D-3-phosphoglycerate dehydro-genase (Os04g55720), phospho-Ser aminotransferase(Os03g06200), and Ser hydroxymethyltransferase(Os12g22030; Table II; Fig. 2). Ala aminotransferase 2(Os01g25130) was also more abundant in anoxic ricecoleoptiles. Gln synthetase root isozyme 3 (Os02g50240)was less abundant under anoxia when compared withaeration, and different isoforms of 5-methyltetrahy-dropteroyltri-Glu-homo-Cys methyltransferase (Metsynthase; Os12g42876 up in DIGE, Os12g42876/Os12g42884 down in iTRAQ) showed discrepancies intheir direction of change. Met generation is particu-larly interesting, as this amino acid is involved in thesynthesis of ethylene, a plant hormone involved insubmergence-induced gene expression (Fukao et al.,2006; Xu et al., 2006). With the exception of 6-d anoxiasamples that showed anoxic accumulation, Met tendedtoward a higher abundance under aerobic conditionsin rice (Table III). The enzyme involved in the firststep of ethylene production, S-adenosyl-Met synthase(Os05g04510), was also detected in our iTRAQ analy-sis (Table II). However, it was significantly less abun-dant in coleoptiles of anoxically germinated rice, anobservation in line with the oxygen dependence of theethylene biosynthetic pathway.
Enzymes or Proteins Involved in Reactive OxygenSpecies Detoxification
Reactive oxygen species (ROS) play an important rolein signaling under oxygen deficiency (Baxter-Burrellet al., 2002; Bailey-Serres and Chang, 2005). We iden-tified several proteins involved in ROS degradationthat changed in abundance. As examples, peroxire-doxin (Os07g44430) was significantly more abundantin rice coleoptiles derived from 6-d-old anoxic seed-lings than in 4-d-old aerated seedlings (Table II). Inconcordance, the transcript for this gene was 32-foldhigher in abundance in anoxic rice coleoptiles (Lasanthi-Kudahettige et al., 2007). Peroxiredoxin is an antioxidantenzyme that can reduce both hydrogen peroxide (H2O2)and alkyl hydroperoxides. In contrast, we identifiedanother H2O2-decomposing enzyme, ascorbate peroxi-dase (Os03g17690, Os07g49400), that was less abundantin anoxic coleoptiles (Table II). The Bowman-Birk-typetrypsin inhibitor (BBTI; Os01g03340) found to decreasein abundance under anoxia may have other functionsbeyond its role in proteolysis. BBTIs have been re-ported to act as monodehydroascorbate reductasesand dehydroascorbate reductases in etiolated mungbean (Vigna radiata) seedlings (Hou et al., 2000) androots of sweet potato (Ipomoea batatas; Hou and Lin,1997) and thus can be involved in the regeneration ofascorbate. These results suggest that rice coleoptilesmay use different detoxification systems under anoxia/hypoxia and reaeration from those used during con-tinual aeration. It has been reported that anoxia can
cause an increase in H2O2 in the rice root apoplast andplasma membrane (Blokhina et al., 2001), suggesting aprotective function of these antioxidant defense en-zymes in anoxic rice coleoptiles. However, we havepreviously measured markers for lipid oxidation anddemonstrated that damage was lower in anoxic cole-optiles relative to aerobic or reoxygenated coleoptiles(Millar et al., 2004), suggesting that either (1) oxidativestress under anoxia is minimal and that peroxiredoxinhas a protective role upon the return of oxygen or (2)peroxiredoxin has a function under anoxia that wehave not anticipated. The former seems more likely,given that oxygen is necessary for the formation ofROS. Interestingly, manganese-superoxide dismutasewas detected in two DIGE analyses, and althoughstatistically significant in its accumulation under 6 d ofanoxia (P , 0.05), manganese-superoxide dismutasedid not meet all of the criteria set for significance;specifically, the abundance change did not exceed 2(Table II), indicating the quantitatively differential roleof peroxiredoxin in responding to the availability ofoxygen. What is clear from the literature is that oxygendeprivation perturbs the redox status of cells, whetherit be ROS levels (Blokhina et al., 2001), oxidative damage(Blokhina et al., 1999; Millar et al., 2004), or regulationof genes and small-molecule antioxidants involved inredox regulation (Yan et al., 1996; Biemelt et al., 1998;Blokhina et al., 2000, 2003; van Dongen et al., 2009).
Proteins Involved in the Process of Translation
Selective translation of cytoplasmic mRNAs in plantsunder oxygen deficiency has been discussed (Bailey-Serres, 1999).We identified several proteins in the iTRAQanalysis involved in translation processes, which weremore abundant in 6-d-old anoxic coleoptiles relativeto the control. Those proteins were elongation factor1-a (Os03g08010), elongation factor 2 (Os01g52470),and S10/S20 domain-containing ribosomal protein(Os03g14530; Table II). Others involved in translationthat were less abundant under anoxia were 40S ribo-somal protein S5 (Os11g29190) and elongation factor(Os02g32030). Whether these abundance changes inthe translational machinery are responsible for theperturbations in the levels of glycolytic, amino acidbiosynthetic, and ROS-defense proteins is currentlyunknown.
Other Proteins of Interest
The lower abundance of indole-3-acetic acid (IAA)-amino acid hydrolase precursor (ILR1; Os03g62060)we report under anoxia can be related to a long historyof research on auxin-regulated coleoptile elongationdating back to the famous experiment of Went (1942).The IAA-amino acid hydrolase is involved in thecleavage of conjugates between IAA and amino acids(Bartel and Fink, 1995). The dramatic decrease of ILR1(Table II) could indicate that IAA is maintained in itsconjugate form under anoxia. Microarray data also
Rice and Wheat Anoxia Responses
Plant Physiol. Vol. 156, 2011 1713 www.plant.org on June 17, 2014 - Published by www.plantphysiol.orgDownloaded from
Copyright © 2011 American Society of Plant Biologists. All rights reserved.
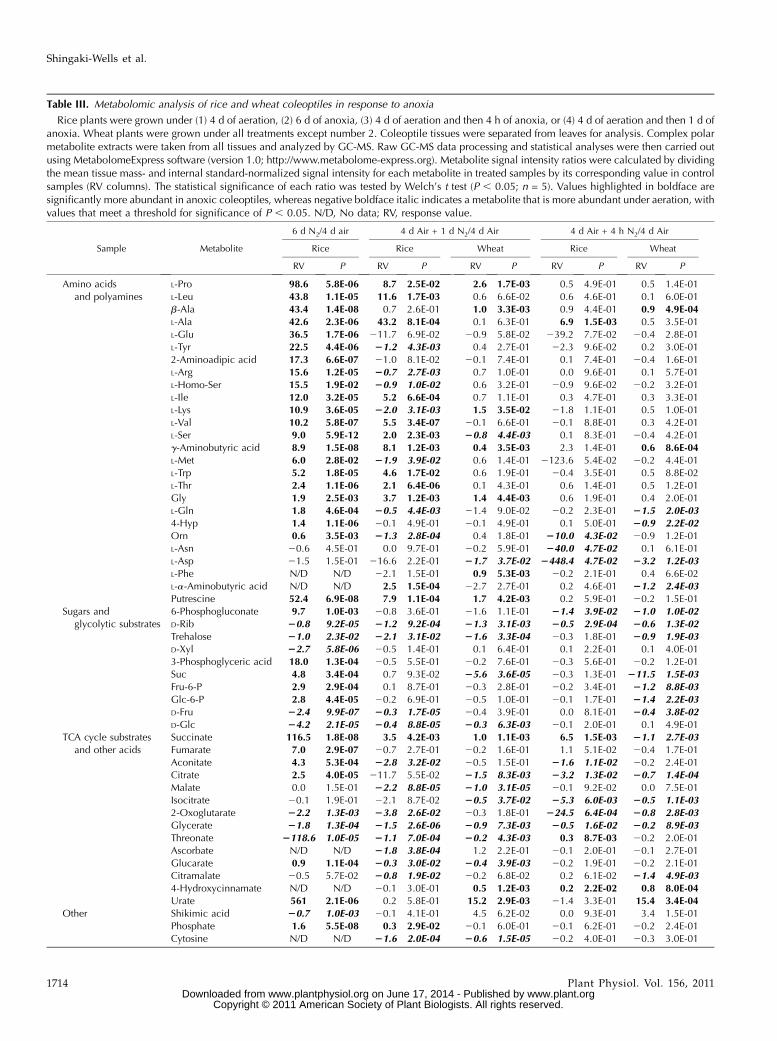
Table III. Metabolomic analysis of rice and wheat coleoptiles in response to anoxia
Rice plants were grown under (1) 4 d of aeration, (2) 6 d of anoxia, (3) 4 d of aeration and then 4 h of anoxia, or (4) 4 d of aeration and then 1 d ofanoxia. Wheat plants were grown under all treatments except number 2. Coleoptile tissues were separated from leaves for analysis. Complex polarmetabolite extracts were taken from all tissues and analyzed by GC-MS. Raw GC-MS data processing and statistical analyses were then carried outusing MetabolomeExpress software (version 1.0; http://www.metabolome-express.org). Metabolite signal intensity ratios were calculated by dividingthe mean tissue mass- and internal standard-normalized signal intensity for each metabolite in treated samples by its corresponding value in controlsamples (RV columns). The statistical significance of each ratio was tested by Welch’s t test (P , 0.05; n = 5). Values highlighted in boldface aresignificantly more abundant in anoxic coleoptiles, whereas negative boldface italic indicates a metabolite that is more abundant under aeration, withvalues that meet a threshold for significance of P , 0.05. N/D, No data; RV, response value.
Sample Metabolite
6 d N2/4 d air 4 d Air + 1 d N2/4 d Air 4 d Air + 4 h N2/4 d Air
Rice Rice Wheat Rice Wheat
RV P RV P RV P RV P RV P
Amino acids
and polyamines
L-Pro 98.6 5.8E-06 8.7 2.5E-02 2.6 1.7E-03 0.5 4.9E-01 0.5 1.4E-01
L-Leu 43.8 1.1E-05 11.6 1.7E-03 0.6 6.6E-02 0.6 4.6E-01 0.1 6.0E-01
b-Ala 43.4 1.4E-08 0.7 2.6E-01 1.0 3.3E-03 0.9 4.4E-01 0.9 4.9E-04
L-Ala 42.6 2.3E-06 43.2 8.1E-04 0.1 6.3E-01 6.9 1.5E-03 0.5 3.5E-01
L-Glu 36.5 1.7E-06 211.7 6.9E-02 20.9 5.8E-02 239.2 7.7E-02 20.4 2.8E-01
L-Tyr 22.5 4.4E-06 21.2 4.3E-03 0.4 2.7E-01 22.3 9.6E-02 0.2 3.0E-01
2-Aminoadipic acid 17.3 6.6E-07 21.0 8.1E-02 20.1 7.4E-01 0.1 7.4E-01 20.4 1.6E-01
L-Arg 15.6 1.2E-05 20.7 2.7E-03 0.7 1.0E-01 0.0 9.6E-01 0.1 5.7E-01
L-Homo-Ser 15.5 1.9E-02 20.9 1.0E-02 0.6 3.2E-01 20.9 9.6E-02 20.2 3.2E-01
L-Ile 12.0 3.2E-05 5.2 6.6E-04 0.7 1.1E-01 0.3 4.7E-01 0.3 3.3E-01L-Lys 10.9 3.6E-05 22.0 3.1E-03 1.5 3.5E-02 21.8 1.1E-01 0.5 1.0E-01
L-Val 10.2 5.8E-07 5.5 3.4E-07 20.1 6.6E-01 20.1 8.8E-01 0.3 4.2E-01
L-Ser 9.0 5.9E-12 2.0 2.3E-03 20.8 4.4E-03 0.1 8.3E-01 20.4 4.2E-01
g-Aminobutyric acid 8.9 1.5E-08 8.1 1.2E-03 0.4 3.5E-03 2.3 1.4E-01 0.6 8.6E-04
L-Met 6.0 2.8E-02 21.9 3.9E-02 0.6 1.4E-01 2123.6 5.4E-02 20.2 4.4E-01
L-Trp 5.2 1.8E-05 4.6 1.7E-02 0.6 1.9E-01 20.4 3.5E-01 0.5 8.8E-02
L-Thr 2.4 1.1E-06 2.1 6.4E-06 0.1 4.3E-01 0.6 1.4E-01 0.5 1.2E-01
Gly 1.9 2.5E-03 3.7 1.2E-03 1.4 4.4E-03 0.6 1.9E-01 0.4 2.0E-01
L-Gln 1.8 4.6E-04 20.5 4.4E-03 21.4 9.0E-02 20.2 2.3E-01 21.5 2.0E-03
4-Hyp 1.4 1.1E-06 20.1 4.9E-01 20.1 4.9E-01 0.1 5.0E-01 20.9 2.2E-02
Orn 0.6 3.5E-03 21.3 2.8E-04 0.4 1.8E-01 210.0 4.3E-02 20.9 1.2E-01
L-Asn 20.6 4.5E-01 0.0 9.7E-01 20.2 5.9E-01 240.0 4.7E-02 0.1 6.1E-01
L-Asp 21.5 1.5E-01 216.6 2.2E-01 21.7 3.7E-02 2448.4 4.7E-02 23.2 1.2E-03
L-Phe N/D N/D 22.1 1.5E-01 0.9 5.3E-03 20.2 2.1E-01 0.4 6.6E-02
L-a-Aminobutyric acid N/D N/D 2.5 1.5E-04 22.7 2.7E-01 0.2 4.6E-01 21.2 2.4E-03
Putrescine 52.4 6.9E-08 7.9 1.1E-04 1.7 4.2E-03 0.2 5.9E-01 20.2 1.5E-01
Sugars and
glycolytic substrates
6-Phosphogluconate 9.7 1.0E-03 20.8 3.6E-01 21.6 1.1E-01 21.4 3.9E-02 21.0 1.0E-02
D-Rib 20.8 9.2E-05 21.2 9.2E-04 21.3 3.1E-03 20.5 2.9E-04 20.6 1.3E-02
Trehalose 21.0 2.3E-02 22.1 3.1E-02 21.6 3.3E-04 20.3 1.8E-01 20.9 1.9E-03D-Xyl 22.7 5.8E-06 20.5 1.4E-01 0.1 6.4E-01 0.1 2.2E-01 0.1 4.0E-01
3-Phosphoglyceric acid 18.0 1.3E-04 20.5 5.5E-01 20.2 7.6E-01 20.3 5.6E-01 20.2 1.2E-01
Suc 4.8 3.4E-04 0.7 9.3E-02 25.6 3.6E-05 20.3 1.3E-01 211.5 1.5E-03
Fru-6-P 2.9 2.9E-04 0.1 8.7E-01 20.3 2.8E-01 20.2 3.4E-01 21.2 8.8E-03
Glc-6-P 2.8 4.4E-05 20.2 6.9E-01 20.5 1.0E-01 20.1 1.7E-01 21.4 2.2E-03
D-Fru 22.4 9.9E-07 20.3 1.7E-05 20.4 3.9E-01 0.0 8.1E-01 20.4 3.8E-02
D-Glc 24.2 2.1E-05 20.4 8.8E-05 20.3 6.3E-03 20.1 2.0E-01 0.1 4.9E-01
TCA cycle substrates
and other acids
Succinate 116.5 1.8E-08 3.5 4.2E-03 1.0 1.1E-03 6.5 1.5E-03 21.1 2.7E-03
Fumarate 7.0 2.9E-07 20.7 2.7E-01 20.2 1.6E-01 1.1 5.1E-02 20.4 1.7E-01
Aconitate 4.3 5.3E-04 22.8 3.2E-02 20.5 1.5E-01 21.6 1.1E-02 20.2 2.4E-01
Citrate 2.5 4.0E-05 211.7 5.5E-02 21.5 8.3E-03 23.2 1.3E-02 20.7 1.4E-04
Malate 0.0 1.5E-01 22.2 8.8E-05 21.0 3.1E-05 20.1 9.2E-02 0.0 7.5E-01
Isocitrate 20.1 1.9E-01 22.1 8.7E-02 20.5 3.7E-02 25.3 6.0E-03 20.5 1.1E-03
2-Oxoglutarate 22.2 1.3E-03 23.8 2.6E-02 20.3 1.8E-01 224.5 6.4E-04 20.8 2.8E-03
Glycerate 21.8 1.3E-04 21.5 2.6E-06 20.9 7.3E-03 20.5 1.6E-02 20.2 8.9E-03
Threonate 2118.6 1.0E-05 21.1 7.0E-04 20.2 4.3E-03 0.3 8.7E-03 20.2 2.0E-01
Ascorbate N/D N/D 21.8 3.8E-04 1.2 2.2E-01 20.1 2.0E-01 20.1 2.7E-01
Glucarate 0.9 1.1E-04 20.3 3.0E-02 20.4 3.9E-03 20.2 1.9E-01 20.2 2.1E-01Citramalate 20.5 5.7E-02 20.8 1.9E-02 20.2 6.8E-02 0.2 6.1E-02 21.4 4.9E-03
4-Hydroxycinnamate N/D N/D 20.1 3.0E-01 0.5 1.2E-03 0.2 2.2E-02 0.8 8.0E-04
Urate 561 2.1E-06 0.2 5.8E-01 15.2 2.9E-03 21.4 3.3E-01 15.4 3.4E-04
Other Shikimic acid 20.7 1.0E-03 20.1 4.1E-01 4.5 6.2E-02 0.0 9.3E-01 3.4 1.5E-01
Phosphate 1.6 5.5E-08 0.3 2.9E-02 20.1 6.0E-01 20.1 6.2E-01 20.2 2.4E-01
Cytosine N/D N/D 21.6 2.0E-04 20.6 1.5E-05 20.2 4.0E-01 20.3 3.0E-01
Shingaki-Wells et al.
1714 Plant Physiol. Vol. 156, 2011 www.plant.org on June 17, 2014 - Published by www.plantphysiol.orgDownloaded from
Copyright © 2011 American Society of Plant Biologists. All rights reserved.

suggest that the transcript of this protein was dramat-ically down-regulated (271-fold) in anoxic rice coleop-tiles (Lasanthi-Kudahettige et al., 2007). This supportsthe observation that auxin-binding activities were de-creased in anoxic coleoptiles (Mapelli and Locatelli,1995) and that there was no synergistic effect of IAA andanaerobiosis on rice coleoptile elongation (Pegoraroet al., 1988). The repressive effect of anoxia on auxin-related genes has also been observed in Arabidopsisthrough a global gene expression analysis (Loreti et al.,2005).Also of interest was the finding that several proteins
with unknown functions accumulated under anoxia.These proteins are annotated as protein kinases thatcontain the domain of unknown function 26. Theirtranscript fold increases under anoxia range from 248-to 1,007-fold (Os08g04250, Os08g04210, Os08g04240;Lasanthi-Kudahettige et al., 2007). In addition, theArabidopsis ortholog (At5g48540; Supplemental TableS3) is up-regulated in response to 2 and 9 h of hypoxiaboth within the total and polysomal mRNA pools ofArabidopsis seedlings (Branco-Price et al., 2008). Nota-bly, we found anoxic accumulation of two group 3 lateembryogenesis abundant proteins (LEA; Os05g46480,Os02g15250) as well as embryonic protein DC-8(Os03g07180). LEAs are hydrophilic unstructured pro-teins rich in Gly, Ala, and Ser (Baker et al., 1988;Campos et al., 2006). It has been reported that a LEAprotein (Os04g52110) accumulates in anoxic rice em-bryos (Howell et al., 2007), and other groups havedemonstrated the inducibility of GUS reporters whenfused to a carrot (Daucus carota) group 3 LEA promoterunder hypoxia, salinity, and dehydration (Siddiquiet al., 1998). Recently, it was shown that SUB1A in-creased the accumulation of transcripts encoding forproteins involved in dehydration tolerance. Most in-terestingly, the LEA3 transcript level increased to agreater degree during desubmergence in M202(Sub1)rice relative to wild-type M202 (Fukao et al., 2011).This is especially interesting given that dehydration is astress inherent to desubmergence. This LEA3 transcriptactually showed a decrease during submergence, achange in opposition to what we have found. This maybe attributable to the use of different cultivars, themeasurement of transcript levels and not proteinabundance levels, and that submergence and anoxiaare not perfectly comparable. Despite these differences,in our experimental system, it is tempting to speculatethat LEA up-regulation is a response that provides aprotective and anticipatory function for when plantsreturn to air. Clearly, LEAs are stress responsive; how-ever, the role of these proteins in anoxic environmentsawaits further insights into their molecular function.
Metabolomic Analysis Reveals a Greater Response toAnoxia in Rice Than in Wheat Coleoptiles
To investigate the impact of the changes in primarymetabolism on metabolite pools, we considered theoverall changes in the gas chromatography-mass spec-
trometry (GC-MS) profiles of primary metabolites inwheat and rice coleoptiles exposed to anoxia. Consis-tent with the physiological and proteomic data, therewere dramatic differences in metabolite profiles be-tween rice coleoptiles derived from 4-d-old aeratedand 6-d-old anoxic seedlings, with very high accumu-lation of amino acids under anoxia (Table III; Fig. 2).Many of these responses were also observed in ricecoleoptiles that were switched to anoxia for 1 d, al-though these tended to be considerably more subtle(Table III; Fig. 3).
A number of major differences observed in 6-d-oldanoxic seedling coleoptiles relative to 4-d-old aerobicseedling coleoptiles were not observed at all as re-sponses in switched seedling coleoptiles (e.g. 17- to45-fold increases in 3-phosphoglycerate, b-Ala, and2-aminoadipate and a remarkable 560-fold increase inurate; Supplemental Table S7). Moreover, some me-tabolites responded in opposite directions to the twotreatments (e.g. Arg, homo-Ser, Lys, and Tyr; Supple-mental Table S7). These discrepancies are consistentwith oxygen-dependent biogenesis of cellular com-ponents involved in the regulation of thesemetabolitesin rice.
The wheat coleoptile metabolite profile also respondedto anoxia (Table III; Fig. 3; Supplemental Table S4). Certainfeatures were found to be common to responses ofwheat and rice coleoptiles to 1-d anoxic transfer. Theseincluded accumulations of g-aminobutyrate, Gly, Ile,Pro, Thr, succinate, and putrescine and decreases inAsp, Fru, Rib, trehalose, citrate, isocitrate, citramalate,glucarate, malate, glycerate, threonate, and cytosine(Table III; Supplemental Table S5). However, in wheat,these responses tended to be much less pronouncedthan those observed in anoxically switched rice cole-optiles (Table III; Fig. 3).
While some metabolite responses to the 1-d anoxicshift were common to both species (Fig. 3; Table III),we did identify a number of species-specific responsesthat may be linked to the differential anoxia toleranceof these species (Supplemental Tables S5 and S6). Rice-specific responses included moderate to strong in-creases in Ser, Ala, Leu, and Trp and decreases in Arg,Met, Tyr, Orn, 6-phosphogluconate, and aconitate (withthe aconitate response being themost consistently strongbetween experiments). Wheat-specific responses in-cluded moderate increases in b-Ala, 4-hydroxycinna-mate, and shikimate, strong increases in urate, andmoderate decreases in 4-Hyp and Suc. Interestingly, asmall number of metabolites responded moderatelystrongly in opposite directions between the two spe-cies. For example, a-aminobutyrate and phosphate in-creased in rice while decreasing in wheat; conversely,Lys, Phe, Xyl, and ascorbate decreased in rice whileincreasing in wheat. The distinctive and significantaccumulation of Ala and Ser in rice was consistent withour evidence of increased abundance of enzymes inthese pathways in rice (Fig. 3).
Surprisingly, L-Ala did not significantly differ inabundance between control and anoxically switched
Rice and Wheat Anoxia Responses
Plant Physiol. Vol. 156, 2011 1715 www.plant.org on June 17, 2014 - Published by www.plantphysiol.orgDownloaded from
Copyright © 2011 American Society of Plant Biologists. All rights reserved.

wheat coleoptiles (Table III), contradictory to a previ-ous report where Ala levels accumulated in wheatshoots to the same degree as that of rice shoots after 8 hof anoxia (Menegus et al., 1989) as well as a range ofreports from other species (van Dongen et al., 2009;Narsai et al., 2011). Such a difference might be ex-plained by differences in the experimental system, thespecific dissection of the coleoptile tissue used in thisreport, or the timing of the amino acid accumulation.For example, accumulation of Ala in roots of Arabi-dopsis was found by treatment with 48 h of 4% and 8%oxygen but not when the concentration of oxygen wasreduced to 1% (van Dongen et al., 2009). To considerthe last of these, we repeatedmetabolite profiling at 4 hafter the switch to anoxia in both rice and wheat, but
again we saw an increase in L-Ala in rice but not inwheat (Table III).
In addition to changes in amino acids, variations inintermediates in the tricarboxylic acid (TCA) cyclewere also observed. In the TCA cycle, the step con-verting succinate into fumarate by succinate dehydro-genase requires the operation of an electron transportchain and reduction of oxygen to water. Withoutoxygen, the TCA cycle will stop at succinate dehydro-genase and succinate will accumulate, as we observedin both rice and wheat coleoptiles (Table III; Fig. 3) andas other studies have reported (Menegus et al., 1991;Fan et al., 1997; Rocha et al., 2010). This claim was alsosupported by the decrease in other TCA cycle inter-mediates such as malate and citrate in both anoxically
Figure 3. Effect of a 1-d anoxic switch on carbohydrate metabolism, glycolysis, fermentation, amino acid metabolism, and theTCA cycle in rice and wheat coleoptiles. Rice and wheat seeds were germinated and grown under aeration for 4 d or for 4 d witha switch to 1 d of anoxia. Green or red boxes represent metabolites significantly more abundant during aeration or the anoxicswitch, respectively (P, 0.05). The yellow boxes represent metabolites whose abundances are unchanged. Enzyme names thataccompany arrows are also colored in this fashion for the rice response only (anoxia-responsive proteins were not identified inwheat). The numbers on the top left and right side of each square represent the response value (RV) of the correspondingmetabolite (anoxia/aeration) in rice and wheat coleoptiles, respectively. All data were extracted from Tables II and III. (Forabbreviations, see Fig. 2 legend).
Shingaki-Wells et al.
1716 Plant Physiol. Vol. 156, 2011 www.plant.org on June 17, 2014 - Published by www.plantphysiol.orgDownloaded from
Copyright © 2011 American Society of Plant Biologists. All rights reserved.

switched cereals, yet it was contradicted when observ-ing 6-d-old anoxic rice coleoptiles (Table III; Figs. 2 and3) and suggests that the other intermediates in theTCA cycle were utilized under anoxia. The advantageof the accumulation of succinate under anoxia hasbeen widely discussed in the context of the extra ATPproduction that can result (Gibbs and Greenway, 2003;Bailey-Serres and Voesenek, 2008; Rocha et al., 2010).Under prolonged anoxia, higher abundances of Suc,
Glc-6-P, and Fru-6-P in rice coleoptiles were observed(Table III; Fig. 3). Rice coleoptiles treated with shorterperiods of anoxia (24 or 4 h) revealed no significantdifferences in these sugars between stress and controltreatments. In wheat, however, a 4-h anoxic treatmentresulted in significant decreases in all three sugars,and the 24-h treatment resulted in a decrease of Suc(Table III; Fig. 3). Decreases in the levels of the trans-portable sugar Suc as well as decreases in glycolyticintermediates might be indicative of a delayed transi-tion to anaerobic metabolism in wheat when com-pared with rice.
Database-Driven Metabolic Phenotype Analysis RevealsConserved and Divergent Responses to Low Oxygen in
Rice and Wheat
Having established that wheat and rice coleoptilesdisplay differential responses to oxygen deprivation, wethought it would be informative to compare these re-sponses with those previously observed in other species.To this end, we used the PhenoMeter tool ofMetabolome-Express (https://www.metabolome-express.org; fordetails, see “Materials and Methods”) to search theMetabolomeExpress database of metabolic pheno-types, MetaPhenDB (see “Materials and Methods”),for previously reported metabolic phenotypes of sta-tistically significant qualitative overlap (codirectionalresponses) or inverse overlap (opposite direction re-sponses) with the rice and wheat responses to anoxiathat we report.As expected, the metabolic responses of rice and
wheat coleoptiles to anoxic transfer retrieved signifi-cant hits (P , 0.05; Fisher’s exact test) to a number ofpreviously reported responses to oxygen deprivation(Gibon et al., 2002; Narsai et al., 2009, 2011; Rocha et al.,2010; summarized in Supplemental Table S9) whileretrieving very few matches to any of the many otherfunctionally less closely related metabolic responses inthe MetaPhenDB database (for detailed results, in-cluding Fisher’s exact test P values, see SupplementalTable S9). In addition, a number of species-specificpositive and negative hits were also observed to di-verse treatments (Supplemental Table S8). For exam-ple, rice gave highly significant positive hits to theresponses of Arabidopsis cell suspensions to inhibi-tion of the mitochondrial electron transport chaincomplex I (Garmier et al., 2008), while wheat did notgive any significant hits to this phenotype. Conversely,only wheat gave significant positive hits to low-oxygenresponses of potato (Solanum tuberosum) tubers
(Geigenberger et al., 2000), castor bean (Ricinus com-munis) phloem (van Dongen et al., 2003), or the sulfurdepletion-mediated hypoxia response of the Chlamy-domonas reinhardtii stm6 mutant (Timmins et al., 2009;Supplemental Table S8). In two cases, waterloggingof Populus 3 canescens roots (Kreuzwieser et al., 2009)and low-oxygen treatment of Arabidopsis roots (vanDongen et al., 2009), rice gave positive hits whilewheat gave inverse hits (Supplemental Table S8), in-dicating significant divergence between rice and wheatin metabolites that define these responses. Given thelarge difference that these two species display in theirresponses to anoxia at the metabolite level, we wantedto consider whether the ability to generate a particularmetabolite pool contributes to anoxia tolerance and weset out to test this hypothesis.
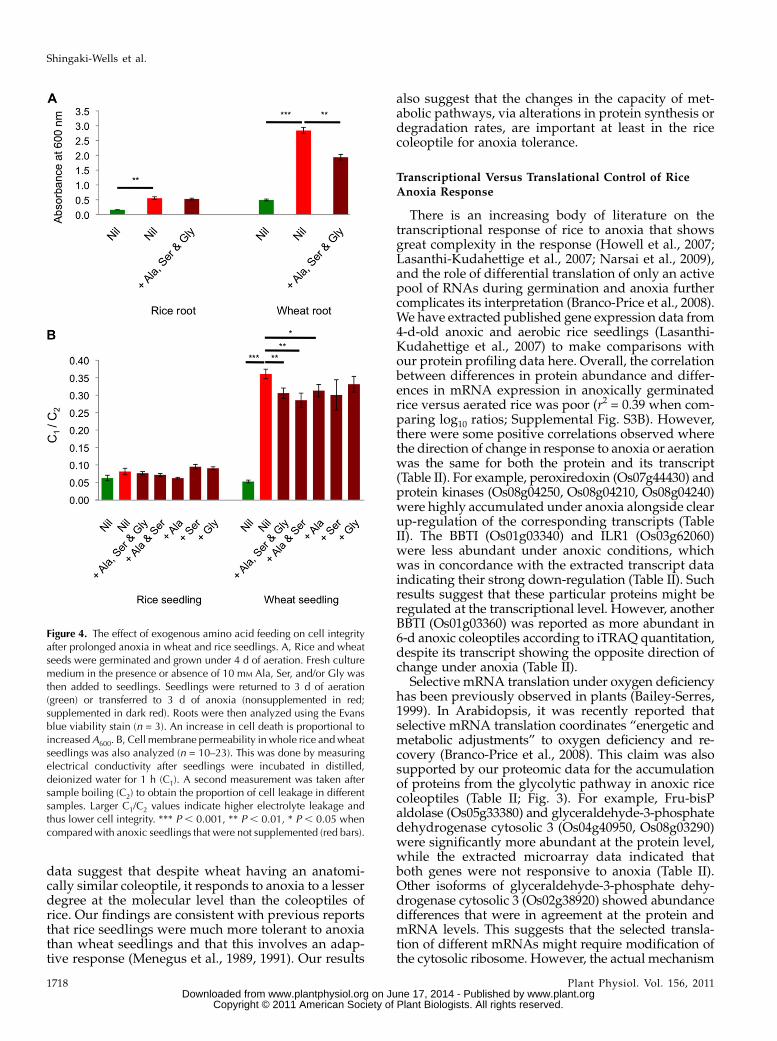
Amino Acid-Induced Improvement of Cell Integrity inWheat under Anoxia
A range of reports in mammalian cells have high-lighted that exogenous addition of Gly, Ser, and/orAla can enhance the survival of cells to oxygen dep-rivation (Brecht and Groot, 1994; Tijsen et al., 1997;Wang et al., 2010). To test whether the differentialaccumulation of these amino acids could be part ofplant anoxia tolerance and to define the functionalimportance of the divergence of rice and wheat met-abolic responses to anoxia, we supplemented themedium used for rice and wheat growth under anoxia.We supplemented with a combination of amino acidsand assessed plant performance with the Evans blueroot cell viability assay after 3 d in anoxia (Fig. 4A).This showed that amino acid supplementation signif-icantly increased cell viability in wheat but not in riceroots, consistent with the differential accumulation ofthese amino acids in rice. To confirm this finding fromwhole wheat seedlings, we used the measurement ofelectrical conductivity as a direct indicator of electro-lyte leakage, and thus cell integrity, from anoxicallytreated seedlings in the presence or absence of thesethree amino acids in several different combinations(Fig. 4B). This showed that the combination of Ser/Ala/Gly significantly lowered electrolyte leakage, asdid Ser/Ala, but the presence of only one of the aminoacids did not protect wheat seedlings from electrolyteleakage (P , 0.01). We also confirmed the absence ofthis positive effect in anoxia-tolerant rice seedlings. Thissuggests that the disparity between rice and wheatmetabolite pool responses (Fig. 3) may contribute to thedegree of anoxia tolerance and that partial generation ofthese pools (via exogenous supplementation) in sensi-tive plants can improve cellular integrity.
DISCUSSION
We have analyzed the differential responses of co-leoptiles from rice and wheat seedlings to anoxia at thephysiological, metabolomic, and proteomic levels. Our
Rice and Wheat Anoxia Responses
Plant Physiol. Vol. 156, 2011 1717 www.plant.org on June 17, 2014 - Published by www.plantphysiol.orgDownloaded from
Copyright © 2011 American Society of Plant Biologists. All rights reserved.
data suggest that despite wheat having an anatomi-cally similar coleoptile, it responds to anoxia to a lesserdegree at the molecular level than the coleoptiles ofrice. Our findings are consistent with previous reportsthat rice seedlings were much more tolerant to anoxiathan wheat seedlings and that this involves an adap-tive response (Menegus et al., 1989, 1991). Our results
also suggest that the changes in the capacity of met-abolic pathways, via alterations in protein synthesis ordegradation rates, are important at least in the ricecoleoptile for anoxia tolerance.
Transcriptional Versus Translational Control of RiceAnoxia Response
There is an increasing body of literature on thetranscriptional response of rice to anoxia that showsgreat complexity in the response (Howell et al., 2007;Lasanthi-Kudahettige et al., 2007; Narsai et al., 2009),and the role of differential translation of only an activepool of RNAs during germination and anoxia furthercomplicates its interpretation (Branco-Price et al., 2008).We have extracted published gene expression data from4-d-old anoxic and aerobic rice seedlings (Lasanthi-Kudahettige et al., 2007) to make comparisons withour protein profiling data here. Overall, the correlationbetween differences in protein abundance and differ-ences in mRNA expression in anoxically germinatedrice versus aerated rice was poor (r2 = 0.39 when com-paring log10 ratios; Supplemental Fig. S3B). However,there were some positive correlations observed wherethe direction of change in response to anoxia or aerationwas the same for both the protein and its transcript(Table II). For example, peroxiredoxin (Os07g44430) andprotein kinases (Os08g04250, Os08g04210, Os08g04240)were highly accumulated under anoxia alongside clearup-regulation of the corresponding transcripts (TableII). The BBTI (Os01g03340) and ILR1 (Os03g62060)were less abundant under anoxic conditions, whichwas in concordance with the extracted transcript dataindicating their strong down-regulation (Table II). Suchresults suggest that these particular proteins might beregulated at the transcriptional level. However, anotherBBTI (Os01g03360) was reported as more abundant in6-d anoxic coleoptiles according to iTRAQ quantitation,despite its transcript showing the opposite direction ofchange under anoxia (Table II).
Selective mRNA translation under oxygen deficiencyhas been previously observed in plants (Bailey-Serres,1999). In Arabidopsis, it was recently reported thatselective mRNA translation coordinates “energetic andmetabolic adjustments” to oxygen deficiency and re-covery (Branco-Price et al., 2008). This claim was alsosupported by our proteomic data for the accumulationof proteins from the glycolytic pathway in anoxic ricecoleoptiles (Table II; Fig. 3). For example, Fru-bisPaldolase (Os05g33380) and glyceraldehyde-3-phosphatedehydrogenase cytosolic 3 (Os04g40950, Os08g03290)were significantly more abundant at the protein level,while the extracted microarray data indicated thatboth genes were not responsive to anoxia (Table II).Other isoforms of glyceraldehyde-3-phosphate dehy-drogenase cytosolic 3 (Os02g38920) showed abundancedifferences that were in agreement at the protein andmRNA levels. This suggests that the selected transla-tion of different mRNAs might require modification ofthe cytosolic ribosome. However, the actual mechanism
Figure 4. The effect of exogenous amino acid feeding on cell integrityafter prolonged anoxia in wheat and rice seedlings. A, Rice and wheatseeds were germinated and grown under 4 d of aeration. Fresh culturemedium in the presence or absence of 10 mM Ala, Ser, and/or Gly wasthen added to seedlings. Seedlings were returned to 3 d of aeration(green) or transferred to 3 d of anoxia (nonsupplemented in red;supplemented in dark red). Roots were then analyzed using the Evansblue viability stain (n = 3). An increase in cell death is proportional toincreasedA600. B, Cell membrane permeability in whole rice andwheatseedlings was also analyzed (n = 10–23). This was done by measuringelectrical conductivity after seedlings were incubated in distilled,deionized water for 1 h (C1). A second measurement was taken aftersample boiling (C2) to obtain the proportion of cell leakage in differentsamples. Larger C1/C2 values indicate higher electrolyte leakage andthus lower cell integrity. *** P , 0.001, ** P , 0.01, * P , 0.05 whencomparedwith anoxic seedlings that were not supplemented (red bars).
Shingaki-Wells et al.
1718 Plant Physiol. Vol. 156, 2011 www.plant.org on June 17, 2014 - Published by www.plantphysiol.orgDownloaded from
Copyright © 2011 American Society of Plant Biologists. All rights reserved.
of selective translation in plants remains unknown.Matching of the rice genes studied here to their Arabi-dopsis orthologs showed no apparent correlation be-tween the rice proteins, whose abundance was notreflected in rice transcript data, and the ribosomalloading of orthologous mRNA under anoxia in Arabi-dopsis (Supplemental Table S3). Exceptions includesome proteins with unknown functions as well asclassical anaerobic proteins.Alternatively, difference in protein abundance be-
tween treatments could be accounted for by alterationsof the rate of synthesis and/or degradation of eachprotein. The abundance of cytosolic ascorbate perox-idase (Os03g17690) was significantly decreased with-out any apparent change in gene expression (Table II),suggesting that the translation of this gene was in-hibited by some downstream consequence of anoxia orthat this protein underwent selective degradation. Themechanism of selective protein degradation under an-oxia also deserves further investigation. Because thewheat coleoptile proteome was largely unchangedeven after 24 h of anoxia (Fig. 1C), selective mRNAtranslation or protein degradation might not be occur-ring as frequently in this species as is apparent in ricecoleoptiles. The consequence of a smaller upstreamresponse for the regulation of translation and proteinturnover in wheat coleoptiles under anoxia was alsoreflected in metabolic and physiological responses.
Amino Acid Metabolism Is Perturbed during Anoxia
The accumulation of amino acids in anoxic rice andwheat coleoptiles is consistentwith thewell-documentedobservation of this phenomenon when plants are ex-posed to differing degrees of oxygen deprivation (Fanet al., 1997; Kato-Noguchi and Ohashi, 2006; Narsaiet al., 2009; van Dongen et al., 2009; Rocha et al., 2010).We also detected the accumulation of enzymes involvedin Ala, Ser, and Gly biosynthesis concomitant with theaccumulation of those amino acids (Fig. 2). The pro-posed benefit of the accumulation of Ala under oxygendeprivation in different plant species has been dis-cussed in detail (Gibbs and Greenway, 2003; Bailey-Serres and Voesenek, 2008). Also, Ala synthesis throughAla aminotransferase 2 does not contribute to the oxi-dation of NADH, as does lactate or ethanol produc-tion, but rather serves as a retainable carbon sourceupon return to air (Good and Crosby, 1989; Miyashitaet al., 2007). However, the role of Gly and Ser accu-mulation is less clear. The transcripts for a number ofthese biosynthetic proteins are more abundant underanoxia (Lasanthi-Kudahettige et al., 2007; Table II),indicating that amino acid synthesis rather than proteindegradation is likely to be responsible. But, to ourknowledge, direct evidence for the benefits of feedingexogenous amino acids to seedlings growing underanoxia in an anoxia-intolerant but not an anoxia-tolerantspecies (Fig. 4) has not previously been reported.We initiated these exogenous feeding experiments
on the basis of an intriguing report on the positive
effects of Gly, Ser, and Ala on mammalian cells underhypoxic stress. Of the 23 standard amino acids tested,only Gly, L-Ala, and L-Ser provided significant protec-tion from hypoxic injury of cultured hepatocytes (Brechtand Groot, 1994). For some years, hypoxic or energydeficiency injury to hepatocytes and kidney tubuleshas been treated with Gly as a method of cell preser-vation (Weinberg et al., 1991; Carini et al., 1997; Tijsenet al., 1997). Although the literature agrees that pro-tection by Gly is not simply an enhancement of theenergetic state of the hypoxic cells, the mechanism ofprotection is still unclear. Research favors two differ-ent mechanisms associated with the modification ofthe rise in intracellular Na+ during hypoxia due toenergy-induced loss of Na+-K+-ATPase activity: indi-rectly via the activation of Gly receptor neurotrans-mitters (Carini et al., 1997) or directly by blockingnonselective sodium transport (Frank et al., 2000).
Subsequent literature examination also shows thatwhile the addition of a range of amino acids into ex-ternal medium can result in cytoplasmic acidificationof plant cells (Felle, 1981), the addition of Ala and Serdoes not acidify the cytoplasm but instead results in apH increase of some 0.2 to 0.3 units (Felle, 1996). Thissuggests a selective benefit of these amino acids inavoiding cytoplasmic acidification under anoxia. Addi-tionally, Ser is the entry point for sphingolipid biosyn-thesis in plants. The transcript of the gene controllingthe first step of sphingolipid biosynthesis, the conden-sation of palmitate and Ser to form 3-keto-dihydro-sphingosine (Ser palmitoyltransferase [Os01g70370]),was up-regulated 20-fold in anoxic coleoptiles (Lasanthi-Kudahettige et al., 2007) and was classified as a coreanaerobic responder in germinating rice embryos(Narsai et al., 2009). Recent research in Caenorhabditiselegans (Crowder, 2009; Menuz et al., 2009) suggeststhat ceramides play a critical role in anoxia tolerance.The possible role of Ser in ceramide biosynthesisthrough Ser palmitoyltransferase in plant adaptationto anoxia deserves further investigation to identifynovel mechanisms conferring anoxia tolerance.
Hence, there are a range of possible explanations forthe beneficial effects of combinations of Ala/Ser/Glyon plant cell anoxia tolerance through the retention ofcarbon skeletons, modification of biosynthetic processes,and cellular ion balance.
CONCLUSION
In summary, our study reinforced the importance ofglycolysis and ethanolic fermentation in the adapta-tion to anaerobiosis and suggests that glycolysis mightalso be important in providing substrates for amino acidsynthesis. Rice, but not wheat, coleoptiles respondedto anoxia dramatically at the physiological, proteomic,and metabolomic levels, in concordance with the re-spective tolerance and intolerance of these speciesto anoxia. Further investigation into the role of machin-ery differences in selected mRNA translation and/or
Rice and Wheat Anoxia Responses
Plant Physiol. Vol. 156, 2011 1719 www.plant.org on June 17, 2014 - Published by www.plantphysiol.orgDownloaded from
Copyright © 2011 American Society of Plant Biologists. All rights reserved.
protein turnover between rice and wheat coleoptiles isneeded based on the targets identified here. We providenovel protein and metabolite evidence of the enhance-ment of Ser/Gly biosynthesis as well as support obser-vations that Ala accumulates in anoxic rice. We alsoshow a benefit for wheat by exogenous application ofthese amino acids and highlight a range of mechanismsthat could be responsible for conferring anoxia toler-ance.
MATERIALS AND METHODS
Plant Material
Dehulled rice (Oryza sativa ‘Amaroo’) and wheat (Triticum aestivum
‘Calingiri’) seeds were surface sterilized for 10 min using 50% (v/v) NaOCl
and then thoroughly rinsed with distilled, deionized water. Fifty to 75 seeds
were placed in conical flasks containing 250 mL of culture medium (0.5 mM
MES, 0.4 mM CaSO4, pH 6.5) and bubbled with air or N2 (6–7 L min21). Plastic
tubing delivered the gas to the seeds, and the system was sealed using
Parafilm and aluminum foil. Seedlings were grown in the dark at 30�C for (1)
4 d under aeration, (2) 4 d under aeration with an additional 1-d switch to
anoxia, or (3) 6 d under anoxia. To ensure that stress conditions were anoxic,
oxygen concentrations were monitored, and after 10 min of N2 bubbling, the
oxygen concentration was below the level of detection. This was measured
using the LabQuest Vernier oxygen meter with a sensitivity of 0.01% oxygen.
Rice seed was kindly provided by the New South Wales Department of
Primary Industries and wheat seed by the Western Australian Department of
Agriculture and Food.
Evans Blue Viability Stain
This protocol was adapted from the method described by Baker and Mock
(1994). Fresh tissues were excised from seedlings, weighed (0.05–0.1 g), and
placed in a 10-mL Falcon tube containing 100 mL of distilled, deionized water.
Two milliliters of 0.25% (w/v) Evans blue was added to each sample, and
horizontally lying tubes were shaken at room temperature for 20 min at 300
rpm. The stain was rinsed from tissues in a sieve until the water ran clear, snap
frozen, and then ground in a 2-mL Eppendorf microfuge tube containing a
carborundum ball for 3min at 17 shakes s21. A total of 0.5 mL of 1% (w/v) SDS
was added, and samples were ground for 3 min again. One milliliter of
distilled, deionized water was added to samples, which were then centrifuged
at 8,800g for 3 min. The absorbance of diluted supernatants (1:3) was measured
at 600 nm. The average masses of tissue samples (0.075 g) were used to nor-
malize absorbance measurements so that different samples could be com-
pared (n = 3).
Measurement of Electrical Conductivity
We measured electrical conductivity as an estimation of membrane integ-
rity (Yan et al., 1996). This was done in whole rice and wheat seedlings
germinated and grown for 4 d in aeration and subsequently transferred to
anoxia or air for 3 d in fresh culture medium (0.5 mM MES, 0.4 mM CaSO4, pH
6.5). Some samples were supplemented with the amino acids L-Ala, L-Ser,
and/or Gly at 10 mM concentrations. Seedlings were then washed with
distilled, deionized water, patted dry with tissue paper, and placed in 15-mL
Falcon tubes containing 10 mL of distilled, deionized water for 1 h at 19.5�C.The electrical conductivity of these solutions was measured (C1; TPS Aqua-C
conductivity TDS temperature meter). Samples were then microwaved for 2
min. Care was taken to ensure boiling of each sample. After 1 h, the electrical
conductivity was measured again (C2) at 19.5�C and used as the denominator
in the calculation of percentage electrolyte leakage.
ADH Activity
Measurement of ADH activity was performed as described byWaters et al.
(1991). Briefly, protein was extracted by grinding approximately 70 mg
of snap-frozen plant tissue with acid-washed sand and 1 mL of extraction
buffer (125 mM MES, 110 mM NaCl, 1 mM EDTA, 0.5 mM thiamine PPi, 2.5 mM
MgSO2, and freshly added dithiothreitol at 2 mM, pH 6.8). After centrifugation
at 10,000g for 4 min at 4�C, the supernatant was removed for analysis. The
ADH activity was measured at 340 nm in a 1-mL cuvette in reaction medium
(10 mM acetaldehyde, 50 mM TES, 0.17 mM NADH, pH 7.5).
Carbohydrate Measurement
Carbohydrate levels were measured using a modified method (Trevelyan
and Harrison, 1952). Tissue extracts were prepared by heating 20-mg samples
submerged in 2 mL of 80% ethanol at 70�C for 20 min in a tightly sealed tube.
Extracts were then removed from tissue, and 100 mL of extract was added into
1 mL of freshly prepared anthrone reagent (mixture of 0.2 g of anthrone to 100
mL of 70% [v/v] sulfuric acid). After vortexing, samples were boiled at 100�Cfor 10 min exactly, promptly placed in an icy-water bath for 5 min, and then
removed and stored at room temperature for 5 min before measuring A627.
Oxygen Uptake Measurements
Oxygen uptake measurements followed a procedure described previously
(Lee et al., 2008) using a computer-controlled Clark-type oxygen electrode
unit. Slight modifications include the use of approximately 90 mg of fresh
tissue and 2 mL of oxygen-saturated buffer composed of 5 mM KH2PO4, 10 mM
TES, 10 mM NaCl, and 2 mM MgSO4, pH 7.2.
Protein Purification
Snap-frozen coleoptiles were ground with acid-washed sand and a solu-
bilizing solution (7% [w/v] SDS, 125 mM Tris-HCl, and 10% [w/v] b-mercap-
toethanol at a 5:8 [w/v] ratio, pH 7). Protein purification was carried out using
the chloroform-methanol method (Wessel and Flugge, 1984). Protein pellets
were then incubated with 80% acetone for 1 h at 220�C. The solution was
centrifuged at 14,000 rpm for 10 min at 4�C, and the pellets were air dried.
Protein was resolubilized with rehydration buffer (6 M urea, 2 M thiourea, 2%
[w/v] CHAPS, 2% [v/v] immobilized pH gradient buffer, and 18 mM
dithiothreitol) for preparative gels or lysis buffer (6 M urea, 2 M thiourea, 2%
[w/v] CHAPS, and 40 mM Tris) for DIGE gels by shaking in an orbital rocker at
1,400 rpm at 25�C for 45 min. Centrifugation at 20,000g for 15 min was then
carried out. Protein was quantified using the 2D Quant Kit (GE Healthcare).
IEF/SDS-PAGE Gel Separations
For preparative gels, 800 mg of protein resolubilized in rehydration buffer
containing equal amounts of both samples was loaded onto IEF strips (3-10NL,
3-11NL, 24 cm; GE Healthcare) and separated for 24 h (up to 50 mA per strip,
5 W, 21�C). Six-step program parameters were as follows: 30 V for 12 h and
hold (step and hold [stp]), 500 V for 1-h stp, 1,000 V for 1-h gradient, 3,000 V
for 2-h gradient, 8,000 V for 2-h gradient, and 8,000 V for 6-h stp). IEF strips
were then dipped in 13 gel buffer, placed on top of a 12% acrylamide gel, and
run at 45 mA per gel for 6 to 7 h. For DIGE gels (Eubel et al., 2007), 50 mg of
treated, control, and a 1:1 internal standard mixture of the above-mentioned
coleoptile proteins was labeled separately with 400 mM fluorescent CyDye. The
labeling procedure was carried out according to the recommendations of GE
Healthcare. Samples were pooled and separated in the same manner that
preparative gels were. DIGE gels were scanned using a Typhoon laser scanner
(GE Healthcare), and quantitative analysis was carried out using the DeCyder
software package (version 6.5; GE Healthcare). Three independent dye-
swapping replicates were carried out. Statistically significant spots were
selected for MS identification according to their appearance in nine of nine
fluorescent images, a ratio of abundance difference of 2 or greater, and a value
of P # 0.05. Both DIGE and preparative gels were Coomassie Brilliant Blue
stained and destained.
Protein Identification Using MS
Selected protein spots were excised from gels and digested in gel as
described previously (Taylor et al., 2005). Vacuum-dried samples were
redissolved in 5% (v/v) acetonitrile and 0.1% (v/v) formic acid for analysis
on an XCT Ultra Ion Trap mass spectrometer (Agilent Technologies), and MS/
MS spectra were exported for data analysis. MS spectra were examined
against an in-house rice database of The Institute for Genomic Research Rice
Pseudomolecules and Genome Annotation and mitochondrial and plastid
Shingaki-Wells et al.
1720 Plant Physiol. Vol. 156, 2011 www.plant.org on June 17, 2014 - Published by www.plantphysiol.orgDownloaded from
Copyright © 2011 American Society of Plant Biologists. All rights reserved.

protein sets (Rice version 6) using version 2.2.03 (Matrix Science) of theMascot
search engine. The following settings were selected for searching: MS error
tolerance of 61.2 D, MS/MS error tolerance of 60.6 D, maximum missed
cleavages tolerated as one, two variable modifications including carbamido-
methyl (C) and oxidation (M), peptide charge as 2+ and 3+, and finally, the
instrument selected as ESI-TRAP. After results were retrieved from theMascot
search engine, “Require bold red” and “Standard scoring” checkboxes were
selected with the ion score cutoff set at 37, the “Significance threshold”
set at P , 0.05, and the “Max. number of hits” set at AUTO. MS spectra
files are available for analysis via the Proteome Commons Tranche Project
under hashWiq7A0erU/p/zv9IJSKf+5pyjbFZXnERbYRQYwrglOB3N/kmT/
Sp9qJ4ksGmr9J76AmipUl3xMLTO1I07LFWa19V0K8AAAAAAAACEg = =.
Metabolite Extraction, GC-MS Sample, andData Analysis
Metabolite extraction from coleoptiles followed a modified procedure
described previously (Howell et al., 2009). Tubes containing ground tissue
samples (100 mg of stressed or nonstressed coleoptiles) and grinding balls
(cooled) were placed in a liquid N2-cooled solid rack. Cold metabolite
extraction medium (0.5 mL; 85% [w/v] HPLC-grade methanol, 15% [w/v]
untreated MilliQ water, and 100 ng mL21 ribitol) was added to each tube,
immediately vortexed, and then shaken at 1,400 rpm for 20 min at 65�C.To pellet cell debris, samples were centrifuged at 20,000g for 10 min. Aliquots
(60 mL) of extract were dried in a vacuum centrifuge for approximately 2 h.
Twenty microliters of 20 mg mL21 methoxylamine-HCl (98% purity; Sigma)
was added to each of the dried samples. Samples were then shaken at 1,400
rpm for 90 min at 30�C. To each sample, 30 mL of N-methyl-N-(trimethylsilyl)-
trifluoroacetamide (derivatization grade; Sigma) was added, followed by
shaking again at 1,400 rpm for 30 min at 37�C. After this, 10 mL of n-alkane
standard mix (0.029% [v/v] n-dodecane, 0.029% [v/v] n-pentadecane, 0.029%
[w/v] n-nonadecane, 0.029% [w/v] n-docosane, 0.029% [w/v] n-octacosane,
0.029% [w/v] n-dotriacontane, and 0.029% [w/v] n-hexatriacontane dissolved
in anhydrous pyridine) was added and vortexed. Samples were transferred to
GC-MS amber vials with screw-top seals and low-volume inserts (Agilent
Technologies). These were then incubated for 4 h at room temperature for
equilibration. Analysis of samples on the GC-MS device followed the proce-
dure described previously (Howell et al., 2009). GC-MS data were collected
using Chemstation GC/MSD Data Analysis Software (Agilent Technologies).
Raw GC-MS data preprocessing and statistical analysis were performed using
MetabolomeExpress software (version 1.0; http://www.metabolome-express.
org). Detailed methods have been reported (Carroll et al., 2010).
Metabolic Phenocopy Analysis Using theMetabolomeExpress PhenoMeter
To systematically characterize relationships between the metabolic phe-
notypes observed in this study and metabolic phenotypes reported in previ-
ous studies, we used the PhenoMeter tool of MetabolomeExpress (https://
www.metabolome-express.org) to search the MetabolomeExpress metabolic
phenotype database, MetaPhenDB, for metabolic phenotypes having statisti-
cally significant qualitative overlap with the responses observed in this study
(submitted as a batch of “bait” responses). The PhenoMeter uses the following
procedure for each bait response. The bait response is compared with each
and every reference response in MetaPhenDB, one at a time. Each comparison
is done by first counting (1) the number of metabolites increased (i.e. having a
greater than 1-fold change) in both bait and reference; (2) the number of
metabolites decreased in both bait and reference; (3) the number of metab-
olites increased in bait but decreased in reference; and (4) the number of
metabolites decreased in bait but increased in reference. These counts were
then used as input in a two-tailed Fisher’s exact test to calculate the P value of
obtaining the observed positive (codirectional) or negative (inverse) response
overlap by chance alone. P. 0.05 was used to indicate statistically significant
overlaps or inverse overlaps. To minimize biases caused by the presence of
different sets of “unknown” metabolites in metabolic phenotypes acquired
from different studies, only metabolites of known structure (and hence having
the same name in each study) were considered in comparisons. Only metab-
olites present in both bait and reference were considered. So that the anoxia
responses observed in this study could be compared with previously
published plant responses to anoxia and hypoxia, we added the complete
set of 36 metabolic phenotypes associated with seven peer-reviewed publica-
tions (Geigenberger et al., 2000; Gibon et al., 2002; van Dongen et al., 2003,
2009; Branco-Price et al., 2008; Timmins et al., 2009; Rocha et al., 2010) from
other groups presented in a recent review (Narsai et al., 2011) of the topic to
MetaPhenDB prior to PhenoMeter analysis. At the time of analysis, Meta-
PhenDB contained 12,379 publicly available metabolite response statistics
representing 116 metabolic phenotypes, including oxygen deprivation-related
metabolic phenotypes for a total of six plant species (Arabidopsis [Arabidopsis
thaliana], potato [Solanum tuberosum], Lotus japonicus, Populus 3 canescens,
castor bean [Ricinus communis], and rice) in addition to metabolic phenotypes
associated with a wide variety of other environmental, developmental, and
genetic perturbations.
iTRAQ Analysis
Proteins were purified and quantified as described above. For each sample,
a total of 100 mg of protein was precipitated by the addition of 4 volumes of
cold acetone and stored in 220�C overnight. The precipitated protein was
then resuspended in dissolution buffer and denatured, and Cys residues were
blocked according to the manufacturer’s instructions (AB Sciex). Each sample
was then digested with 20 mL of 0.25 mg mL21 trypsin (Invitrogen) at 37�Covernight and labeled with the iTRAQ tags in triplicate. iTRAQ reagents were
resuspended in 50 mL of 2-propanol and added to each sample, pH adjusted,
and allowed to incubate at room temperature for 2 h. The labeled samples
were pooled prior to further analysis. To remove excess labeling reactants and
to reduce the interference of salts during liquid chromatography-MS/MS
analysis, the pooled samples were diluted 4-fold with strong cation-exchange
buffer A (10 mM KH2PO4 in 25% acetonitrile, pH 3.0) and subjected to strong
cation-exchange chromatography using an OPTI-LYNX cartridge (Optimize
Technologies). The eluent was dried in a vacuum concentrator and stored at
220�C for liquid chromatography-MS/MS analysis.
Samples were analyzed on an Agilent 6510 quadrupole-time-of-flight
(Q-TOF) mass spectrometer with an HPLC Chip Cube source. The chip
consisted of a 160-nL enrichment column (Zorbax 300SB-C18 5mm) and a
150-mm separation column (Zorbax 300SB-C18 5mm) driven by an Agilent
Technologies 1100 series nano/capillary liquid chromatography system. Pep-
tides were loaded onto the trapping column at 4 mL min21 in 5% (v/v)
acetonitrile and 0.1% (v/v) formic acid with the chip switched to enrichment
and using the capillary pump. The chip was then switched to separation, and
peptides were eluted during a 1-h gradient (5%–60% [v/v] acetonitrile) using
the nano pump at 300 nL min21 directly into the mass spectrometer. The
Q-TOF mass spectrometer was run in positive ion mode, and MS scans were
run over a mass-to-charge ratio range of 275 to 1,500 and at 4 spectra s21.
Precursor ions were selected for auto-MS/MS at an absolute threshold of 500
and a relative threshold of 0.01, with a maximum of three precursors per cycle
and active exclusion set at two spectra, and released after 1 min. Precursor
charge-state selection and preference was set to [M+H]2+ and then [M+H]3+,
and precursors were selected by charge and then abundance. Resulting MS/
MS spectra were searched against The Institute for Genomic Research Rice
Pseudomolecules and Genome Annotation and mitochondrial and plastid
protein sets (Rice_osa6) using version 2.2.03 (Matrix Science) of the Mascot
search engine. The following settings were selected for database searching:MS
error tolerance of 6100 ppm; MS/MS error tolerance of 60.5 D; maximum
missed cleavages tolerated as one; fixed modifications methylthio (C),
iTRAQ8plex (N-term), iTRAQ8plex (K); variable modifications carbamido-
methyl (C) and oxidation (M) iTRAQ8plex (Q), peptide charge of 2+ or greater;
and finally, the instrument selected as ESI-Q-TOF. The resulting searches were
then exported, and all peptides identified (P , 0.05) were extracted to create
an exclusion list for the subsequent run. All five runs were performed
and combined using mzdata Combinator version 1.0.4 (West Australian Centre
of Excellence in Computational Systems Biology) for database searching
as outlined below. MS spectra files are available for analysis via the Prote-
ome Commons Tranche Project under hash 5AJQpzyi1I5adgPNIGdJ+
oQf8nlIoXnjLVhePv9x39srDtRpuZe9gQu9ij62NLKetNEdx6t1MqirlvSglVAA-
UHcQZAYAAAAAAAABcA = =.
Quantitation was carried out using default settings in Mascot version
2.2.03 (Matrix Science) for protein identifications as outlined above and
quantitation on isobaric mass tags (iTRAQ) at the peptide level. In more detail,
ratios for individual peptide matches were obtained from peptides meeting
the minimum criteria outlined above and were then combined to determine
ratios for protein hits using a weighted average. Outlier removal was carried
out by Dixon’s method for up to 25 data points per protein or by Rosner’s
method, where more than 25 data points were present and normalization was
carried out by median ratio. Values are reported as geometric means with SD,
and those significantly different from 1 at a 95% confidence interval are
Rice and Wheat Anoxia Responses
Plant Physiol. Vol. 156, 2011 1721 www.plant.org on June 17, 2014 - Published by www.plantphysiol.orgDownloaded from
Copyright © 2011 American Society of Plant Biologists. All rights reserved.

marked with asterisks (Supplemental Table S1). For proteins reported to have
a nonnormal distribution, the geometric SD was determined manually. Here, a
geometric mean for the individual peptide ratios and a 95% confidence
interval window was calculated as a t test in Analyze-it version 2.21.
Supplemental Data
The following materials are available in the online version of this article.
Supplemental Figure S1. Germination, growth, and cell integrity of rice
and wheat under anoxia.
Supplemental Figure S2. Number of protein spots detected in each
proteomic analysis that significantly differed in abundance between
treatments.
Supplemental Figure S3. Correlations between protein abundance de-
tected from iTRAQ and DIGE and between transcript and protein
abundance differences between continuously anoxic and aerated rice
coleoptiles.
Supplemental Figure S4.DIGE on two-dimensional 3-11NL IEF/SDS gels.
Supplemental Table S1. Entire list of rice coleoptile proteins significantly
changing between treatments that were identified by DIGE and iTRAQ
proteomic analyses.
Supplemental Table S2. Quantitative analysis of protein abundance from
4-d aerated and 6-d anoxic rice coleoptiles using iTRAQ.
Supplemental Table S3. Comparison of steady-state and polysomal
Arabidopsis mRNAs under aeration and hypoxia, whose genes are
orthologous to rice genes encoding proteins significantly changing in
abundance in at least one of our rice proteome analyses.
Supplemental Table S4. Whole set of relative metabolite levels in wheat
and rice coleoptiles under aerated and anoxic conditions.
Supplemental Table S5. Comparison of metabolite responses between
wheat and rice coleoptiles from seedlings switched to 1 d of anoxia in
two independent experiments.
Supplemental Table S6. Grouping of metabolite responses in coleoptiles
of 4-d-old rice and wheat seedlings transferred to anoxia for 1 d (anoxic
switch conditions).
Supplemental Table S7. Comparison of metabolite responses in coleop-
tiles of anoxically switched and anoxically germinated rice seedlings.
Supplemental Table S8.Metabolic phenocopy analysis: comparison of the
low-oxygen responses of rice and wheat coleoptiles with low-oxygen
and respiratory-perturbation responses in other species and tissues.
Supplemental Table S9. Expanded results of MetabolomeExpress Pheno-
Meter analysis.
Received March 2, 2011; accepted May 12, 2011; published May 27, 2011.
LITERATURE CITED
Alpi A, Beevers H (1983) Effects of O2 concentration on rice seedlings.
Plant Physiol 71: 30–34
Atwell B, Waters I, Greenway H (1982) The effect of oxygen and turbulence
on elongation of coleoptiles of submergence-tolerant and -intolerant rice
cultivars. J Exp Bot 33: 1030–1044
Bailey-Serres J (1999) Selective translation of cytoplasmic mRNAs in
plants. Trends Plant Sci 4: 142–148
Bailey-Serres J, Chang R (2005) Sensing and signaling in response to
oxygen deprivation in plants and other organisms. Ann Bot (Lond) 96:
507–518
Bailey-Serres J, Voesenek LACJ (2008) Flooding stress: acclimations and
genetic diversity. Annu Rev Plant Biol 59: 313–339
Baker CJ, Mock NM (1994) An improved method for monitoring cell death
in cell suspension and leaf disc assays using Evans blue. Plant Cell
Tissue Organ Cult 39: 7–12
Baker J, Steele C, Dure L (1988) Sequence and characterization of 6 Lea
proteins and their genes from cotton. Plant Mol Biol 11: 277–291
Bartel B, Fink GR (1995) ILR1, an amidohydrolase that releases active
indole-3-acetic acid from conjugates. Science 268: 1745–1748
Baxter-Burrell A, Yang Z, Springer PS, Bailey-Serres J (2002) RopGAP4-
dependent Rop GTPase rheostat control of Arabidopsis oxygen depri-
vation tolerance. Science 296: 2026–2028
Biemelt S, Keetman U, Albrecht G (1998) Re-aeration following hypoxia or
anoxia leads to activation of the antioxidative defense system in roots of
wheat seedlings. Plant Physiol 116: 651–658
Blokhina O, Virolainen E, Fagerstedt KV (2003) Antioxidants, oxidative
damage and oxygen deprivation stress: a review. Ann Bot (Lond) 91:
179–194
Blokhina OB, Chirkova TV, Fagerstedt KV (2001) Anoxic stress leads to
hydrogen peroxide formation in plant cells. J Exp Bot 52: 1179–1190
Blokhina OB, Fagerstedt KV, Chirkova TV (1999) Relationships between
lipid peroxidation and anoxia tolerance in a range of species during
post-anoxic reaeration. Physiol Plant 105: 625–632
Blokhina OB, Virolainen E, Fagerstedt KV, Hoikkala A, Wahala K,
Chirkova TV (2000) Antioxidant status of anoxia-tolerant and -intoler-
ant plant species under anoxia and reaeration. Physiol Plant 109:
396–403
Branco-Price C, Kaiser KA, Jang CJH, Larive CK, Bailey-Serres J (2008)
Selective mRNA translation coordinates energetic and metabolic ad-
justments to cellular oxygen deprivation and reoxygenation in Arabi-
dopsis thaliana. Plant J 56: 743–755
Branco-Price C, Kawaguchi R, Ferreira RB, Bailey-Serres J (2005)
Genome-wide analysis of transcript abundance and translation in
Arabidopsis seedlings subjected to oxygen deprivation. Ann Bot
(Lond) 96: 647–660
Brecht M, Groot H (1994) Protection from hypoxic injury in cultured
hepatocytes by glycine, alanine, and serine. Amino Acids 6: 25–35
Campos F, Zamudio F, Covarrubias AA (2006) Two different late embryo-
genesis abundant proteins from Arabidopsis thaliana contain specific
domains that inhibit Escherichia coli growth. Biochem Biophys Res
Commun 342: 406–413
Carini R, Bellomo G, Grazia De Cesaris M, Albano E (1997) Glycine
protects against hepatocyte killing by KCN or hypoxia by preventing
intracellular Na+ overload in the rat. Hepatology 26: 107–112
Carroll AJ, Badger MR, Harvey Millar A (2010) The MetabolomeExpress
Project: enabling Web-based processing, analysis and transparent dis-
semination of GC/MS metabolomics datasets. BMC Bioinformatics 11:
376–388
Crowder CM (2009) Ceramides: friend or foe in hypoxia? Science 324:
343–344
Eubel H, Lee CP, Kuo J, Meyer EH, Taylor NL, Millar AH (2007) Free-flow
electrophoresis for purification of plant mitochondria by surface charge.
Plant J 52: 583–594
Fan TW-M, Higashi RM, Frenkiel TA, Lane AN (1997) Anaerobic nitrate
and ammonium metabolism in flood-tolerant rice coleoptiles. J Exp Bot
48: 1655–1666
Felle H (1981) Stereospecificity and electrogenicity of amino acid transport
in Riccia fluitans. Planta 152: 505–512
Felle HH (1996) Control of cytoplasmic pH under anoxic conditions and its
implication for plasma membrane proton transport in Medicago sativa
root hairs. J Exp Bot 47: 967–973
Frank A, Rauen U, de Groot H (2000) Protection by glycine against hypoxic
injury of rat hepatocytes: inhibition of ion fluxes through nonspecific
leaks. J Hepatol 32: 58–66
Fukao T, Xu K, Ronald PC, Bailey-Serres J (2006) A variable cluster of
ethylene response factor-like genes regulates metabolic and develop-
mental acclimation responses to submergence in rice. Plant Cell 18:
2021–2034
Fukao T, Yeung E, Bailey-Serres J (2011) The submergence tolerance
regulator SUB1A mediates crosstalk between submergence and drought
tolerance in rice. Plant Cell 23: 412–427
Garmier M, Carroll AJ, Delannoy E, Vallet C, Day DA, Small ID, Millar
AH (2008) Complex I dysfunction redirects cellular and mitochondrial
metabolism in Arabidopsis. Plant Physiol 148: 1324–1341
Geigenberger P, Fernie AR, Gibon Y, Christ M, Stitt M (2000) Metabolic
activity decreases as an adaptive response to low internal oxygen in
growing potato tubers. Biol Chem 381: 723–740
Gibbs J, Greenway H (2003) Mechanisms of anoxia tolerance in plants. I.
Growth, survival and anaerobic catabolism. Funct Plant Biol 30: 1–47
Gibbs J, Morrell S, Valdez A, Setter TL, Greenway H (2000) Regulation of
Shingaki-Wells et al.
1722 Plant Physiol. Vol. 156, 2011 www.plant.org on June 17, 2014 - Published by www.plantphysiol.orgDownloaded from
Copyright © 2011 American Society of Plant Biologists. All rights reserved.
alcoholic fermentation in coleoptiles of two rice cultivars differing in
tolerance to anoxia. J Exp Bot 51: 785–796
Gibon Y, Vigeolas H, Tiessen A, Geigenberger P, Stitt M (2002) Sensitive
and high throughput metabolite assays for inorganic pyrophosphate,
ADPGlc, nucleotide phosphates, and glycolytic intermediates based on
a novel enzymic cycling system. Plant J 30: 221–235
Good AG, Crosby WL (1989) Anaerobic induction of alanine aminotrans-
ferase in barley root tissue. Plant Physiol 90: 1305–1309
Guglielminetti L, Perata P, Alpi A (1995) Effect of anoxia on carbohydrate
metabolism in rice seedlings. Plant Physiol 108: 735–741
Hou WC, Lin YH (1997) Dehydroascorbate reductase and monodehy-
droascorbate reductase activities of trypsin inhibitors, the major sweet
potato (Ipomoea batatas [L] Lam) root storage protein. Plant Sci 128:
151–158
Hou WC, Wang YT, Lin YH, Hsiao LJ, Chen TE, Wang CW, Dai H (2000) A
complex containing both trypsin inhibitor and dehydroascorbate re-
ductase activities isolated from mitochondria of etiolated mung bean
(Vigna radiata L. (Wilczek) cv. Tainan no. 5) seedlings. J Exp Bot 51:
713–719
Howell KA, Cheng K, Murcha MW, Jenkin LE, Millar AH, Whelan J
(2007) Oxygen initiation of respiration and mitochondrial biogenesis in
rice. J Biol Chem 282: 15619–15631
Howell KA, Narsai R, Carroll A, Ivanova A, Lohse M, Usadel B, Millar
AH, Whelan J (2009) Mapping metabolic and transcript temporal
switches during germination in rice highlights specific transcription
factors and the role of RNA instability in the germination process. Plant
Physiol 149: 961–980
Huang S, Greenway H, Colmer TD (2003) Anoxia tolerance in rice
seedlings: exogenous glucose improves growth of an anoxia-‘intoler-
ant’, but not of a ‘tolerant’ genotype. J Exp Bot 54: 2363–2373
Huang S, Greenway H, Colmer TD, Millar AH (2005) Protein synthesis by
rice coleoptiles during prolonged anoxia: implications for glycolysis,
growth and energy utilization. Ann Bot (Lond) 96: 703–715
Kato-Noguchi H, Ohashi C (2006) Effects of anoxia on amino acid levels in
rice coleoptiles. Plant Prod Sci 9: 383–387
Klok EJ, Wilson IW, Wilson D, Chapman SC, Ewing RM, Somerville SC,
Peacock WJ, Dolferus R, Dennis ES (2002) Expression profile analysis
of the low-oxygen response in Arabidopsis root cultures. Plant Cell 14:
2481–2494
Kordan HA (1974) The rice shoot in relation to oxygen supply and root
growth in seedlings germinating under water. New Phytol 73: 695–697
Kreuzwieser J, Hauberg J, Howell KA, Carroll A, Rennenberg H, Millar
AH, Whelan J (2009) Differential response of gray poplar leaves and
roots underpins stress adaptation during hypoxia. Plant Physiol 149:
461–473
Lasanthi-Kudahettige R, Magneschi L, Loreti E, Gonzali S, Licausi F,
Novi G, Beretta O, Vitulli F, Alpi A, Perata P (2007) Transcript profiling
of the anoxic rice coleoptile. Plant Physiol 144: 218–231
Lee CP, Eubel H, O’Toole N, Millar AH (2008) Heterogeneity of the
mitochondrial proteome for photosynthetic and non-photosynthetic
Arabidopsis metabolism. Mol Cell Proteomics 7: 1297–1316
Liu FL, Vantoai T, Moy LP, Bock G, Linford LD, Quackenbush J (2005)
Global transcription profiling reveals comprehensive insights into
hypoxic response in Arabidopsis. Plant Physiol 137: 1115–1129
Loreti E, Poggi A, Novi G, Alpi A, Perata P (2005) A genome-wide analysis
of the effects of sucrose on gene expression in Arabidopsis seedlings
under anoxia. Plant Physiol 137: 1130–1138
Magneschi L, Kudahettige RL, Alpi A, Perata P (2009) Comparative
analysis of anoxic coleoptile elongation in rice varieties: relationship
between coleoptile length and carbohydrate levels, fermentative me-
tabolism and anaerobic gene expression. Plant Biol (Stuttg) 11: 561–573
Mapelli S, Locatelli F (1995) The relation of rice coleoptiles, auxin-binding
protein, and protein-biosynthesis to anoxia and indoleacetic-acid. Russ J
Plant Physiol 42: 624–629
Menegus F, Cattaruzza L, Chersi A, Fronza G (1989) Differences in the
anaerobic lactate-succinate production and in the changes of cell sap pH
for plants with high and low resistance to anoxia. Plant Physiol 90: 29–32
Menegus F, Cattaruzza L, Mattana M, Beffagna N, Ragg E (1991) Response
to anoxia in rice and wheat seedlings: changes in the pH of intracellular
compartments, glucose-6-phosphate level, and metabolic rate. Plant
Physiol 95: 760–767
Menuz V, Howell KS, Gentina S, Epstein S, Riezman I, Fornallaz-
Mulhauser M, Hengartner MO, Gomez M, Riezman H, Martinou J-C
(2009) Protection of C. elegans from anoxia by HYL-2 ceramide syn-
thase. Science 324: 381–384
Millar AH, Trend AE, Heazlewood JL (2004) Changes in the mitochondrial
proteome during the anoxia to air transition in rice focus around
cytochrome-containing respiratory complexes. J Biol Chem 279:
39471–39478
Miyashita Y, Dolferus R, Ismond KP, Good AG (2007) Alanine amino-
transferase catalyses the breakdown of alanine after hypoxia in Arabi-
dopsis thaliana. Plant J 49: 1108–1121
Mocquot B, Prat C, Mouches C, Pradet A (1981) Effect of anoxia on energy
charge and protein synthesis in rice embryo. Plant Physiol 68: 636–640
Mustroph A, Lee SC, Oosumi T, Zanetti ME, Yang H, Ma K, Yaghoubi-
Masihi A, Fukao T, Bailey-Serres J (2010) Cross-kingdom comparison
of transcriptomic adjustments to low-oxygen stress highlights con-
served and plant-specific responses. Plant Physiol 152: 1484–1500
Nagai T, Makino A (2009) Differences between rice and wheat in temper-
ature responses of photosynthesis and plant growth. Plant Cell Physiol
50: 744–755
Narsai R, Howell KA, Carroll A, Ivanova A, Millar AH, Whelan J (2009)
Defining core metabolic and transcriptomic responses to oxygen avail-
ability in rice embryos and young seedlings. Plant Physiol 151: 306–322
Narsai R, Rocha M, Geigenberger P, Whelan J, van Dongen JT (2011)
Comparative analysis between plant species of transcriptional and
metabolic responses to hypoxia. New Phytol 190: 472–487
Opik H (1973) Effect of anaerobiosis on respiratory rate, cytochrome
oxidase activity and mitochondrial structures in coleoptiles of rice
(Oryza sativa L.). J Cell Sci 12: 725–739
Pegoraro R, Mapelli S, Torti G, Bertani A (1988) Indole-3-acetic acid and
rice coleoptile elongation under anoxia. J Plant Growth Regul 7: 85–94
Perata P, Guglielminetti L, Alpi A (1997) Mobilization of endosperm
reserves in cereal seeds under anoxia. Ann Bot (Lond) 79: 49–56
Perata P, Pozueta-Romero J, Akazawa T, Yamagushi J (1992) Effect of
anoxia on starch breakdown in rice and wheat seeds. Planta 188: 611–618
Raymond P, Al-Ani A, Pradet A (1985) ATP production by respiration and
fermentation, energy charge during aerobiosis and anaerobiosis in
twelve fatty and starchy germinating seeds. Plant Physiol 79: 879–884
Ricard B, Pradet A (1989) Anaerobic protein synthesis in different organs of
germinating rice seeds. Plant Physiol Biochem 27: 761–768
Ricard B, Rivoal J, Spiteri A, Pradet A (1991) Anaerobic stress induces the
transcription and translation of sucrose synthase in rice. Plant Physiol
95: 669–674
Rocha M, Licausi F, Araujo WL, Nunes-Nesi A, Sodek L, Fernie AR, van
Dongen JT (2010) Glycolysis and the tricarboxylic acid cycle are linked
by alanine aminotransferase during hypoxia induced by waterlogging
of Lotus japonicus. Plant Physiol 152: 1501–1513
Sachs M, Subaiah C, Saab I (1996) Anaerobic gene expression and flooding
tolerance in maize. J Exp Bot 47: 1–15
Setter TL, Waters I (2003) Review of prospects for germplasm improve-
ment for waterlogging tolerance in wheat, barley and oats. Plant Soil
253: 1–34
Siddiqui NU, Chung H-J, Thomas TL, Drew MC (1998) Abscisic acid-
dependent and -independent expression of the carrot late-embryogenesis-
abundant-class gene Dc3 in transgenic tobacco seedlings. Plant Physiol 118:
1181–1190
Taylor NL, Heazlewood JL, Day DA, Millar AH (2005) Differential impact
of environmental stresses on the pea mitochondrial proteome. Mol Cell
Proteomics 4: 1122–1133
Tijsen MJH, Peters SMA, Bindels RJM, van Os CH, Wetzels JFM (1997)
Glycine protection against hypoxic injury in isolated rat proximal
tubules: the role of proteases. Nephrol Dial Transplant 12: 2549–2556
Timmins M, Zhou W, Rupprecht J, Lim L, Thomas-Hall SR, Doebbe A,
Kruse O, Hankamer B, Marx UC, Smith SM, et al (2009) The metab-
olome of Chlamydomonas reinhardtii following induction of anaerobic
H2 production by sulfur depletion. J Biol Chem 284: 23415–23425
Trevelyan WE, Harrison JS (1952) Studies on yeast metabolism. I. Frac-
tionation and microdetermination of cell carbohydrates. Biochem J 50:
298–303
van Dongen JT, Frohlich A, Ramırez-Aguilar SJ, Schauer N, Fernie AR,
Erban A, Kopka J, Clark J, Langer A, Geigenberger P (2009) Transcript
and metabolite profiling of the adaptive response to mild decreases in
oxygen concentration in the roots of Arabidopsis plants. Ann Bot (Lond)
103: 269–280
van Dongen JT, Schurr U, Pfister M, Geigenberger P (2003) Phloem
Rice and Wheat Anoxia Responses
Plant Physiol. Vol. 156, 2011 1723 www.plant.org on June 17, 2014 - Published by www.plantphysiol.orgDownloaded from
Copyright © 2011 American Society of Plant Biologists. All rights reserved.
metabolism and function have to cope with low internal oxygen. Plant
Physiol 131: 1529–1543
Wang G-H, Jiang Z-L, Chen Z-Q, Li X, Peng L-L (2010) Neuroprotective
effect of L-serine against temporary cerebral ischemia in rats. J Neurosci
Res 88: 2035–2045
Waters I, Morrels S, Greenway H, Colmer T (1991) Influence of O2 supply
prior to anoxia on tolerance to anoxia, alcoholic fermentation, and sugar
levels. J Exp Bot 42: 1437–1447
Weinberg JM, Nissim I, Roeser NF, Davis JA, Schultz S, Nissim I (1991)
Relationships between intracellular amino acid levels and protec-
tion against injury to isolated proximal tubules. Am J Physiol 260:
F410–F419
Went FW (1942) Growth, auxin and tropisms in decapitated Avena cole-
optiles. Plant Physiol 17: 236–249
Wessel D, Flugge UI (1984) A method for the quantitative recovery of
protein in dilute solution in the presence of detergents and lipids. Anal
Biochem 138: 141–143
Wu WW, Wang G, Baek SJ, Shen R-F (2006) Comparative study of three
proteomic quantitative methods, DIGE, cICAT, and iTRAQ, using 2D
gel- or LC-MALDI TOF/TOF. J Proteome Res 5: 651–658
Xu K, Xu X, Fukao T, Canlas P, Maghirang-Rodriguez R, Heuer S, Ismail
AM, Bailey-Serres J, Ronald PC, Mackill DJ (2006) Sub1A is an
ethylene-response-factor-like gene that confers submergence tolerance
to rice. Nature 442: 705–708
Yan B, Dai Q, Liu X, Huang S, Wang Z (1996) Flooding-induced membrane
damage, lipid oxidation and activated oxygen generation in corn leaves.
Plant Soil 179: 261–268
Yu J, Hu S, Wang J, Wong GK, Li S, Liu B, Deng Y, Dai L, Zhou Y, Zhang X,
et al (2002) A draft sequence of the rice genome (Oryza sativa L. ssp.
indica). Science 296: 79–92
Shingaki-Wells et al.
1724 Plant Physiol. Vol. 156, 2011 www.plant.org on June 17, 2014 - Published by www.plantphysiol.orgDownloaded from
Copyright © 2011 American Society of Plant Biologists. All rights reserved.