Increased expression and function of glutamate transporters in multiple sclerosis
11
Increased expression and function of glutamate transporters in multiple sclerosis Ainara Vallejo-Illarramendi, a Marı ´a Domercq, a Fernando Pe ´rez-Cerda ´, a Rivka Ravid, b and Carlos Matute a, * a Departamento de Neurociencias, Universidad del Paı ´s Vasco, E-48940, Leioa, Vizcaya, Spain b Netherlands Brain Bank, Meibergdreef 33, 1105 AZ Amsterdam ZO, The Netherlands Received 13 April 2005; revised 13 June 2005; accepted 28 June 2005 Available online 2 August 2005 Recent studies have shown that glutamate excitotoxicity may be a component in the etiology of multiple sclerosis (MS). Glutamate transporters determine the levels of extracellular glutamate and are essential to prevent excitotoxicity. We have analyzed here the expression of the glutamate transporters EAAT1, EAAT2 and EAAT3 in control and in MS optic nerve samples. We observed an overall increase in the level of the glutamate transporters EAAT1 and EAAT2 mRNA and protein. In turn, functional assays showed that glutamate uptake was also increased in MS samples. Furthermore, glutamate transporter increases were mimicked in rat optic nerves treated with excitotoxic levels of glutamate. Together, these results indicate that enhanced expression of glutamate transporters in MS constitutes a regulatory response of glial cells to toxic levels of glutamate in the CNS during inflammation and neurodegeneration. D 2005 Elsevier Inc. All rights reserved. Keywords: Multiple sclerosis; Glutamate; Oligodendrocytes; Astrocytes; Excitotoxicity Introduction Multiple sclerosis (MS) is a chronic, degenerative disease of the CNS, which is characterized by focal lesions with inflamma- tion, demyelination, infiltration of immune cells, oligodendroglial death and axonal damage (Trapp et al., 1998; Prineas et al., 2002). These cellular alterations are accompanied by neurological deficits, such as sensory disturbances, lack of motor coordination and visual impairment (Steinman, 2001). MS usually begins with an autoimmune inflammatory reaction to myelin components and progresses later to a chronic phase in which oligodendrocytes, myelin and axons degenerate (Steinman et al., 2002). Auto- immunity may be triggered by microbial protein sequences which share homologies with components of the myelin sheath and which in turn are recognized by T cells (Wucherpfennig et al., 1997). Activated lymphocytes penetrate into the CNS and open the blood – brain barrier to plasma constituents which otherwise cannot reach the nervous tissue and are toxic to neurons and glia (Weiner and Selkoe, 2002). Although the precise cause of MS remains unclear, several lines of evidence support the hypothesis that glutamate excitotoxicity may be involved in this pathology (Matute et al., 1997; McDonald et al., 1998; Pitt et al., 2000; Smith et al., 2000). Oligodendrocytes are highly vulnerable to excitotoxic signals mediated by AMPA and kainate receptors (Matute et al., 1997; McDonald et al., 1998; Sanchez-Gomez and Matute, 1999; Sanchez-Gomez et al., 2003), and activation of these receptors in vivo can induce inflammation, demyelination and other patho- logical features which are typical of MS lesions (Matute, 1998). Strong evidence supporting an association between glutamatergic hyperfunction and MS has come from pharmacological studies showing that amantadine decreases the rate of relapse of MS patients (Plaut, 1987) and that memantine, as well as AMPA antagonists, ameliorates the neurological sequelae of experimental autoimmune encephalomyelitis (EAE) (Wallstrom et al., 1996; Pitt et al., 2000; Smith et al., 2000). Moreover, alterations in glutamate homeostasis in MS have given further credence to the potential involvement of the glutamatergic system in this pathology. Thus, the levels of glutamate are increased in the cerebrospinal fluid of patients with acute MS (Stover et al., 1997) and secondary progressive MS (Sarchielli et al., 2003), as well as in serum prior to the onset of clinical relapse (Westall et al., 1980). In addition, glutamine synthase and glutamate dehydrogenase, enzymes responsible for glutamate degradation, are downregulated in EAE and MS white matter (Hardin-Pouzet et al., 1997; Werner et al., 2001), whereas the glutamate producing enzyme, glutaminase, shows increased immunoreactivity in macrophages and microglia in active MS lesions (Werner et al., 2001). Together, these data strongly suggest 0969-9961/$ - see front matter D 2005 Elsevier Inc. All rights reserved. doi:10.1016/j.nbd.2005.06.017 * Corresponding author. Fax: +34 94 601 3400. E-mail address: [email protected] (C. Matute). Available online on ScienceDirect (www.sciencedirect.com). www.elsevier.com/locate/ynbdi Neurobiology of Disease 21 (2006) 154 – 164
-
Upload
independent -
Category
Documents
-
view
2 -
download
0
Transcript of Increased expression and function of glutamate transporters in multiple sclerosis

Increased expression and function of glutamate transporters
in multiple sclerosis
Ainara Vallejo-Illarramendi,a Marıa Domercq,a Fernando Perez-Cerda,a
Rivka Ravid,b and Carlos Matutea,*
aDepartamento de Neurociencias, Universidad del Paıs Vasco, E-48940, Leioa, Vizcaya, SpainbNetherlands Brain Bank, Meibergdreef 33, 1105 AZ Amsterdam ZO, The Netherlands
Received 13 April 2005; revised 13 June 2005; accepted 28 June 2005
Available online 2 August 2005
Recent studies have shown that glutamate excitotoxicity may be a
component in the etiology of multiple sclerosis (MS). Glutamate
transporters determine the levels of extracellular glutamate and are
essential to prevent excitotoxicity. We have analyzed here the
expression of the glutamate transporters EAAT1, EAAT2 and EAAT3
in control and in MS optic nerve samples. We observed an overall
increase in the level of the glutamate transporters EAAT1 and EAAT2
mRNA and protein. In turn, functional assays showed that glutamate
uptake was also increased in MS samples. Furthermore, glutamate
transporter increases were mimicked in rat optic nerves treated with
excitotoxic levels of glutamate. Together, these results indicate that
enhanced expression of glutamate transporters in MS constitutes a
regulatory response of glial cells to toxic levels of glutamate in the CNS
during inflammation and neurodegeneration.
D 2005 Elsevier Inc. All rights reserved.
Keywords: Multiple sclerosis; Glutamate; Oligodendrocytes; Astrocytes;
Excitotoxicity
Introduction
Multiple sclerosis (MS) is a chronic, degenerative disease of
the CNS, which is characterized by focal lesions with inflamma-
tion, demyelination, infiltration of immune cells, oligodendroglial
death and axonal damage (Trapp et al., 1998; Prineas et al.,
2002). These cellular alterations are accompanied by neurological
deficits, such as sensory disturbances, lack of motor coordination
and visual impairment (Steinman, 2001). MS usually begins with
an autoimmune inflammatory reaction to myelin components and
progresses later to a chronic phase in which oligodendrocytes,
myelin and axons degenerate (Steinman et al., 2002). Auto-
immunity may be triggered by microbial protein sequences which
share homologies with components of the myelin sheath and
which in turn are recognized by T cells (Wucherpfennig et al.,
1997). Activated lymphocytes penetrate into the CNS and open
the blood–brain barrier to plasma constituents which otherwise
cannot reach the nervous tissue and are toxic to neurons and glia
(Weiner and Selkoe, 2002). Although the precise cause of MS
remains unclear, several lines of evidence support the hypothesis
that glutamate excitotoxicity may be involved in this pathology
(Matute et al., 1997; McDonald et al., 1998; Pitt et al., 2000;
Smith et al., 2000).
Oligodendrocytes are highly vulnerable to excitotoxic signals
mediated by AMPA and kainate receptors (Matute et al., 1997;
McDonald et al., 1998; Sanchez-Gomez and Matute, 1999;
Sanchez-Gomez et al., 2003), and activation of these receptors in
vivo can induce inflammation, demyelination and other patho-
logical features which are typical of MS lesions (Matute, 1998).
Strong evidence supporting an association between glutamatergic
hyperfunction and MS has come from pharmacological studies
showing that amantadine decreases the rate of relapse of MS
patients (Plaut, 1987) and that memantine, as well as AMPA
antagonists, ameliorates the neurological sequelae of experimental
autoimmune encephalomyelitis (EAE) (Wallstrom et al., 1996; Pitt
et al., 2000; Smith et al., 2000).
Moreover, alterations in glutamate homeostasis in MS have
given further credence to the potential involvement of the
glutamatergic system in this pathology. Thus, the levels of
glutamate are increased in the cerebrospinal fluid of patients with
acute MS (Stover et al., 1997) and secondary progressive MS
(Sarchielli et al., 2003), as well as in serum prior to the onset of
clinical relapse (Westall et al., 1980). In addition, glutamine
synthase and glutamate dehydrogenase, enzymes responsible for
glutamate degradation, are downregulated in EAE and MS white
matter (Hardin-Pouzet et al., 1997; Werner et al., 2001), whereas
the glutamate producing enzyme, glutaminase, shows increased
immunoreactivity in macrophages and microglia in active MS
lesions (Werner et al., 2001). Together, these data strongly suggest
0969-9961/$ - see front matter D 2005 Elsevier Inc. All rights reserved.
doi:10.1016/j.nbd.2005.06.017
* Corresponding author. Fax: +34 94 601 3400.
E-mail address: [email protected] (C. Matute).
Available online on ScienceDirect (www.sciencedirect.com).
www.elsevier.com/locate/ynbdi
Neurobiology of Disease 21 (2006) 154 – 164
that the levels of glutamate are likely to be increased in EAE as
well as in MS.
High affinity glutamate transport is the major mechanism by
means of which the CNS maintains low levels of extracellular
glutamate (Danbolt, 2001). To date, five human excitatory amino
acid transporters (EAAT1–5) have been cloned (Arriza et al.,
1994; Danbolt, 2001). It is conceivable that the altered
expression or function of these glutamate transporters may be
responsible for increased extracellular glutamate in the diseased
CNS. Truncated splicing variants of human EAAT2 (Lin et al.,
1998; Meyer et al., 1998) and EAAT3 (Matsumoto et al., 1999),
which regulate the function of normal EAAT proteins (Lin et al.,
1998), could be additionally involved in the pathogenesis of
neurodegenerative disorders, including MS. In the present study,
we determined the levels of expression of EAAT1–3 and their
splicing variants in optic nerves from MS and controls. The
results indicate that the expression and function of glutamate
transporters are indeed increased in optic nerves of MS patients
and that high levels of glutamate can drive upregulation of the
expression of these transporters in the isolated rat optic nerve.
On the basis of the present results, enhanced expression of
glutamate transporters in MS represents an adaptive response to
increased levels of glutamate in the CNS during inflammation
and neurodegeneration.
Materials and methods
Human tissue samples
Postmortem optic nerve samples from 16 long-standing MS
patients and 12 control subjects (who died from non-neurological
diseases) were obtained at autopsy under the management of the
Netherlands Brain Bank. All patients and controls had previously
given written approval for the use of their tissue, according to the
guidelines of the Netherlands Brain Bank. Samples obtained
included frozen tissue (�80-C) used for microarray, real-time
PCR analysis, Western blot and functional studies and 4%
formaldehyde-fixed tissue used for immunohistochemical studies.
Clinical characteristics for control and patient groups are
presented in Table 1. We used clinical data together with
macroscopic tissue analysis to classify MS samples as normal
appearing (NAON) or damaged optic nerves (DON), when
showing macroscopic plaques, atrophy and/or optic neuritis. For
Table 1
Clinical characteristics
Reference Code Gender Age PMD (hours) Duration of
MS (years)
MS type Optic nerve
alterations
MS samples
MS1 98-176 M 83 7:05 52 PP No
MS2 99-054 F 58 8:10 20 SP Yes
MS3 98-185 F 70 8:55 19 PP Yes
MS4 98-158 F 76 16:31 53 SP Yes
MS5 98-087 F 55 7:35 >11 SP No
MS6 98-179 F 60 8:50 36 PP Yes
MS7 99-062 F 79 10:00 44 PP No
MS8 99-025 F 64 7:45 35 SP Yes
MS9 98-066 F 75 4:50 >27 PP/SP No
MS10 01-018 F 48 8:10 8 SP No
MS11 01-003 M 69 10:00 34 PP Yes
MS12 99-119 F 38 5:15 10 RR No
MS13 00-024 F 52 8:25 16 PP/SP Yes
MS14a 99-109 M 70 6:25 22 SP Yes
MS15a 99-121 M 51 7:50 29 SP Yes
MS16a 99-066 M 69 16:45 46 PP No
Control samples
C1, 14, 16 98-101 M 72 6:45
C2, 5 98-125 F 58 6:15
C3 98-104 F 74 7:25
C4 98-051 F 94 16:50
C6 98-061 F 64 6:00
C7 98-042 F 79 9:45
C8 98-148 F 54 5:35
C9 98-112 F 84 9:20
C10, 13 00-050 F 52 6:50
C11 00-090 M 70 7:45
C12 00-025 F 41 13:30
C15 98-127 M 56 5:25
Optic nerve alterations consisted of macroscopic plaques, atrophy and/or optic neuritis.
Abbreviations: Reference, Netherlands Brain Bank bar-coded numbers; A, microarrays; qPCR, real-time quantitative PCR; IH, immunohistochemistry; C,
control; MS, multiple sclerosis; M, male; F, female; PMD, postmortem delay; PP, primary progressive; SP, secondary progressive; RR, relapsing remitting.a These samples have been used only for immunohistochemistry.
A. Vallejo-Illarramendi et al. / Neurobiology of Disease 21 (2006) 154–164 155

comparisons, MS samples were matched with control samples for
age, sex and postmortem delay.
RNA extraction and cDNA synthesis
Total RNA was extracted from optic nerve samples by the
guanidinium/phenol/chloroform method. Synthesis of cDNA was
carried out with a reverse transcription (RT) kit (Applied
Biosystems, Madrid, Spain) using random hexamers as primers.
The reaction mixture was incubated at 48-C for 30 min followed
by 5 min at 95-C to inactivate reverse transcriptase. Mock reverse
transcription (without enzyme) for each sample served as negative
controls.
Microarray procedure
Total RNA extracted from the optic nerves of control and MS
patients was used to synthesize cDNA with a primer containing
poly T and T7 RNA polymerase promoter sequences. Double-
strand cDNA was synthesized by means of the Superscript Choice
System (Invitrogen, Barcelona, Spain), and it was used as a
template for in vitro transcription to generate biotinylated cRNA
(Enzo Diagnostics, Farmingdale, NY). Labeled RNA was purified
with the Qiagen RNeasy Mini Kit spin columns (Qiagen, Hilden,
Germany) and quantified by spectrophotometry. Test3 arrays
(Affymetrix, Santa Clara, CA) were hybridized to check cRNA
integrity before running the expression arrays. In all cases, the
GADPH 3V/5V ratio, indicative of RNA sample quality, was below
2. Labeled cRNAwas fragmented and added to Affymetrix human
genome U133 arrays. After sample hybridization, microarrays
were extensively washed and scanned using a confocal scanner.
Fluorescence intensities were analyzed by Microarray Suite 5.0
software (Affymetrix). The expression level, ‘‘mean intensity’’, for
each gene was determined by calculating the mean of the average
differences of all replicates (perfect match–mistmach oligonucleo-
tides) for each probe set. The data filtering criteria applied were
based on the statistical significance (unpaired t test) of expression
changes, fixed at P < 0.0025.
Real-time quantitative PCR (qPCR)
The levels of expression of the glutamate transporters EAAT1,
EAAT2, EAAT3 and several splice variants as well as the levels of
different MS markers were analyzed using qPCR. Glial fibrillary
acidic protein (GFAP), CD8, tumor necrosis factor-a (TNFa) and2V,3V-cyclic nucleotide 3V-phosphodiesterase (CNPase) were used
as markers of astroglial reactivity, infiltration, inflammation and
oligodendrocyte viability, respectively. Primers (Supplementary
Table 1) were designed with PrimerExpress software (Applied
Biosystems). qPCR reactions were carried out with 20–80 ng of
reverse transcribed RNA and 50–300 nM of forward and reverse
primers (Genotek, Sabadell, Spain) diluted in SYBRGreen PCR
universal master mix reagent (Applied Biosystems) in an ABI
PRISM 7000 Sequence Detection System instrument (Applied
Biosystems). We verified that generated fluorescence was not
overestimated by contamination resulting from residual genomic
DNA amplification (using RT negative controls) and from primer
dimer formation or external DNA contamination (no template
controls). qPCR products were also subjected to a dissociation
protocol to ensure that a single amplicon of the expected melting
temperature was indeed obtained.
The amount of cDNA was calculated from the appropriate
standard curve of a stock cDNA obtained from human optic
nerve. Correlation values were 0.995–0.99996. Duplicate qPCR
reactions were performed for each cDNA sample, and the
standard deviations of the Ct values considered were �0.38.
Several constitutive genes (Supplementary Table 1) were used as
endogenous references to compensate for different RT efficiencies
and normalize the variability in the initial quantities of total RNA
so that accurate comparison of gene expression levels could be
made between the different samples. Target genes were normal-
ized by means of a normalization factor (FN5), based on the
geometric mean of multiple internal control genes and calculated
by recently developed software (Vandesompele et al., 2002). The
best and worst scoring housekeeping genes of the six genes
analyzed were ubiquitin C and cyclophilin A, respectively.
Consequently, we eliminated data from the cyclophilin A gene
and calculated a normalization factor based on the expression
levels of the remaining 5 housekeeping genes (FN5). Expression
of endogenous genes used to normalize is showed in Fig. 2D.
Data are expressed as fold change in gene expression compared
to the matched controls. The relative abundance of the different
transporters or splicing variants was determined by using the DCtmethod (see User Bulletin 2; Applied Biosystems). Normalized
data from qPCR in the control and MS groups were compared by
one tail paired Student’s t test. The Spearman non-parametric test
was used for correlation analysis. All results are expressed as
mean T SEM.
Immunohistochemical analysis
Optic nerve samples for histology (Table 1) were fixed with 4%
formaldehyde in phosphate buffered saline (PBS, pH 7.4) for 4–8
days. Subsequently, they were cryoprotected in 20% sucrose in
PBS and stored at �80-C until cryostat sectioning. Tissue was
permeabilized with 0.1% Triton X-100 in incubation solutions or
with absolute ethanol for 10 min previously to immunohisto-
chemistry procedure.
Conventional immunoperoxidase histochemistry was carried
out as previously described (Domercq et al., 1999). Some
sections were hematoxylin–eosin or luxol fast blue stained,
and others were immunoreacted with antibodies to glial fibril-
lary acid protein (GFAP, 0.1 Ag/ml, Chemicon, Temecula, CA)
or myelin basic protein (MBP, 4 Ag/ml, Sternberger Mono-
clonals, Lutherville, MD) to assess the presence of inflamma-
tion, cellular infiltration, demyelination and astroglial reactivity
in optic nerve samples from MS patients (see Supplementary
Fig. 1).
To evaluate the glutamate transporters expression in human
optic nerve, double immunofluorescence staining was carried out
on normal human optic nerve sections. Longitudinal sections were
incubated for 48 h at 4-C with antibodies to EAAT1 (0.4–1.0 Ag/ml for EAAT1) or EAAT2 (0.05–0.2 Ag/ml for EAAT2) (Rothstein
et al., 1994). Sections were subsequently incubated with antibodies
to adenomatus polyposis coli protein (APC, 2.0 Ag/ml, Calbio-
chem, Darmstadt, Germany), marker for oligodendrocytes (Bhat et
al., 1996) or to GFAP (0.1 Ag/ml, Chemicon), marker for astrocyte-
cytoskeleton. Appropriate fluorescent secondary antibodies were
used for each combination. Control staining was done in the
absence of each one of the primary antibodies. Labeling was
examined with a Zeiss Axioplan photomicroscope. Selected
fluorescence digital microphotographies were deconvoluted using
A. Vallejo-Illarramendi et al. / Neurobiology of Disease 21 (2006) 154–164156

Aquacosmos* software (Hamamatsu, Photonics Iberica, Barce-
lona, Spain) to improve labeling.
Western blot
The level of glutamate transporter expression was determined in
total homogenates of control and MS optic nerves. Samples (10 Agof protein per lane) were loaded and size separated in 10% SDS-
PAGE. Proteins were blotted onto nitrocellulose filters (Amersham
Biosciences, Barcelona, Spain) and incubated with antibodies
directed against EAAT1 (1 Ag/ml, Santa Cruz Biotechnology, Santa
Cruz, CA), EAAT2 (1 Ag/ml) and h-actin (1:1000; Sigma, Madrid,
Spain). Immunoblots were visualized using enhanced chemilumi-
nescence (Pierce, Rockford, IL). Protein bands densitometry was
performed using Scion Image for Windows (Scion, Frederick,
MD), and actin immunoreactivity was used to normalize glutamate
transporters signal.
Glutamate uptake in glial plasmalemmal vesicles
Glial plasmalemmal vesicles (GPV) were obtained from
postmortem human optic nerves according to a procedure
described earlier (Nakamura et al., 1993). Briefly, optic nerves
were homogenized in 0.32 M sucrose, 1 mM EDTA using a
Teflon-glass homogenizer and centrifuged at 1000 � g for 10
min. The supernatant was layered (33,500 � g, 5 min) on a
discontinuous four-step 2, 6, 10 and 20% Percoll (Amersham
Biosciences) gradient, and the GPVs collected at the interface
between 2 and 6% Percoll. GPVs were further centrifuged at
33,500 � g for 20 min.
Glutamate uptake in GPVs was determined at 37-C in saline
solution containing (in mM): NaCl, 140; KCl, 5; MgCl2, 2; CaCl2,
2; HEPES, 10; glucose, 10 (pH 7.4). GPVs were incubated in the
presence of 1 AM of 3H-glutamate, and uptake was stopped by
filtration through glass fiber filter papers (Whatman, Brentford,
UK) in a vacuum filtering manifold. Filters were washed 5 times
with 2 ml of ice-cold PBS within 15 s, and their radioactivity was
counted with a scintillation cocktail. Sodium-dependent uptake
was calculated as the difference between the amount of radio-
activity in the presence of sodium and the amount observed in the
choline-containing buffer.
Preparation of rat optic nerves, drug perfusion and quantification
of glutamate transporter transcripts
Adult male Sprague–Dawley rats were deeply anesthetized
with chloroform and then decapitated. Optic nerves were freed
from their meninges in artificial cerebrospinal fluid (aCSF: 126
mM NaCl, 3 mM KCl, 2 mM MgSO4, 26 mM NaHCO3, 1.25
mM NaH2PO4 and 2 mM CaCl2I2H2O) supplemented with 10
mM glucose. Subsequently, the nerves were placed into a
chamber and perfused for 3 h with oxygen-saturated aCSF, to
which glutamate (1 mM) alone or in the presence of CNQX (30
AM, Sigma) was applied. After perfusion, total RNA was
extracted, and synthesis of cDNA was carried out as described
above. Rat glutamate transporter transcripts GLAST, GLT-1 and
EAAC1, the murine counterparts of human EAAT1, 2 and 3
respectively, were quantified by qPCR as described above, using
the corresponding rat primer pairs (Supplementary Table 1).
Gene expression levels were normalized using three constitutive
genes (see Supplementary Table 1). Normalized data were
compared by a one tail non-paired Student’s t test, and data
expressed as mean T SEM.
Cloning, transfection and transport studies
cDNA amplicons encoding EAAT2 and the EAAT2 exon 7
skipping splice variant were obtained by RT-PCR from control
human optic nerve RNA using the following primer pair:
forward: 5V-CCT GAC ATG GCA TCT ACG GAA G-3V; reverse:5V-ATT TCT CAC GTT TCC AAG G-3V. PCR was carried out
with the Taq Platinum Master Mix (Invitrogen) employing an
annealing temperature of 55-C and an elongation time of 2 min
for 35 cycles. The PCR reaction was purified using the GenElute
PCR DNA Purification kit (Sigma) and ligated into the
pTARGET vector (Promega Corporation, Madison, WI). Tran-
sient transfections into HEK-293 cells were carried out using
LipofectAMINE Plus reagent (Invitrogen). Sodium-dependent
glutamate uptake was performed 3–4 days after transfection, as
described previously (Domercq et al., 1999). Uptake was
measured using 100 nM l-[3H]-glutamic acid in the presence
of increasing concentrations of unlabeled substrate, at 37-C for 5
min. Data are expressed as a mean T SEM of at least 3
independent experiments performed in triplicate. Uptake data
were plotted by nonlinear regression using Prism software
(GraphPAD Software, San Diego, CA).
Results
Analysis of EAAT expression by DNA microarrays
Since glutamate homeostasis is altered in MS (Matute et al.,
2001), we analyzed if the expression of glutamate-related enzymes
as well as glutamate receptors and transporters were altered in this
disease using DNA microarrays. To this end, we used 4 human
optic nerve samples (MS 10, 11, 12, 13; Table 1) obtained at
autopsy from MS patients and matched controls from subjects who
did not suffer any neurological or psychiatric disorder. Of the 193
glutamate-related genes annotated in the DNA microarrays
employed, we found that the expression levels of the glutamate
transporters EAAT1 and EAAT2 were altered in optic nerve MS
samples (average fold increase 1.5 and 1.7, respectively). To
validate these results, we used qPCR and extended this study to
other members of the glutamate transporter family, as described
below.
Molecular characterization of postmortem MS and control tissue
All samples were characterized by studying the expression
levels of GFAP, TNFa, CD8 and CNPase which are commonly
used to analyze MS lesions (Lassmann et al., 1998; Lucchinetti et
al., 1999). This analysis revealed an average increase in the levels
of mRNA encoding GFAP (2.0-fold, P < 0.05), TNFa (5.5-fold,
P < 0.05) and CD8 (8.9-fold, P < 0.05) in MS samples compared
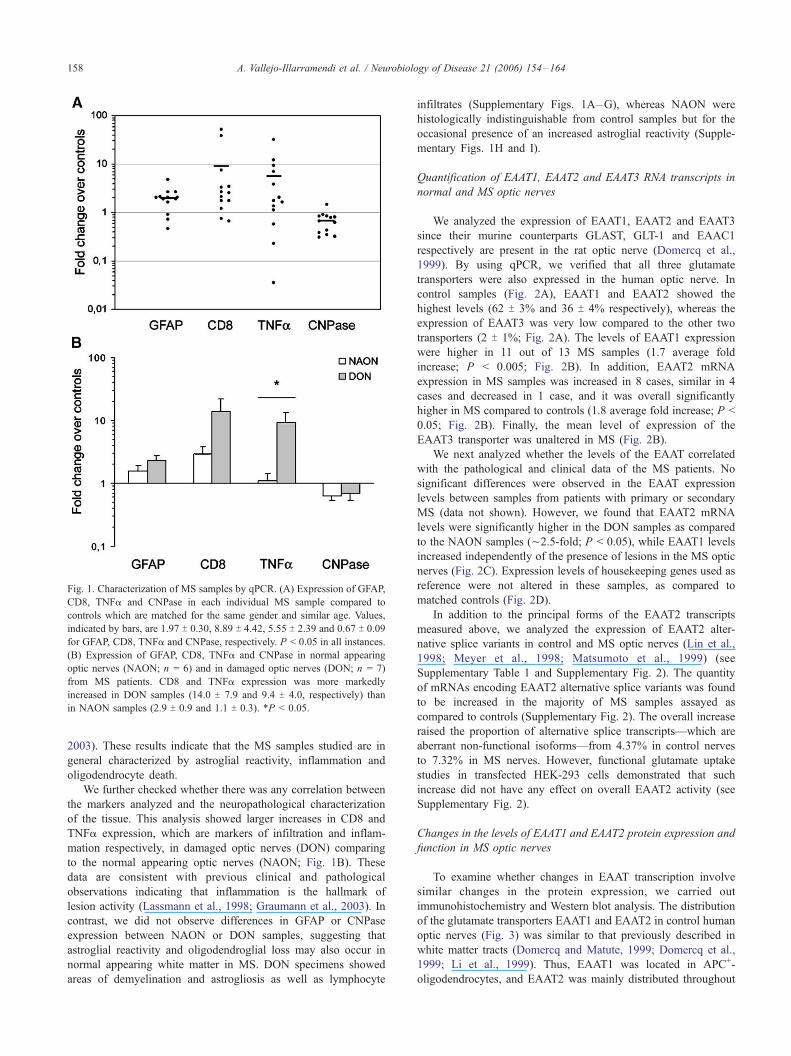
to matched controls (Fig. 1A). In contrast, CNPase expression
showed a significant reduction (0.7-fold, P < 0.05) (Fig. 1A).
Moreover, MBP transcripts were decreased in 8 cases but
increased in the remaining 5 samples. Of these latter samples,
three (MS1, 5 and 8) presented a strong upregulation of MBP, a
feature which is likely indicative of intense remyelinating activity
which has been reported in some MS lesions (Graumann et al.,
A. Vallejo-Illarramendi et al. / Neurobiology of Disease 21 (2006) 154–164 157
2003). These results indicate that the MS samples studied are in
general characterized by astroglial reactivity, inflammation and
oligodendrocyte death.
We further checked whether there was any correlation between
the markers analyzed and the neuropathological characterization
of the tissue. This analysis showed larger increases in CD8 and
TNFa expression, which are markers of infiltration and inflam-
mation respectively, in damaged optic nerves (DON) comparing
to the normal appearing optic nerves (NAON; Fig. 1B). These
data are consistent with previous clinical and pathological
observations indicating that inflammation is the hallmark of
lesion activity (Lassmann et al., 1998; Graumann et al., 2003). In
contrast, we did not observe differences in GFAP or CNPase
expression between NAON or DON samples, suggesting that
astroglial reactivity and oligodendroglial loss may also occur in
normal appearing white matter in MS. DON specimens showed
areas of demyelination and astrogliosis as well as lymphocyte
infiltrates (Supplementary Figs. 1A–G), whereas NAON were
histologically indistinguishable from control samples but for the
occasional presence of an increased astroglial reactivity (Supple-
mentary Figs. 1H and I).
Quantification of EAAT1, EAAT2 and EAAT3 RNA transcripts in
normal and MS optic nerves
We analyzed the expression of EAAT1, EAAT2 and EAAT3
since their murine counterparts GLAST, GLT-1 and EAAC1
respectively are present in the rat optic nerve (Domercq et al.,
1999). By using qPCR, we verified that all three glutamate
transporters were also expressed in the human optic nerve. In
control samples (Fig. 2A), EAAT1 and EAAT2 showed the
highest levels (62 T 3% and 36 T 4% respectively), whereas the
expression of EAAT3 was very low compared to the other two
transporters (2 T 1%; Fig. 2A). The levels of EAAT1 expression
were higher in 11 out of 13 MS samples (1.7 average fold
increase; P < 0.005; Fig. 2B). In addition, EAAT2 mRNA
expression in MS samples was increased in 8 cases, similar in 4
cases and decreased in 1 case, and it was overall significantly
higher in MS compared to controls (1.8 average fold increase; P <
0.05; Fig. 2B). Finally, the mean level of expression of the
EAAT3 transporter was unaltered in MS (Fig. 2B).
We next analyzed whether the levels of the EAAT correlated
with the pathological and clinical data of the MS patients. No
significant differences were observed in the EAAT expression
levels between samples from patients with primary or secondary
MS (data not shown). However, we found that EAAT2 mRNA
levels were significantly higher in the DON samples as compared
to the NAON samples (¨2.5-fold; P < 0.05), while EAAT1 levels
increased independently of the presence of lesions in the MS optic
nerves (Fig. 2C). Expression levels of housekeeping genes used as
reference were not altered in these samples, as compared to
matched controls (Fig. 2D).
In addition to the principal forms of the EAAT2 transcripts
measured above, we analyzed the expression of EAAT2 alter-
native splice variants in control and MS optic nerves (Lin et al.,
1998; Meyer et al., 1998; Matsumoto et al., 1999) (see
Supplementary Table 1 and Supplementary Fig. 2). The quantity
of mRNAs encoding EAAT2 alternative splice variants was found
to be increased in the majority of MS samples assayed as
compared to controls (Supplementary Fig. 2). The overall increase
raised the proportion of alternative splice transcripts—which are
aberrant non-functional isoforms—from 4.37% in control nerves
to 7.32% in MS nerves. However, functional glutamate uptake
studies in transfected HEK-293 cells demonstrated that such
increase did not have any effect on overall EAAT2 activity (see
Supplementary Fig. 2).
Changes in the levels of EAAT1 and EAAT2 protein expression and
function in MS optic nerves
To examine whether changes in EAAT transcription involve
similar changes in the protein expression, we carried out
immunohistochemistry and Western blot analysis. The distribution
of the glutamate transporters EAAT1 and EAAT2 in control human
optic nerves (Fig. 3) was similar to that previously described in
white matter tracts (Domercq and Matute, 1999; Domercq et al.,
1999; Li et al., 1999). Thus, EAAT1 was located in APC+-
oligodendrocytes, and EAAT2 was mainly distributed throughout
Fig. 1. Characterization of MS samples by qPCR. (A) Expression of GFAP,
CD8, TNFa and CNPase in each individual MS sample compared to
controls which are matched for the same gender and similar age. Values,
indicated by bars, are 1.97 T 0.30, 8.89 T 4.42, 5.55 T 2.39 and 0.67 T 0.09
for GFAP, CD8, TNFa and CNPase, respectively. P < 0.05 in all instances.
(B) Expression of GFAP, CD8, TNFa and CNPase in normal appearing
optic nerves (NAON; n = 6) and in damaged optic nerves (DON; n = 7)
from MS patients. CD8 and TNFa expression was more markedly
increased in DON samples (14.0 T 7.9 and 9.4 T 4.0, respectively) than
in NAON samples (2.9 T 0.9 and 1.1 T 0.3). *P < 0.05.
A. Vallejo-Illarramendi et al. / Neurobiology of Disease 21 (2006) 154–164158
GFAP+-astroglial processes (Fig. 3). The cell types expressing both
glutamate transporters were identical in MS and in control optic
nerves. However, immunoreactivity was more intense for EAAT1
and EAAT2 in MS optic nerves (data not shown). In agreement
with immunohistochemistry data, protein levels of EAAT1 and
EAAT2 showed about a two-fold increase in MS optic nerves
homogenates, as revealed by immunoblot analysis (n = 13; P <
0.05; Fig. 4A).
Finally, we analyzed whether the increase in EAAT1 and
EAAT2 transporters in MS samples was relevant to glutamate
uptake in these samples. To this end, we used a preparation of
glial plasmalemmal vesicles (GPVs) which shows a high
activity of glutamate uptake (Nakamura et al., 1993). GPVs
derived from human optic nerve showed low levels of glutamate
uptake (12.4 pmol/mg prot/min) as compared to GPV from
other brain regions (see Nakamura et al., 1993). However, we
detected a significant increase, about two-fold, in Na+-dependent
glutamate uptake in GPVs from MS optic nerves compared to
control GPVs (n = 6; P < 0.05; Fig. 4B), indicating that the
function of EAAT transporters is substantially enhanced in MS
optic nerves.
Glutamate induces glutamate transporter upregulation in rat optic
nerves
Upregulation of glutamate transporters in MS optic nerves
could be an adaptive and protective response to altered levels of
glutamate observed in this demyelinating disease (Sarchielli et al.,
2003). To test this possibility, we evaluated whether elevated
concentrations of glutamate are sufficient to induce an upregulation
of EAATs in optic nerves. To this end, isolated adult rat optic
nerves were perfused with oxygen-saturated aCSF, and expression
of glutamate transporters was assayed by qPCR. We found that the
proportion of the glutamate transporters GLAST, GLT-1 and
EAAC1, which are the rat homologs of EAAT1, 2 and 3 in rat
optic nerves, was 50 T 4%, 49% T 4% and virtually absent,
respectively (Fig. 5A). Addition of glutamate (1 mM, 3 h) to the
perfusate resulted in a significant increase of about 1.4-fold in the
expression of GLAST and GLT1 compared with controls (n = 5;
Fig. 5B). This effect was partially blocked by adding to the
perfusate the AMPA/kainate receptor antagonist CNQX. This
result indicates that glutamate upregulates the glutamate trans-
porters GLAST and GLT1 in rat optic nerves, a mechanism that
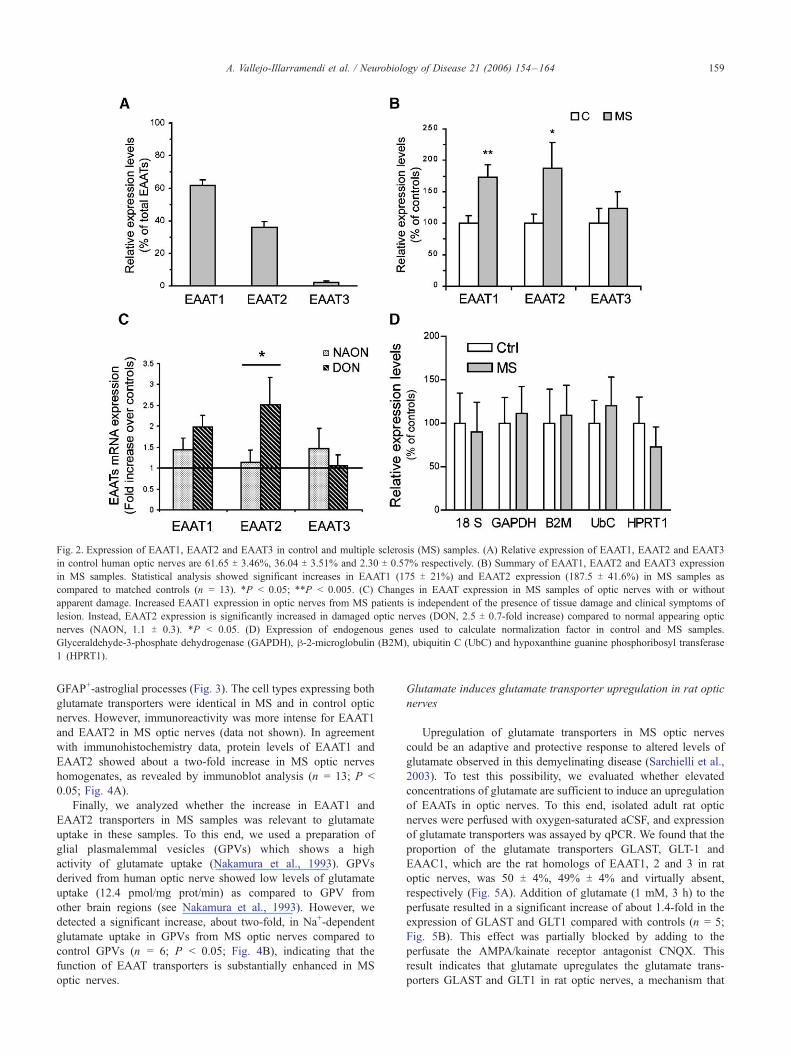
Fig. 2. Expression of EAAT1, EAAT2 and EAAT3 in control and multiple sclerosis (MS) samples. (A) Relative expression of EAAT1, EAAT2 and EAAT3
in control human optic nerves are 61.65 T 3.46%, 36.04 T 3.51% and 2.30 T 0.57% respectively. (B) Summary of EAAT1, EAAT2 and EAAT3 expression
in MS samples. Statistical analysis showed significant increases in EAAT1 (175 T 21%) and EAAT2 expression (187.5 T 41.6%) in MS samples as
compared to matched controls (n = 13). *P < 0.05; **P < 0.005. (C) Changes in EAAT expression in MS samples of optic nerves with or without
apparent damage. Increased EAAT1 expression in optic nerves from MS patients is independent of the presence of tissue damage and clinical symptoms of
lesion. Instead, EAAT2 expression is significantly increased in damaged optic nerves (DON, 2.5 T 0.7-fold increase) compared to normal appearing optic
nerves (NAON, 1.1 T 0.3). *P < 0.05. (D) Expression of endogenous genes used to calculate normalization factor in control and MS samples.
Glyceraldehyde-3-phosphate dehydrogenase (GAPDH), h-2-microglobulin (B2M), ubiquitin C (UbC) and hypoxanthine guanine phosphoribosyl transferase
1 (HPRT1).
A. Vallejo-Illarramendi et al. / Neurobiology of Disease 21 (2006) 154–164 159
constitutes a possible adaptive response to elevated concentrations
of glutamate.
Discussion
The results reported here indicate that the expression of the
glutamate transporters EAAT1 and EAAT2 is increased in
postmortem optic nerves from MS patients. EAAT1 is the most
abundant glutamate transporter transcript in human optic nerves,
and its expression is consistently higher in the MS samples
examined. In contrast, upregulation of EAAT2 expression in optic
nerves from MS patients correlates with the presence of damage. In
addition, we also observed increases in the expression of EAAT1
and EAAT2 protein. Moreover, we present evidence indicating that
the increase in EAAT1 and EAAT2 transporter expression is
relevant to glutamate uptake.
EAAT1 and EAAT2 glutamate transporter expression and
function are positively regulated by the presence of extracellular
glutamate (Thorlin et al., 1998; Duan et al., 1999). In addition,
enhanced expression of glutamate transporters has also been
detected in experimental paradigms involving increased glutamate
levels and neurodegeneration. Thus, upregulation of glutamate
transporters occurs in the retina after optic nerve crush and in
traumatic lesions to the spinal cord (Vera-Portocarrero et al.,
2002; Mawrin et al., 2003). Inflammation following facial nerve
axotomy, cortical injury or chronic infection with the simian
immunodeficiency virus results in an increased expression of
GLAST and GLT-1 in microglial cells (Lopez-Redondo et al.,
2000; Van Landeghem et al., 2001; Chretien et al., 2002).
Moreover, restraint stress leads to higher glutamate levels in the
hippocampus which renders neurons more vulnerable to neuro-
toxic insults (Lowy et al., 1995), despite a concomitant
upregulation of the GLT-1/EAAT2 transporter (Reagan et al.,
2004). Consistent with these findings, we also observed that
glutamate increases the expression of EAAT1 and EAAT2
glutamate transporters in the optic nerve. Therefore, the enhanced
expression of EAAT1 and EAAT2 in optic nerves from MS
patients reported in this study may be reflecting an adaptive
molecular change to limit glutamate excitotoxicity and ensuing
neurodegeneration. Indeed, a recent DNA microarray study in MS
samples showed upregulation of genes characteristic of neuro-
protective mechanisms against hypoxia (Graumann et al., 2003),
a condition which causes oligodendrocyte death (Lyons and
Kettenmann, 1998) and which can be prevented by glutamate
receptor antagonists (Matute et al., 1997; Tekkok and Goldberg,
2001).
In contrast to our findings, a previous immunohistochemical
study described decreased EAAT2 expression in oligodendrocytes
of spinal cord white matter in subjects with MS (Werner et al.,
2001). However, we did not detect EAAT2 expression in
oligodendrocytes in human optic nerve samples, in agreement
with previous findings in other species or regions (Rothstein et al.,
1994; Milton et al., 1997; Domercq et al., 1999; Li et al., 1999). In
addition, we observed that the increase in EAAT2 protein
correlates with the change observed in EAAT2 transcripts. The
apparent discrepancy with the previous study (Werner et al., 2001)
could be explained by differences in the regions analyzed, in the
antibodies used, the procedures to fix tissues and/or the disease
stages examined.
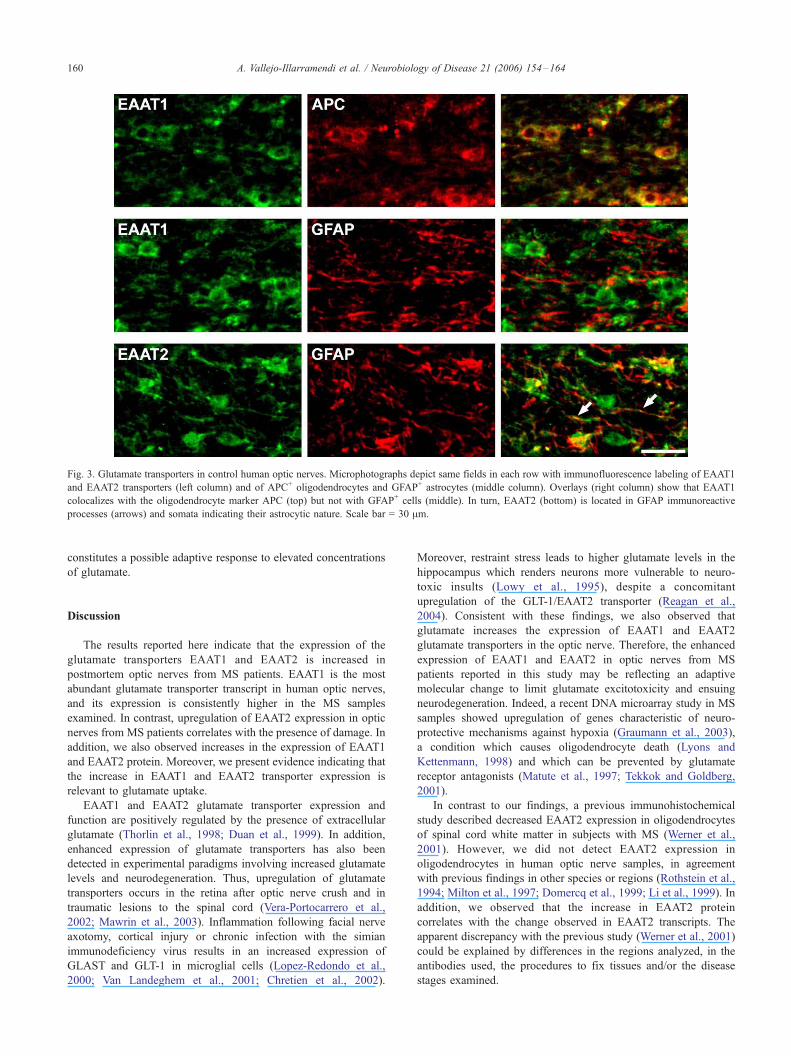
Fig. 3. Glutamate transporters in control human optic nerves. Microphotographs depict same fields in each row with immunofluorescence labeling of EAAT1
and EAAT2 transporters (left column) and of APC+ oligodendrocytes and GFAP+ astrocytes (middle column). Overlays (right column) show that EAAT1
colocalizes with the oligodendrocyte marker APC (top) but not with GFAP+ cells (middle). In turn, EAAT2 (bottom) is located in GFAP immunoreactive
processes (arrows) and somata indicating their astrocytic nature. Scale bar = 30 Am.
A. Vallejo-Illarramendi et al. / Neurobiology of Disease 21 (2006) 154–164160

Several lines of evidence support the idea that the extracellular
concentration of glutamate is increased in MS. Thus, the
concentration of glutamate in cerebrospinal fluid is higher in
acute than in silent MS and controls (Stover et al., 1997), and it
is associated with the severity and course of the disease
(Barkhatova et al., 1998). Similarly, glutamate levels are
increased in the cerebrospinal fluid of secondary progressive
MS patients (Sarchielli et al., 2003). In serum, glutamate rises
gradually a month or two prior to the onset of clinical relapse to
reach a peak during relapse and then slowly declines (Westall et
al., 1980). Finally, a rise in glutamate and glutamine content has
been detected in MS white matter by proton magnetic resonance
spectroscopic imaging (Tourbah et al., 1999; Srinivasan et al.,
2005). Collectively, these findings indicate that glutamate homeo-
stasis is altered in MS and that high glutamate levels are
associated with this disease.
Several features may account for the increased levels of
glutamate observed in the CNS of MS patients. The rate of
glutamate entry across the blood–brain barrier under physiological
conditions is very low (Oldendorf and Szabo, 1976; Betz et al.,
1994). This creates a steep gradient in glutamate concentration
between the bloodstream (Divino Filho et al., 1998) and the
extracellular space in the CNS (Danbolt, 2001). Indeed, the
concentration of glutamate and other excitatory amino acids in
the CNS parenchyma significantly increases following experimen-
tal opening of the blood–brain barrier (Westergren et al., 1994).
Thus, blood–brain barrier distortion due to MS-associated
inflammation results in glutamate flooding of the CNS and
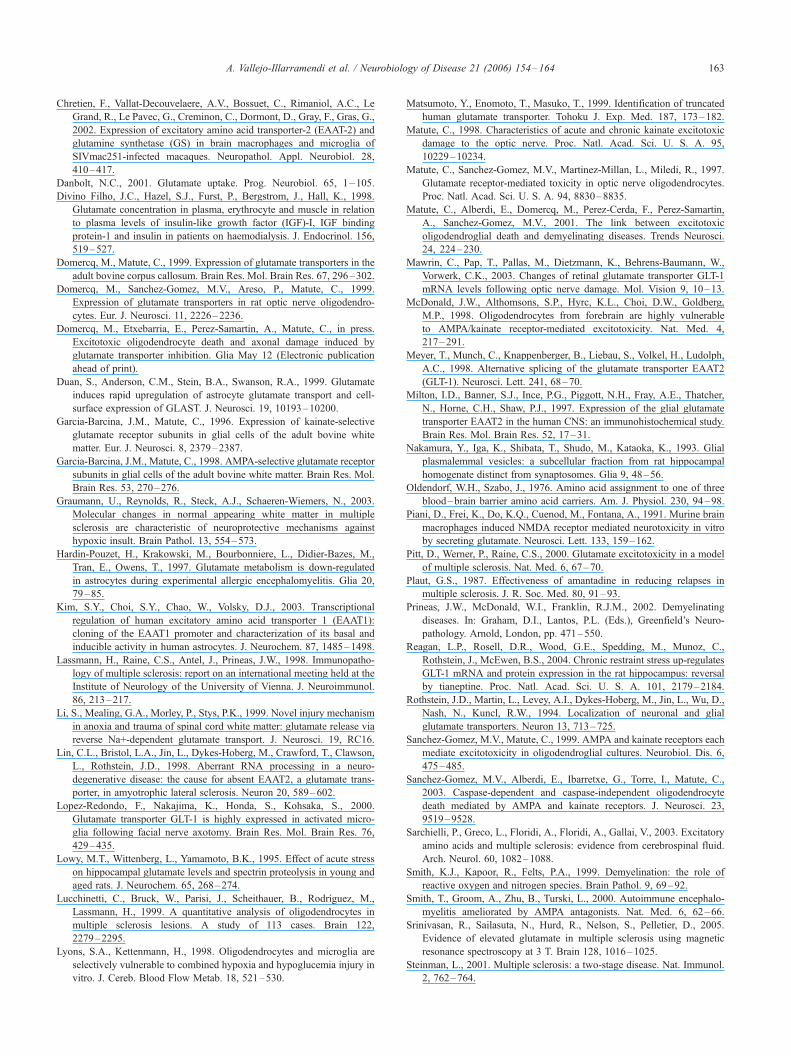
Fig. 4. Quantitative analysis of EAAT protein levels and function in optic nerves from MS patients and matched controls. (A) Western blot analysis of
EAAT1 and EAAT2 protein levels in control and MS optic nerves. Representative samples from each group and histograms showing the average density in
EAAT1 and EAAT2 transporters, normalized to h-actin, in MS optic nerves and matched controls (n = 13; *P < 0.05, **P < 0.01). (B) Na+-dependent
glutamate uptake determined in glial plasmalemmal vesicles from control and MS optic nerves. A significant increase in uptake in MS optic nerves was
detected (n = 6; *P < 0.05).
A. Vallejo-Illarramendi et al. / Neurobiology of Disease 21 (2006) 154–164 161
subsequent increase in the concentration of this amino acid
(Oldendorf and Szabo, 1976; Betz et al., 1994) which can
jeopardize the viability of oligodendrocytes which are highly
vulnerable to excitotoxicity (Matute et al., 1997; McDonald et al.,
1998). Furthermore, alterations in the glutamate producing enzyme
glutaminase in close proximity to dystrophic axons in MS have
been detected in activated macrophages/microglia (Werner et al.,
2001), a cell lineage which has the potential to produce and release
glutamate (Piani et al., 1991). Therefore, in addition to direct
glutamate leakage from the bloodstream, activated macrophages/
microglia in MS may also contribute to increases in the
concentration of local glutamate. Finally, glutamate transporter
activity is inhibited by reactive oxygen species (Trotti et al., 1998),
which are known players of MS neuropathology (Smith et al.,
1999) and thus impair further glutamate homeostasis.
EAAT1 and EAAT2 transporters are differently modulated in
the MS samples studied. This is probably because they are
expressed in different cell types, astrocytes vs. oligodendrocytes,
which respond differently to environmental changes. Indeed,
EAAT1 promoter activity is cell-type dependent and varies greatly
among the cells tested (Kim et al., 2003). Intriguingly, EAAT1
expression is consistently augmented in MS samples including
normally appearing optic nerves. This suggests that oligodendro-
cytes react more readily to subtle changes in glutamate concen-
tration, probably as a mechanism to limit excitotoxicity. Indeed,
inhibition of expression and functioning of glutamate transporters
in isolated optic nerves, which induces a three-fold increase in
extracellular glutamate, damages oligodendrocytes and induces
demyelination (Domercq et al., in press). The expression of
glutamate receptors by oligodendrocytes (Garcia-Barcina and
Matute, 1996, 1998) may provide a sensor by means of which
these cells regulate EAAT1. Determination of these early molecular
alterations in normal appearing white matter in MS can be useful to
elucidate the mechanisms of lesion formation and to develop new
treatments (Graumann et al., 2003).
In conclusion, the present study provides evidence for an
increased expression of EAAT1 and EAAT2 glutamate transporters
in the optic nerves of MS subjects that correlates with an increase
in glutamate uptake in these patients. Enhanced expression of
glutamate transporters may reflect a mechanism to limit oligoden-
drocyte excitotoxicity caused by high glutamate levels in MS.
Potentiation of this adaptive response with positive transcriptional
regulators of glutamate transporter expression such as EGF or h-lactams may prove to be of therapeutical value in the treatment of
MS.
Acknowledgments
Supported by Fundacion ‘‘La Caixa’’, Ministerio de Salud y
Consumo, Gobierno Vasco and the Universidad del Paıs Vasco. We
thank Dr. M.M. Panicker for advice in cloning and transfection
experiments and Dr. D.J. Fogarty for having corrected the English
of the manuscript. AV-I and MD hold fellowships from the
Gobierno Vasco.
Appendix A. Supplementary data
Supplementary data associated with this article can be found, in
the online version, at doi:10.1016/j.nbd.2005.06.017.
References
Arriza, J.L., Fairman, W.A., Wadiche, J.I., Murdoch, G.H., Kavanaugh,
M.P., Amara, S.G., 1994. Functional comparisons of three glutamate
transporter subtypes cloned from human motor cortex. J. Neurosci. 14,
5559–5569.
Barkhatova, V.P., Zavalishin, I.A., Askarova, L.Sh., Shavratskii, V.Kh.,
Demina, E.G., 1998. Changes in neurotransmitters in multiple sclerosis.
Neurosci. Behav. Physiol. 28, 341–344.
Betz, A.L., Goldstein, G.W., Katzman, R., 1994. Blood–brain–cerebro-
spinal fluid barriers. In: Siegel, G., Agranoff, B., Albers, R.W.,
Molinoff, P.B. (Eds.), Basic Neurochemistry: Molecular, Cellular and
Medical Aspects. Raven Press, New York, pp. 681–699.
Bhat, R.V., Axt, K.J., Fosnaugh, J.S., Smith, K.J., Jonson, K.A., Hill, D.E.,
Kinzler, K.W., Baraban, J.M., 1996. Expression of the APC tumor
suppressor protein in oligodendroglia. Glia 17, 169–174.
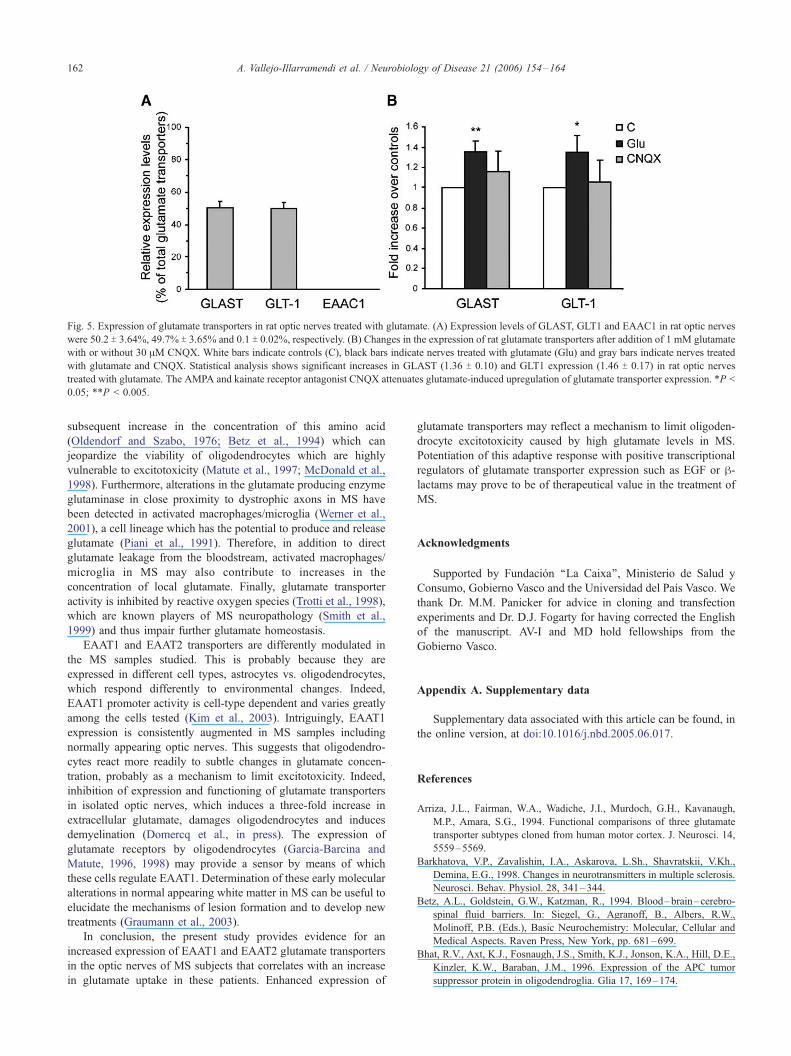
Fig. 5. Expression of glutamate transporters in rat optic nerves treated with glutamate. (A) Expression levels of GLAST, GLT1 and EAAC1 in rat optic nerves
were 50.2 T 3.64%, 49.7% T 3.65% and 0.1 T 0.02%, respectively. (B) Changes in the expression of rat glutamate transporters after addition of 1 mM glutamate
with or without 30 AM CNQX. White bars indicate controls (C), black bars indicate nerves treated with glutamate (Glu) and gray bars indicate nerves treated
with glutamate and CNQX. Statistical analysis shows significant increases in GLAST (1.36 T 0.10) and GLT1 expression (1.46 T 0.17) in rat optic nerves
treated with glutamate. The AMPA and kainate receptor antagonist CNQX attenuates glutamate-induced upregulation of glutamate transporter expression. *P <
0.05; **P < 0.005.
A. Vallejo-Illarramendi et al. / Neurobiology of Disease 21 (2006) 154–164162
Chretien, F., Vallat-Decouvelaere, A.V., Bossuet, C., Rimaniol, A.C., Le
Grand, R., Le Pavec, G., Creminon, C., Dormont, D., Gray, F., Gras, G.,
2002. Expression of excitatory amino acid transporter-2 (EAAT-2) and
glutamine synthetase (GS) in brain macrophages and microglia of
SIVmac251-infected macaques. Neuropathol. Appl. Neurobiol. 28,
410–417.
Danbolt, N.C., 2001. Glutamate uptake. Prog. Neurobiol. 65, 1–105.
Divino Filho, J.C., Hazel, S.J., Furst, P., Bergstrom, J., Hall, K., 1998.
Glutamate concentration in plasma, erythrocyte and muscle in relation
to plasma levels of insulin-like growth factor (IGF)-I, IGF binding
protein-1 and insulin in patients on haemodialysis. J. Endocrinol. 156,
519–527.
Domercq, M., Matute, C., 1999. Expression of glutamate transporters in the
adult bovine corpus callosum. Brain Res. Mol. Brain Res. 67, 296–302.
Domercq, M., Sanchez-Gomez, M.V., Areso, P., Matute, C., 1999.
Expression of glutamate transporters in rat optic nerve oligodendro-
cytes. Eur. J. Neurosci. 11, 2226–2236.
Domercq, M., Etxebarria, E., Perez-Samartin, A., Matute, C., in press.
Excitotoxic oligodendrocyte death and axonal damage induced by
glutamate transporter inhibition. Glia May 12 (Electronic publication
ahead of print).
Duan, S., Anderson, C.M., Stein, B.A., Swanson, R.A., 1999. Glutamate
induces rapid upregulation of astrocyte glutamate transport and cell-
surface expression of GLAST. J. Neurosci. 19, 10193–10200.
Garcia-Barcina, J.M., Matute, C., 1996. Expression of kainate-selective
glutamate receptor subunits in glial cells of the adult bovine white
matter. Eur. J. Neurosci. 8, 2379–2387.
Garcia-Barcina, J.M., Matute, C., 1998. AMPA-selective glutamate receptor
subunits in glial cells of the adult bovine white matter. Brain Res. Mol.
Brain Res. 53, 270–276.
Graumann, U., Reynolds, R., Steck, A.J., Schaeren-Wiemers, N., 2003.
Molecular changes in normal appearing white matter in multiple
sclerosis are characteristic of neuroprotective mechanisms against
hypoxic insult. Brain Pathol. 13, 554–573.
Hardin-Pouzet, H., Krakowski, M., Bourbonniere, L., Didier-Bazes, M.,
Tran, E., Owens, T., 1997. Glutamate metabolism is down-regulated
in astrocytes during experimental allergic encephalomyelitis. Glia 20,
79–85.
Kim, S.Y., Choi, S.Y., Chao, W., Volsky, D.J., 2003. Transcriptional
regulation of human excitatory amino acid transporter 1 (EAAT1):
cloning of the EAAT1 promoter and characterization of its basal and
inducible activity in human astrocytes. J. Neurochem. 87, 1485–1498.
Lassmann, H., Raine, C.S., Antel, J., Prineas, J.W., 1998. Immunopatho-
logy of multiple sclerosis: report on an international meeting held at the
Institute of Neurology of the University of Vienna. J. Neuroimmunol.
86, 213–217.
Li, S., Mealing, G.A., Morley, P., Stys, P.K., 1999. Novel injury mechanism
in anoxia and trauma of spinal cord white matter: glutamate release via
reverse Na+-dependent glutamate transport. J. Neurosci. 19, RC16.
Lin, C.L., Bristol, L.A., Jin, L., Dykes-Hoberg, M., Crawford, T., Clawson,
L., Rothstein, J.D., 1998. Aberrant RNA processing in a neuro-
degenerative disease: the cause for absent EAAT2, a glutamate trans-
porter, in amyotrophic lateral sclerosis. Neuron 20, 589–602.
Lopez-Redondo, F., Nakajima, K., Honda, S., Kohsaka, S., 2000.
Glutamate transporter GLT-1 is highly expressed in activated micro-
glia following facial nerve axotomy. Brain Res. Mol. Brain Res. 76,
429–435.
Lowy, M.T., Wittenberg, L., Yamamoto, B.K., 1995. Effect of acute stress
on hippocampal glutamate levels and spectrin proteolysis in young and
aged rats. J. Neurochem. 65, 268–274.
Lucchinetti, C., Bruck, W., Parisi, J., Scheithauer, B., Rodrıguez, M.,
Lassmann, H., 1999. A quantitative analysis of oligodendrocytes in
multiple sclerosis lesions. A study of 113 cases. Brain 122,
2279–2295.
Lyons, S.A., Kettenmann, H., 1998. Oligodendrocytes and microglia are
selectively vulnerable to combined hypoxia and hypoglucemia injury in
vitro. J. Cereb. Blood Flow Metab. 18, 521–530.
Matsumoto, Y., Enomoto, T., Masuko, T., 1999. Identification of truncated
human glutamate transporter. Tohoku J. Exp. Med. 187, 173–182.
Matute, C., 1998. Characteristics of acute and chronic kainate excitotoxic
damage to the optic nerve. Proc. Natl. Acad. Sci. U. S. A. 95,
10229–10234.
Matute, C., Sanchez-Gomez, M.V., Martinez-Millan, L., Miledi, R., 1997.
Glutamate receptor-mediated toxicity in optic nerve oligodendrocytes.
Proc. Natl. Acad. Sci. U. S. A. 94, 8830–8835.
Matute, C., Alberdi, E., Domercq, M., Perez-Cerda, F., Perez-Samartin,
A., Sanchez-Gomez, M.V., 2001. The link between excitotoxic
oligodendroglial death and demyelinating diseases. Trends Neurosci.
24, 224–230.
Mawrin, C., Pap, T., Pallas, M., Dietzmann, K., Behrens-Baumann, W.,
Vorwerk, C.K., 2003. Changes of retinal glutamate transporter GLT-1
mRNA levels following optic nerve damage. Mol. Vision 9, 10–13.
McDonald, J.W., Althomsons, S.P., Hyrc, K.L., Choi, D.W., Goldberg,
M.P., 1998. Oligodendrocytes from forebrain are highly vulnerable
to AMPA/kainate receptor-mediated excitotoxicity. Nat. Med. 4,
217–291.
Meyer, T., Munch, C., Knappenberger, B., Liebau, S., Volkel, H., Ludolph,
A.C., 1998. Alternative splicing of the glutamate transporter EAAT2
(GLT-1). Neurosci. Lett. 241, 68–70.
Milton, I.D., Banner, S.J., Ince, P.G., Piggott, N.H., Fray, A.E., Thatcher,
N., Horne, C.H., Shaw, P.J., 1997. Expression of the glial glutamate
transporter EAAT2 in the human CNS: an immunohistochemical study.
Brain Res. Mol. Brain Res. 52, 17–31.
Nakamura, Y., Iga, K., Shibata, T., Shudo, M., Kataoka, K., 1993. Glial
plasmalemmal vesicles: a subcellular fraction from rat hippocampal
homogenate distinct from synaptosomes. Glia 9, 48–56.
Oldendorf, W.H., Szabo, J., 1976. Amino acid assignment to one of three
blood–brain barrier amino acid carriers. Am. J. Physiol. 230, 94–98.
Piani, D., Frei, K., Do, K.Q., Cuenod, M., Fontana, A., 1991. Murine brain
macrophages induced NMDA receptor mediated neurotoxicity in vitro
by secreting glutamate. Neurosci. Lett. 133, 159–162.
Pitt, D., Werner, P., Raine, C.S., 2000. Glutamate excitotoxicity in a model
of multiple sclerosis. Nat. Med. 6, 67–70.
Plaut, G.S., 1987. Effectiveness of amantadine in reducing relapses in
multiple sclerosis. J. R. Soc. Med. 80, 91–93.
Prineas, J.W., McDonald, W.I., Franklin, R.J.M., 2002. Demyelinating
diseases. In: Graham, D.I., Lantos, P.L. (Eds.), Greenfield’s Neuro-
pathology. Arnold, London, pp. 471–550.
Reagan, L.P., Rosell, D.R., Wood, G.E., Spedding, M., Munoz, C.,
Rothstein, J., McEwen, B.S., 2004. Chronic restraint stress up-regulates
GLT-1 mRNA and protein expression in the rat hippocampus: reversal
by tianeptine. Proc. Natl. Acad. Sci. U. S. A. 101, 2179–2184.
Rothstein, J.D., Martin, L., Levey, A.I., Dykes-Hoberg, M., Jin, L., Wu, D.,
Nash, N., Kuncl, R.W., 1994. Localization of neuronal and glial
glutamate transporters. Neuron 13, 713–725.
Sanchez-Gomez, M.V., Matute, C., 1999. AMPA and kainate receptors each
mediate excitotoxicity in oligodendroglial cultures. Neurobiol. Dis. 6,
475–485.
Sanchez-Gomez, M.V., Alberdi, E., Ibarretxe, G., Torre, I., Matute, C.,
2003. Caspase-dependent and caspase-independent oligodendrocyte
death mediated by AMPA and kainate receptors. J. Neurosci. 23,
9519–9528.
Sarchielli, P., Greco, L., Floridi, A., Floridi, A., Gallai, V., 2003. Excitatory
amino acids and multiple sclerosis: evidence from cerebrospinal fluid.
Arch. Neurol. 60, 1082–1088.
Smith, K.J., Kapoor, R., Felts, P.A., 1999. Demyelination: the role of
reactive oxygen and nitrogen species. Brain Pathol. 9, 69–92.
Smith, T., Groom, A., Zhu, B., Turski, L., 2000. Autoimmune encephalo-
myelitis ameliorated by AMPA antagonists. Nat. Med. 6, 62–66.
Srinivasan, R., Sailasuta, N., Hurd, R., Nelson, S., Pelletier, D., 2005.
Evidence of elevated glutamate in multiple sclerosis using magnetic
resonance spectroscopy at 3 T. Brain 128, 1016–1025.
Steinman, L., 2001. Multiple sclerosis: a two-stage disease. Nat. Immunol.
2, 762–764.
A. Vallejo-Illarramendi et al. / Neurobiology of Disease 21 (2006) 154–164 163

Steinman, L., Martin, R., Bernard, C., Conlon, P., Oksenberg, J.R., 2002.
Multiple sclerosis: deeper understanding of its pathogenesis reveals new
targets for therapy. Annu. Rev. Neurosci. 25, 491–505.
Stover, J.F., Pleines, U.E., Morganti-Kossmann, M.C., Kossmann, T.,
Lowitzsch, K., Kempski, O.S., 1997. Neurotransmitters in cerebrospinal
fluid reflect pathological activity. Eur. J. Clin. Invest. 27, 1038–1043.
Tekkok, S.B., Goldberg, M.P., 2001. Ampa/kainate receptor activation
mediates hypoxic oligodendrocyte death and axonal injury in cerebral
white matter. J. Neurosci. 21, 4237–4248.
Thorlin, T., Roginski, R.S., Choudhury, K., Nilsson, M., Ronnback, L.,
Hansson, E., Eriksson, P.S., 1998. Regulation of the glial glutamate
transporter GLT-1 by glutamate and delta-opioid receptor stimulation.
FEBS Lett. 425, 453–459.
Tourbah, A., Stievenart, J.L., Gout, O., Fontaine, B., Liblau, R., Lubetzki,
C., Cabanis, E.A., Lyon-Caen, O., 1999. Localized proton magnetic
resonance spectroscopy in relapsing remitting versus secondary pro-
gressive multiple sclerosis. Neurology 53, 1091–1097.
Trapp, B.D., Peterson, J., Ransohoff, R.M., Rudick, R., Mork, S., Bo, L.,
1998. Axonal transection in the lesions of multiple sclerosis. N. Engl. J.
Med. 338, 278–285.
Trotti, D., Danbolt, N.C., Volterra, A., 1998. Glutamate transporters are
oxidant-vulnerable: a molecular link between oxidative and excitotoxic
neurodegeneration? Trends Pharmacol. Sci. 19, 328–334.
Vandesompele, J., De Preter, K., Pattyn, F., Poppe, B., Van Roy, N., De
Paepe, A., Speleman, F., 2002. Accurate normalization of real-time
quantitative RT-PCR data by geometric averaging of multiple internal
control genes. Genome Biol. 3, 1–11.
Van Landeghem, F.K., Stover, J.F., Bechmann, I., Bruck, W., Unterberg, A.,
Buhrer, C., von Deimling, A., 2001. Early expression of glutamate
transporter proteins in ramified microglia after controlled cortical
impact injury in the rat. Glia 35, 167–179.
Vera-Portocarrero, L.P., Mills, C.D., Ye, Z., Fullwood, S.D., McAdoo,
D.J., Hulsebosch, C.E., Westlund, K.N., 2002. Rapid changes in
expression of glutamate transporters after spinal cord injury. Brain
Res. 927, 104–110.
Wallstrom, E., Diener, P., Ljungdahl, A., Khademi, M., Nilsson, C.G.,
Olsson, T., 1996. Memantine abrogates neurological deficits, but not
CNS inflammation, in Lewis rat experimental autoimmune encephalo-
myelitis. J. Neurol. Sci. 137, 89–96.
Weiner, H.L., Selkoe, D.J., 2002. Inflammation and therapeutic vaccination
in CNS diseases. Nature 420, 879–884.
Werner, P., Pitt, D., Raine, C.S., 2001. Multiple sclerosis: altered glutamate
homeostasis in lesions correlates with oligodendrocyte and axonal
damage. Ann. Neurol. 50, 169–180.
Westall, F.C., Hawkins, A., Ellison, G.W., Myers, L.W., 1980. Abnormal
glutamic acid metabolism in multiple sclerosis. J. Neurol. Sci. 47,
353–364.
Westergren, I., Nystrom, B., Hamberger, A., Nordborg, C., Johansson, B.B.,
1994. Concentrations of amino acids in extracellular fluid after opening
of the blood–brain barrier by intracarotid infusion of protamine sulfate.
J. Neurochem. 62, 159–165.
Wucherpfennig, K.W., Catz, I., Hausmann, S., Strominger, J.L., Steinman,
L., Warren, K.G., 1997. Recognition of the immunodominant myelin
basic protein peptide by autoantibodies and HLA-DR-2-restricted T cell
clones from multiple sclerosis patients. Identity of key contact residues
in the B-cell and T-cell epitopes. J. Clin. Invest. 100, 1114–1122.
A. Vallejo-Illarramendi et al. / Neurobiology of Disease 21 (2006) 154–164164