Regulation of mesangial cell apoptosis and proliferation by intracellular Ca2+ signals
Upload
independentCategory
view
0download
0

Cellular and Molecular Methods in Neuroscience Research

Merighi-FMnew order i-xiv.qxd 5/23/02 4:55 PM Page ii

Adalberto MerighiGiorgio CarmignotoEditors
Cellular and Molecular Methods in Neuroscience Research
Foreword by A. Claudio Cuello
With 66 Illustrations
Merighi-FMnew order i-xiv.qxd 5/23/02 4:55 PM Page iii

Adalberto Merighi DVM Giorgio CarmignotoDepartment of Veterinary Morphophysiology Department of Experimental and Biomedical SciencesRita Levi Montalcini Center Brain Repair CNR Center for the Study of BiomembranesUniversity of Torino University of PadovaGruglasco I-10095, Italy Padova I-35121, Italy
Library of Congress Cataloging-in-Publication DataCellular and molecular methods in neuroscience research / editors, Adalberto Merighi,Giorgio Carmignoto.
p. cm.Includes bibliographical references and index.ISBN 0-387-95386-8 (alk. paper)1. Molecular neurobiology—Laboratory manuals. 2. Neurons—Laboratory manuals.
1. Merighi, Adalberto. II. Carmignoto, Giorgio.QP356.2 .C45 2002
573.8′48—dc21 2001054917
ISBN 0-387-95386-8 Printed on acid-free paper
© 2002 Springer-Verlag New York, Inc.
All rights reserved. This work may not be translated or copied in whole or in part without the written permission of thepublisher (Springer-Verlag New York, Inc., 175 Fifth Avenue, New York, NY 10010, USA), except for brief excerpts inconnection with reviews or scholarly analysis. Use in connection with any form of information storage and retrieval,electronic adaptation, computer software, or by similar or dissimilar methodology now known or hereafter developed isforbidden.The use in this publication of trade names, trademarks, service marks, and similar terms, even if they are not identifiedas such, is not to be taken as an expression of opinion as to whether or not they are subject to proprietary rights.
Printed in the United States of America.
9 8 7 6 5 4 3 2 1 SPIN 10856186
www.springer-ny.com
Springer-Verlag New York Berlin HeidelbergA member of BertelsmannSpringer Science+Business Media GmbH
Cover illustration: The cover image is an art-work composition from original tables of the book that emphasizes the rangeof novel analysis methods now available in cellular and molecular neuroscience research, in contrast to the classical neu-roanatomical approach of Golgi staining, which represented a milestone in neurohistology during the first half of the lastcentury. The center image is a photograph from an original Golgi preparation by Giovanni Godina, Emeritus Professor ofVeterinary Anatomy at the University of Torino, Italy,
Merighi-FMnew order i-xiv.qxd 5/23/02 4:55 PM Page iv

This book is dedicated to the memory of Giovanni Godina, Emeritus Professor of Veterinary Anatomy at the University of Torino, Italy.
Merighi-FMnew order i-xiv.qxd 5/23/02 4:55 PM Page v

This page intentionally left blank

vii
Of all the fields of medical research, Neuroscience is perhaps the most interdisciplinary.The intrinsic complexity of the nervous system demands it. Traditionally, the nervous sys-tem was explored in a unidisciplinary fashion, typically with neurophysiological, neuro-chemical and neuroanatomical approaches. In recent decades - and thanks to the develop-ment of a number of new and powerful technologies -it has been easier, and thereforecompelling, to combine disciplines and methodologies in order to answer a single ques-tion. The revolution provoked by the progress in molecular biology has compounded andgreatly enriched these possibilities, as demonstrated by the high quality and originality ofpresent day publications.
The present book on " Cellular and Molecular Methods in Neuroscience Research"edited by Adalberto Merighi and Giorgio Carmignoto is an excellent representation ofthis integrated, multidisciplinary approach. The Editors have selected very relevant andcurrent topics for each chapter and they have been able to attract very credible specialiststo write them. I anticipate that the book will be an important reference publication formany years to come, as the choice of subjects makes it very attractive. The protocols covera broad range of fields from downstream cellular signaling, transfections of neurons andglia, single cell mRNA analysis to integrated systems. This preface is not the place to ana-lyze the individual merits of each chapter. However, it would be appropriate to highlightthe fact that, contrary to analogous books, this particular publication has the merit ofdwelling in some detail on the drawbacks and advantages of the procedures and on theirbest perceived applications. The book is written largely on the experimental evidence gath-ered by the authors, who provide a frank and clear explanation of the known limitationsof the procedures and, in many cases, interesting accounts of the difficulties they person-ally encountered until optimal procedures were established.
The readers will find in "Cellular and Molecular Methods in Neuroscience Research" amost useful companion to their experimental work. Its bibliography is extensive and willprove valuable when searching for key methodological papers. Many of the chapters con-tain procedure flow charts showing experimental alternatives and tables with the key appli-cations of the protocols described. These aspects, along with the description of the specif-ic reagents, their applications and limitations and the name of suppliers, will greatlyfacilitate the transition from reading the chapter to the actual application of the protocols.
In closing, Drs. Merighi and Carmignoto should be congratulated for their vision inputting together such a valuable collection of chapters and for their ability in persuadingvery busy colleagues to set aside time and effort to describe in such detail experimental pro-cedures. Springer-Verlag should also be congratulated for supporting the Editors in thisenterprise. But it is the Neuroscience community as a whole that owes the authors the great-est debt of thanks for providing in such a clear fashion the best up-to-date "recipes" in theirexperimental "cookbook". I believe that a large cohort of contemporary neuroscientists willenjoy the reading and practice of this book. I wish them all new and exciting results!
A. Claudio CuelloResearch Chair in Pharmacology
McGill UniversityJune 2002
FOREWORD
Merighi-FMnew order i-xiv.qxd 5/23/02 4:55 PM Page vii

This page intentionally left blank

PREFACE
ix
Analysis of the nervous tissue presents unique and peculiar technical problems that are encoun-tered in everyday bench work. While numerous books dealing with cellular and molecular pro-tocols for general use in cell biology are available, very few are specifically devoted to neurobiol-ogy. Moreover, the “cross-talk” between researchers with different backgrounds, i.e., histologists,cell and molecular biologists, and physiologists, is still quite difficult, and very often one remainssomehow confined to his own specific field of expertise, never daring to explore “mysterious”lands without the support of a big laboratory. The motivation behind this project was to puttogether the contributions from a number of well-known neuroscientists to produce a book thatoffers a survey of the most updated techniques for the study of nerve cells. We have chosen tocover a number of different topics, and therefore, each chapter should not be considered exhaus-tive of the matter but rather a guide to those who are willing to exploit a series of techniques thatare not regularly used in their laboratories. This book is written by researchers who routinelyperform their studies in different areas of neuroscience and have contributed to the develop-ment of new methodologies. It is designed as a method book to be routinely used by laboratorypersonnel, and each chapter also encompasses a background section, in which authors havedelineated the rationale at the basis of the different approaches described, and a clear and accu-rate discussion of the advantages and disadvantages that are inherent to each technique. Weasked the authors to put particular emphasis on the advantages of a multidisciplinary approach,which combines different techniques to obtain an in-depth structural and functional analysis ofneural cells. Thus, it has been rather difficult to define a table of contents according to the clas-sical way in which these books are organized. Nonetheless, we have tried to group together thechapters dealing with similar matters.
As a general indication to the readers, Chapters 1 and 2 describe a series of techniques that aresuitable for analysis of signal transduction mechanisms in cell systems. Chapters 3 through 6 aredevoted to the description of transfection methods and their applications in cultured cells andorganotypic slices. Chapter 7 describes a sophisticated novel approach to the analysis of geneexpression in single cells. It also contains a wide and punctual survey on the rationale for thechoice of different approaches to the dissection of the complexity of CNS organization. Theremaining chapters describe a series of techniques in situ to be used in analysis of gene expression(Chapters 8 and 9), neurochemical characterization of nerve cells and analysis of connectivity(Chapters 10 and 15), combined electrophysiological and morphological analysis (Chapter 11),tracing of neural connections (Chapters 12 and 13), apoptosis detection (Chapter 14) and cal-cium imaging (Chapter 16).
At the end of the book, we put particular care in the preparation of the Index, trying to makenumerous cross-references to different indexing words, thus rendering easier the search for spe-cific subjects.
We are grateful to Paula Challaghan, Life Science Editor at Springer-Verlag, New York forher confidence in our project. We also wish to mention the careful and patient work of AllanAbrams in assembling the book. Finally our deepest and sincere thanks go to all the scientistswhose contributions made this manual possible.
If this book encourages even a few people to use one of the protocols described as a part oftheir regular techniques rather than leaving them to the aficionados, we will have more than sat-isfied our aim.
Adalberto MerighiGiorgio Carmignoto
June 2002
Merighi-FMnew order i-xiv.qxd 5/23/02 4:55 PM Page ix

This page intentionally left blank

xi
Foreword . . . . . . . . . . . . . . . . . . . . . . . . . . . . . . . . . . . . . . . . . . . . . . . . . . . . . vii
Preface . . . . . . . . . . . . . . . . . . . . . . . . . . . . . . . . . . . . . . . . . . . . . . . . . . . . . . . ix
Contributors . . . . . . . . . . . . . . . . . . . . . . . . . . . . . . . . . . . . . . . . . . . . . . . . . . xiii
1 Analyses of Intracellular Signal Transduction Pathways in CNS Progenitor Cells . . . . . . . . . . . . . . . . . . . . . . . . . . . . . . . . . . . . . . . . . . . . . . . . 1Elena Cattaneo and Luciano Conti
2 Confocal and Electron Microscopic Tracking of Internalized Neuropeptides and/or Their Receptors . . . . . . . . . . . . . . . . . . . . . . . . . . . . . . 15Alain Beaudet, Alexander C. Jackson, and Franck Vandenbulcke
3 Transfection Methods for Neurons in Primary Culture . . . . . . . . . . . . . . . . . . 29Christoph Kaether, Martin Köhrmann, Carlos G. Dotti, and Francesca Ruberti
4 Polyethylenimine: a Versatile Cationic Polymer for Plasmid-Based Gene Delivery in the CNS . . . . . . . . . . . . . . . . . . . . . . . . . . . . . . . . . . . . . . . . . . . . 37Barbara A. Demeneix, Gregory F. Lemkine, and Hajer Guissouma
5 Transfection of GABAA Receptor with GFP-Tagged Subunits in Neurons and HEK 293 Cells . . . . . . . . . . . . . . . . . . . . . . . . . . . . . . . . . . . . 53Stefano Vicini, Jin Hong Li, Wei Jian Zhu, Karl Krueger, and Jian Feng Wang
6 Neuronal Transfection Using Particle-Mediated Gene Transfer . . . . . . . . . . . . 67Harold Gainer, Raymond L. Fields, and Shirley B. House
7 Analysis of Gene Expression in Genetically Labeled Single Cells . . . . . . . . . . . 85Stefano Gustincich, Andreas Feigenspan, and Elio Raviola
8 Immunocytochemistry and In Situ Hybridization: Their Combinations for Cytofunctional Approaches of Central and Peripheral Neurons . . . . . . . . . . . . . . . . . . . . . . . . . . . . . . . . . . 119Marc Landry and André Calas
9 In Situ Reverse Transcription PCR for Detection of mRNA in the CNS . . . . . . . . . . . . . . . . . . . . . . . . . . . . . . . . . . . . . . . . . . . . . . . . . . . . 145Helle Broholm and Steen Gammeltoft
10 Immunocytochemical Labeling Methods and Related Techniques for Ultrastructural Analysis of Neuronal Connectivity . . . . . . . . . . . . . . . . . . . 161Patrizia Aimar, Laura Lossi, and Adalberto Merighi
CONTENTS
Merighi-FMnew order i-xiv.qxd 5/23/02 4:55 PM Page xi

xii
11 Combined Electrophysiological and Morphological Analyses of CNS Neurons . . . . . . . . . . . . . . . . . . . . . . . . . . . . . . . . . . . . . . . . . . . . . . . . . 181Alfredo Ribeiro-da-Silva and Yves De Koninck
12 Tract Tracing Methods at the Light Microscopic Level . . . . . . . . . . . . . . . . . . . 203Marina Bentivoglio and Giuseppe Bertini
13 Tract Tracing Methods at the Ultrastructural Level . . . . . . . . . . . . . . . . . . . . . 221Isaura Tavares, Armando Almeida, and Deolinda Lima
14 In Vivo Analysis of Cell Proliferation and Apoptosis in the CNS . . . . . . . . . . . 235Laura Lossi, Silvia Mioletti, Patrizia Aimar, Renato Bruno, and Adalberto Merighi
15 Confocal Imaging of Nerve Cells and Their Connections . . . . . . . . . . . . . . . . 259Andrew J. Todd
16 Confocal Imaging of Calcium Signaling in Cells from Acute Brain Slices . . . . . . . . . . . . . . . . . . . . . . . . . . . . . . . . . . . . . . . . . . 273Wim Scheenen and Giorgio Carmignoto
Index . . . . . . . . . . . . . . . . . . . . . . . . . . . . . . . . . . . . . . . . . . . . . . . . . . . . . . . . . . . 285
Contents
Merighi-FMnew order i-xiv.qxd 5/23/02 4:55 PM Page xii

xiii
CONTRIBUTORS
Patrizia AimarDepartment of Veterinary MorphophysiologyNeuroscience Research GroupUniversity of TorinoTorino, Italy, EUArmando AlmeidaInstitute of Histology and EmbryologyFaculty of Medicine and IBMCUniversity of OportoOporto, Portugal, EUAlain BeaudetDepartment of Neurology and
NeurosurgeryMontreal Neurological InstituteMontreal, Quebec, CanadaMarina BentivoglioDepartment of Morphological and
Biomedical Sciences - Section of Anatomy and Histology
Faculty of MedicineUniversity of VeronaVerona, Italy, EUGiuseppe BertiniDepartment of Morphological and
Biomedical Sciences - Section of Anatomy and Histology
Faculty of MedicineUniversity of VeronaVerona, Italy, EUHelle BroholmRigshospitaletCopenhagen University HospitalDepartment of NeuropathologyCopenhagen, Denmark, EURenato BrunoDepartment of Veterinary
Morphophysiology University of TorinoTorino, Italy, EUAndré CalasLaboratorie de Cytologie, Institut des
Neurosciences, UMR CNRS 7624Université Pierre et Marie Curie, Paris VIParis Cedex, France, EUGiorgio CarmignotoDepartment of Experimental and
Biomedical Sciences CNR Center for the Study of
BiomembranesUniversity of PadovaPadova, Italy, EU
Elena CattaneoInstitute of Pharmacological SciencesUniversity of MilanoMilano, Italy, EULuciano ContiInstitute of Pharmacological SciencesUniversity of MilanoMilano, Italy, EUYves De KoninckDepartment of Pharmacology and
Therapeutics McGill University Montreal, Quebec, CanadaBarbara A. DemeneixLaboratorie de Physiologie Générale et
Comparée, UMR CNRS 8572Muséum National d’Historie NaturelleParis Cedex, France, EUCarlos G. DottiCavalieri Ottolenghi Scientific InstituteUniversità degli Studi di TorinoOrbassano, Italy, EUAndreas FeigenspanDepartment of NeurobiologyHarvard Medical SchoolBoston, MA, USARaymond L. FieldsLaboratory of NeurochemistryNational Insitute of Health, NINDSBethesda, MD, USAHarold GainerLaboratory of NeurochemistryNational Insitute of Health, NINDSBethesda, MD, USASteen GammeltoftDepartment of Clinical BiochemistryGlostrup HospitalCopenhagen UniversityGlostrup, Denmark, EUHajer GuissoumaLaboratorie de Physiologie Générale et
Comparée, UMR CNRS 8572Muséum National d’Historie NaturelleParis Cedex, France, EUStefano GustincichDepartment of NeurobiologyHarvard Medical SchoolBoston, MA, USAShirley B. HouseLaboratory of NeurochemistryNational Insitute of Health, NINDSBethesda, MD, USA
Merighi-FMnew order i-xiv.qxd 5/23/02 4:55 PM Page xiii

Contributors
Alexander C. JacksonDepartment of Neurology and
NeurosurgeryMontreal Neurological InstituteMontreal, Quebec, CanadaChristoph KaetherEMBL Heildelberg, Cell Biology
ProgrammeHeildelberg, Germany, EUMartin KöhrmannEMBL Heildelberg, Cell Biology
ProgrammeHeildelberg, Germany, EUKarl KruegerDepartment of Physiology and
BiophysicsGeorgetown University Medical SchoolWashington DC, USAMarc LandryINSERM EPI 9914 Instutut François Magendie,1 Rue Camille Saint-Saëns,33077 cedex, France, EUGregory F. LemkineLaboratorie de Physiologie Générale et
Comparée, UMR CNRS 8572Muséum National d’Historie NaturelleParis, France, EUJinHong LiDepartment of Physiology and
BiophysicsGeorgetown University Medical SchoolWashington DC, USADeolinda LimaInstitute of Histology and EmbryologyFaculty of Medicine and IBMCUniversity of OportoOporto, Portugal, EULaura LossiDepartment of Veterinary
Morphophysiology Neuroscience Research GroupUniversity of TorinoTorino, Italy, EUAdalberto MerighiDepartment of Veterinary
Morphophysiology Neuroscience Research GroupRita Levi Montalcini Center for Brain
RepairUniversity of TorinoTorino, Italy, EU
Silvia MiolettiDepartment of Veterinary
Morphophysiology University of TorinoTorino, Italy, EUElio RaviolaDepartment of NeurobiologyHarvard Medical SchoolBoston, MA, USAAlfredo Ribeiro-Da-SilvaDepartments of Pharmacology and
Therapeutics and Anatomy and Cell Biology
McGill UniversityMontreal, Quebec, CanadaFrancesca RubertiEMBL Heildelberg, Cell Biology ProgrammeHeildelberg, Germany, EUWim ScheenenDepartment of Cellular Animal PhysiologyUniversity of NijmegenNijmegen, The Netherlands, EUIsaura TavaresInstitute of Histology and EmbryologyFaculty of Medicine and IBMCUniversity of OportoOporto, Portugal, EUAndrew J. ToddLaboratory of Human AnatomyInstitute of Biomedical and Life SciencesUniversity of GlasgowGlasgow, UK, EUFranck VandenbulckeLaboratoire de Biologie Animale Université de Lille I, CNRS Unit 8017Villeneuve d'Ascq, Cedex, France, EUStefano ViciniDepartment of Physiology and BiophysicsGeorgetown University Medical SchoolWashington DC, USAJian Feng WangDepartment of Physiology and BiophysicsGeorgetown University Medical SchoolWashington DC, USAWeiJian ZhuDepartment of Physiology and BiophysicsGeorgetown University Medical SchoolWashington DC, USA
xiv
Merighi-FMnew order i-xiv.qxd 5/23/02 4:55 PM Page xiv

1
OVERVIEW
Growth factors such as epidermalgrowth factor (EGF), fibroblast growth fac-tor (FGF), platelet derived growth factor(PDGF), and the neurotrophins andcytokines, such as interleukines and inter-ferons, have a profound influence on theproliferation, survival, and differentiationof central nervous system (CNS) cells.They exert their roles by binding to theirrespective membrane-bound receptors andstimulating phosphorylation cascades (4).These receptors have been classified intotwo major groups: (i) receptors that havean intrinsic tyrosine kinase domain. Theseare also known as receptor protein tyrosinekinases (RPTK) and are exemplified by theepidermal growth factor receptor (EGFR)and neurotrophin receptors; and (ii) recep-tors such as those for the interleukins,which lack a kinase domain and use cyto-plasmic tyrosine kinases.
In both cases, common strategies areemployed for intracellular propagation ofthe external stimulus. These include recep-tor dimerization, transphosphorylation of
the receptor chains, as well as recruitmentand phosphorylation of cytoplasmic signal-ing components. Phosphotyrosine residuesfunction as binding sites for intracellularsignaling proteins containing SH2 (srchomology 2) or phosphotyrosyl binding(PTB) domains (10), thus allowing specificprotein–protein interactions. The kinasedomain of activated RPTKs, for example,undergoes transphosphorylation of thedimerized receptors and then phosphory-lates adaptor proteins like Shc and Grb2,which then activate Ras. Subsequent eventsinvolve three kinases steps: a MAPKKK-like Raf1, which phosphorylates aMAPKK-like MEK, which, finally, phos-phorylates the MAPKs. MAPKs ultimatelytranslocate to the nucleus where they phos-phorylate transcription factors to generateboth immediate (c-fos gene expression) anddelayed gene transcription responses (11).
In recent years, there has been muchprogress in the identification and charac-terization of the intracellular signalingpathways that mediate responses by CNScells to growth factors. The first evidence ofprotein kinase presence and activity in the
Cellular and Molecular Methods in Neuroscience ResearchEdited by A. Merighi and G. Carmignoto
Analyses of Intracellular SignalTransduction Pathways in CNSProgenitor Cells
Elena Cattaneo and Luciano ContiInstitute of Pharmacological Sciences, University of Milano, Milano, Italy, EU
1
Merighi1-aucorr.qxd 5/23/02 5:06 PM Page 1

CNS dates back to the early 1980s, when acoincidental increase in the activity ofpp60src with active neurogenesis in thestriatum and hippocampus indicated thatchanges in protein tyrosine phosphoryla-tion occurred during maturation. Morerecently, it has been demonstrated that reg-ulation of phosphorylation events on spe-cific signaling proteins may affect thebehavior of CNS cells. We have found thatmarked changes occur in the availability ofthe Shc(s) molecules during neuronal mat-uration. In particular, levels of ShcA adap-tor decrease sharply in coincidence withneurogenesis in the brain (7). We have sug-gested that changes in Shc levels at differ-ent stages of development may affect theactivity of downstream components of sig-naling pathways (for example Ras-MAPK)and thereby cause either proliferation ordifferentiation (4).
Other pathways have been identifiedwhich affect the survival of neural cells. Forexample, once the high affinity nervegrowth factor (NGF) receptor TrkA is acti-vated in PC12 cells, it stimulates cell sur-vival through a Ras independent mecha-nism that utilizes the phosphatidyl inositol3-kinase (PI3-K) pathway. PI3-K is anSH2-containing enzyme associated with avariety of receptor and nonreceptor proteintyrosine kinases. The enzyme is a het-erodimer that phosphorylates the 3′ posi-tion on a variety of inositol lipids and ser-ines on protein substrates. It has beenshown that exposure of various cell types(including cerebellar neurons) to survivalfactors induces activation of the PI3-K andof its crucial mediator, a serine–threonineprotein kinase named protein kinase B(PKB) or Akt. PKB promotes cell survivalvia three mechanisms: (i) phosphorylationand inactivation of the pro-apoptotic BAD(Bcl2-associated death promoter); (ii)phosphorylation of FKHRL1, a memberof the Forkhead family of transcription fac-tors, thus inhibiting its nuclear transloca-
tion and transcriptional activation of deathgenes; and (iii) inhibition of caspase-9 acti-vation, that normally leads to cell death.
Other signaling pathways are alsoknown to exert important roles in CNScells. Among them, the JAK/STAT path-way is critical for the transduction of sig-nals from activated cytokine receptors (3).The JAKs (for janus kinases) are cytoplas-mic tyrosine kinases that, once activated bythe stimulated receptors, can phosphory-late the STAT (for signal transducers andactivators of transcription) transcriptionfactors. These translocate into the nucleuswhere they bind to specific DNA elements(DNA response elements) situated up-stream of genes induced by cytokines (6,8).For example, STAT3 phosphorylation andactivation has been demonstrated to becrucial for astrocytes differentiation fromCNS progenitor cells (1).
This chapter will describe methodsemployed to study signaling pathways inCNS cells.
BACKGROUND
Phosphospecific Antibodies
Old techniques for the study of tyrosinephosphorylated molecules require biosyn-thetic labeling with 32P-labeled inorganicphosphate. This is intrinsically quite sim-ple, but requires the use of radiolabeledcompounds that involve the risks of radio-active manipulation. Thus, an importantadvance in the analysis of protein tyrosinephosphorylation, and the regulation of sig-naling by such phosphorylation, was thedevelopment of antibody technology togenerate phosphospecific antibodies. Theserecognize a phosphorylated epitope in agiven protein, thereby avoiding cross-reac-tion with other phosphoproteins or withthe unphosphorylated form of the protein.In fact, once the primary sequence around
2
E. Cattaneo and L. Conti
Merighi1-aucorr.qxd 5/23/02 5:06 PM Page 2

a phosphorylation site is known, itbecomes possible to generate antibodiesagainst any synthetic polypeptides modeledon these phosphorylation sites. Thus,unlike conventional and general antiphos-phoamino acid (i.e., antiphosphotyrosine,antiphosphoserine, antiphosphothreonine)antibodies, which have broad reactivity,antiphosphospecific antibodies haveunique specificity toward the cognate pro-teins. These reagents have provided newinsights into the phosphorylation processesthat control protein function. Thus, forexample, using antiphosphopeptide anti-bodies and immunoblotting analyses, it ispossible to identify and isolate distinctphosphorylated species of a phosphopro-tein that contains multiple phosphoryla-tion sites. Such reagents not only facilitateconventional in vitro analyses of phospho-proteins, but also permit the in situ analy-sis of the abundance and phosphorylation(and activation) state of individual proteinsin preparations of cells and tissue. Theseantibodies can therefore be used withimmunofluorescence on fixed culturedcells, with immunohistochemistry on for-malin-fixed paraffin-embedded tissue sec-tions, as well as for immunoprecipitationand immunoblotting analyses.
Antiphosphoamino Antibodies andImmunoprecipitation Assays
The list of antibodies that recognizephosphoproteins is growing rapidly, but isstill limited, while the methods for produc-tion of phosphospecific antibodies is time-consuming and very expensive. As a result,other more classical techniques must beused to study protein phosphorylation.Historically, the advance in analyses of pro-tein tyrosine phosphorylation, and the reg-ulation of signal transduction pathways bysuch phosphorylation, occurred with theproduction of polyclonal and monoclonalantiphosphotyrosine antibodies. These
antibodies proved capable of recognizingphosphorylated tyrosine residues in thecontext of virtually any flanking peptidesequence. Antiphosphotyrosine antibodieshave been most useful in the analyses oftyrosine phosphorylation of proteins witha technique that combines immunoprecip-itation and immunoblotting. Typically inthis procedure, a protein is immunoprecip-itated either with conventional antiproteinantibody or with antiphosphotyrosine anti-body, then immunoblotted with whicheverof these two antibodies was not used forthe immunoprecipitation. Immunopre-cipitation is a procedure by which peptidesor proteins that react specifically with anantibody are removed from solution. Asusually practiced, the name of the proce-dure derives from the removal of antibody–antigen complexes by the addition of aninsoluble form of an antibody binding pro-tein such as protein A or protein G (Figure1). The choice of immobilized antibodybinding protein depends upon the speciesthat the antibody was raised in. Protein Abinds well to rabbit, cat, human, pig, andguinea pig IgG as well as mouse IgG2a andIgG2b. Protein G binds strongly to IgGfrom cow, goat, sheep, horse, rabbit, andguinea pig, as well as to mouse IgG1 andIgG3. Protein G can also bind bovineserum albumin (BSA). Thus, BSA shouldbe added to buffers used with protein G.Alternatively, recombinant protein G with-out BSA binding sites can be used. Second,antibody coupled to Sepharose or ProteinG-Sepharose (both from Amersham Phar-macia Biotech, Little Chalfont, Bucks,England, UK) can also be used instead. Itis not crucial that Sepharose be used as amatrix, because other polymerized agarosesor even fixed strains of Staphylococcus cellsexpressing high amounts of surface proteinA can also be used. Analysis of the immu-noprecipitate is usually done by electro-phoresis and western blot, although othertechniques can be employed.
3
1. Analyses of Intracellular Signal Transduction Pathways
Merighi1-aucorr.qxd 5/23/02 5:06 PM Page 3

Kinase Assays
Another assay commonly used in stud-ies on the regulation by reversible phos-phorylation of specific biochemical eventsis the analysis of the kinase activity. Toassay the phosphotransfer reactions cat-alyzed by protein kinases, it is necessaryfirst to identify a target substrate for thetransfer reactions. Essentially, this means asubstrate that is quite specific. The basicstrategy for protein kinase assays is based,therefore, on the use of a labeled donorsubstrate so that when phosphotransferaseactivity is present in the enzyme sample,accumulation of the label in the protein orpeptide acceptor substrate can be easilydetected. The most frequently used proto-col requires [γ-32P]ATP as the donor sub-strate and a specific protein or peptide asthe acceptor substrate. Phosphotransfer isdetected as the accumulation of 32P-labeled protein or substrate. Clearly, thesource of enzyme activity is critical toobtain acceptable results. In fact, the pri-mary requirement is that the kinase activi-ty be stable both under the conditions usedto prepare the enzyme and under thoseused in the assay.
Immunocytochemical Assays
Another method to investigate the stateof phosphorylation and activation of a pro-tein is to analyze its subcellular localizationby immunocytochemistry. For several kin-ases and transcription factors, the phos-phorylation event is associated with theiractivation and nuclear translocation, be-cause this is the zone where they will exerttheir roles. This is the case of a family oftranscription factors, the STATs. In latentcells, STAT proteins are found in the cyto-plasm in a monomeric form, while in stim-ulated cells, STAT proteins are subjected totyrosine phosphorylation by the activatedJAK(s) or other tyrosine kinases. Tyrosine
phosphorylation of STAT proteins isknown to be associated with nuclear trans-location and activation of latent DNAbinding activity, leading to transcriptionalactivation of target genes. Nuclear translo-cation is therefore indicative of STATs acti-vation. Thus, description of subcellularSTAT localization will also reveal theirphosphorylation state.
PROTOCOLS
Protocol for Immunoprecipitation
Materials and Reagents
All chemicals are from Sigma (St. Louis,MO, USA) unless otherwise stated.
Lysis buffer
• 25 mM Tris-HCl, pH 7.5• 150 mM NaCl• 1 mM Sodium orthovanadate• 20 mM NaF• 5 mM EDTA• 1 mM EGTA • 2% Triton X-100• 10% Glycerol• 1 mM ZnCl2Stored and stable at 4°C. Before use,
add:
• 1 mM Phenylmethylsulfonyl fluoride(PMSF)
PMSF is very labile in water. A moreexpensive but more stable alternative is4-(2-aminoethyl)-benzenesulfonyl fluoridehydrochloride (AEBSF) (Pefabloc; RocheMolecular Biochemicals, Mannheim, Ger-many).
• 10 µg/mL Pepstatin • 10 µg/mL Leupeptin• 10 µg/mL Aprotinin
4
E. Cattaneo and L. Conti
Merighi1-aucorr.qxd 5/23/02 5:06 PM Page 4

Washing Buffer
• 50 mM Tris-HCl, pH 7.5• 0.3 M NaCl• 0.5% Triton X-100• 0.02% NaN3The washing buffer can be stored at
25°C for a number of months.• 0.1 M Sodium orthovanadate (phos-
phatase inhibitor). Dissolve powder inwater at pH 10.0. Boil. Keep at roomtemperature for up to 1 week in thedark.
• 10 mg/mL of aprotinin and leupeptinin water. Keep frozen at -20°C inaliquots.
• 10 mg/mL of pepstatin A in ethanol.Keep frozen at -20°C in aliquots.
• Phosphate-buffered saline (PBS)
50% Protein A-Sepharose Solution
Resuspend protein A-sepharose slurry inPBS (100 mg of protein A-sepharose pow-der once hydrated corresponds to 400 µLof volume). Wait until all crystals are dis-solved. Pellet by centrifugation (14 000× g)for 10 minutes at full speed in a centrifugeat 4°C. Discard supernatant and resuspendin PBS containing 1% Triton X-100.Repeat centrifugation. Discard the super-natant and add to the pellet an equal vol-ume of immunoprecipitation buffer con-taining 100 µg/mL BSA and 0.1% sodiumazide. Store at 4°C for up to 6 months.
2× Electrophoresis Buffer
• 250 mM Tris, pH 6.8• 100 mM Glycine• 4% Sodium dodecyl sulfate (SDS)• 10% Glycerol
Procedure
The procedure here assumes that a con-
centration step is required to obtainenough protein material for the immuno-precipitation analysis. It is possible to lyse 2to 4 100-mm diameter dishes using 1 mLof lysis buffer in order to concentrate theprotein content.1. Decant the medium and follow with a
rapid rinse in PBS. After the cells arewashed, drain and aspirate the excessPBS.
2. Add 250 to 350 µL of lysis buffer tothe plate. Scrape the cells from the dishand transfer them to a microcentrifugetube. The viscosity of the sample canbe reduced by a brief sonication or byseveral passages through a 26 gaugeneedle.
3. Leave the sample on ice for 30 min-utes.
4. Centrifuge (14 000× g) at 4°C for 10minutes at 14 k rpm in a microcen-trifuge.
5. Collect the supernatant and measurethe protein concentration using a BCAkit and protein standards (PierceChemical, Rockford, IL, USA). Thecell lysates can be stored at -80°C. Inmany protocols, a preclearing step isperformed to remove molecules thatbind nonspecifically to the insolubleprotein A or protein G (steps 7–8).
6. Use 1 to 2 mg (in a 1000 µL volume)of total proteins for immunoprecipita-tion.
7. Add 25 µL of protein-A-sepharosesolution (shake to suspend slurrybefore pipetting) and incubate on atube turner for 1 hour at room temper-ature.
8. Centrifuge (14 000× g) for 1 minute at14 k rpm in a microfuge and transferthe supernatant to another tube.
9. Add 1 to 5 µg of antibody to each tubeand incubate for 4 hours at room tem-perature or overnight at 4°C.
5
1. Analyses of Intracellular Signal Transduction Pathways
Merighi1-aucorr.qxd 5/23/02 5:06 PM Page 5

10. Add 100 µL of protein A-sepharosesolution (shake to suspend slurrybefore pipetting) and incubate on atube turner for 3 hours at room tem-perature.
11. Centrifuge (14 000× g) for 1 minute at14 k rpm in a microcentrifuge andretain the pellet.
12. Add 500 µL of cold washing buffer,vortex mix, spin for 1 minute at 14 krpm in a microcentrifuge, and discardthe supernatant.
13. Add 1 mL washing buffer, vortex mix,spin for 1 minute, discard the super-natant, and repeat 2 times.
14. Add 1 mL 10 mM Tris-acetate, pH7.5, vortex mix, spin for 1 minute, anddiscard the supernatant.
15. Solubilize all samples in 30 to 50 µL ofthe SDS sample buffer, vortex mix,boil for 5 minutes, and centrifuge.
16. Save the supernatant. Immunoprecipi-tates in sample buffer can be storedalmost indefinitely at -80°C. Storagefor more than 7 to 10 days at -20°Ccan lead to deterioration.
17. Electrophorese the sample on a SDS-polyacrylamide gel and transfer theproteins to a polyvinylidene fluoride(PVDF) membrane (Cat. No.1722026; Roche Molecular Biochemi-cals). To prevent tyrosine dephospho-rylation during the transfer procedure,we recommend adding 100 µM sodi-um orthovanadate to the transferbuffer.
18. Incubate the membrane in 50 mL ofblocking buffer for 1 hour at roomtemperature. We recommend not usinga blocking buffer that contains drymilk because antiphosphotyrosine anti-bodies bind to a number of the milkproteins. The following blocking buffercan be used: 5% (wt/vol) BSA, 10 mMTris-HCl, pH 7.4, 0.15 M NaCl.
19. Incubate the membrane in antiphos-photyrosine antibodies in blockingbuffer for 2 hours at room temperatureor overnight at 4°C. Several antiphos-photyrosine antibodies are commer-cially available. We recommend mono-clonal antibodies (PY20; TransductionLaboratories, Lexington, KY, USA; or4G10; Upstate Biotechnology, LakePlacid, NY, USA). It is possible tomake a mixture of the two antibodies(PY20 1:1000 dilution, 4G10 1:2500dilution).
20. Wash the membrane for 1 hour withTBST (Tris-buffered saline withTween) at room temperature withagitation. Replace the washing solutionevery 10 to 15 minutes.
21. Incubate the membrane with horserad-ish peroxidase-conjugated secondaryantibody for 1 hour at room tempera-ture.
22. Wash the membrane as described instep 20.
23. Detect by using ECLplus reagent(Amersham Pharmacia Biotech) fol-lowing the manufacturer’s instructions.
Protocol for In Vitro Kinase Assay
Materials and Reagents
Immunoprecipitation Buffer
• 10 mM Tris, pH 7.4• 1.0% Triton X-100• 0.5% Nonidet P-40• 150 mM NaCl• 20 mM Sodium fluoride• 0.5 mM Sodium orthovanadate• 1 mM EDTA• 1 mM EGTA• 10 mM Sodium pyrophosphate • 0.2 mM PMSF
6
E. Cattaneo and L. Conti
Merighi1-aucorr.qxd 5/23/02 5:06 PM Page 6

• 10 µg/mL Aprotinin • 10 µg/mL Leupeptin • 10 µg/mL Pepstatin A
Kinase Buffer
• 10 mM Tris, pH 7.4• 150 mM NaCl• 10 mM MgCl2• 0.5 mM Dithiothreitol (DTT)
Staining Solution
• 0.25% Coomassie blue• 45% Methanol• 10% Acetic acid
Destaining Solution
• 40% Methanol• 10% Acetic acid
5× Electrophoresis Buffer
• 625 mM Tris, pH 6.8• 20% SDS• 50% Glycerol• 0.05% Bromophenol blue• 10% β-Mercaptoethanol• 0.1 M Sodium orthovanadate (phos-
phatase inhibitor). Dissolve powder inwater, pH 10.0. Boil. Keep at roomtemperature for up to 1 week in thedark.
• 10 mg/mL of aprotinin and leupeptinin water. Keep frozen at -20°C inaliquots.
• 10 mg/mL of pepstatin A in ethanol.Keep at -20°C.
• [γ-32P]ATP• Cold ATP• X-ray film (Amersham Pharmacia
Biotech)
Procedure
Preparation of Cell Lysate
1. Wash cells on a confluent 100-mm cul-ture dish with 10 mL of PBS.
2. Lyse the cells by addition of 1 mL coldimmunoprecipitation buffer.
3. Scrape the cells off the dish and pass 5to 10 times through a 26 gauge needleto disperse large aggregates, then incu-bate for 20 minutes on ice.
4. Centrifuge (14 000× g) for 30 minutesin a microcentrifuge at 14 k rpm at4°C. Retain the supernatant.
5. Repeat centrifugation in a new tube.6. The supernatant is the total cell lysate.
Measure the protein concentrationusing the BCA kit and protein stan-dards.
Immunoprecipitation of the Protein Kinase
7. Incubate the cell lysate (0.5–1.0 mgprotein) with 2 to 5 µg soluble anti-body.
8. Immunoprecipitate for 1 hour at 4°Con a tube turner.
9. Add 30 µL of 50% protein A-seph-arose suspension and incubate for 2hours at 4°C on a tube turner.
10. Wash the complexes by resuspension inimmunoprecipitation buffer, followedby a 3-minute centrifugation in amicrocentrifuge 14 k rpm at 4°C.Repeat the wash twice.
11. Collect the complexes by centrifuga-tion for 3 minutes in a microcentrifugeat 14 k rpm at 4°C.
Kinase Assay
12. Wash the immunocomplexes threetimes at 4°C with kinase buffer.
13. Remove the supernatant by aspiration
7
1. Analyses of Intracellular Signal Transduction Pathways
Merighi1-aucorr.qxd 5/23/02 5:06 PM Page 7

and, with the pellet on ice, add 40 µLof kinase buffer containing the appro-priate protein substrate at 1.0 mg/mL(e.g., 5 µg of acid denatured enolase),25 µM cold ATP, 2.5 µCi [γ-32P]ATP.
14. Mix carefully by pipetting up and down.15. Transfer the tubes to 30°C in a circu-
lating water bath and incubate for 15minutes.
16. Add 15 µL of boiling 5× concentratedelectrophoresis sample buffer to stopthe reaction. Boil for 5 minutes.
17. Centrifuge the samples and electro-phorese the soluble fractions.
18. Fix and stain the gel in staining solu-tion for 45 minutes at room tempera-ture.
19. Destain the gel in destaining solutionfor 2 hours. Change the destainingsolution 4 to 5 times.
20. Dry the gel and expose it to X-ray filmat -80°C. Kinase activity will be indi-cated by a band of phosphorylated pro-tein substrate.
RESULTS
The use of antiphosphospecific antibod-ies allows rapid detection of phosphorylat-ed proteins by using the western blot assayor immunocytochemistry. There is anextensive list of phosphospecific antibodiesthat are commercially available. This in-cludes tyrosine kinase receptors (such asEGFR, Trks), cytoplasmic tyrosine kinases(Src, JAKs), Ser-Thr kinases (Raf, PKB,PKC [protein kinase C]), MAPKs (Erks,p38, JNKs [c-Jun N-terminal kinase]), andtranscription factors (c-Jun, STATs, CREB[cAMP response-element binding pro-tein]). In our laboratory, these antibodiesare primarily used to analyze the phospho-rylation and activation state of various sig-naling proteins that are involved in theresponsiveness of CNS progenitor cells togrowth factors (4,6). Figure 2A carries anexample of western blot assay performedusing a phospho-STAT3 antibody on pri-mary CNS progenitor cells stimulated withciliary neurotrophic factor (CNTF). This
8
E. Cattaneo and L. Conti
Figure 1. Schematic representation of the principle of immunoprecipitation. An antibody added to a mixture of proteins bindsspecifically to its antigen (). The antibody–antigen complex is absorbed from solution by addition of an immobilized antibodybinding protein such as protein A-sepharose. Upon centrifugation, the antibody–antigen complex is collected in the pellet. Sub-sequent liberation of the antigen is achieved by boiling the sample in the presence of SDS.
Merighi1-aucorr.qxd 5/23/02 5:06 PM Page 8

antibody specifically recognizes the tyro-sine 705 of phosphorylated STAT3 pro-tein. This residue is normally phosphory-lated by the JAKs and is important forSTAT homo- or heterodimerization. Insuch assays, it is essential to evaluate thetotal content of the protein analyzed, inorder to quantify the degree of activation.For this purpose, the same membrane isstripped and reacted with a STAT3 anti-body recognizing the phosphorylated and
nonphosphorylated STAT3 species (Figure2A, lower panel).
Tyrosine phosphorylation of STAT pro-teins is known to be associated withnuclear translocation and activation oflatent DNA binding activity, leading totranscriptional activation of target genes.Nuclear translocation is therefore indica-tive of STATs activation. In Figure 2B, weanalyzed the occurrence of nuclear translo-cation of STAT3 after cytokine stimulation
9
1. Analyses of Intracellular Signal Transduction Pathways
Figure 2. STAT3 activation inCNS progenitor cells followingCNTF treatment. (A) Cell lysatesobtained from untreated andCNTF-treated primary neuronalcultures generated from the E14 ratstriatum primordia were immu-noblotted with antiphospho-STAT3 antibody (upper panel). Atyrosine phosphorylated STAT3band is visible in response toCNTF. The same membrane wasstripped and reacted with anti-STAT3 antibody (lower panel). (B)STAT3 translocates into the nucle-us of ST14A cells upon cytokinestimulation. The cells were incu-bated in the absence or presence ofligand for 15 minutes. The cellulardistribution of STAT3 was exam-ined by immunofluorescence.Untreated ST14A cells show a dif-fuse STAT3 distribution. On theother hand, STAT3 is detectedexclusively in the nuclei of thetreated cells, where a strong immu-nofluorescence signal is clearly visi-ble (arrows). (See color plate A1.)
Merighi1-aucorr.qxd 5/23/02 5:06 PM Page 9

of ST14A CNS progenitor cells (5).STAT3 was found to vary its cellular distri-bution upon cytokine stimulation. Inuntreated ST14A cells (Figure 2B, upperpanel), STAT3 antigene is visualized as adiffuse immunofluorescence both in thecytoplasm and, to a lesser extent, in thenucleus. Within 15 minutes followingcytokine treatment (Figure 2B, lowerpanel), the nuclei of ST14A cells becomebrightly stained, indicative of nucleartranslocation of STAT3.
The immunoprecipitation assay can bevery informative for a number of situa-tions. For example, it permits evaluation ofdirect and physical interaction betweenproteins by co-immunoprecipitation ofone protein with another. We have appliedthis technique to identify signaling path-ways activated by growth factors in embry-onic CNS progenitor cells in vivo. We haveexploited the fact that CNS progenitorcells in the embryonic brain are localizedwithin the germinal zone which faces theventricles. With this approach, we evaluat-ed the extent of induced phosphorylationafter injection of growth factors into thecerebral ventricular system of rat embryos(Figure 3, upper panel). In particular, weinvestigated whether ShcA adaptors, whichare specifically expressed in CNS progeni-tor cells, were subjected to phosphorylation(7). For this purpose, lysates from EGF-treated and untreated (control) animalswere subjected to immunoprecipitationwith anti-ShcA antibodies, followed bywestern blot with antiphosphotyrosineantibodies. Figure 3 (lower panel) shows abasal level of p52shcA phosphorylation inlysates from control animals. On the otherhand, when an equal amount of lysedtelencephalic material obtained from EGF-injected embryos was subjected to the sameimmunoprecipitation procedure, p52shcA
phosphorylation was markedly induced(Figure 3, lower panel A). In Figure 3,(lower panel B) the same membrane filter
as in panel A was stripped and reacted withanti-ShcA monoclonal antibodies. Asshown (Figure 3, lower panel, arrows),ShcA proteins were immunoprecipitated tothe same extent in control and treatedgroups. The finding of in vivo EGF-induced p52shcA phosphorylation in CNSprogenitor cells is further substantiated bythe presence of a 170 kDa phosphorylatedband in the EGF-treated lane (Figure 3,lower panel, arrow in A), which specificallyreacts with a monoclonal antibody againstthe EGFR that is known to coprecipitatewith phosphorylated ShcA proteins (notshown). Furthermore, since the activatedShcA proteins normally interact with theGrb2 adaptor protein, we evaluated thepresence of Grb2 in the ShcA immunopre-cipitates from control and EGF-stimulatedgroups. As shown in Figure 3 (lower panelC), the 23 kDa Grb2 protein coprecipi-tates with anti-ShcA antibodies in lysatesfrom treated embryos, indicative of a func-tional activation of the Ras-MAPK path-way. We conclude that the use of immuno-precipitation assays not only allowsevaluation of the phosphorylation state of aprotein, but can also be used to dissect outthe protein–protein interactions that occurin vitro and in vivo.
TROUBLESHOOTING
Lyses of the Cells
A critical step during cell lysis is thepreservation of the phosphorylation state.This is accomplished by inhibition of pro-tein phosphatases and other kinases by theaddition to the lysis or homogenizationbuffer of inhibitors for serine–threoninekinases (such as sodium fluoride andokadaic acid) or for tyrosine kinases (suchas sodium orthovanadate). The inclusionof chelating agents and protease inhibitorsin the lysis buffer is also important. In fact,
10
E. Cattaneo and L. Conti
Merighi1-aucorr.qxd 5/23/02 5:06 PM Page 10

11
1. Analyses of Intracellular Signal Transduction Pathways
Figure 3. p52ShcA phosphorylation and interaction with Grb2 in embryonic telencephalic vesicles following intraventricularinjection of EGF. (Upper panel) Injection of growth factors into the telencephalic vesicles of E15 (embryonic day 15) embryos.Injection was performed by a procedure we have developed for embryonic transplantation of CNS progenitor cells (2,9). Tenmicroliters of EGF (10 ng/µL) were placed intraventricularly into E15 embryos. The figure shows a schematic drawing of the ratembryonic neural tube and of the ventricular system where the growth factors were delivered. At E15, the cells lining the neuraltube are still immature and proliferating actively. Intraventricular injection of growth factors at this early stage of brain matura-tion can therefore target this particular population of CNS progenitor cells. (A, anterior; P, posterior; D, dorsal; V, ventral).(Lower panel) (A) Phosphotyrosine immunoblot of ShcA immunoprecipitates after in vivo EGF treatment. Ten minutes afterinjection, the embryos were removed, and the telencephalic vesicles were isolated and subjected to immunoprecipitation withanti-ShcA antiserum followed by immunodecoration with 4G10 antiphosphotyrosine antibodies. Phosphorylated p52ShcA is indi-cated. Control embryos were injected with vehicle. A 170-kDa phosphorylated band (arrow) corresponding to the coprecipitat-ed EGFR is also visible in the treated group. (B) Anti-ShcA immunoblot of the filter in panel A. The membrane was stripped andreacted with ShcA monoclonal antibody. As shown, ShcA proteins were immunoprecipitated to the same extent in control andEGF-treated groups. (C) Anti-Grb2 immunoblot of the same immunoprecipitates as in panel A. The arrow indicates the 23 kDaGrb2 protein, which coprecipitates with ShcA more abundantly in the treated group. (See color plate A2.)
Merighi1-aucorr.qxd 5/23/02 5:06 PM Page 11
many proteins such as kinases can be sensi-tive to limited proteolysis during the lysis.Compounds such as EDTA or EGTAchelate calcium and reduce the activity ofcalcium-activated proteases. The mostcommonly used protease inhibitors includePMSF, leupeptin, pepstatin A, antipain,and benzamidine. It is always a good ideato add these inhibitors to the lysis bufferjust before it is used to lyse the cells.
Immunoprecipitation Assays
Like all immunochemical procedures,attention must be given to antibody cross-reactivity with other antigens. Nonspecificbinding can be a particular problem if pro-teins that are immunologically distinct fromthe antigen are trapped in the pelletsformed during immunoprecipitation. Toreduce nonspecific binding, immunoprecip-itation buffers usually contain a detergentthat reduces hydrophobic interactions, aprotein to block nonspecific binding sites,and high salt to reduce ionic interactions.Despite these precautions, nonspecificbinding can occur. It is crucial, therefore,always to perform a control reaction wherethe antibody is replaced by a nonrelevantimmunoglobulin (i.e., normal serum forpolyclonal antibodies, control mouseascytes fluid for ascytes, and isotype controlsfor purified mouse monoclonal antibodies).
Only use high quality siliconized tubesfor immunoprecipitation. Many brands ofEppendorf tube adsorb proteins whichare released during the final boiling in SDSand contribute to the background. Somepeople transfer the sepharose pellet to thenew tube immediately before addition of2× electrophoresis buffer.
Only use ultra pure BSA in the buffer toresuspend protein A-sepharose.
Sensitivity can be a problem, especiallywhen the antigen is a minor component ofthe protein pool. Effort should be made touse as much protein in the immunoprecip-
itation reaction as possible. Start with 1 or2 mg of total protein extract.
Kinase Assays
The oxidation state of cysteines and thestate of disulfide linkages may influencekinase activity. Inclusion of a reducingagent (2-β-mercaptoethanol or DTT) cantherefore be essential to preserve enzymeactivity.
It is important to choose the correctsubstrate for the kinase you are assaying;specific substrate information should becollected from previously published works.Synthetic peptide substrates are also com-mercially available.
For many kinases, it is important toidentify the more appropriate Mg2+ andMn2+ concentrations.
ACKNOWLEDGMENTS
The work of the authors is supported byTelethon Italy to E.C. (No. E840) andL.C. (No. E1025).
REFERENCES
1.Bonni, A., Y. Sun, M. Nadal-Vicens, A. Bhatt, D.A.Frank, I. Rozovsky, N. Stahl, G.D. Yancopoulos, andM.E. Greenberg. 1997. Regulation of gliogenesis inthe central nervous system by the JAK-STAT signalingpathway. Science 278:477-483.
2.Cattaneo, E., L. Magrassi, G. Butti, L. Santi, A.Giavazzi, and S. Pezzotta. 1994. A short term analysisof the behaviour of conditionally immortalized neu-ronal progenitors and primary neuroepithelial cellsimplanted into the fetal rat brain. Brain Res. Dev.Brain Res. 83:197-208.
3.Cattaneo, E., C. De-Fraja, L. Conti, B. Reinach, L.Bolis, S. Govoni, and E. Liboi. 1996. Activation of theJAK/STAT pathway leads to proliferation of ST14Acentral nervous system progenitor cells. J. Biol. Chem.271:23374-23379.
4.Cattaneo, E. and P.G. Pelicci. 1998. Emerging rolesfor SH2/PTB-containing Shc adaptor proteins in thedeveloping mammalian brain. Trends Neurosci.21:476-481.
5.Cattaneo, E. and L. Conti. 1998. Generation andcharacterization of embryonic striatal conditionally
12
E. Cattaneo and L. Conti
Merighi1-aucorr.qxd 5/23/02 5:06 PM Page 12

immortalized ST14A cells. J. Neurosci. Res. 53:223-234.
6.Cattaneo, E., L. Conti, and C. De-Fraja. 1999. Sig-nalling through the JAK-STAT pathway in the devel-oping brain. Trends Neurosci. 22:365-369.
7.Conti, L., C. De-Fraja, M. Gulisano, E. Migliaccio, S.Govoni, and E. Cattaneo. 1997. Expression and acti-vation of SH2/PTB-containing ShcA adaptor proteinreflects the pattern of neurogenesis in the mammalianbrain. Proc. Natl. Acad. Sci. USA 94:8185-8190.
8.De-Fraja, C., L. Conti, L. Magrassi, S. Govoni, and E.Cattaneo. 1998. Members of the JAK/STAT proteins
are expressed and regulated during development in themammalian forebrain. J. Neurosci. Res. 54:320-330.
9.Magrassi, L., M.E. Ehrlich, G. Butti, S. Pezzotta, S.Govoni, and E. Cattaneo. 1998. Basal ganglia precur-sors found in aggregates following embryonic trans-plantation adopt a striatal phenotype in heterotopiclocations. Development 125:2847-2855.
10.Pawson, T. 1995. Protein modules and signalling net-works. Nature 373:573-580.
11.Segal, R.A. and M.E. Greenberg.1996. Intracellularsignaling pathways activated by neurotrophic factors.Annu. Rev. Neurosci. 19:463-489.
13
1. Analyses of Intracellular Signal Transduction Pathways
Merighi1-aucorr.qxd 5/23/02 5:06 PM Page 13

15
OVERVIEW
This chapter describes confocal and elec-tron microscopic methods for trackingpeptide ligands and/or their receptors fol-lowing their internalization in cell culturesor brain slices. The confocal microscopictechniques are based upon the use of highaffinity fluorescent ligands that were origi-nally developed in our laboratory to studythe fate of internalized neurotensin (NT),somatostatin (SRIF), and opioid peptides(9,13,17). The electron microscopic tech-niques are adapted from the pre-embed-ding immunogold method developed byVirginia Pickel and her team (5) as appliedby us to study the effect of ligand exposureon the subcellular distribution of varioussubtypes of neuropeptide receptors.
As with any recipe, the success of thesedifferent methods lies with the quality of theunderlying ingredients. In other words, se-lective high affinity ligands and specific, sen-sitive antibodies are sine qua non. We haverecently reviewed the factors to be consid-ered when selecting a fluorescent ligand for
confocal imaging studies (2). A vast selectionof fluorescent peptides is currently availablefrom Advanced Bioconcept (Montreal, QC,Canada), a subsidiary of NEN Life ScienceProducts (Boston, MA, USA). However, notall of these peptides are applicable to thetype of study described below, and it isstrongly recommended that the ligand ofchoice be first tested in a heterologous trans-fection system. Neuropeptide receptor anti-bodies have also become widely availablethrough a variety of commercial sources.Here again, however, these antibodies maynot all be ideal for the type of double label-ing or electron microscopic work detailedbelow. Furthermore, some of these antibod-ies may not recognize an important subset ofreceptors, because the sequence againstwhich they are directed is either glycosylatedor otherwise conformationally modified.Care should be taken, therefore, to first testthe selected antibodies thoroughly in a mod-el system and, preferably, to identify recog-nized molecules by Western blot.
Cellular and Molecular Methods in Neuroscience ResearchEdited by A. Merighi and G. Carmignoto
Confocal and Electron MicroscopicTracking of Internalized Neuropeptidesand/or Their Receptors
Alain Beaudet, Alexander C. Jackson, and Franck VandenbulckeMontreal Neurological Institute, McGill University, Montreal, QC, Canada
2
Merighi2-aucorr.qxd 5/23/02 5:16 PM Page 15

BACKGROUND
The interaction between neuropeptidesand some of their complimentary G pro-tein-coupled receptors (GPCR) has beenshown to result in the endocytosis of the re-ceptor–ligand complex. This mechanism,referred to as ligand-induced internaliza-tion, has long been known to play a keyrole in receptor sequestration and resensiti-zation (12) and was recently proposed to beinvolved in cell signaling (6,20).
Most of our knowledge concerning thefate of internalized ligands and/or recep-tors is derived from studies of single trans-membrane domain receptors. For instance,the transferrin receptor has long beenknown to be constitutively internalized viaclathrin-coated pits into early endosomes(19). In the acidic environment of endo-somes, iron dissociates from transferrin,and both transferrin and its receptor returnto the cell surface in recycling endosomes(7). Much less is known, however, con-cerning the fate of internalized GPCRs ortheir ligands. With regard to receptors,most of the available evidence is derivedfrom studies of the prototypical GPCR,the β2-adrenergic receptor, which was doc-umented to recycle back to the plasmamembrane following ligand dissociation inthe acidic environment of endosomes (23).Other GPCRs, however, such as the lu-teinizing hormone receptor, are degradedin lysosomes (14). As for GPCR ligands,virtually nothing is known of their postin-ternalization trafficking, with the excep-tion of some neuropeptides that wereshown to be targeted to lysosomes fordegradation (14,15).
The techniques described below were de-veloped by us to monitor the fate of in-ternalized neuropeptide receptor–ligandcomplexes by confocal and electron micro-scopy. Visualization of bound and internal-ized ligand molecules proved the most chal-lenging, since peptide ligands are prone to
dissociate from their receptors or to leak outfrom intracellular compartments during his-tological processing. We tackled this prob-lem by resorting to fluorescent ligands andminimizing histological steps prior to theirvisualization by confocal microscopy. How-ever, internalized ligand molecules may alsobe detected by other techniques, such as au-toradiography, as described elsewhere (4).Receptors are easier than their ligands totrack at cellular and subcellular levels, sincethey are membrane-bound and are thereforepreserved in situ during histological process-ing. Furthermore, they are strongly anti-genic and are therefore amenable to im-munocytochemical detection. For studies inheterologous transfection systems, this de-tection may be facilitated by tagging the re-ceptors with immunogenic or fluorescentsequences (1,15). The techniques that wedescribe below were developed for studyingGPCR trafficking in cell cultures and brainslices. However, similar approaches havebeen used equally effectively by others tostudy the effect of agonist exposure on re-ceptor trafficking in vivo (8,16).
PROTOCOLS
Protocol for Tracking InternalizedLigands by Confocal Microscopy
Principle of Technique
The fate of internalized ligands is moni-tored by confocal microscopy following thelabeling of cells in culture or of brain slicesex vivo with nanomolar concentrations offluorescent derivatives of either native ormetabolically stable analogs of peptide lig-ands. The distribution of the label may beanalyzed either immediately after ligand ex-posure, as described below for studies incell cultures, or after varying periods ofchasing with physiological buffer, as de-scribed below for studies in brain slices.
16
A. Beaudet et al.
Merighi2-aucorr.qxd 5/23/02 5:16 PM Page 16

Studies in Cell Culture
The protocol described here was used tomonitor the fate of internalized NT (18),somatostatin (17,21), and opioid peptides(13) in transfected COS-7 cells or in pri-mary neuronal cultures.
Materials and Reagents
• COS-7 cells transfected with cDNAencoding the appropriate receptors (fordetails on transfection procedure seeReference 17) or:
• Neuronal cultures from embryonic orneonatal rat brain prepared as previ-ously described (18,22).
• α-Bodipy-neurotensin 2-13 (fluo-NT),α-Bodipy-[D-Trp8]somatostatin (fluo-SRIF), α-Bodipy-dermorphin, α-Bod-ipy-deltorphin. These fluorescent com-pounds were originally synthesized andpurified for us by Dr. J.-P. Vincent(University of Nice-Sophia Antipolis,France). They are currently availablefrom NEN Life Science Products.
• 12-mm polylysine-treated glass cover-slips (25 µg/mL polylysine, 15 min atroom temperature) (Sigma, St. Louis,MO, USA).
• Earle’s buffer: 50 mM 4-(2-hydroxy-ethyl)-1-piperazineethanesulfonic acid(HEPES) buffer, pH 7.4, containing140 mM NaCl, 5 mM KCl, 1.8 mMCaCl2, 3.6 mM MgCl2 (all salts arefrom Sigma).
• Supplemented Earle’s buffer: Earle’sbuffer containing 0.1% bovine serumalbumin (BSA), 0.01% glucose, and0.8 mM 1,10-phenanthroline (pepti-dase inhibitor), pH 7.4.
• Hypertonic acid buffer: 0.2 M aceticacid and 0.5 M NaCl in Earle’s buffer,pH 4.0.
• Aquamount (Polysciences, Warring-ton, PA, USA).
Procedure
1. For experiments on transfected epithe-lial cells, plate the cells as a monolayeron 12-mm polylysine-coated glass cov-erslips and let them adhere for 1 to 2hours at 37°C. For experiments in pri-mary cultures, plate the cells ontopolylysine-coated glass coverslips andallow them to grow in a humidified at-mosphere at 37°C and 5% CO2 untilfully differentiated (6–10 days).
2. Preincubate the cells for 10 minutes at37°C in supplemented Earle’s buffer.
3. Incubate the cells for various periods oftime (5, 10, 15, 30, 45, and 60 min)with 10 to 20 nM of the appropriatefluorescent ligand in supplementedEarle’s buffer. For determination ofnonspecific labeling, add a hundredfoldconcentration of nonfluorescent pep-tide or antagonist to the incubationmedium.
4. At the end of the incubation, rinse thecells 3 times with ice-cold Earle’s bufferor with hypertonic acid buffer to disso-ciate surface-bound ligand. At thispoint, cells may be fixed with 4%paraformaldehyde in 0.1 M phosphatebuffer, pH 7.4. The latter procedure of-fers the advantage of allowing for co-immunolocalization of cellular antigens(see below).
5. Air-dry the cells rapidly and mountthem up on glass slides with Aqua-mount. It is imperative that the cellsthemselves not be exposed to an aque-ous medium (unless they were fixed) asthis would promote dissociation of re-ceptor–ligand complexes.
6. Examine by confocal microscopy. Im-ages may be acquired as single midcel-lular optical sections or through multi-ple serial Z levels at 32 scans per frame.
17
2. Tracking of Internalized Neuropeptides
Merighi2-aucorr.qxd 5/23/02 5:16 PM Page 17

Studies in Brain Slices
The protocol described below was usedto monitor the fate of internalized NT inslices from rat ventral midbrain tegmentum(11) and basal forebrain (10).
Materials and Reagents
• Adult male Sprague-Dawley rats.• Fluorescent ligand (same as above).• Ringer buffer: 130 mM NaCl, 20 mM
NaHCO3, 1.25 mM KH2PO4, 1.3mM MgSO4, 5 mM KCl, 10 mM glu-cose, and 2.4 mM CaCl2.
• 4% Paraformaldehyde (PFA) (ElectronMicroscopy Science, Fort Washington,PA, USA): 4% PFA in 0.1 M phos-phate buffer, pH 7.4.
• Cryoprotectant solution: 30% sucrosein 0.1 M phosphate buffer, pH 7.4.
• Cryoprotectant solution: 30% sucrosein 0.1 M phosphate buffer, pH 7.4.
• Aquamount (Polyscience)
Procedure
1. Following decapitation of the rat,rapidly remove and immerse the brainin a cold oxygenated (95% O2, 5%CO2) Ringer buffer.
2. Cut 300 to 400-µm-thick slicesthrough the regions of interest with aVibratome.
3. Equilibrate the slices for 45 minutes inoxygenated Ringer buffer at room tem-perature.
4. Superfuse the slices for 3 minutes at37°C with 20 to 40 nM fluorescent lig-and in Ringer buffer.
5. Rinse with oxygenated Ringer bufferfor 5, 10, 15, 30, 45, or 60 minutes at37°C. To control for nonspecific label-ing, incubate additional slices in thepresence of 100- to 1000-fold excess of
nonfluorescent probe or antagonist.6. After rinsing, fix the slices for 30 min-
utes at room temperature with 4% PFA.7. Immerse the slices overnight in the cry-
oprotectant solution, flatten on tissuechuck, snap freeze in isopentane at-60°C, and resection at 45 µm thick-ness in the plane of the slice on a freez-ing microtome.
8. Mount frozen sections on gelatin-coat-ed glass slides with Aquamount and ex-amine by confocal microscopy.
Protocol for Simultaneous Detection ofInternalized Ligand and of either Recep-tors or Cell Compartment Markers
Principles of Technique
Combination of fluorescent ligand bind-ing and immunohistochemistry makes itpossible to simultaneously track down ligandand receptor following neuropeptide bindingand internalization. Intracellular traffickingof ligand can also be monitored throughcombined visualization of the fluorescent lig-and and of specific markers of intracellularcompartments. Because significant amountsof ligand are lost in the course of immuno-histochemical processing, this type of study isbest performed in transfected cells as theseexpress high concentrations of receptors andthus bind and internalize commensuratelylarge amounts of fluorescent ligand. Presum-ably, the same type of approach should be ap-plicable to cells or tissue slices expressing en-dogenous receptors, provided that the ligandis cross-linked to the receptor prior to im-munohistochemical processing.
Materials and Reagents
• COS-7 cells transfected with cDNAencoding either native or epitope-tagged receptors.
18
A. Beaudet et al.
Merighi2-aucorr.qxd 5/23/02 5:16 PM Page 18

• Appropriate α-Bodipy-labeled fluores-cent ligand.
• Antibodies directed against either the re-ceptor itself or against the immunogenicepitope in the case of epitope-tagged re-ceptors; or antibodies directed againstcompartment-specific cellular antigens(e.g., rab proteins, lamp proteins, etc.).
• Fluorescein isothiocyanate (FITC)-tagged secondary antibodies.
• Normal serum from the same speciesas the secondary antiserum.
• Phosphate-buffered saline (PBS): 0.9%NaCl in 0.1 M phosphate buffer, pH7.4.
• Earle’s buffer.• Polylysine (Sigma).• Aquamount (Polyscience).
Procedure
1. Plate the transfected cells on 12-mmpolylysine-coated glass for 1 to 2 hoursat 37°C.
2. Incubate the transfected cells with thefluorescent ligand (20 nM) for variousperiods of time at 37°C as describedabove and rinse 3 times in ice-cold Ear-le’s buffer.
3. Fix the cells with 4% PFA for 20 min-utes at room temperature.
4. Rinse twice with PBS.5. Preincubate the cells for 20 minutes in
PBS containing 3% normal serum.6. Incubate for 60 minutes at room temper-
ature with appropriate dilution of prima-ry antibody in PBS containing 1% nor-mal serum and 0.02% Triton X-100.
7. Rinse 3 × 5 minutes with PBS.8. Incubate with the FITC-tagged sec-
ondary antibody diluted 1:100 to1:500 in PBS for 30 minutes at roomtemperature.
9. Rinse 3 × 5 minutes in PBS.
10. Mount the coverslips, cell-side downon glass slides with Aquamount and ex-amine by confocal microscopy. FITCsignal is imaged by exciting sampleswith 488 nm and Bodipy red signal byexciting samples with 568 nm.
Protocol for Monitoring the Effect ofLigand Exposure on the SubcellularDistribution of Neuropeptide Receptors
Principles of Technique
The present technique applies standardpre-embedding immunogold procedures,as originally developed in V. Pickel’s labora-tory (5), to the electron microscopic detec-tion of neuropeptide receptors in transfect-ed epithelial cells, primary neuronalcultures, or brain slices, following stimula-tion by an unlabeled agonist. As for confo-cal microscopic studies, labeling may becarried out either by pulse chase as de-scribed below for studies in cell culture, orimmediately after stimulation with the ag-onist, as described below for studies inbrain slices.
Studies in Cell Cultures
Materials and Reagents
• COS-7 cells transfected with cDNAencoding the appropriate receptors (fordetails on transfection procedure seeReference 17) or:
• Neuronal cultures from embryonic orneonatal rat brain prepared as previ-ously described (18,22).
To Be Prepared Fresh on Day 1
• 0.2 M Sörensen’s phosphate buffer(SPB), pH 7.4: 154 mM Na2HPO4,23 mM NaH2PO4H2O. Do not ad-just pH.
19
2. Tracking of Internalized Neuropeptides
Merighi2-aucorr.qxd 5/23/02 5:16 PM Page 19

• 0.1 M Tris-buffered saline (TBS), pH7.4: 1.2% (wt/vol) Trizma base, 0.9%NaCl. Adjust to pH 7.4 with HCl.
• 2% PFA in 0.1 M SPB, pH 7.4.• 2% Acrolein (Electron Microscopy
Science) and 2% PFA in 0.1 M SPB. • Blocking buffer: 1.5% normal serum
(Sigma) from the same species as sec-ondary antibody diluted in 0.1 MTBS.
• Antibody dilution buffer: 0.05% Tri-ton X-100 and 0.5% normal serum in0.1 M TBS.
• Primary antibodies directed against ei-ther the receptor itself or an epitopetag and diluted in antibody dilutionbuffer (dilution must be worked outfor each antibody).
• Earle’s buffer: 140 mM NaCl, 5 mMKCl, 1.8 mM CaCl2, 0.9 mMMgCl2•6 H20, 25 mM HEPES.
• Appropriate receptor agonist dilutedin concentrations ranging from 10 nMto 10 µM in binding buffer consistingof 0.8 mM 1,10-phenanthroline,0.1% D-glucose, 1% BSA in Earles’buffer.
To be Prepared Fresh on Day 2
• 0.01 M PBS: 0.01M SPB in double-distilled water and 0.9% NaCl. Adjustto pH 7.4.
• Washing incubation buffer: 0.5%gelatin stock and 8.0% (wt/vol) BSAin 0.01 M PBS.
• 2% glutaraldehyde (Electron Micros-copy Science) in 0.01 M PBS.
• 1 nm gold particle-tagged secondaryantibodies directed against species inwhich primary antibody was raised(IgG-gold conjugate; Amersham Phar-macia Biotech, Little Chalfont, Bucks,England, UK), diluted 1:20 in washingincubation buffer.
• 0.2 M citrate buffer: 5.95% (wt/vol)sodium citrate (trisodium citrate, de-hydrated) in double-distilled water; ad-just to pH 7.4 with 0.2 M citric acid(2.1 g in 50 mL distilled water).
• 2% osmium tetroxide (OsO4) in 0.2M SPB (prepare immediately beforeuse and keep in the dark at all times).
• Silver intensification kit (AmershamPharmacia Biotech).
Procedure
These experiments are carried out oncells that have been cultured directly intothe bottom of plastic culture dishes (21).
Day 1
Incubate cells with desired concentra-tion of agonist. For pulse-chase labelingover multiple time points: (i) preincubatein binding buffer for 5 minutes at 4°C; (ii)pulse with agonist dissolved in bindingbuffer for 30 minutes at 4°C; and (iii)chase with binding buffer for various timepoints at 37°C.1. Fix with 2% acrolein in 2% PFA for 20
minutes at room temperature.2. Post-fix with 2% PFA for 20 minutes at
room temperature.3. Rinse 2 × 10 minutes in 0.1 M TBS.4. Incubate in blocking buffer for 30 min-
utes.5. Incubate overnight at 4°C with appro-
priate dilution of primary antibody di-rected against the receptor in antibodydilution buffer.
Day 2
1. Rinse 3 × 10 minutes in 0.01 M PBS.2. Rinse for 10 minutes in washing incu-
bation buffer. 3. Incubate for 2 hours at room tempera-
20
A. Beaudet et al.
Merighi2-aucorr.qxd 5/23/02 5:16 PM Page 20

ture with the IgG-gold conjugate.4. Rinse for 5 minutes in washing incuba-
tion buffer. 5. Rinse 3 × 5 minutes in 0.01 M PBS. 6. Fix 10 minutes with 2% glutaralde-
hyde. 7. Rinse for 5 minutes in 0.01 M PBS.8. Rinse twice in 0.2 M citrate buffer.9. Silver intensification: mix solutions A
and B in each well and develop for 7minutes.
10. Rinse twice in 0.2 M citrate buffer.11. Rinse for 10 minutes in 0.1 M SPB.12. Postfix for 10 minutes in 2% osmium
tetroxide (in the dark).13. Dehydrate in graded ethanols:
50% EtOH for 2 × 5 minutes. 70% EtOH for 2 × 5 minutes.80% EtOH for 5 minutes.90% EtOH for 5 minutes.95% EtOH for 10 minutes.100% EtOH for 2 × 15 minutes.
14. Embed in Epon as follows:a. Apply 1:1 Epon: propylene oxide so-
lution for 1 minute and aspirate.b. Apply 1:3 Epon: propylene oxide so-
lution for 3 minutes and aspirate.c. Apply one drop of 100% Epon to
the surface of the cells.15. Place the flush surface of the cylindrical
plastic mold onto the bottom of thewell. Ensure a good seal between themold and the bottom of the well, andthat the mold is perpendicular to thebottom.
16. Carefully fill in the area between the in-side surface of the culture plate and theplastic mold with plasticine modelingclay.
17. Fill the plastic mold with 100% epon.18. Replace the 4-well plate cover, add lead
weights to the lid, and cure in a 60°Coven for 13 to 16 hours.
19. Remove the plasticine modeling clay and
crack off the polymerized Epon blocksfrom the surface of the culture plate.
20. Examine the bottom surface of thepolymerized Epon block under the dis-secting microscope for labeled cells.
21. Trim the block around the labeled cells.22. Incubate in a 60°C oven for at least an-
other 24 to 48 hours before cuttingwith the ultramicrotome.
Studies in Brain Slices
Materials and Reagents
• Adult male Sprague-Dawley rats(200–250 g).
• Ringer buffer: 124 mM NaCl, 5 mMKCl, 1.2 mM NaH2PO4, 2.4 mMCaCl2, 1.5 mM MgSO4, 26 mMNaHCO3, 10 mM glucose, pH 7.4.
• Fixative: 4% PFA and 0.3% glu-taraldehyde in 0.1 M SPB, pH 7.4.
• Cryoprotectant: 0.1 M SPB, 25% su-crose, 3% glycerol.
• Isopentane at -70°C.• Liquid nitrogen.• Same complement of immunohisto-
chemical reagents and buffers as listedfor studies in cell cultures.
Procedure
Day 1
1. Decapitate the rats and rapidly removethe brains.
2. Block and section the region(s) of inter-est on a vibratome and collect slices(100 µm) in ice-cold Ringer buffer,continuously oxygenated by a mixtureof 95% O2 and 5% CO2.
3. Equilibrate slices in Ringer buffer for40 minutes at room temperature.
4. Preincubate slices in Ringer buffer for15 minutes at 37°C.
21
2. Tracking of Internalized Neuropeptides
Merighi2-aucorr.qxd 5/23/02 5:16 PM Page 21

5. Incubate slices in Ringer buffer con-taining various concentrations of ago-nist for 10 to 60 minutes at 37°C.
6. Fix slices with fixative.7. Rinse twice in 0.1 M SPB.8. To permeabilize the tissue, incubate
sections in cryoprotectant solution for30 minutes, freeze in isopentane at-70°C, dip in liquid nitrogen, thaw in0.1 M SPB at room temperature.
9. Immerse in blocking buffer for 30 min-utes.
10. Incubate overnight at 4°C with appro-priate dilution of receptor antibody inantibody dilution buffer.
Day 2
1. Carry out immunolabeling with sec-ondary antibody, postfixation in 2%OsO4 for 40 minutes, and dehydrationof slices as described for cell culturesabove (day 2, steps 1 through 13).
2. Then, embed slices as follows:a. Immerse in 1:1 Epon: propylene ox-
ide solution for 30 minutes and aspi-rate.
b. Immerse in 1:3 Epon: propylene ox-ide solution for 30 minutes and aspi-rate.
c. Immerse in 100% Epon overnight at4°C.
3. Flat-embed the sections in between twosheets of acetate film; lay on a flat,smooth surface, and add lead weightsto the top.
4. Cure in a 60°C oven for 24 to 48hours.
5. Gently remove one of the acetate sheetsfrom the surface of the embedded tis-sue.
6. Add a thin film of cyanoacrilate glue tothe surface of the embedded tissue andquickly affix to the flush bottom sur-face of a polymerized Epon block.
7. Trim the block around the labeled cells.8. Cure at 60°C for at least another 24 to
48 hours before cutting with the dia-mond knife.
RESULTS AND DISCUSSION
Confocal Microscopic Studies
Studies in Cell Cultures
The result of an experiment in which thefate of fluo-NT, specifically bound to highaffinity NT1 receptors, was monitored overtime in COS-7 cells transfected withcDNA encoding the NT1 receptor is illus-trated in Figure 1. Cells were exposed to 20nM fluo-NT for periods ranging between 5and 60 minutes, and the intracellular distri-bution of the ligand was visualized by con-focal microscopy following hypertonic acidstripping of surface-bound ligand. At shorttime intervals (0–30 min), the label formedsmall “hot spots” distributed throughoutthe cytoplasm of the cells, but sparing thenucleus (Figure 1A). At later time points(>30 min), these endosome-like particlesdecreased in number and progressively clus-tered towards the center of the cells next tothe nucleus (Figure 1B). This fluorescentlabeling was specific in that it was not ob-served in nontransfected parent cells or intransfected cells incubated in the presenceof a hundredfold concentration of nonfluo-rescent NT (Figure 1C).
Figure 2 illustrates the results of an ex-periment in which we monitored in parallelthe fate of a fluorescent analog of somato-statin, fluo-SRIF, with that of one of its re-ceptors, sst2A, in COS-7 cells transfectedwith cDNA encoding the sst2A receptorsubtype. sst2A receptors were labeled by im-munocytochemistry using an antibody di-rected against its C terminal sequence(kindly provided by Dr. Agnes Schon-brunn, University of Texas). To obtain a
22
A. Beaudet et al.
Merighi2-aucorr.qxd 5/23/02 5:16 PM Page 22

good compromise between immunocyto-chemical detection of the receptor andpreservation of internalized ligand, all im-munolabeling steps were shortened as muchas they could, and double-labeled cells wereexamined immediately after mounting. Af-ter short incubations (0–20 min), receptorand ligand molecules were extensively colo-calized at the outskirts of the cells (Figure 2,A and A′). By contrast, after longer incuba-tion periods, receptor and ligand were al-most entirely dissociated (Figure 2, B andB′). Indeed, while the ligand was confinedto the core of the cells, the receptors hadlargely recycled back to the cell surface.
To characterize the intracellular routing offluo-SRIF, detection of the fluorescent labelwas combined with the immunocytochemi-cal detection of marker proteins for differentendocytic compartments. Thus, followingshort (0–20 min) incubations of the trans-fected cells with fluo-SRIF, most of the intra-cellular ligand was detected in compart-ments that immunostained positively for rab5A, a small GTP-binding protein known tobe associated with early endosomes (notshown). By contrast, at longer time intervals(45 min) it was extensively colocalized withsyntaxin 6, a marker of the Trans-Golgi Net-work (TGN) and of the pericentriolar recy-cling endosome (Figure 2, C and C′).
Studies in Brain Slices
Examination of rat brain slices pulse-la-beled with fluo-NT and chased for shortperiods of time (5–10 min) revealed a fairlydiffuse distribution of the fluorescent labelover nerve cell bodies and neuronal process-es within regions documented to expresshigh concentrations of NT1 receptors, suchas the basal forebrain (10) and the ventralmidbrain (11) (Figure 3A). This distribu-tion was specific in that it was totally pre-vented by the addition of a hundredfoldconcentration of nonfluorescent ligand. Itresulted from clathrin-mediated internaliza-
tion, as it was entirely blocked by the endo-cytosis inhibitor, phenylarsine oxide. Athigh magnification, the label was found tobe accumulated within small endosome-likestructures distributed throughout perikaryaand dendrites. After longer periods of chase(20–60 min), the label had totally disap-peared from neuronal processes and wasdensely concentrated within perikarya (Fig-ure 3B), suggesting that it had been trans-ported retrogradely from the dendrites tothe cell bodies. Furthermore, at the level ofneuronal perikarya themselves, a decrease innumber but an increase in size of labeledendosomes was observed, suggesting thatthe original endocytic vesicles had coalescedover time. In addition, there was a decreasein their mean distance from the nuclear en-velope, suggesting a progressive migrationof the late endosomes towards a juxtanu-clear recycling compartment.
Electron Microscopic Studies
Studies in Cell Cultures
As can be seen in Figure 4, SRIF sst5 re-ceptors, immunolabeled in COS-7 cellstransfected with cDNA encoding the sst5receptor subtype, were detected in the formof small rounded silver-intensified gold par-ticles. In the absence of stimulation by theagonist, approximately 25% of the goldparticles were associated with plasma mem-branes versus 75% with intracellular vesicu-lar organelles (21) (Figure 4A). By contrast,after 10 minutes of exposure to 20 nM D-Trp8-SRIF, the proportion of gold particlesassociated with the membrane increasedsignificantly (to 47%), while the mean dis-tance of intracellular particles from the plas-ma membrane decreased significantly (from2–3 to 0.25–1 µm), indicating a SRIF-in-duced mobilization of receptors from thecell center to the periphery (Figure 4B).Furthermore, in cells exposed to SRIF, goldparticles were detected more frequently in
23
2. Tracking of Internalized Neuropeptides
Merighi2-aucorr.qxd 5/23/02 5:16 PM Page 23

24
A. Beaudet et al.
Figure 2. Dual localization of internalizedfluo-SRIF (A, B, and C) and of sst2A im-munoreactivity (A′′ and B′′) or of the TGNmarker syntaxin 6 (C′′) in COS-7 cellstransfected with cDNA encoding thesst2A receptor. Cells were incubated with20 nM fluo-SRIF at 37°C for 5 to 45 min-utes, fixed, and immunocytochemically re-acted with either sst2A or syntaxin 6 anti-bodies. (A and A′) After 5 minutes ofincubation, there is complete overlap be-tween the ligand (A) and sst2A immunore-activity (A′) at the periphery of the cell. (Band B′) After 30 minutes of incubation,fluo-SRIF (B) and sst2A immunoreactivity(B′) are both distributed more centrallywithin the cells and are partially dissociat-ed. (C and C′) At 45 minutes, fluo-NT (C)is concentrated next to the nucleus, whereit colocalizes extensively (arrows) with theTGN marker syntaxin 6 (C′). Abbrevia-tion: N, nucleus. Scale bar: 10 µm. (Seecolor plate A3.)
Figure 1. Confocal microscopic imaging of internalized fluo-NT in COS-7 cells transfected with cDNA encoding the NT1 re-ceptor. Images were acquired as single midcellular optical sections at 32 scans per frame. (A) After a 20-minute incubation at37°C, acid-wash resistant fluo-NT labeling is segregated within small endosome-like particles distributed throughout the cyto-plasm of the cell. (B) At 45 minutes, intracellular fluorescent particles are less numerous and clustered next to the nucleus. (C)This internalization is receptor-mediated, as it is no longer detectable when the incubation is carried out in the presence of an ex-cess of nonfluorescent NT. Abbreviation: N, nucleus. Scale bar: 10 µm.
Merighi2-aucorr.qxd 5/23/02 5:16 PM Page 24

clathrin-coated pits at the cell membrane(Figure 4C) as well as in coated vesicles inthe subplasmalemmal zone (Figure 4D)than in nonexposed cells, indicating thatsst5 receptor internalization proceededthrough clathrin-mediated mechanisms.
Studies in Brain Slices
By contrast, in brain slices immunola-beled with antibodies directed against sst2Areceptors, exposure to the agonist (40 min)resulted in a significant decrease in mem-brane to intracellular receptor ratios (3)(Figure 5). The same decrease was apparentin the two brain regions sampled (based ontheir high sst2A receptor content), namelythe basolateral amygdala and the claustrum(Figure 5). It was entirely prevented by theendocytosis inhibitor phenylarsine oxide,indicating that it resulted from clathrin-me-diated receptor internalization (Figure 5).
Taken together, these two sets of data in-dicate that depending on the receptor sub-type involved, receptor-mediated internal-ization may either increase or decrease cell
surface receptor density and, hence, playdifferential roles in cellular desensitization.
Technical Notes
There are a variety of fixative agents suit-able for the investigation of receptor local-ization at the ultrastructural level. We havebeen equally successful with mixtures of glu-taraldehyde (0.3%) and paraformaldehyde(4%) or of acrolein (3.75%) and parafor-maldehyde (2%). The use of acrolein con-fers a greater degree of ultrastructural preser-vation but, at high concentrations, canadversely affect tissue antigenicity. In eithercase, primary fixation should be followed bytwo postfixation steps, one with a higherconcentration of glutaraldehyde (2%) forcross-linking the secondary antibody to theprimary antibody, and another with osmi-um tetroxide to aid ultrastructural preserva-tion and the staining of lipid bilayers.
The silver-intensification step is perhapsthe most delicate of the entire immunogoldstaining protocol. Care must be taken notonly to find the optimal incubation time
25
2. Tracking of Internalized Neuropeptides
Figure 3. Confocal microscopic images of fluo-NT labeling in slices of rat ventral tegmental area. Slices were pulse-labeled for 3minutes with 10 nM fluo-NT, and sections were scanned 10 minutes (A) and 30 minutes (B) after washout with Ringer buffer. At10 minutes (A), labeling is evident over both perikarya (arrows) and neuropil. At 30 minutes (B), nerve cell bodies are still in-tensely labeled, but the neuropil labeling is markedly reduced. Note that at 30 minutes, the labeling is detected in the form ofsmall puntate fluorescent granules that pervade the perikaryal cytoplasm (arrows). Images were reconstructed from a stack of 25 se-rial optical sections separated by 0.12 µm steps and scanned at 32 scans per frame. Scale bars: 10 µm. (See color plate A4).
Merighi2-aucorr.qxd 5/23/02 5:16 PM Page 25
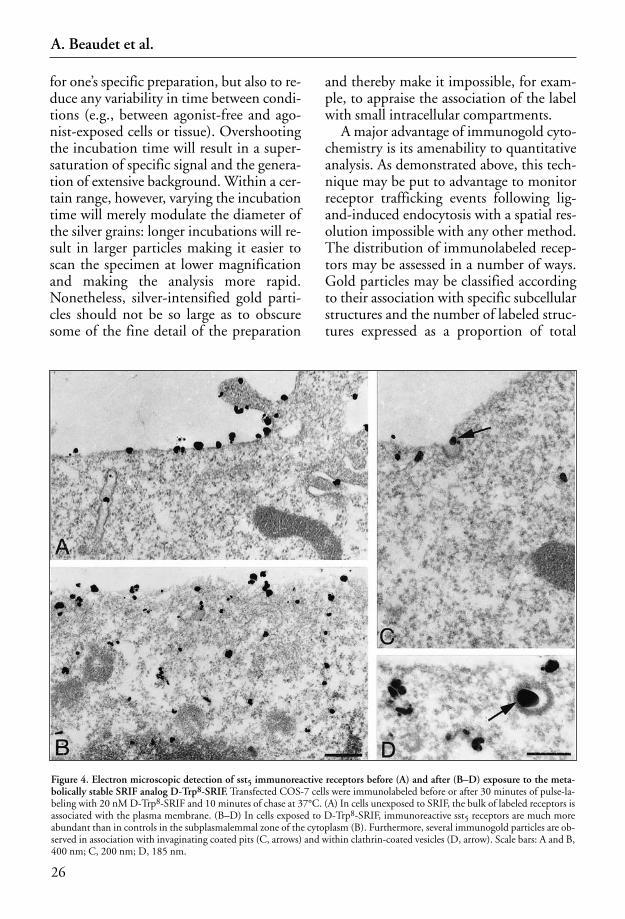
for one’s specific preparation, but also to re-duce any variability in time between condi-tions (e.g., between agonist-free and ago-nist-exposed cells or tissue). Overshootingthe incubation time will result in a super-saturation of specific signal and the genera-tion of extensive background. Within a cer-tain range, however, varying the incubationtime will merely modulate the diameter ofthe silver grains: longer incubations will re-sult in larger particles making it easier toscan the specimen at lower magnificationand making the analysis more rapid.Nonetheless, silver-intensified gold parti-cles should not be so large as to obscuresome of the fine detail of the preparation
and thereby make it impossible, for exam-ple, to appraise the association of the labelwith small intracellular compartments.
A major advantage of immunogold cyto-chemistry is its amenability to quantitativeanalysis. As demonstrated above, this tech-nique may be put to advantage to monitorreceptor trafficking events following lig-and-induced endocytosis with a spatial res-olution impossible with any other method.The distribution of immunolabeled recep-tors may be assessed in a number of ways.Gold particles may be classified accordingto their association with specific subcellularstructures and the number of labeled struc-tures expressed as a proportion of total
26
A. Beaudet et al.
Figure 4. Electron microscopic detection of sst5 immunoreactive receptors before (A) and after (B–D) exposure to the meta-bolically stable SRIF analog D-Trp8-SRIF. Transfected COS-7 cells were immunolabeled before or after 30 minutes of pulse-la-beling with 20 nM D-Trp8-SRIF and 10 minutes of chase at 37°C. (A) In cells unexposed to SRIF, the bulk of labeled receptors isassociated with the plasma membrane. (B–D) In cells exposed to D-Trp8-SRIF, immunoreactive sst5 receptors are much moreabundant than in controls in the subplasmalemmal zone of the cytoplasm (B). Furthermore, several immunogold particles are ob-served in association with invaginating coated pits (C, arrows) and within clathrin-coated vesicles (D, arrow). Scale bars: A and B,400 nm; C, 200 nm; D, 185 nm.
Merighi2-aucorr.qxd 5/23/02 5:17 PM Page 26

(e.g., labeled coated pits expressed as a per-centage of coated pits evident at the cellsurface). Alternatively, the number of la-beled receptors associated with a particularstructure may be expressed as a proportionof the total number of labeled receptors inthe cell profile (e.g., proportion of labeledreceptors associated with plasma mem-branes), or as densities of receptors associ-ated with that profile (e.g., number oflabeled receptors per unit length of mem-brane or per unit area of profile). In thecontext of receptor-mediated endocytosis,labeled receptors may also be classified ac-
cording to their distance from the plas-malemma and then sorted into bins of in-creasing distance from the cell surface (21).
Readers are referred to Chapter 10 forfurther discussion on the immunogold la-beling procedures.
ACKNOWLEDGMENTS
We thank Catherine M. Cahill, AnneMorinville, and Pierre Villeneuve for theirhelp in the preparation of the manuscriptand Naomi Takeda for secretarial assistance.
27
2. Tracking of Internalized Neuropeptides
Figure 5. Effect of SRIF stimulation on the subcellular distribution of immunoreactive sst2A receptors in dendrites of the claus-trum and basolateral amygdala. Slices were incubated for 45 minutes at 37°C with or without D-Trp8-SRIF (100 nm–10 µm).Dendrite-associated immunogold particles were counted and classified as either membrane-associated or intracellular, and the re-sults expressed as membrane-associated per total. In the absence of agonist, approximately 60% of gold particles were associatedwith dendritic plasma membranes in both cerebral regions. Addition of agonist induced a decrease in the percentage of receptorsassociated with plasma membranes. The agonist-induced decrease in surface receptors was prevented by adding 10 µM phenylar-sine oxyde to the incubation medium. Values are the mean ± standard error of the mean (SEM) from three animals. **, P < 0.01.
Merighi2-aucorr.qxd 5/23/02 5:17 PM Page 27

REFERENCES
1.Barak, L.S., S.S.G. Ferguson, J.I.E. Zhang, C. Mar-tenson, T. Meyer, and M.G. Caron. 1997. Internaltrafficking and surface mobility of a functionally intactbeta2-adrenergic receptor-green fluorescent proteinconjugate. Mol. Pharmacol. 51:177-184.
2.Beaudet, A., D. Nouel, T. Stroh, F. Vandenbulcke, C.Dal Farra, and J.-P. Vincent. 1998. Fluorescent ligandsfor studying neuropeptide receptors by confocal mi-croscopy. Braz. J. Med. Biol. Res. 31:1479-1489.
3.Boudin, H., P. Sarret, J. Mazella, A. Schonbrunn, andA. Beaudet. 2000. Somatostatin-induced regulation ofsst2A receptor expression and cell surface availability incentral neurons: role of receptor internalization. J.Neurosci. 20:5932-5939.
4.Castel, M.-N., J. Woulfe, X. Wang, P.M. Laduron, andA. Beaudet. 1992. Light and electron microscopic lo-calization of retrogradely transported neurotensin in ratnigrostriatal dopaminergic neurons. Neuroscience50:269-282.
5.Chan, J., C. Aoki, and V.M. Pickel. 1990. Optimizationof differential immunogold-silver and peroxidase label-ing with maintenance of ultra-structure in brain sectionsbefore plastic embedding. J. Neurosci. 15:113-127.
6.Daaka, Y., L.M. Luttrell, S. Ahn, G.J. Della Rocca,S.S.G. Ferguson, M.G. Caron, and R.J. Lefkowitz.1998. Essential role for G protein-coupled receptor en-docytosis in the activation of mitogen-activated proteinkinase. J. Biol. Chem. 273:685-688.
7.Dautry-Varsat, A., A. Ciechanover, and H.F. Lodish.1983. pH and the recycling of transferrin during recep-tor-mediated endocytosis. Proc. Natl. Acad. Sci. USA80:2258-2262.
8.Dumartin, B., I. Caillé, F. Gonon, and B. Bloch.1998. Internalization of D1 dopamine receptor in stri-atal neurons in vivo as evidence of action by dopamineagonists. J. Neurosci. 18:1650-1661.
9.Faure, M.-P., P. Gaudreau, I. Shaw, N.R. Cashman,and A. Beaudet. 1994. Synthesis of a biologically activefluorescent probe for labeling neurotensin receptors. J.Histochem. Cytochem. 42:755-763.
10.Faure, M.-P., A. Alonso, D. Nouel, G. Gaudriault, M.Dennis, J.-P. Vincent, and A. Beaudet. 1995. Somato-dendritic internalization and perinuclear targeting ofneurotensin in the mammalian brain. J. Neurosci.15:4140-4147.
11.Faure, M.-P., D. Nouel, and A. Beaudet. 1995. Axonaland dendritic transport of internalized neurotensin inrat mesostriatal dopaminergic neurons. Neuroscience68:519-529.
12.Ferguson, S.S.G., J. Zhang, L.S. Barak, and M.G.Caron. 1998. Role of β-arrestins in the intracellulartrafficking of G-protein-coupled receptors. Adv. Phar-macol. 42:420-424.
13.Gaudriault, G., D. Nouel, C. Dal Farra, A. Beaudet,and J.-P. Vincent. 1997. Receptor-induced internaliza-tion of selective peptidic µ and δ opioid ligands. J. Biol.Chem. 272:2880-2888.
14.Ghinea, N., M.T. Vu Hai, M.T. Groyer-Picard, A.Houllier, D. Schoevaert, and E. Milgrom. 1992. Path-ways of internalization of the hCG/LH receptor: im-munoelectron microscopic studies in Leydig cells andtransfected L-cells. J. Cell Biol. 118:1347-1358.
15.Grady, E.F., A.M. Garland, P.D. Gamp, M. Lovett,D.G. Payan, and N.W. Bunnett. 1995. Delineation ofthe endocytic pathway of substance P and its seven-transmembrane domain NK1 receptor. Mol. Biol. Cell6:509-524.
16.Mantyh, P.W., C.J. Allen, J.R. Ghilardi, S.D. Rogers,C.R. Mantyh, H. Liu, A.I. Basbaum, S.R. Vigna, andJ.E. Maggio. 1995. Rapid endocytosis of a G protein-coupled receptor: substance P-evoked internalization ofits receptor in the rat striatum in vivo. Proc. Natl. Acad.USA 92:2622-2626.
17.Nouel, D., G. Gaudriault, M. Houle, T. Reisine, J.-P.Vincent, J. Mazella, and A. Beaudet. 1997. Differen-tial internalization of somatostatin in COS-7 cellstransfected with sst1 and sst2 receptor subtypes: a con-focal microscopic study using novel fluorescent so-matostatin derivatives. Endocrinology 138:296-306.
18.Nouel, D., M.-P. Faure, J.-A. St. Pierre, R. Alonso, R.Quirion, and A. Beaudet. 1997b. Differential bindingprofile and internalization process of neurotensin vianeuronal and glial receptors. J. Neurosci. 17:1795-1803.
19.Pearse, B.M. 1982. Coated vesicles from human pla-centa carry ferritin, transferrin, and immunoglobulinG. Proc. Natl. Acad. Sci. USA 79:451-455.
20.Sarret, P., D. Nouel, C. Dal Farra, J.-P. Vincent, A.Beaudet, and J. Mazella. 1999. Receptor-mediated in-ternalization is critical for the inhibition of the expres-sion of growth-hormone by somatostatin in the pitu-itary cell line AtT-20. J. Biol. Chem. 274:19294-19300.
21.Stroh, T., A.C. Jackson, P. Sarret, C. Dal Farra, J.-P.Vincent, H.J. Kreienkamp, J. Mazella, and A. Beau-det. 2000. Intracellular dynamics of sst5 receptors intransfected COS-7 cells: maintenance of cell surface re-ceptors during ligand-induced endocytosis. Endocrin-ology 141:354-365.
22.Stroh, T., A.C. Jackson, C. Dal Farra, A. Schonbrun,J.P. Vincent, and A. Beaudet. Receptor-mediated in-ternalization of somatostatin in rat cortical and hip-pocampal neurons. Synapse (In press).
23.von Zastrow, M. and B.K. Kobilka. 1992. Ligand-reg-ulated internalization and recycling of human β2-adrenergic receptors between the plasma membraneand endosomes containing transferrin receptors. J.Biol. Chem. 267:3530-3538.
28
A. Beaudet et al.
Merighi2-aucorr.qxd 5/23/02 5:17 PM Page 28

29
OVERVIEW
We describe two simple, quick, andreproducible methods to transfect primaryhippocampal neurons. The first methodconsists of a modified calcium phosphate(CP) transfection. We have developed thismethod to analyze localization of proteins infully mature hippocampal neurons, howeverit can also be used for others purposes, suchas the analysis of gene regulation or functionof proteins in neurons. This method offersthe advantage of transfecting small numbersof neurons at different developmentalstages. The second method is an efficientelectroporation (EP) protocol to performlarge-scale biochemistry experiments. Exam-ples demonstrate the suitability of bothtechniques. These protocols could be a use-ful framework to transfect primary neuronscultured from other brain regions.
BACKGROUND
Many neuroscientists have successfullydeveloped viral methods to transfect pri-mary neurons (reviewed in Craig, 1998;
see Reference 1). However, production ofrecombinant virus remains complex andtime-consuming. Moreover, potential toxi-city to the neurons and probable safetyhazard to laboratory personnel cannot beexcluded. In the last few years, several labo-ratories have made an effort to transfectpostmitotic primary neurons in dissociatedculture adapting classical transfectionmethods (e.g., CP precipitation and cat-ionic lipid transfection) used for dividingcells. Transfection by CP has been success-fully applied for introducing cloned eu-karyotic DNAs in cultured mammaliancells. Although the mechanisms remain ob-scure, it is believed that the transfectedDNA enters the cytoplasm by endocytosisand is transferred to the nucleus (4).
In the last few years, a series of papershave been published where this DNA/CPtransfection method was adapted to trans-fect a primary culture of rat cortical, hippo-campal, spinal cord, and dorsal rootganglion neurons (6,9,10). However, theprecise conditions for successful CP-medi-ated DNA transfection have not been fullyinvestigated, and the efficiency reported isrelatively low, at most 1% to 2% (for review
Cellular and Molecular Methods in Neuroscience ResearchEdited by A. Merighi and G. Carmignoto
Transfection Methods for Neurons inPrimary Culture
Christoph Kaether1, Martin Köhrmann1, Carlos G. Dotti1,2, andFrancesca Ruberti1
1EMBL Heidelberg, Cell Biology Programme, Heidelberg, Germany, EU; 2Cavalieri Ottolenghi Scientific Institute, Università degli Studi diTorino, Orbassano, Italy, EU
3
Merighi3-aucorr.qxd 5/23/02 5:20 PM Page 29

see Reference 1). Furthermore, in previousreports neurons are mostly transfected be-fore plating or at an immature stage.
In our laboratory, we are interested inthe mechanisms that guard intracellulartransport of membrane proteins and theirsorting to the axon or the dendrites in neu-rons. We use as a cellular system primaryneurons from rat embryo hippocampideveloped by Goslin and Banker (3). Hip-pocampal neurons are grown at low densi-ty on glass coverslips, which are theninverted in order to face a monolayer ofglia grown on a plastic dish. The use of thehippocampal–glia coculture system allowus to reproduce in vitro neuronal polariza-tion, which leads to differentiated neuronswith one axon and several dendrites. Cellscan be maintained in culture more thanthree weeks after plating.
For our work it would be convenient tohave a simple protocol that allows: (i) totransfect embryonic hippocampal neuronsat different developmental stages includingfully mature neurons; (ii) to transfect sev-eral cDNAs at the same time in parallelexperiments instead of producing a recom-binant virus for each construct; and (iii) tocotransfect two plasmids into the sameneurons. Thus, we adapted a CP protocolfor efficient transfection of hippocampalneurons (5). This method has been success-fully applied to transfect adult hippocam-pal neurons, but the cells were grown in adifferent manner. We describe a protocoland emphasize the crucial factors forobtaining efficient transfection by CP in“our” hippocampal neurons.
We also describe a second protocol thatis based on EP (8). There are very fewexamples of applications of this method toprimary neurons, and transfection efficien-cies are below 2% (7). We present a proto-col to transfect hippocampal neurons at arate of up to 20% efficiency. Other trans-fection protocols are described in Chapters4 to 6 of this book.
PROTOCOLS
Protocol for Calcium PhosphatePrecipitation
We use CP for transfecting exogenousproteins into cultured hippocampal neuronsand subsequent localization studies usingimmunofluorescence or video microscopy.CP can also be used for small-scale bio-chemical studies like western blot to charac-terize an antibody or to verify the full-length expression of a transfected protein.
The preparation and culturing of hip-pocampal neurons is described in detail inReference 2 and 3.
Materials and Reagents
• Neurons 3 to 14 days in vitro (DIV)• Waterbath at 37°C• 3.5-cm Plastic dishes• Sterile forceps• 2-mL Eppendorf tubes• Vortex mixer• 2.5% CO2 incubator• 250 mM CaCl2 solution, sterile and
warmed to room temperature• 2× BBS, (280 mM NaCl, 1.5 mM
Na2HPO4, 50 mM BES [N,N-bis(2-hydroxyethyl)-2-aminoethanesulfonicacid]; Sigma, St. Louis, MO, USA),pH 7.1
• HBS (135 mM NaCl, 20 mM HEPES[4-(2-hydroxyethyl)-1-piperazineeth-anesufonic acid], pH 7.1, 4 mM KCl,1 mM Na2HPO4, 2 mM CaCl2, 2mM MgCl2, 10 mM glucose)
• Dishes with conditioned N2 medium• DNA (2–5 mg/mL)
Preparation of DNA
For optimal results, prepare endotox-in-free DNA with a plasmid purificationkit (EndoFree Plasmid Maxi Kit; Qia-gen, Hilden, Germany). After the final pre-cipitation, dissolve DNA in endotoxin-free
30
C. Kaether et al.
Merighi3-aucorr.qxd 5/23/02 5:20 PM Page 30

water or Tris-EDTA (TE) at a concentra-tion of 1 to 3 mg/mL. Prepare 50 to100-µL aliquots and store at -20°C. Storethawed DNA at 4°C and avoid frequentfreezing and thawing.
Preparation of Conditioned N2
Older, polarized neurons survive betterin medium enriched in factors secreted byastrocytes. To keep neurons in conditionedmedium throughout the transfection, it isnecessary to have preconditioned mediumat hand. Therefore, we grow astrocytes on6-cm plastic dishes as described in Refer-ence 2. The N2 medium in which astro-cytes are grown can be used for transfec-tion. Check that the pH is not too acidic,as this will prevent the precipitate to form.
Procedure
1. Warm 2× BBS and CaCl2 to roomtemperature. Place HBS in a 37°Cwaterbath.
2. Add 2 mL of conditioned N2 into a3.5-cm dish and transfer coverslips intothe dishes such that the neurons arefacing up. Immediately place them inthe 5% incubator for 30 minutes.
3. In a 2-mL tube mix 2 to 5 µg of DNAwith the CaCl2 solution to a final vol-ume of 60 µL. Mix briefly by vortexmixing.
4. Slowly add 60 µL of 2× BBS while stir-ring with the tip.Vortex mix briefly. If several dishes aretransfected with the same DNA, pre-pare a master mixture. This ensuresequal transfection for all dishes.
5. After 1 minute, take the cells out of theincubator and check the pH of themedium. If necessary, add drops ofdiluted hydrochloric acid to reach thedesired pH. Color must be red, not yel-lowish and not purple.
6. Add DNA–phosphate precipitate andstir gently. The medium should nowbecome yellowish. Transfer dishes to a2.5% CO2 incubator.
7. Let precipitate form and settle ontocells for 30 to 120 minutes. Check themedium after 30 to 60 min. If themedium is very purple and turbid, theprecipitate is probably already very big.Check on a microscope for size of theprecipitate. Precipitate should have thesize and appearance of bacterial conta-mination. Big precipitates are toxic,and the cells will die.
8. After precipitate has formed, gentlywash the cells 2 times with prewarmedHBS, then add the original medium inwhich they were grown.
9. Flip coverslips so that the neurons arefacing the bottom of the dish and incu-bate until analysis. Depending on theconstruct, we analyze cells 8 hours to 3days after transfection.
Pitfalls
Several parameters are critical for an effi-cient transfection.1. We found that the use of endotoxin-
free DNA significantly increases thenumber of transfected cells.
2. The use of a 2.5% CO2 incubator dur-ing the transfection procedure is essential in our hands.
3. Successful transfection is dependenton the pH of the medium to whichthe precipitate is added. A too acidicmedium will prevent the precipitateto form, and a too alkaline mediumwill lead to huge precipitates that areneurotoxic.
Drawbacks
Even by carefully following the protocoltransfection, efficiencies vary from trans-
31
3. Transfection Methods for Neurons in Primary Culture
Merighi3-aucorr.qxd 5/23/02 5:20 PM Page 31

fection to transfection. Moreover differentconstructs generally give different efficien-cies, even if the same expression vector isused (C.K. and F.R., unpublished observa-tion). Also, transfected cells on a dish orcoverslip are not evenly distributed, buttend to cluster.
Protocol for Transfection of Neurons forBiochemical Experiments
For analysis of exogenous proteins bywestern blot or radioactive labeling, neuronscan be grown on 3.5-cm plastic dishes andtransfected in principle as described above.
Preparation of Polylysine-Coated PlasticDishes: Prepare 2 Days Before Plating
1. Cover bottom of dish with 1 mg/mLpolylysine and leave overnight at roomtemperature.
2. Remove polylysine solution and wash 2times for 1 hour in distilled water.
3. Add 1 mL medium (minimum essentialmedium [MEM] + 10% horse serum)and keep overnight in the incubator.
4. Replace medium with N2 supplement-ed with insulin (5 µg/mL).
5. Seed cells and allow to grow for desiredtime. For better survival neurons canbe covered with a big coverslip withparaffin dots.
Procedure
1. Collect the original medium of thecells and store in the incubator.
2. Perform the transfection as describedabove. Afterwards, add the originalmedium back and incubate the cellsuntil needed.
For analysis, prepare a cell lysate (seebelow) and pool three dishes per lane on asodium dodecyl sulfate (SDS) gel.
Protocol for Electroporation
For large-scale biochemistry, we electro-porate neurons before plating and growthem in 75-cm2 flasks.
Materials and Reagents
• Gene Pulser (Bio-Rad Laboratories,Hercules, CA, USA)
• 0.4-cm Gene Pulser cuvettes (Bio-Rad)
• Horse-MEM
• Hank’s balanced salt solution (HBSS)
• 75-cm2 flasks coated with polylysine
• DNA, endotoxin-free, concentrationof 1 to 4 mg/mL
Procedures
Coating of Flasks: Prepare at Least 1 DayBefore Preparing the Neurons
1. Add 10 mL of a 10 µg/mL polylysinesolution to the flask and incubate for 1hour at room temperature.
2. Wash 3 times with water and add 10mL horse-MEM. Incubate overnight in
a 37°C, 5% CO2 incubator.3. Replace the medium with N2 medium
and equilibrate in the incubator for atleast 3 hours.
4. Dissect hippocampi, triturate, andcount.
5. Add 2.5 to 3 × 10⁶ cells to an electro-poration cuvette.
6. Add 50 µg DNA and HBSS if neces-sary, to a final volume of 0.8 mL andmix with a pasteur pipet. Leave atroom temperature for 3 to 5 minuteswith occasional mixing.
7. Electroporate at 850 V, 25 µF, and 200Ohm. Time constant should be 0.8.
8. Carefully resuspend cells by pipetting
32
C. Kaether et al.
Merighi3-aucorr.qxd 5/23/02 5:20 PM Page 32
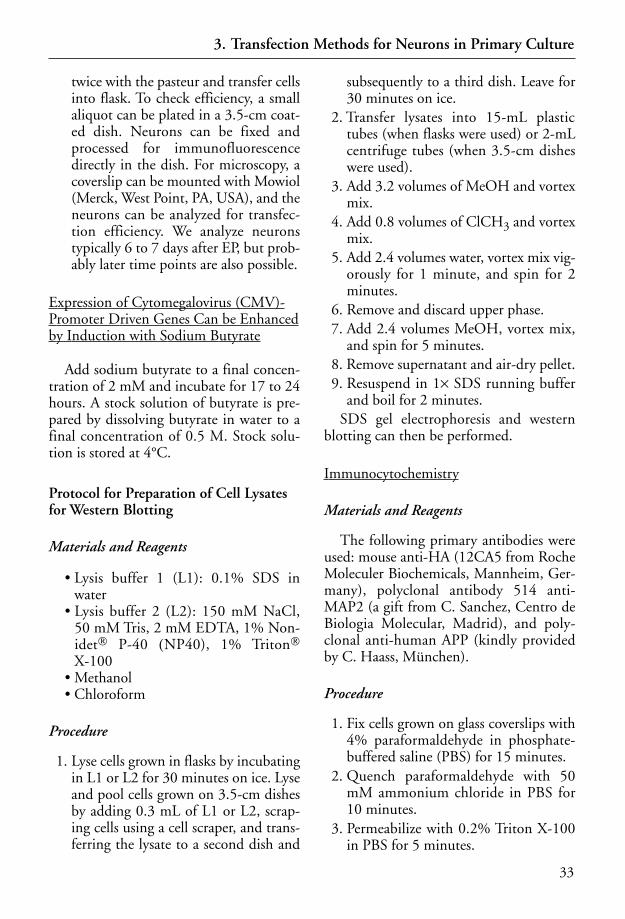
twice with the pasteur and transfer cellsinto flask. To check efficiency, a smallaliquot can be plated in a 3.5-cm coat-ed dish. Neurons can be fixed andprocessed for immunofluorescencedirectly in the dish. For microscopy, acoverslip can be mounted with Mowiol(Merck, West Point, PA, USA), and theneurons can be analyzed for transfec-tion efficiency. We analyze neuronstypically 6 to 7 days after EP, but prob-ably later time points are also possible.
Expression of Cytomegalovirus (CMV)-Promoter Driven Genes Can be Enhancedby Induction with Sodium Butyrate
Add sodium butyrate to a final concen-tration of 2 mM and incubate for 17 to 24hours. A stock solution of butyrate is pre-pared by dissolving butyrate in water to afinal concentration of 0.5 M. Stock solu-tion is stored at 4°C.
Protocol for Preparation of Cell Lysatesfor Western Blotting
Materials and Reagents
• Lysis buffer 1 (L1): 0.1% SDS inwater
• Lysis buffer 2 (L2): 150 mM NaCl,50 mM Tris, 2 mM EDTA, 1% Non-idet P-40 (NP40), 1% Triton
X-100• Methanol• Chloroform
Procedure
1. Lyse cells grown in flasks by incubatingin L1 or L2 for 30 minutes on ice. Lyseand pool cells grown on 3.5-cm dishesby adding 0.3 mL of L1 or L2, scrap-ing cells using a cell scraper, and trans-ferring the lysate to a second dish and
subsequently to a third dish. Leave for30 minutes on ice.
2. Transfer lysates into 15-mL plastictubes (when flasks were used) or 2-mLcentrifuge tubes (when 3.5-cm disheswere used).
3. Add 3.2 volumes of MeOH and vortexmix.
4. Add 0.8 volumes of ClCH3 and vortexmix.
5. Add 2.4 volumes water, vortex mix vig-orously for 1 minute, and spin for 2minutes.
6. Remove and discard upper phase.7. Add 2.4 volumes MeOH, vortex mix,
and spin for 5 minutes.8. Remove supernatant and air-dry pellet.9. Resuspend in 1× SDS running buffer
and boil for 2 minutes.SDS gel electrophoresis and western
blotting can then be performed.
Immunocytochemistry
Materials and Reagents
The following primary antibodies wereused: mouse anti-HA (12CA5 from RocheMoleculer Biochemicals, Mannheim, Ger-many), polyclonal antibody 514 anti-MAP2 (a gift from C. Sanchez, Centro deBiologia Molecular, Madrid), and poly-clonal anti-human APP (kindly providedby C. Haass, München).
Procedure
1. Fix cells grown on glass coverslips with4% paraformaldehyde in phosphate-buffered saline (PBS) for 15 minutes.
2. Quench paraformaldehyde with 50mM ammonium chloride in PBS for10 minutes.
3. Permeabilize with 0.2% Triton X-100in PBS for 5 minutes.
33
3. Transfection Methods for Neurons in Primary Culture
Merighi3-aucorr.qxd 5/23/02 5:20 PM Page 33

4. Then incubate with blocking solution(2% bovine serum albumin [BSA], 2%fetal calf serum [FCS], 0.2% fish skingelatin) in PBS for 30 minutes.
5. For double labeling, incubate the cellswith the primary antibodies diluted in10% blocking solution in PBS for 1hour at room temperature or overnightat 4°C.
6. Wash with PBS 3 times. 7. Incubate with appropriate fluoro-
chrome-conjugated secondary antibod-ies diluted in 10% blocking solution inPBS for 20 to 30 minutes at room tem-perature.
8. Mount coverslips with mowiol con-taining 100 mg/mL DABCO (Sigma)as an antifading agent.
RESULTS AND DISCUSSION
Calcium Phosphate Transfection
The CP protocol was applied to studythe sorting of exogenous neuronal trans-membrane proteins. Figure 1 shows theresult of an experiment in which we havetransfected 9 days in vitro (DIV) hip-pocampal neurons with the cDNA for themetabotropic glutamate receptor (mGluR2,kindly provided by S. Nakanishi) in whichan HA epitope tag has been inserted at theN terminus of the protein. Twenty-fourhours after transfection, cells were analyzedby immunofluorescence using antibodiesagainst the dendritic cytoskeletal proteinMAP2 and antibodies against the HA epi-tope tag to detect the recombinant mGlu-R2. As shown in Figure 1, the recombinantHA-mGluR2 is distributed to the somato-dendritc domain like the protein MAP2.
The CP method also allows the analysisof the distribution of two different exoge-nous proteins in the same cell. Almost100% cotransfection can be obtained by
mixing plasmids prior to precipitate forma-tion. Figure 2 shows the results of acotransfection of the cDNA for glutamatereceptor 1 (GluR1) and amyloid precursorprotein (APP). These two proteins are den-dritic and axonal–dendritic, respectively.
This CP transfection method can also
34
C. Kaether et al.
Figure 1. Immunofluorescence showing the dendritic distri-bution of N-HA-mGluR2 in 10 DIV hippocampal neurons.Nine DIV neurons were transfected with the cDNA for HA-mGluR2 and fixed 24 hours later and processed for immuno-fluorescence using antibodies against HA and MAP-2. PanelsA and B show the distribution of the HA-mGluR2 proteinand the endogenous dendritic marker MAP2, respectively.Panel C shows a phase contrast micrograph. HAmGluR2labeling is restricted to cell body and dendrites (identified byMAP2 labeling). The axon is indicated by the arrow.
Merighi3-aucorr.qxd 5/23/02 5:20 PM Page 34

be used for localization studies by time-lapse video microscopy using green fluores-cent protein (GFP) fusion protein. Trans-port of GFP-tagged transmembrane pro-teins such as synapthophysin and APP (C.Kaether and C.G. Dotti, unpublisheddata) and the RNA binding protein Stau-fen (6a) have been successfully analyzed in
living hippocampal neurons. The rate oftransfection using this protocol allowed usto analyze by western blotting that theGFP fusion proteins are accuratelyprocessed (see protocol section).
Calcium Phosphate TransfectionEfficiency
In order to determine transfection effi-ciency, we have transfected cDNAs codingfor different neuronal transmembrane pro-teins under the control of the CMV pro-moter. We can detect protein expression byimmunofluorescence 8 hours after trans-fection. However, in most cases, we haveanalyzed protein distribution 24 hoursafter CP. We can transfect cells after 1 to 11DIV, but we found that transfection effi-ciency decreases when cells after 8 DIVwere used. In optimal conditions, we wereable to obtain a transfection efficiency of10% to 20% for three different constructs.Yet we want to stress, as mentioned alreadyin the protocol section, that the efficiencycan vary a lot between transfections andbetween constructs.
Several other applications of this CPmethod can be envisaged, for example func-tional studies of wild-type and mutated pro-teins in single cells, using electrophysiologyor time-lapse microscopy. Although weestablished optimal CP transfection condi-tions for embryonic hippocampal neurons,it will be also possible to adapt this protocolto other types of primary neuronal cultures.
Electroporation
To demonstrate the efficient transfec-tion of hippocampal neurons by EP, wedissected the hippocampi of 13 to 15 em-bryos. Dissociated cells were electroporat-ed without or with pEGFP-N1 (CLON-TECH Laboratories, Palo Alto, CA, USA),which is an expression vector coding forenhanced GFP, and cultured in 75-cm2
35
3. Transfection Methods for Neurons in Primary Culture
Figure 2. Cotransfection of 9 DIV hippocampal neurons withHA-GluR1 and human APP-cDNAs. Twenty-four hours aftercotransfection, the cells were analyzed by immunofluorescenceusing antibodies against HA and human APP. Human APP(panel A) extends to the axonal domain (arrow) as well as tothe dendritic compartment. HA-GluR1 distribution is restrict-ed to the dendrites (panel B). Panel C shows a phase contrastmicrograph. Scale bar is10 µm.
Merighi3-aucorr.qxd 5/23/02 5:20 PM Page 35

flasks. After 7 days, EP neurons were lysedin lysis buffer and processed for immu-noblotting. Blotting was performed usingan antiserum against GFP (CLONTECH)(Figure 3). A single band at 30 kDa corre-sponding to GFP is detected in cell lysatesof transfected cells (Figure 3, lane 1) butnot in control cells (Figure 3, lane 2). A15th of the total cell lysate of a 75-cm2
flask could be readily detected on a westernblot (data not shown). This corresponds toapproximately 70 000 neurons, out ofwhich 10% to 20% are transfected.
In summary, the described protocolsprovide tools for a variety of approacheswhere the expression of exogenous proteinsin primary neurons is required. In thefuture, new approaches using this tech-nique might include screening of anexpression library to pick up relevant genesfor specific neuronal function.
ACKNOWLEDGMENTS
We thank B. Hellias for technical assis-
tance and Jose Abad for providing the pro-tocol on growing hippocampal neurons in75-cm2 flasks. C.K. was a recipient of a fel-lowship of the Fritz-Thyssen-Stiftung, F.R.was a recipient of a European Communitylong-term fellowship.
REFERENCES
1.Craig, A.M. 1998. Transfecting cultured neurons, p.79-111. In G. Banker and K. Goslin. (Eds.), CulturingNerve Cells. MIT Press, Boston.
2.de Hoop, M.J., L. Meyn, and C.G. Dotti. 1998. Cul-turing hippocampal neurons and astrocytes from fetalrodent brain, p. 154-163. In J.E. Celis (Ed.), Cell Biol-ogy: A Laboratory Handbook, Vol. 1. Academic Press,San Diego.
3.Goslin, K. and G. Banker. 1991. Rat hippocampalneurons in low-density culture, p. 251-282. In G.Banker and K. Goslin. (Eds.), Culturing Nerve Cells.MIT Press, Cambridge, MA.
4.Graham, F.L. and A.J. van der Eb. 1973. Transforma-tion of rat cells by DNA of human adenovirus 5. Virol-ogy 52:456-467.
5.Haubensak, W., F. Narz, R. Heumann, and V. Less-mann. 1998. BDNF-GFP containing secretory gran-ules are localized in the vicinity of synaptic junctionsof cultured cortical neurons. J. Cell Sci. 111:1483-1493.
6.Kanai, Y. and N. Hirokawa. 1995. Sorting mecha-nisms of tau and MAP2 in neurons: suppressed axon-al transit of MAP2 and locally regulated microtubulebinding. Neuron 14:421-432.
6a.Kohrmann, M., M. Luo, C. Kaether, L. DesGro-seillers, C.G. Dotti, and M.A. Kiebler. 1999. Micro-tubule-dependent recruitment of Staufen-green fluo-rescent protein into large RNA-containing granulesand subsequent dendritic transport in living hip-pocampal neurons. Mol. Biol. Cell. 10:2945-2953.
7.Li, H., S.T. Chan, and F. Tang. 1997. Transfectionof rat brain cells by electroporation. J. Neurosci.Methods 75:29-32.
8.Potter, H., L. Weir, and P. Leder. 1984. Enhancer-dependent expression of human kappa immunoglob-ulin genes introduced into mouse pre-B lymphocytesby electroporation. Proc. Natl. Acad. Sci. USA81:7161-7165.
9.Watson, A. and D. Latchman. 1996. Gene deliveryinto neuronal cells by calcium phosphate-mediatedtransfection. Methods 10:289-291.
10.Xia, Z., H. Dudek, C.K. Miranti, and M.E. Green-berg. 1996. Calcium influx via the NMDA receptorinduces immediate early gene transcription by a MAPkinase/ERK-dependent mechanism. J. Neurosci.16:5425-5436.
36
C. Kaether et al.
Figure 3. Western blot of electroporated neurons culturedfor 7 days. Neurons were electroporated with (lane 1) orwithout (lane 2) pEGFP-N1 cDNA, cultured for 7 days, andsubjected to Western blotting. Western blotting using GFP-antiserum detected a 30 kDa band in the cell lysates of trans-fected neurons (lane 1). The positions of molecular weightmarkers are indicated (in kDa).
Merighi3-aucorr.qxd 5/23/02 5:20 PM Page 36
37
OVERVIEW
We have developed and optimized amethod for delivering plasmid-based genesinto the vertebrate brain. The methodinvolves condensation of DNA into stable,small (<100 nm ø), and diffusible com-plexes using a cationic polymer, poly-ethylenimine (PEI). The approach isextremely versatile as it relies on use ofplasmid, not viral-based constructions.This means that construction preparationand amplification is easy to carry out, riskfree, and rapidly verified. The method isextremely efficient, giving very high yieldsfor small (nanogram) quantities of plas-mid. An overriding advantage is that it pro-vides a convenient technique for studyingphysiological regulation of neuronal genefunction within defined brain areas atdefined developmental stages or in specificphysiological states. One can thus obtaindata on integrated transcriptional responsesthat, obviously, could not be obtained byan in vitro approach without resorting togerminal transgenesis. We have applied itto the analysis of protein function and pro-moter regulation in the central nervous sys-tems (CNS) of mouse, rat, and Xenopus.
BACKGROUND
Gene transfer into cells of the CNS,whether in vivo or ex vivo, is a delicate anddifficult endeavor. Its uses are, however, sopromising that it is not surprising to notethat the field has drawn much attentionover the last decade. Two broad classes ofuses can be distinguished. On the onehand, there is gene therapy where the ulti-mate target will be the modification of anendogenous gene by homologous recombi-nation or the remedial addition of a genecoding for a deficient protein. On theother hand, we have analytical approacheswhere the aim may be either to determinethe physiological relevance of a given pro-tein by blocking or by bolstering its expres-sion or to dissect the regulatory mecha-nisms impinging on promoter function inan integrated setting. Furthermore, analy-sis of promoter regulation will be a prereq-uisite for creating constructs with opti-mized regulatory sequences for expressingtherapeutic proteins in physiologicallyappropriate conditions.
In the field of basic research, stereotaxicmicroinjection of different permutations ofa specific promoter into defined brainregions is a rapid and inexpensive method
Cellular and Molecular Methods in Neuroscience ResearchEdited by A. Merighi and G. Carmignoto
Polyethylenimine: A Versatile CationicPolymer for Plasmid-Based GeneDelivery in the CNS
Barbara A. Demeneix, Gregory F. Lemkine, and Hajer GuissoumaLaboratoire de Physiologie Générale et Comparée, UMR CNRS 8572Muséum National d’Histoire Naturelle, Paris, France, EU
4
Merighi4-aucorr.qxd 5/23/02 5:23 PM Page 37

for assessing function and for mappingtranscriptional regulatory elements. Indeed,using somatic gene transfer can provideresults on spatial and temporal regulationthat otherwise could only be obtained bylabor-intensive germinal transgenesis, anapproach that also requires a great deal oforganizational prowess and expense formaintenance of the numerous lines created.Gene transfer into the CNS can be basedon cell grafting or direct delivery. For directdelivery, a variety of methods, viral or non-viral, are available. As to the viral methods,in mammalian systems, reports haveappeared describing the use of adenovirus-es, lentiviruses, herpes virus, and adenoas-sociated virus-derived vectors. In amphib-ians, vaccinia virus has also been applied.However, besides their inherent safetyproblems in therapeutic settings, viral con-structs are laborious to construct and verify.Moreover, their production in large quan-tities is often problematic. For these reasonsmany groups have turned to synthetic, ornonviral, vectors to achieve gene transfer inthe CNS. Two main classes of syntheticvectors have been tested in the intact CNS:cationic lipids and cationic polymers. Here,we describe the use of a cationic polymerPEI. Indeed, of all the synthetic vectors sofar tested in the mammalian CNS, lowmolecular weight PEIs (1) provide the mostefficient gene delivery.
One of the most important features ofPEI is its lack of toxicity in vivo. In theCNS, the lesions inevitably created bymicroinjection into the brain tissue are nodifferent following injection of carrier orinjection of PEI/DNA complexes in carri-er. This lack of toxicity with PEI is nodoubt related to its high efficiency, whichallows the use of very low amounts ofDNA (in the nanogram range). The highefficiency of PEI is in turn related to itscapacity for protonation (2). The fact that,in PEI, one in every third atom is an aminonitrogen that can be protonated, makes
PEI the cationic polymer having the high-est charge density potential available.Moreover, the overall protonation level ofPEI increases from 20% to 45% betweenpH 7.0 and 5.0 (12).
PEI can be used for delivering plasmidDNA or oligonucleotides to brains of adultand newborn mice (1,3) and rats (9).Moreover, it can be used in the CNS forintrathecal (1,9) or intraventricular deliv-ery (6), the latter route being one thatcould be particularly useful for delivery oftherapeutic proteins such as nerve growthfactors. Work from our group and others isshowing that the method can be used forup and down modulation of protein pro-duction in defined brain regions and foranalysis of neuron-specific promoter regu-lation (5,7).
When starting up a gene transfer proto-col in vivo, it is always preferable, whetherone’s aim is promoter analysis or produc-tion of protein, to optimize delivery byexamining the quantitative aspects of trans-gene expression in the region targeted witha luciferase and then spatial aspects with aβ-galactosidase (β-gal) construct. Indeed,we have found that the optimal ratio ofPEI amine to DNA phosphate can varyaccording to species and brain region tar-geted. Such preliminary work will alsoenable one to test which promoter will per-form best in a given cell population ordevelopmental stage. For these reasons, wedetail our methods for extracting andassaying firefly luciferase (from Photinuspyralis) in the brain, this luciferase beingthe best reporter gene available for settingup gene transfer protocols. It is three ordersof magnitude more sensitive than β-gal,and the fact that it can be quantified withprecision is an overriding factor for choos-ing it for optimization of PEI/DNA ratios,amounts of DNA to be used, time courseevaluation, and for promoter analysis.Other reporter genes, such as chloram-phenicol acetyltransferase (CAT) and β-gal
38
B.A. Demeneix et al.
Merighi4-aucorr.qxd 5/23/02 5:23 PM Page 38

can of course be quantified, but each has itsdrawbacks compared to luciferase. Themain problem with colorimetric quantifi-cation of β-gal expression in the CNS isexcessive interference from endogenousenzymatic activity. Suppliers of kits (suchas Promega, Lyon, France) for suchmethodology recommend heat inactivationof endogenous enzymes. However, in ourhands, such precautions have proven inef-fective, and the extremely high backgroundfound throughout the mouse brain pre-cludes precise quantification of expressionof transgenes encoding β-gal. Similarly,when using histochemical procedures it isvital to use appropriate fixation conditionsto avoid interference from endogenousactivity that can be high, particularly in thehippocampus. CAT is a good alternativefor quantification, but whichever methodis chosen [usually enzyme-linked immuno-sorbent assay (ELISA) or the method ofSeed and Sheen (11)], assay time is longerand the methodology laborious. Thus, werecommend starting off with luciferase,thereby determining first, optimalPEI/DNA ratios, and then kinetics anddose-response curves can be established(Figure 1). Such experiments will alsoreveal the inherent variability of transferefficiency in the target examined and deter-mine the need or not for normalization inexperiments involving promoter regulationwith luciferase.
However, it remains that β-gal is one ofthe best markers for following spatialaspects of expression. Green fluorescentprotein (GFP) is equally sensitive, but thefluorescent imaging, although estheticallypleasing, is not as satisfactory as standardlight microscopy for anatomical detail. Forthis reason, we provide the methodologyfor β-gal revelation in whole brains. Indeed,histochemical analysis of β-gal expressionon whole brains allows for rapid assessmentof transfer efficiency and transgene distrib-ution in small sized samples (newborn
mouse brains or regions of adult brains).We also provide a methodology for reveal-ing β-gal expression on histological sec-tions, a step that obviously permits moreprecise anatomical analysis, which is ofcourse essential for determining brainregions and morphology of transfected neu-rons and glial cells. Further, it is on suchsections (prepared by vibratome or cryostatsectioning) that double labeling byimmunocytochemistry can be performed toidentify the cells expressing the transgenes.For instance, to identify neurons, one canuse a neurofilament (NF) antibody or aNeuN antibody, and to identify astrocytes,an antibody against glial acid fibrillary pro-tein (GFAP) can be employed. Above all,one must remember that if one obtains justa few cells labeled with β-gal (a very insen-sitive method when dealing with transientexpression in vivo), this level of efficiencywill be more than sufficient to allow one toproceed with either promoter analysis usingluciferase or to study the biological effectsof a given gene of interest. Finally, we alsosuggest a very sensitive immunoautoradi-ographic method for measuring variation inexpression of genes of interest at low levels.Readers should refer to Chapters 3, 5, and6 of this book for descriptions of othertransfection procedures.
PROTOCOLS
Protocol for PEI Preparation
Materials and Reagents
• Branched 25 kDa PEI (Sigma, St.Quentin Fallavier, France) in anhy-drous form.
• Linear (0.1 M ) 22 kDa PEI (Euro-medex, Souffleweyersheim, France).
Both preparations should be stored at4°C having adjusted the pH to ≤4.0.
39
4. Polyethylenimine: A Versatile Cationic Polymer
Merighi4-aucorr.qxd 5/23/02 5:23 PM Page 39

Procedure
The stock solution (0.1 M) of PEI pro-vided by Euromedex (22 kDa) is used assupplied. The 25 kDa obtained is preparedas follows: weigh 4.5 mg of the solution,mix with 800 µL of sterile water thus ob-taining a 0.1 M solution. Adjust the pH to≤4.0 with 0.1 N HCl and the volume to 1mL. Solutions are kept as aliquots at 4°C orat -20°C for long term storage (>1 month).
Protocol for Plasmid Preparation
Materials and Reagents
• For setting up in vivo gene transferwith PEI, one can use commerciallyavailable plasmids [e.g., p cytomegalo-virus (CMV)-luciferase from Promega;pCMV(nls)-Lac-Z from CLON-TECH (Montigny-le-Bretonneux,France)]. For CAT, the most efficient
40
B.A. Demeneix et al.
Figure 1. Flow chart for optimizing PEI-based gene delivery into the intact CNS.We recommend setting up this methodwith a luciferase reporter gene under aCMV promoter.
Merighi4-aucorr.qxd 5/23/02 5:23 PM Page 40

construct we have tested is pcis-CMV-CAT provided by R. Debs and co-workers (13).
• Endotoxin-free plasmid DNA.• Appropriate restriction enzymes for
verifying plasmids. • Agarose gels [0.8% in 1× Tris-acetate
EDTA (TAE) or Tris-borate EDTA(TBE), see Reference 10].
• Spectrophotometer for measurementsof DNA concentrations (OD260) andpurity of DNA (OD260/OD280 >1.8).
Procedure
1. For plasmid DNA preparation andpurification we recommend use of Jet-star columns (GENOMED, Raleigh,NC, USA). The system is based onanion exchange columns. According tothe manufacturer’s instructions andsolutions supplied, bacteria resultingfrom maxiculture are lysed by alcali.Large membrane debris are eliminatedusing potassium acetate and centrifuga-tion. The resulting supernatant isloaded on columns, and DNA is elutedwith a solution containing approxi-mately 2 M NaCl, then centrifugedafter isopropanol precipitation. The pel-let is washed with ethanol 70% (-20°C)and resuspended in water or Tris-EDTA(TE) at high DNA concentration (≥0.5µg/µL in TE). This is to ensure thatwhen diluting DNA to its working con-centration (≤0.5 µg/µL in 5% glucose),the final TE concentration is not greaterthan 1 mM Tris/0.1 mM EDTA (stan-dard TE/10). These plasmid prepara-tions are endotoxin free.
2. One microliter of each DNA prepara-tion is diluted in 1 mL of sterile waterand analyzed at 260 and 280 nm.According to Sambrook et al. (10), 1 UOD260 correspond to 50 µg/mL ofdouble-stranded DNA.
3. Agarose gel electrophoresis is used toverify that the plasmid DNA is notdenatured, is free of RNA, and is main-ly supercoiled. Restriction map analysiscan be used to check constructions atthis point. To this end, native anddigested plasmids are analyzed using0.8% agarose gel electrophoresis inTAE, with bromophenol-blue and aDNA molecular weight marker (10).The gel is observed on a UV transillu-minator (312 nm) and photographedwith a Sony video equipment fromOSI (Maurepas, France).
Protocol for Condensation of DNA withPEI and Analysis
Materials and Reagents
• Filtered (0.22 µm) 5% glucose solu-tion.
• Autoclaved 0.9% NaCl solution.• DNA resuspended in water at a final
concentration of <0.5 µg/µL.• PEI solutions diluted extremporane-
ously to 10 mM.• Sterile polypropylene tubes (1.5 mL).• Vortex mixer.• Electrophoresis equipment for check-
ing complexation (not required eachtime, only for the first round of exper-iments).
Procedure
1. Plasmid DNA is diluted in sterile (0.22µm filtered) 5% glucose to the chosenconcentration (usually 0.5–2 µg/µL).After vortex mixing, the appropriateamount of a 0.1 M PEI solution isadded, and the solution is vortex mixedagain. The required amount of PEI,according to DNA concentration andnumber of equivalents needed, is calcu-lated by taking into account that 1 µg
41
4. Polyethylenimine: A Versatile Cationic Polymer
Merighi4-aucorr.qxd 5/23/02 5:23 PM Page 41

DNA is 3 nmol of phosphate, and that1 µL of 0.1 M PEI is 100 nmol ofamine nitrogen. So to complex 10 µgof DNA (30 nmol phosphate) withN/P (PEI amine/DNA phosphate)ratio of 5 eq PEI, one needs 150 nmolof PEI (1.5 µL of a 0.1 M solution). Tominimize pipetting errors, it is best todilute PEI down to 50 or 10 mM, butthis should be done extemporaneously. Dilute DNA to 10 µg (final concentra-tion 0.5 µg/µL) in 20 µL of final 5%glucose. Add the necessary volume ofPEI to form the desired N/P ratio and,water to a final volume of 20 µL.
2. When using a plasmid preparation forthe first time, we recommend analysisof complexes by agarose gel elec-trophoresis (Figure 2) and comparingtheir migration to that of naked DNA(plasmid alone, N/P ratio = 0) afteradding 1 to 2 µL of bromophenol blue.This gives a gel retardation profile inwhich DNA/PEI complexes formed atN/P <1 migrate similarly to naked
DNA. At N/P >6, complexes are sopositively charged that they migrate tothe negative pole.
Protocol for Microinjections and Animal Care
Materials and Reagents
• Animals: adult and newborn OF-1mice or Sprague-Dawley rats, both sup-plied by Iffa Credo (L’Arbresle, France).
• Stereotaxic apparatus from DavidKopf, Phymed, Paris, France. Stereo-taxic coordinates for mice are deter-mined according to Lehmann (8).
• Micromanipulator (Narishige; OSI)and microcapillaries (ext ø 1 mm;OSI). Capillaries are pulled to ext ø of10 to 15 µm.
• Capillary puller (Narishige).• Hamilton syringe (10 µL) with a 21
gauge needle (ext ø of 460 µm; OSI).• Ice to anesthetize newborn mice (10
min on ice).
42
B.A. Demeneix et al.
Figure 2. Verification of DNA compaction by linear 22 kDa and branched 25 kDa PEI. A pCMV-luc construct (1 µg) wasmixed with PEI at various charge ratios, and DNA/PEI complexes were electrophoresed in 0.8% agarose gel stained with ethidi-um bromide. The position of the wells and the direction of the electrophoretic migration are indicated on the right.
Merighi4-aucorr.qxd 5/23/02 5:23 PM Page 42

• Sodium pentobarbital (Sanofi, Paris,France) diluted to 10% to anesthetizeadult animals (70 mg/kg weight, i.p.).
• Recovery chamber. Animals should bekept under an infrared lamp or a spe-cially constructed heated cage untilfully recovered from anesthesia andsurgery.
Procedure
1. Obviously, all the procedures describedherein that involve animals and theircare must be conducted in conformitywith appropriate institutional guide-lines that are in accordance withnational and international laws andpolices.
2. Adult (1–2 month old) mice are anes-thetized using sodium pentobarbitaldiluted to 10% in 0.9% NaCl. Ani-mals are anesthetized by an i.p. injec-tion (70 mg/kg). Adult mice or rats areplaced in the stereotaxic apparatus. Anincision is made to expose the cranialskull and a hole made with a 21 gaugeneedle at chosen stereotaxic coordi-nates. Between 0.5 and up to 5 µL ofcomplexes in 5% glucose are injectedslowly (<5 min) with a Hamiltonsyringe adapted on a stereotaxic appa-ratus, small volumes are used forintrathecal injection and larger vol-umes for intraventricular injection.The needle is left in place for 5 minutespostinjection, to limit backflow fromthe injection site.
3. Newborn mice are anesthetized byhypothermia on ice, and 1 µL of com-plexes are injected with a microcapillaryadapted on a micromanipulator. Thehead of the anesthetized pup is heldmanually for direct microinjection.Again, injections should be as slow aspossible, and the capillary left in placefor at least a minute to limit backflow.
4. Animals are left in a recovery chamberuntil active. When optimizing PEIdelivery, newborns are returned to thedam for 24 hours before sacrifice, andadults are kept for 72 hours before sac-rifice, as expression is usually maximalat these time points.
Protocol for Following LuciferaseActivity in Brain Homogenates
Materials and Reagents
• Microdissection tools for dissectingout brain areas.
• Ultra-Turrax (OSI) equipped with asmall plunger to homogenize tissuesamples directly in a polyethylene tube.
• Refrigerated bench-top centrifuge forEppendorf tubes to pellet cell debrisafter homogenization so as to recuper-ate supernatant for luciferase assay.
• Luciferase assay kit from Promega.This system is based on the oxidationof luciferin by luciferase, in the pres-ence of ATP and O2, with photonproduction.
• Luminometer (model ILA-911;Tropix, Bedford, MA, USA) to quanti-fy light emitted.
Procedure
To quantify luciferase expression, ani-mals are sacrificed by decapitation afteranesthesia. The dissected brains are separat-ed in hemispheres and homogenized usingan Ultra-Turrax, in 2-mL Eppendorf tubescontaining 200 µL (for the newborn) or500 µL (for the adults) of luciferase lysisbuffer. Homogenates are centrifuged, and20 µL of each supernatant with 100 µL ofluciferase assay substrate are vortex mixed.The light emitted is quantified in relativelight units (RLUs) using a luminometer.
43
4. Polyethylenimine: A Versatile Cationic Polymer
Merighi4-aucorr.qxd 5/23/02 5:23 PM Page 43

Protocols for ββ-Galactosidase Revelation
Materials and Reagents
• 5-Bromo-4-chloro-3-indolyl-β-D-galactopyranoside (X-gal) (Eurogen-tec, Seraing, Belgium) sold in powderform. Both the powder and stock solu-tion (40 mg/mL) prepared in dimethylsulfoxide (DMSO; Sigma) must bekept at -20°C.
• Phosphate-buffered saline (PBS) 0.1M.
• EGTA.• Paraformaldehyde (PFA; Sigma). Pre-
pare a stock solution of 20% in PBSand store at -20°C.
• MgCl2 (1 M).• Tween20 (Sigma).• Heparin (10 U/L in 0.9% NaCl) for
perfusion.• Peristaltic pump (Polylabo, Stras-
bourg, France) for perfusion of ani-mals and fixation of tissues by perfu-sion.
• Vibratome (Leica, Rueil-Malmaison,France) to section the tissues (20–40µm thickness).
• DMSO to make stock solutions of X-gal.
• Small paint brush to transfer tissuesections from one solution to another.Obtain from any art equipment sup-plier.
• 25-mL sterile plastic vials to collectsections.
• Potassium ferricyanide and potassiumferrocyanide (Sigma): prepare 0.2 Mstock solutions of each.
• Alcohol series for dehydration (baths:70%, 95%, and 100% of ethanol).
• Xylene, benzyl benzoate, and benzylalcohol (all from Sigma) for delipida-tion of whole newborn brains and forsmall blocks of tissue from adult brains.
• Appropriate sized coverslips and glyc-erol (glycerol/PBS, 1/3 vol/vol) formounting slides.
• Plastic gloves. Benzyl benzoate andbenzyl alcohol are irritants.
• Glassware for delipidation solutions.• Microscope equipped with activation
and emission filters for fluorescein.
Procedure
β-gal can be revealed by several means:1. Histochemical X-gal revelation, whe-
ther on sections or carried out in toto,requires intracardial perfusion of theanesthetized animals using a peristalticpump. First, tissues are fixed by perfus-ing 2% PFA (in PBS), then fixation iscontinued by leaving tissues blocksovernight in the same solution. Tissuesare then vibratome sectioned, and sec-tions are incubated in a 0.4 mg/mL X-gal solution for 2 to 4 hours (30°C). Itis important to precede the fixation byperfusion with saline containing 10 Uof heparin to help remove blood andblood cells from the vessels. The fixa-tive (2% PFA) can contain EGTA 1.25mM and MgCl2 2 mM, whichimproves the X-gal reaction. To makethe reaction mixture, the stock solutionof X-gal (40 mg/mL in DMSO) isdiluted to 0.8 to 1 mg/mL PBS con-taining: 0.1% Tween 20, 4 mM potas-sium ferricyanide, 4 mM potassiumferrocyanide, and 2 mM MgCl2.
2. Immunocytochemical revelation alsorequires fixed vibratome sectionsmounted on cromallun–gelatin-coatedslides. Polyclonal anti-β-gal monoclonalanti-GFAP and monoclonal anti-NeuNantibodies are used in our experiments.Monoclonal as well as polyclonal anti-bodies can be labeled using appropriatelabeling kits from Amersham PharmaciaBiotech (Piscataway, NJ, USA). We used
44
B.A. Demeneix et al.
Merighi4-aucorr.qxd 5/23/02 5:23 PM Page 44

Cy3.5 (Fluorolinf-ab) according tothe manufacturer’s instructions to labelmonoclonal antibodies. Primary anti-bodies are diluted to the concentrationsrecommended by each manufacturer inPBS 0.1 M (containing gelatin 0.2%,TritonX-100 0.3%, 3% normal goatserum). Anti-β-gal is revealed using flu-orescein coupled antirabbit antibody.Sections are protected from light toavoid fading of the fluorescence andmounted with glycerol/PBS (1/3vol/vol) or Vectashield and examinedunder a fluorescence microscope.
Luciferase antibodies can also be usedto follow transgene expression in adouble labeling protocol. However,there are currently some problems withobtaining good luciferase antibodiesfor in vivo work (see Discussion).
3. Fluorescein digalactoside (FDG) isanother substrate for β-gal. Hydrolysisof FDG by β-gal results in the libera-tion of both a monogalactoside andfluorescein. This second product is eas-ily detectable and theoretically makesthis method very sensitive. Its mainlimitation for us is that it is not suitablefor fixed tissues, so it is difficult toobtain good morphology in brainpreparations. Moreover, on unfixed tis-sue, as cells die, the fluorescein productdiffuses out. Thus, the revelation pro-cedure must be very fast. Also, it is notpossible to perform double staining toidentify cell types. So this method,which has the theoretical advantage ofhigher sensitivity than X-gal, is in factrather limited for in vivo studies.
4. In toto X-gal revelation require intracar-dial perfusion of the anesthetized ani-mals using a peristaltic pump. Fixationand postfixation are performed as forvibratome sections, but organs are treat-ed as whole mounts. Incubate tissues ina 0.4 mg/mL X-gal solution for 2 to 4
hours (30°C), rinse in 0.1 M PBS (2 × 5min) and transfer in series of ethyl alco-hol under mild agitation: 70% (2 × 2h), 95% (overnight and another bath of1 h), 100% (2 × 2 h). Dehydrationtimes can be adapted depending on thetissue size. To ensure thorough dehydra-tion, one can leave the tissue in the sec-ond 100% alcohol bath overnight. Putdehydrated tissues into xylene (2 × 2 hin glass), then transfer them into benzylbenzoate–benzyl alcohol (2/1 vol/vol) ina glass container until clarification.
Note: Use gloves and glass containers atall steps involving benzyl benzoate andbenzyl alcohol. These agents are irritantsand also dissolve plastic.
Protocol for CAT Assay
Materials and Reagents
• [14C]chloramphenicol (57 mCi/mmol;Amersham Pharmacia Biotech).Aliquots stored at -20°C.
• Butyryl-CoA 10 mM (100 mg; Cat.No. B1508; Sigma). Aliquots stored at-80°C.
• Tris-HCl buffer 250 mM, pH 7.5.• 2,6,10,14-tetramethylpentade-
cane/xylene (2:1, TMPD; Sigma).• Miniature polybrene vials for scintilla-
tion counter (Packard, Meriden, CT,USA).
Procedure
We use CAT activity to normalize forluciferase expression when the site of injec-tion produces mean values with intra- andinterassay variability of more than 15%. Insuch conditions, it is difficult to obtain sta-tistically valid results without normalizingfor transfection efficiency with a constitu-itively active construct (e.g., CMV-CAT).
1. Before using a co-injected ubiquitously
45
4. Polyethylenimine: A Versatile Cationic Polymer
Merighi4-aucorr.qxd 5/23/02 5:23 PM Page 45

expressed gene (CMV-CAT ) to normal-ize for expression from a physiologicallyregulated transgene, it is appropriate tovalidate this approach by quantifyingthe correlation between the expressionof two constituitively expressed genesco-injected into the same brain area. Forthis, two plasmids (0.35 µg pCMV-lucand 0.15 µg pCMV-CAT in 2 µL 5%glucose) are complexed with PEI 22kDa (4 eq) and co-injected into brainarea targeted. After 18 hours, mice areanesthetized, decapitated, and brainsremoved for luciferase and CAT assays.
2. For CAT assay, transfer a 50-µL super-natant aliquot to a 1.5-mL polypropy-lene tube, keep the tube on ice beforeadding 40 µL of 0.25 M Tris-HClbuffer (pH 7.5). Start reaction by add-ing 10 µL of mix solution of butyryl-CoA (0.53 mM; Sigma) and [14C]chloramphenicol (0.01 mM, 1.85 kBqper tube; Amersham Pharmacia Bio-tech). After 3 to 5 seconds of vortexmixing, incubate for 1 hour at 37°C.Then, stop the reaction by adding 200µL of TMPD/xylene solution (2:1).Vortex mix for 20 seconds and placetube on ice. To separate products, cen-trifuge for 5 minutes at 4°C (11 000×g), remove 150 µL of supernatant, andquantify products in a scintillationcounter (Amersham PharmaciaBiotech, Piscataway, NJ, USA).
3. Assay luciferase on other sample ofsupernatant (see above).
4. Plot luciferase against CAT values fromthe same sample. Correlation should besignificant.
Protocol for Immunoradiography
Materials and Reagents
• Appropriate primary polyclonal anti-body raised in rabbit against gene ofinterest.
• Cryostat (Leica).• Cryostat sections (15–20 µm thick)
cut at -20°C.• Cromallun–gelatin-coated slides (see
above).• Dessicator.• PFA (see above).• PBS.• BSA.• Normal goat serum (Sigma).• Donkey antirabbit [35S]IgG (200–
2000 Ci/mmol, 100 µCi/mL; Amer-sham Pharmacia Biotech).
• β max films (Amersham PharmaciaBiotech).
• Computerized image analysis system(Biocom, Les Ulis, France).
Procedure
This protocol is adapted from Refer-ence 4. 1. The cryostat sections are dessicated at
4°C and frozen at -80°C until used.After a 3-minute fixation (4% para-formaldehyde in PBS) at 4°C sectionsare preincubated for 1 hour in PBS sup-plemented with 3% BSA and 1% goatserum, then incubated overnight in anappropriate concentration of polyclonalprimary antibody raised in rabbit.
2. After extensive washes in PBS, sectionsare incubated for 2 hours at room tem-perature in donkey antirabbit [35S]IgG.
3. After abundant washing, sections areair-dried and apposed to β max film for1 to 2 days.
4. Optical density is measured by com-puterized image analysis.
RESULTS AND DISCUSSION
Choice of PEI
A number of PEIs with different mean
46
B.A. Demeneix et al.
Merighi4-aucorr.qxd 5/23/02 5:23 PM Page 46

molecular weights are available commercial-ly. For example, preparations of branchedPEI synthetized to different degrees of poly-merization are available (800, 50, or 25kDa). Preparations of very low molecularweight (0.7 and 2 kDa) are also availablefrom Sigma, but do not complex DNA effi-ciently. We have found that the branched25 kDa and linear 22 kDa (Euromedex)polymers work best in the CNS (1,6).
It is most important to note that whenusing either the 22 or 25 kDa preparationsto deliver oligonucleotides, one should onlyuse phosphodiesters and not phosphoroth-ioates. We have found (as has E. SaisonBehmoaras, CNRS/MNHN, Paris) thatcomplexes of PEI and phosphorothioatesare of lower efficiency than PEI/phospho-diesters complexes in vitro and in vivo.
Choice of Plasmid DNA Preparation Kit
Even though our own (unpublished)results show that the presence of smallamounts (≤1 endotoxin units [EU] endo-toxin/µg DNA) of endotoxins (also referredto as lipopolysaccarides [LPS]) have nodeleterious effects on short term (<4 days)expression in the CNS, we have no data onthe possible effects of their presence in thelonger term. For this reason, we always useendotoxin-free plasmid preparations. Werecommend Jetstar columns. The resultingDNA has ≤0.1 EU endotoxins/µg DNA.This value is not statistically different fromthe values we find in plasmids preparedwith Endotoxin-free columns (Qiagen,Valencia, CA, USA).
If other methods of plasmid preparationare used, we recommend measurement ofendotoxin content by Limulus AmebocyteLysate Assay (LAL; or Coatest Endotox-in) manufactured by Charles River Endo-safe (Charleston, SC, USA) and distributedin Europe by Chromogenix (Mölndal,Sweden). If values are ≥4 EU/µg DNA,then endotoxins should be removed by
chromatography through Affi-prepPolymysin Matrix (Bio-Rad Laboratories,Hercules, CA, USA) according to the man-ufacturer’s instructions and endotoxin con-tent reverified. After chromatography, val-ues should be ≤0.05 EU/µg DNA.
Optimal PEI/DNA Ratios
We have found that the optimal ratio ofPEI amine/DNA phosphate (N/P ratio)providing the best level of gene expressioncan vary according to species (and perhapscan also vary according to site of injection).In the mouse and Xenopus tadpole brains,we have consistently found the N/P ratioof 6 provides the best transfection condi-tions. In contrast, when injecting PEI/DNA complexes into the adult rat substan-tia nigra, we found that the optimal ratiowas 3 (9). In this light, it is important tonote that increasing the N/P ratio from 2to 6 not only increases the overall charge ofcomplexes but also decreases complex size,complexes excluding ethidium bromide(BET), and becoming less visible in the gel.This greater condensation has been con-firmed by zeta-sizing (6). Condensation ofDNA can be followed by use of BET andelectrophoresis (Figure 2), but the optimalN/P ratio can only be ascertained bytransfection.
Optimization of Amounts of DNA to be Used
We have found in a number of in vivosystems that lower amounts of DNA givebetter yields and more faithful physiologi-cal regulation than larger amounts. Forinstance, in a number of promoter studiesin the mouse CNS, we use no more than100 ng of expression vectors coding for thedifferent transcription factors to be tested.Optimization of yield can be carried out byvarying the amounts of DNA used eitherin a constant volume (and varying concen-
47
4. Polyethylenimine: A Versatile Cationic Polymer
Merighi4-aucorr.qxd 5/23/02 5:23 PM Page 47

tration) or by using a constant DNA con-centration (and varying the volume). Wehave found in the newborn mouse brainthat whichever method is used the optimalyield is around 100 ng per injection site(Figure 3). It is interesting to note also thatvery low amounts of DNA (20 ng) givemeasurable amounts of luciferase, anobservation that is difficult to obtain inculture conditions.
Choice of Reporter Gene and DetectionMethod
When assessing efficiency of gene trans-fer, one must take into account the sensi-tivity of the method used. Histochemicalβ-gal assay with X-gal is rather insensitivebut can give quite satisfactory results in
some situations. We find that it givesroughly the same image of transgene distri-bution and number of cells labeled to anequivalent amount of GFP plasmid. It hasbeen estimated that revealing a good GFPsignal requires 105 to 106 molecules percell to show up over background (14). Forthis reason, we have also tried immunocy-tochemistry with a polyclonal antibodyagainst β-gal (Cappel [ICN, Orsay,France]) or against GFP (CLONTECH)(Figure 4), but this method is generally nomore sensitive than histochemistry. How-ever, it is important to note that one canobtain very good, and statistically signifi-cant, modulation of endogenous proteinswith PEI-based gene transfer in systemswhere transferring an equivalent amount ofβ-gal reveals no apparent production of
48
B.A. Demeneix et al.
Figure 3. Reducing the amounts of DNA introduced improves reporter gene yield. Optimization of yield (RLU luciferase/µgDNA used) was carried our by varying amounts of DNA used either in a constant volume (2 µL) and varying concentration(striped bars) or by using a constant DNA concentration (500 ng/µL) and varying the final injection volume (black bars).Whichever method is used, the optimal yield is around 100 ng per injection site in this model (newborn mouse brain).
Merighi4-aucorr.qxd 5/23/02 5:23 PM Page 48

protein. This was the case for a recent seriesof experiments where we transfected plas-mids expressing either sense or antisensesequences of the dopamine transporter(DAT) into the rat substantia nigra (9). Intransfection conditions where no β-galactivity could be revealed (0.5 µg CMV-β-gal in 1 µL 5% glucose), use of plasmidencoding DAT significantly increasedDAT content. This was shown by immu-noautoradiography and by biological mea-surements of dopamine uptake (9). For thisreason, we particularly recommend immu-noautoradiography for following low levelsof expression of genes of interest against
which good antibodies have been raised.Although luciferase is an excellent
reporter gene for kinetic and quantitativestudies, the lack of good antibodies againstit, limits its use for precise examination ofspatial aspects of gene expression. To ourknowledge, the only reasonable luciferaseantibody currently available is that fromCortex Biochem (San Leandro, CA, USA)distributed in Europe by Europa ResearchProducts, Ely, UK. We have obtained vari-able results with this polyclonal antibodyaccording to batch number. Promega com-mercialized a polyclonal antifireflyluciferase up until the end of 1997, but it
49
4. Polyethylenimine: A Versatile Cationic Polymer
Figure 4. Use of immunocytochemistry to reveal expression of GFP reporter gene in newborn mouse brains. Vibratome sec-tions were prepared and exposed to a rabbit polyclonal (CLONTECH) antibody against GFP. The second antibody was anantirabbit antibody linked to alkaline phosphatase (CLONTECH).
Merighi4-aucorr.qxd 5/23/02 5:23 PM Page 49

has been withdrawn from circulation dueto problems of titer. However, we havebeen able to obtain reasonable results withsome batch numbers. Santa Cruz Biotech-nology (Santa Cruz, CA, USA) also pro-duces a luciferase antibody, but we havenot yet tested this antibody on sectionfrom brains transfected in vivo.
Using PEI-Based Gene Transfer toFollow Promoter Regulation in DefinedAreas of the CNS
A major topic of discussion in the field atthe moment is whether faithful physiologi-cal regulation can be obtained by transienttransfection (whether in vitro or in vivo)
50
B.A. Demeneix et al.
Figure 5. PEI-based gene transfer is apowerful method for carrying out analy-sis of promoter regulation in vivo.Example of thyroid hormone-dependentdown regulation of TRH promoter activ-ity in the hypothalamus of newbornmice. (A) TRH-luc is regulated in a phys-iologically faithful manner being signifi-cantly repressed in the presence of T3(controls, ct; left hand columns). Tran-scriptional regulation is isoform specific:overexpression of TRβ allows for T3-dependent transcription (middle col-umns), whereas overexpression of TRαabrogates T3-dependent transcriptionand increases basal expression 5-fold(right hand columns). (B) TR isoformeffects on TRH-luc expression are playedout down the hypothalamo–hypo-physeal–thyroid axis. Overexpression ofan empty (ct) plasmid or a plasmidexpressing TRβ does not affect basal lev-els of circulating thyroid hormone (T4),whereas expression of TRα increases T4secretion 5-fold. Note that effects of TRisoforms on TRH-luc transcription andT4 secretion are equivalent. T4 levelswere measured by radioimmunoassay.
Merighi4-aucorr.qxd 5/23/02 5:23 PM Page 50

using plasmid-based delivery. This is be-cause with plasmid vectors, as with adenovi-ral vectors, transcription results from episo-mally-located sequences. This contrasts withthe situation where one follows transcrip-tion from integrated sequences, as is the casewith retroviruses or adenoassociated viruses,or with stably transfected cell lines whateverthe method initially chosen for gene deliv-ery. However, we have found that, despitethe lack of integration into the genome, weobtain remarkably tight physiologically ap-propriate regulation of cell-specific promot-ers in vivo. A particularly illustrative exam-ple is that of thyrotropin releasing hormone(TRH) promoter regulation in the hypo-thalamus. We have microinjected complexescontaining 1 µg of construct containing 900bp of the rat TRH promoter upstream ofthe luciferase coding sequence, complexedwith 22 kDa PEI into the hypothalamus ofnewborn mice in different thyroid states. Inhypothyroid animals, transcription is twicethat in normal euthyroid animals, and inhyperthyroid animals, transcription isreduced to half that of the normal group(7). This transcriptional regulation faithfullyreflects the negative feedback effect of circu-lating thyroid hormone on hypothalamicTRH production (Figure 5A). What ismore, the effects of different thyroid hor-mone receptor isoforms (TRα and TRβ)can be assessed both on TRH-luc transcrip-tion and on endogenous TRH (Figure 5B).In effect, when animals are transfected withan expression vector for TRα, not only isTRH-luc transcription increased 4/5-fold,but the effect is played out down the hypo-thalamo–hypophyseal–thyroid axis, and T4secretion is increased 4/5-fold. We deducefrom this that the effects of the differentTRs on TRH-luc transcription are echoedon endogenous TRH transcription. Anotherexample of physiological regulation of trans-genes introduced by somatic gene transferincludes the Krox-24 gene in the newbornmouse brain (5).
REFERENCES
1.Abdallah, B., A. Hassan, C. Benoist, D. Goula, J.P.Behr, and B.A. Demeneix. 1996. A powerful nonviralvector for in vivo gene transfer into the adult mam-malian brain: polyethylenimine. Hum. Gene Ther.7:1947-1954.
2.Behr, J.P. and B.A Demeneix. 1998. Gene deliverywith polycationic amphiphiles and polymers. Curr.Res. Mol. Ther. 1:5-12.
3.Boussif, O., F. Lezoualc’h, M.A. Zanta, M. Mergny,D. Scherman, B. Demeneix, and J.P. Behr. 1995. Anovel, versatile vector for gene and oligonucleotidetransfer into cells in culture and in vivo: polyethylen-imine. Proc. Natl. Acad. Sci. USA. 92:7297-7303.
4.Gérard, C., M.P. Martres, K. Lefèvre, M.C. Miquel,D. Vergé, L. Lanfumey, E. Doucet, M. Hamon, andS. El Mestikawy. 1997. Immuno-localization of sero-tonin 5-HT6 receptor-like material in the rat centralnervous system. Brain Res. 146:207-219.
5.Ghorbel, M.T., I. Seugnet, N. Hadj-Sahraoui, P. Top-ilko, G. Levi, and B.A. Demeneix. 1998. Thyroid hor-mone effects on Krox-24 transcription in the post-natalmouse brain are developmentally regulated but are notcorrelated with mitosis. Oncogene 18:917-924.
6.Goula, D., J. Remy, P. Erbacher, M. Wasowicz, G.Levi, B. Abdallah, and B. Demeneix. 1998a. Size, dif-fusibility and transfection performance of linearPEI/DNA complexes in the mouse central nervous sys-tem. Gene Ther. 5:712-717
7.Guissouma, H., M.T. Ghorbel, I. Seugnet, T. Ouatas,and B.A. Demeneix. 1998. Physiological regulation ofhypothalamic TRH transcription in vivo is T3 recep-tor isoform-specific. FASEB J. 12:1755-1764.
8.Lehmann, A. 1974. Atlas Stéréotaxique du Cerveau dela Souris. CNRS Editions, Paris.
9.Martres, M.P., B.A. Demeneix, N. Hanoun, M.Hamon, and B. Giros. 1998. Up- and down-expres-sion of dopamine transporter by plasmid DNA transferin the rat brain. Eur. J. Neurosci. 10:3607-3616.
10.Sambrook, J., E.F. Fritsch, and T. Maniatis. 1989. InN. Ford, C. Nolan, and M. Ferguson (Eds.), MolecularCloning: A Laboratory Manual. CSH LaboratoryPress, Cold Spring Harbor, NY.
11.Seed, B. and J.Y. Sheen. 1988. A simple phase extrac-tion assay for chloramphenicol acetyl transferase. Gene67:271-277.
12.Suh, J., H.-J. Paik, and B.K. Hwang. 1994. Ionizationof polyethylenimine and polyallylamine at variouspHs. Bioorg. Chem. 22:318-327.
13.Zhu, N., D. Liggitt, Y. Liu, and R. Debs. 1993. Sys-temic gene expression after intravenous DNA deliveryinto adult mice. Science 261:209-211.
14.Zlokarnik, G., P.A. Negulescu, T.E. Knapp, L. Mere,N. Burres, L. Feng, M. Whitney, K. Roemer, and R.Y.Tsien. 1998. Quantitation of transcription and clonalselection of single living cells with β-lactamase asreporter. Science 279:84-88.
51
4. Polyethylenimine: A Versatile Cationic Polymer
Merighi4-aucorr.qxd 5/23/02 5:23 PM Page 51

This page intentionally left blank

53
OVERVIEW
We describe an approach that may allowto study changes in the γ-aminobutyricacid (GABAA)receptor distribution withdevelopment and pharmacological treat-ments in living neurons. We producedexpression vectors containing chimeras ofthe green fluorescent protein (GFP) linkedto the C terminus of GABAA receptorsα1, γ2, or the δ subunits. Human embry-onic kidney (HEK) 293 cells were success-fully transfected with α1-GFP cDNAstogether with β3 subunit as indicated bythe formation of green fluorescent clustersof receptor subunits that colocalized withimmunospecific staining for the α1 sub-units and by whole-cell recordings ofGABA-activated Cl- currents. Althoughthe current density was lower in these cells,GABA, bicuculline, and ZnCl2 actionswere unaltered. Similarly, transfection withcDNAs encoding for the γ2-GFP chimeratogether with α1β3 subunit cDNAs pro-duced clusters of subunits and GABA-acti-vated chloride currents that were insensi-tive to blockade by ZnCl2 and that werepotentiated by zolpidem. Lastly, δ-GFP
chimeras transfection in HEK cells pro-duced receptor insensitive to the potentia-tion by the neurosteroid THDOC. Wethen successfully transfected primary cul-tures of neocortical and cerebellar neuronswith these GABAA receptor subunits—GFP chimeras. We obtained evidence ofelongated cluster formation in both celltypes that matched well, although notcompletely, endogenous receptor clustersas indicated by β2/3 staining, and also par-tially corresponded to synaptophysinpositive punctae indicating synaptic local-ization of transfected subunits.Electrophysiological recordings fromtransfected neurons indicated that func-tional GABAergic synapses were still main-tained. This approach will allow to followtargeting and distribution of GABAAreceptor clusters in living neurons duringdevelopment in culture and in differentexperimental conditions.
BACKGROUND
Receptor protein dynamics and interac-tions in living cells can been studied with
Cellular and Molecular Methods in Neuroscience ResearchEdited by A. Merighi and G. Carmignoto©2001 Eaton Publishing, Natick, MA
Transfection of GABAA Receptor withGFP-Tagged Subunits in Neurons andHEK 293 Cells
Stefano Vicini, Jin Hong Li, Wei Jian Zhu, Karl Krueger, and Jian Feng WangDepartment of Physiology and Biophysics, Georgetown UniversityMedical School, Washington, DC, USA
5
Merighi5-aucorr.qxd 5/23/02 5:29 PM Page 53

fluorescent microscopy, photobleaching,and resonance energy transfer. It is there-fore essential to be able to identify strongligands or selective antibodies to link tofluorescent probes to allow similar studies.An alternative approach takes advantage ofthe possibility to tag receptor proteins witha fluorescent protein. To this aim, the GFPfrom the jellyfish Aequorea victoria isbeginning to be extensively used for thispurpose. Indeed, GFP-tagged proteins,both in the cytosol and in the plasmamembrane, have been studied recently (SeeReferences 6 and 7 for review). A particu-larly useful application of GFP tagging ofprotein is to study the localization, distri-bution, and dynamics of neurotransmitterreceptors. An essential condition for thisstudy however is that tagging does not alterbinding or functional properties of thereceptor. A GFP-tagged version of the N-methyl-D-aspartate (NMDA) receptorsubunit NR1 (12) has been transfected inmammalian HEK 293 cells and has beendemonstrated to produce functionalNMDA receptors when cotransfected withNR2A subunit. Functional integrity ofGFP-conjugated glycine receptor channelshas been recently reported (8). Similarfindings have been shown for both α andβ adrenergic receptors (2,3,10) and volt-age-gated calcium channels (9).
Ligand gated receptor channels are het-erooligomeric proteins made by multiplesubunit. In particular, GABAA receptorsare pentameric structures that comprise anion channel for chloride ion. These recep-tors, localized in postsynaptic membranesthroughout the central nervous system areresponsible for inhibitory synaptic trans-mission (See Reference 11 for review).Tagging of one of the subunit may allow toobserve the formation of functional recep-tor complexes as demonstrated for NMDAreceptors in HEK cells (12). Indeed,Connor et al. (5) have recently demon-strated the formation of functional GABA
channels tagged with GFP on the surfaceof Xenopus oocytes. These receptors havemaintained both binding and electrophys-iological properties of nontagged recep-tors. Additionally, the level of receptorexpression was unaltered, and both Ec50for GABA and benzodiazepine potentia-tion were also unaffected. Lastly, the inter-action between distinct subunit that givesrise to specific pharmacological propertieswas preserved when GFP-tagged α1 sub-unit is expressed. Calciumphosphate-based transient transfectiontechnique (4) has been classically appliedto transfect eukaryotic expression vectorsin mammalian tumoral cell lines. Recentlyhowever, successful transfection of primaryneuronal culture has been reported,although with a limited efficiency (1,16).Here, we report the successful constructionof cDNAs expressing GABAA receptorsubunits tethered to the GFP protein andits expression and colocalization in pri-mary cultures of cortical and cerebellarneurons.
PROTOCOLS
Materials and Reagents
• Basal Eagle’s medium (LifeTechnologies, Gaithersburg, MD,USA).
• Coverslips were mounted on slidesusing Vectashield (VectorLaboratories, Burlingame, CA, USA)as mounting medium.
• Fluorescein isothiocyanate (FITC)-conjugated goat antimouse (JacksonImmunoResearch Laboratories, WestGrove, PA, USA).
• Gentamycin (Life Technologies).• Glass capillaries (Wiretrol II; DRUM-
MOND Scientific, Broomall, PA,USA).
• Glass coverslips (Fisher Scientific,
54
S. Vicini et al.
Merighi5-aucorr.qxd 5/23/02 5:29 PM Page 54

Pittsburgh, PA, USA).• HEK 293 cells (No. CRL1573;
ATCC, Rockville, MD, USA). • Indocarbocyanine (Cy3) (Jackson
ImmunoResearch Laboratories).• Minimal essential medium (MEM)
(Life Technologies).• MEM with Hanks’ salts (Life
Technologies).• Monoclonal mouse antisynaptophysin
(Roche Molecular Biochemicals,Mannheim, Germany).
• Penicillin (Life Technologies).• Plasmid pGREENLANTERN (Life
Technologies).• Polyclonal rabbit anti-α1 and β2/3
antibodies (CHEMICONInternational, Temecula, CA, USA).
• Poly-L-lysine (Sigma, St. Louis, MO,USA).
• Rabbit IgG antibodies (Jackson Im-munoResearch Laboratories).
• Streptomycin (Life Technologies).• Trypsin (Sigma).• Vector pCDM8 (Invitrogen,
Carlsbad, CA, USA).• Vector pEGFP-N1 (CLONTECH
Laboratories, Palo Alto, CA, USA). • Patch amplifier (Axopatch 1D; Axon
Instruments, Foster City, CA, USA).• 8-pole low-pass Bessel filter
(Frequency Devices, Haverhill, MA,USA).
• Digitization software (Clampex 8;Axon Instruments).
• Analysis software (Origin; MicroCalSoftware, Northampton, MA, USAand Clampfit 8; Axon Instruments).
Procedures
HEK 293 Cell Line
HEK 293 cells were grown in MEM,
supplemented with 10% fetal bovineserum, 100 U/mL penicillin, and 100 U/mL streptomycin, in a 6% CO2 incubator.Exponentially growing cells were dispersedwith trypsin, seeded at 2 × 10⁵ cells/35-mm dish in 1.5 mL of culture medium andplated on 12-mm glass coverslips.
Primary Cultures
Primary cultures of rat cerebellar gran-ule neurons were prepared from 7 days oldSprague Dawley rat cerebella. Corticalneurons from newborn rat pups were pre-pared with similar procedure. Cells weredispersed with trypsin (0.25 µg/mL) andplated at a density of 0.8 to 1 × 10⁶ on 35-mm Nunc dishes coated with poly-L-lysine (10 µg/mL). Cells were cultured inbasal Eagle’s medium supplemented with10% bovine calf serum, 2 mM glutamine,100 µg/mL gentamycin, and maintained at37°C in 6% CO2. Cytosine arabinoside(10 µM) was added to all cultures 18 to 24hours after plating to inhibit glial prolifer-ation. The final concentration of KCl inthe culture medium was adjusted to 25mM.
Construction of Plasmid DNA for GABASubunit with GFP Tags
Rat α1, γ2, and δGABAA receptor sub-unit cDNAs were individually subclonedinto the expression vector pCDM8. Tofuse those cDNAs with GFP, we usedpEGFP-N1 vector that contains multiplecloning sites before the EGFP codingsequence. The GABAA receptor subunitcDNAs was modified via polymerase chainreaction (PCR), and the stop codons werereplaced by suitable cloning site. Then thetarget gene was cloned into pEGFP-N1 sothat it is in frame with the EGFP codingsequences. The α1 subunit was cloned intopEGFP-N1 using HindIII and KpnI sites.The PCR product of γ2 subunit was cut by
55
5. Transfection of GABAA Receptor
Merighi5-aucorr.qxd 5/23/02 5:29 PM Page 55

BamHI and SpeI, and ligated to thepEGFP-N1 cut by NheI and BamHI. Theδ subunit was inserted into EcoRI andBamHI sites of pEGFP-N1.
cDNA Transient Transfection
HEK 293 cells were transfected usingthe calcium phosphate precipitationmethod (4) with various combinations ofsubunit cDNAs. The following plasmidcombinations were mixed: α1:β3:γ2-GFP,α1-GFP:β3:γ2, and α1:β3:δGFP, (1 µgeach construct) and the coprecipitates wereadded to culture dishes containing 1.5 mLMEM for 12 to 16 hours at 37°C under3% CO2. The media was removed, thecells were rinsed twice with culture media,and finally incubated in the same mediafor 24 hours at 37°C under 6% CO2.
Cortical neurons and cerebellar granulecells at 4 days in vitro (DIV) were trans-fected with pEGFP-N1 expression vector,γ2-GFP, and α1-GFP chimera expressionvector using a modified calcium phosphateprecipitation method. Briefly, the culturemedium was replaced and saved. After onetime washing with transfection medium(MEM with Hanks’ salts), 3 µg plasmidswere added to cells of each dish containing1.5 mL transfection medium and thenincubated for 1 hour at room temperaturein cell culture hood. After rinsing 2 timeswith transfection medium, the cells wereput back to saved medium and then weremaintained at 37°C under 6% CO2. Forα1-GFP chimera transfected cortical neu-rons, insulin was added to the medium atthe concentration of 2 µm/mL in neuronsat DIV 13 for 2 hours.
Electrophysiological Studies
Cultured granule cells or isolated HEK293 transfected cells were voltage-clampedat -50 mV in the whole-cell configurationusing the patch clamp technique on the
stage of an inverted microscope at roomtemperature. The recording pipet con-tained (mM) 145 CsCl, 5 MgCl2, 11 eth-ylene glycol bis (β-aminoethlether)-N, N,N′,N′-tetraacetic acid (EGTA), 5 Na-adenosine-5′-triphosphate (ATP), 0.2guanosine-5′-triphosphate (GTP), and 10mM 4-(2-hydroxyethyl)-1-piperazineeth-anesulfonic acid (HEPES) at pH 7.2 withCsOH. Cells were bathed in (mM) 145NaCl, 5 KCl, 2 CaCl2, and 5 HEPES atpH 7.2 with NaOH. Osmolarity wasadjusted to 325 mosm with sucrose. Theculture dish in the recording chamber (<500 µL total volume) was continuouslyperfused (5 mL/min) to prevent accumula-tion of drugs. All drugs dissolved in bathsolution contained, dimethyl sulfoxide(DMSO) at a maximal final concentrationof 0.01%, which failed per se to modifyGABA responses. GABA was applieddirectly by a gravity-fed Y tubing deliverysystem placed within 100 µm of therecorded cell. Bath perfusion for the 2 min-utes preceding coapplication with GABAwas required to observe full potentiation ofGABA responses by flunitrazepam. GABA(0.5 M in water adjusted to pH 4.0 withHCl) was also applied by iontophoresiswith 30-millisecond pulses of positive cur-rent. With GABA iontophoretic currentsin the 25 to 50 nA range, outward currentswere generated in transfected cells in sucha way as to obtain a peak amplitude of 150to 200 pA. Benzodiazepines (BZs) were agift from Hoffman La Roche(Switzerland), DMCM and β-CCM werefrom Ferrosan (Denmark) and Zolpidemwas from Syntelabo (France). All drugswere dissolved in bath solution containingDMSO at a maximal final concentration of0.01%.
Currents were monitored with a patchamplifier (Axopatch 1D), filtered at 1.5kHz (8-pole low-pass Bessel), digitized inan IBM-PC computer with the Clampex 8software for off-line analysis. After normal-
56
S. Vicini et al.
Merighi5-aucorr.qxd 5/23/02 5:29 PM Page 56

ization, fitting of the dose-response rela-tionship was performed using the logisticequation:
% Imax = 100/Imax * 1+(EC50/[GABA]nh)
where Imax is the maximal Cl- current,elicited by GABA, EC50 is the GABAconcentration eliciting the half-maximalresponse, and nh is the Hill coefficient.Results are expressed as mean ± SEM.Origin and Clampfit 8 software were usedfor figure preparation and statistical analy-sis using ANOVA with a P < 0.05 and apaired t-test with P < 0.01. The Bonferronicorrection was applied for multiple groupcomparison.
Antibodies
The monoclonal mouse anti-GAD65antibody was a kind gift from Dr. SamuelRabkin (Georgetown University,Washington, DC).
Immunocytochemistry
Cultured HEK 293 cells and were fixedwith 4% paraformaldehyde, 4% sucrose inphosphate-buffered saline (PBS) for 15minutes at room temperature and perme-abilized with 0.25% Triton X-100 for 3to 5 minutes. Cells were preincubated in10% goat serum for 30 minutes at roomtemperature and then incubated in primaryantibody in PBS containing 5% goat serumovernight at 4°C. The concentrations ofprimary antibodies were: rabbit anti-β2/3subunit (10 µg/mL), rabbit anti-α1 subunit(1:100), and mouse anti-GAD65 (1µg/mL). After washing 3 times in PBS, cellswere incubated with goat antirabbit and/orantimouse (Cy3-conjugated 1:200, FITC-conjugated 1:50) secondary antibodies for 1hour at room temperature. Coverslips werevisualized using a microscope equipped forthe visualization of fluorescence (Vanox,Olympus, Japan). Spectral characteristics of
the excitation–emission filters used were490/530 nm (green fluorescence for FITCand GFP) and 545/610 nm (red fluores-cence for Cy3), respectively. Bleed-throughwas minimal as seen looking at immunos-taining with only single color labeling andby the lack of colocalization of some clustersin double staining experiments. Cells werevisualized through 10×, 40×, and 100×objectives, and images were captured usinga digital camera and transferred to a com-puter workstation. Controls were per-formed by omitting primary antibodies.Only a weak and nonspecific staining wasobserved under these experimental condi-tions.
Receptor cluster colocalization wasquantified over a length of 100 µm in 3dendrites evaluated in each of 5 selectedneurons. Clusters were counted after back-ground subtraction and manual fluores-cent thresholding correspondent to twicethe intensity of the diffuse fluorescence ofthe dendritic shaft (modified fromReference 13).
RESULTS AND DISCUSSION
Transfection of GABAA ReceptorSubunit EGFP Constructs in HEK Cells
Using a commercially available plasmidkit, we made several constructs of GABAAreceptor subunits with the EGFP proteintethered to the C terminus of the receptorsubunit. When cotransfected in mam-malian HEK 293 cells diffuse punctaestaining could be observed throughout theentire cells including the plasma mem-brane in living cells. The nucleus was notstained. In Figure 1 are shown examples ofcells transfected with α1-GFP and β3cDNAs transfection and γ2-GFP withα1β3 cDNAs transfections. Similar distri-bution was observed with δ-GFP subunittransfection (not shown).
57
5. Transfection of GABAA Receptor
Merighi5-aucorr.qxd 5/23/02 5:29 PM Page 57

Immunocytochemical staining with anti-bodies against the α1 subunit of GABAreceptor confirmed that GFP punctae cor-responded to the α1 subunit protein (notshown). Similarly, staining with β2/3 sub-unit selective antibodies (not shown)demonstrated that α1-GFP clustersmatched β3 subunit clusters, indicatingthat the majority of receptors comprisingα1-GFP tandems also contained the β3subunit.
We then performed electrophysiologicalstudies on HEK 293 cells transfected withconstructs of GABAA receptor subunitstethered to the EGFP protein.Applications of increasing GABA concen-trations to voltage-clamped cells elicitedcurrents of increasing peak characterizedby faster desensitization (Figure 2, A andB). Dose-response indicated that the pres-ence of the GFP tether did not alter the
half maximal concentration nor the maxi-mal response recorded from cells transfect-ed with the α1 and β3 cDNAs.
The presence of specific subunit in theGABAA receptor complex determinesselective pharmacological regulation bydistinct pharmacological agents (11). Zinchas been widely used as a selective agent todetermine the presence of the γ2 subunit inthe receptor channel complex (11). Figure2B illustrates that currents elicited byionophoretical application of GABA wereblocked by ZnCl2. Among the distinctpharmacological agents that regulateGABAA receptor, the benzodiazepines andneurosteroids have a better characterizedstructural requirement in term of subunitcomposition (11). In Figure 2C, we illus-trate GABA-activated currents in a HEKcell transfected with α1β3 and γ2-GFPcDNAs. The allosteric modulator
58
S. Vicini et al.
Figure 1. Two examples of living HEK cells transfected with αα1-GFP and ββ3 subunit cDNAs (left panel) and with αα1ββ3 andγγ2-GFP subunit cDNA (right panel). Diffuse punctate staining could be observed throughout the cells including the plasmamembrane. The nucleus was not stained.
Merighi5-aucorr.qxd 5/23/02 5:29 PM Page 58

59
5. Transfection of GABAA Receptor
Figure 2. GABAR-GFP receptors with GFP tethers at the C terminus preserve pharmacological properties. (A) Half maximal concentration and maximum peak of GABA-activated cur-rents from HEK 293 cells expressing GABA receptors with α1-GFP subunit together with β3 and γ2 subunit (a) does not change as compared to cells expressing with α1β3 and γ2 subunits(b). A summary of the results obtained is shown in (c).(B) γ2-GFP tandem preserve sensitivity to ZnCl2 inhibition of GABA currents produced by ionophoretic applications in a HEK celltransfected with α1-GFP/β3 subunit cDNAs. γ2-GFP tandem cotransfected with α1β3 subunit cDNA inhibits ZnCl2 sensitivity. (C) γ2-GFP tandem preserve zolpidem potentiation.Ionophoretic application of GABA produced currents in a HEK cell transfected with α1-GFP/β3/γ2 subunit cDNAs that were potentiated by the imidazopyridine Zolpidem. (D) GABA cur-rent potentiation by neurosteroid THDOC in cells transfected with α1β3 (a) was abolished when δ-GFP cDNA was cotransfected (b). A summary of the results obtained is shown in (c).

Zolpidem potentiated considerably theresponse to ionophoretically appliedGABA, demonstrating that the benzodi-azepine recognition site was not affected bythe GFP tether on the γ2 subunit.Coexpression of δ-GFP tandem stronglyreduced the potentiation by the neuros-teroid THDOC (Figure 2D), as observedwith wild-type δ subunit (18). Theseresults taken together indicate that theexpression of GABAA receptor subunit,modified to include a fluorescent marker attheir C terminus, does not affect the for-mation of functional chloride channels,agonist sensitivity, or allosteric regulationof channel activity.
Transfection of Neurons in PrimaryCulture
Using a modification of the CaPO4 pre-cipitation technique (4), we transfected
primary culture of rat cortical and cerebel-lar neurons. GFP transfected neurons wereobserved as early as 6 hours after transfec-tion. In Figure 3 are shown examples ofcortical neurons expressing GFP proteinand one example of GFP positive cerebel-lar granule neuron where dendrite andaxon are clearly distinguishable. The per-cent success of transfection was highlyvariable in distinct experiments but neverexceeded 0.5% of the neurons. Cellsremained transfected for the reminder ofthe culture lives (up to 4 weeks), but thenumber of fluorescent cells decrease withtime along with the total cell number.Fluorescent intensity of transfected neu-rons was extremely bright and allowed usto distinguish many details of anatomicalfeatures such as axonal branches andgrowth cones and dendritic spines (notshown). Functional properties such asaction potential generation, occurrence of
60
S. Vicini et al.
Figure 3. Transfection of cortical and cerebellar neurons in primary culture with GFPcDNA. Cortical neurons (cx) at 2 distinct DIV are shown with overlapping fluorescenceand differential interference contrast (DIC) optics. Transfection was performed at DIV 4.In the lower panel, a cerebellar granule neuron (cb) is illustrated. The short dendrite andthe long convoluted axon are clearly distinguishable.

spontaneous synaptic currents, and thecapability to produce functional synapseswere not affected as observed in parallelelectrophysiological recordings (notshown). For comparison, GFP expressionwas attempted with viral transfection usinga defective herpes simplex virus vector(courtesy of Dr. S. Rabkin). Virus infec-tion produced GFP expression and label-ing of neuronal cells, but the intensity ofstaining was 100-fold lower than withCaPO4 transfection, and the degree oftoxicity was greatly enhanced.
Transfection of GABAA ReceptorSubunit EGFP Constructs in Neurons
After demonstrating successful transfec-tion of the pEGFP construct in neurons,we attempted to transfect α1-GFP and γ2-GFP constructs. Cells were successfullytransfected with both cDNAs, and the per-cent cell transfected was not considerablydifferent for the distinct plasmids.However, the intensity of fluorescence andthe pattern of protein distribution differedconsiderably. First, with α1-GFP cDNA,the formation of clear punctae of GFP flu-orescence was observed on dendrites andoccasionally on axons of transfected neu-rons (Figure 4). Second, a diffuse and weakfluorescence staining was observedthroughout the cells allowing the identifi-cation of dendritic branches of the trans-fected cell. With γ2-GFP cDNA, weobserved only the diffuse fluorescence, andwe failed to observe clusters similar tothose seen with α1-GFP transfection. It ispossible that for both γ2 and α1 subunittagging with GFP, the C terminus mayalter the subunit assembly allowing releaseof cytoplasmic-free subunit-GFP tandems.It is also possible that cleavage of the GFPportion of the construct produced a con-siderable amount of free GFP. Lastly, dif-fuse staining may correspond to the cyto-plasmic assembly of the receptor that pre-
cedes membrane insertion. Whatevermechanism underlie the diffuse staining, itis clear that with α1-GFP cDNA we alsoobserved clear formation of subunit clus-ters that may indicate the correct assemblyand targeting of labeled GABAA receptorsin living neurons. The reason for the fail-ure of γ2-GFP construct to perform equal-ly well remain to be investigated further.This raises the concerns that differentcDNA constructs may or may not have thecapability for proper processing. Thus, toachieve successful expression, more thanone construct per protein should be made.
Electrophysiological recordings demon-strate the occurrence of spontaneousinhibitory postsynaptic currents (s.i.p.s.cs)in α1-GFP transfected cells (Figure 4B).This indicates that the formation ofinhibitory synapses and the function ofpostsynaptic receptors was unaffected bythe tagging of the α1 subunit.
Once we observed the successful forma-tion of subunit clusters in neurons, wewanted to study the colocalization of α1-subunit constructs and the presence of theβ subunit with selective antibodies. Asillustrated in Figure 5 (top panel), therewas clear matching between α1-GFP clus-ters and the presence of clusters of β2/3subunit, indicating, although not totallyproving, that coassembly of native andtransfected subunits may occur togetherwith appropriate targeting to the dendritesof receptor subunits. The most suggestiveevidence that α1-GFP clusters reveal func-tional GABAA receptor comes from stain-ing of α1-GFP transfected neurons withantibodies against glutamic acid decar-boxylase 65, a marker of GABAergic presy-naptic terminals. As it can be observed inFigure 5B, many α1-GFP clusters werefacing presynaptic GABAergic terminals,suggesting that they are part of postsynap-tic densities at those sites. At the sametime, a few extrasynaptic clusters were alsoidentified consistently with the demon-
61
5. Transfection of GABAA Receptor
Merighi5-aucorr.qxd 5/23/02 5:29 PM Page 61

62
S. Vicini et al.
Figure 4. Transfection of GABAR-GFP in a cortical neuron (cx) and acerebellar granule neuron (cb) of αα1-GFP subunit. (A) Photomicrographswere taken at DIV 8, and transfectionwas performed at DIV 5. GFP fluores-cence clusters were clearly observed ondendrites of both cells. A fainter diffusestaining was also seen throughout thecell, possibly cytoplasmic in origin, thatallowed the observation of anatomicdetails of the dendritic tree. A few clus-ters were observed in thin neuriticbranches, possibly being axons. (B)Whole-cell recording of spontaneousinhibitory synaptic currents from anα1-GFP-transfected neuron. Perfusionwith bicuculline methiodide (10 µM)abolished the outward currents (notshown).

strated evidence for extrasynaptic receptorclusters.
Insulin Treatment
A report demonstrated the relativelyrapid regulation of GABAA receptor sub-unit by insulin (17). To verify that thetransfected constructs expressing α1-GFPsubunit in cortical neurons were capable to
undergo the same regulation as demon-strated by insulin treatments, we incubatedcortical neurons for 1 or 2 hours withinsulin and measured the number of α1-GFP clusters per 100 µm of dendriticlength. As seen in Figure 6, insulin treat-ment produced a time-dependent increaseof fluorescence subunit clusters, indicatingthat the tagging of the subunit proteinwith the fluorescent tether did not affect
63
5. Transfection of GABAA Receptor
Figure 5. Colocalization of GABAR-GFP in cortical neurons with ββ2/3 subunit and GAD 65. In the two top panels α1-GFPclusters in fixed cortical neuron (DIV 10) is compared to Cy3-β2/3 subunit immunostaining. In the lower panels, α1-GFP clustersare compared in another cortical neuron to immunostaining for the selective presynaptic marker of GABAergic terminals GAD 65,shown at higher magnification. In both panels, arrows indicate matching clusters while arrowheads indicate nonmatching clusters.
Merighi5-aucorr.qxd 5/23/02 5:29 PM Page 63

64
S. Vicini et al.
Figure 6. Insulin increases the clusters of αα1-GFP subunit. (A) α1-GFP clusters are compared between a control cortical neurons at DIV 12 and a distinct neuron in the same culture after2 hours of addition to the culture medium of 1 µM insulin. (B) Summary of the results on the number of α1-GFP clusters per 100 µm dendritic length obtained with 2 insulin incubationtimes. * indicates significant difference (independent student t-test, P < 0.05).

regulation of expression.
CONCLUSIONS
As previously demonstrated, taggingGABAA receptor subunit with GFP doesnot alter functional expression and phar-macological properties. In addition, ourdata present evidence that transfection ofGFP-tagged subunits is possible in neocor-tical and cerebellar neurons in primary cul-ture. Clusters of fluorescent proteins thatmatched well with endogenous GABAAreceptor clusters are formed. FunctionalGABAergic synapses are still maintained intransfected neurons that possibly utilizeα1-GFP subunit as seen by correspon-dence with glutamic acid decarboxylase(GAD) positive punctae. Insulin treatmentincreased the expression of α1 clustersindicating that the receptor can undergo asimilar regulation as the native receptor.Our data also highlight possible problemsof transfecting exogenous subunit intoneurons, γ2-GPF transfection did not giverise to clusters and axonal localization maybe an artifact of the transfection proce-dure. However, the results presented hereindicate that if the transfected constructcan form clusters in neurons in culture,assembly targeting and regulation can pro-ceed as for native receptors. This raised thehope that this approach will allow us tofollow the targeting and distribution ofGABAA receptor clusters in living neuronsduring development in culture and in var-ious experimental conditions.Furthermore, the possibility to simultane-ously visualize two GFP variants in livingneurons may allow, in the future, to tagtwo distinct proteins (14) with the goal ofstudying the coassembly and independentregulation of subunit expression. This willbe essential to the understanding of thesignificance of the large heterogeneity ofsubunits for ligand-gated channels, which
constitute postsynaptic receptors in thecentral nervous system (CNS). Indeed,studies on AMPA receptors GFP-taggedhave demonstrated rapid spine deliveryand redistribution after synaptic activation(15).
ACKNOWLEDGMENTS
Supported by National Institute ofNeurological Disorders and Stroke(NINDS) Grant Nos. NS32759 andMH01680.
REFERENCES
1.Ango, F., S. Albani-Torregrossa, C. Joly, D. Robbe, J.-M. Michel, J.-P. Pin, J. Bockaert, and L. Fagni. 1999.A simple method to transfer plasmid DNA into neu-ronal primary cultures: functional expression of themGlu5 receptor in cerebellar granule cellsNeuropharmacology 38:793-803.
2.Awaji, T., A. Hirasawa, M. Kataoka, H. Shinoura, Y.Nakayama, T. Sugawara, S. Izumi, and G.Tsujimoto. 1998. Real-time optical monitoring of lig-and-mediated internalization of α1b-adrenoceptorwith green fluorescent protein. Mol. Endocrinol.12:1099-1111.
3.Barak, L.S., S.S. Ferguson, J. Zhang, C. Martenson,T. Meyer, and M.G. Caron. 1997. Internal traffickingand surface mobility of a functionally intact β2-adren-ergic receptor-green fluorescent protein conjugate.Mol. Pharmacol. 51:177-184.
4.Chen, C. and H. Okayama. 1987. High efficiencytransformation of mammalian cells by plasmid DNA.Mol. Cell Biol. 7:2745-2752.
5.Connor, J.X., A.J. Boileau, and C. Czajkowski. 1998.A GABAA receptor α1 subunit tagged with green flu-orescent protein requires a beta subunit for functionalsurface expression. J. Biol. Chem. 273:28906-28911.
6.Cubitt, A.B., R. Heim, S.R. Adams, A.E. Boyd, L.A.Gross, and R.Y. Tsien. 1995. Understanding, improv-ing and using green fluorescent proteins. TrendsBiochem. Sci. 20:448-455.
7.Cubitt, A.B., L.A. Woollenweber, and R. Heim.1999. Understanding structure-function relationshipsin the Aequorea victoria green fluorescent protein.Methods Cell Biol. 58:19-30.
8.David-Watine, B., S.L. Shorte, S. Fucile, D. de SaintJan, H. Korn, and P. Bregestovski. 1999. Functionalintegrity of green fluorescent protein conjugatedglycine receptor channels. Neuropharmacology38:785-792.
9.Grabner, M., R.T. Dirksen, and K.G. Beam. 1998.Tagging with green fluorescent protein reveals a dis-
65
5. Transfection of GABAA Receptor
Merighi5-aucorr.qxd 5/23/02 5:29 PM Page 65

tinct subcellular distribution of L-type and non-L-typeCa2+ channels expressed in dysgenic myotubes. Proc.Natl. Acad. Sci. USA 17:1903-1908.
10.Hirasawa, A., T. Sugawara, T. Awaji, K. Tsumaya, H.Ito, and G. Tsujimoto. 1997. Subtype-specific differ-ences in subcellular localization of α1-adrenoceptors:chlorethylclonidine preferentially alkylates the accessi-ble cell surface α1-adrenoceptors irrespective of thesubtype. Mol. Pharmacol. 52:764-770.
11.MacDonald, R.L. and R.W. Olsen. 1994. GABAAreceptor channels. Annu. Rev. Neurosci. 17:569-602.
12.Marshall, J., R., Molloy, G.W. Moss, J.R. Howe, andT.E. Hughes. 1995. The jellyfish green fluorescentprotein: a new tool for studying ion channel expressionand function. Neuron 14:211-215.
13.Rao, A. and A.M. Craig. 1997. Activity regulates thesynaptic localization of the NMDA receptor in hip-pocampal Neurons. Neuron 19:801-812.
14.Rongo, C., C.W. Whitfield, A. Rodal, S.K. Kim, andJ.M. Kaplan. 1998. LIN-10 is a shared component of
the polarized protein localization pathways in neuronsand epithelia. Cell 94:751-759.
15.Shi, S.H., Y. Hayashi, R.S. Petralia, S.H. Zaman, R.J.Wenthold, K. Svoboda, and R. Malinow. 1999. Rapidspine delivery and redistribution of AMPA receptorsafter synaptic NMDA receptor activation. Science284:1811-1816.
16.Van den Pol, A.N. and P.K. Ghosh. 1998. Selectiveneuronal expression of green fluorescent protein withcytomegalovirus promoter reveals entire neuronalarbor in transgenic mice. J. Neurosci. 18:10640-10651.
17.Wan, Q., Z.G. Xiong, H.Y. Man, C.A. Ackerley, J.Braunton, W.Y. Lu, L.E. Becker, J.F. MacDonald, andY.T. Wang. 1997. Recruitment of functionalGABA(A) receptors to postsynaptic domains byinsulin. Nature 388:686-690.
18.Zhu, W.J., J.F. Wang, K.E. Krueger, and S. Vicini.1996. δ Subunit inhibits neurosteroid modulation ofGABAA receptors. J. Neurosci. 16:6648-6656.
66
S. Vicini et al.
Merighi5-aucorr.qxd 5/23/02 5:29 PM Page 66

67
OVERVIEW
The ability to transfect differentiatedneurons with DNA constructs of varioussizes has been limited by the relative refrac-toriness of these cells, to classical calciumphosphate-DNA coprecipitation, and lipo-some–carrier-mediated transfection meth-ods. Particle-mediated gene transfer (alsocalled biolistics) represents a relatively sim-ple solution to this problem, requiring lit-tle by the way of special technical expertise.Plasmid DNAs of unlimited sizes are usedto coat approximately one micron tungstenor gold particles, and these particles arethen accelerated into living cells and tissuesby a blast of helium gas. A commercialdevice, referred to as the “Gene Gun”obtained from Bio-Rad, is available for thispurpose. Biolistics has many uses, e.g., theproduction of antibodies after in vivotransfection of foreign DNAs into skin, exvivo transfection of genes into tissues to beused for transplantation, and for the studyof specific gene expression in distinct dif-ferentiated neurons in vitro. Cotransfec-tion of multiple and distinct DNA con-structs into single cells is easily performed,and this makes this technology of special
value for physiological studies of differen-tiated neurons.
BACKGROUND
The technique of particle-mediated genetransfer (also known as biological ballistics,or in its shortened form, biolistics) was firstdeveloped in order to deliver nucleic acidsinto plant cells by the use of particles coat-ed with foreign DNAs which are accelerat-ed at high velocity (12,30,31,38). In thecase of plant cells, the presence of cell wallsmade conventional techniques, such aselectroporation, direct DNA uptake, lipo-some–carriers, calcium phosphate, andmicroinjection techniques ineffective andinefficient. The development of the biolis-tics technique (30,31) permitted the accel-erated 1 to 4 µm tungsten microprojectilesto penetrate the cell walls and plasma mem-branes and to carry the surface-adsorbedforeign DNA into the plant cells’ nucleargenome, ultimately resulting in the genera-tion of stable plant transformants (37).
Over the years, a number of deviceshave been developed to accelerate themicroprojectiles. In the first devices, gun-
Cellular and Molecular Methods in Neuroscience ResearchEdited by A. Merighi and G. Carmignoto
Neuronal Transfection Using Particle-Mediated Gene Transfer
Harold Gainer, Raymond L. Fields, and Shirley B. HouseLaboratory of Neurochemistry, National Institutes of Health, NINDS,Bethesda, MD, USA
6
Merighi6-aucorr.qxd 5/23/02 6:01 PM Page 67
powder was used in a so-called particle gunto generate the pressure to accelerate 4 µmtungsten microprojectiles into the plantcells at 10 to 15 cm distances from the endof the device. Today, the gunpowder hasbeen replaced by a blast of helium gas, andthe tungsten particles by 0.6 to 1.6 µmgold particles, which are now routinelyused for animal cells. Two devices sold byBio-Rad Laboratories (Hercules, CA,USA), the PDS 1000/He Biolistic particledelivery system, an in-chamber model thatrequires a vacuum for transfection, and thenewer Helios Gene Gun System, whichis hand-held and requires no vacuum, aremost commonly used. In the PDS 1000system, the target cells (covered only by athin layer of medium) are placed in achamber that is flushed with helium gasand then evacuated to 25 inches of mer-cury before the gold particles are accelerat-ed into the tissue by a He pressure of about1000 to 1200 psi. The point of thesemaneuvers is to reduce the resistance of theambient air and surface fluid over the tis-sue to the momentum of the gold particle,and thereby enhance penetration of thecoated gold particle into the tissue. Theabove manipulations are obviously undesir-able for the health of the tissue, and in fact,the PDS 1000 system is very inefficientand restricted in its use. In contrast, theHelios Gene Gun System is hand-held inopen space (usually in a tissue culture hoodfor sterility) and in addition to being moreflexible [e.g., it can be easily used in invitro and in vivo experiments (46)], it isfaster, less variable, and more efficient inthe transfection of neurons (unpublishedobservations and Reference 45).
Biolistic techniques have been highlyeffective in transfecting a wide variety oforganisms and cell types (6,15,22,27,46).Among these are cells in invertebrates andlower vertebrates (10,11,13,47), bacteriaand yeast (26,39), and even subcellularorganelles (e.g., for mitochondria genomic
transformation, see References 7, 8, and12). Biolistics has also been prominent inthe development of DNA vaccines, geneticimmunization strategies (3,27,29,35,43),and in experimental approaches to ex vivogene therapy of pancreatic islets (19,20,36). The use of biolistics with pancreaticislets is a particularly interesting case, sincecells in this organ do not replicate, therebyprecluding the use of retroviruses for exvivo gene therapy. Application of aden-oviruses successfully transduces 50% ofislet cells, whereas biolistics only transfects3% of the cells (19). While relatively ineffi-cient when compared to adenovirus trans-duction, biolistics was 35 times more effec-tive than liposomal delivery techniquesand, most important, did not develop theimmune response rejection evoked by theintroduction of adenoviral proteins to thesystem. In fact, despite the relatively lowtransfection efficiency of the biolisticsapproach, transplantation of the transfect-ed islets was able to reverse the diabeticstate of alloxan-induced diabetes in Balb/crecipient mice (19).
Differentiated neurons are not oftenable to be transfected with DNA con-structs by using conventional methods (seealso Chapters 3 through 5 of this book).Viral vectors can be very effective in thisregard (see Results and Discussion), how-ever, as in the case of the islets, lower effi-ciencies may also be adequate in studies onneurons. One of the first uses of biolisticsin the nervous system was done as a test offeasibility of using particle-mediated genetransfer for ex vivo gene transfer into braintissues (25). In this study the authors trans-fected fetal brain with various promoter–luciferase constructs in vitro and foundthat the biolistic method produced 100-fold more gene expression than either calci-um phosphate coprecipitation, electropora-tion, or lipofection methods (25). Thebiolistically transfected tissues were imme-diately transplanted into caudate or intra-
68
H. Gainer et al.
Merighi6-aucorr.qxd 5/23/02 6:01 PM Page 68

cortical regions of adult host rats, andluciferase activity could be detected in thesite of the transplant up to 2 months aftergene transfer. One year after this study waspublished, two other reports, using thePDS 1000 system, described the use of thebiolistic technology on central nervous sys-tem tissue in novel experimental para-digms. Arnold et. al (1) described the useof particle-bombardment transfection incombination with organotypic cultures ofmice cerebellum to study purkinje cell-spe-cific expression of the calbindin D28k geneas well as glial and granule cell-specificexpression of the brain lipid-binding pro-tein gene. Using this strategy, they couldidentify 5′ flanking regions in these genesthat were responsible for this cell type-spe-cific expression in postnatal cerebellum. Loet. al. (32) exploited the low efficiency ofbiolistic transfection using the β-galactosi-dase (Lac-Z) gene in slices of postnatal ratand ferret visual cortex and hippocampusto visualize the Golgi-like 5-bromo-4-chloro-3-indolyl-β-D-galactopyranoside(X-gal) staining of neuronal dendrites,axons, and glial processes. The authors sug-gested that the use of green fluorescentprotein (GFP) reporters in biolistics in thefuture would be very valuable for develop-mental studies of living neurons (23).
Following these pioneering paperswhich illustrated the uses of biolistics totransfect neurons, a wide variety of neuro-biological studies using particle-mediatedgene transfer were reported. These haveincluded identification of a calciumresponsive element regulating expression ofcalcium binding proteins in Purkinje cells(2), studies of neurotrophin regulation incortical dendrites and spines (23,33,34),development in embryonic retina (48), andvarious physiological studies (14,49).Given the versatility of the gene gun, itsaccessibility, and the wide variety of exper-imental purposes to which it can be put, itis likely that biolistic transfection will soon
become a frequently used tool in manyneurobiological studies.
Several technical papers, describingdetailed protocols for successful biolisticshave been published. Particularly valuableto the reader are the early papers from theSanford Laboratory (31,37) discussing thevarious factors that must be considered toget optimal transfection by biolistics.Biewenga et al. (6) discuss the critical para-meters for use of the PDS 1000 Instru-ment, and Wellmann et al. (45) present anoptimized protocol for transfection ofbrain slices and dissociated neurons usingthe hand-held Helios gene gun system. Thetwo papers provide valuable practical tipsand clues for the successful employment ofbiolistics in neuronal systems. In the sec-tions below, we present detailed protocolsfor the tissue culture and biolistic transfec-tion of rat hypothalamic neurons in organ-otypic slice cultures which we have usedwith success (16,24,40). It should be notedhowever, that optimization of the biolisticparameters (particularly the helium airpressure and the distance of the gun fromthe target) must be determined empiricallyfor each new tissue and cell type.
PROTOCOLS
Protocol for Stationary Organotypic SliceExplant Cultures
Materials and Reagents
• McIlwain Tissue Chopper (Brink-mann Instruments, Westbury, NY,USA).
• Tissue culture dishes (150, 100, 60,and 35-mm Falcon; Becton Dicken-son, Bedford, MA, USA).
• Gey’s Balanced Salt Solution (LifeTechnologies, Gaithersburg, MD,USA and Sigma, St. Louis, MO,
69
6. Neuronal Transfection Using Particle-Mediated Gene Transfer
Merighi6-aucorr.qxd 5/23/02 6:01 PM Page 69
USA). • 50% glucose (Sigma).• 70% ethanol.• Breakable blades (Fine Science Tools,
Vancouver, BC, Canada and feath-erblades; Ted Pella, Redding, CA,USA).
• Blade holder (Fine Science Tools andROBOZ Surgical, Rockville, MD,USA).
• Double edge blades. • Surgical supplies (No. 5 forceps, fine
spatulas, large and small scissors;ROBOZ and Fine Science Tools).
• Millipore Millicell-CM filter inserts(Millipore, Bedford, MA, USA).
Culture Medium
To prepare 200 mL, mix together thesereagents from Life Technologies, exceptBME which is from Sigma:
• 100 mL Eagle Basal Medium (BME).• 50 mL horse serum. • 50 mL Hanks Balanced Salt Solution.• 2 mL 50% glucose (vol/vol).• 1 mL L-glutamine (200 mM, 100×). Cover with aluminum foil, medium is
light sensitive.
Procedure to Dissect and Culture RodentHypothalamus
1. Postnatal 5 to 7-day-old rats or 5 to10-day-old mice are washed with 70%ethanol and decapitated. Their brainsare quickly and aseptically removedunder a hood.Lateral cuts are made in the skull start-ing at the foramen magnum and end-ing at the olfactory lobes. The skull isgently lifted up from the rear exposingthe brain. Cuts are then made betweenolfactory lobes and the frontal cortex
and rostral to the cerebellum. The ros-tral part of the brain is gently lifted toexpose the optic nerves, which are thencut prior to removing the brain fromthe skull. Finally the brain is removedand placed into cold Gey's solution ina 60-mm petri dish containing 0.5%glucose.
2. Carefully remove blood vessels andmeninges around hypothalamus andgently straighten out residual opticnerves. These serve as helpful land-marks since the suprachiasmatic nucle-us (SCN) is found at the base of opticchiasm.
3. Block out the hypothalamus using arazor blade in a blade holder. Cut awayall cortex on both sides lateral to thehypothalamus (from a ventral view)and make a clean horizontal cut 2 to 3mm above the third ventricle (coronalview).
4. Place the blocked hypothalamus on thetissue chopper so that the hypothala-mus is ventral side down on the chop-per disk and the optic nerves are abut-ting the chopper blade. Set thethickness of the slices at 350 to 400 µmfor rats and 300 µm for mice.Note: Try to avoid excess fluid onchopper disk as this will cause the tis-sue to be picked up by the blade.
5. Cut the sections as a group, trying tokeep them in order, and lift the groupof sections onto a spatula and placethem into a cold drop of Gey’s solutionplus glucose in a 100-mm petri dish.Carefully separate the slices using asmall spatula and forceps. Note: It is critical for the survival of thetissue to be extremely gentle in thetransferring and manipulating of theslices at this stage and afterwards.
6. Select the sections of interest and trim
70
H. Gainer et al.
Merighi6-aucorr.qxd 5/23/02 6:01 PM Page 70

them free of extraneous tissue using arazor blade scalpel, place them in freshdrops of the Gey's/glucose solution,and allow them to sit at 4°C in a refrig-erator (1–2 h).
7. Put 1.1 mL of culture media into each35-mm petri dish. The 35-mm petridishes are placed inside of a 150-mmpetri dish acting as a container to min-imalize their handling.
8. Place tissue slices to be cultured ontoMillicell-CM filters by using two smallspatulas touching each other and byusing the capillary forces between themto transfer the slices. Make sure the tis-sue rests flat on the filters.
Note: Too much fluid on the filter willprevent tissue from adhering to the filter.If this happens, remove the excess fluid orreplate (even if it is the next day).9. Place the Millicell-CM filters contain-
ing the slices onto the 1.1 mL of cul-ture media in the 35-mm petri dishes,and incubate at 36°C in 5% CO2 for14 to 20 days.
Note: The slices thin to optimal thick-nesses for immunohistochemistry (IHC)and in situ hybridization histochemistryafter incubation for 10 to 20 days. Theslices can survive for 1 to 2 months, butmay thin too much over such long peri-ods for subsequent experimental manipu-lations.
10. Media contains penicillin–strepto-mycin either for the first 3 days in vitro(DIV) or throughout.
11. Media is changed 3 times a week, withfresh media always in a new 35-mmpetri dish in order to maximize thevitality and sterility of the culture.
12. In biolistics protocols, we usually shootthe cultured slices after 4 to 5 DIV,replace the medium, and assay by IHCafter a total of 10 DIV.
Protocols for Immunohistochemistry ofOrganotypic Cultures
Materials and Reagents
• Netwells (Corning Costar, Cambridge,MA, USA).
• Netwell Carriers (Corning Costar).• Phosphate-buffered saline (PBS) (1×).• Normal goat serum (NGS) (Sigma).• ABC Elite kit (Vector Laboratories,
Burlingame, CA, USA).• Rabbit IgG (biotinylated) (Vector Lab-
oratories).• Mouse IgG (biotinylated) (Vector Lab-
oratories).• 3,3′ Diaminobenzidine tetrahy-
drochloride (DAB; Sigma).• Nickel sulfate (Sigma).• Imidazole (Sigma).• Glucose (Sigma).• NH4Cl.• Glucose oxidase (GOD; Calbiochem-
Novabiochem, San Diego, CA, USA).• Permount (Fisher Scientific, Pitts-
burgh, PA, USA).• Formaldehyde.• Tris-buffered saline (TBS) 1×, pH 7.4.• Triton X-100.• Nos. 0 or 1 fine sable paint brush.• Gelatin-coated slides or• Superfrost-plus slides (Fisher Scientific).• Xylene.• 100 % EtOH.• Americlear Histology clearing solvent
(Baxter Healthcare, McGraw Park, IL,USA).
• Coverslips.• Filter paper.
Cryoprotectant Medium
From Watson et. al. (44a).
71
6. Neuronal Transfection Using Particle-Mediated Gene Transfer
Merighi6-aucorr.qxd 5/23/02 6:01 PM Page 71

1.59 g NaH2PO4.H2O (mono)
5.47 g Na2HPO4 (dibasic)9.0 g NaCl300 g Sucrose10 g Polyvinyl pyrrolidone (PVP-40)(Bio-Rad)300 mL Ethylene glycol
Bring to 1 L with distilled water andstore in refrigerator.
Procedure
1. To fix the sections on the filters, 4%formaldehyde/PBS is placed beneathand on top of the slice on the Millicellfilter for 1.5 to 2 hours.
2. The slice cultures are thoroughly butgently rinsed with PBS. If rinsed toohard, it might dislodge and damage thetissue.
3. Use a scalpel blade or scissors to cut outthe filters carrying the slices.
4. Place the filters holding the slices inNetwells into the 6-well plate carrierscontaining PBS (or into cryoprotectantif you are not going to stain tissue rightaway).
Note: It is very important that the sliceson the filters are always fully immersedthroughout this and all following proce-dures.5. Rinse the slices extremely well in PBS
before going into blocking solution.6. Place the slices into blocking solution
(10% NGS, 0.3% Triton X-100,0.01% Na azide) for 1 to 2 hours.
7. Place into primary antibody (diluted in1% egg albumin, 0.01% Na azide) andincubate overnight at 4°C.
8. Rinse well in PBS (3 × 10 min) usingNetwells and carriers.
9. Apply secondary antibody—rabbit ormouse IgG biotinylated (at 1:500 dilu-tion) in PBS at room temperature for1.5 to 2 hours. Do not add sodium
azide to this mixture, as it will interferewith the peroxidase reaction.
10. Rinse well in PBS (3 × 10 min).11. Place slices (in Netwells) in ABC solu-
tion in the ABC kit (1:600 dilution) inthe 6-well plates for 1 to 1.5 hours atroom temperature.
12. Rinse tissues well with 2× PBS andrinse with 2× TBS (if you are usingNiSO4 in DAB reaction mixture).
13. Place sections (in Netwells) into theDAB reaction mixture.
To make DAB reaction mixture:Imidazole 136 mgNH4Cl 40 mgGlucose 400 mgPBS 85 mL orTBS 85 mL (when using with NiSO4)To the above, add 10 mL of filtered DAB(100 mg DAB/20 mL in 1× TBS, pH7.4).Then add 500 µL of glucose oxidase(100 U/mL) to above and mix well.
Important: Allow mixture (with or with-out 70–80 mg NiSO4/100 mL) to sit atleast 10 to 15 minutes before use.14. Gently rock sections (in Netwells) in
DAB reaction mixture (time of reac-tion should be determined empirical-ly).
15. Stop reaction by rinsing thoroughly inPBS (2 × 10 min) or TBS and finallyin fresh PBS.
16. Samples can be stored in PBS nolonger than 2 days.
17. If you are doing double label IHC, dothe NiSO4 step first (this results in ablack reaction product). Then rinsewell in PBS (3 x 10 min) and blockagain for 30 minutes in NGS.
18. Place sections into the second primaryantibody and incubate overnight at4°C.
72
H. Gainer et al.
Merighi6-aucorr.qxd 5/23/02 6:01 PM Page 72

19. Repeat the above steps 8 through 15.The final staining reaction for the sec-ond antibody is in the same DAB reac-tion mixture, but without NiSO4(reaction product is brown in color).
Procedure for Removing Sections fromFilters in order to Mount on Slides
1. Set Netwell in water before removingtissue from filter.
2. Place a drop of water on the coatedslide.
3. Place the filter on top of a petri dish ina drop of water.
4. Gently ease the tissue off with thecamel hair brush.
5. Let the tissue stick to the brush andplace it in the drop of water on theslide.
6. Check the slide under the scope afteryou have removed all of the tissue andgently unfold and straighten out thetissue.
7. Remove excess fluid with filter paper.8. Allow to air-dry undisturbed over-
night.9. Place slides in water for 15 to 20 min-
utes to remove salt.10. Wash in 100% EtOH (2 × for 10–15
min).11. For slides only, clear in xylene (3 × for
10–15 min).12. Add permount and place coverslip on
slides.Note: In some cases, the tissue may be
too fragile and might have to stay on the fil-ter in order to be processed. In these cases,place sections still on filters and in Netwellsinto Americlear Clearing Solvent to cleartissue (xylene will cause filters to curl up).Remove section still on filter and place fil-ter on slide, add permount, and place cov-erslip over filter containing the section.
Visualization of the immunostained cellswill be useful but less than optimal as com-pared to the mounted section that can becompletely removed from the filter.
Protocol for Biolistics Using the HeliosGene Gun
The Helios Gene Gun is the apparatusused in our laboratory for biolistics. It usespressurized helium gas to accelerate micronsized gold particles which are coated withplasmid DNA. Several factors are impor-tant to consider for effective biolistics.These are:1. The amount of gold used per cartridge(individual bullet) ranges from 0.125 to1.0 mg. The standard amount used in ourlaboratory is 0.5 mg/cartridge. The size ofgold particles available from Bio-Rad are0.6, 1.0, and 1.6 µm in diameter. Wehave found no difference in transfectionefficiency between any of these sizes eitherin cell cultures or in organotypic sliceexplants. Our laboratory routinely uses1.0 µm gold for all transfections.2. The quantity of nucleic acid used foreach transfection can vary over a range of1.0 ng to 5.0 µg/cartridge. In any newexperimental situation, we begin with 1.0µg/cartridge. This 1.0 µg can be made upof single or multiple nucleic acid con-structs. DNA transfection efficiencies inour laboratory are similar when usingfrom 1.0µg and 0.1 µg/cartridge. Furtherdilution to 0.01 µg results in a noticeabledecrease in efficiency.3. The amount of DNA per milligramgold can range from 0.002 to 10.0 µg. Avalue of 2 is standard in our laboratory.Optimum transfection efficiencies as wellas target specificities are greatly influencedby this value and must be determinedempirically for each construct–target used.A table in the Helios Gene Gun Manualgives details for varying this parameter.
73
6. Neuronal Transfection Using Particle-Mediated Gene Transfer
Merighi6-aucorr.qxd 5/23/02 6:01 PM Page 73
4. The pressure and distance to shoot atare key parameters, and these values willhave to be determined experimentally foreach target. For organotypic sliceexplants, we use between 120 to 180 psiand between 10 to 20 mm distancebetween the gun barrel and target. Forcell lines and primary dissociated cell cul-tures, we use 120 psi and 17 to 29 mm.
Materials and Reagents
• Helios Gene Gun. • Helium hose (Bio-Rad).• Helium regulator (Bio-Rad).• Helium tank (grade 4.5, 99.995%).• Gold Microcarriers (Bio-Rad).• PVP. • Fresh 100% EtOH.• 15-mL Disposable polypropylene cen-
trifuge tubes.• 1.5-mL Microcentrifuge tubes.• 0.05 M Spermidine.• 1 M CaCl2.• 200-µL and 1-mL pipetman and tips.• 5-mL, 10-mL pipets and pipet-aid.• Purified plasmid DNA in distilled
water or TE (10 mM Tris,1 mMEDTA, pH 8.0).
• Ultrasonic cleaner (e.g., Fisher F83,Branson 1210).
• Analytical balance.• Microfuge.• Tubing Prep Station (Bio-Rad).• Nitrogen tank (grade 4.8, 99.998%).• Gold-Coat tubing (Bio-Rad).• Nitrogen regulator (Bio-Rad).• Ultrasonic cleaner.• Tubing cutter (Bio-Rad). • Vortex shaker (Fisher Scientific). • Peristaltic pump (Amersham Pharma-
cia Biotech, Piscataway, NJ, USA).
• 20-mL Scintillation vial.• Dessicant.• Parafilm.• Timer.
Procedure
Note: An unopened bottle of 100%EtOH must be used each day this proce-dure is used in order to prevent the absorp-tion of water in EtOH from inhibiting theprocess.1. Connect the N2 supply line to the Tub-
ing Prep Station. Cut a 30-inch lengthof tubing. Connect a 10-mL syringewith adapter tubing to one end of theGold-Coat tubing and flush the tubingwith EtOH. Insert the tubing into thetubing support cylinder. Be sure thatthe tubing extends past the O-ring seal.Turn on the nitrogen and set the flowto 0.3 LPM. Purge the tubing for atleast 15 minutes to dry the insidebefore loading the gold.
2. Place 25 mg of 1.0 µm gold into a 1.5-mL microfuge tube.
3. Add 100 µL of 0.05 M spermidine tothe gold and vortex mix for 5 seconds.
4. Sonicate for 5 to 10 seconds.5. Add 50 µg plasmid DNA in 100 µL or
less total volume and vortex mix imme-diately.
6. While vortexing, add 100 µL 1 MCaCl2 dropwise.
7. After all CaCl2 is added, turn vortexmixer off and let tube stand for 10minutes at room temperature.
8. Spin tube for 10 seconds in amicrofuge to pellet the gold.
9. Aspirate off most of the liquid butleave approximately 20 µL.
10. Resuspend the pellet in the remainingsupernatant by flicking the tube withyour finger. Wash the pellet 3 times
74
H. Gainer et al.
Merighi6-aucorr.qxd 5/23/02 6:01 PM Page 74

with 1 mL of fresh 100% ethanol eachtime, spin approximately 10 secondsbetween each wash and discard thesupernatants, leaving 20 µL of theEtOH supernatant.
11. Add 8.75 µL of 20 mg/mL PVP (inEtOH) to a 15-mL screw cap tube.
12. Add 3.491 mL of 100% EtOH to the15-mL screw cap tube and mix.
13. Transfer the pellet from step 11 in 200µL of the PVP/EtOH solution to the15-mL tube.
14. Wash the microfuge tube with 200 µLPVP/EtOH to suspend any remaininggold and transfer to the 15-mL tube.
15. Vortex mix the gold suspension tobreak up any clumps and then sonicatebriefly to break up any remainingclumps.
16. Invert the tube continuously to keepthe gold from settling in the 15-mLtube.
17. Remove the cap of the 15-mL tube.Using a 10-mL syringe with adaptertubing on the end, draw the gold sus-pension all the way into the Gold-Coattubing. Remove the tubing from thesuspension and continue drawing thesuspension into the tubing in order toleave an inch of airspace at the end.
18. Bring the tubing to a horizontal posi-tion and slide it into the tubing sup-port cylinder of the Tubing Prep Sta-tion. Make sure it goes throughO-ring.
19. Let stand for 3 minutes to settle thegold particles. Detach the adapter tub-ing from the syringe and attach it tothe tubing on the peristaltic pump.Remove ethanol at the rate of 0.7 inch-es/seconds.
20. Detach the adapter tubing and rotatethe Gold-Coat tubing in the supportcylinder 180° and let sit for 5 seconds.
21. Turn Tubing Prep Station on to start
rotating the tubing.22. Rotate the tubing for 20 seconds; then
purge with N2 at 0.3 LPM.23. Continue drying the tubing while
rotating for 5 minutes.24. Turn off the motor on the Tubing Prep
Station. Close the valve on the flowme-ter. Remove the tubing from the tub-ing support cylinder.
25. Inspect the tubing for blank spots andcut them out with a razor blade.
26. Place a desiccant pellet into a 20-mLscintillation vial and place the vial intothe bottom of the tubing cutter.
27. Insert one end of the tubing into thetubing cutter and cut tubing into car-tridges.
28. If not using the cartridges immediately,seal the lid of the scintillation vial withparafilm and store at 4°C in a closedchamber with desiccant.
Biolistic Transfection of Organotypic SliceExplant Cultures
1. Sterilize the barrel liner and cartridgeholder with 70% EtOH.
2. Attach the barrel liner to the GeneGun.
3. Load cartridges into the cartridge hold-er (leaving at least one chamber empty)and place in the Gene Gun.
4. Connect the helium hose line to theregulator and Gene Gun.
5. Set the pressure on the regulator. Fororganotypic cultures we use 120 to 180psi (exact value is determined empiri-cally).
6. To adjust the pressure in the regulator,keep one cartridge holder positionempty. Using this empty position, testthe shooting pressure. Adjust if neces-sary.
7. Cock the cartridge holder to load a car-tridge.
75
6. Neuronal Transfection Using Particle-Mediated Gene Transfer
Merighi6-aucorr.qxd 5/23/02 6:01 PM Page 75

8. Position the barrel liner over the targetat 10 to 20 mm and shoot the target.
9. After the biolistic run is completed,turn helium supply off and bleed theline. Disconnect the hose line andremove the cartridge holder from theGene Gun.
10. Place slice cultures into fresh medium.11. Culture as described above for 4 to 5
days (optimal duration for immunohis-tochemical assays).
RESULTS AND DISCUSSION
The following example from our labora-tory illustrates the use of biolistics in com-bination with organotypic neuronal tissueculture, in order to elucidate the mecha-nisms that are responsible for the cell-spe-cific gene expression of oxytocin (OT) andvasopressin (VP) genes in the magnocellu-lar neurons of the hypothalamo-neurohy-pophysial system (HNS). The absence ofhomologous cell lines that express thesegenes required that investigators conductsuch experiments using transgenic mice(17,18,44). The number of DNA con-structs that would be needed to be evaluat-ed in order to determine the cis elements inthese genes that control their cell-specificexpression were too large to routinely usethe relative expensive and protracted trans-genic approach. Hence, an alternative invitro strategy was sought.
Organotypic Hypothalamic TissueCultures
One of the essential criteria for a tissueculture model to study cell-specific geneexpression is that the distinct neuronalphenotypes found in vivo can be identifiedin vitro. In the case of the HNS, this meansthat the neuronal phenotypes expressingthe OT and VP peptides should be found
in identifiable nuclei in the in vitro model.This is found in organotypic cultures ofhypothalamus derived from neonatal miceand rats (24), and this is illustrated in Fig-ure 1. Using specific antibodies which aremarkers of the OT and VP phenotypes(i.e., PS-38, against OT-associated neuro-physin, OT-Np; and THR, against VP-associated neurophysin, VP-Np) inimmunohistochemical assays, it is possibleto identify the various nuclei. The paraven-tricular (PVN), accessory (ACC), andsupraoptic nuclei (SON) in Figure 1, Athrough D, and the suprachiasmatic nucle-us in Figure 1E are clearly identifiable inslices cultured for 15 DIV. Higher magnifi-cation views of these immunoreactive neu-rons in Figure 1, C, D, and F show thatthey resemble differentiated OT and VPneurons with their large cell bodies androbust nonspiny dendritic processes.
Efficacy of Biolistics in OrganotypicCultures
As noted earlier, conventional methodssuch as calcium–phosphate coprecipitation,electroporation, and lipid-mediated celltransfection are not very effective whenused with organotypic cultures. This couldbe due, in part, to the presence of a reactiveastrocyte layer which grows over the cul-tured slice, and thereby prevents access ofthe DNA-containing vehicles to the neu-rons below. One alternative is to use viralvectors, and indeed, we have successfullyused adenoassociated viral vectors to trans-fect large numbers of OT and other neu-rons in such organotypic cultures (28).However, the production of multiple viralvectors accommodating the large numbersof DNA constructs necessary for promot-er–enhancer analysis would be nearly aslabor-intensive and time-consuming as theuse of transgenic mice for this purpose. Inbiolistics, however, any DNA construct ofany size and in any configuration can be
76
H. Gainer et al.
Merighi6-aucorr.qxd 5/23/02 6:01 PM Page 76

used virtually immediately for transfection.Therefore, biolistics provides a very rapidassay, comparable to the use of cell lines fordeletion construct analysis, but with the
advantage of being able to be used in themore biologically relevant primary neurons.
In preliminary experiments (42), weused biolistics to transfect cells in station-
77
6. Neuronal Transfection Using Particle-Mediated Gene Transfer
Figure 1. Organotypic cultures. Slice explants of mouse and rat hypothalamus after 15 DIV. Panels A through D are mouse neu-rons immunostained with PS 36 monoclonal antibody for OT-Np. Panels E and F are immunostained for VP-Np with THR poly-clonal antibody (obtained from Dr. Alan Robinson, University of Pittsburgh). (A) A lower power micrograph showing an entire sliceexplant stained for OT-Np (PS 38) and containing three magnocellular nuclei (see arrows labeled B–D). These nuclei are shown athigh power in B to D for PVN (B), SON (C), and ACC (D) nuclei, respectively. (E and F) High magnification views of VP cells inrat hypothalamic slice explants (15 DIV) immunostained using THR antibody. VP cells in rat suprachiasmatic nuclei are shown inpanel E, and VP cells in SON are shown in panel F. Scale line in panel F represents 800 µm in panel E and 200 µm in panel F. Scaleline in panel C represents 1 mm in panel A, 300 µm in panel B, and 150 µm in panels C and D. Adapted from Reference 24.
Merighi6-aucorr.qxd 5/23/02 6:01 PM Page 77

ary organotypic cultures with a variety ofpromoters [e.g., cytomegalovirus (CMV),rous sarcoma virus (RSV), glial fibrillaryacidic protein (GFAP), α-tubulin, and var-ious α-1B calcium (N) channel promoterconstructs] and reporters (e.g., Lac-Z,luciferase, and GFP). We found that hip-pocampal and hypothalamic slice explantswere easily and effectively transfected bythis method. This is illustrated in Figure 2,where a CMV-GFP construct was “shot”using a PDS Bio-Rad System into hip-pocampal (Figure 2A) and hypothalamic(Figure 2B) slices. Note that the transfec-tion incidence is low and random. Bothglia (Figures 2, C and D) and neurons (Fig-ure 2F) are transfected by the CMV-GFP,since the CMV promoter does not distin-guish between these cell types. The layer ofreactive astrocytes covering the surfaces ofthe cultured slices are preferentially hit bythe gold particles and therefore are the pre-dominant cell types visualized (Figure 2, Cand D) when using the CMV promoter.
In contrast, when a nerve-specific enolase(NSE) promoter was fused to a GFPreporter to produce a NSE-GFP construct,which was shot using a Helios Gene Gunapparatus into hypothalamic slices, predom-inantly neuronal phenotypes were visualizedexpressing the GFP. Figure 3 shows the mul-tipolar neurons with long processes in bothorganotypic (Figure 3, A and B) as well as indissociated (Figure 3, C and D) hypothala-mic cultures that were transfected with theNSE-GFP construct and which robustlyexpressed the GFP reporter.
Use of Biolistics to AssayVasopressin–Gene Constructs inHypothalamic Organotypic Cultures
Figure 4 illustrates the results of prelim-inary experiments using the biolistic tech-nique to transfect hypothalamic neurons inorganotypic cultures with VP gene con-structs containing either choramphenicol
transferase (CAT) (Figures 4, A through C)or GFP (Figures 4D though F) reporters.Previous studies in transgenic mice havesuggested that key cis elements in the VPgene for cell-specific expression are locatedin the downstream 3′ flanking (noncoding)region of the gene (17,18). Consistent withthis view is the observation that when VPgene constructs containing the entire gene(including the 3 exons and 2 introns) plusthe 2 to 3 kb upstream and 2 to 3 kbdownstream flanking regions and with aCAT reporter inserted in exon III are intro-duced into transgenic mice, the expressionof the CAT reporter is highly cell-specificin magnocellular VP neurons (17,44). Weused one of these constructs, termed VPIII-CAT-2.1 (the CAT was inserted at theend of exon III followed by a 2.1 kb 3′flanking sequence), as a positive control inbiolistic experiments. The results of theseexperiments are shown in Figure 4, Athrough C, where CAT expressing cells,visualized by immunocytochemistry(ICC), occur only in areas of the slicewhere the endogenous VP cells are found(see Figure 1). The specificity of the expres-sion was indicated by the following obser-vations: (i) comparable experiments usinghippocampal slices, which have no VP-expressing cells, showed no cells thatexpressed the CAT reporter after transfec-tion with the VP-III-CAT-2.1 construct;(ii) the CMV-GFP experiments shown inFigure 2 indicates that mostly glial cellswere being penetrated by the gold particles,but yet no glial expression of CAT wasfound using the VP III-CAT-2.1 construct;(iii) the morphology of the neuronal celltypes expressing the CAT in the hypothala-mic (in Figure 4, A through C slices)resembles the endogenously VP-expressingcells in these organotypic cultures (see Fig-ure 1) and not the predominately multipo-lar neurons that were visualized when NSEwas used as a promoter (Figure 3); and (iv),double label ICC using CAT antibodies
78
H. Gainer et al.
Merighi6-aucorr.qxd 5/23/02 6:01 PM Page 78

and VP marker antibodies (e.g., againstVP-Np) showed colocalization betweenendogenous VP and CAT immuno-reactivity (unpublished observations).
Given this success using the positive con-trol construct, VP III-CAT-2.1, we thentested a new deletion construct.
The VP gene deletion construct used
79
6. Neuronal Transfection Using Particle-Mediated Gene Transfer
Figure 2. CMV-GFP transfected cells in organotypic cultures. Visualization of CMV-GFP transfected cells in organotypic hip-pocampal (A,C, and E) and hypothalamic (B,D, and F) cultures. Panel A shows visualization by ICC of CMV-GFP biolisticallytransfected cells in a hippocampal slice explant culture (scale line in panel E = 2.5 mm). Panel B shows visualization of CMV-GFPtransfected cells in a hypothalamic slice explant culture (scale line = 2.0 mm). Panel C shows a higher power photomicrograph ofa hippocampal slice explant culture. Notice the variety of cell types transfected (scale line = 400 µm). Panel D shows a higherpower photomicrograph of a hypothalamic slice explant culture. Notice the variety of cell types transfected (scale line = 200 µm).Panel E shows a high power view of CMV-GFP transfected cells in a hippocampal slice explant culture (scale line = 40 µm).Notice that the 2 transfected cells have a gold particle in the nucleus. The other gold particles seen in the photomicrograph havenot successfully transfected any cells. Panel F shows a CMV-GFP transfected neuron with a long axonal process in a hypothalam-ic slice explant culture (scale line = 400 µm). Adapted from Reference 42.
Merighi6-aucorr.qxd 5/23/02 6:01 PM Page 79

contained the same upstream and down-stream sequences and exon I in the VP IIICAT-2.1 gene, but had exons II and III andintrons I and II removed, and the CATreporter was replaced by GFP, which wasfused to exon I. This gene construct wasnamed VP I-GFP-2.1, and the results of itsbiolistic transfection into hypothalamicslices are shown in Figure 4, D through F. Asimilar expression pattern in hypothalamicneurons was observed using this deletionconstruct, with GFP expression occurringexclusively in the relevant nuclear areas(e.g., PVN, Figure 4D and SCN, Figure4F) that express the endogenous gene in thecultured slice (see Figure 1). Immunocyto-
chemical studies showed colocalization ofthe VP-Np marker and the expressed GFP(unpublished observations), further indicat-ing correct cell-specific expression by thedeletion construct. Thus, it appears that thecombined biolistic-organotypic cultureapproach can be a very practical and effec-tive strategy to study cell-specific geneexpression mechanisms in a variety of celltypes in the central nervous system.
CONCLUSIONS
Particle-mediated gene transfer has a sig-nificant advantage over the conventional
80
H. Gainer et al.
Figure 3. NSE-GFP transfection of neuronal cultures. GFP expression in neurons in organotypic (A and B) and dissociated (Cand D) cultures prepared from PN 2 rodent hypothalami 4 days after biolistic transfection with pNSE-GFP constructs (NSE pro-moter obtained from Dr. Freda Miller, McGill University). Scale line in panel D represents 400 µm in panel A, and 200 µm inpanels B through D.
Merighi6-aucorr.qxd 5/23/02 6:01 PM Page 80

procedures that are used for transfection, inthat it is applicable to all cell types and canbe used in most experimental circum-stances. Only viral vectors have a compara-ble applicability (but not all viral vectorsare equally effective in all animal species),
however, the viral vector technology ismuch more labor-intensive, more time-consuming, requires special biosafety facili-ties, may exhibit biotoxicity, and often elic-its a deleterious immune response from thehost when used in vivo. A second major
81
6. Neuronal Transfection Using Particle-Mediated Gene Transfer
Figure 4. VP-CAT/EGFP gene expression in organotypic cultures. Results of biolistic transfection of VP III-CAT-2.1 (A–C)and VP-I-EGFP-2.1 (D–F) constructs into organotypic hypothalamic cultures. Analysis of CAT or GFP expression was made byIHC in PVN or SON (panels A, B, D, and E) and SCN (panels C and F) regions of the cultures.
Merighi6-aucorr.qxd 5/23/02 6:01 PM Page 81

advantage of biolistics is that only super-coiled plasmid DNA is needed to coat thegold particles, and hence, nonmolecularbiologists can easily and rapidly incorporatethis technology into their experimentalrepertoires. The only disadvantage of thebiolistic methodology, is its relatively lowefficiency (the usual being about 1%–3%of cells transfected), however, a recentreport claimed transfection efficiencies of10% with dissociated cerebellar granulecells and hippocampal neurons cultured oncoverslips (45). It is clear that in two cir-cumstances, viral vectors would be the pre-ferred method for transfection, i.e., wherelarge (>50%) transfection efficiencies areneeded, and in vivo in deep regions (e.g.,subcortical nuclei) of the central nervoussystem where the gold particles can neitherpenetrate nor be selectively targeted.
There is, however, a unique feature ofbiolistics that provides an importantopportunity for experimental biologists.This derives from the fact that multipleplasmid DNA copies are adsorbed to thegold particle's surface. It has been estimat-ed that approximately 200 plasmid DNAcopies can coat a single one micron goldparticle (4,5,27,41). Hence, penetration ofa cell nucleus would deliver multiple copiesto a single cell and would be likely to pro-duce hyperexpression of the transfectedgene relative to the endogenous gene. Thiscould possibly explain why the same con-struct (e.g., VP-III-CAT-2.1) when used intransgenic mice did not produce detectableCAT expression in the SCN in vivo(17,44), but could produce robust expres-sion in neurons of the SCN (in Figure 4C)when transfected by biolistics. Presumably,the integrated DNA constructs in thetransgenic mice (even when present asmultiple concatenated copies) had lowertranscriptional efficiencies than the sameDNA constructs when used in biolistics.Even more important, is the fact that avariety of plasmid DNAs can be placed on
the same gold particle, thereby providingan easy technique for colocalization ofmore than one type of DNA construct inany transfected cell. Arnold et. al. (1) trans-fected coated gold particles with a mixtureof two distinct constructs with differentreporters and found, following biolistictransfection, that 97% of the 130 cellsstudied expressed both reporters. In con-trast, when each construct coated a differ-ent population of gold particles, and thegold particles were subsequently mixed andshot into cells, there was no colocalizationof reporters. This property of coating goldparticles with two distinct genes allowed usto do quantitative biolistic assays of geneexpression by using one of the colocalizedconstructs as an internal control (42).Although similar experiments have notbeen done in animal cells, the cotransfec-tion of plant cells with as many as 12 (21)or 13 (9) different plasmid DNAs has beenreported. Eighty five percent of the trans-genic plants contained more than 2 and17% more than 9 of the transgenes. If suchcotransfection is also possible in animalcells (e.g., neurons), then it should be feasi-ble to perturb a neuron by transfecting sev-eral specific wild-type or mutant genes,and to simultaneously mark the transfectedneuron with a GFP reporter in order toidentify it in living cultures for imagingand/or physiological analysis.
ACKNOWLEDGMENTS
The authors wish to thank Drs. S.-W.Jeong and Abraham Thomas for their con-tributions in the early stages of this work,Ms. Sharon Key for her help in making thefigures, and Ms. Sophia D. Jackson for typ-ing this manuscript.
REFERENCES
1.Arnold, D., L. Feng, J. Kim, and N. Heintz. 1994. A
82
H. Gainer et al.
Merighi6-aucorr.qxd 5/23/02 6:01 PM Page 82

strategy for the analysis of gene expression duringneural development. Proc. Natl. Acad. Sci. USA91:9970-9974.
2.Arnold, D.B. and N. Heintz. 1997. A calcium respon-sive element that regulates expression of two calciumbinding proteins in Purkinje cells. Proc. Natl. Acad.Sci. USA 94:8842-8847.
3.Barry, M.A. and S.A. Johnston. 1997. Biological fea-tures of genetic immunization. Vaccine 15:788-791.
4.Baker, S.M., P.G. Okkema, and J.A. Jaehning. 1984.Expression of the Saccharomyces cerevisiae GAL7 geneon autonomously replicating plasmids. Mol. Cell Biol.4:2062-2071.
5.Baker, S.M., S.A. Johnston, J.E. Hopper, and J.A.Jaehning. 1987. Transcription of multiple copies of theyeast GAL7 gene is limited by specific factors in addi-tion to GAL4. Mol. Gen. Genet. 208:127-134.
6.Biewenga, J.E., O.H. Destree, and L.H. Schrama.1997. Plasmid-mediated gene transfer in neurons usingthe biolistics technique. J. Neurosci. Methods 71:67-75.
7.Butow, R.A. and T.D. Fox. 1990. Organelle transfor-mation: shoot first, ask questions later. TIBS 15:465-468.
8.Butow, R.A., R.M. Henke, J.V. Morgan, S.M. Bel-char, and P.S. Perlman. 1996. Transformation of Sac-charomyces cerevisiae mitochondria using the biolisticgun. Methods Enzymol. 264:265-279.
9.Chen, L., P. Marmey, N.J. Taylor, J.-P. Brizard, C.Espinoza, P. D’Cruz, H. Huet, S. Zhang, A. deKochko, R.N. Beachy, and C.M. Faquet. 1998. Ex-pression and inheritance of multiple transgenes in riceplants. Nat. Biotechnol. 16:1060-1064.
10.Cheng, F.-M. and K.E. Joho. 1994. Effect of biolisticparticle size on the efficiency of transfection of oocytesin Xenopus ovary tissue. Nucleic Acids Res. 22:3265-3269.
11.Cheng, L., P.R. Ziegelhoffer, and N.-S. Yang. 1993. Invivo promoter activity and transgene expression inmammalian somatic tissues evaluated by using particlebombardment. Proc. Natl. Acad. Sci. USA 90:4455-4459.
12.Daniell, H. 1997. Transformation and foreign geneexpression in plants mediated by microprojectile bom-bardment. Methods Mol. Biol. 62:463-489.
13.Davis, R.E., A. Parra, P.T. LoVerde, E. Ribeiro, G.Glorioso, and S. Hodgson. 1999. Transient expressionof DNA and RNA in parasitic helminths by using par-ticle bombardment. Proc. Natl. Acad. Sci. USA 96:8687-8692.
14.Fernandez-Fernandez, J.M., N. Wanaverbecq, P. Hal-ley, M.P. Caulfield, and D.A. Brown. 1999. Selectiveactivation of heterologously expressed G-protein-gatedK+ channels by M2 muscarinic receptors in rat sympa-thetic neurons. J. Physiol. 515:631-637.
15.Furth, P.A. 1997. Gene transfer by biolistic process.Mol. Biotechnol. 7:139-143.
16.Gahwiler, B.H., M. Capogna, D. Debanne, R.A.McKinney, and S.M. Thompson. 1997. Organotypicslice cultures: a technique has come of age. TrendsNeurosci. 20:471-477.
17.Gainer, H. 1998. Cell-specific gene expression in mag-nocellular oxytocin and vasopressin neurons. Adv. Exp.
Med. Biol. 449:15-27.18.Gainer, H. and S. Wray. 1994. The cellular and mole-
cular biology of oxytocin and vasopressin, p. 1099-1129. In E. Knobil and J.D. Neill (Eds.), Physiologyof Reproduction, 2nd ed. Raven Press, New York.
19.Gainer, A.L., G.S. Korbutt, R. Rajotte, G.I. Warnock,and J.F. Elliott. 1996. Successful biolistic transforma-tion of mouse pancreatic islets while preserving cellularfunction. Transplantation 61:1567-1571.
20.Guo, Z., A.S.F. Chong, S. Jandeska, W.H. Sun, Y.Tian, W. Podlasek, J. Shen, D. Mital, S. Jensik, andJ.W. Williams. 1997. Gene gun-mediated gene trans-fer and expression in rat islets. Transplant. Proc.29:2209-2210.
21.Hadi, M.Z., M.D. McMullen, and J.J. Finer. 1996.Transformation of 12 different plasmids into soybeanvia particle bombardment. Plant Cell Reports 15:500-505.
22.Hapala, I. 1997. Breaking the barrier: methods forreversible permeabilization of cellular membranes.Crit. Rev. Biotechnol. 17:105-122.
23.Horch, H.W., A. Krüttgen, S.D. Portbury, and L.C.Katz. 1999. Destabilization of cortical dendrites andspines by BDNF. Neuron 23:353-364.
24.House, S.B., A. Thomas, K. Kusano, and H. Gainer.1998. Stationary organotypic cultures of oxytocin andvasopressin magnocellular neurons from rat and mousehypothalamus. J. Neuroendocrinol. 10:849-861.
25.Jiao, S., L. Cheng, J.A. Wolff, and N.-S. Yang. 1993.Particle bombardment-mediated gene transfer andexpression in rat brain tissues. Biotechnology 11:497-502.
26.Johnston, S.A. and M.J. DeVit. 1996. Biolistic trans-formation of yeasts. Methods Mol. Biol. 53:147-153.
27.Johnston, S.A. and D.-C. Tang. 1994. Gene guntransfection of animal cells and genetic immunization.Methods Cell Biol. 43:353-365.
28.Keir, S.D., S.B House, J. Li, X. Xiao, and H. Gainer.1999. Gene transfer into hypothalamic organotypiccultures using an adeno-associated virus vector. Exp.Neurol. 160:313-316.
29.Kilpatrick, K.E., T. Cutler, E. Whitehorn, R.J. Drape,M.D. Macklin, S.M. Witherspoon, S. Singer, and J.T.Hutchins. 1998. Gene gun delivered DNA-basedimmunizations mediate rapid production of murinemonoclonal antibodies to the Flt-3 receptor. Hybrido-ma 17:569-576.
30.Klein, T.M., E.D. Wolf, R. Wu, and J.C. Sanford.1987. High-velocity microprojectiles for deliveringnucleic acids into living cells. Nature 327:70-73.
31.Klein, T.M., T. Gradziel, M.E. Fromm, and J.C. San-ford. 1988. Factors influencing gene delivery into zeamays cells by high velocity microprojecters. Biotech-nology 6:559-563.
32.Lo, D.C., A.K. McAllister, and L.C. Katz. 1994. Neu-ronal transfection in brain slices using particle-mediat-ed gene transfer. Neuron 13:1263-1268.
33.McAllister, A.K., L.C. Katz, and D.C. Lo. 1997. Op-posing roles for endogenous BDNF and NT-3 in regu-lating cortical dendritic growth. Neuron 18:767-768.
34.McAllister, A.K., D.C. Lo, and L.C. Katz. 1995. Neu-rotrophins regulate dendritic growth in developingvisual cortex. Neuron 15:791-803.
83
6. Neuronal Transfection Using Particle-Mediated Gene Transfer
Merighi6-aucorr.qxd 5/23/02 6:01 PM Page 83

35.Robinson, H.L. and C.A. Torres. 1997. DNA vac-cines. Semin. Immunol. 9:271-283.
36.Rodriquez-Rilo, H.L., W.R. Paljug, J.R.T. Lakey, M.J.Taylor, and D. Grayson. 1998. Biolistic bioengineer-ing of pancreatic beta-cells with fluorescent green pro-tein. Transplant Proc. 30:465-468.
37.Sanford, J.C. 1990. Biolistic plant transformation.Physiol. Plant 79:206-209.
38.Sanford, J.C., F.D. Smith, and J.A. Russell. 1993.Optimizing the biolistic process for different biologicalapplications. Methods Enzymol. 217:483-509.
39.Smith, F.D., P.R. Harpending, and J.C. Sanford.1992. Biolistic transformation of prokaryote-factorsthat effect biolistic transformation of very small cells.J. Gen. Microbiol. 36:239-248.
40.Stoppini, L., P.A. Buchs, and D. Muller. 1991. A sim-ple method for organotypic cultures of nervous tissue.J. Neurosci. Methods 37:173-182.
41.Tanelian, D.L., M.A. Barry, S.A. Johnston, T. Le, andG. Smith. 1997. Controlled gene gun delivery andexpression of DNA within the cornea. BioTechniques23:484-488.
42.Thomas, A., D.S. Kim, R.L. Fields, H. Chin, and H.Gainer. 1998. Quantitative analysis of gene expressionin organotypic slice-explant cultures by particle-medi-ated gene transfer. J. Neurosci. Methods 84:181-191.
43.Turner, J.G., J. Tan, B.E. Crucian, D.M. Sullivan,O.F. Ballester, W.S. Dalton, N.-S. Yang, J.K. Burk-holder, and H. Yu. 1998. Broadened clinical utility ofgene gun-mediated, granulocyte-macrophage colony-
stimulating factor cDNA-based tumor cell vaccines asdemonstrated with a mouse myeloma model. Hum.Gene Ther. 9:1121-1130.
44.Waller, S.J., A. Ratty, J.P. Burbach, and D. Murphy.1998. Transgenic and transcriptional studies on neu-rosecretory cell gene expression. Cell Mol. Neurobiol.18:149-171.
44a.Watson, R.E., Jr., S.J. Wiegand, R.W. Clough, andG.E. Hoffman. 1986. Use of cryoprotectant to main-tain long-term peptide immunoreactivity and tissuemorphology. Peptides 7:155-159.
45.Wellmann, H., B. Kaltschmidt, and C. Kaltschmidt.1999. Optimized protocol for biolistic transfection ofbrain slices and dissociated cultured neurons with ahand-held gene gun. J. Neurosci. Methods 92:55-64.
46.Williams, R.S., S.A. Johnston, M. Riedy, M.J. DeVit,S.G. McElligott, and J.C. Sanford. 1991. Introduc-tion of foreign genes into tissues of living mice byDNA-coated microprojectiles. Proc. Natl. Acad. Sci.USA 88:2727-2730.
47.Wilm, T., P. Demel, H.-U. Koop, H. Schnabel, andR. Schnabel. 1999. Ballistic transformation of caeno-rhabditis elegans. Gene 229:31-35.
48.Wong, W.T., J.R. Sanes, and R.O.L. Wong. 1998.Developmentally regulated spontaneous activity in theembryonic chick retina. J. Neurosci. 18:8839-8852.
49.Xu, T., S. Finkbeiner, D.B. Arnold, A.J. Shaywitz,and M.E. Greenberg. 1998. Ca2+ influx regulatesBDNF transcription by a CREB family transcriptionfactor-dependent mechanism. Neuron 20:709-726.
84
H. Gainer et al.
Merighi6-aucorr.qxd 5/23/02 6:01 PM Page 84

85
OVERVIEW
A combination of transgenic technologyand single-cell reverse transcription poly-merase chain reaction (RT-PCR) has beenused to study gene expression in dopamin-ergic amacrine (DA) cells of the mouseretina. Because there are only 900 DA cells,and they cannot be distinguished fromneighboring neurons on the basis of theirmorphology, we labeled them with humanplacental alkaline phosphatase (PLAP) byintroducing into the mouse genome PLAPcDNA under the control of the promoterof the gene for tyrosine hydroxylase (TH),the rate-limiting enzyme for dopaminebiosynthesis. Because PLAP is an enzymethat resides on the outer surface of the cellmembrane, we can identify DA cells afterdissociation of the retina by immunocyto-chemistry in the living state. Cells are thenpatch clamped and harvested for single-cellRT-PCR analysis of gene expression. Here,we describe the preparation of the fluores-cent antibody E6-Cy3 to specifically detectPLAP-expressing cells, methods to obtainshort-term cultures of solitary neurons
from mouse retinas, and techniques todetect gene expression in individual neu-rons. Properties and pitfalls of single-cellRT-PCR are described and discussed.
BACKGROUND
Analysis of Neural Networks in the AdultBrain
To date, an impressive body of knowl-edge exists on the physiological events thatunderlie visual perception. This is due, inpart, to the fact that the visual input can becontrolled with great precision and, inpart, to our adequate understanding of thefirst stages of visual processing. In this con-text, the retina has been a particularlyattractive object of study because of itsphysical location, the distinctive morphol-ogy of its neurons, and the regularity of itsarchitecture. Interesting and intellectuallystimulating hypotheses on the physiologi-cal organization of the retina have beendeduced from output measurements,which are the responses of ganglion cells,
Cellular and Molecular Methods in Neuroscience ResearchEdited by A. Merighi and G. Carmignoto
Analysis of Gene Expression inGenetically Labeled Single Cells
Stefano Gustincich, Andreas Feigenspan, and Elio RaviolaDepartment of Neurobiology, Harvard Medical School, Boston, MA, USA
7
Merighi7-aucorr.qxd 5/23/02 6:07 PM Page 85

after manipulation of the neural networksand subsequent modeling. This top-downparadigm is today the favored approach tothe understanding of neural networks ingeneral. In the case of the retina, it relies onthe assumption that this neural center con-tains a limited number of neuronal celltypes: photoreceptor, bipolar, horizontal,amacrine, and ganglion cells.
The reality, however, is far more complex.Nine different types of cone bipolars wereidentified in the rat retina (11). A combina-tion of photochemical and Golgi stainingmethods described at least 28 different typesof amacrine cells in the rabbit (24). Finally,DeVries and Baylor were able to assign rab-bit ganglion cells to 11 distinct physiologicalclasses (8). This extraordinary complexity isnot restricted to the retina. Electrophysio-logical characterization of inhibitoryinterneurons identified at least 16 differentfunctional types in the hippocampus (31).On the other hand, the Golgi methodrevealed 50 anatomical types of local circuitneurons in the striate cortex of the monkey,which led to the suggestion that there couldbe as many as 100 different cell types ineach layer of the neocortex (34).
At the heart of this fundamental issue isthe definition of cell type, intended here asa class of neurons that receives a uniquesynaptic or sensory input, carries out a spe-cific set of computations, and transmits theproducts of its activity to a unique set ofpostsynaptic neurons or peripheral effectorcells. It is possible, therefore, that each neu-ronal type expresses a unique constellationof neuroactive molecules, ion channels,and receptors. Often, but not necessarilyeverywhere, each neuronal type has aunique morphology dictated by the needfor ordered sampling of the visual world,efficient utilization of space, and uniformi-ty in the neuronal geometry. In this case,shape of a neuron generally reflects thespecificity of its synaptic connections.
As a result, the various neuronal types
express unique combinations of genes,which can be explored with the techniquesof molecular biology. In a bottom-upapproach, neurons are identified on thebasis of cell type-specific markers, and theircomplement of molecular constituents issubsequently analyzed. This knowledge isthen used to design appropriate physiolog-ical experiments to clarify their function inthe computations carried out by the net-works of which they are components (25).
Gene Expression in the Nervous System
Our underestimation of the complexityof neural networks derives mainly from thelack of markers specific for the various celltypes and of methods to assign gene expres-sion either at the mRNA or protein level toidentified neuronal populations.
When a new gene is identified and itscDNA cloned, a first step in its characteri-zation is the analysis of its pattern ofexpression in various tissues. In the litera-ture, vast numbers of northern blots wereperformed on brain RNA. However, thedetection of the mRNA of interest in thewhole brain is not very informative; thisgene can be moderately expressed in mostif not all the neurons, or it can be highlyexpressed in a single large cell populationwhile absent in all others. Even less infor-mative is the failure to detect any givenspecies of mRNA. This occurs for manygenes expressed in the central nervous sys-tem. A gene can in fact be transcribed at avery high level in a rare cell type only.Northern analysis of RNAs purified fromspecific regions of the brain reduces, butdoes not eliminate, this averaging effect.With in situ hybridization experiments onbrain sections, it is often impossible to rec-ognize the types of neurons that contain aspecies of mRNA; most of the neurons aretoo small, too closely packed, and theirshape is not visible in its entirety. Further-more, this technique is not very sensitive,
86
S. Gustincich et al.
Merighi7-aucorr.qxd 5/23/02 6:07 PM Page 86

and the analysis is limited to a very smallnumber of genes per experiment.
Double immunostaining with a cell-spe-cific marker is nowadays the standard tech-nique to identify the neurons that expressan antigen of interest. Markers are usuallyneurotransmitters and their syntheticenzymes, peptides, cytoskeletal, and calci-um-binding proteins. The number of suchmarkers, however, is limited, and they arerarely distributed throughout the cytosol,thus allowing recognition of the cell shape.Furthermore, they can be expressed inmore than one cell type in the same area ofthe brain, thus adding new difficulties tothe interpretation of the pattern of expres-sion. In the retina, for instance, antibodiesdirected against glutamic acid decarboxy-lase (GAD), the GABA synthesizingenzyme, recognize most of the amacrinecells without discriminating among the 28different types.
Single-Cell Analysis of Gene Expression
Besides immunocytochemistry, otherroutine methods to study the presence ofreceptors and channels in neurons areintracellular recordings followed by injec-tion of dyes or enzymes and patch clamp-ing of identified cells in slices, after dissoci-ation or in primary cultures (25).
In recent years, however, the patch pipethas also been exploited to collect cytoplasmfrom morphologically identified neurons.This material is then the substrate of aseries of biochemical reactions that lead tothe description of the pattern of expressionof selected genes at a single-cell level. Sub-sequently, biophysical and pharmacologicalproperties of ligand and voltage-gated ionchannels in single identified neurons canbe correlated with the expression of specif-ic mRNAs (28,30,35).
During a patch clamp experiment in thewhole-cell configuration, the rupture of themembrane patch establishes a low resis-
tance pathway between the interior of thecell and the lumen of the recording pipet,thus allowing the dialysis of the cell interi-or with the electrode solution. At the endof the recording, negative pressure isapplied, and this causes the entry of the cellor its contents into the pipet tip. The tip isfinally broken into a microfuge tube toharvest the cell. In the original version ofthe single-cell RT-PCR technique, thesolution filling the microelectrode containsall the reagents necessary for first-strandcDNA synthesis (22,37).
Two methods have been used to detectthe presence of specific mRNAs in the har-vested cell. After random primed first-strand cDNA synthesis, PCR amplificationwith specific primers is carried out in thesame tube. The amplified DNA is thenanalyzed by agarose gel electrophoresis. Asecond round of PCR amplification maybe required to detect low abundance genesor to synthesize larger amounts of materialfor further analysis. The choice of the PCRprimers determines which gene is analyzed.This method was successfully applied tostudy the expression of single genes or fam-ilies of genes. A very powerful extension ofthis method is called multiplex PCR; afterharvesting the cell content, a first round ofPCR is performed with multiple primerpairs. Then, several secondary PCRs arecarried out, each containing only one ofthe previously used pairs of primers (22).
This technique has demonstrated all itspotential in a series of elegant papers on themolecular constituents of native glutamatereceptors (1). In a first-round PCR, degen-erated primers specific for regions highlyconserved in all AMPA subunits subtypeswere used to amplify mRNAs expressed inthe neuron of interest. Several, second-round PCRs were then assembled usingsubunit-specific primers to detect the sub-units expressed and their spliced forms. Theamplification products were then directlysequenced to detail the state of editing of
87
7. Gene Expression in Genetically Labeled Single Cells
Merighi7-aucorr.qxd 5/23/02 6:07 PM Page 87

the messages or cloned to quantify the rela-tive abundance of the various subunits.These works, on cerebellar Purkinje andgranule cells in culture (22), in type I and IIhippocampal cells in culture (4), and in avariety of identified cells in brain slices(14,19), have clearly demonstrated that dif-ferential regulation of gene expression leadsto functional diversity in the receptors ofnative neurons. For instance, the presenceof the GluR2 subunit is related to the calci-um permeability of the receptor–ionophorecomplex (14,19).
A second method is based on the activi-ty of the T7 RNA polymerase (6,37). First-strand cDNA is synthesized with a primerthat contains the promoter sequence forthis phage enzyme. After the harvest of thecell contents and the incubation withreverse transcriptase, a second-strand syn-thesis reaction is performed. The double-stranded cDNA is in turn the template foran in vitro transcription reaction in thepresence of a radiolabeled ribonucleotide.The amplified RNA can then be used as aprobe to hybridize cDNA clones immobi-lized on a nylon membrane. This methodhas two advantages: (i) the T7 amplifica-tion step is linear, thus maintaining thecorrect proportion between differentmRNAs; and (ii) a theoretically unlimitednumber of cDNAs can be detected simul-taneously. This technique was successfullyapplied on a number of different cell types.It requires, however, more manipulationsthan single-cell RT-PCR, and it does notprovide information on common cell-spe-cific processing, such as splicing and edit-ing. Furthermore, reverse northern blotscan be subject to a high frequency of falsepositives derived from cross-hybridizationof noncomplementary genes that containcommon sequences.
Appendix I shows a list of genes whoseexpressions were assessed with single-cellRT-PCR and the neuronal cell types thatwere harvested. In addition to the descrip-
tion of multisubunit ligand-gated channels,single-cell analysis was applied to the studyof the pattern of splicing of voltage-gatedchannels to identify the subtypes in a fami-ly of metabotropic receptors and to detectcell-specific markers in order to confirm theidentity of the investigated neuron.
Single-cell RT-PCR is significantly moresensitive than in situ hybridization andpermits, therefore, the detection of tran-scripts present in low abundance. Itsabsolute sensitivity, however, is still uncer-tain (see Results and Discussion).
Identification of Specific Cell Types forSingle-Cell RT-PCR
In many instances, single-cell RT-PCRhas followed conventional patch clamprecordings. Neuronal cytoplasm was har-vested from cells in slices, primary cultures,and after acute dissociation. Unfortunate-ly, the same limitations that restrict theelectrophysiological analysis to a relativelysmall number of identified cell types alsohold true for the analysis of gene expres-sion. Only well recognizable neurons canbe studied, and the diversity among typesis clearly underestimated. For instance,typical classifications were “spiking andnon-spiking” or “agonist-sensitive and ago-nist-insensitive” neurons. Furthermore,electrophysiological recordings are oftenobtained from neurons whose identity inthe intact tissue is not known.
Rare populations are probably neverencountered by chance during recording inslices, or they cannot be identifiedunequivocally without the injection of afluorescent dye such as Lucifer yellow atthe end of the experiment. Primary cul-tures are prepared from many areas of thebrain, but most of the cells lose their dis-tinctive morphology after a few days invitro. Furthermore, it is unclear whetherneurons after several days in culture are stillrepresentative of their phenotypes in vivo.
88
S. Gustincich et al.
Merighi7-aucorr.qxd 5/23/02 6:07 PM Page 88

Enzymatic digestion and mechanical tritu-ration of regions of the nervous system is apowerful method to obtain short-term cul-tures of solitary neurons from both youngand adult animals. The majority of the cellsis damaged during dissociation, but someof them retain highly characteristic mor-phological traits that facilitate their identi-fication, such as cerebellar Purkinje cells,hippocampal pyramidal cells, retinal rods,and rod bipolars (25).
Nonspecific fluorescent markers, like4′6-diamidine-2-phenylindole (DAPI) andacridine orange, are sometimes applied tothe tissue maintained in vitro to label thesoma of specific neuronal populations.Other dyes can be injected in vivo andaccumulated by retrograde transport.
Transgenic technology is a powerful toolfor stable ectopic expression of a gene in atissue or cell type of interest. Therefore, aneuronal type can be labeled by linking thepromoter of a cell type-specific gene to areporter gene whose product can be detect-ed with common microscopic techniques.This approach is dependent upon the iden-tification of the correct genomic sequencesthat drive gene expression in specific celltypes and the use of an appropriate reporter.
There is a large amount of literature onthe structure of the regulatory elements ofgenes expressed in the nervous system andthe effects of the introduction into themouse genome of cloned genomic frag-ments acting as promoters for a visiblereporter (29). In some cases, such as withthe promoter for the tyrosine hydroxylasegene, the expression of the reporter is spa-tially and temporally regulated as the wild-type gene (2,16). In these cases, entire pop-ulations of specific neuronal types arelabeled in the genetically modified mouseline. More frequently, no expression, lowlevel expression, and expression limited toa fraction of the relevant cell populationare the outcomes. These results are inter-preted as a consequence of the absence of
important regulatory sequences in the con-struct or as position effects caused byendogenous sequences near the insertionsite of the transgene. Interestingly, in sometransgenic lines the reporter is expressed incell populations that do not contain theendogenous product of the gene whosepromoter was used in the construct. Whenthese ectopias are stable throughout subse-quent generations, cell types can be labeledfor which no specific markers are currentlyavailable (15).
Because the fundamental goal of thisapproach is to carry out electrophysiologi-cal recordings in neurons that belong tospecific populations or to study geneexpression at the single-cell level, neuronsmust be identified in the living state.Therefore, an ideal reporter must be eitherspontaneously fluorescent, detected by afluorescent probe, or capable of generatinga fluorescent reaction product. Specificneuronal types become thus visible in theintact tissue, in slices, or after enzymaticdigestion and mechanical trituration of theneural center in which they reside. Further-more, because the data obtained from geneexpression will be used to deduce the func-tion of a neuronal type as a component of anetwork, an ideal marker should be visiblewith both light and electron microscopesand stain neurons in their entirety. Infor-mation about the morphology of the cells(shape and size), their location (position ofcell bodies and processes), and distribution(coverage) can thus be obtained with thelight microscope and integrated with dataon their synaptic connections after a studywith the electron microscope.
Unfortunately, at the state of the art,there is no single reporter that fulfills allthe above requirements. A reporter genefrequently used is LacZ, that codes for theenzyme β-galactosidase (β-gal) (23). Cellsexpressing β-gal become fluorescent in theliving state after incubation with fluores-cein-di-β-D-galactopyranoside, but the
89
7. Gene Expression in Genetically Labeled Single Cells
Merighi7-aucorr.qxd 5/23/02 6:07 PM Page 89

reaction product, fluorescein, leaks out ofthe cell very rapidly. In fixed tissue, theenzyme generates a blue precipitate from ahalogenated indolyl derivative of galactose;perikarya are visible as well as the initialportion of large processes, but neither den-dritic arborizations nor the axon terminalsare stained in their entirety. Furthermore,the product of the histochemical reaction isnot sufficiently electron dense to permitidentification of fine processes with theelectron microscope.
A new fluororogenic substrate for β-lac-tamase has been recently synthesized (40).However, no transgenic mouse line hasbeen produced to date that expresses thisreporter. Furthermore, no substrate is cur-rently available for stable light and electronmicroscope preparations.
A green fluorescent protein (GFP) fromthe jellyfish Aequorea victoria is anothercommonly used reporter (5,36). Its prima-ry sequence was extensively modified foruse in mammals (41). The mutation S65Tgives enhanced brightness and an excita-tion–emission spectrum similar to that offluorescein. Furthermore, translation effi-ciency increased dramatically when thesequence of the cDNA coding region wasadapted to the codon usage of mammals,and a canonical Kozak sequence wasincluded for initiation of translation. Visu-alization of GFP-expressing cells with theelectron microscope must rely on postem-bedding immunocytochemistry, which is aless than ideal way to study the synapticconnections of the stained cells. There arereports that GFP-induced fluorescence canbe efficiently photo-converted, but largeamounts of protein are required. The mainshortcoming of this reporter is that a rela-tively large cytoplasmic concentration isrequired for its detection (105–106 mole-cules/cell), a quantity that is often difficultto obtain when a cell type-specific mam-malian promoter is used. Recently, howev-er, GFP was successfully expressed in trans-
genic mice under the control of a mam-malian promoter in gonadotropin-releasinghormone neurons (33) and in retinaldopaminergic cells (Gustincich and Ravio-la, unpublished results).
PLAP was originally introduced as amarker to follow the fate of progenitorscells in the mouse retina and in otherregions of the central nervous system (13).PLAP is normally present in high concen-tration in the microvilli of the syncytiotro-phoblast, and it is reexpressed ectopicallyin a variety of tumors in the adult. Becauseit is linked to the outer cell surface, it wasexploited for immunodetection of cancercells in patients. Therefore, numerousmonoclonal antibodies exist which recog-nize various antigenic regions of the pro-tein (7). The monoclonal antibody E6,that belongs to the IgG2b, k subtype, wasproduced against butanol-extracted ace-tone-precipitated human placentas and ishighly specific for both native and cDNA-synthesized PLAP protein (3,9,20). As theenzyme is located on the outer surface ofthe cell membrane, PLAP-expressing neu-rons can be identified by immunocyto-chemistry in the living state. Thus, cellscan be harvested for molecular biology andtheir voltage-gated and ligand-gated chan-nels studied with the patch clamp tech-nique. To prevent a secondary antibody toinduce patching and subsequent endocyto-sis of the primary antibody–antigen com-plex, purified E6 was directly coupled tothe monofunctional reactive dye Cy3.The Cy3-conjugated antibody (E6-Cy3)did not significantly cross-link its antigen,because the fluorescent marker neitherformed patches at the cell surface nor wasinternalized by endocytosis in cultured ψ-2-DAP cells, which synthesize humanPLAP as a result of retroviral infection. Incontrast, dramatic endocytosis wasobserved when the cultures were stainedwith polyclonal anti-PLAP antibodies, orwhen incubation with the monoclonal
90
S. Gustincich et al.
Merighi7-aucorr.qxd 5/23/02 6:07 PM Page 90

antibody was followed by treatment withpolyclonal antimouse IgGs. Furthermore,GABA-gated currents were studied inPLAP-carrying rod bipolars and found tobe indistinguishable from those recordedfrom morphologically identified wild-typemouse rod bipolars (16).
Because of its high pH optimum (pH10.0–10.5), PLAP biological activity isprobably minimal in the normal environ-ment of the developing and adult nervoussystems (27,32). We and others haveshown that PLAP ectopic expression inter-feres neither with the development norwith the electrophysiological properties ofvarious neuronal populations (13,16).PLAP is a sturdy enzyme; it is not inacti-vated by fixation with both formaldehydeand low concentrations of glutaraldehyde.Furthermore, in contrast with otherendogenous phosphatases, its activity sur-vives exposure to a temperature of 65°C for30 minutes. Thus, after heat inactivation,only ectopically expressed PLAP is stainedboth at the light and electron microscopesby common histochemical techniques forphosphatase activity. Because of its connec-tion to the bilayer by a glican–inositolphosphate tail, PLAP diffuses throughoutthe neuronal surface. As a result, the prod-uct of the histological reaction outlines theentire neuronal surface; dendritic arborsare stained in their entirety, and axons canbe followed to their termination in distantregions of the brain or body. For the lightmicroscope, a purple product is generatedupon hydrolysis of 5-bromo-4-chloro-3-indolyl phosphate in presence of nitro bluetetrazolium chloride as an electron accep-tor. The histochemical method for electronmicroscopy derives from the old Gomoritechnique, based on the hydrolysis oforganic phosphates in the presence of calci-um ions. With a lead citrate modification,PLAP enzymatic activity generates a densereaction product on the outer aspect of thecell membrane without obscuring the
underlying cytoplasm. Thus, synaptic con-nections can be studied (16,26).
Because of the unique possibility ofusing both immunolabeling and enzymaticreactions, PLAP-carrying neurons cantherefore be identified in the living state formolecular and electrophysiological analysisand, after chemical fixation, for light andelectron microscopic studies.
A Case Study: Dopaminergic AmacrineCells of the Retina
Dopamine (DA) subserves fundamentalfunctions in the nervous system; it facili-tates and controls initiation of movement,regulates reward behaviors and affectivestates, and is involved in the response tostress. Dysfunction of the DA system hasbeen implicated in the neurobiology ofaddictions and in a vast array of clinicalconditions, such as Parkinson’s disease, tar-dive dyskinesia, and schizophrenia. Thus,an understanding of the mechanisms thatcontrol the release of this modulator mayhave important consequences for interven-tions in motor and affective disorders.
In the retina, DA is synthesized by eitheramacrine or interplexiform cells. When thevertebrate retina is illuminated, DA extra-cellular levels increase and modulate manyof the events that lead to neural adaptationto light (39). It has been shown that there isa significant decrease of DA cells in agedhuman and rat retinas compared toyounger individuals. Furthermore, retinalDA cells degenerate in patients affected byParkinson disease, suggesting a commonmechanism of degeneration in mesen-cephalic and retinal DA neurons (10).
DA is the first neuroactive molecule inthe synthetic pathway for catecholamines,and tyrosine hydroxylase (TH) is the rate-limiting enzyme for its synthesis. Immuno-cytochemical detection of TH is the mostsensitive tool to identify DA cells. However,progress in the study of these neurons has
91
7. Gene Expression in Genetically Labeled Single Cells
Merighi7-aucorr.qxd 5/23/02 6:07 PM Page 91

been slow because these cells are very rare(approximately 450 neurons in the mouseretina) and for the lack of reliable methodsto label them in the living state (16,38).
We have exploited the properties ofPLAP to study the dopaminergic neuronsof the mouse retina. To this purpose, welinked its cDNA to a promoter sequence ofthe gene for TH (2). This construct wasintroduced into the mouse genome, and aline of transgenic animals was obtained inwhich PLAP was expressed on the outersurface of the cell membrane of DA cells(16). PLAP-labeled DA cells were studiedwith the light and electron microscopesand, after enzymatic digestion andmechanical trituration of the retina, patchclamped for single-cell RT-PCR studies ofgene expression or for electrophysiologicalexperiments (12,16,17). Thus, their reper-tory of mRNAs could be correlated withtheir physiological properties and withtheir synaptic connections. In this way, alarge amount of information was obtainedon a very rare type of neuron.
In the following sections, we illustratethe techniques to study gene expression ata single-cell level in PLAP-containing neu-rons of transgenic mice. First, we describethe culture conditions of E6-Hy hybrido-ma cells, the purification of E6 antibody,and the coupling reaction to the fluo-rochrome Cy3. Then, we illustrate thepreparation of short-term cultures of soli-tary neurons from adult mouse retinas andthe harvesting of PLAP-expressing cells forsingle-cell RT-PCR. Because we knowfrom immunocytochemistry that the pro-moter of the TH gene directs the expres-sion of PLAP to all neurons of the intactretina which contain TH (16), we analyzedthe presence of TH mRNA by single-cellRT-PCR in solitary dopaminergic neuronsharvested after dissociation and labelingwith E6-Cy3. In the protocol section, wereport the conditions for detecting thistranscript in single cells. In the next sec-
tion, the experimental results are presentedand discussed. They represent a reliablemeasure of the sensitivity and reproducibil-ity of our method for single-cell RT-PCR.We also comment upon results obtainedwith other mRNAs, such as those for theGABAA receptor subunits (17). Further-more, we discuss properties and limits ofthe single-cell RT-PCR technique when itis applied to solitary neurons and to exper-iments of simultaneous detection of severaltranscripts in the same cell.
The characterization of the transgenicmouse used in this study was presentedelsewhere as well as the details on the pro-tocols used for light and electron micro-scopy (16).
PROTOCOLS
Protocol for the Preparation of theAntibody E6-Cy3
We describe here all the steps that leadto the production of E6-Cy3 as they areroutinely carried out in our laboratory,from growing E6-Hy hybridoma cells tothe coupling reaction. Because most ofthem are common knowledge, they can bemodified according to the needs and habitsof each laboratory (18). We recommendthe production of at least 1 L of super-natant to obtain approximately 3 to 5 mgof protein. The step in Ultra Low-IgGmedium is required to avoid copurificationof the antibodies present in the serum.They can in fact cause an inefficient label-ing of the E6 antibody and undesirablenonspecific staining during in vivo experi-ments. The most delicate step is the cou-pling reaction between the amino groupsof the lysines present in the antibody andthe activated groups of the dye. Many fac-tors can affect its efficiency: temperature,buffer, pH, length of time, and the ratiobetween the concentrations of antibody
92
S. Gustincich et al.
Merighi7-aucorr.qxd 5/23/02 6:07 PM Page 92

and dye. After the purification, a dialysisstep is needed to change the buffer solutionfrom Tris-HCl to phosphate to avoid thereaction of the dye with the amino groupscontained in the Tris molecule. The alka-line pH is used to keep all the aminogroups of the protein in the reactive form.We find convenient to lyophilize the anti-body after the dialysis so that its concentra-tion can be optimally adjusted for the cou-pling reaction. The uncoupled E6 can bestored for months at 4°C. It must not befrozen. When 1 mg of E6 is coupled to halftube of Cy3, we obtain approximately 1.5mL of E6-Cy3 antibody that can be storedat 4°C for several months. This sample istested for specificity and brightness on reti-nal sections at 1:1000/1:5000 dilutions,and it is used 1:100 in in vivo experiments.
Materials and Reagents
• HGM (hybridoma growth medium):10% fetal bovine serum, MEM (mini-mum essential medium) sodium pyru-vate 1 mM, L-glutamine 2 mM, peni-cillin 100 U/mL, streptomycinsulphate 100 µg/mL in RPMI 1640(all from Life Technologies, Gaithers-burg, MD, USA).
• AHM (antibody harvesting medium):10% Ultra Low IgG fetal bovineserum, MEM sodium pyruvate 1 mM,L-glutamine 2 mM, penicillin 100U/mL, streptomycin sulphate 100µg/mL in RPMI 1640 (all from LifeTechnologies).
• Protein A Sepharose® 4 Fast Flow(Amersham Pharmacia Biotech, Pis-cataway, NJ, USA).
• 1 M Tris-HCl, pH 8.0 (autoclaved).• 10 Kd cutoff Slide-A-Lyzer dialysis
cassettes (Pierce Chemical, Rockford,IL, USA).
• Glycine 0.1 M, pH 2.5 (filtered).
• Carbonate buffer 1 M, pH 9.3 (fil-tered).
• Monofunctional Cy3 dye (AmershamPharmacia Biotech).
• G25 Sepharose (Amersham PharmaciaBiotech).
Procedure
Culturing Hybridoma Cells andHarvesting the Antibody
1. Resuspend cells from the cryotube in10 mL HGM. Spin for 5 minutes at400× g. Discard supernatant. Resus-pend pellet in 10 mL HGM. Spinagain for 5 minutes at 400× g. Discardsupernatant. Resuspend pellet in 5 mLHGM. Take 100 µL and measure cellconcentration with the Trypan blueexclusion method: refringent cells alive,blue cells dead. Add HGM to an opti-mal concentration of 2 x 10⁵ cells/mL.Incubate the flasks at 37°C in 5%CO2, 95% O2 atmosphere.
2. Count the number of cells regularly.The culture must be kept at a concen-tration between 105 and 106 cells/mL(3–4 days) and should never exceed106 cells/mL. E6 hybridoma cells tendto stick to the bottom of the flask;shake it vigorously when cells are col-lected for counting or splitting.
3. Expand the culture to a volume of 100mL with a concentration of 106
cells/mL. Cells are then collected andspun for 5 minutes at 400× g. Discardthe supernatant. Resuspend 108 cells in1 L of AHM (105 cells/mL). Countcell concentration every day. When theculture reaches 106 cells/mL, incubatethe culture for 2 more days.
4. Collect the medium. Spin for 15 min-utes at 1000× g. Pool the supernatant(1 L), add 0.1% sodium azide, and
93
7. Gene Expression in Genetically Labeled Single Cells
Merighi7-aucorr.qxd 5/23/02 6:07 PM Page 93

store at 4°C.
Purification of the Antibody
1. Wash 1 mL of Protein A Sepharose 4Fast Flow with 10 mL 0.1 M Tris-HCl,pH 8.0 (1 mL drained resin binds 35mg human IgG). Repeat twice.
2. Insert a piece of packing foam at thebottom of a 20-mL sterile syringe(check the flow with water) and mountthe syringe as a chromatography col-umn. Wash with water. Resuspend theresin in 10 mL 0.1 M Tris-HCl, pH8.0 and gently add it to the syringe.Wash the column with 40 mL of 0.1M Tris-HCl, pH 8.0.
3. Add 110 mL 1 M Tris-HCl, pH 8.0 tothe 1 L of supernatant (note the changein color). Before the resin dries, add 10mL of the supernantant/Tris solutionto the column.
4. Close the mouth of the syringe with arubber stopper. This must have a holethrough which a plastic tube is insert-ed. The other end of the tube is sub-merged in a bottle containing thesupernatant/Tris solution. Raise thebottle to fill the syringe and keepadjusting the height so that the fluid inthe syringe does not overflow.
5. Pass all the supernatant/Tris solutionthrough the column twice (24–36 h).Note: Never let the column dry up.
6. When all the supernatant/Tris solutionhas passed through the column, add 2x 20 mL of 0.1 M Tris-HCl, pH 8.0.Then, add 2 x 20 mL of 10 mM Tris-HCl, pH 8.0.
7. Let the fluid sink to the top level of theresin and add 0.1 M glycine, pH 2.5,in small aliquots. Recover approxi-mately 900-µL aliquots of eluted solu-tion in microfuge tubes containing 100µL of 1 M Tris-HCl, pH 8.0. Collect10 aliquots and store them at 4°C.
8. Regenerate the column with 2 addi-tional washes of 20 mL each of 0.1 Mglycine, pH 2.5, and resuspend theresin in 10 mL water. Wash it twice ina Falcon® tube (Becton Dickinson,Bedford, MA, USA) and store it at4°C.
Electrophoresis, SpectrophotometricReading, and Dialysis
We usually carry out polyacrylamide gelelectrophoresis on 2 µL of each aliquot(18). After the gel is stained withCoomassie® blue, the aliquots that containthe antibody are pooled. The antibodysolution is then dialyzed for at least 48hours against phosphate-buffered saline(PBS) in a 10 Kd cutoff Slide-A-Lyzer dial-ysis cassette. The buffer is changed at leasttwice a day. The solution is then collected,and the protein concentration is measuredwith a spectrophotometer, reading theabsorbance at 280 nm. The antibody isthen lyophilized to a concentration of atleast 1.5 mg/mL.
Coupling
1. Prepare 1 mg of dialyzed antibody in700 µL PBS.
2. Add 100 µL of 1 M carbonate buffer,pH 9.3.
3. Dissolve the content of a single tube ofCy3 dye in 400 µL of PBS. Take 200µL and add them to the antibody solu-tion. Wrap the tube in aluminum foiland stir by rotation for 30 minutes at30°C.
4. Put the tube on ice.5. During the reaction, prepare the seph-
arose column. Suspend the G25 resinin an equal volume of PBS to a finalvolume of 50 mL. Pour the resuspend-ed resin into a 50-mL Falcon tube andwash it with PBS. Spin down for 1
94
S. Gustincich et al.
Merighi7-aucorr.qxd 5/23/02 6:07 PM Page 94

minute at 400× g. Repeat twice. Pre-pare a 10-mL sterile syringe with foamat the nipple (check the flow by addingwater), and mount it as a chromatogra-phy column. Wash with water. Resus-pend the resin in 25 mL of PBS andgently add aliquots to the syringe.When an approximate 8-mL resin col-umn has formed, continue to add PBSuntil the coupling reaction is complete.
6. Before the resin dries, add the antibodysolution. After the entire sample hasentered the column, add 100-µL ali-quots of PBS. When a dye-free upperportion of the column becomes visible,fill the syringe with PBS. During chro-matography, two thick red bands willbecome visible. Collect, in an Eppen-dorf® tube, the volume containing thebottom band.
7. Store the E6-Cy3 antibody at 4°C in atube wrapped in aluminum foil.
Protocol for Dissociation of the Retinaand Harvesting of Neurons
This protocol has been optimized todetect a very small population of neuronsthat are located in the middle of the retina;DA cell bodies occupy the most vitreal tierof the inner nuclear layer (INL) and thedendrites spread in the stratum S1 of theinner plexiform layer (16). The proceduremust be drastic enough to free these cellsfrom the surrounding tissue, but it shouldnot compromise their viability, and itshould preserve some of the dendrites forthe study of postsynaptic receptors. It isespecially important that PLAP at the cellsurface is not completely digested;although the dissociated cells are never asintensely stained as in the intact retina,enough enzyme must survive papain diges-tion to permit easy identification of thelabeled neurons.
Papain probably acts only at the inner
and outer limiting membranes of the reti-na; therefore, the enzymatic digestion mustbe followed by trituration (21).
Because DA cells are very rare, the entirecell suspension must be plated. We usuallydistribute our preparation among 6 smallpetri dishes. We can detect an average of 5DA cells per petri dish in a carpet of thou-sands of unlabeled neurons. Thirty min-utes are the minimum amount of time toallow the solitary neurons to sediment onthe glass coverslip at the bottom of thedish. The dishes must be pretreated for atleast 1 hour with a solution of concavalinA to promote cell adhesion to the glass.
For single-cell RT-PCR experiments onother retinal cell types, the dissociationprocedure has to be modified. Rods, rodbipolars, and ganglion cells are morenumerous than DA cells and probably eas-ier to obtain by dissociation of the retina.Best results are obtained by decreasing thedigestion step to 20 min and limiting thenumber of trituration events. For neuronsof the central nervous system, the dissocia-tion is carried out on vibratome sections.After trituration, we centrifuge only thesupernatant, discarding the fragments thatfall at the bottom of the tube. The solitaryneurons are then plated at the lowest con-centration possible taking into account thefrequency of the cell type of interest. Wewere not successful with protocols thatinclude an incubation step in a very lowamount of calcium ions. Furthermore,such treatment may have undesirableeffects on gene expression.
When harvesting neurons for single-cellRT-PCR experiments, our main concern isthe preservation of the integrity of themRNA and the elimination of RNA origi-nating from other cells or cDNA contami-nants present in the laboratory. Recordingchambers are washed with hydrogen perox-ide prior to concavalin A treatment; aere-osol-resistant pipet tips, tubes, and glass forelectrodes are autoclaved; reagents are
95
7. Gene Expression in Genetically Labeled Single Cells
Merighi7-aucorr.qxd 5/23/02 6:07 PM Page 95

stored at -20°C in single-use aliquots. Cellsare harvested, and solutions are prepared inrooms that are different from the laborato-ry in which the PCRs and agarose gel elec-trophoresis are carried out. We pretreat theelectrodes with dimethyl-chloro-sylane todecrease the affinity of the glass for theRNA present in the medium. Further-more, we apply positive pressure to thesolution within the electrode from themoment this is immersed into the bath anduntil it touches the cell membrane. Afterthe seal is formed, we monitor its resistancethroughout the harvesting procedure tocontrol its integrity. The cell is then liftedand positioned in front of a flux of freshextracellular solution for 1 min. All theseoperations occur under constant visualcontrol (17).
In the literature, neurons floating in themedium have been collected for single-cellRT-PCR using a large-bore suction pipet.This technique can only be applied whenthe tissue of interest contains a nearlyhomogeneous cell population or the celltype under study can be easily recognizedon account of its shape. Furthermore, thecollection must be fast, because of the highmortality of the cells when they do notadhere to a solid substrate. More impor-tantly, the probability that undesirable cellsor cellular debris are sucked into the pipetis very high.
We find it convenient to carry outcDNA synthesis and PCR amplification ina day different from that of harvesting.Therefore, we store single cells at -80°C inthe presence of RNase inhibitor. This pro-cedure also decreases the chances of conta-mination. Lysis of the neurons takes placewhen they are thawed.
Alternatively, the harvested cells can bemomentarily kept on ice in a solution con-taining RNase inhibitor and the detergentNonidet® P-40 (NP40), which lyses onlythe plasma membrane without affecting thenuclear envelope. Furthermore, 0.5%
NP40 does not inhibit reverse transcriptase.
Materials and Reagents
• Coating solution: concavalin A(Sigma, St. Louis, MO, USA) 1mg/mL in PBS, prepared fresh.
• EBSS medium: (Earle’s Balanced SaltSolution; Sigma) enriched with glu-cose (10 mg/mL).
• 10× Papain-activating stock solution:1 mM L-cysteine, 0.5 mM EDTA inEBSS medium, stored in 500-µLaliquots at -20°C.
• 20× DNase I stock solution: 200U/mL DNase I (Worthington Bio-chemical, Lakewood, NJ, USA) inEBSS medium, stored in 500-µLaliquots at -80°C.
• Digestion buffer: 20 U/mL papain(Worthington Biochemical) in 5 mLof EBSS medium containing 1×papain-activating solution and 1×DNase I solution.
• 10× OVOBSA stock solution: 1mg/mL ovomucoid inhibitor (Wor-thington Biochemical) and 1 mg/mLbovine serum albumin (Sigma) inEBSS medium, stored in 500-µLaliquots at 4°C.
• Trituration buffer: 5 mL of EBSSmedium containing 1× DNase I solu-tion and 1× OVOBSA solution.
• MEM (Sigma).• Extracellular solution: NaCl 137 mM,
KCl 5.4 mM, CaCl2 1.8 mM, MgCl21 mM. 4-(2-hydroxethyl)-1-pipera-zineethanesulfonic acid (HEPES) 5mM, glucose 20 mM. Autoclaved andstored at 4°C.
• Intracellular (electrode) solution: KCl130 mM, EGTA 0.5 mM in HEPES10 mM, pH 7.4. Autoclaved andstored at 4°C.
96
S. Gustincich et al.
Merighi7-aucorr.qxd 5/23/02 6:07 PM Page 96

• Electrodes: borosilicate glass electrodes(1.65 mm OD, 1.2 mm ID; A-M Sys-tems, Carlsborg, WA, USA) areimmersed in a 5% solution ofdimethyl-chloro-sylane (Sigma) inchloroform for at least 1 hour. Theyare then carefully washed, baked at80°C overnight, and autoclaved. Patchpipets are constructed using a horizon-tal 2-stage electrode puller (BB-CH,Mecanex, Geneva, Switzerland); theelectrode resistance ranges from 5 to 7MΩ. Electrodes are connected to theamplifier via an Ag/AgCl wire. Theelectrode holder and the headstage aremounted on a piezoelectric remote-controlled device attached to a tridi-mensional micromanipulator (Bur-leigh Instruments, Fishers, NY, USA).The intracellular solution is filteredand loaded into the electrode.
• Harvesting solution: 2 µL contains 0.4µL of 5× first-strand buffer (KCl 375mM, MgCl2 15 mM, Tris-HCl 250mM, pH 8.3), 10 mM dithiothreitol(DTT) and 4 U RNAGUARD(Amersham Pharmacia Biotech).
Procedure
Dissociation of the Retina
1. Eyes are enucleated from anesthetized,1 to 6-month-old mice and opened atthe equator. After removal of cornea,lens, and vitreous body, the eyecups aretransferred to a petri dish containingEBSS and cut in half. The 4 specimenare then moved into a 10-mL Falcontube containing 5 mL of digestionbuffer and incubated for 40 minutes at37°C with gentle agitation. Prior touse, the enzyme is activated for 30minutes at 37°C by adding 20 U/mLpapain to 1× papain-activating solu-tion. At the moment of immersing thespecimens, the digestion buffer is com-
pleted by adding an equal amount of1× DNase I stock solution.
2. At the end of the digestion, eyecups aretransferred into a petri dish containing2 mL of trituration buffer. The retinasare carefully detached from the pig-ment epithelium and moved to a Fal-con tube containing 1 mL of fresh trit-uration buffer. For trituration, they areslowly sucked into and immediatelyexpelled from a fire-polished Pasteurpipet and this process is repeated about10 times. The supernatant containing asuspension of dissociated cells is trans-ferred into a new Falcon tube. Theremaining retinal pieces are resuspend-ed in 1 mL of trituration buffer andtriturated 5 more times using a Pasteurpipet whose bore had been reduced byfire polishing.
3. Cell suspensions are pooled and cen-trifuged at 1000 rpm for 5 minutes.The pellet is then resuspended in 2 mLMEM. The antibody E6-Cy3 is diluted1:200 in 2 mL MEM, and this solutionis added to the cell suspension.
4. Aliquots of the cell suspension aredeposited in the recording chambers.These are prepared by machining ahole 20 mm in diameter in the bottomof a 35-mm petri dish and gluing a cir-cular glass coverslip 25 mm in diameterto the margin of the hole with Sylgard184 (Dow Corning, Midland, MI,USA). Finally, the surface of the cover-slip is treated with concanavalin Asolution for at least 1 hour prior totransfer of the cell suspension. The reti-nal neurons are allowed to sediment onthe glass for 30 minutes at 37°C in 5%CO2, 95% O2 atmosphere.
Harvesting of Neurons
1. Thirty minutes after plating, cells arewashed 5 times and kept in the extra-cellular solution for the rest of the
97
7. Gene Expression in Genetically Labeled Single Cells
Merighi7-aucorr.qxd 5/23/02 6:07 PM Page 97

experiment. After positioning therecording chamber on the stage of aninverted microscope, E6-Cy3-stainedneurons are identified by scanning thecoverslip in epifluorescence (535 nmexcitation filter; 610 nm barrier filter).Immediately after cell identification,the UV beam is turned off, and the restof the procedure is carried out in visi-ble light with Nomarski optics.
2. When the patch pipet is immersed intothe bath, positive pressure is continu-ously applied to the fluid within toavoid entry of cellular debris. Aftergigaseal formation on the surface of theneuron and disruption of the patchmembrane, the cellular contents areaspirated into the pipet by gentlyapplying negative pressure until theresidual cell ghost became stuck to thepipet tip. The electrode is then posi-tioned in front of a perfusion tube withan internal diameter of 0.5 mm. Thecell is washed for 1 min with freshextracellular solution applied by pres-sure ejection. The electrode is then lift-ed from the bath and removed fromthe holder.
3. The tip of the pipet is finally brokeninto an Eppendorf tube containing 2µL of harvesting solution. After briefcentrifugation, the tube is frozen ondry ice and stored at -80°C. Harvestinglasts from 30 to 90 minutes from thetime of plating.
Protocol for Single-Cell RT-PCR
Our protocol consists of a random-primed cDNA synthesis step followed by 2successive rounds of PCR (Figure 1) (17).The first amplification reaction occurs inpresence of forward (F) and reverse (R)primers, whereas in the second round, twoprimers internal to the first amplificationproduct (FN and RN, N for nested) areused to increase specificity. Primer sequen-
ces are located in different exons to avoidamplification of genomic DNA and are alldesigned to anneal at 55°C (first round) or60°C (second round), so that differentcDNAs can be amplified together in a sin-gle multiplex experiment. Primers are usu-ally 22 to 24 nucleotides long with aguanosine and cytosine content of 50% to60%. 5′ and 3′ end of the primers are notcomplementary to prevent the formationof hairpins or primer dimers. The ampli-fied fragment must be kept short, prefer-ably in the range of 150 to 400 bp. Eachcouple of primers is first tested in a RT-PCR experiment from 100 ng of retinatotal RNA. These amplifications are car-ried out for 40 cycles at the appropriateannealing temperature. The RT-PCR prod-ucts are digested with suitable restrictionenzymes to confirm specificity. RNA-dependency of the amplification is estab-lished by omitting RT during first-strandcDNA synthesis.
Neurons of interest, bystander cells andcontrols (supernatant and first-strand mix-ture in absence of a cell) are examinedsimultaneously in each experiment. Fur-thermore, six is the highest number of cellsthat are analyzed at any given time to min-imize contamination.
The repertory of PCR products shouldbe the same when the number of cycles isincreased from 28 + 30 cycles to 40 + 35cycles. However, the number of cyclesmust be kept as low as possible to avoidcontamination and increase in number ofnonspecific signals.
The number of cycles required, howev-er, depends on a variety of factors, butespecially the abundance of the amplifiedtranscript. In most cases, a single round of40 cycles is sufficient.
Many different RT-PCR strategies arereported in the literature. The first-strandsynthesis can be directed by oligo(dT)primers, random examers or antisenseprimers that recognize specific target
98
S. Gustincich et al.
Merighi7-aucorr.qxd 5/23/02 6:07 PM Page 98

sequences. The cDNA thus obtained canthen be amplified with specific primers fora single-round PCR or with two-roundPCR, where the first amplification occursin presence of degenerated oligonucleotidesand the second with primers specific forthe various transcripts.
Several methods of detection have beenemployed, including ethidium bromidestaining, Southern blotting, and directautoradiography of the amplified bandsthrough incorporation of a radioactivenucleotide or primer in the PCR.
Materials and Reagents
• First-strand mixture: 18 µL contain3.6 µL of 5× first-strand buffer (KCl375 mM, MgCl2 15 mM, Tris-HCl250 mM, pH 8.3); 36 U RNA-GUARD; 4 ng Pd(N)6, 1 mM eachdNTPs (from Amersham PharmaciaBiotech), 4 mM DTT, 200 U ReverseTranscriptase SUPERSCRIPT II H-(both from Life Technologies).
• Primers: for the amplification of THmRNA, first-round F primer was 5′-CTGGCCTTCCGTGTGTTTCAG-TG-3′, which hybridizes with THcDNA at nt 915 (GenBank® AccessionNo. M69200), and the correspondingR primer was 5′-CCGGCTGGTA-GGTTTGATCTTGG-3′, which hy-bridizes with TH cDNA at nt 1296.The first-round RT-PCR product was382 bp long. The second-round FNprimer was 5′-AGTGCACACAGTA-CATCCGTCAT-3′, which hybridizeswith TH cDNA at nt 934, and the cor-responding RN primer was 5′-GC-TGGTAGGTTTGATCTTGGTA-3′,which hybridizes with TH cDNA at nt1293. The final nested RT-PCR prod-uct was 360 bp long and contained aunique SacI site.
• First-round PCR mixture: 80 µL con-tains 10 µL of 10× RT-PCR buffer (KCl
350 mM, MgCl2 9 mM, Tris-HCl 100mM, pH 8.3), 40 pM each F and Rprimers, 1 U Taq DNA polymerase(Roche Molecular Biochemicals).
• Second-round PCR mixture: 49 µLcontains 5 µL of 10× PCR buffer (KCl500 mM, MgCl2 15 mM, Tris-HCl100 mM, pH 8.3), 200 µM eachdNTPs, 20 pM each FN and RNprimers, 1 U Taq DNA polymerase.
• QIAquick gel extraction kit (Qia-gen, Valencia, CA, USA).
• Original TA Cloning® Kit (Invitro-gen, Carlsbad, CA, USA).
Procedure
First-Strand cDNA Synthesis
1. Tubes containing single cells are incu-bated for 1 minute 30 seconds at 65°C.
2. After cooling in ice for 2 minutes, 18µL of First Strand Reaction Mixture isadded to each tube, and first-strandcDNA is synthesized at 42°C for 1hour. At the end of the reaction, tubesare cooled on ice.
Two Rounds PCR
Here, we describe the procedure that weused for amplification of TH mRNA. 1. Eighty microliters of the first-round
PCR mixture are added to the tubes.First-round amplification comprises: 2minutes 30 seconds at 94°C; 10 cycleseach consisting of 30 seconds at 94°C,30 seconds at 55°C, and 1 minute at72°C; 18 cycles each consisting of 30seconds at 94°C, 30 seconds at 55°C,and 1 minute at 72°C, with a 5 secondextension time added to the final stepof each cycle beginning from the sec-ond cycle; 10 minutes at 72°C.
2. One microliter of the first-round PCRproducts is used as a template for
99
7. Gene Expression in Genetically Labeled Single Cells
Merighi7-aucorr.qxd 5/23/02 6:07 PM Page 99

second-round PCRs and mixed with49 µL of the second-round PCR mix-ture solution. Amplification is carriedout as following: 2 minutes 30 secondsat 94°C; 10 cycles each consisting of 30seconds at 94°C, 30 seconds at 60°C,and 1 minute at 72°C; 20 cycles eachconsisting of 30 seconds at 94°C, 30seconds at 60°C, and 1 minute at72°C, with a 5 second extension timeadded to the final step of each cyclebeginning from the second cycle.
Analysis of the Results
1. Ten microliters of the second-roundPCR products are analyzed by elec-trophoresis in 1% Seakem® GTG®
and 1% NuSieve® GTG agarose(FMC BioProducts, Rockland, ME,USA), containing 0.5 µg/mL ethidiumbromide.
2. The remaining PCR products are puri-fied and desalted using the Qiagen kit.DNA is then digested with SacI tocheck for specificity.
3. When the experiments at the single-celllevel are completed, a single-cell RT-PCR product is cloned into the pCR-IIvector by using the Original TACloning Kit. Both strands are sequencedusing the dideoxy-chain terminationmethod. DNA similarities are examinedby matching the query sequence todatabase entries using the basic localalignment search tool (BLAST) algo-rithm. We rigorously avoided cloningthe PCR fragments before the end ofthe single-cell RT-PCR experiments,because the presence of a recombinantsequence in the laboratory increases thepossibility of contamination.
RESULTS AND DISCUSSION
E6-Hy hybridoma cells were grown
until they reached a concentration of 106
cells/mL in 1 L of AHM. The supernatantwas collected, and the E6 antibody waspurified with a protein A-sepharose col-umn. After a 2-day dialysis, the antibodywas concentrated to 2 mg/mL. One mil-ligram of E6 was coupled to half the tubeof monofunctional Cy3, and the E6-Cy3antibody was collected from a G25 chro-matography column.
Staining (1:1000) of cryostat sections ofthe retina of the transgenic animals showedthat all cells positive to the histochemicalmethod for PLAP activity were also stainedby E6-Cy3 and immunoreactive for TH(Figures 2 and 3).
After enzymatic digestion and mechani-cal trituration of the transgenic retina, DAneurons were identified in the living stateafter staining with E6-Cy3 (Figure 3,inset). After establishing giga-seal with apatch electrode, the cell was harvested intothe pipet by applying negative pressure andwashed with fresh extracellular solution.The tip of the pipet was then broken into aPCR tube containing RNase inhibitor andstored. Large unlabeled neurons, possiblyganglion cells, were also collected for fur-ther analysis. During cell harvest, a sampleof the supernatant in the recording cham-ber was collected and used as a control torule out amplification of mRNA fromfloating or dead cells.
Single neurons were then denatured,and first-strand cDNA was synthesizedfrom each of them in the presence of ran-dom primers. Another control reaction wascarried out in the absence of a cell. ThecDNAs were in turn the template for tworounds of PCR, and the PCR productswere finally analyzed by restriction enzymedigestion and agarose gel electrophoresis.
A 360-bp product specific for the THtranscript was amplified in 23 out of 28labeled cells (82%), whereas unlabeled neu-rons were consistently negative (Figure 4).An aliquot of the reaction products from
100
S. Gustincich et al.
Merighi7-aucorr.qxd 5/23/02 6:07 PM Page 100

labeled cells was purified and cut with SacIto prove the specificity of the amplification.As expected, the digestion with this restric-tion enzyme produced fragments of 271 and89 bp (Figure 4). When the experiments at
the single-cell level were completed, a single-cell RT-PCR product was cloned andsequenced to confirm its identity.
The combination of transgenic technol-ogy with single-cell RT-PCR proved to be a
101
7. Gene Expression in Genetically Labeled Single Cells
Figure 1. Flow chart of a single-cell RT-PCR experiment on genetically labeled solitary neurons.
Merighi7-aucorr.qxd 5/23/02 6:07 PM Page 101

powerful tool to detect gene expression in avery small cell population; DA cells repre-sent in fact less than 0.005% of the neu-rons of the mouse retina.
We know from immunocytochemistrythat in the retina of this transgenic mouseline, all PLAP-expressing neurons containTH (16). Therefore, the proportion of sin-gle cells that yielded a specific amplifica-tion product represents an estimate of theefficiency of our single-cell RT-PCR tech-nique (82%). Either loss of the cell, deteri-oration of the message, or inefficientamplification easily explains failures. Thesedata must be taken into account when noamplification product is obtained with apair of primers specific for other messages.
Negative results should be consideredwith caution, because the sensitivity of thetechnique remains to be determined. Har-vesting efficiency and integrity of themRNA cannot be measured for every cell,and the PCR itself is susceptible to a cer-tain amount of internal variability.
With a technique based on processingindividual cells and in absence of false pos-itive results, we have adopted a rate of suc-cess higher than 70% as an indication thata given gene was expressed throughout anentire neuronal population.
Theoretically, the simultaneous amplifi-cation of the gene of interest and another,high-abundance gene would confirm thespecificity of the reaction. However, weconsistently failed in our effort to demon-strate in the very same cell the presence ofmessages for both TH and less abundanttranscripts such as those for the GABAAreceptor subunits. Amplification of thesubunit mRNAs was, in fact, competitivelysuppressed by the reaction for TH.
Because we have previously shown thatDA cells express GABAA receptors, the sin-gle-cell RT-PCR technique was applied toa study of the subunit composition of thisligand-gated channel (16,17). At least 10DA cells were individually examined for
each of the 13 GABAA subunit transcriptsfor a total of 161 cells. DA cells expressmRNA for the α1, α3, α4, β1, β3, γ1,γ2S, and γ2L subunits. All these subunitmRNAs were successfully detected in atleast 70% of the cells tested. Messages forthe α2, α5, β2, γ3, δ, and ε subunits werenot detected in DA cells. To confirm thatthe absence of these subunit transcripts wasnot due to low sensitivity of our technique,we showed that they were present in unla-beled bystander neurons.
Then, we examined whether all DA cellscontained the 7 GABAA receptor subunittranscripts, or they could be assigned to sub-populations each expressing a differentrepertory of GABAA receptor mRNAs. Tothis purpose, we resorted to multiplex semi-nested RT-PCR; in this method, first-strandcDNA was synthesized from single cells andamplified in the presence of primers for allsubunit transcripts detected previously.Then, the product of the first-round ampli-fication was distributed among 7 differentsecond-round reactions, each specific for asingle subunit cDNA. Seven DA cells wereexamined, and 4 of them contained thetranscripts of all 7 subunits. In 3 cells, thereaction failed, and we did not obtain anyPCR product. Large unlabeled neurons,possibly ganglion cells, expressed differentrepertories of subunit mRNAs.
Because little is known of the turnoverof mRNAs in intact organs or after dissoci-ation, we were concerned that our findingsin the isolated cells did not reflect the truesituation in the intact retina. Especiallyworrisome, in this respect, was the suppres-sion of synaptic inputs that could alter theexpression of postsynaptic receptor genes.Our approach to this problem was twofold.First, we investigated whether the repertoryof transcripts varied over time; we began toobserve loss of some of the messengers at 4hours 30 minutes. As a result, cell harvest-ing was limited to the first 90 minutes afterdissociation. To test whether the experi-
102
S. Gustincich et al.
Merighi7-aucorr.qxd 5/23/02 6:07 PM Page 102
mental conditions induced a new patternof gene expression, we shut off de novotranscription immediately after triturationby blocking the activity of RNA poly-merase II with α-amanitin. Multiplex sem-inested RT-PCR analysis proved that thepattern of gene expression remained thesame after inhibition of mRNA synthesis.Immunocytochemistry with subunit-spe-cific antibodies showed that all subunitsdetected by RT-PCR after dissociationwere expressed in the intact retina (17).
These findings prove that single-cell RT-PCR on solitary neurons is a reliablemethod to study gene expression in a spe-cific cell population of the adult brain.When carried out in combination with aphysiological analysis by patch clamping, itwill speed up and focus the biophysical andpharmacological research and elucidate themolecular species responsible for the cells’behavior. On the other hand, genetic label-ing permits the study of types of neuronsthat cannot be recognized on the basis oftheir shape or size. These new data willaddress the role of these cell types in thecomputations carried out by the neuralnetworks of which they are components.
TROUBLESHOOTING
Staining with the E6-Cy3 Antibody
After the coupling reaction, a new E6-Cy3 preparation must be tested at adilution of 1:1000 on brain sections oftransgenic mice containing the PLAP-expressing cells of interest. Two problemsmay arise: (i) nonspecific staining of cellsthat do not express PLAP; and (ii) PLAP-expressing cells are not labeled, or they areweakly stained. E6 is very sensitive to over-coupling, and, for this reason, we use halfof the quantity of the dye which is recom-mended by the manufacturer. When theantibody is over-coupled, it usually loses
specificity, and in mouse retinal sections itreacts intensely with nuclei in the INL. Forthis reason, we recommended the purifica-tion of adequate amounts of antibody. Thecoupling reaction can then be repeatedwith decreasing quantity of dye until spe-cific staining is obtained. On the otherhand, when the antibody is insufficientlycoupled, it does not stain adequatelyPLAP-expressing cells in vivo. This may becaused by copurification of large quantitiesof protein from the hybridoma supernatant(a remedy would be to use the Ultra LowIgG fetal bovine serum), presence of Tris-HCl in the buffer (a remedy would be dial-ysis for 2 additional days), denaturation ofthe antibody during the coupling (test theE6 batch at a dilution of 1:1000 on brainsections followed by an antimouse sec-ondary).
When the batch of E6-Cy3 is satisfacto-ry, many other factors may influence thestaining of cells after dissociation. If thestaining is weak or absent, the antibodymay be old, and it should be tested on sec-tions. Papain must be washed very careful-ly after the digestion step during the disso-ciation because contaminant traces of theenzyme may degrade the antibody. If non-specific staining is observed, the quality ofthe dissociation may be poor, for dead cellsbind the antibody. Alternatively, papainhas completely digested the PLAP presentat the neuronal surface; then, the concen-tration of the enzyme must be decreased orthe incubation time shortened.
Neuronal Viability in Short-TermCultures
The presence of a high number of cellswith well-preserved processes is an indicatorof the good quality of the dissociation. Thenumber of trituration events and the lengthof the incubation in papain are crucial stepsto obtain optimal results. Furthermore,results can vary with the different batches of
103
7. Gene Expression in Genetically Labeled Single Cells
Merighi7-aucorr.qxd 5/23/02 6:07 PM Page 103

the enzyme provided by the manufacturer.When the quality of the dissociation deteri-orates, papain is the prime suspect. If thechange of papain has no effects, we makenew petri dishes; repeated use of the samedishes or lack of appropriate care in han-dling them can cause the accumulation ofundesired contaminants. When this occurs,differences in cells’ viability between dishesare observed. If the problem persists, weprepare new media carefully, avoiding heavymetal contamination.
Absence of Single-Cell RT-PCR Products
The failure of obtaining single-cell RT-PCR products is a common outcome whena new cell type or a new transcript is stud-ied. Furthermore, it may occasionally hap-pen even when the protocol is normally suc-cessful. Most common causes are: (i) the
experiment was not carried out in anRNase-free environment; (ii) reverse tran-scriptase did not work properly; (iii) primerswere degraded; and (iv) cells were dying.The standard requirements when workingwith RNA are familiar to molecular biolo-gists. Recording chambers must be washedwith hydrogen peroxide, tubes and glass forelectrodes must be baked or autoclaved, andgloves must always be worn. The reversetranscriptase is stored in a StrataCooler®
(Stratagene, La Jolla, CA, USA) and is han-dled very gently. Primers are stored at -20°Cin single-use aliquots to avoid degradationby repeated freezing and thawing. When anew experiment is designed, primers andPCR conditions must be tested first on 100ng of total RNA from the tissue of interest.Finally, cells must be harvested during thefirst hour after plating only from optimalpreparations.
104
S. Gustincich et al.
Figure 2. Retinal dopaminergic neurons express PLAP. In the retina of a mouse line that carries PLAP cDNA linked to the promoterfor TH, type I catecholaminergic cells express PLAP. In a vertical section of the retina, a neuron is positive to the histochemical reac-tion for PLAP activity (top panel) that exhibits TH-like immunoreactivity (bottom panel) (adapted from Reference 16).
Merighi7-aucorr.qxd 5/23/02 6:07 PM Page 104

105
7. Gene Expression in Genetically Labeled Single Cells
Figure 3. E6-Cy3 specifically stains PLAP-expressing neurons. A monoclonal antibody for PLAP (E6), conjugated to Cy3 (E6-Cy3),is specific for DA cells, because the very cells that are stained by the histochemical method for PLAP (top panel) also bind E6-Cy3 (bot-tom panel). Inset: solitary DA cells are identified in the living state by staining with the E6-Cy3 antibody (adapted from Reference 16).
Merighi7-aucorr.qxd 5/23/02 6:07 PM Page 105

Nonspecific RT-PCR Products
Nonspecific bands commonly appearwhen no target template is present in thereaction mixture. Nonspecific bands mayalso be associated with the specific amplifi-cation product. In this case, the number ofcycles should be reduced, or the sequenceof the primers should be changed.
RT-PCR Products in the ControlReaction
There are three major sources of conta-mination: (i) mRNA from dead cells pre-sent in the medium of the short-term cul-ture is accidentally collected during cellharvesting; (ii) template DNA is present inthe tube as a result of cross-contaminationduring handling of the RT-PCR reactions;and (iii) PCR products of previous reac-tions are reamplified.
To avoid collection of contaminatingmRNA from the medium, cells must bewashed several times with extracellularsolution before harvesting. Electrodes must
be pretreated with sylane. Positive pressureis applied to the solution within the elec-trode from the moment this is immersedinto the bath and until it touches the cellmembrane. After the seal is formed, theresistance must be continuously moni-tored, and all operations must occur underconstant visual control. Cells must bewashed for 1 min with fresh extracellularsolution. If the seal is poor, cells are dis-carded. Cells are harvested only when thedissociation is satisfactory. When the disso-ciation is poor, the percentage of dead cellsis very high, and it is difficult to achieve agood seal, thus increasing the possibility ofcontamination. An aliquot of the mediumis always collected and processed in paral-lel.
During the single-cell RT-PCR, glovesare the most common source of contami-nation. This occurs when tubes are opened.
Because single-cell RT-PCR is a verysensitive technique, amplification of PCRproducts from previous experiments can bea problem. With no exception, cells areharvested and solutions prepared in rooms
106
S. Gustincich et al.
Figure 4. Single-cell RT-PCR.Ethidium-stained agarose gel elec-trophoresis of single-cell RT-PCRsfor TH transcript. Lane 1, a singleDA cell; lane 2, an unlabeled cell;lane 3, a control reaction where thecell was omitted; lane 4, SacI diges-tion of the products of lane 1.Markers are molecular weights VI(from Roche Molecular Biochemi-cals). A single 360-bp product is vis-ible in lane 1. A restriction enzymedigestion produces fragments of 271and 89 bp, confirming the identityof the amplified band.
Merighi7-aucorr.qxd 5/23/02 6:07 PM Page 106

that are different from the laboratory inwhich PCRs are carried out. The analysisof the results is carried out in a third area.We strongly suggest the cloning of thePCR products only at the end of the seriesof single-cell RT-PCR experiments.
REFERENCES
1.Audinat, E., B. Lambolez, and J. Rossier. 1996. Func-tional and molecular analysis of glutamate-gated chan-nels by patch-clamp and RT-PCR at the single celllevel. Neurochem. Int. 28:119-136.
2.Banerjee, S.A., P. Hoppe, M. Brilliant, and D.M.Chikaraishi. 1992. 5′ Flanking sequences of the rattyrosine hydroxylase gene target accurate tissue-specif-ic, developmental, and transsynaptic expression intransgenic mice. J. Neurosci. 12:4460-4467.
3.Berger, J., A.D. Howard, L. Gerber, B.R. Cullen, andS. Udenfriend. 1987. Expression of active, membrane-bound human placental alkaline phosphatase by trans-fected simian cells. Proc. Natl. Acad. Sci. USA84:4885-4889.
4.Bochet, P., E. Audinat, B. Lambolez, F. Crepel, J.Rossier, M. Iino, K. Tsuzuki, and S. Ozawa. 1994.Subunit composition at the single-cell level explainsfunctional properties of a glutamate-gated channel.Neuron 12:383-388.
5.Chalfie, M., Y. Tu, G. Euskirchen, W.W. Ward, andD.C. Prasher. 1994. Green fluorescent protein as amarker for gene expression. Science 263:802-805.
6.Estee, J., P. Crino, and J. Eberwine. 1999. Preparationof cDNA from single cells and subcellular regions, p.3-18. In S.M. Weissman (Ed.), Methods of Enzymolo-gy (303): cDNA Preparation and Characterization.Academic Press, San Diego.
7.De Groote, G., P. De Waele, A. Van De Voorde, M.De Broe, and W. Fiers. 1983. Use of monoclonal anti-bodies to detect human placental alkaline phosphatase.Clin. Chem. 29:115-119.
8.DeVries, S.H. and D.A. Baylor. 1997. Mosaic arrange-ment of ganglion cell receptive fields in rabbit retina. J.Neurophysiol. 78:2048-2060.
9.De Waele, P., G. De Groote, A. Van De Voorde, W.Fiers, J.-D. Franssen, P. Herion, and J. Urbain. 1982.Isolation and identification of monoclonal antibodiesdirected against human placental alkaline phosphatase.Arch. Int. Physiol. Biochim. 90:B21.
10.Djamgoz, M.B., M.W. Hankins, J. Hirano, and S.N.Archer. 1997. Neurobiology of retinal dopamine inrelation to degenerative states of the tissue. Vision Res.37:3509-3529.
11.Euler, T., H. Schneider, and H. Wassle. 1996. Gluta-mate responses of bipolar cells in a slice preparation ofthe rat retina. J. Neurosci. 16:2934-2944.
12.Feigenspan, A., S. Gustincich, B.P. Bean, and E. Ravi-ola. 1998. Spontaneous activity of solitary dopaminer-gic cells of the retina. J. Neurosci. 18:6776-6789.
13.Fields-Berry, S.C., A.L. Halliday, and C.L. Cepko.
1992. A recombinant retrovirus encoding alkalinephosphatase confirms clonal boundary assignment inlineage analysis of murine retina. Proc. Natl. Acad. Sci.USA 89:693-697.
14.Geiger, J.R., T. Melcher, D.S. Koh, B. Sakmann, P.H.Seeburg, P. Jonas, and H. Monyer. 1995. Relativeabundance of subunit mRNAs determines gating andCa2+ permeability of AMPA receptors in principalneurons and interneurons in rat CNS. Neuron 15:193-204.
15.Gustincich, S., D.K. Wu, L.J. Koopman, and E. Ravi-ola. 1996. A transgenic approach to the study of neur-al networks in the retina. Invest. Ophthalmol. Vis. Sci.37:S1060.
16.Gustincich, S., A. Feigenspan, D.K. Wu, L.J. Koop-man, and E. Raviola. 1997. Control of dopaminerelease in the retina: a transgenic approach to neuralnetworks. Neuron 18:723-736.
17.Gustincich, S., A. Feigenspan, W. Sieghart, and E.Raviola. 1999. Composition of the GABA(A) recep-tors of retinal dopaminergic neurons. J. Neurosci.19:7812-7822.
18.Harlow, E. and D. Lane. 1988. Antibodies: A Labora-tory Manual. CSH Laboratory Press, Cold Spring Har-bor, NY.
19.Jonas, P., C. Racca, B. Sakmann, P.H. Seeburg, andH. Monyer. 1994. Differences in Ca2+ permeability ofAMPA-type glutamate receptor channels in neocorti-cal neurons caused by differential GluR-B subunitexpression. Neuron 12:1281-1289.
20.Kam, W., E. Clauser, Y.S. Kim, Y.W. Kan, and W.J.Rutter. 1985. Cloning, sequencing, and chromosomallocalization of human term placental alkaline phos-phatase cDNA. Proc. Natl. Acad. Sci. USA 82:8715-8719.
21.Lam, DM. 1972. Biosynthesis of acetylcholine in tur-tle photoreceptors. Proc. Natl. Acad. Sci. USA 69:1987-1991.
22.Lambolez, B., E. Audinat, P. Bochet, F. Crepel, and J.Rossier. 1992. AMPA receptor subunits expressed bysingle Purkinje cells. Neuron 9:247-258.
23.MacGregor, G.R., A.E. Mogg, J.F. Burke, and C.T.Caskey. 1987. Histochemical staining of clonal mam-malian cell lines expressing E. coli beta-galactosidaseindicates heterogeneous expression of the bacterialgene. Somat. Cell Mol. Genet. 13:253-65.
24.MacNeil, M.A., J.K. Heussy, R.F. Dacheux, E. Ravio-la, and R.H. Masland. 1999. The shapes and numbersof amacrine cells: matching of photofilled with golgi-stained cells in the rabbit retina and comparison withother mammalian species. J. Comp. Neurol. 413:305-326.
25.Masland, R.H. and E. Raviola. 2000. Confrontingcomplexity: strategies for understanding the microcir-cuitry of the retina. Ann. Rev. Neurosci. 23:249-284.
26.Mayahara, H., H. Hirano, T. Saito, and K. Ogawa.1967. The new lead citrate method for the ultracyto-chemical demonstration of activity of non-specificalkaline phosphatase (orthophosphoric monoesterphosphohydrolase). Histochemie 11:88-96.
27.McComb, R.B. and G.N. Bowers, Jr. 1972. Study ofoptimum buffer conditions for measuring alkalinephosphatase activity in human serum. Clin. Chem.
107
7. Gene Expression in Genetically Labeled Single Cells
Merighi7-aucorr.qxd 5/23/02 6:07 PM Page 107

18:97-104.28.Monyer, H. and B. Lambolez. 1995. Molecular biolo-
gy and physiology at the single-cell level. Curr. Opin.Neurobiol. 5:382-387.
29.Oberdick, J., R.J. Smeyne, J.R. Mann, S. Zackson,and J.I. Morgan. 1990. A promoter that drives trans-gene expression in cerebellar Purkinje and retinal bipo-lar neurons. Science 248:223-226.
30.O’Dowd, D.K. and M.A. Smith. 1996. Single-cellanalysis of gene expression in the nervous system. Mea-surements at the edge of chaos. Mol. Neurobiol.13:199-211.
31.Parra, P., A.I. Gulyas, and R. Miles. 1998. How manysubtypes of inhibitory cells in the hippocampus? Neu-ron 20:983-993.
32.Posen, S., C.J. Cornish, M. Horne, and P.K. Saini.1969. Placental alkaline phosphatase and pregnancy.Ann. NY Acad. Sci. 166:733-774.
33.Spergel, D.J., U. Kruth, D.F. Hanley, R. Sprengel,and P.H. Seeburg. 1999. GABA- and glutamate-acti-vated channels in green fluorescent protein-taggedgonadotropin-releasing hormone neurons in transgenicmice. J. Neurosci. 19:2037-2050.
34.Stevens, C.F. 1998. Neuronal diversity: too many celltypes for comfort? Curr. Biol. 8:R708-R710.
35.Sucher, N.J. and D.L. Deitcher. 1995. PCR and
patch-clamp analysis of single neurons. Neuron14:1095-1100.
36.Tsien, R.Y. 1998. The green fluorescent protein. Ann.Rev. Biochem. 67:509-544.
37.Van Gelder, R.N., M.E. von Zastrow, A. Yool, W.C.Dement, J.D. Barchas, and J.H. Eberwine. 1990.Amplified RNA synthesized from limited quantities ofheterogeneous cDNA. Proc. Natl. Acad. Sci. USA87:1663-1667.
38.Versaux-Botteri, C., J. Nguyen-Legros, A. Vigny, andN. Raoux. 1984. Morphology, density and distribu-tion of tyrosine hydroxylase-like immunoreactive cellsin the retina of mice. Brain Res. 301:192-197.
39.Witkovsky, P. and A. Dearry. 1991. Functional rolesof dopamine in the vertebrate retina. Progr. RetinalRes. 11:247-292.
40.Zlokarnik, G., P.A. Negulescu, T.E. Knapp, L. Mere,N. Burres, L. Feng, M. Whitney, K. Roemer, and R.Y.Tsien. 1998. Quantitation of transcription and clonalselection of single living cells with beta-lactamase asreporter. Science 279:84-88.
41.Zolotukhin, S., M. Potter, W.W. Hauswirth, J. Guy,and N. Muzyczka. 1996. A “humanized” green fluo-rescent protein cDNA adapted for high-level expres-sion in mammalian cells. J. Virol. 70:4646-4654.
108
S. Gustincich et al.
Merighi7-aucorr.qxd 5/23/02 6:07 PM Page 108

109
RECEPTORS
GlutamateLambolez et al. (1992) R GluR1-4 C cerebellum Purkinje n.Bochet et al. (1994) R GluR1-4 C hippocampus n. type IIJonas et al.(1994) R GluRA-D S neocortex pyramidal and non-p. n.Geiger et al. (1995) R GluRA-D S CA3 pyramidal n.
Hilar mossy cellsdentate gyrus granule cellslayer V pyramidal cellsdentate gyrus basket cellsHilar interneuronsneocortex layer V non-pyramidalcells
medial nucleus of the trapezoid bodyBergmann glial cells
Ruano et al. (1995) R GluR5-7, KA1-2 C hippocampus n.Zhang et al. (1995) R GluR1-4 D retina ganglion cellAudinat et al. (1996) R GluR1-4 S neocortex pyramidal and non-p. n.Garaschuk et al. (1996) R GluRA-D S CA1 pyramidal n.
NR2A-CLambolez et al. (1996) R GluR1-4 S neocortex pyramidal and non-p. n.Tempia et al. (1996) R GluR1-4 S cerebellum Purkinje n.Wang & Grabowski R NMDAR1 S cerebellum granule n.(1996) cerebellum Purkinje n.Angulo et al. (1997) R GluR1-4 S cortex nonpyramidal n.Flint et al. (1997) R NR2A-D S somatosensoy cortex n.Plant et al. (1997) R NR2A-D S forebrain medial septal inhibitory n.Ying et al. (1997) R GluR1-4 C hippocampus n.
Appendix I
Analysis of gene expression at a single-cell level on cells from the mammalian ner-vous system. Single-cell RT-PCR experiments are classified according to the functionof the gene product whose mRNA expression was analyzed. For each experiment thefollowing information is given: first author of the paper and year of publication (thecomplete reference is listed alphabetically below); species (R = Rat; M = Mouse);mRNAs identified (see below for abbreviations); method of preparation (C = primaryCulture; S = Slice; D = Dissociation); neuronal types that were analyzed (n. = neuron).
MerAppx1.qxd 5/23/02 6:17 PM Page 109

Chen et al. (1998) R GluR1-4 D striatum n.Das et al. (1998) M NR1, NR3A D cerebrocortical n.Porter et al. (1998) R GluR1-4 S neocortex interneurons
GluR5-7, KA1-2NR2A-D
Stefani et al. (1998) R GluR1-4 D striatum medium spiny n.GluR5-7, KA1-2
Zawar et al. (1999) R NR2A-C S CA1 pyramidal n.stratum radiatuminterneuronsglial cellsdentate gyrus granule cells
Tehrani et al. (2000) R mGluR1-8 S retina ganglion cell
GABAGrigorenko & Yeh R β1-3 D retina rods(1994) retina ganglion cells
retina Muller gliaWang & Grabowski R γ2 S cerebellum granule n.(1996)Yeh et al. (1996) R α1-6, β1-3, D retina bipolar cells
γ1-3, δ, ρ1-2 retina ganglion cellsRuano et al. (1997) R α1-6, β1-3, S cerebellum Purkinje n.
γ1-3, δ cortex pyramidal nYan et al. (1997)b R α1-4, β1-3, D neostriatum cholinergic interneurons
γ1-3, δBerger et al. (1998) R α1-5, β1-3, γ1-3 S hippocampus basket n.Gustincich et al. (1999) M α1-5, β1-3, D retina dopaminergic n.
γ1-3, δ, εGuyon et al. (1999) R α1-6, β1-3, D substantia nigra dopaminergic n.
γ1-3, δ
AChYan et al. (1996) R mAChR: m1-5 D neostriatum cholinergic
interneuronsPoth et al. (1997) R nAChR: α2-5,7, C intracardiac parasympathetic n.
β2-4Vysokanov et al. (1998) R mAChR: m1 D medialprefrontal cortex
pyramidal n.medialprefrontal cortex interneurons
Porter et al. (1999) R nAChR: α2-7, S cortex pyramidal n.β2-4 cortex interneurons
Stewart et al. (1999) R mAChR: m1-5 D/C sensorimotor cortex pyramidal n.
Other ReceptorsSurmeier et al. (1996) R dopamine D neostriatum medium spiny n.
110
S. Gustincich et al.
MerAppx1.qxd 5/23/02 6:17 PM Page 110

(D1a-b, D2-4)Neumann et al. (1997)a R IFNγ-R; TNFαR C hippocampusNeumann et al. (1997)b R IFNγ-R C dorsal root ganglionYan et al. (1997)a R dopamine D neostriatum cholinergic interneurons
(D1a-b, D2-4)Yan et al. (1997)b R dopamine D neostriatum cholinergic interneurons
(D1-5)Futami et al. (1998) R SP S substantia nigra dopaminergic n.
cerebellum Purkinje n.Hurbin et al. (1998) R VP (V1a-b-2) D supraoptic nucleus magnocellular n.Schmidt-Ott et al. (1998)M ET (ETA-B) S cerebellum Purkinje n.
Bergmann glial cellsVysokanov et al. (1998) R dopamine (D4) D medialprefrontal cortex pyramidal n.
serotonin medialprefrontal cortex interneurons(5-HT2a, 5-HT2c,5-HT7)
Cardenas et al. (1999) R serotonin D dorsal root ganglion n.(5-HT1D, 5-HT2C, 5-HT7)
Skynner et al. (1999) M ERα-β S gonadotropin-releasing hormone n.Tsuchiya et al. (1999) R serotonin (5HT3) S spinal cord dorsal horn n.Zhu et al. (1999) R AT1A C hypothalamus
CHANNELS
SodiumVega-Saenz de Miera RBI, Scn8a D cerebellum Purkinje n.et al. (1997)
CalciumSong et al. (1996) R α1C-D D neostriatum medium spiny n.Yan et al. (1996) R α1A-E D neostriatum cholinergic interneuronsMermelstein et al. (1997) R α1A-D D neostriatum medium spiny n.Plant et al. (1998) R α1A-S S facial nucleus motorneuronsGlasgow et al. (1999) R α1A-E; α2; β1-4 D hypothalamus magnocellular n.Mermelstein et al. (1999) R α1, β1-4 D neostriatum medium spiny n.
cortex pyramidal n.
PotassiumMassengill et al. (1997) M Kv3.1 C cortex n.Martina et al. (1998) R Kv1.1, Kv1.2, S dentate gyrus basket cell
Kv1.4, Kv1.6, CA1 pyramidal n.Kv2.1, Kv2.2Kv3.1; Kv3.2,Kv 4.1, Kv 4.2,Kv 4.3
Mermelstein et al. (1998) R IRK1-3 D nucleus accumbens projection n.Song et al. (1998) R Kv1.1, Kv1.2, D neostriatum cholinergic interneurons
111
7. Appendix I
MerAppx1.qxd 5/23/02 6:17 PM Page 111

Kv1.4, Kv1.5,Kv3.4, Kv 4.1,Kv 4.2, Kv 4.3,Kv β1, Kv β2,Kv β3
Baranauskas et al. (1999) R Kv2.1, Kv2.2, D globus pallidus n.Kv 3.1, Kv 3.2
Zawar et al. (1999) R Kir6.1, Kir6.2, S CA1 pyramidal n.SUR1, SUR2 stratum radiatum interneurons
glial cellsdentate gyrus granule cells
Tkatch et al. (2000) R Kv 4.1; Kv 4.2; D neostriatum medium spiny n.Kv 4.3 neostriatum cholinergic
interneuronsglobus pallidus n.basal forebrain cholinergic n.
CELL-TYPE MARKERSEnzymesBochet et al. (1994) R GAD65 C hippocampus n. type IIJonas et al.(1994) R GAD65 S neocortex pyramidal and non-p. n.Yan et al. (1996) R ChAT D neostriatum cholinergic interneuronsCauli et al. (1997) R GAD65; S sensorymotor cortex
GAD67;ChAT nonpyramidal n.cerebellum Purkinje n.
Ceranik et al. (1997) R GAD67 S dentate gyrus interneuronsPlant et al. (1997) R GAD65 S forebrain medial septal inhibitory n.Yan et al. (1997)a R ChAT D neostriatum cholinergic interneuronsYan et al. (1997)b R ChAT D neostriatum cholinergic interneuronsComer et al. (1998) R TH; PNMT D rostral ventrolateral medullaLipski et al. (1998) R TH; PNMT D rostral ventrolateral medulla Porter et al. (1998) R GAD65; GAD67 S neocortex interneurons
ChATSong et al. (1998) R ChAT D neostriatum cholinergic interneuronsTkatch et al. (1998) R GAD67; ChAT D globus pallidus n.
basal forebrain n.Vysokanov et al. (1998) R GAD67 D medialprefrontal cortex pyramidal n.
medialprefrontal cortex interneuronsBaranauskas et al. (1999) R GAD67; ChAT D globus pallidus n.Fusco et al. (1999) R ChAT D striatum interneurons
striatum projection n.corticostriatal projection n.globus pallidus projection n.nucleus basalis n.
Gustincich et al. (1999) M TH D retina dopaminergic n.Guyon et al. (1999) R TH; GAD65; D substantia nigra dopaminergic n.
GAD67
112
S. Gustincich et al.
MerAppx1.qxd 5/23/02 6:17 PM Page 112

Kawai et al. (1999) R TH; PNMT D rostral ventrolateral medullaPorter et al. (1999) R GAD65; GAD67 S cortex pyramidal n.
cortex interneurons
NeuropeptidesSong et al. (1996) R ENK; SP D neostriatum medium spiny n.Surmeier et al. (1996) R ENK; SP D neostriatum medium spiny n.Cauli et al. (1997) R VIP; CCK; SS; S sensorymotor cortex nonpyramidal n.
NPY cerebellum Purkinje n.Chen et al. (1998) R ENK; SP D striatum n.Hurbin et al. (1998) R VP; OT D supraoptic nucleus magnocellular n.Mermelstein et al. (1998) R ENK; SP D nucleus accumbens projection n.Porter et al. (1998) R VIP S neocortex interneuronsSong et al. (1998) R ENK; SP D neostriatum cholinergic interneurons Stefani et al. (1998) R ENK; SP D striatum medium spiny n.Fusco et al. (1999) R ENK; SP D striatum interneuron
striatum projection n.corticostriatal projection n.globus pallidus projection n.nucleus basalis n.
Glasgow et al. (1999) R OT; VP; Dyn; D hypothalamus magnocellular n.Gal; CCK; CRH
Kelz et al. (1999) M ENK; SP D striatum n.Mermelstein et al. (1999) R ENK; SP D neostriatum medium spiny n.
cortex pyramidal n.Porter et al. (1999) R VIP; CCK; SS; S cortex pyramidal n.
NPY cortex interneuronsTsuchiya et al. (1999) R ENK S spinal cord dorsal horn n.
Calcium-Binding ProteinsWang & Grabowski R CB S cerebellum granule n.(1996) cerebellum Purkinje n.Cauli et al. (1997) R CR; CB; PV S sensorymotor cortex nonpyramidal n.
cerebellum Purkinje n.Porter et al. (1998) R CR S neocortex interneuronsVysokanov et al. (1998) R CR; CB; PV D medialprefrontal cortex pyramidal n.
medialprefrontal cortex interneuronsBaranauskas et al. (1999) R PV D globus pallidus n.Glasgow et al. (1999) R CB D hypothalamus magnocellular n.Porter et al. (1999) R CR; CB; PV S cortex pyramidal n.
cortex interneurons
Other MarkersLambolez et al. (1992) R GFAP C cerebellum Purkinje n.Gahring et al. (1996) M NSE C cortex n.Neumann et al. (1997)a R MAP2; GFAP C hippocampusNeumann et al. (1997)b R GFAP C dorsal root ganglionComer et al. (1998) R NSE D rostral ventrolateral medulla
113
7. Appendix I
MerAppx1.qxd 5/23/02 6:17 PM Page 113

Kawai et al. (1999) R NSE D rostral ventrolateral medullaLipski et al. (1998) R NSE D rostral ventrolateral medullaSkynner et al. (1999) M GFAP S gonadotropin-releasing hormone n.Tsuchiya et al. (1999) R NSE S spinal cord dorsal horn n.
MISCELLANEA
Chiang et al. (1994) R NOS C hippocampus n.Crepel et al. (1994) R NOS S cerebellum granule n.
cerebellum Purkinje n.Baba-Aissa et al. (1996) R SERCA2-3 S cerebellum Purkinje n.Gahring et al. (1996) M TNFα C cortex n.Wang & Grabowski R clathrin; S cerebellum granule n.(1996) NCAM; cerebellum Purkinje n.
hnRNP A1-2Wang & Wu (1996) R Gαq; Gα11 D substantia nigra dopaminergic n.Wu & Wang (1996) R Gαq; Gα11 D substantia nigra dopaminergic n.Neumann et al. (1997)a R GAPDH; MHC I; C hippocampus
β2-microglobulin; TAP1; TAP2calnexin
Neumann et al. (1997)b R GAPDH; CD4 C dorsal root ganglionIFNγ
Comer et al. (1998) R GAPDH; NAT D rostral ventrolateral medullaSchmidt-Ott et al. M ET (ET1-3) S cerebellum Purkinje n.(1998) ET-converting Bergmann glial cells
enzyme (ECE1-2)Shen et al. (1998) M Rps4; Snrpn; S hippocampus pyramidal n.
Ncam; F3camTkatch et al. (1998) R ACh Vtr.; D globus pallidus n.
GABA Vtr. basal forebrain n. Vysokanov et al. (1998) R CaMKII D medialprefrontal cortex pyramidal n.
medialprefrontal cortex interneurons Zhu et al. (1998) R PLA2; AT2 C hypothalamus and brainstem Brocke et al. (1999) R CaMKII (α, S CA1 pyramidal n.
αB, β, β′, βe, β′e, γ variants, δA-C)
Fusco et al. (1999) R huntingtin D striatum interneuronsstriatum projection n. corticostriatal projection n.globus pallidus projection n.nucleus basalis n.
Glasgow et al. (1999) R GAPDH D hypothalamic magnocellular n.Skynner et al. (1999) M GnRH S gonadotropin-releasing hormone n.Zhu et al. (1999) R CaMKII; PKCα C hypothalamus
114
S. Gustincich et al.
MerAppx1.qxd 5/23/02 6:17 PM Page 114

ABBREVIATIONS
ACh = Acetylcholine; ACh Vtr. = Acetylcholine Vesicular transporter; AT = Angiotensin Typereceptor; CaMKII = Ca2+/calmodulin-dependent kinase II; CB = Calbindin; CCK =Cholecystokinin; ChAT = Choline Acetyltransferase; CR = Calretinin; Dyn = Dynorphin;ENK = Enkephalin; ER = Estrogen Receptor; ET = Endothelin; GABA = γ-aminobutyricacid; GABA Vtr. = GABA Vesicular transporter; GAD = Glutamic Acid Decarboxylase; Gal =Galanin; GAPDH = Glyceraldehyde-3-Phosphate Dehydrogenase; GFAP = Glial FibrillaryAcidic Protein; GluR(1-4) = α-amino-3-hydroxy-5-methyl-4-isoxazolepropionate-typeionotropic Glutamate Receptor; GnRH = Gonadotropin-Releasing Hormone; hnRNP =heterogeneous nuclear Ribonucleoprotein; IFNγ = Interferon γ; IFNγ-R = Interferon γReceptor; IRK = Inwardly Rectifying Potassium; KA = Kainate-type ionotropic GlutamateReceptor; Kir = K+ channel Inward Rectifier; mAChR = muscarinic Acetylcholine Receptor;MAP = Microtubule Associated Protein; mGluR = metabotropic Glutamate Receptor; MHC= Major Histocompatibility Complex; nAChR = nicotinic Acetylcholine Receptor; NAT =Noradrenaline Transporter; NCAM = Neural Cell Adhesion Molecule; NOS = Nitric OxideSynthase; NPY = Neuropeptide Y; NR2 = N-methyl-D-aspartate-type ionotropic GlutamateReceptor 2; NSE = Neurone-Specific Enolase; OT = Oxytocin; PKC = Protein Kinase C;PLA2 = Phospholipase A2; PNMT = Phenylethanolamine-N-methyltransferase; PV =Parvalbumin; RBI = Rat Brain I; Scn8a = Sodium Channel α subunit; SERCA =Sarco(endo)plasmic reticulum Ca2+ ATPase; SP = Substance P; SS = Somatostatin; SUR =Sulphonylurea Receptor; TH = Tyrosine Hydroxylase; TNFα-R = Tumor Necrosis Factor αReceptor; VIP = Vasoactive Intestinal Peptide; VP = Vasopressin.
REFERENCES
1.Angulo et al.1997. J. Neurosci. 17:6685.2.Audinat et al. 1996. J. Physiol. (Paris) 90:331.3.Baba-Aissa et al. 1996. Brain Res. Mol. Brain Res. 41:169.4.Baranauskas et al. 1999. J. Neurosci. 19:6394.5.Berger et al. 1998. J. Neurosci. 18:2437.6.Brocke et al. 1999. J. Biol. Chem. 274:22713.7.Cardenas et al. 1999. J. Physiol. 518:507.8.Cauli et al. 1997. J. Neurosci. 17:3894.9.Ceranik et al. 1997. J. Neurosci. 17:5380.10.Chen et al. 1998. Neuroscience 83:749.11.Chiang et al. 1994. Mol. Brain Res. 27:183.12.Comer et al. 1998. Brain Res. Mol. Brain Res. 62:65.13.Crepel et al. 1994. Neuropharmacology 33:1399.14.Das et al. 1998. Nature 393:377.15.Flint et al. 1997. J. Neurosci. 17:2469.16.Fusco et al. 1999. J. Neurosci. 19:1189.17.Futami et al. 1998. Brain Res. Mol. Brain Res. 54:183.18.Gahring et al. 1996. Neuroimmunomodulation 3:289.19.Garaschuk et al. 1996. J. Physiol. 491:757.20.Geiger et al. 1995. Neuron 15:193.
115
7. Appendix I
MerAppx1.qxd 5/23/02 6:17 PM Page 115

21.Glasgow et al. 1999. Endocrinology 140:5391.22.Grigorenko and Yeh. 1994. Vis. Neurosci. 11:379.23.Guyon et al. 1999. J. Physiol. 516:719.24.Gustincich et al. 1999. J. Neurosci. 19:7812.25.Hurbin et al. 1998. Endocrinology 139:4701.26.Jonas et al. 1994. Neuron 12:1281.27.Kawai et al. 1999. Brain Res. 830:246.28.Kelz et al. 1999. Nature 401:272.29.Lambolez et al. 1992. Neuron 9:247.30.Lambolez et al. 1996. Proc. Natl. Acad. Sci. USA 93:1797.31.Lipski et al. 1998. Am. J. Physiol. 274:R1099.32. Martina et al. 1998. J. Neurosci. 18:8111.33.Massengill et al. 1997. J. Neurosci. 17:3136.34.Mermelstein et al. 1997. Neuroreport 8:485.35.Mermelstein et al. 1999. J Neurosci 19:7268.36.Mermelstein et al. 1998. J. Neurosci. 18:6650.37.Neumann et al. 1997. J. Exp. Med. 185:305.38.Neumann et al. 1997. J. Exp. Med. 186:2023.39.Plant et al. 1998. J. Neurosci. 18:9573.40.Plant et al. 1997. J. Physiol. 499:47.41.Porter et al. 1999. J. Neurosci. 19:5228.42.Porter et al. 1998. Eur. J. Neurosci. 10:3617.43.Poth et al. 1997. J. Neurosci. 17:586.44.Ruano et al. 1995. Neuron 14:1009.45.Ruano et al. 1997. Eur. J. Neurosci. 9:857.46.Schmidt-Ott et al. 1998. J. Cardiovasc. Pharmacol. 31:S364.47.Seeburg et al. 1995. Recent Prog. Horm. Res. 50:19.48.Shen et al. 1998. Mol. Gen. Med. 63:96.49.Skynner et al. 1999. Endocrinology 140:5195.50.Song et al. 1996. J. Neurophysiol. 76:2290.51.Song et al. 1998. J. Neurosci. 18:3124.52.Stefani et al. 1998. Dev. Neurosci. 20:242.53.Stewart et al. 1999. J. Neurophysiol. 81:72.54.Surmeier et al. 1996. J. Neurosci. 16:6579.55.Tehrani et al. 2000. Invest. Ophthalmol. Vis. Sci. 41:314-319.56.Tempia et al. 1996. J. Neurosci. 16:456.57.Tkatch et al. 1998. Neuroreport 9:1935.58.Tkatch et al. 2000. J. Neurosci. 20:579.59.Tsuchiya et al. 1999. Neuroreport 10:2749.60.Vega-Saenz de Miera et al. 1997. Proc. Natl. Acad. Sci. USA 94:7059.61.Vysokanov et al. 1998. Neurosci. Lett. 258:179.62.Wang and Wu. 1996. Brain Res. Mol. Brain Res. 36:29.63.Wang and Grabowski. 1996. RNA 2:1241.64.Wu and Wang. 1996. J. Neurochem. 66:1060.65.Yan et al. 1996. J. Neurosci. 16:2592.66.Yan et al. 1997. J. Neurophysiol. 77:1003. Y67.Yan et al. 1997. Neuron 19:1115.
116
S. Gustincich et al.
MerAppx1.qxd 5/23/02 6:17 PM Page 116

68.Yeh et al. 1996. Vis. Neurosci. 13:283.69.Ying et al. 1997. J. Neurosci. 17:9536.70.Zawar et al. 1999. J. Physiol. 514:327.71.Zhang et al. 1995. Neuroscience 67:177.72. Zhu et al. 1998. J. Neurosci. 18:679.73. Zhu et al. 1999. J. Neurophysiol. 82:1560.
117
7. Appendix I
MerAppx1.qxd 5/23/02 6:17 PM Page 117

This page intentionally left blank

119
OVERVIEW
The birth of new concepts in chemicalneurotransmission, like cotransmission,volume transmission, or neuronal versatili-ty, frequently occurred thanks to theadvances in neurocytochemichal technolo-gies. First, the identification and in situlocalization of neurotransmitters, relatedenzymes, and receptors greatly benefitedfrom the development of more and morespecific and sensitive cytochemical tech-niques. For instance, after histochemistryof acetylcholinesterase, the chemical neu-roanatomy of monoamine neurons origi-nated from histofluorescence methods. It isthe development, however, of immunocy-tochemistry (ICC) at optic and electronmicroscope levels which has given an uni-versal and versatile tool for such cartogra-phies, first of neuropeptides, then ofenzymes of neurotransmitter metabolism,
and finally of the neurotransmitters them-selves after the pionneering work of Stein-busch and colleagues (36) for serotonin.However these mappings, completed bythat of receptors through ligand binding orICC, does not allow, for example, theassumption that identified protein mole-cules are truly synthetized within siteswhere they are detected.
The in situ hybridization (ISH) ofmRNAs, to which our purpose will berestricted (excluding ISH on chromo-somes), leads to the detection and cellularlocalization of another step of the proteinand peptide synthesis.
Thus, the comparison of results obtainedby both techniques, ICC and ISH, is ableto bring invaluable data about the cellularexpression of a given peptide or protein,inter- or intracellular relationship betweendifferent molecules, and also functionalactivity of chemically identified neurons.
Cellular and Molecular Methods in Neuroscience ResearchEdited by A. Merighi and G. Carmignoto
Immunocytochemistry and In SituHybridization: Their Combinations forCytofunctional Approaches of Centraland Peripheral Neurons
Marc Landry1,2 and André Calas3
1Laboratoire de Biologie de la Différenciation et du Développement,Université Victor Ségalen and 2INSERM EPI 9914, Institut FrançoisMagendie, Bordeaux; 3Laboratoire de Cytologie, Institut desNeurosciences, Université Pierre et Marie Curie, Paris, France, EU
8
Merighi8-aucorr.qxd 5/23/02 7:00 PM Page 119

This is exemplarily the case for the combi-nation of both kinds of labelings on thesame material. Moreover, the results ofcombining these different techniques allowtheir mutual validation, since their respec-tive artifacts are different.
The aim of the present review is todescribe and comment on some protocolscombining different ISH procedures, orISH and ICC, and to develop for each ofthem their abilities and limitations as wellas their possible contributions to cellularneurobiology.
BACKGROUND
Considered individually, each labelingtechnique, ICC or ISH, constitutes a longchain of histochemical steps whose qualityof the final result strongly depends on theweakest link. This is even more true for theircombination, which raises not only additivedifficulties but also specific problems due tothe coupling itself; the readibility of resultsand the compatibility of histochemical treat-ments and namely their possible interfer-ences in giving rise to excess or deficiencyerrors. The use of different consecutive sec-tions (12), to perform ICC and ISH reac-tions separately, removes their possible inter-ferences and only leaves open thecompatibility of histochemical treatmentsprior to ISH and ICC themselves, like fixa-tion and embedding. In order to comparelabelings at the cellular level, mirror sectionshave been used (41), and the signalsobserved are generally of the same kind.
However, although being more difficult,the combination of labelings on the samesection appears to be both more elegant andrich in information. Compatibility and pos-sible interactions between reagents involvedin the labeling techniques will be exposedand discussed further. Here, we wish only togive a rapid overview of the different mark-ers currently used for ICC and ISH detec-
tions. A dark precipitate arises from thedevelopment of the activity of an enzymecoupled to an antibody. The most com-monly used enzymes are alkaline phos-phatase and peroxidase, but others can bealso considered. Fluorescent dyes give sharpsignals and are useful for confocal micro-scope analysis. Alternatively, antigens as wellas reporter molecules may be detected bysilver-enhanced ultra small gold particle-conjugated antibodies. Autoradiographicprocedures are mostly restricted to ISHstudies, although radioactive ICC detec-tions have also been reported. Conversely,postembedding immunogold protocols aremainly carried out for antigen detection byICC at the electron microscope level (Chap-ter 10), and only a few ISH studies havebeen reported, most of them related to viralmessengers (see Reference 10).
Here, we shall focus on some protocolsthat are either widely used or specificallydesigned for more restricted purposesthanks to the emergence of new and poten-tially powerful detection systems. Takentogether, these protocols cover a wide rangeof possible applications and allow the con-sideration of various difficulties of the mul-tiple labeling methods.
PROTOCOLS
General Comments
Some standard protocols for multiplelabelings are proposed below. We did notdescribe protocols for labeling probes usedin ISH, since our purpose was restricted tothe combination of techniques. Moreover,the need for multiple labeling influencesthe choice of the reporter molecule butdoes not modify the way to label probes.The composition of the solutions is notmodified by the coupling, and commonhybridization solutions or incubationbuffers can be used. Of course, the various
120
M. Landry and A. Calas
Merighi8-aucorr.qxd 5/23/02 7:00 PM Page 120

treatments must avoid degradation ofmRNAs from tissues or antigens prior totheir detection (also discussed in sectionentitled Radioactive and Enzymatic Dou-ble ISH).
Materials and Reagents
The following materials and reagents areused for any of the ISH protocols present-ed in this review:
• Tissue sections or cell cultures.
Labeling
• Probes:Oligoprobes: 25 to 30 pmol are labeledwith radioactive dNTP; 100 pmol arelabeled with nonradioactive (digoxi-genin, biotin, fluorescein) dNTP.Riboprobes: 1 µg template is tran-scribed.
• Terminal transferase or RNA polyme-rase (Roche Molecular Biochemicals,Mannheim, Germany)
• Labeling buffer (Roche Molecular Bio-chemicals).
• Probe purification: ethanol, LiCl,EDTA, or DNase I (Sigma, St. Louis,MO, USA).
Hybridization
• Bovine serum albumin (BSA; Sigma).• Ficoll (Sigma).• Polyvinylpyrrolidone (PVP; Sigma).• N-lauroylsarcosine (Sigma).• Dextran sulfate (Sigma).• Denatured salmon testis DNA (Sig-
ma).• Dithiothreitol (DTT; Sigma).• Deionized formamide (Sigma).• Yeast RNA (Sigma).• Sodium dodecyl sulfate (SDS; Sigma).• Formamide (Sigma).
Hybridization Buffers
Oligoprobes: 50% deionized forma-mide, 4× standard saline citrate (SSC) (1×SSC = 0.15 M NaCl, 0.015 M NaCitrate),1× Denhardt’s solution (0.02% BSA,0.02% Ficoll, 0.02% PVP), 0.02 MNaPO4 (pH 7.0), 1% N-lauroylsarcosine,10% dextran sulphate, 500 mg/L dena-tured salmon testis DNA, 20 mM DTT ifusing radioactively labeled probes.
Riboprobes: 50% deionized formamide,5× SSC, yeast RNA (50 µg/mL), 1% SDS,20 mM DTT if using radioactively labeledprobes.
Probes
Oligoprobes: radioactively labeled oligo-probes are incubated at 0.5 nM; biotin- ordigoxigenin-labeled oligoprobes are used at0.5 (lowly expressed mRNAs) to 10 (high-ly expressed mRNAs) nM.
Riboprobes: 10% of the labeled probe isdiluted in 500 µL of hybridization solu-tion.
Posthybridization Washings
Oligoprobes: 4 times for 15 minutes at55°C (SSC 1×), then 30 minutes at roomtemperature.
Riboprobes: 2 times for 30 minutes at70°C (50% formamide; 5× SSC, 1%SDS), 2 times for 30 minutes at 65°C(50% formamide, 2× SSC).
Other reagents, specific of a given tech-nique, are listed below, together with thecorresponding protocol.
Protocol for Radioactive and EnzymaticDouble ISH (Protocol #1)
General Comments
This protocol is well suited for cryostatsections (Figure 1a) or cell cultures (Figure
121
8. Immunocytochemistry and In Situ Hybridization
Merighi8-aucorr.qxd 5/23/02 7:00 PM Page 121

1b) and can be performed with oligo- orriboprobes on unfixed (5,8,24,45) or fixed(23,25,37,46) tissue. No pretreatments arerequired on cryostat sections, but cells mayneed to be permeabilized. Preparationsmust be finally mounted without dehydra-tion to avoid fading of the nitro blue tetra-zolium/5-bromo-4-chloro-3-indolyl phos-phate (NBT/BCIP) precipitate.
Materials and Reagents
• 35S- and digoxigenin-labeled nucleo-tides.
• Tris buffers: buffer A: 0.1 M Tris, pH7.5, 1 M NaCl, 2 mM MgCl2; bufferB: 0.1 M Tris, pH 9.5, 0.1 M NaCl, 5mM MgCl2.
• Alkaline phosphatase-conjugated anti-digoxigenin antibody (Roche Molecu-lar Biochemicals).
• BSA.• Alkaline phosphatase substrate (NBT
and BCIP) (Roche Molecular Bio-chemicals).
• Photographic emulsion (AmershamPharmacia Biotech, Piscataway, NJ,USA).
• Developer and fixer.
Procedure
See flow chart in Protocol 1.1. Unfixed or fixed (generally with 4%
paraformaldehyde) samples are frozenon dry ice or isopentane cooled at-30°C.
2. Sections are cut with a cryostat andthaw-mounted on slides.
3. Hybridization is carried out with alldioxigenin-labeled and radioactiveprobes together.
4. Perform posthybridization washingsaccording to the type of probes used(see above).
5. Preincubate slides with buffer A con-taining 0.5% to 1% BSA (buffer A-BSA) for 30 minutes at room tempera-ture.
6. Incubate with alkaline phosphatase-conjugated antidigoxigenin antibodydiluted 1:5000 in buffer A-BSAovernight at 4°C.
7. Rinse in buffers A and B.8. Incubate with the NBT/BCIP alkaline
phosphatase substrate diluted in bufferB at room temperature in the dark.
9. Process sections for autoradiography.10. Mount and observe.
Protocol for Double Fluorescent ISH(Protocol #2)
General Comments
Although scarcely used, the double fluores-cent ISH provides quick and easily readableresults that can be analyzed with a confocalmicroscope (Figure 2, b,d, and f). The proto-col described below takes advantadge of thehigh specificity and sensitivity of the 2-hydroxy-3-naphtoic acid-2′-phenylanilidephosphate (HNPP) detection set (Figure 2, aand c, and Figure 3a) (16,18). The precipita-tion of the dephosphorylated form of HNPPis ensured by Fast Red TR (Roche MolecularBiochemicals), and the combined HNPP/FastRed TR is a highly fluorescent product. Theaccumulation of the precipitate, and hencethe signal, can be triggered by repeated addi-tion of fresh substrate solution.
Materials and Reagents
• Biotin- and digoxigenin-labeled nucleo-tides.
• Tris buffers: buffer A: 0.1 M Tris, pH7.5, 1 M NaCl, 2 mM MgCl2; bufferC: 100 mM Tris-HCl, 150 mM NaCl,10 mM MgCl2, pH 8.0.
122
M. Landry and A. Calas
Merighi8-aucorr.qxd 5/23/02 7:00 PM Page 122

123
8. Immunocytochemistry and In Situ Hybridization
Protocol 1 and 2. Flow chart diagram showing the main steps of the protocols for radioactive and enzymatic double ISH (Pro-tocol #1) and double fluorescent ISH (Protocol #2).
Merighi8-aucorr.qxd 5/23/02 7:00 PM Page 123

124
M. Landry and A. Calas
Figure 1. Double labelings on sections of peripheral (a) and central (c–f) rat nervous system and on primary cell cultures (b).(a) Dorsal root ganglia sections have been hybridized with digoxigenin- and radioactively labeled probes complementary to calci-tonin gene related peptide (CGRP) (purple precipitate) and galanin receptor 1 (silver grains) mRNA, respectively (Protocol #1).Double labeled (arrows) and neurons containing CGRP only are visualized in normal rats. (b) Primary culture of adult dorsal rootganglia double stained for neuropeptide tyrosine (enzymatic precipitate) and its Y1 receptor (radioactive signal) by using the sameprotocol. Large neurons are double labeled (arrow), whereas others display only the radioactive signal (open arrowhead). Thus, theY1 receptor can be considered both a pre- and postsynaptic receptor. (c) Double detection of heterologous gene products: doublelabeling combining two enzymatic detections (modified from Protocol #5). Galanin peptide is visualized by immunoperoxidase,whereas the development of alkaline phosphatase activity leads to the detection of oxytocin mRNA in the supraoptic nucleus of alactating female rat hypothalamus. Upon such a stimulation, some neurons appear doubly labeled beside two distinct populationsof cells singly labeled either for galanin (small arrowhead) or oxytocin mRNA (large arrowhead). (d) Double detection of heterol-ogous gene products: double labeling combining radioactive ISH detection of vasopressin mRNA to immunoperoxidase for tyro-sine hydroxylase (TH) in hypothalamic supraoptic nucleus of a dehydrated rat (modified from Protocol #5). Most neurons aredouble labeled (open arrows), although some cells remain single labeled either for TH (small arrowhead) or vasopressin mRNA(open arrowhead). Note that double labeled cells are easier to distinguish than when using a double enzymatic detection. (e) Dou-ble detection of homologous gene products: double labeling combining radioactive ISH detection of vasopressin mRNA toimmunoperoxidase for vasopressin peptide in the rat hypothalamic supraoptic nucleus (modified from Protocol #5). Most neuronsare double labeled (open arrows). However, rare cells remain single labeled for vasopressin and can be considered as resting neu-rons storing peptide (small arrowhead). (f ) Double fluorescent immunolabeling using the CARD method to detect neuropeptidetyrosine Y1 receptor containing neurons (green) and neuropeptide tyrosine containing afferent fibers (red) in the rat arcuate nucle-us (see Protocol #6). Yellow color corresponds to the superimposition of both fluorescences and indicates double labelings, i.e.,contacts between fibers and neurons (arrows). The neuropeptide tyrosine containing fibers establish contact on soma and process-es of Y1 receptor expressing neurons. Scale bars: 25 µm. (See color plate A5.)
Merighi8-aucorr.qxd 5/23/02 7:00 PM Page 124

• Alkaline phosphatase-conjugated anti-digoxigenin antibody.
• BSA.• Rabbit antibiotin antibody (Roche
Molecular Biochemicals.• Appropriate biotin–streptavidin fluo-
rescent reagents e.g., streptavidin fluo-rescein isothiocyanide (FITC; Vector,Burlingame, CA, USA).
• Alkaline phosphatase fluorescent sub-strate (HNPP) (Roche Molecular Bio-chemicals).
Procedure
See flow chart in Protocol 2.1. Unfixed or fixed (generally with 4%
paraformaldehyde) samples are frozenon dry ice or isopentane cooled at-30°C.
2. Sections are cut with a cryostat andthaw-mounted on slides.
3. Hybridization is carried out with alldioxigenin- and biotin-labeled probestogether.
4. Perform posthybridization washingsaccording to the type of probes used(see above).
5. Preincubate slides with buffer A con-taining 0.5% to 1% BSA (buffer A-BSA) for 30 minutes at room tempera-ture.
6. Incubate with alkaline phosphatase-conjugated antidigoxigenin antibodydiluted 1:5000 in buffer A-BSAovernight at 4°C.
7. Incubate with a biotinylated antirabbitantibody diluted in buffer A-BSA for30 minutes at room temperature, thenrinse in buffer A.
8. Incubate with FITC-conjugated strep-tavidin diluted in buffer A-BSA for 2hours at room temperature, then rinsein buffers A and C.
9. Incubate in HNPP/Fast Red contain-
ing buffer C for 30 minutes at roomtemperature, then rinse in buffer C (3times).
10. Rinse in distilled water.11. Mount in antifading medium and
observe.
Protocol for Double ISH at the ElectronMicroscope Level (Protocol #3)
General Comments
The major problems are, first, to perme-abilize the tissue while preserving a goodmorphology, and second, to maintain, asfar as possible, the sensitivity of the ISHprocedures despite treatments required forthe observation at the electron microscopelevel (Figure 4b). This method is likely tobe applicable not only to vibratome sec-tions but also to slices and cells.
Material and Reagents
• Phosphate buffer (PB), pH 7.4, 0.1 Mand phosphate-buffered saline (PBS),pH 7.4, 0.1 M.
• 4% Paraformaldehyde in PBS.• Biotin- and digoxigenin-labeled nucleo-
tides.• BSA.• Rabbit antibiotin antibody.• Appropriate biotin–streptavidin rea-
gents.• Gelatin (Sigma).• Normal goat serum (NGS; Sigma).• Gold-conjugated antidigoxigenin anti-
body (British BioCell International,Cardiff, Wales, UK).
• 3, 3′-diaminobenzadine (DAB; Sigma).• Silver enhancement kit (Amersham
Pharmacia Biotech).• Osmium tetroxyde (Electron Micro-
scopy Sciences, Fort Washington, PA,USA).
125
8. Immunocytochemistry and In Situ Hybridization
Merighi8-aucorr.qxd 5/23/02 7:00 PM Page 125

126
M. Landry and A. Calas
Merighi8-aucorr.qxd 5/23/02 7:00 PM Page 126

• Epon (Electron Microscopy Sciences).• Lead citrate (Electron Microscopy Sci-
ences).
Procedure
See flow chart in Protocol #3. Furtherdetails on electron microscopy (EM)preparation protocols can be found inChapter 10.1. Perfuse the animal with an appropriate
fixative (usually 4% paraformalde-hyde).
2. Sample areas of interest and postfix inthe same fixative.
3. Cut 50 to 70 µm Vibratome sections,and subject them to permeabilizationpretreatments.
4. Hybridize with all digoxigenin- andbiotin-labeled probes together.
5. Perform posthybridization washingsaccording to the type of probes used(see above).
6. Preincubate sections with PBS contain-ing 0.5% to 1% BSA (PBS-BSA) for30 minutes at room temperature.
7. Incubate with an antibiotin antibodydiluted in PBS-BSA overnight at 4°C,then rinse in PBS.
8. Preincubate in blocking solution (PBS-BSA, gelatin, and NGS) for 2 hours atroom temperature.
9. Incubate with 1 nm gold-conjugatedantidigoxigenin antibody diluted 1:50in the blocking solution for 30 minutesat room temperature, then rinse inPBS.
10. Postfix in 4% paraformadehyde in PBSfor 10 minutes at room temperature,then rinse in PBS.
11. Incubate with a biotinylated-conjugat-ed antirabbit antibody diluted in PBS-BSA for 30 minutes at room tempera-ture, then rinse in PBS.
12. Incubate with a peroxidase-conjugatedavidin–biotin complex diluted inPBS-BSA for 2 hours at room tempera-ture, then rinse in PBS and Tris buffer.
13. Develop peroxidase reaction, then rinsein Tris buffer and water.
14. Perform silver enhancement, then rinsein water and PB.
15. Postfix in OsO4 1% in PB for 10 min-utes at room temperature.
16. Embed.17. Cut ultrathin sections and counterstain
them with lead citrate before EMobservation.
127
8. Immunocytochemistry and In Situ Hybridization
Figure 2. Multiple labelings on sections of the rat peripheral (a and c) and central (b and d–h) nervous system. (a) The HNPPdetection set gives a red fluorescence with exciter at 568 nm line leading to identify galanin mRNA containing neurons (arrow) inthe axotomized superior cervical ganglia. (c) No green fluorescence is detected on the same section with exciter at 488 nm line.Such a specificity allows the combination of fluorescent ISH to galanin mRNA visualized by the HNPP detection set (b) with afluorescein isothiocyanate (FITC)-conjugated–streptavidin visualization of biotin-labeled probes complementary to vasopressinmRNA (d) in hypothalamic magnocellular neurons of a salt-loaded rat supraoptic nucleus. The analysis at the confocal microscopeand the merge image (f ) lead to identify specific subcellular compartments involved in the synthesis of either galanin (perinuclearlocalization, red fluorescence) or vasopressin (green fluorescence, peripheral localization). The coupling between ICC with animmunoperoxidase protocol and ISH for vasopressin mRNA (e) or oxytocin mRNA (g) can be performed by using a silver-enhanced gold particle method (e) (Protocol #4) or a double enzymatic detection (g) (Protocol #5) identical to that of Figure 1c.Double labeled cells (arrows) are easily visualized with the former protocol. The latter needs to calibrate the development of theenzyme activity to be able to distinguish both colors. Triple labeling is shown in panels g and h (Protocol #5) and combine ICCfor galanin (brown precipitate) to double radioactive and enzymatic ISH for vasopressin and oxytocin mRNAs, respectively. Bothmicrographs correspond to the same field, but different focuses are necessary to identify the three markers that are not in the sameplane on the preparation. Some neurons are triple labeled (arrow). Besides, neurons containing oxytocin only (filled arrowhead),cells double labeled for vasopressin mRNA and galanin (open arrowhead) are seen. Scale bars: 50 µm (panels a, c, e, h, and g); 5µm (panels b, d, and f ). (See color plate A6.)
Merighi8-aucorr.qxd 5/23/02 7:00 PM Page 127

128
M. Landry and A. Calas
Figure 3. Schematic representation of double nonradioactive ISH protocols (a and b) and tyramide detection (c). (a) Two different mRNAs (1 and 2) are visualized by a double fluorescentISH method (see Protocol #2) using HNPP combined to Fast red and FITC as reporter molecules. (b) Two different mRNAs (1 and 2) are visualized by a double ISH method compatible withelectron microscope analysis (see Protocol #3) using peroxidase and silver-enhanced gold particles as reporter molecules. (c) Principle of the detection of a nonradioactive probe or a tissue anti-gen by the CARD method using FITC as a reporter molecule. Abbreviations: DAB, 3,3′-diaminobenzidine; FITC, fluorescein isothiocyanate; HNPP, 2-hydroxy-3-naphtoic acid-2′-pheny-lanilide phosphate; HRP, horseradish peroxidase.

129
8. Immunocytochemistry and In Situ Hybridization
Protocol 3. Flow chart diagram showing the main steps of the protocol for double ISH at the electron microscope level.
Merighi8-aucorr.qxd 5/23/02 7:01 PM Page 129

Protocol for Double LabelingCombining Gold Particles ISH andEnzymatic ICC at the ElectronMicroscopic Level (Protocol #4)
General Comments
Beside problems similar to those of Pro-tocol #3, the fixation must be suitable forboth ICC and ISH, and antigenicity mustremain unaltered. The reporter moleculesare identical to those of the previous proto-col, and the observation may be carried outeither at the light (Figure 2e) or electronmicroscopic (Figure 4a) level.
Material and Reagents
• PB, pH 7.4, 0.1 M, and PB, pH 7.4,0.1 M.
• 4% Paraformaldehyde in PB.• Digoxigenin-labeled nucleotides.• BSA.• Appropriate primary and secondary
antibodies.• Appropriate biotin–streptavidin rea-
gents.• Gelatin.• NGS.• Gold-conjugated antidigoxigenin an-
tibody.• DAB.• Silver enhancement kit.• Osmium tetroxyde.• Epon.• Lead citrate.
Procedure
See flow chart in Protocol #4. Furtherdetails on EM preparation protocols can befound in Chapter 10.1–6. See Protocol #3.
7. Incubate with a rabbit primary anti-body diluted in PBS-BSA overnightat 4°C, then rinse in PBS.
8-17. See Protocol #3.
Protocol for Triple Labeling CombiningEnzymatic ICC and Radioactive andEnzymatic Double ISH (Protocol #5)
General Comments
Such a multiple labeling needs to takecare of possible interferences between thevarious procedures. It can be applied tocryostat sections and cells. The sensitivityof the different techniques is likely to bedecreased by the multiplication of steps.The use of floating instead of thaw-mount-ed sections is likely to reduce this loss of sen-sitivity. A coating may be necessary, as inProtocol #1, but in the given example (Fig-ure 2, g and h), the high amount of mRNAallows to shorten the incubation time inNBT/BCIP, which results in an absence ofchemography and maintains the highspecificity of each labeling. A double label-ing protocol combining radioactive ISHand enzymatic ICC can be derived fromthis method by omitting the enzymatic ISH(Figure 1, d and e) (21,22,35,41).
Materials and Reagents
• PB, pH 7.4, 0.1 M, and PBS, pH 7.4,0.1 M.
• 4% paraformaldehyde in PBS.• 35S- and digoxigenin-labeled nucleo-
tides.• BSA.• Appropriate primary and secondary
antibodies.• Appropriate biotin–streptavidin rea-
gents. Tris buffers: buffer A: 0.1 MTris, pH 7.5, 1 M NaCl, 2 mMMgCl2; buffer B: 0.1 M Tris, pH 9.5,0.1 M NaCl, 5 mM MgCl2.
• Alkaline phosphatase-conjugated anti-digoxigenin antibody.
• DAB.• Tris buffer, 0.05 M, pH 7.6.• Alkaline phosphatase substrate (NBT/
BCIP).
130
M. Landry and A. Calas
Merighi8-aucorr.qxd 5/23/02 7:01 PM Page 130

131
8. Immunocytochemistry and In Situ Hybridization
Protocol 4. Flow chart diagram showing the main steps of the protocol for double labeling combining gold particles ISH andenzymatic ICC at the electron microscopic level.
Merighi8-aucorr.qxd 5/23/02 7:01 PM Page 131

• Photographic emulsion.• Developer and fixer.
Procedure
1. Perfuse the animal with an appropriatefixative (usually 4% paraformalde-hyde), remove the areas of interest, andpostfix them in the same fixative.
2. Cut cryostat sections and thaw-mountthem on slides.
3. Carry out hybridization with all dioxi-genin- and biotin-labeled probestogether.
4. Perform posthybridization washingsaccording to the type of probes used(see above).
5. Preincubate sections with buffer A con-taining 0.5% to 1% BSA (buffer A-BSA) for 30 minutes at room tempera-ture.
6. Incubate with a mixture of primaryand an antidigoxigenin antibodiesdiluted in buffer A-BSA overnight at4°C, then rinse in buffer A.
7. Incubate with a biotinylated-conjugat-ed antirabbit antibody diluted in bufferA-BSA for 30 minutes at room temper-ature, then rinse in buffer A.
8. Incubate with a peroxidase-conjugatedavidin–biotin complex diluted in PBS-BSA for 1 hour at room temperature,then rinse in buffer A and Tris buffer.
9. Develop the peroxidase reaction, thenrinse in Tris buffer and buffer A and B.
10. Incubate with NBT/BCIP diluted inbuffer B at room temperature in thedark.
11. Perform autoradiography.12. Mount and observe.
Protocol for Tyramide Amplification(Protocol #6)
General Comments
This detection system is based on thereaction of peroxidase with hydrogen per-oxide and the phenolic part of tyramide,which produces a quinone-like structurebearing a radical on the C2 group. Thisactivated tyramide then covalently binds totyrosine in close vicinity to the peroxidase(3,43,44). Such a reaction can be appliedeither to ICC (Figure 1f ) or ISH (Figure4b) detection with a similar protocol after
132
M. Landry and A. Calas
Figure 4. Double (a) (Protocol #4) and single (b) (Protocol#6) detection at the electron microscopic level. (a) Vaso-pressin mRNA is detected with digoxigenin-labeled probesvisualized by the silver-enhanced gold particle method (arrow-heads). Galanin peptide is identified by immunoperoxidase(arrows). Both labelings are visualized in the same magnocel-lular neuron of the rat supraoptic nucleus but they occupy dif-ferent subcellular domains. Galanin is stored in a perinucleararea, whereas vasopressin mRNA is prominent in the Nisslbodies at the periphery of the cell body. (b) An undilated sec-tion of an axon (short arrow) arising from hypothalamic mag-nocellular neurons is labeled within the internal layer of themedian eminence of a salt-loaded rat. Scale bar: 0.5 µm.
Merighi8-aucorr.qxd 5/23/02 7:01 PM Page 132

133
8. Immunocytochemistry and In Situ Hybridization
Protocol 5. Flow chart diagram showing the main steps of the protocol for triple labeling combining ICC and a radioactive andenzymatic double ISH.
Merighi8-aucorr.qxd 5/23/02 7:01 PM Page 133

peroxidase is bound to the target via anantibody. The tyramide can be conjugatedto a fluorochrome (Figure 1f ) or a hapten(Figure 4b). Hence, direct or indirect (seebelow and Figure 3c) detection of enzy-matically deposited tyramides is possibleand can be coupled to another labeling(Figure 1f ) (5,14).
Material and Reagents
• Digoxigenin-labeled nucleotides.• Appropriate primary and secondary
antibodies.• Tyramide amplification kit.• Appropriate biotin–streptavidin rea-
gents.• Tris buffer: 0.1 M Tris-HCl, pH 7.5,
0.15 M NaCl.• DAB.• Tris buffer, 0.05 M, pH 7.6.• TNB: Tris-NaCl blocking buffer: 0.1
M Tris-HCl, pH 7.5, 0.15 M NaCl,0.05% Tween 20.
• TNT: Tris-NaCl Tween buffer: 0.1 MTris-HCl, pH 7.5, 0.15 M NaCl,0.5% DuPont Blocking reagent.
Procedure
See flow chart in Protocol #6.1. Perform hybridization with a digoxi-
genin-labeled probe and/or incubationwith the primary antibody of the ICCdetection.
2. Preincubate in TNB for 30 minutes atroom temperature.
3. Incubate with a peroxidase-conjugatedsecondary or an antidigoxigenin anti-body diluted in TNB for 30 minutes atroom temperature, then rinse in TNT.
4. Incubate with biotinylated tyramidediluted in its proper amplification dilu-ent for 10 minutes at room tempera-ture, then rinse in TNT.
5. Incubate with peroxidase-conjugated
streptavidin diluted in TNB for 2hours at room temperature, then rinsein TNT and Tris buffer.
6. Develop the peroxidase reaction, thenrinse in Tris buffer.
7. Continue the steps corresponding tothe coupled reaction.
The biotinylated tyramide can be re-placed by a fluorochrome-conjugated tyra-
134
M. Landry and A. Calas
Protocol 6. Flow chart diagram showing the main steps ofthe protocol for tyramide amplification.
Merighi8-aucorr.qxd 5/23/02 7:01 PM Page 134

mide, which leads to a direct observationafter mounting in an antifading medium.
RESULTS AND DISCUSSION
General Comments
Preparation of the material
Fixation
Fixation is the first and a crucial step forISH and ICC, since it must allow both agood morphological preservation and agood efficiency of the histochemical reac-tions, two criteria often being contradicto-ry. The fixation needed for ICC and ISH isoften quite different, and these require-ments make it difficult, in some cases, tocombine the two techniques on the samepreparation. Two kinds of fixative can beconsidered: chemical and physical fixatives.
Among the former, precipitating fixa-tives give a nice morphology, but are gener-ally not well suited for RNA detection (seeReference 10). However, the Clarke andCarnoy fixatives are widely used for cyto-genetic studies, and a modified Clarkesolution proved to be a good alternative forISH on amphibian oocytes (28). Non-precipitating aldehydic fixatives have beenintroduced in ISH studies in the 1980s,and 4% paraformaldehyde is now the mostcommon fixative for both ICC and ISHand their combination (31). The fixationby the formaldehyde or its derivatives islargely reversible. Thus, the chemical prop-erties of nucleic acids are not modified bythe fixation and hybrids. The melting tem-perature (Tm) remains unchanged uponaldehyde fixation (6). Despite these favor-able properties, it is preferable to use slightconcentrations of formaldehyde on ner-vous tissue (12) to allow a better accessibil-ity of the probes to the target. The glu-taraldehyde is known to be of a poor
interest in ISH studies since it creates adense network of double bonds making theprobe penetration difficult (see Reference10). Finally, the use of picric acid should bebanned since it modifies chemical proper-ties of the probe and can alter it.
Although best suited for ICC, the fixa-tion by perfusion often maintains, in thebrain, some molecules that can react withthe hybridization solution and induce ahigh background (Reference 34 andunpublished observations). Thus, immer-sion fixation or fixation on slides after sec-tioning, are usually the most appropriateways to prepare tissues. However, perfusionis sometimes necessary for studies at theelectron microscope level, and somemRNA species can hardly be detected atthe ultrastructural level in such conditions.A possible requirement for a specific type offixation, either for protein or for mRNAdetection, is in fact the most critical restric-tion to the coupling between ICC and ISH.
Physical fixations have also been usedand proved to be of great interest, at leastfor double ISH. Thus, drying is a very easyway to fix nervous tissues, and air-driedcryostat sections (8) or cell cultures (17) aremore sensitive to mRNA detection thanfixed material. However, without chemicalfixation, ICC is unlikely to be performedand cannot be combined with ISH on thesame preparation. Therefore, the use ofsuch a protocol must be restricted to dou-ble ISH studies. Also, microwave heatinghas been reported to improve hybridizationefficiency without altering tissue morphol-ogy (20).
Storing of Material
The nervous tissue preparations can bestored at -20°C, after or without fixation, insealed boxes that may contain a chemical toabsorb humidity. Importantly, the sectionsor cells must have been carefully air-driedbefore freezing. There is no significant
135
8. Immunocytochemistry and In Situ Hybridization
Merighi8-aucorr.qxd 5/23/02 7:01 PM Page 135

decrease of the mRNA content for a periodup to 1 year if slides are properly stored.
Compatibility of the Combined Reactions
A double labeling experiment needs thatthe two reactions are compatible in terms offixation (see above), pretreatments, temper-ature of reaction, and detection. There is nomajor hindrance to the detection of twomRNAs. In contrast, a good preservation ofthe antigens (or mRNAs) in the conditionsof the ISH (or ICC) reaction is a majorcondition for coupling ICC and ISH.
Pretreatments
No specific pretreatments are requiredfor combining two detections, but standardpretreatments for ICC or ISH are still need-ed as long as they are consistent with thecoupling. Preincubations aiming to avoidnonspecific labeling, that is prehybridiza-tion and/or the blocking step for ICC, areuseful prior to each reaction and do notinterfere with the coupled reaction. On theother hand, permeabilization steps for ISHstudies, using high amounts of proteinase,are likely to denature tissue antigens. Pro-teinase seems to be useless on cryostat sec-tions and can be replaced by a freeze-thawprotocol on vibratome sections or on cells.
Temperature of Reactions
The temperatures needed for thehybridization or posthybridization stepsdepend on the Tm of the probes and canreach 70°C for the riboprobes. Subse-quently, double ISH experiments must becarried out either with oligoprobes only orwith riboprobes only, but a mixture of thetwo types of probes appears almost impos-sible. Similarly, the temperatures usuallyrange between 4° and 37°C for ICC, andit appears difficult to preserve antigenicityafter performing ISH with riboprobes. On
the contrary, temperatures needed for ISHwith oligoprobes are compatible with ICCreactions.
The temperature used for posthybridiza-tion washings may be high (e.g., SSC 1×; 4times for 15 minutes at 55°C followed by30 minutes at room temperature whenusing oligoprobes) to efficiently eliminatepossible background staining. In contrast, alower temperature (e.g., twice in 2× SSC for30 minutes each at room temperature; twicein 0.1× SSC for 30 minutes each at hybri-dization temperature when using oligo-probes) is preferable for combining withICC or for electron microscope studies toensure a better preservation of antigenicityor ultrastructural morphology, respectively.
Order of the Two Detections
When combining ICC and ISH, it hasto be decided what reaction should be car-ried out first. Performing ICC prior to ISHbrings up two major problems. First, theimmunohistochemical reagents must re-main devoid of RNase, and the detectionof low amounts of mRNA make it neces-sary to use RNase inhibitors. Second, thedetection system must not be altered orhindered by the subsequent ISH reactionand, conversely, must not prevent theaccessibility of the probe to the targetmRNA. In particular, nonspecific ISHlabeling after immunoperoxidase reactioncan be reduced either by acetylation (4),which prevents cation binding to diamino-benzidine reaction product, or by a prehy-bridization step (35) using a tRNA-en-riched solution. If the antigen can stand upto the ISH conditions, it is then possible toinvert the order of the two detections. Sucha protocol makes it easier to preservemRNAs. However, even if the hybridiza-tion step is carried out first, the develop-ment of ISH, either radioactive or nonra-dioactive, should be performed after ICCto avoid alteration of antigenicity (21,41).
136
M. Landry and A. Calas
Merighi8-aucorr.qxd 5/23/02 7:01 PM Page 136

Compatibility of the Detection Systems
First, the signals given by each techniqueshould be readily distinguishable. Second,the detectable molecule, that is the reportermolecule introduced chemically or enzy-matically, should not interfere with thehybridization reaction or the stability ofthe resulting hybrid. Moreover, it shouldremain accessible to the detection systemused later on. The most common protocolsof multiple labelings associate a radioactiveto an enzymatic detection. Despite itslower sensitivity, the silver-enhanced goldlabeling can also be used as an alternativeto the radioactive reaction, since the goldparticles can be clearly identified in bright-field or epi-illumination observation. Iftwo enzymatic labelings have to be per-formed, the reaction products must be ofsharply different colors (e.g., purple andbrown) (see Protocol #5).
Recently, new protocols arose that allowmultiple fluorescent detections (11; see alsothe section entitled New Trends). Besideclassical fluorochromes, fluorescent dyesproved to be useful to detect someenzymes. As an example, the red fluores-cence of the HNPP compound used inProtocol 2 is specifically detected with anexciter at the 568 nm line (Figure 2a). Nogreen fluorescence is observed with anexciter at the 488 nm line (Figure 2c). Theefficiency and specificity of this detectionset expands the range of fluorescence-basedtechniques available for multiple labelings(see Protocol #2) (Figure 2, b, d, and f ).
At the electron microscope level, animportant feature is the resolution of thereporter molecules. Autoradiographic stud-ies may require the use of 3H instead of 35Sto sharpen the resolution of the signal.Nevertheless, beside the difficulties of sucha technique, the resolution remains poor.Also, enzymatic products are known to dif-fuse throughout the cytoplasm. However,the resolution is fine enough to identify the
positive subcellular compartments, and forISH, enzymatic preembedding appears tobe a good compromise between sensibilityand resolution (39). In multiple labelingstudies, an enzymatic reaction can be com-bined to silver-enhanced gold staining. Thelatter represents, to date, the marker ensur-ing the best resolution for pre-embeddingICC (1,2) and ISH (23,32,33,42) studies,provided that the duration and tempera-ture of the silver enhancement procedureare well optimized.
A postfixation is usually advised afterincubation with gold particle-conjugatedantibody and may result in a possiblemasking of antigenic sites.
Sensitivity and Specificity
The sensitivity of the ISH reaction is notaltered by coupling to another mRNAdetection if both reactions use either oligo-(5) or riboprobes. When performing dou-ble ISH according to Protocol #1, we didnot notice a decrease of the nonradioactiveISH sensitivity due to the use of DTT, evenat high concentrations. In contrast, com-bining radioactive ISH and ICC results in adecrease of the ISH signal by 30% (unpub-lished data), probably because the incuba-tions in stringent solutions are damaging tothe immunocytochemical reaction.
Regarding the specificity of each com-bined reaction, a coating with 3% collodi-on in amyl acetate has proved to be neces-sary after double ISH and before dipping(Protocol #1) to avoid chemographyinducing nonspecific labeling for bothradioactive and enzymatic reactions (46).Otherwise, no artifacts are induced by thecoupling if there is no cross reactivitybetween the detection systems.
Other Protocols
The protocols described should be con-sidered as general protocols using oligo-
137
8. Immunocytochemistry and In Situ Hybridization
Merighi8-aucorr.qxd 5/23/02 7:01 PM Page 137

probes for multiple labelings on cryostat orvibratome sections. They need few changesto be adapted to other material.
Cell cultures can be hybridized as cryo-stat sections after being air-dried and/orpermeabilized by a freeze-thawing protocolor by using Triton® X-100 (18,19). Forclassical histological analysis, human sam-ples are usually embedded in paraffin thathas to be removed before an ICC or ISHreaction. Paraffin embedding provides awell preserved morphology, but the proto-col of inclusion may be inconsistent withsome ICC reactions, and it induces adecrease in the sensitivity of the ISH signal.Thus, the use of riboprobes appears highlyrecommended for such samples. As analternative, some authors replaced paraffinby gelatin or polyethylene glycol (PEG),which allows the recovery of high sensitivi-ty (7). Also, slices can be processed formultiple labeling after sectioning (see alsothe section entitled Compatibility withOther Techniques).
Riboprobes must be hybridized accord-ing to their specific protocol, but the hy-brids can be visualized by the same devicesas those used for oligoprobes.
Choice of the Most Suitable Protocol
The choice of the protocol mainly de-pends on the desired application. Also, themost suitable markers are different fromone purpose to another. Thus, we will giveexamples of typical applications for each ofthe protocols previously listed.
Radioactive and Enzymatic Double ISH
This protocol has been broadly used andproved to be reliable and easy to performeither with riboprobes (37) or oligoprobes(5,24). Such a protocol allows one to locatea given mRNA synthesizing neuron amonga chemically identified population. It can,for instance, give clues to the nature of a
neuropeptide receptor, e.g., presynaptic orpostsynaptic (5), and lead to distinguishingbetween the physiological roles of differentreceptor subtypes. Beside its high sensitivi-ty, the use of radioactive probes gives theopportunity to quantify one signal (25,26)and, hence, to carry out functional studies.Furthermore, double ISH experiments, fol-lowed by the quantification of the radioac-tive signal, can demonstrate that the level ofa gene expression may be regulated by somephysiological or experimental stimulationsonly in a restricted population characterizedby its neurochemical phenotype identifiedby the nonradioactive signal. In particular,this leads to quantitatively studying theexpression of functional markers of cellularactivity (transcription factors, second mes-sengers) in a given neuronal population.
Double Fluorescent ISH
Since these detection procedures appearless sensitive, at least in the central nervoussystem, than the previous ones, their use isnot well suited to mapping cell populationsthat express a given mRNA, especially ifthe mRNA expression is weak. In contrast,these techniques appear more appropriatefor subcellular localization studies. Theirmajor advantage lies in a high resolution ofthe fluorescent signals, especially when ob-served with a confocal microscope, thusmaking possible the study of intracellularlocalization of mRNAs. This protocol pro-vided evidence for a differential subcellularcompartmentalization of G proteins andvasopressin mRNAs within the same hypo-thalamic magnocellular neuron (39) orbetween two neuropeptides transcripts,namely galanin and vasopressin (Figure 2,b, d, and f ), in the same model.
Double ISH at the Electron Microscope Level
Although double ISH at the electron
138
M. Landry and A. Calas
Merighi8-aucorr.qxd 5/23/02 7:01 PM Page 138
microscope level cannot be considered as aroutine technique, it provides unsurpassedinformation on the relative distribution oftwo mRNA species at the subcellular level.However, appropriate controls are neededto ensure the specificity of the technique.
Double Labeling Combining ICC and ISH
This double labeling offers a wide rangeof applications, both at the optic and elec-tron microscope levels depending on thechosen markers. For light microscopy, anenzymatic ICC can be combined withmRNA detection by using either the sil-ver-enhanced gold particle protocol (seeProtocol #4) or radioactive probes (seeProtocol #5 modified by omitting theenzymatic ISH).
This coupling represents, first, an alter-native to double ICC or double ISH toidentify possible colocalizations betweenheterologous protein and mRNA (21,22,41). Second, it allows functional studieswhen visualizing homologous protein andmRNA. It makes it possible to check thereality of the protein synthesis in messen-ger-containing neurons (Figure 1e). On thecontrary, it may point out a possible lack ofone gene expression product (12,41) (seealso Figure 1e). If the peptide is not de-tectable, neurons can be seen as active cells,where translation products may be export-ed to nerve endings at a higher rate thanthey are synthesized. In contrast, a neuronin which a transcript is not visualized,although the corresponding peptide hasbeen identified, may be considered as aresting cell, storing molecules that are like-ly to be released upon stimulation. Thus,combining ICC and ISH documents thefunctional heterogeneity of neuronal popu-lations that were usually considered as awhole.
For these studies, the use of radioactive-ly labeled probes is highly recommended
because of their high sensitivity. Moreover,silver grains are easily distinguished fromperoxidase precipitate (Figure 1c versusFigure 1, d and e). In some cases, it may beof importance to identify which subcellu-lar compartment is actually accumulatingthe protein or the messenger (e.g., den-drites or axons). Then, ISH can be per-formed by using a fluoresent method or adigoxigenin-labeled probe detected by thesilver-enhanced gold particle system.Whereas the sensitivity of the latter is lowerthan the autoradiographic procedure, itsresolution is excellent (Figure 2e) andallows studies at the electron microscopiclevel (Figure 4a).
Triple Labeling Combining EnzymaticICC and Radioactive and EnzymaticDouble ISH
This protocol is a combination of oth-ers. One probe has to be detected with anenzymatic marker, and a good timing ofthe development of the two enzymaticreactions must be found. This triple label-ing gives valuable information about theprecise distribution of a peptide betweenthe two populations identified upon thebasis of their transcript content (13,22)(Figure 2, g and h). In summary, the mainapplications for which the protocols pre-sented here can be divided are as follows:
1. Anatomical localization: multiple label-ings allow one to describe the cellularor intracellular distribution of a givengene expression product in a chemical-ly identified population.
2. Functional studies: given the nature ofthe target genes (e.g., receptors, secondmessenger molecules, inducible tran-scription factors) and the possible vari-ations of their mRNA amounts, multi-ple labelings can document the roles ofneurochemicals and their implicationsin functional regulations.
139
8. Immunocytochemistry and In Situ Hybridization
Merighi8-aucorr.qxd 5/23/02 7:01 PM Page 139

Controls
Usual control experiments, that aim toinvestigate possible excess or deficiencyerrors when performing ICC or ISH, arestill necessary for multiple labelings. Be-sides these controls specific to each reac-tion, possible interferences must be alsochecked. An easy way is to compare theresults of the multiple labelings to thoseobtained when performing each labelingseparately. Another advantadge is to evalu-ate a possible decrease of sensitivity in-duced by the coupling procedure. Whenpossible, it may be useful to invert theorder of two detections to determine possi-ble interactions between different steps.Changing the detection systems alsoensures the specificity of the labelings.
Compatibility with Other Techniques
Other techniques can be coupled toICC and/or ISH on the same preparation.Hodological tracing is one example of aneuroanatomical method that needs an invivo injection. Such a treatment of the ani-mal does not affect the detection of pro-teins and/or mRNAs.
The effects of exogenous drugs as well asphysiological or pathological conditionscan be analyzed by their consequences onthe relative distribution and/or intensity ofthe combined stainings.
Also, binding studies can be combinedwith ICC and/or ISH. Of particular inter-est is the recent development of fluorescentligands that allow studies at the cellularand subcellular levels (30) and make it pos-sible to directly compare the synthesis rateof a given receptor with its localization androuting within living cells upon variousstimulations.
New Trends
Improvements in the ability of multiple
labelings to localize gene products liemainly in amplification procedures. Therecent introduction of the catalyzedreporter deposition (CARD) method inmorphological studies represents a goodexample of new efforts aiming to increasethe sensitivity of the techniques (3,19,43).The CARD method is based on the use oftyramides as described in Protocol #6. Ourprocedure can be applied either for ICC orISH detection. The tyramide amplificationsequence can be inserted within other pro-tocols, and the specific reagents requiredfor this detection (amplification diluent,blocking solution) do not affect the cou-pled reactions. The high signal generationcapacity of the peroxidase tyramide reac-tion allows the detection of low amountsof target molecules. The diffusion of thedeposited tyramide limits the resolution ofthe technique which remains suitable forelectron microscope ISH studies (Figure4b) (23) or for ICC localization of mem-brane-bound receptors (Figure 1f ) (5). Adramatic amplification of the messengersmight also be obtained by in situ reversetranscription polymerase chain reaction(RT-PCR) methods. However, with a fewremarkable exceptions (see References 10,27, and 29), technical problems arosewhich slowed down the development ofthis method. In particular, the good con-ditions for the amplification rounds arenot easy to adjust, and the fixation mustrepresent an acceptable compromisebetween the penetration of reagents andthe retention of the amplification prod-ucts. In situ RT-PCR methods are dis-cussed in Chapter 9.
Together with the gain in sensitivity, thedevelopment of highly resolutive tech-niques allows one to further study thecompartmentalization of gene productsand especially the routing of proteins andmRNAs. Adequation between proteins andtheir corresponding mRNA in specific sub-cellular domains provided evidence for a
140
M. Landry and A. Calas
Merighi8-aucorr.qxd 5/23/02 7:01 PM Page 140

local synthesis of proteins on their site ofaction, as it has been well documented fordendritic synthesis of bioactive molecules(33,38).
Neuroanatomical techniques are nowbroadly used in ontogenesis studies. Togive functional clues, it is of importance todetermine the period of gene expressionthroughout development. Thus, a timecomponent must be taken into account inaddition to the spatial localization of geneproducts. Thus, neuroanatomical methodsled to describe hierarchies in regulatoryinteractions (15). Moreover, the codetec-tion of a protein and its messenger is essen-tial, and discrepancies identified betweentheir relative distribution suggested a diffu-sion of the protein in tissues that do notexpress the transcript (9). Furthermore, themultiple labeling methods allow one to fol-low the regulation of a gene expression indifferentiating neurons that are furtheridentified by their neurochemical pheno-type. Double ISH using riboprobes is thuslikely to be a very useful technique for thisapproach, since it allows studies on wholemount embryos as well as on paraffin-embedded tissue.
A common feature of functional studiesis now the use of genetically-modified sys-tems. Multiple labelings represent usefultools to colocalize endogenous and exoge-nous genes and thus to identify cells or tis-sues that are expressing a tagged transgene.
In all these models, quantifying the geneexpression has become an essential feature,and numerous devices are in developmentto quantitatively analyze radioactive or flu-orescent signals by using the so-called betaimagers and imaging softwares.
A broad array of multiple labeling meth-ods is now available and represent essentialapproaches not only for anatomical butalso for functional studies. Their growinginterest depends on their ability to answeran increasing number of questions relatedto cellular or developmental neurobiology.
ACKNOWLEDGMENTS
We are grateful to Prof. Tomas Hökfelt(Department of Neuroscience, KarolinskaInstitutet, Stockholm, Sweden) in whoselaboratory some of the described protocolshave been set up or improved. We thankthe Association pour la Recherche Médi-cale en Aquitaine for providing financialsupport to the authors.
REFERENCES
1.Bernard, V., P. Somogyi, and J.P. Bolam. 1997. Cellu-lar, subcellular, and subsynaptic distribution of AMPA-type glutamate receptor subunits in the neostriatum ofthe rat. J. Neurosci. 17:819-833.
2.Bernard, V., O. Laribi, A.I. Levey, and B. Bloch. 1998.Subcellular redistribution of m2 muscarinic acetylcho-line receptors in striatal interneurons in vivo after acutecholinergic stimulation. J. Neurosci. 18:10207-10218.
3.Bobrow, M.N., T.D. Harris, K.J. Shaughnessy, andG.J. Litt. 1989. Catalyzed reporter deposition, a novelmmethod of signal amplification. Application to im-munoassays. J. Immunol. Methods 125:279-285.
4.Brahic, M., A.H. Haase, and E. Cash. 1984. Simulta-neous in situ detection of viral RNA and antigens.Proc. Natl. Acad. Sci. USA 81:5445-5448.
5.Broberger, C., M. Landry, H. Wong, J.N. Walsh, andT. Hökfelt. 1997. Subtypes Y1 and Y2 of the neuro-peptide Y receptor are respectively expressed in pro-opiomelanocortin and neuropeptide Y-containing neu-rons of the rat hypothalamic arcuate nucleus. J.Neuroendocrinol. 66:393-408.
6.Brudlag, D., C. Schlehuber, and J. Bonner. 1977. Pro-perties of formaldehyde treated nucleohistone. Bio-chemistry 8:3214.
7.Clayton, D.F. and A. Alvarez-Buylla. 1989. In situhybridization using PEG-embedded tissue and ribo-probes: increased cellular detail coupled with high sen-sitivity. J. Histochem. Cytochem. 3:389-393.
8.Dagerlind, A., K. Friberg, A.J. Bean, and T. Hökfelt.1992. Sensitive messenger RNA detection using un-fixed tissue: combined radioactive and non-radioactivein situ hybridization histochemistry. Histochemistry98:39-49.
9.Driever, W. and C. Nusslein-Volhard. 1988. The bicoidprotein determines position in the Drosophila embryoin a concentration-dependent manner. Cell 54:95-104.
10.Fournier, J.G. 1994. Histologie Moléculaire. Tech-nique and Documentation. Lavoisier, Paris.
11.Grino, M. and A.J. Zamora. 1998. An in situ hybridi-zation histochemistry technique allowing simultaneousvisualization by the use of confocal microscopy of threecellular mRNA species in individual neurons. J. Histo-chem. Cytochem. 46:753-759.
12.Guitteny, A.F., P. Böhlen, and B. Bloch. 1988. Analy-sis of vasopressin gene expression by in situ hybridiza-
141
8. Immunocytochemistry and In Situ Hybridization
Merighi8-aucorr.qxd 5/23/02 7:01 PM Page 141

tion and immunohistochemistry in semi-thin sections.J. Histochem. Cytochem. 36:1373-1378.
13.Hrabovszky, E., M.E. Vrontakis, and S.L. Pertersen.1995. Triple-labeling method combining immunocy-tochemistry and in situ hybridization histochemistry:demonstration of overlap between fos-immunoreactiveand galanin mRNA-expressing subpopulations ofluteinizing hormone-releasing hormone neurons infemale rats. J. Histochem. Cytochem. 4:363-370.
14.Hunyady, B., K. Krempels, G. Harta, and E. Mezey.1996. Immunohistochemical signal amplification bycatalyzed reporter deposition and its application indouble immunostaining. J. Histochem. Cytochem. 12:1353-1362.
15.Ingham, P.W. 1988. The molecular genetics of embry-onic pattern formation in Drosophila. Nature 335:25-34.
16.Kagiyama, N., S. Fujita, M. Momiyama, H. Saito, H.Shirahama, and S.H. Hori. 1992. A fluorescent detec-tion method for DNA, hybridization using 2-hydroxy-3naphthoic acid-2′-phenylanilide phosphate as a subtratefor alkaline phosphatase. J. Histochem. Cytochem.25:467-471.
17.Kerekes, N., M. Landry, M. Rydh-Rinder, and T.Hökfelt. 1997. The effect of NGF, BDNF and bFGFon galanin message associated peptide in cultured ratdorsal root ganglia. Brain Res. 754:131-141.
18.Kerekes, N., M. Landry, and T. Hökfelt. 1999. Leu-kemia inhibitory factor (LIF) regulates galanin/GMAPexpression in cultured mouse dorsal root ganglia with anote on in situ hybridization technology. J. Neurosci.89:1123-1134.
19.Kerstens, H.M.J. and P.J. Poddighe. 1995. A novel insitu hybridization signal amplification method basedon the deposition of biotinylated tyramide. J. Histo-chem. Cytochem. 4:347-352.
20.Lan, H.Y., W. Mu, Y.Y. Ng, and D.J. Nikolic-Pater-son. 1996. A simple, reliable, and sensitive method fornonradioactive in situ hybridization: use of microwaveheating to improve hybridization efficiency and pre-serve tissue morphology. J. Histochem. Cytochem.3:281-287.
21.Landry, M., A. Trembleau, R. Arai, and A. Calas. 1991.Evidence for a colocalization of OT mRNA and galanin:a study combining in situ hybridization and immu-nohistochemistry. Mol. Brain Res. 10:91-95.
22.Landry, M., D. Roche, E. Angelova, and A. Calas.1997. Expression of galanin in gypothalamic magnocel-lular neurons of lactating rats. Coexistence with vaso-pressin and oxytocin. J. Endocrinol. 155:467-481.
23.Landry, M. and T. Hökfelt. 1998. Subcellular localiza-tion of preprogalanin mRNA in perikarya and axons ofhypothalamo-posthypophyseal magnocellular neurons:an in situ hybridization study at the light and electronmicroscope level. J. Neurosci. 84:897-912.
24.Landry, M., K. Aman, and T. Hökfelt. 1998. The gal-anin-R1 receptor in anterior and mid-hypothalamus:distribution and regulation. J. Comp. Neurol. 399:321-340.
25.Le Moine, C. and B. Bloch. 1995. D1 and D2 dopa-mine receptor gene expression in the rat striatum: sen-sitive cRNA probes demonstrate prominent segrega-tion of D1 and D2 mRNAs in distinct neuronal
populations of the dorsal and ventral striatum. J.Comp. Neurol. 355:418-426.
26.Le Moine, C., V. Bernard, and B. Bloch. 1994. Quan-titative in situ hybridization, using radioactive probesin the study of gene expression in heterocellular sys-tems. In K.H.A. Choo (Ed.), Methods in MolecularBiology, In Situ Hybridization Protocols, Vol. 33.Humana Press, Totowa.
27.Martinez, A., M.J. Miller, K. Quinn, E.J. Unsworth,M. Ebina, and F. Cuttitta. 1995. Non-radioactivelocalization of nucleic acids by-direct in situ PCR andin situ RT-PCR in paraffin-embedded sections. J.Histochem. Cytochem. 8:739-747.
28.Melton, D.A. 1987. Translocation of a localized mater-nal mRNA to the vegetal pole of Xenopus oocytes.Nature 328:80-82.
29.Morel, G., M. Berger, B. Ronsin, S. Recher, S. Ricard-Blum, H.C. Mertani, and P.E. Lobie. 1998. In situreverse transcription-polymerase chain reaction. Ap-plications for light and electron microscopy. J. Biol. Cell90:137-154.
30.Nouel, D., M.P. Faure, J.A. St. Pierre, R. Alonso, R.Quirion, and A. Beaudet. 1997. Differential bindingprofile and internalization process of neurotensin vianeuronal and glial receptors. J. Neurosci. 17:1795-1803.
31.Pardue, M.L. 1987. In situ hybridization, p. 179. InB.D. Hames and S.J. Miggins (Eds.), Nucleic AcidHybrydization. IRL Press, Oxford.
32.Prakash, N., S. Fehr, E. Mohr, and D. Richter. 1997.Dendritic localization of rat vasopressin mRNA: ultra-structural analysis and mapping of targeting elements.J. Neurosci. 9:523-532.
33.Racca, C., A. Gardiol, and A. Triller. 1997. Dendriticand postsynaptic localizations of glycine receptor αsubunit mRNAs. J. Neurosci. 17:1691-1700.
34.Schachter, G.S. 1987. Studies of neuropeptide geneexpression in brain pituitary, p. 111. In K.L. Valenti-no, J.H. Eberwin, and J.D. Barchas (Eds.), In SituHybridization. Applications to Neurobiology. OxfordUniversity Press, New-York.
35.Shivers, B.D., R. Harlan, D.W. Pfaff, and B.S.Schachter. 1986. Combination of immunocytochem-istry and in situ hybridization in the same tissue sectionof rat pituitary. J. Histochem. Cytochem. 34:39-43.
36.Steinbusch, H.W., A.A. Verhofstad, and H.W. Joost-en. 1978. Localization of serotonin in the central ner-vous system by immunohistochemistry: description ofa specific and sensitive technique and some applica-tions. Neuroscience 3:811-819.
37.Svenningsson, P., C. Le Moine, B. Kull, R. Sunahara,B. Bloch, and B.B. Fredholm. 1997. Cellular expres-sion of adenosine A 2A receptor messenger RNA in therat central nervous system with special reference todopamine innervated areas. J. Neurosci. 4:1171-1185.
38.Torre, E.R. and O. Steward. 1996. Protein synthesiswithin dendrites: glycosylation of newly synthesizedproteins in dendrites of hippocampal neurons in cul-ture. J. Neurosci. 16:5967-5978.
39.Trembleau, A. and F.E. Bloom. 1996. Spatial segrega-tion of Gαs mRNA and vasopressin mRNA to distinctdomains of the rough endoplasmic reticulum withinsecretory neurons of the rat hypothalamus. J. Mol.
142
M. Landry and A. Calas
Merighi8-aucorr.qxd 5/23/02 7:01 PM Page 142

Cell. Neurosci. 7:17-28.40.Trembleau, A., A. Calas, and M. Fevre-Montange.
1990. Ultrastructural localization of oxytocin mRNAin the rat hypothalamus by in situ hybridization using asynthetic oligonucleotide. Mol. Brain Res. 8:37-45.
41.Trembleau, A., D. Roche, and A. Calas. 1993. Com-bination of non-radioactive in situ hybridization withimmunohistochemistry: a new method allowing thesimultaneous detection of two mRNAs and one anti-gen in the same section. J. Histochem. Cytochem.41:489-498.
42.Trembleau, A., M. Morales, and F.E. Bloom. 1996.Differential compartmentalization of vasopressin mes-senger RNA and neuropeptide within the rat hypo-thalamo-neurohypophysial axonal tracts: light andelectron microscopic evidence. J. Neurosci. 1:113-125.
43.Van Gijlswijk, R.P.M., H.J.M.A.A. Zijlmans, J. Wie-gant, M.N. Bobrow, T.J. Erickson, K.E. Adler, H.J.
Tanke, and A.K. Raap. 1997. Fluorochrome-labeledtyramides: use in immunocytochemistry and fluores-cence in situ hybridization. J. Histochem. Cytochem.45:375-382.
44.Van Gijlswijk, R.P.M., D.J. van Gijlswijk-Janssen,A.K. Raap, M.R. Daha, and H.J. Tanke. 1996.Enzyme labelled antibody-avidin complexes, new flex-ible and sensitive immunochemical reagents. J.Immunol. Methods 189:117-127.
45.Xu, Z.-Q., T.-J. Shi, M. Landry, and T. Hökfelt.1996. Evidence for galanin receptors in primary senso-ry neurons and effect of axotomy and inflammation.Neuroreport 8:237-242.
46.Young, W.S. III. 1989. Simultaneous use of digoxige-nin and radiolabeled oligodeoxyribonucleotide probesfor hybridization histochemistry. Neuropeptides 13:271-275.
143
8. Immunocytochemistry and In Situ Hybridization
Merighi8-aucorr.qxd 5/23/02 7:01 PM Page 143

145
OVERVIEW
The development of polymerase chainreaction (PCR) produced a technologicalbreakthrough in nucleic acid detection byincreasing molecular sensitivity capabili-ties. In situ PCR is a marriage of two estab-lished technologies: PCR and in situhybridization based on the amplificationwithin intact cells or tissue sections of spe-cific DNA sequences, or mRNA species, tolevels detectable by in situ hybridizationand/or immunohistochemistry. Thus, PCRresults can be correlated spatially with cellmorphology.
This chapter focuses on the applicationof in situ PCR on detection of mRNA inrat brain sections. We provide a detailedone-day protocol for direct in situ reversetranscription PCR (RT-PCR) using incor-poration of nonradioactive nucleotides(digoxigenin-11-dUTP) in the PCR prod-uct and detection with an antidigoxigeninantibody conjugated with alkaline phos-phatase. We have used this approach forlocalization of 90 kDa ribosomal S6 kinase(RSK) mRNA in adult rat brain. Initially,we investigated the distribution of RSK1,
RSK2, and RSK3 mRNA in rat brain byconventional in situ hybridization usingradiolabeled oligonucleotides. The signalswere, however, too weak for localization inbrain section. Accordingly, we applied insitu RT-PCR to improve the sensitivity byPCR amplification of the target and byincreasing the signal with immunocyto-chemistry. Using this protocol, RSKmRNA was successfully visualized in neu-ronal cell bodies throughout the adult ratbrain (Figures 1 and 2).
BACKGROUND
In situ hybridization is an invaluable toolto identify, in tissue samples, the cell typethat contains a specific nucleic acid. In situhybridization techniques represent the his-tochemical counterparts to Northern andSouthern blot analysis in molecular biology.These techniques enable investigators todelineate which cells in a mixed populationexpress the mRNA of interest or harbor aparticular viral DNA (28). In situhybridization permits the localization ofnuclear acid sequences at the cellular level
Cellular and Molecular Methods in Neuroscience ResearchEdited by A. Merighi and G. Carmignoto
In Situ Reverse Transcription PCR forDetection of mRNA in the CNS
Helle Broholm1 and Steen Gammeltoft2
1Rigshospitalet Copenhagen University Hospital, Department ofNeuropathology, Copenhagen; and 2Department of ClinicalBiochemistry, Glostrup Hospital, Copenhagen University, Glostrup, Denmark, EU
9
Merighi9-aucorr.qxd 5/23/02 7:09 PM Page 145

with high specificity, but this is sometimesovershadowed by low detection sensitivity(19,25). The threshold for detection ofmRNA are approximately 10 copies percell, and most conventional nonisotopicprotocols do not detect single-copy genes.Thus, constraints on the detection limits ofthe assay minimize its effectiveness in evalu-ating low level nucleic acid expression (seeChapter 8 for further discussion and fordetails on in situ hybridization protocols).
In situ PCR has been applied for thedetection of low abundance viral DNA andmRNA in tissue and cellular samples. Thefirst successful in situ PCR was described10 years ago, where lentiviral DNA ininfected cells was amplified in situ, and theamplification product was detected by insitu hybridization (6). The technique hasprimarily been applied for the detection ofviral DNA. Several groups used in situPCR to localize different human viruses informalin-fixed paraffin-embedded tissuesand blood cell suspensions (1,3,11,13,23,26). Some authors have used in situ PCRto localize mRNA in cells with low levels ofexpression (2,8,14,19,20,24,29). Manycenters, however, have encountered prob-lems with reaction failure or commonlyseen false positive signals. Several reviews
and books have dealt with these problemsand published modifications and develop-ment of the in situ PCR protocols (5,7,15,19,22,25).
In Situ PCR Techniques
The term in situ PCR is used to describethe technique as a whole. Direct in situPCR describes the technique whereby alabel is incorporated directly into theamplicon during PCR of cellular DNAand subsequently detected in order tolocalize the amplified product. Indirect insitu PCR describes an alternative techniquewhereby the amplicon is produced by PCRof cellular DNA without label incorpora-tion. The amplified product is then detect-ed by standard in situ hybridization. Thisbasic terminology can be extended toinclude amplification and detection ofmRNA targets by direct or indirect in situRT-PCR (Figure 3). Four essentially simi-lar in situ amplification techniques havebeen described (15,25):
1. Direct in situ PCR: PCR amplificationof cellular DNA sequences in tissuespecimens using either a hapten-la-beled nucleotide (dUTP) or hapten-labeled primer within the PCR
146
H. Broholm and S. Gammeltoft
Figure 1. Localization of RSK2 mRNA in rat cerebral cortexby indirect in situ RT-PCR. Color staining is localized in thecytoplasm of neuronal cell bodies of interneurons in cortex.Glial cells are unstained. (See color plate A7.)
Figure 2. Localization of RSK2 mRNA in rat cerebellum bydirect in situ RT-PCR. Color staining is localized in cyto-plasm of the perikarya of Purkinje cells. Neurons in the gran-ular cell layer are unstained. (See color plate A7.)
Merighi9-aucorr.qxd 5/23/02 7:09 PM Page 146

mixture. Biotin, digoxigenin, or fluo-rescein is used to label the nucleotideor primer. The labeled PCR product isthen detected in the tissue using stan-dard detection techniques as for con-ventional in situ hybridization orimmunocytochemistry.
2. Indirect in situ PCR: PCR amplificationof cellular DNA sequences in tissuespecimens using a standard PCR mix-ture. Following PCR, the localization ofthe amplified product is then detectedby in situ hybridization using a labeledoligonucleotide or genomic probe. Thelabels used can be either isotopic (32P,35S) or nonisotopic (e.g., biotin, digoxi-genin, or fluorescein). To date, most
studies have used nonisotopic labels.3. Direct in situ RT-PCR: amplification
of mRNA sequences in cells and tissuespecimens by initially creating a com-plementary DNA (cDNA) templateusing reverse transcriptase and thenamplifying the newly created cDNAtemplate by PCR using labeled nu-cleotides as for direct in situ PCR. Thelabeled PCR product is detected byimmunocytochemistry (Figure 4).
4. Indirect in situ RT-PCR: amplificationof RNA sequences in cells and tissuespecimens by creating a cDNA tem-plate using reverse transcriptase, ampli-fying the newly created DNA templateby PCR, and then probing this DNA
147
9. In Situ Reverse Transcription PCR
Figure 3. In situ RT-PCR for detection of mRNA in brain sections.
Merighi9-aucorr.qxd 5/23/02 7:09 PM Page 147

148
H. Broholm and S. Gammeltoft
Figure 4. Schematic representation of direct and indirect in situ RT-PCR protocols.
Merighi9-aucorr.qxd 5/23/02 7:09 PM Page 148

with an internal oligonucletide probe(Figure 4).
We have used direct in situ RT-PCR forlocalization of 90 kDa RSK mRNA in adultrat brain (H. Broholm and S. Gammeltoft,unpublished data). RSK is involved in tran-scriptional regulation by growth factors andhormones via the mitogen-activated protein(MAP) kinase cascade in brain and othertissues (4,10). Three isoforms of RSK exist:RSK1, RSK2, and RSK3 with about 80%homology. The importance of RSK2 inbrain function was recently underlined bythe finding that inactivating mutations ofhuman RSK2 gene are associated with asyndromic form of mental retardation, Cof-fin-Lowry syndrome (9,27). Thus, it isimportant to analyze the cellular distribu-tion and function of RSK isoforms in thecentral nervous system (CNS).
We have evaluated two techniques of insitu RT-PCR for detection of mRNA incells and tissues: (i) direct in situ RT-PCRwith incorporation of a label directly intothe PCR product and subsequent detec-tion; and (ii) indirect in situ RT-PCR withamplification of cDNA and subsequenthybridization (Figures 1 and 2). We con-clude that direct in situ RT-PCR is themethod of preference, as it is simple, sensi-tive, specific, rapid, and reproducible. Indi-rect in situ RT-PCR may be more specificbecause the probe only hybridizes to thetarget-specific amplicon sequences pro-duced during the PCR and not to DNAproduced by nonspecific synthesis. On theother hand, the process of indirect in situRT-PCR takes considerably longer thandirect in situ PCR because of the addition-al hybridization and stringent washingsteps required. Furthermore, manipulationof the tissue can result in detachment andloss of the sections. Finally, indirect in situRT-PCR is generally found to be less sensi-tive than direct in situ RT-PCR.
During direct in situ RT-PCR, a label isincorporated directly into the amplicon
throughout the PCR process. Two methodscan be utilized for direct incorporation. Inone method, a hapten-labeled nucleotideanalog such as biotin-11-dUTP, digoxi-genin-11-dUTP, or fluorescein-15-dATP isadded to the PCR mixture. During amplifi-cation, the hapten becomes incorporatedinto the amplicon and can be detected byenzyme-conjugated antibodies and chro-mogenic substrates. Direct label incorpora-tion results in the labeling of all nucleicacids synthesized during the PCR processwith a high degree of sensitivity. With thisapproach, the detection of single-copymRNA is made possible. The other methodof direct incorporation is via hapten-labeledprimers. This labeling method is less sensi-tive as less hapten is incorporated at eachamplification step. Hapten-labeled oligonu-cleotide primers tend to be sticky, and thenonspecific binding can lead to high back-ground. We used direct incorporation ofdigoxigenin-11-dUTP into the PCR prod-uct and detection by antidigoxigenin anti-body conjugated to alkaline phosphataseand chromogenic substrate.
An important factor for the success of insitu PCR is the availability of instrumenta-tion dedicated to the thermal cycling ofPCR components on microscopic slides.We used GeneAmp In situ PCR system1000 manufactured by PE Biosystems(Foster City, CA, USA) (15). With thisinstrument, in situ PCR can be performedon nondisrupted cells and tissues immobi-lized onto the surface of microscopic slides.The capacity is 10 slides with two or threesections per slide. The slides are held firm-ly against a series of vertical slots compris-ing the block of the thermal cycler toensure precise temperature control. Thesystem also provides a unique containmentsystem for maintaining PCR componentsover the sections during thermal cycling. Adedicated Assembly Tool is used to assem-ble AmpliCover Discs and AmpliCoverClips (all from PE Biosystems) onto 1.2-
149
9. In Situ Reverse Transcription PCR
Merighi9-aucorr.qxd 5/23/02 7:09 PM Page 149

mm-thick silane-coated slides to create astandardized reaction chamber of 35 to 50µL volume over the immobilized sample.The stainless steel AmpliCover Clips holdthe silicon-rubber AmpliCover Discs firm-ly in place to ensure that the containedreaction remains sealed throughout thecycling reaction.
We emphasize, however, that severalproblems were encountered with the tech-nique leading to reaction failure or falsepositive signals. The implementation of insitu RT-PCR is labor-intensive andrequires the optimization of each stepinvolved in the procedure. No universallyapplicable technique is available, and astandard protocol for in situ RT-PCR doesnot exist. All variables should be carefullycontrolled for each application, and indi-vidual steps must be determined empirical-ly. Critical steps include starting material,fixation of tissue, protease digestion,DNase digestion, primer design, andcycling conditions. Future users of in situRT-PCR are recommended to read reviewsthat deal with technical problems and opti-mization of protocols (7,15–17,19,21,22,25).
PROTOCOL FOR DIRECT IN SITURT-PCR
Materials and Reagents
• Tissue-Tek® O.C.T.-compound (Sa-kura Finetek, Amsterdam, The Neder-lands).
• Multi-well culture plates (CorningIncorporates, Corning, NY, USA).
• 2-methylbutane (Sigma, St. Louis,MO, USA).
• In situ PCR glass slides (PE Biosys-tems).
• Humi-Cap dessicant capsules (UnitedDesiccants, Pennsauken, NJ, USA).
• Paraformaldehyde (Sigma).• Disposable syringe filters (Millipore,
Bedford, MA, USA).• Pepsin (Sigma).• Proteinase K (Sigma).• Diethyl-pyrocarbonate (DEPC; Sigma).• Deoxyribonuclease I (DNase I; Roche
Molecular Biochemicals, Mannhein,Germany).
• Thermanox cover slips (Miles Scien-tific, Naperville, IL, USA).
• Acetic anydride (Sigma).• Triethanolamine (Sigma).• Acetic acid (Sigma).• GeneAmp RNA PCR Core Kit (PE
Biosystems).• GeneAmp In situ PCR System 1000.• Albumin (Sigma).• Antidigoxigenin Fab fragment conju-
gated with alkaline phosphatase (RocheMolecular Biochemicals).
• 4-nitroblue tetrazolium chloride(Sigma).
• 5-bromo-4-choloro-3-indolyl phos-phate (BCIP; Sigma).
Buffers and Solutions
Buffered Paraformaldehyde 4%
Paraformaldehyde fixative is prepared byheating to 60°C a volume of water equal toslightly less that 2/3 the desired final volumeof fixative. Weigh out a quantity of para-formaldehyde that will make a 4% solutionand add it with a stir bar to the water.Cover. Transfer the solution to fume hoodand maintain on heating plate at 60°C withstirring. Add 1 N NaOH drop-wise with aPasteur pipet until the solution is clear. Thesolution will still have some fine particlesthat will not go away. Be careful not to over-heat the solution. Remove from heat andadd 1/3 volume 3× phosphate-buffered
150
H. Broholm and S. Gammeltoft
Merighi9-aucorr.qxd 5/23/02 7:09 PM Page 150

saline (PBS). Bring pH of solution to 7.2with HCl, add water to final volume, andfilter using a disposable Millipore filter.Cool to room temperature or to 4°C on ice.
Caution: Formaldehyde is a carcinogenand may cause allergic reactions.
3×× and 1×× Phosphate-Buffered Saline, pH7.2
Prepare the following solutions: 390mM NaCl/30 mM Na2HPO4 and 390mM NaCl/30 mM NaH2PO4. Mix toobtain 3× PBS, pH 7.2 and autoclave orsterilize with a filter. Prepare 1× PBS bydiluting 3× PBS 3-fold with water.
Diethyl-Pyrocarbonate-Water 0.1%
In all steps involving treatment of sec-tions for in situ RT-PCR, it is recommend-ed to use water with DEPC in order toinhibit RNase activity. Prepare 0.1%DEPC-H2O by adding 1 mL 100%DEPC to 1000 mL MilliQ-purified water.Mix for 1 hour and incubate at 37°C.Autoclave the solution.
Pepsin 2 mg/mL
Prepare the solution with 10 mg pepsinin 4832 µL 0.1% DEPC-H2O and 168 µL3 M HCl. Freshly made for each experi-ment.
DNase Solution 50 U/mL
Prepare the solution by adding 1.0 µLDNase I (5 U), RNase-free to 100 µL 1×DNase buffer composed of Tris 40 mM,pH 7.6, MgCl2 6 mM, and CaCl2 2 mM.
Acetic Anhydride 0.3% in 0.1 MTriethanolamine
Triethanolamine (1.85 g) in 100 mLMilliQ water. Stir to ensure complete solu-
tion. Adjust pH to 8.0. Just before use, add300 µL acetic anhydride. Keep everythingin the hood.
Reverse Transcriptase Master Mixture(GeneAmp RNA PCR Core Kit)
Add the reagents in the order and pro-portions as follows: MgCl2 25 mM 4 µL,10× PCR Buffer II 2 µL, DEPC-H2O9 µL, dNTP 10 mM 2 µL, RNase 20 U/µL1 µL, Oligo(dT)16 1 µL, MuLV reversetranscriptase 50 U/µL 1 µL. Total volume20 µL.
PCR Master Mixture (GeneAmp RNAPCR Core Kit)
The solution is prepared by adding thereagents in the order and proportions as fol-lows: MgCl2 25 mM 3.2 µL, 10× PCRBuffer II 4.0 µL, DEPC-H2O 26.9 µL,dNTP 10 mM 0.8 µL, digoxigenin-11-dUTP 1 mM 0.8 µL, Taq DNA polymerase5 U/µL 0.3 µL, “Downstream” Primer 10µM 2.0 µL and “Upstream” Primer 10 µM2.0 µL. Total volume 40.0 µL.
Buffer 1 for Digoxigenin Detection
0.05 M Tris-HCl, pH 7.5, and 0.15 MNaCl.
Buffer 2 for Digoxigenin Detection
0.1 M Tris-HCl, pH 9.5, 0.05 MMgCl2, and 0.1 M NaCl.
Blocking Buffer
Albumin 0.3% dissolved in Buffer 1.
Digoxigenin Antibody Solution
Antidigoxigenin Fab fragment conjugat-ed with alkaline phosphatase is diluted1:500 in Buffer 1.
151
9. In Situ Reverse Transcription PCR
Merighi9-aucorr.qxd 5/23/02 7:09 PM Page 151

4-Nitroblue Tetrazolium Chloride
10 mg/mL water.
5-Bromo-4-Chloro-3-Indoylphosphate
25 mg/0.5 mL dimethylformamide(DMF).
Protocol
General Concepts
Direct in situ RT-PCR technique repre-sents the coming together of RT-PCR andin situ hybridization, allowing the amplifi-cation of specific mRNA sequences insidecells. First, cells or tissue sections aremounted on coated glass slides and fixedwith a suitable fixative, usually neutral-buffered formaldehyde. For some applica-tions, formaldehyde-fixed cells or tissue arepermeabilized using proteolytic enzymes inorder to permit access of PCR reagents intothe cells and to target the nucleic acid.Before performing the reverse transcriptionprocedure, degradation of the existingDNA is usually recommended to avoidamplification of the genomic DNA. Acety-lation can be included during pretreatmentto reduce nonspecific sticking of hapten-labeled oligonucleotide primers duringindirect in situ RT-PCR. Reverse transcrip-tase reaction is performed to synthesizecDNA from mRNA, and PCR amplifica-tion in situ is performed in specificallydesigned in situ PCR thermocyclers.Digoxigenin-labeled nucleotides are incor-porated during the PCR, and the amplifiedproduct is visualized by immunocyto-chemistry using antibody to digoxigeninconjugated with alkaline phosphatase. Weemphasize that pretreatment with protease,DNase as well as acetylation, was aban-doned in our protocol. This resulted in asimple and rapid 4-step protocol of directin situ RT-PCR: (i) sample preparation;
(ii) reverse transcriptase reaction; (iii) insitu PCR amplification; and (iv) immuno-detection and visualization (Table 1).
Sample Preparation
Tissue Dissection
1. Kill the animal by decapitation with-out anesthesia.
2. Open the skull with scissors cuttingthrough foramen magnum and themidline and gently remove the brainand place it on the bottom of a plasticpetri dish on ice at 4°C.
3. Remove the meninges with a pincer.Cut the brain with a razor blade in 6coronal sections of 4 to 5 mm andplace them in wells of a 12-well cellculture plate on ice at 4°C.
4. Embed tissue in OCT and freeze it byimmersion of the plate in liquid 2-methylbutane prechilled with dry ice.The frozen tissue is stored in sealedcontainers at -80°C.
Comment: The meninges are removedwith a pincer to avoid interference with thecoronal sectioning. Tissue should be ori-ented in the block appropriately for sec-tioning. Note the tissue number on theblock directly and indicate which face ofthe block should be sectioned.
Sectioning and Fixation of Frozen Tissues
5. Cut 7-µm cryostat sections and thaw-mount them on 1.2-mm silane-coatedin situ PCR glass slides.
6. Allow to air-dry and fix in 4%paraformaldehyde in 1× PBS, pH 7.2,at room temperature for 20 minutes.Two sections are placed on each slide,one for a positive test and one for anegative control (see below).
7. Wash slides once in 3× PBS for 5 min-utes and twice in 1× PBS for 5 minutes.
152
H. Broholm and S. Gammeltoft
Merighi9-aucorr.qxd 5/23/02 7:09 PM Page 152

8. Dehydrate step-wise in 70%, 80%,90%, and 100% ethanol for 2 minutesat each step and air-dry.
9. Slides are stored at -80°C in plasticslide boxes with Humi-Cap desiccantcapsules.
Comment: The problem with keepingthe tissue sections on the slide during thehybridization and washing procedures isreduced by the use of silane-coated glassslides and subsequent 4% paraformalde-hyde fixation. mRNA is stable when stored
as described above, and tissue sections maybe used for up to 6 months after sectioning.
Pretreatment of Sections
Protease Digestion
Protease digestion is performed with150 µL of pepsin 2 mg/mL in 0.01 N HClper sample and incubated for 20 to 90minutes at room temperature in a humidchamber. The slide is washed with DEPCwater for 5 minutes. Others have used
153
9. In Situ Reverse Transcription PCR
Table 1. Protocol for Direct In Situ RT-PCR
Step Objective Technique Comment
Tissue sectioning Disrupt tissue barriers and 5–10-µm sections at Sections should be lessand adhesion keep sections on the slide -18°C on 1.2-mm than 10 µm to permit
during incubations. silane-coated glass diffusion of reagents to slides. nucleic acid targets.
Fixation Maintain tissue PBS-buffered 4% Weak and brief fixation doesarchitecture and prevent paraformaldehyde for not cause denaturation ofdiffusion of mRNA. 20 min. proteins, mRNA, or DNA.
Protease digestion Degrade protein–protein Pepsin 2 mg/mL in Omitted in our protocol.and protein–DNA 0.01 N HCl for 20–90 networks. min at room temperature.
DNase treatment Degrade genomic DNA Deoxyribonuclease Omitted in our protocol.to prevent false positive 1 U for 7–16 h.reactions.
Acetylation Prevent nonspecific Acetic anhydride 0.3% Omitted in our protocol.sticking of hapten-labeled in 0.1 M triethanolamineoligonucleotide primers for 10 min and aceticused in indirect RT-PCR. acid 20% for 15 s.
Reverse transcription Synthesis of cDNA MuLV reverse Standard reversefrom mRNA. transcriptase 2.5 U with transcriptase procedure.
oligo(dT)16 primer for 30 min at 42°C.
PCR Amplification of cDNA. Taq DNA polymerase Standard PCR procedure.0.4 U with primer set and digoxigenin-11-dUTP inthermal cycler (45 cycles).
Immunodetection Increase signal and localize Antidigoxigenin antibody Standard immunochemistry.cellular mRNA (cDNA). 1:500 for 60 min at 37°C.
Visualization Staining of cells for light Color development with Standard histochemistry.microscopy. substrate for alkaline
phosphatase.
Merighi9-aucorr.qxd 5/23/02 7:09 PM Page 153

proteinase K 0.1 to 0.5 µg/mL for cells and0.1 to 1.0 µg/mL for tissue sections beforein situ RT-PCR of mRNA.
Comment: In our study (mild aldehydefixation) protease digestion was omitted.
In the case of strong formaldehyde-fixed(10% for 16–24 h) and paraffin-embeddedsections, however, protease digestion is gen-erally recommended to reduce the networkof protein–protein and protein–DNAcross-linking created by the fixative, and toallow diffusion of primers and Taq DNApolymerase to the nucleic acid targets. Theduration of protease digestion depends onthe type of fixative used and the extent offixation. It is a critical parameter that mustbe determined empirically (22). Too littleprotease digestion will result in poor ampli-fication efficiency, while over digestion willdestroy tissue morphology and will permitdiffusion of the amplicons out of the cells.In our experience, the protease digestion isdifficult to optimize and should be avoidedif possible. Using fresh frozen sections of ratbrain, we tested whether protease digestionwas needed for in situ RT-PCR of RSKmRNA. A comparison between protease-treated and untreated sections showed nodifference in amplification and localizationof the signal. In both cases, a strong signalwas clearly localized to the cytoplasm ofneuronal cell bodies in the brain.
Digestion with DNase
DNase treatment is performed by appli-cation of 20 µL of DNase solution (1U/sample) to each section. Cover withThermanox cover slips and incubate theslide at 37°C in a humid chamber for atleast 7 hours. Digestion times shorter that7 hours might not be adequate to com-pletely degrade genomic DNA. After thedigestion the slides are washed for 1minute in ultra-pure water followed by100% ethanol and air-drying.
Comment: In our study of RSK mRNA
distribution in rat brain, DNase pretreat-ment of sections was omitted. Digestionwith DNase may be used to degradegenomic DNA and prevent amplificationof genomic sequences during in situ RT-PCR leading to false positive reactions.Although we omitted this step, we did notobserve any nuclear localization of thedigoxigenin label and found only stainingof the cytoplasm indicating that amplifica-tion of genomic DNA was not a problem.
DNase treatment appears to be a prob-lematic step, and on some occasions omis-sion of this step is required to avoid non-specific nuclear staining. A time-dependentincrease in nonspecific nuclear staining isclearly seen after 2 and 24 hours of DNasetreatment (19). This anomaly is probablycaused by small fragments of nuclear DNAbeing used as nonspecific primers duringthe amplification step. Efficient amplifica-tion of genomic DNA can be avoided byusing special primer designs such as apoly(dT) primer or primers flankingintrons. Elimination of the need for DNasetreatment has been successfully demon-strated in these instances (15).
Acetylation
Labeled reagents can stick nonspecifical-ly to tissue sections because of staticcharge. One way of reducing static chargeis to include an acetylation step during thepretreatment procedure. Acetylation is per-formed by incubation of sections with0.3% acetic anhydride in 0.1 M tri-ethanolamine for 10 minutes followed by20% acetic acid for 15 seconds and thenwashing with water.
Comment: In our study, acetylation ofbrain sections before in situ RT-PCR wasomitted. This step can be included to pre-vent nonspecific sticking of hapten-labeledoligonucleotide primer during indirect insitu RT-PCR (15). High background inproblematic tissues (e.g., kidney, liver, and
154
H. Broholm and S. Gammeltoft
Merighi9-aucorr.qxd 5/23/02 7:09 PM Page 154

gastrointestinal tract) can be reduced sig-nificantly by inclusion of this step. Thisstep is rarely used if hapten-labelednucleotides are used for direct in situ RT-PCR detection of mRNA.
Reverse Transcriptase Reaction
10. Remove slides from the freezer and thawfor 5 minutes at room temperature.
11. Apply 20 µL reverse transcriptase mas-ter mixture on the sections. The reversetranscriptase reaction can be primedusing random oligo(dT) primers or cus-tom-designed forward (antisense) pri-mers 3′ to the gene of interest, i.e., thedownstream primer of the PCR ampli-fication. We used oligo(dT)16 to primeall mRNAs with a poly(A) tail for initi-ating first-strand cDNA synthesis.
12. Cover the sections with Thermanoxcover slips.
13. Preincubate the slides at room temper-ature for 10 minutes to extend theoligo(dT)16 by reverse transcriptase.The slides are incubated in a humidchamber at 42°C for 30 minutes. Toavoid disrupting tissue material, care-fully lift the cover slips without slidingthem sideways.
14. Wash the slides in 1× PBS for 5 min-utes at room temperature. Dehydratethe slides in 0.1% DEPC-H2O with50%, 70%, 90%, and 100% ethanol, 1minute each, and air-dry.
Comment: Heat inactivation of reversetranscriptase, which is used for solutionRT-PCR is not necessary for in situ RT-PCR as the enzyme is removed by washingthe slides. All reagents and plast-wareshould be RNase-free. The investigatorshould use gloves to avoid contaminationof samples with skin bacteria and RNase.Negative controls are prepared by omittingMuLV reverse transcriptase from thereverse transcriptase master mixture.
PCR Amplification
15. Program the GeneAmp In situ PCRSystem 1000 as follows: a 2 minutehold at 95°C; 45 cycles of 95°C for 15seconds and 59°C for 30 seconds; a 7minute hold at 72°C; a 24 hour holdat 4°C. The hybridization temperaturedepends on the GC content and melt-ing temperature (Tm) of the primers.Cycling conditions must be optimizedfor the target sequence and primer pair.
16. Set the thermal cycler at a 70°C hold. 17. Prepare 40 µL of PCR master mixture
for each tissue section. For the applica-tion, the PCR master mixture compo-nents might have to be optimized.
18. Place a slide on the Assembly Tool andoverlay the section with 40 µL of PCRsolution. Be careful not to let the dropof solution spread along the glass.
19. Make an assembly using the Ampli-Cover Discs, Clips, and Assembly Toolcontained in the GeneAmp In situPCR System 1000. Continue with theother tissue spots.
20. As each slide is assembled, place it inthe GeneAmp In situ PCR System1000 set at a 70°C soak.
21. When all the slides are placed in thecycler, begin the thermal cycle programdescribed above.
22. After cycling is complete, soak theslides at 4°C until disassembly anddigoxigenin detection.
Comment: The protocol has beenapplied for in situ RT-PCR of RSK1,RSK2, and RSK3 cDNA in rat brain. Therecommended primer length is between 20and 30 nucleotides. In our study, theprimer length varied between 21 and 23bp. The GC content varied between 0.42and 0.66. The PCR product length shouldbe 100 to 600 bp. The length of the PCRproduct was 546 bp for RSK1, 412 bp forRSK2, and 328 bp for RSK3. To eliminate
155
9. In Situ Reverse Transcription PCR
Merighi9-aucorr.qxd 5/23/02 7:09 PM Page 155

the possibility of generating PCR productsfrom genomic DNA, it is important todesign primers that bridge introns so as todistinguish the template source on thebasis of product size. Before the in situPCR experiments, all parameters for thePCR, including MgCl2, pH, and anneal-ing temperature must be optimized bysolution PCR and agarose electrophoresis.Products should be cloned and sequencedto confirm identity. In our study, the Tm ofthe primers varied between 54° and 59°C,but a temperature of 59°C is used for acombined primer annealing and extensionstep for 30 seconds. The 7 minute hold at72°C after the thermal cycling was used toallow primer extension and amplicon syn-thesis to be completed. We used 45 cyclesto obtain the highest amplification ofcDNA. Some authors recommend lowernumber of cycles to avoid nonspecificnuclear staining (19). In our study, howev-er, no nuclear staining was observed. Nega-tive controls are prepared by omittingprimers or Taq DNA polymerase from thePCR master mixture.
Immunodetection and Visualization
23. Remove the AmpliCover Clips fromeach slide using the Disassembly Tool.Carefully lift the AmpliCover Discwithout sliding it sideways so as not todisrupt the tissue material.
24. Rinse the slides briefly with Buffer 1using a Pasteur pipet.
25. Wash the slides in a Coplin jar withBuffer 1 for 5 minutes followed byBlocking buffer for 20 minutes.
26. Drain the slides of Blocking buffer, andwipe a ring around each section with ahydrophobic pen.
27. Apply 50 µL of antidigoxigenin anti-body solution.
28. Place the slides in a humid chamberand incubate at 37°C for 60 minutes.
29. In a Coplin jar, wash the slides inBuffer 2. Add 1 mL per slide of freshlyprepared solution with appropriatesubstrates (4-nitroblue tetrazoliumchloride and BCIP) and develop for 5minutes to 1 hour at room temperatureprotected from light. Drain the sub-strate solution from the slides. Stop thereaction by rinsing in water.
30. The tissue is counterstained in MayersHematoxylin for 1 minute. Slides aremounted with Aquamount.
Comment: Do not let the sections dryout during the entire detection process.The length of development will depend onthe initial copy number of the mRNA tar-get sequences and the amplification effi-ciency. It has been estimated that after 30cycles, amplification is of the order of 10-to 30-fold (3). Monitor the developmentof purple color on the slide every few min-utes. In our study of in situ RT-PCR ofRSK mRNA in rat brain, a 5 minute devel-opment was sufficient. A purple precipitatewill appear in the location where digoxi-genin is incorporated into DNA. For insitu RT-PCR, color development willappear over the cytoplasm, which is thecellular compartment where most mRNAis found. Over development will result inhigh levels of background staining.
DISCUSSION
In situ RT-PCR is a relatively new tech-nique that extends the researcher’s ability tolocalize specific mRNA targets in cells andtissue. It combines the specificity of in situhybridization and the sensitivity of PCRand, with reliable multislide thermal cyclersavailable, can be a very reproducible tech-nique. Two main protocols, direct and indi-rect, have been described for in situ RT-PCR. In the direct approach a labelednucleotide is incorporated into the PCRproducts, whereas in the indirect method a
156
H. Broholm and S. Gammeltoft
Merighi9-aucorr.qxd 5/23/02 7:09 PM Page 156

subsequent in situ hybridization with alabeled probe is required to visualize theproducts (15,18,25). We chose the directmethod because it is shorter, less expensive,and minimizes manipulation of the tissue,which can result in detachment and loss ofsections. Some authors point out thatdirect methods can result in false positiveresults (12,15,18), but we find that use ofproper controls will eliminate this problem.
Fixation and pretreatment of tissue orcells before in situ RT-PCR is of great sig-nificance for the successful result. Severalgroups have addressed these critical prob-lems that may cause reaction failure or falsepositive results. During the development ofour protocol, we evaluated the fixation andpretreatment carefully. The use of fixationof sections for in situ PCR has been dis-cussed (25). Based on our experience within situ RT-PCR, 4% paraformaldehyde inPBS buffer for 20 minutes is the best fixa-tion to preserve integrity of tissue mor-phology and to retain mRNA and cDNAin the cells. Several authors recommendprotease digestion of tissue sections thathave been fixed in 10% paraformaldehydefor 16 to 24 hours and embedded in paraf-fin in order to degrade protein–protein andprotein–DNA network and permit diffu-sion of PCR reagents to nucleic acid targets(22). On the other hand, protease overdi-gestion can result in loss of tissue architec-ture and migration of the PCR productsfrom the cells (19). We find, however, thattreatment of sections with pepsin is diffi-cult to optimize and does not improve theresults. Accordingly, we omitted proteasedigestion from our protocol.
The DNase treatment of sections for insitu RT-PCR is used to degrade genomicDNA in order to reduce amplification ofDNA during PCR. This appears to be aproblematic step that may result in non-specific nuclear staining probably causedby small fragments of nuclear DNA beingused as nonspecific primers during the
amplification step (19). DNase digestionwas omitted from our in situ RT-PCR pro-tocol for amplification of RSK mRNA.Even after a high number of cycles (weused 45 cycles), we find that the staining islimited to the cytoplasm indicating that noamplification of genomic DNA occursduring the PCR amplification. Finally,acetylation of sections is recommended inorder to reduce nonspecific sticking of hap-ten-labeled primers. This is not relevant forour procedure of direct in situ RT-PCRusing hapten-labeled nucleotide for label-ing of amplified DNA. In conclusion, werecommend a light and brief fixation of tis-sue sections, but avoid pretreatment.
The RT-PCRs were performed using astandard protocol for solution reverse tran-scriptase reaction and PCR from PE Bio-systems. The same conditions were usedfor in situ RT-PCR and solution RT-PCRallowing control and analysis of the PCRproducts by gel electrophoresis and DNAsequencing. This improved the reliabilityof in situ RT-PCR. The PCR productsranged in size from 328 to 546 bp in ourstudy. Others have analyzed the effect ofsize of the PCR product on sensitivity (19).Products smaller that 600 bp always yield-ed signal, whereas a longer product (1400bp) did not. It is reasonable to concludethat in situ PCR matched the sensitivity ofsolution PCR. Immunodetection and visu-alization were standard immunohisto-chemistry procedures based on reagentsfrom Roche Molecular Biochemicals. Thesignal obtained was of sufficient intensity,and no modifications were needed.
In conclusion, in situ RT-PCR is facile,versatile, can be done quickly, and does notrequire nucleic acid extraction and purifi-cation. Traditional in situ hybridizationtechniques are useful only if the targetsequence copy number is greater than 10per cell. Because targets can be exponen-tially amplified with PCR, the researchercan use in situ PCR to detect and localize
157
9. In Situ Reverse Transcription PCR
Merighi9-aucorr.qxd 5/23/02 7:09 PM Page 157

low abundance nucleic acid sequences. Intheory, a single DNA and mRNA moleculeper cell should be detectable using in situPCR and in situ RT-PCR, respectively.
ACKNOWLEDGMENTS
Birte Kofoed is gratefully acknowledgedfor expert and enduring technical assis-tance during implementation and applica-tion of in situ RT-PCR. The study wassupported by grants from the DanishResearch Center for Growth and Regenera-tion, Danish Cancer Society, Novo Nor-disk Foundation, and the Foundation forMedical Research in Copenhagen County,Greenland and Faeroe Islands.
REFERENCES
1.Bagasra, O., S.P. Hauptman, H.W. Lischner, M.Sachs, and R.J. Pomerantz. 1992. Detection of humanimmunodeficiency virus type 1 provirus in mononu-clear cells by in situ polymerase chain reaction. N.Engl. J. Med. 326:1385-1391.
2.Chow, L.H., S. Subramanian, G.J. Nuovo, F. Miller,and E.P. Nord. 1995. Endothelin receptor mRNAexpression in renal medulla identified by in situ RT-PCR. Am. J. Physiol. 269:F449-F457.
3.Embretson, J., M. Zupancic, J. Beneke, M. Till, S.Wolinsky, J.L. Ribas, A. Burke, and A.T. Haase. 1993.Analysis of human immunodeficiency virus-infectedtissues by amplification and in situ hybridizationreveals latent and permissive infections at single-cellresolution. Proc. Natl. Acad. Sci. USA 90:357-361.
4.Frodin, M. and S. Gammeltoft. 1999. Role and regu-lation of 90 kDa ribosomal S6 kinase (RSK) in signaltransduction. Mol. Cell. Endocrinol. 151:65-77.
5.Gu, J. 1995. In Situ Polymerase Chain Reaction andRelated Technology. Eaton Publishing, Natick, MA.
6.Haase, A.T., E.F. Retzel, and K.A. Staskus. 1990.Amplification and detection of lentiviral DNA insidecells. Proc. Natl. Acad. Sci. USA 87:4971-4975.
7.Herrington, C.S. and J.J. O’Leary. 1998. PCR In SituHybridization. Oxford University Press, New York.
8.Jacob, A., I.R. Hurley, L.O. Goodwin, G.W. Cooper,and S. Benoff. 2000. Molecular characterization of avoltage-gated potassium channel expressed in rat testis.Mol. Hum. Reprod. 6:303-313.
9.Jacquot, S., K. Merienne, E. Trivier, M. Zeniou, S.Pannetier, and A. Hanauer. 1999. Coffin-Lowry syn-drome: current status. Am. J. Med. Genet. 85:214-215.
10.Jensen, C.J., M.B. Buch, T.O. Krag, B.A. Hemmings,S. Gammeltoft, and M. Frodin. 1999. 90-kDa riboso-
mal S6 kinase is phosphorylated and activated by 3-phosphoinositide-dependent protein kinase-1. J. Biol.Chem. 274:27168-27176.
11.Koffron, A.J., M. Hummel, B.K. Patterson, S. Yan,D.B. Kaufman, J.P. Fryer, F.P. Stuart, and M.I.Abecassis. 1998. Cellular localization of latent murinecytomegalovirus. J. Virol. 72:95-103.
12.Komminoth, P. and A.A. Long. 1993. In-situ poly-merase chain reaction. An overview of methods, appli-cations and limitations of a new molecular technique.Virchows Arch. B Cell Pathol. Incl. Mol. Pathol.64:67-73.
13.Komminoth, P., A.A. Long, R. Ray, and H.J. Wolfe.1992. In situ polymerase chain reaction detection ofviral DNA, single-copy genes, and gene rearrange-ments in cell suspensions and cytospins. Diagn. Mol.Pathol. 1:85-97.
14.Kulaksiz, H., R. Arnold, B. Goke, E. Maronde, M.Meyer, F. Fahrenholz, W.G. Forssmann, and R.Eissele. 2000. Expression and cell-specific localizationof the cholecystokinin B/gastrin receptor in the humanstomach. Cell Tissue Res. 299:289-298.
15.Lewis, F. 1996. An Approach to In situ PCR. PEBiosystems, Foster City, CA.
16.Long, A.A. 1998. In-situ polymerase chain reaction:foundation of the technology and today’s options. Eur.J. Histochem. 42:101-109.
17.Long, A.A. and P. Komminoth. 1997. In situ PCR. Anoverview. Methods Mol. Biol. 71:141-161.
18.Long, A.A., P. Komminoth, E. Lee, and H.J. Wolfe.1993. Comparison of indirect and direct in-situ poly-merase chain reaction in cell preparations and tissuesections. Detection of viral DNA, gene rearrangementsand chromosomal translocations. Histochemistry99:151-162.
19.Martinez, A., M.J. Miller, K. Quinn, E.J. Unsworth,M. Ebina, and F. Cuttitta. 1995. Non-radioactivelocalization of nucleic acids by direct in situ PCR andin situ RT-PCR in paraffin-embedded sections. J. His-tochem. Cytochem. 43:739-747.
20.Nakai, M., T. Kawamata, T. Taniguchi, K. Maeda,and C. Tanaka. 1996. Expression of apolipoprotein EmRNA in rat microglia. Neurosci. Lett. 211:41-44.
21.Nuovo, G.J. 2000. In situ localization of PCR-ampli-fied DNA and cDNA. Methods Mol. Biol. 123:217-238.
22.Nuovo, G.J. 1994. PCR In Situ Hybridization. RavenPress, New York.
23.Nuovo, G.J., F. Gallery, P. MacConnell, J. Becker, andW. Bloch. 1991. An improved technique for the in situdetection of DNA after polymerase chain reactionamplification. Am. J. Pathol. 139:1239-1244.
24.Ohtaka-Maruyama, C., F. Hanaoka, and A.B. Chep-elinsky. 1998. A novel alternative spliced variant of thetranscription factor AP2alpha is expressed in themurine ocular lens. Dev. Biol. 202:125-135.
25.O’Leary, J.J., R. Chetty, A.K. Graham, and J.O.McGee. 1996. In situ PCR: pathologist’s dream ornightmare? J. Pathol. 178:11-20.
26.Patterson, B.K., M. Till, P. Otto, C. Goolsby, M.R.Furtado, L.J. McBride, and S.M. Wolinsky. 1993.Detection of HIV-1 DNA and messenger RNA inindividual cells by PCR-driven in situ hybridization
158
H. Broholm and S. Gammeltoft
Merighi9-aucorr.qxd 5/23/02 7:09 PM Page 158

and flow cytometry. Science 260:976-979.27.Trivier, E., D. De Cesare, S. Jacquot, S. Pannetier, E.
Zackai, I. Young, J.L. Mandel, P. Sassone-Corsi, andA. Hanauer. 1996. Mutations in the kinase Rsk-2 asso-ciated with Coffin-Lowry syndrome. Nature 384:567-570.
28.Wilcox, J.N. 1993. Fundamental principles of in situ
hybridization. J. Histochem. Cytochem. 41:1725-1733.
29.Wolfahrt, S., B. Kleine, and W.G. Rossmanith. 1998.Detection of gonadotrophin releasing hormone and itsreceptor mRNA in human placental trophoblasts usingin-situ reverse transcription-polymerase chain reaction.Mol. Hum. Reprod. 4:999-1006.
159
9. In Situ Reverse Transcription PCR
Merighi9-aucorr.qxd 5/23/02 7:09 PM Page 159

161
OVERVIEW
We describe a series of techniques basedon the use of immunocytochemical label-ing methods for the study of the neuro-chemistry and connectivity of cells withinthe central nervous system (CNS). Accord-ing to our current view, neurons commu-nicate to each other mainly at the level ofsynapses. Although it is now widely accept-ed that nonsynaptic neuron-to-neuroncommunication and neuron-to-glia cross-talk also occur, ultrastructural localizationof transmitters–modulators at synapses andanalysis of neuronal connections stillremain major challenges for a correctunderstanding of the way in which neu-ronal networks are organized and operate.
This chapter is mainly devoted to thedescription of a number of immunocyto-chemical procedures that are performed onmaterial that, as far as possible, has been pre-pared according to the protocols for conven-tional electron microscopy, particularlyregarding the use of osmium tetroxide as afixative for the achievement of optimalultrastructure. We will also briefly consider
several techniques which can be used incombinations with the above methods andmay be useful to further dissect the complexinteractions between the cells of the CNS.
In situ hybridization techniques at theultrastructural level are considered inChapter 8. A detailed description of themethods used for combined ultrastructuraland electrophysiological analysis of centralneurons is given in Chapter 11, and exam-ples of applications of gold labeling proce-dures to the study of cell proliferation andapoptosis are considered in Chapter 14.
BACKGROUND
Immunocytochemical Labeling Methodsat the Electron Microscope Level
Immunocytochemical labeling methodsrely on the possibility to successfully identi-fy the molecule(s) of biological interestdirectly on tissue sections by using an anti-gen–antibody reaction that is then visual-ized in the light and/or electron microscopeby adequate means. Historically, the first
Cellular and Molecular Methods in Neuroscience ResearchEdited by A. Merighi and G. Carmignoto
Immunocytochemical Labeling Methodsand Related Techniques forUltrastructural Analysis of NeuronalConnectivity
Patrizia Aimar1, Laura Lossi1, and Adalberto Merighi1,2
1Department of Veterinary Morphophysiology—Neuroscience ResearchGroup; and 2Rita Levi Montalcini Center for Brain Repair, Universitàdegli Studi di Torino, Torino, Italy, EU
10
Merighi10-aucorr.qxd 5/23/02 7:56 PM Page 161

immunocytochemical reactions at the elec-tron microscopic level were performed inthe early 1970s (30). Since then, the origi-nal methods have been widely modifiedand perfected, and in the 1980s, they start-ed to be more extensively used for analysisof central (and peripheral) neurons.
The study of the neurochemistry andconnectivity of the CNS poses unique prob-lems due to a series of inherent difficultiesfor the achievement of satisfactory immuno-labeling. The main factors to be consideredfor this purpose may be summarized as fol-lows: (i) retention of antigens within thetissue and the preservation of their anti-genicity; (ii) preservation of adequate ultra-structure; and (iii) the absence of a barrierlikely to prevent penetration of antibodiesinto the tissue and interaction with theirrespective antigens. The achievement of theoptimal balance of these three factors (par-ticularly for the cells of the CNS) is a ratherdemanding task. Nevertheless, one has tokeep in mind that it is obviously pointless toobtain labeling in the absence of good ultra-structure, and vice versa.
In general terms, immunocytochemicallabeling methods at the ultrastructural levelfall into two main categories: the pre- andpostembedding methods. In the former, asit appears from the flow chart diagram ofFigure 1, the immunostaining reaction iscarried out before osmium postfixation andthe embedding procedure, while in the lat-ter, the immunostaining is performeddirectly on ultrathin sections of tissueswhich have previously been embedded inplastic resins. Under several aspects, thesetwo intrinsically different approaches haveproved to be complementary, since theadvantages of the pre-embedding protocolsroughly correspond to the disadvantages ofthe postembedding methods, and vice versa.As we will discuss in one of the followingsections, the use of small-sized colloidal goldparticles and/or gold clusters in conjunctionwith silver intensification procedures in pre-
embedding methods represents an appeal-ing alternative for the localization of partic-ularly labile antigens. The main advantagesand disadvantages of these approaches havebeen summarized in Figure 2.
Irrespective of the protocol, primary fix-ation is an insuppressible preliminary stepto all immunocytochemical procedures,although ultrathin frozen sections ofunfixed material or cryosubstitution tech-niques might represent possible alternatives(19,24–27,32,59,79). Nonetheless, thesemethods are very expensive, show manytechnical difficulties, and their generalpracticability is still limited. As an addi-tional alternative, some of the problemsrelated to the embedding procedures canbe avoided by cutting ultrathin frozen sec-tions of fixed tissue, although this proce-dure is also very demanding in terms ofcosts and technical skill (46,52,95). Read-ers are referred to the existing literature foran additional discussion of the generalprinciples of primary fixation and pre- andpostembedding procedures (see for exam-ple References 7,8,60,62,65,80–82,91).
Pre-Embedding Immunolabeling
The protocols, which have been mostwidely employed for pre-embedding ultra-structural studies of the nervous tissue, arethe peroxidase–antiperoxidase (PAP) andthe avidin–biotin–peroxidase complex(ABC) methods. Historically, the PAPmethod (90) was used first, and then themore sensitive ABC procedure (43). Boththese methods are of the immunoenzymatictype. Nonetheless, immunoenzymatic tech-niques are not the only available alternativefor pre-embedding immunocytochemistry,since other methods rely on radioimmuno-logical procedures (39,71,74,78). We willconsider here the protocols based on use ofhorseradish peroxidase (HRP) and gold par-ticles as reporter molecules.
The protocols based on HRP are general-
162
P. Aimar et al.
Merighi10-aucorr.qxd 5/23/02 7:56 PM Page 162

ly associated to the use of 3,3′diamino-benzidine (DAB) as a chromagen to revealthe site(s) of positive reaction. As mentionedabove, they have a series of advantages–dis-advantages that have been summarized inFigure 2, together with some explicativecomments. These methods basically consistof a PAP or ABC reaction which is similarto that employed for light microscopy.However, the mandatory need for adequateultrastructural preservation is obviouslylinked with several problems that areencountered during fixation, tissue section-ing, and immunostaining. Perhaps the mostserious drawbacks associated with the use ofthese methods are related to the generallypoor tissue penetration of immunoreactantsand the appearance of nonspecific stainingoften due to the multiple steps involved inthe immunolabeling procedure (see Refer-
ence 78). We have considered some of theseissues in Table 1.
Very small (about 1 nm) colloidal goldparticles or gold clusters (Nanogold) canalso be used for pre- (and post-) embeddingimmunocytochemical labeling. The use ofsilver-intensified 1 nm colloidal gold parti-cles or Nanogold in pre-embedding proce-dures has been introduced in the recent pastto overcome some of the problems that areinherent to the “classic” pre- and postem-bedding immunogold labeling methods (seeFigure 2 and Table 1). We will describe anddiscuss this approach in the following sec-tions of this chapter.
Post-Embedding Immunolabeling
When choosing to use immunogoldpost-embedding staining methods, it is nec-
163
10. Ultrastructural Analysis of Neuronal Connectivity
Figure 1. Flow chart diagram of principal steps in pre- and post-embedding immunocytochemical staining of the nervous tissue.
Merighi10-aucorr.qxd 5/23/02 7:56 PM Page 163

164
P. Aimar et al.
Figure 2. Block diagram showing the main advantages–disadvantages of the most widely employed methods for immunocytochemical labeling in transmission electron microscopy.

165
10. Ultrastructural Analysis of Neuronal Connectivity
Table 1. Practical Hints in Pre-Embedding Procedures
Step in the PreparativeProcedure Available Alternatives Suggested Guidelines and/or Comments
Fixation In general: In pre-embedding procedures, primary fixation is carried 4% paraformaldehyde + 0.02%–0.5% out with minimal concentrations of glutaraldehyde toglutaraldehyde in 0.1 M Sörensen buffer, pH 7.4 minimize the detrimental effects on tissue antigenicity.
Large protein antigens (transmitter-synthesizing enzymes,Possible additions: receptors) are often sensitive to minimal amounts0.2% picric acid (for carbohydrates residues) of glutaraldehyde and thus require a pre-embedding1% acrolein (to increase the rate of fixation) approach for their visualization.
Tissue Sectioning Vibrating microtome (Vibratome) For CNS analysis, the vibrating microtome represents theTissue chopper best available choice. The tissue chopper often producesCryostat or freezing microtome sensible tissue damage. Cryostat sections generally show
poor ultrastructure.
Penetration of 0.25% Triton (for 15 min prior to immunostaining) Even very low concentration Triton has detrimental effectsImmunoreactants Freeze-thawing on ultrastructure. It is advisable not to exceed the
Use of high ionic strength solutions concentration indicated.Use of Fab′ fragments Freeze-thawing is performed on tissue blocks which shouldUse of ultra-small gold not exceed 5 mm thickness before Vibratome sectioning.
Tissue is infiltrated in 30% sucrose in 0.1 M phosphate buffer as a cryoprotectant, then immersed in liquid nitrogen for 1–2 minutes and finally thawed in phosphate buffer atroom temperature.
Immunostaining Conventional staining: Intensification of DAB reaction offers higher sensitivity andwith DAB Incubation in 0.06% DAB in PBS for 10 minutes results in black end-product which is easier to photograph
at room temperature. Addition of 0.01% H2O2 for correlative light and electron microcopy studies.and incubation for further 15 minutes. Prepare the medium by adding dropwise the correctIntensification protocol: amount of 1% cobalt chloride and 1% nickel ammoniumIntensification of the DAB product can be obtained sulphate to the final concentration indicated.by adding cobalt chloride and nickel ammonium sulphate at the final concentrations of 0.05% and 0.04% before incubation with H2O2
Flat-Embedding Plastic coverslips Avoid the use of glass slides and hydrophobic repellentAcetate foils (blank EM negatives) coating, since it is difficult to detach samples for re-embedding.

essary to be aware that problems will beencountered which are not only related tofixation and the labeling procedure, but alsoto all the preparative stages of postfixation,dehydration, resin infiltration, and curing.All these aspects have been extensivelyreviewed in previous publications from ourlaboratory (2,62). For the sake of brevity, wehave summarized some relevant aspects inTable 2. Nonetheless, we intend to considerbelow certain issues of particular importanceand mention some of the more recent find-ings which may represent significant amelio-rations of the existing protocols.
Embedding can be carried out using bothhydrophobic epoxy resins and hydrophilicacrylic embedding media (18). For most tis-sue, the quality of tissue preservation is def-initely superior after epoxy resin embeddingand osmium postfixation, although embed-ding in hydrophilic media results in higherlabeling efficiency. This latter is a conse-quence of less detrimental effects on tissueantigenicity (17). A method of Epon prepa-ration has recently been described to obtainapproximately the same immunogold label-ing for epoxy sections as for acrylic sectionswithout any etching (16).
Osmium postfixation represents a fun-damental step in post-embedding im-munocytochemistry of epoxy sections fromthe brain and/or spinal cord. In our opin-ion, the use of osmium postfixation ismandatory for adequate preservation of thedelicate membrane structures of differentsynapses and subcellular organelles withinthe CNS. The discussion of the mecha-nism of action of osmium as a fixative forelectron microscopy (EM) is beyond thepurpose of this review. It is sufficient toremember here that (membrane) lipidsremain soluble in organic solvents such asalcohols or acetone (40,69) and are extract-ed during embedding procedures unlesssecondary fixation with osmium tetroxideis applied or aldehyde-fixed tissue isembedded at low temperatures using
hydrophilic resins (17,18,96). Recently, anosmium-free method of Epon embedmenthas been introduced that preserves bothultrastructure and antigenicity for post-embedding immunocytochemistry of theCNS (70). The method is based on prima-ry fixation with high concentration glu-taraldehyde and replacement of osmiumpostfixation with tannic acid followed byother heavy metals and p-phenylene-diamine. Pretreatments with strong oxidiz-ers (section etching) are usually required torestore antigenicity of osmicated material.Different chemicals have been employed tothis purpose, but sodium metaperiodate(10) so far gives the most satisfactoryresults (see Reference 62 for further discus-sion). It seems of relevance the findingthat, by using of a sodium citrate-bufferedsodium metaperiodate solution at hightemperature, a significantly higher goldlabeling density can be achieved (93).
If those mentioned above may be con-sidered among the most serious problemsto be solved to achieve a successful post-embedding immunolabeling of the ner-vous tissue, perhaps the more relevantadvantages in the use of this approach arethe possibilities to obtain a reliable subcel-lular localization of molecules under study,the easiness to perform multiple labelings,and the possibility to quantify the immu-nocytochemical signal (see Figure 2 andResults and Discussion).
PROTOCOLS
Protocol for Pre-EmbeddingImmunostaining with Ultra-Small Gold Clusters (Nanogold)
Materials and Reagents
• Formaldehyde EM grade (ElectronMicroscopy Science, Fort Washington,PA, USA).
• Glutaraldehye EM grade (Electron
166
P. Aimar et al.
Merighi10-aucorr.qxd 5/23/02 7:56 PM Page 166

167
10. Ultrastructural Analysis of Neuronal Connectivity
Table 2. Practical Hints in Post-Embedding Procedures
Step in the Preparative Procedure Available Alternatives Suggested Guidelines and/or Comments
Fixation In general: In post-embedding procedures, fixation is usually carried out with4% paraformaldehyde + 2.5% glutaraldehyde high concentration glutaraldehyde that is necessary to achieve in 0.1 M Sörensen buffer, pH 7.4 optimal structural preservation. Up to 5% glutaraldehyde is usedor for immunocytochemical labeling of transmitter amino acids1% paraformaldehyde + 2% glutaraldehyde in (see for example Reference 15).0.1 M Sörensen buffer, pH 7.4
Postfixation 1% osmium tetroxide in water Potassium permanganate can be used as an alternativeor to osmium tetroxide when embedding is carried out in1% osmium ferrocyanide hydrophilic media that need to be cured at low temperature
by UV light (62).
Dehydration Ethanol The total length of dehydration should not exceed 45 minutesor to avoid extraction of tissue components and reductionAcetone of antigenicity.
Embedding Araldite Embedding in Araldite is usually ideal for subsequentor etching with sodium metaperiodate. Epon or Epon-AralditeEpon require longer etching to restore tissue antigenicity (62).or Keep the embedding steps as short as possible to avoidEpon-Araldite extraction of antigens by resin monomer.
Embedding with hydrophilic resins (LR White, LR Gold, Lowicryl K4M) is usually unsatisfactory for CNS analysis (62).
Sectioning and Collect sections onto nickel or gold grids Nickel (gold) grids avoid interaction of the metal withCounterstaining Counterstain very shortly in uranyl acetate oxidizing solutions.
and lead citrate It is preferable to use uncoated grids unless strictly necessary (single slot grids for reconstruction studies or in certain double labeling protocols) (62).

Microscopy Science).• Bovine Serum Albumin, Fraction V
(BSA; Sigma, St. Louis, MO, USA).• Triton X-100 (Sigma).• Normal Goat Serum (NGS; Sigma).• Nanogold antirabbit (Nanoprobes,
Stony Brook, NY, USA).• Nanogold antimouse (Nanoprobes).• Goldenhance-EM (Nanoprobes).
Procedure
1. Perfuse the animal with a fixative con-sisting of 4% paraformaldehyde,0.02% to 0.05% glutaraldehyde and0.2% picric acid in Sörensen buffer 0.1M, pH 7.6.
2. Remove the areas of interest and trimthem to small blocks (not exceeding 5mm in thickness). Postfix for 2 addi-tional hours in the same fixative.
3. Cryoprotect blocks by infiltration withincreasing concentrations of sucrose inphosphate-buffered saline (PBS). Infil-tration is carried out as follows: 10%sucrose, 1 hour; 20% sucrose, 2 hours;30% sucrose, overnight (or as long asblocks sink at the bottom of vials).
4. Quickly freeze blocks in liquid nitrogenfor 1 to 2 minutes and then allow themto thaw in PBS at room temperature.
5. Thoroughly wash blocks in PBS andcut them with a Vibratome at a thick-ness of 30 to 50 µm.
6. Carefully wash sections in PBS. Optional: incubate in 0.2% TritonX-100 for 15 minutes prior toimmunostaining.
7. Incubate in NGS (diluted 1:30 in PBScontaining 0.2% BSA) for 60 minutesat room temperature.
8. Incubate in primary antibodies at opti-mal titer (in PBS containing 0.2%BSA) overnight preferably under con-
tinuous agitation. The length and tem-perature of incubation in the primaryantibody must be varied upon necessi-ty. Incubation as long as 72 hours at4°C can be required for low affinityantibodies.
9. Thoroughly wash in 0.5 M Tris-buffered saline (TBS), pH 7.0 to 7.4containing 1% BSA (TBS-BSA).
10. Incubate overnight at room tempera-ture in the appropriate Nanogoldreagent diluted 1:100 in TBS-BSA.
11. Carefully wash sections as follows: PBS2 × 5 minutes; PBS + 0.1% gelatin for5 minutes; distilled water for 5 min-utes.
12. Prepare the Goldenhance-EM reagentjust before use following the manufac-turer’s instructions: mix well 1 volumeof reagent A (enhancer) and 1 volumeof reagent B (activator); wait for 20minutes and add 1 volume of reagentC (initiator).
13. Check staining intensity at the lightmicroscope. Usually the reaction iscompleted after 10 minutes, but theintensification time should be adjustedfrom case to case.
14. Wash quickly in distilled water andthen transfer sections for a few secondsin a solution of photographic fixer.Thoroughly wash in distilled water.
15. Optional: postfix sections in 2% glu-taraldehyde in Sörensen buffer 0.1 M,pH 7.4, for 30 minutes at room tem-perature.
16. Thoroughly wash in Sörensen buffer,postfix in osmium tetroxide, dehy-drate, and infiltrate in resin asdescribed below in steps 5 through 11of the Protocol for Preparation of theNervous Tissue for Post-embeddingImmunocytochemistry.
17. Flat-embed sections between 2 blankEM negatives.
168
P. Aimar et al.
Merighi10-aucorr.qxd 5/23/02 7:56 PM Page 168

18. Areas of interest may be photographedin the light microscope, trimmed to bedirectly glued at the top of an emptyresin block, and cut with the ultrami-crotome.
Protocol for Preparation of the NervousTissue for Post-EmbeddingImmunocytochemistry
Materials and Reagents
• Formaldehyde EM grade.• Glutaraldehye EM grade.• BSA.• Triton X-100.• Sodium metaperiodate (Sigma).• NGS.• Osmium tetroxide (Electron Micros-
copy Science).• Uranyl acetate (Electron Microscopy
Science).
Procedure
1. Perfuse the animal with a fixative con-sisting of 1% paraformaldehyde and2% glutaraldehyde in Sörensen buffer0.1 M, pH 7.6.
2. Remove the areas of interest and trimthem to small blocks (not exceeding 5mm in thickness). Postfix for 2 addi-tional hours in the same fixative.
3. Reduce blocks to small (1 mm3) cubes. Optional: it is advisable to cutVibratome sections (200 µm) of theareas of interest to be eventually flat-embedded for the purpose of betterorientation or correlative lightmicroscopy studies.
4. Thoroughly wash in Sörensen buffer0.1 M, pH 7.6.
5. Postfix Vibratome sections (or blocks)in osmium ferrocyanide for 60 minutes
at 4°C. The osmium ferrocyanide isprepared just prior to use by addingone volume of 2% aqueous osmiumtetroxide to one volume of 3% potassi-um ferrocyanide.
6. Wash in maleate buffer, pH 5.1, 4 × 5minutes.
7. Stain for 60 minutes at 4°C with 1%uranyl acetate in maleate buffer, pH6.0.
8. Wash in maleate buffer, pH 5.1, 4 × 5minutes.
9. Dehydrate as follows: 50% ethanol for5 minutes; 80% ethanol for 5 minutes;95% ethanol for 5 minutes; 100%ethanol 3 × 10 minutes.
10. Transfer sections in propylene oxide 2× 10 minutes.
11. Infiltrate in resin as follows: propyleneoxide–resin without accelerator (vol/vol): 3:1 for 15 minutes; 2:1 for 15minutes; 1:1 for 2 hours (not longer).Embed in resin plus accelerator andcure for 24 hours.
Protocol for Post-Embedding SingleImmunogold Staining
Materials and Reagents
• Syringe filters—pore size 0.22 µm(Whatman, Maidstone, England).
• 200 to 300 mesh nickel grids (ElectronMicroscopy Science).
• BSA.• Triton X-100.• NGS.• Egg albumin (Sigma).• Goat antirabbit (mouse) IgG gold
conjugated (10 or 20 nm) (British Bio-Cell International, Cardiff, Wales,UK). An alternative: protein A-gold com-plex (10 or 20 nm) (British BioCellInternational).
169
10. Ultrastructural Analysis of Neuronal Connectivity
Merighi10-aucorr.qxd 5/23/02 7:56 PM Page 169

Procedure
All solutions must be filtered with dis-posable filters. All steps are performeddirectly on grid. Grids are incubated ondrops (30–50 µL) of solutions.1. Collect sections onto precleaned
uncoated grids.2. Float grids on drops of a saturated
aqueous solution of sodium metaperi-odate for 5 to 15 minutes at room tem-perature (see also Table 2).
3. Rinse in 0.5 M TBS, pH 7.0 to 7.6,containing 1% Triton X-100.
4. Incubate for 60 minutes at room tem-perature in TBS containing 1% BSA(TBS-BSA) to which 10% normalserum from the donor species of thegold-conjugated IgGs has been added(generally NGS). If protein A-goldcomplexes are used, incubate in TBS-BSA containing 1% egg albumin.
5. Transfer onto drops of primary antiseraat optimal titer for 24 to 72 hours atroom temperature.
6. Thorough wash in TBS-BSA and incu-bate for 60 minutes at 37°C with theappropriate gold conjugate diluted1:15 in TBS-BSA.
7. Extensively rinse in TBS-BSA, andpostfix for 10 minutes at room temper-ature in 2.5% glutaraldehyde inSörensen or cacodylate buffer.
8. Wash grids in double-distilled waterand allow to dry protected from dust.
9. Counterstain with Reynold’s lead cit-rate and uranyl acetate.
Protocol for Post-Embedding DoubleImmunogold Staining Using PrimaryAntibodies Raised in Different Species
Materials and Reagents
See section on single immunogoldstaining.
Procedure
1–4. See section on single immunogold staining.
5. Incubate in a mixture of the first pri-mary antibodies at optimal titers, i.e.,rabbit anti-A and mouse anti-B.
6. Thoroughly wash in TBS-BSA andincubate for 60 minutes at 37°C withthe appropriate mixture of gold con-jugates diluted 1:15 in TBS-BSA, i.e.,goat antirabbit 10 nm gold and goatantimouse 20 nm gold.
7–9. See section on single immunogoldstaining.
RESULTS AND DISCUSSION
Pre-Embedding Versus Post-EmbeddingImmunolabeling Methods
The comparison of Figures 3 and 4 isuseful to the purpose of describing themain advantages and disadvantages in theuse of pre- and post-embedding proceduresfor the localization of neural antigens inthe CNS. In this case, we have used amouse monoclonal antibody against theglial fibrillary acidic protein (GFAP)(Roche Molecular Biochemicals, Mann-heim, Germany) to localize this intermedi-ate filament protein in astrocytes from thehippocampus and spinal cord. We willbriefly consider the following main issues:(i) ultrastructural preservation, (ii) sensitiv-ity of the methods, (iii) subcellular local-ization of antigen(s) under study, (iv) pos-sibility to quantify the results ofimmunocytochemical labeling, and (v) toperform multiple stainings.
Ultrastructural Preservation
As mentioned in the Background sec-tion, the need for optimal ultrastructuralpreservation is mandatory, particularly in
170
P. Aimar et al.
Merighi10-aucorr.qxd 5/23/02 7:56 PM Page 170

the study of neural connectivity and neu-rochemical characterization of differentsynapses in the neuropil of the CNS.Although the use of pre-embeddingimmunolabeling with ultra-small goldoffers several advantages over the moreclassical immunoenzymatic methods (aspreviously discussed), it is clear that theultrastructural preservation, which can beachieved by this means, is generally inferiorto that obtained when post-embeddingimmunogold labeling is performed on
osmicated material in epoxy resins. Thedetrimental effect(s) on ultrastructure aremainly linked to the (general) use of milderaldehyde fixation and the treatments thatare necessary to improve tissue penetration.In particular, treatment with detergents(usually Triton X-100) even for a shortperiod of time is sufficient to dissolve partof the cell membranes (see Reference 78 forfurther discussion). Under this aspect, theuse of freeze-thawing may be less detri-mental. However, in both cases, there is a
171
10. Ultrastructural Analysis of Neuronal Connectivity
Figure 3. Ultrastructural visualiza-tion of GFAP immunoreactivity inthe rat hippocampus using post-embedding immunogold (A) or pre-embedding immunogold (B) label-ing techniques. Post-embeddingimmunolabeling (A) has been carriedout directly on ultrathin sectionsfrom osmicated tissue using a 10 nmIgG gold conjugate. An astrocyticprocess is indicated by the arrows.Gold particles are seen over the glialfilaments (insert). Note that they arequite limited in number and show a“patchy” distribution although fila-ments run all along the glial process.Note also that cell membranes arenicely preserved, and that someholes–cleft (asterisks) can be observedas a consequence of section etchingwith sodium metaperiodate. Pre-embedding immunolabeling (B) hasbeen carried out using an ultra-smallgold probe (Nanogold) followed bysilver intensification. Silver-intensi-fied gold particles are easily seen atlow power and almost completely fillan astrocytic process which is indicat-ed by the arrows. Note the intensityof the immunocytochemical signal,but also the less satisfactory preserva-tion of cell membranes due to the useof Triton X-100 pretreatment. Scalebars = 1 µm; insert = 0.25 µm.
Merighi10-aucorr.qxd 5/23/02 7:56 PM Page 171

significative variability in the degree ofpreservation not only within the same tis-sue block, but also among areas of the samesection. Therefore, a certain degree ofunpredictability of the final result in termsof ultrastructural preservation has always tobe expected after pre-embedding immuno-labeling. It is worthy to mention here thatalthough the use of ultra-small gold offerssome ameliorations with respect to theDAB immunoenzymatic procedure, it stillenhances tissue penetration of primary
antibodies. To improve tissue morphologyand yet allow for good antibody andreagent penetration, it was recently pro-posed to use high glutaraldehyde concen-tration (3%) and sodium metabilsulfite(31) as a fixative for pre-embedding withultra-small gold.
Sensitivity of the Methods
The relatively poor sensitivity of thepost-embedding immunolabeling methods
172
P. Aimar et al.
Figure 4. Ultrastructural visualization ofGFAP immunoreactivity in the rat hip-pocampus using post-embedding im-munogold (A) or pre-embedding im-munogold (B) labeling techniques. Highpower views clearly show the differences instaining intensity of glial filaments (gf ) andthe extent of preservation of subcellularstructures such as synaptic vesicles (sv) orneurotubules (nt). Also, at this magnifica-tion, the detrimental effect of tissue per-meabilization is clearly apparent (asterisks).Scale bars = 0.5 µm.
Merighi10-aucorr.qxd 5/23/02 7:56 PM Page 172
perhaps represents the most limiting factorin the use this approach for the localizationof neural antigens within the CNS. Clearly,a much stronger signal is generallyachieved after pre-embedding immunola-beling. Again, the comparison of Figures 3and 4 is self explanatory. Besides thealready mentioned chemical parameters tobe taken into consideration, i.e., primaryfixation, osmium postfixation, dehydra-tion, embedding, and curing, which alto-gether decrease the sensitivity of the post-embedding methods by “killing” tissueantigenicity, two physical parameters needalso to be considered: (i) a proper surfaceexposition of the antigen, and (ii) its (rela-tive) spatial distribution. The post-embed-ding reactions on plastic sections are sur-face reactions, and labeling is restricted toepitopes that are exposed at the cuttingplanes of the ultrathin sections. This mightexplain why post-embedding immunogoldlabeling is, in our example, restricted tocertain areas of the astrocyte processeswhich, on the other hand, appear to con-tain glial filaments all along their course(Figure 3). The spatial distribution of theantigen(s) may also affect the actual possi-bility of a successful localization with thepre- or post-embedding approaches. If oneconsiders two antigens which, in absoluteterms, have the same concentration insidethe cell, but a different cellular localization,such as a cytosolic transmitter synthesizingenzyme and a biologically active peptidepacked in large dense cored vesicles(LGVs), the difficulties in localizing theformer by a post-embedding approach areobvious, since a low number of gold parti-cles scattered over the general cytoplasmare difficult to ascribe to specific stainingrather than to unwanted background. Thisexample and Figure 5 help to clarify whythe post-embedding methods are ideal forlocalizing antigens concentrated (stored) insynaptic vesicles or other subcellularorganelles rather than evenly distributed
inside the cell. On the other hand, the factthat immunoenzymatic pre-embeddingreactions with DAB are self-enhancingreactions is often associated with high sen-sitivity (but poor cellular resolution, sincethe chromagen deposition usually diffusesfrom the actual sites of the antigen–anti-body interaction) and makes these meth-ods ideal for studies of molecules whichhave a rather general distribution withinthe cytosol, although at relatively low con-centrations.
Subcellular Localization ofImmunolabeling
The problem of reliable subcellularlocalization of immunolabeling is directlycorrelated to the so-called spatial resolutionof the techniques. This latter becomes acritical factor which must be carefully con-sidered to determine the actual site inwhich the antigen(s) under study is (are)localized. The spatial resolution of animmunocytochemical technique is definedas the distance between the (particulate)marker employed for visualization and theepitope recognized by the primary anti-body. In the case of the immunoenzymatictechniques, this is rather difficult to esti-mate due to the nature of the electrondensemarker and the possibility of its diffusionfrom the original site(s) of deposition. Thisis the reason why the use of immunogoldlabeling techniques gives the possibility oflocalizing antigens to different subcellularcompartments more precisely than afterany other ultrastructural immunocyto-chemical methods. The minimum value ofthe spatial resolution that can theoreticallybe achieved with the protein A-gold tech-nique is about 16 nm, using a colloidalgold particle of 3 nm (80). Using the IgG-gold technique the spatial resolution isslightly less satisfactory, since IgGs are big-ger than protein A (68). For example,using IgG-gold conjugates with gold parti-
173
10. Ultrastructural Analysis of Neuronal Connectivity
Merighi10-aucorr.qxd 5/23/02 7:56 PM Page 173

cles of 10 nm, the resolution is approxi-mately 21 nm. Therefore, the bigger thegold particle, the less satisfactory is the spa-tial resolution of the technique. Gold clus-ters of small size covalently attached to Fab′fragments (Nanogold) offer a better resolu-tion since Fab′ fragments are about 1/3 thesize of IgGs (38,39). In this latter case,however, one has to take into considerationthe need for silver enhancement of theultra-small size gold probe. The discussionof this aspect is not merely academic, since
it might be necessary, for example, to local-ize certain molecules within the synapticvesicles (mean diameter 40 nm) or on theirmembranes, so that a resolution in themagnitude of 20 nm clearly becomes a crit-ical factor for a correct interpretation of thefinal result(s) obtained after immunogoldlabeling.
Quantification of Immunostaining
In epoxy resin-embedded material, gold
174
P. Aimar et al.
Figure 5. Post-embedding immuno-gold labeling of neural antigens inosmicated tissue. (A) Localization ofcalcitonin gene-related peptide(CGRP) immunoreactivity (10 nmgold particles) over LGVs in terminalswithin the superficial dorsal horn ofthe spinal cord. In the insert, the sub-cellular site of positive reaction is clear-ly restricted to LGVs. (B) Incorpora-tion of bromo-deoxyuridine (BrdU) ina mitotic granule cell precursor of thepostnatal cerebellar cortex. Exoge-nously administered BrdU has beenvisualized using an indirect immuno-gold method with 15 nm colloidalgold. Gold particles are scattered overmitotic chromosomes. (C) Doubleimmunogold labeling of substance P(10 nm gold, long arrows) and CGRP(20 nm gold) over the LGVs in a nerveterminal of the superficial dorsal horn.Staining has been obtained using thesimultaneous labeling method. sv =synaptic vesicles. Scale bars = 0.2 µm(A and C), 1 µm (B).
Merighi10-aucorr.qxd 5/23/02 7:56 PM Page 174

labeling is restricted to antigens exposed tothe surface of the ultrathin sections (7,9).Since immunoreagents do not penetratesections, tissue permeability is not influ-encing the distribution of labeling as afterpre-embedding immunocytochemistry.Therefore, it is possible to quantify thegold particle label over different subcellularcompartments. Quantitative measurementof gold labeling in ultrathin frozen sectionsrequires a 3-dimensional analysis, since inthis case, immunoreactants do penetratetissues (52,72,73).
Results are usually expressed in terms ofnumber of gold particles per area andshould be corrected for background label-ing over empty resin (28,29,36,42,63,80,86,88,91). Computerized systems and ded-icated software have been developed to thispurpose (6,11,28,76).
Multiple Labelings
The availability of gold probes of differ-ent sizes makes the use of post-embeddingimmunogold methods as the methods ofchoice for multiple labeling experiments.Several alternatives are available to this pur-pose, and these include the use of the simul-taneous labeling procedure when the two(or more) primary antibodies available areraised in different species (Figure 5), thedouble face methods, the double protein A(protein G) procedure, and a multiple label-ing protocol based on the use of para-formaldehyde vapors to block unreacted pri-mary immunoglobulin binding sites. Theadvantages and disadvantages of these meth-ods have been already reviewed in detail(62). Finally, it should be mentioned herethat silver intensification of ultra-small goldprobes can be used not only as a single stepprocedure after immunogold labeling tofacilitate the visualization of gold particles atlow magnification, but also for producingdifferent sized gold particles in multiplelabeling procedures (44,49,50,92).
Use of Combined Methods for theAnalysis of Neuronal Connectivity
As thoroughly discussed in the previoussections, several labeling procedures at theultrastructural level can often be performedafter high glutaraldehyde, osmium, andepoxy embedment, i.e., using a materialthat was subjected to a quasi-conventionalpreparative procedure. This has opened theway not only to combine together the dif-ferent immunolabeling protocols, but alsoto use these methods in conjunction withseveral other procedures particularly rele-vant to the study of neuronal connections.These combined approaches have a widerange of potential applications and can betheoretically employed to solve a numberof problems in different fields of basic andapplied neurobiology research.
Combination Pre- and Post-embeddingProcedures
As discussed above, pre- and post-embedding methods have to be consideredas fully complementary to each othersunder several aspects. The combined use ofpre- and post-embedding immunocyto-chemical labeling has been particularly use-ful for the study of the connectivity andsynaptic interactions of central neurons(see for example References 20,21,34,35,and 67). In general terms, a pre-embed-ding labeling procedure is performed first,after low or mild aldehyde fixation, using aprimary antibody directed towards themore labile antigen to be detected and asuitable chromagen (usually DAB). Thenstronger aldehyde fixation, osmication, andembedding, follow. The second, moreresistant, antigen under study is eventuallyvisualized using a post-embedding stainingprotocol. The entire procedure is technical-ly very demanding and not always sostraight. The choice of such an approachmainly depends on the impossibility to
175
10. Ultrastructural Analysis of Neuronal Connectivity
Merighi10-aucorr.qxd 5/23/02 7:56 PM Page 175

visualize the more labile antigen with apost-embedding protocol. However,besides the resistance of antigen(s) tostrong fixation, there are several other vari-ables to be considered, as widely discussedin the previous sections, among which themembrane or cytosolic rather than particu-late distribution of antigen(s) under analy-sis appears to be particularly significative.
Combination with Enzyme Histochemical Techniques
Again, this approach combines a pre-and a post-embedding procedure, but thefirst pre-embedding labeling is a histochem-ical reaction, which is used to revealendogenous enzyme activities. In this case,primary fixation must be compatible withretention of the activity of enzyme(s) understudy. Moreover, a proper chromagen forultrastructural visualization of the enzyme–substrate reaction is needed. Fortunately, anumber of enzymes, such as for exampleacetylcholinesterase (12,87), alkaline phos-phatase (33,37,89), β-galactosidase (85),and nicotinamide adenine dinucleotidephosphate-diaphorase (NADPH-d) (1,13,94), retain their activities in tissues fixed forultrastructural examination. The possibilityto label nitric oxide (NO)-producing cellsby means of a NADPH-d reaction modi-fied for ultrastructural use in combinationwith post-embedding immunogold (3,13)seems to be of particular interest. An addi-tional field of further exploitation of post-embedding gold labeling methods relies onthe possibility to combine them with theultrastructural visualization of enzymessuch as β-galactosidase and human placen-tal alkaline phosphatase, which have beenengineered as reporter genes in transgenicanimals (37,85). For further discussion ofthis type of approach see Chapter 7.
Combination with NeuroanatomicalTract-Tracing Methods
The combination of pre- and post-embedding immunogold labeling and neu-roanatomical tract-tracing methods is anuseful tool in the study of neuronal con-nections. There are several possibilities totrace neuronal connections at the lightlevel. Any of the methods so far developedfor light microscopy has inherent advan-tages and disadvantages. In general terms,any of the tract-tracing methods to be suc-cessfully employed in conjunction withpost-embedding ultrastructural immu-nocytochemistry has to be compatible witha good preservation of cell organelles andmembranes and with the obvious need touse an electrondense tracer. Successful trac-ing of neuronal pathways at the ultrastruc-tural level has been achieved using: (i)Golgi impregnation (87); (ii) retrogradelabeling with either free HRP or HRP con-jugated to plant lectins or other electrondense markers such as colloidal gold parti-cles (5,23,53–56,58,75,78); (iii) antero-grade labeling with free HRP (14,15,22,45,51) or biotinylated dextran amine (84);and (iv) HRP microiontophoretic filling ofsingle neurons or fibers, following electro-physiological characterization (4,57,77).There are numerous examples in the litera-ture in which these methods have beenemployed in conjunction with post-embed-ding immunogold labeling (61,66,83,84).Other approaches such as: (i) anterogradetracing using radiolabeled amino acids (41);(ii) degeneration methods (47,48); and (iii)microiontophoretic filling of single neuronsunder visual control (64) can also be poten-tially combined with post-embeddingimmunogold labeling.
As a general protocol, all these proce-dures involved the administration of thetracer in vivo or in a slice preparation, fol-lowed by primary fixation in low concentra-tion glutaraldehyde and the pre-embedding
176
P. Aimar et al.
Merighi10-aucorr.qxd 5/23/02 7:56 PM Page 176

visualization of the tracer by enzyme histo-chemistry. If a pre-embedding immunogoldprocedure is then chosen, tissue is processedas described in the Protocols section. If apost-embedding approach is preferred, tis-sue is then postfixed in higher glutaralde-hyde concentration, osmicated, and embed-ded. Finally a “classical” immunogoldlabeling procedure is employed to detectdirectly on tissue sections the antigen(s) ofinterest (see Protocols). Since the entire pro-cedure is generally carried out on vibratomeslices, correlative light and electronic studiesare made possible.
ACKNOWLEDGMENTS
Much of the work described here wassupported by grants from the University ofTorino, the Italian Ministero dell’Istruzionedell’Università e della Ricerca (MIUR -Cofin 2000, Cofin 2001), and ConsiglioNazionale delle Ricerche (CNR). We aregreatly indebted to Dr. Jim Hainfeld,Nanoprobes, Inc., for his generous gift ofNanogold probes and Goldenhance-EMreagent.
REFERENCES
1.Aimar, P., I. Barajon, and A. Merighi. 1998. Ultra-structural features and synaptic connections ofNADPH-diaphorase positive neurones in the rat spinalcord. Eur. J. Anat. 2:27-34.
2.Aimar, P., L. Lossi, and A. Merighi. 1997. Immuno-gold labeling for transmission electron microscopy:exploring new frontiers. Cell Vision 4:394-407.
3.Aimar, P., L. Pasti, G. Carmignoto, and A. Merighi.1998. Nitric oxide-producing islet cells modulate therelease of sensory neuropeptides in the rat substantiagelatinosa. J. Neurosci. 18:10375-10388.
4.Alvarez, F.J., A.M. Kavookjian, and R. Light. 1992.Synaptic interactions between GABA-immunoreactiveprofiles and the terminals of functionally definedmyelinated nociceptors in the monkey and cat spinalcord. J. Neurosci. 12:2901-2917.
5.Basbaum, A.I. 1989. A rapid and simple silverenhancement procedure for ultrastructural localizationof the retrograde tracer WGAapoHRP-Au and its usein double-label studies with post-embedding immuno-cytochemistry. J. Histochem. Cytochem. 37:1811-
1815.6.Beier, K. and H.D. Fahimi. 1985. Automatic determi-
nation of labeling density in protein A-gold immuno-cytochemical preparations using an image analyzer.Application to peroxisomal enzymes. Histochemistry82:99-100.
7.Bendayan, M. 1984. Protein A-gold electron micro-scopic immunocytochemistry: methods, applications,and limitations. J. Electron Microsc. Tech. 1:243-270.
8.Bendayan, M. 1987. Introduction of the protein G-gold complex for high-resolution immunocytochem-istry. J. Electron Microsc. Tech. 6:7-13.
9.Bendayan, M., A. Nanci, and F.W.K. Kan. 1987.Effect of tissue processing on colloidal gold cytochem-istry. J. Histochem. Cytochem. 35:983-996.
10.Bendayan, M. and M. Zollinger. 1983. Ultrastructur-al localization of antigenic sites on osmium-fixed tis-sues appliying the protein A-gold technique. J. His-tochem. Cytochem. 31:101-109.
11.Blackstad, T.W., T. Karagulle, and O.P. Ottersen.1990. Morforel, a computer program for two-dimen-sional analysis of micrographs of biological specimens,with emphasis on immunogold preparations. Comput.Biol. Med. 20:15-34.
12.Bolam, J.P., C.A. Ingham, and A.D. Smith. 1984. Thesection-Golgi-impregnation procedure-3. Combina-tion of Golgi-impregnation with enzyme histochem-istry and electron microscopy to characterize acetyl-cholinesterase-containing neurons in the ratneostriatum. Neuroscience 12:711-718.
13.Bouwens, L. and G. Kloppel. 1994. Cytochemicallocalization of NADPH-diaphorase in the four types ofpancreatic islet cell. Histochemistry 101:209-214.
14.Broman, J. and F. Ådahl. 1994. Evidence for vesicularstorage of glutamate in primary afferent terminals.Neuroreport 5:1801-1804.
15.Broman, J., J. Westman, and O.P. Ottersen. 1990.Ascending afferents to lateral cervical nucleus areenriched in glutamate-like immunoreactivity: a com-bined anterograde transport-immunogold study in thecat. Brain Res. 520:178-191.
16.Brorson, S.H. and F. Skjorten. 1996a. Improved tech-nique for immunoelectron microscopy. How to pre-pare epoxy resin to obtain approximately the sameimmunogold labeling for epoxy sections as for acrylicsections without any etching. Micron 27:211-217.
17.Brorson, S.H. and F. Skjorten. 1996b. The theoreticalrelationship of immunogold labeling on acrylic sec-tions and epoxy sections. Micron 27:193-201.
18.Causton, B.E. 1984. The choice of resins for electronimmunocytochemistry, p. 29-36. In J.M. Polak andI.M. Varndell (Eds.), Immunolabelling for ElectronMicroscopy. Elsevier Publishing, Amsterdam.
19.Chang, J.P. and M. Yokama. 1970. A modified sectionfreeze substitution technique. J. Histochem.Cytochem. 18:683-684.
20.Cheng, P.Y., L.Y. Liu Chen, C. Chen, and V.M. Pick-el. 1996. Immunolabeling of Mu opioid receptors inthe rat nucleus of the solitary tract: extrasynaptic plas-malemmal localization and association with Leu5-enkephalin. J. Comp. Neurol. 371:522-536.
21.Cheng, P.Y., A. Moriwaki, J.B. Wang, G.R. Uhl, andV.M. Pickel. 1996. Ultrastructural localization of mu-
177
10. Ultrastructural Analysis of Neuronal Connectivity
Merighi10-aucorr.qxd 5/23/02 7:56 PM Page 177

opioid receptors in the superficial layers of the rat cer-vical spinal cord: extrasynaptic localization and prox-imity to Leu5-enkephalin. Brain Res. 731:141-154.
22.Cruz, F., D. Lima, and A. Coimbra. 1987. Severalmorphological types of terminal arborizations of pri-mary afferents in laminae I-II of the rat spinal cord, asshown after HRP labeling and Golgi impregnation. J.Comp. Neurol. 261:221-236.
23.De Zeeuw, C.I., J.C. Holstege, F. Calkoen, T.J.H.Ruigrok, and J. Voogd. 1988. A new combination ofWGA-HRP anterograde tracing and GABA immuno-cytochemistry applied to afferents of the cat inferiorolive at the ultrastructural level. Brain Res. 447:369-375.
24.Dudek, R.W. and A.F. Boyne. 1986. An excursionthrough the ultrastructural world of quick-fozen pan-creatic islets. Am. J. Anat. 175:217-243.
25.Dudek, R.W., A.F. Boyne, and M. Freinkel. 1981.Quick-freeze fixation and freeze-drying of isolated ratpancreatic islets: application to the ultrastructurallocalization of inorganic phosphate in the pancreaticbeta cell. J. Histochem. Cytochem. 29:321-325.
26.Dudek, R.W., G.V. Childs, and A.F. Boyne. 1982.Quick-freezing and freeze drying in preparation forhigh quality morphology and immunocytochemistry atthe ultrastructural level: application to pancreatic betacells. J. Histochem. Cytochem. 30:129-138.
27.Dudek, R.W., I.M. Varndell, and J.M. Polak. 1984.Quick-freeze fixation and freeze drying for electronmicroscopic immunocytochemistry, p. 235-248. InJ.M. Polak and I.M. Varndell (Eds.), Immunolabellingfor Electron Microscopy. Elsevier Publishers, Amster-dam.
28.Eneström, S. and B. Kniola. 1990. Quantitiative ultra-structural immunocytochemistry using a computerizedimage analysis system. Stain Technol. 65:263-278.
29.Eneström, S. and B. Kniola. 1995. Resin embeddingfor quantitative immunoelectron microscopy. A com-parative computerized image analysis. Biotech. His-tochem. 70:135-146.
30.Faulk, W.P. and G.M. Taylor. 1971. An immunocol-loid method for the electron microscope. Immuno-chemistry 8:1081-1083.
31.Gilerovitch, H.G., G.A. Bishop, J.S. King, and R.W.Burry. 1995. The use of electron microscopicimmunocytochemistry with silver-enhanced 1.4-nmgold particles to localize GAD in the cerebellar nuclei.J. Histochem. Cytochem. 43:337-343.
32.Gingras, D. and M. Bendayan. 1994. Compartmen-talization of secretory proteins in pancreatic zymogengranules as revealed by immunolabeling on cryo-fixedand molecular distillation processed tissue. Biol. Cell.81:153-163.
33.Gomez, S. and A. Boyde. 1994. Correlated alkalinephosphatase histochemistry and quantitative backscat-tered electron imaging in the study of rat incisorameloblasts and enamel mineralization. Microsc. Res.Tech. 29:29-36.
34.Gong, L.W., Y.-Q. Ding, D. Wang, H.X. Zheng, B.Z.Qin, J.S. Li, T. Kaneko, and N. Mizuno. 1997.GABAergic synapses on mu-opioid receptor-expressingneurons in the superficial dorsal horn: an eletronmicroscopy study in the cat spinal cord. Neurosci. Lett.
227:33-36.35.Gracy, K.N. and V.M. Pickel. 1996. Ultrastructural
immunocytochemical localization of the N-methyl-D-aspartate receptor and tyrosine hydroxylase in the shellof the rat nucleus accumbens. Brain Res. 739:169-181.
36.Gundersen, V., O. Shupliakov, L. Brodin, O.P.Ottersen, and J. Storm-Mathisen. 1995. Quantifica-tion of excitatory amino acid uptake at intact gluta-matergic synapses by immunocytochemistry of exoge-nous D-aspartate. J. Neurosci. 15:4417-4428.
37.Gustincich, S., A. Feigenspan, D.K. Wu, L.J. Koop-man, and E. Raviola. 1997. Control of dopaminerelease in the retina: a transgenic approach to neuralnetworks. Neuron 18:723-726.
38.Hainfeld, J.F. and F.R. Furuya. 1992. A 1.4 nm goldgluster covalently attached to antibodies improvesimmunolabeling. J. Histochem. Cytochem. 40:177-184.
39.Hainfeld, J.F. and R.D. Powell. 1997. Nanogold tech-nology: new frontiers in gold labeling. Cell Vision4:408-432.
40.Hayat, M.A. 1977. Principles and techniques of elec-tron microscopy. Vol. 1. Biological Applications.Edward Arnold, New York.
41.Holstege, J.C. and J.M. Vrensen. 1988. Anterogradetracing in the brain using autoradiography and HRP-histochemistry. A comparison at the ultrastructurallevel. J. Microsc. 150:233-243.
42.Howell, K.E., U. Reuter-Carlson, E. Devaney, J.P.Luzio, and S.D. Fuller. 1987. One antigen one gold? Aquantitative analysis of immunogold labelling of plas-ma membrane 5′-nucleotidase in frozen thin sections.Eur. J. Cell Biol. 44:318-326.
43.Hsu, S.M., L. Raine, and H. Fanger. 1981. Use ofavidin-biotin-peroxidase complex (ABC) inimmunoperoxidase techniques. A comparison betweenABC and unlabeled antibody (PAP) procedures. J. His-tochem. Cytochem. 29:577-587.
44.Huiz, J.M., M.L. Campos, R.H. Helfert, and R.A.Altschuler. 1996. Silver intensification of immunocol-loidal gold on ultrathin plastic sections applied to thestudy of the neuronal distribution of GABA andglycine. J. Hirnforsch. 37:51-56.
45.Kechagias, S. and J. Broman. 1994. Compartmenta-tion of glutamate and glutamine in the lateral cervicalnucleus: further evidence for glutamate as a spinocervi-cal tract neurotransmitter. J. Comp. Neurol. 340:531-540.
46.Keller, G.A., K.T. Tokuyasu, A.H. Dutton, and S.J.Singer. 1984. An improved procedure for immuno-electronmicroscopy: ultrathin plastic embedding ofimmunolabelled ultrathin frozen sections. Proc. Natl.Acad. Sci. USA 81:5744-5747.
47.Knyihar-Csillik, E., B. Csillik, and A.B. Oestreicher.1992. Light and electron microscopic localization of B-50 (GAP43) in the rat spinal cord during transgan-glionic degenerative atrophy and regeneration. J. Neu-rosci. Res. 32:93-109.
48.Knyihar-Csillik, E., B. Csillik, and P. Rakic. 1982.Ultrastructure of normal and degenerating glomerularterminals of dorsal root axons in the substantia gelati-nosa of the Rhesus monkey. J. Comp. Neurol.210:357-375.
178
P. Aimar et al.
Merighi10-aucorr.qxd 5/23/02 7:56 PM Page 178

49.Krenacs, T. and L. Dux. 1994. Silver-enhancedimmunogold labeling of calcium-ATPase in sarcoplas-mic reticulum of skeletal muscle [letter, comment]. J.Histochem. Cytochem. 42:967-968.
50.Krenacs, T., M. van Dartel, E. Lindhout, and M.Rosendaal. 1997. Direct cell/cell communication inthe lymphoid germinal center: connexin43 gap junc-tions functionally couple follicular dendritic cells toeach other and to B lymphocytes. Eur. J. Immunol.27:1489-1497.
51.Light, A.R. and A.M. Kavookjian. 1988. Electronmicroscopic localization of peptide-like immunoreac-tivity in labelled dorsal root terminals in the spinal sub-stantia gelatinosa of the monkey, p. 57-69. In F.Cervero, G.J. Bennett, and P.M. Headley (Eds.), Pro-cessing of Sensory Information in the Superficial Dor-sal Horn of the Spinal Cord. Plenum Press, New York.
52.Liou, W., H.J. Geuze, and J.W. Slot. 1996. Improvingstructural integrity of cryosections for immunogoldlabeling. Histochem. Cell Biol. 106:41-58.
53.Lue, J.H., Y.F. Jiang Shieh, J.Y. Shieh, and C.Y. Wen.1996. The synaptic interrelationships between primaryafferent terminals, cuneothalamic relay neurons andGABA-immunoreactive boutons in the rat cuneatenucleus. Neurosci. Res. 24:363-371.
54.Maxwell, D.J., W.H. Christie, A.D. Short, J. Störm-Mathisen, and O.P. Ottersen. 1990. Central boutonsof glomeruli in the spinal cord of the cat are enrichedwith L-glutamate-like immunoreactivity. Neuroscience36:83-104.
55.Maxwell, D.J., W.M. Christie, O.P. Ottersen, and J.Störm-Mathisen. 1990. Terminals of group Ia primaryafferent fibers in Clarke’s column are enriched with L-glutamate-like immunoreactivity. Brain Res. 510:346-350.
56.Maxwell, D.J., W.M. Christie, A.D. Short, and A.G.Brown. 1990. Direct observations of synapses betweenGABA-immunoreactive boutons and muscle afferentterminals in lamina VI of cat spinal cord. Brain Res.530:215-222.
57.Maxwell, D.J., R. Kerr, E. Jankowska, and J.S. Rid-dell. 1997. Synaptic connections of dorsal horn groupII spinal interneurons: synapses formed with theinterneurons and by their axon collaterals. J. Comp.Neurol. 380:51-69.
58.Maxwell, D.J., O.P. Ottersen, and J. Storm-Mathisen.1995. Synaptic organization of excitatory and inhibito-ry boutons associated with spinal neurons which pro-ject through the dorsal columns of the cat. Brain Res.676:103-112.
59.Menco, B.P., A.M. Cunningham, P. Qasba, N. Levy,and R.R. Reed. 1997. Putative odour receptors localizein cilia of olfactory receptor cells in rat and mouse: afreeze-substitution ultrastructural study. J. Neurocytol.26:297-312.
60.Merighi, A. 1992. Post-embedding electron micro-scopic immunocytochemistry, p. 51-87. In J.M. Polakand J.V. Priestly (Eds.), Electron MicroscopicImmunocytochemistry. Oxford University Press, Lon-don.
61.Merighi, A., F. Cruz, and A. Coimbra. 1992.Immunocytochemical staining of neuropeptides in ter-minal arborization of primary afferent fibers antero-
gradely labeled and identified at light and electronmicroscopic levels. J. Neurosci. Methods 42:105-113.
62.Merighi, A. and J.M. Polak. 1993. Post-embeddingimmunogold staining, p. 229-264. In A.C. Cuello(Ed.), Immunohistochemistry II. John Wiley & Sons,London.
63.Merighi, A., J.M. Polak, and D.T. Theodosis. 1991.Ultrastructural visualization of glutamate and aspartateimmunoreactivities in the rat dorsal horn with specialreference to the co-localization of glutamate, substanceP and calcitonin gene-related peptide. Neuroscience40:67-80.
64.Merighi, A., E. Raviola, and R.F. Dacheux. 1996.Connections of two types of flat cone bipolars in therabbit retina. J. Comp. Neurol. 371:164-178.
65.Morris, J.F., D.V. Pow, and F.D. Shaw. 1989. Strate-gies for the ultrastructural study of peptide containingneurons, p. 83-124. In G. Fink and A.J. Harmar(Eds.), Neuropeptides: A Methodology. John Wiley &Sons, Chichester.
66.Negyessy, L., J. Takacs, I. Divac, and J. Hamori.1994. A combined Golgi and post-embedding GABAand glutamate electron microscopic study of the nucle-us dorsomedialis thalami of the rat. Neurobiology2:325-341.
67.Nirenberg, M.J., J. Chan, R.A. Vaughan, G.R. Uhl,M.J. Kuhar, and V.M. Pickel. 1997. Immunogoldlocalization of the dopamine transporter: an ultrastruc-tural study of the rat ventral tegmental area. J. Neu-rosci. 17:5255-5262.
68.Ottersen, O.P. and C.R. Bramham. 1988. Quantita-tive electron microscopic immunocytochemistry ofexcitatory amino acids, p. 93-100. In E.A. Cavalheiro,J. Lehmann and L. Turski (Eds.), Frontiers in Excitato-ry Amino Acids Research. Alan R. Liss, New York.
69.Pease, D.C. 1964. Histological Techniques for Elec-tron Microscopy. Academic Press, New York.
70.Phend, K.D., A. Rustioni, and R.J. Weinberg. 1995.An osmium-free method of epon embedment that pre-serves both ultrastructure and antigenicity for post-embedding immunocytochemistry. J. Histochem.Cytochem. 43:283-292.
71.Pickel, V.M., J. Chan, and C. Aoki. 1993. Electronmicroscopic immunocytochemical labelling of endoge-nous and/or transported antigens in rat brain using sil-ver intensified one-nanometre colloidal gold, p. 265-280. In A.C. Cuello (Ed.), Immunohistochemistry II.John Wiley & Sons, Chichester.
72.Posthuma, G., J.W. Slot, and H.J. Geuze. 1984.Immunocytochemical assays of amylase and chy-motrypsinogen in rat pancreas secretory granules. Effi-cacy of using immunogold-labeled ultrathin cryosec-tions to estimate relative protein concentrations. J.Histochem. Cytochem. 32:1028-1034.
73.Posthuma, G., J.W. Slot, and H.J. Geuze. 1987. Use-fulness of the immunogold technique in quantitationof a soluble protein in ultra-thin sections. J. His-tochem. Cytochem. 35:405-411.
74.Priestley, J.V. 1984. Pre-embedding ultrastructuralimmunocytochemistry: immunoenzyme techniques, p.37-52. In J.M. Polak and I.M. Varndell (Eds.),Immunolabelling for Electron Microscopy. ElsevierPublishers, Amsterdam.
179
10. Ultrastructural Analysis of Neuronal Connectivity
Merighi10-aucorr.qxd 5/23/02 7:56 PM Page 179

75.Priestley, J.V. and A.C. Cuello. 1989. Ultrastructuraland neurochemical analysis of synaptic input totrigemino-thalamic projection neurones in lamina I ofthe rat: a combined immunocytochemical and retro-grade labelling study. J. Comp. Neurol. 285:467-486.
76.Pulczynski, S. and O. Myhre Jensen. 1994. Quantita-tion of immunogold with an interactive image analysissystem: a new, practical approach to antibody-inducedmodulation, internalization and intracellular transportof surface antigens in viable hematopoietic cells. Anal.Quant. Cytol. Histol. 16:393-399.
77.Rèthelyi, M., A.R. Light, and E.R. Perl. 1989. Synap-tic ultrastructure of functionally and morphologicallycharacterized neurons of the superficial spinal dorsalhorn of cat. J. Neurosci. 9:1846-1863.
78.Ribeiro-Da-Silva, A., J.V. Priestley, and A.C. Cuello.1993. Pre-embedding ultrastructural immunocyto-chemistry, p. 181-228. In A.C. Cuello (Ed.), Immuno-histochemistry II. John Wiley & Sons, Chichester.
79.Robards, A.W. and U.B. Sleytr. 1985. Low tempera-ture methods in biological electron microscopy, p. 1-551. In A.M. Glauert (Ed.), Practical Methods in Elec-tron Microscopy. Elsevier Publishers, Amsterdam.
80.Roth, J. 1982. The protein A-gold (pAg) technique—aqualitative and quantitative approach for antigen local-ization on thin sections, p. 107-134. In G.R. Bullockand P. Petrusz (Eds.), Techniques in Immunohisto-chemistry (Vol. I). Academic Press, London.
81.Roth, J. 1984. The protein A-gold technique for anti-gen localization in tissue sections by light and electronmicroscopy, p. 113-122. In J.M. Polak and I.M. Varn-dell (Eds.), Immunolabelling for Electron Microscopy.Elsevier Publishers, Amsterdam.
82.Roth, J. 1996. The silver anniversary of gold: 25 yearsof the colloidal gold marker system for immunocyto-chemistry and histochemistry. Histochem. Cell. Biol.106:1-8.
83.Saha, S., T.F. Batten, and P.N. McWilliam. 1995.Glutamate-immunoreactivity in identified vagal affer-ent terminals of the cat: a study combining horseradishperoxidase tracing and post-embedding electronmicroscopic immunogold staining. Exp. Physiol.80:193-202.
84.Schwarz, C. and Y. Schmitz. 1997. Projection fromthe cerebellar lateral nucleus to precerebellar nuclei inthe mossy fiber pathway is glutamatergic: a study com-bining anterograde tracing with immunogold labelingin the rat. J. Comp. Neurol. 381:320-334.
85.Sekerkova, G., Z. Katarova, F. Joo, J.R. Wolff, S. Pro-dan, and G. Szabo. 1997. Visualization of beta-galac-tosidase by enzyme and immunohistochemistry in theolfactory bulb of transgenic mice carrying the LacZtransgene. J. Histochem. Cytochem. 45:1147-1155.
86.Slot, J.W., G. Posthuma, L.Y. Chang, J.D. Crapo, andH.J. Geuze. 1989. Quantitative aspects of immuno-gold labeling in embedded and non-embedded sec-tions. Am. J. Anat. 185:271-281.
87.Somogyi, P. 1990. Synaptic connections of neuronesidentified by golgi impregnation: characterisation byimmunocytochemical, enzyme histochemical anddegeneration methods. J. Electron Microsc. Tech.15:332-351.
88.Somogyi, P., K. Halasy, J. Somogyi, J. Störm-Mathisen, and O.P. Ottersen. 1986. Quantification ofimmunogold labelling reveals enrichment of glutamatein mossy and parallel fibre terminals in cat cerebellum.Neuroscience 19:1045-1050.
89.Song, Z.M., S.J. Brookes, and M. Costa. 1994. Char-acterization of alkaline phosphatase-reactive neurons inthe guinea-pig small intestine. Neuroscience 63:1153-1167.
90.Sternberger, L.A., P.J.J. Hardy, J.J. Cucculis, andH.G. Meyer. 1970. The unlabeled antibody-enzymemethod of immunohisto-chemistry. Preparation andproperties of soluble antigen-antibody complex (horse-radish peroxidase-anti-horseradish peroxidase) and itsuse in identification of spirochetes. J. Histochem.Cytochem. 18:315-333.
91.Stirling, J.W. 1990. Immuno- and affinity probes forelectron microscopy: a review of labeling and prepara-tion techniques. J. Histochem. Cytochem. 38:145-158.
92.Stirling, J.W. 1993. Use of tannic acid and silverenhancer to improve staining for electron microscopyand immunogold labeling. J. Histochem. Cytochem.41:643-648.
93.Stirling, J.W. and P.S. Graff. 1995. Antigen unmask-ing for immunoelectron microscopy: labeling isimproved by treating with sodium ethoxide or sodiummetaperiodate, then heating on retrieval medium. J.Histochem. Cytochem. 43:115-123.
94.Tang, F.R., C.K. Tan, and E.A. Ling. 1995. The dis-tribution of NADPH-d in the central grey region (lam-ina X) of rat upper thoracic spinal cord. J. Neurocytol.24:735-743.
95.Tokuyasu, K.T. 1984. Immuno-cryoultramicrotomy,p. 71-82. In J.M. Polak and I.M. Varndell (Eds.),Immunolabelling for Electron Microscopy. ElsevierPublishers, Amsterdam.
96.van Lookeren Campagne, M., A.B. Oestreicher, T.P.Van Der Krift, W.H. Gispen, and A.J. Verkleij. 1991.Freeze-substitution and lowicryl HM20 embedding offixed rat brain: suitability for immunogold ultrastruc-tural localization of neural antigens. J. Histochem.Cytochem. 39:1267-1279.
180
P. Aimar et al.
Merighi10-aucorr.qxd 5/23/02 7:56 PM Page 180

181
OVERVIEW
Immunocytochemical and electrophysi-ological techniques have each indepen-dently yielded important informationregarding the chemical anatomy of andfunction in the central nervous system. Yetit is now apparent that the combined appli-cation of these two techniques can yieldinformation of considerably greater valuethan the simple addition of the dataderived from the isolated use of each of thetwo techniques. In fact, such a combinedapproach is the only way in which it is pos-sible to know how the morphologicalproperties of one specific neuron correlatewith the physiological properties of thatsame cell. With the application of this typeof approach, it becomes possible to draw acorrelation between the physiological andmorphological properties of intracellularlylabeled neurons with their neurotransmit-ter-specific innervation and with the trans-mitter and receptor content of the neuronsthemselves.
In this chapter, we will provide details ofthe protocols for two approaches used toachieve the objectives described above.
One involves the use of intracellularrecording from central nervous system(CNS) neurons in the whole animal. Theother involves whole cell patch clamprecording from live slices. Each approachhas its advantages and limitations andshould be selected based on the type ofissue one seeks to study.
BACKGROUND
The approach combining intracellularelectrophysiological recording in whole ani-mals with light and electron microscopicimmunocytochemistry of CNS neuronshas been described by us in detail in previ-ous publications (9,10,19,20). The mainadvantages of this approach include: (i) theelectrophysiological experiments are per-formed in vivo, in the anesthetized animal,so the synaptic circuitry and physiologicalresponses are maintained as close to normalas possible; (ii) one can study responseselicited by natural stimuli; and (iii) as theanimal is perfused with histological fixa-tives at the end of the experiment, the mor-phological preservation obtained at theultrastructural level is very good to excel-
Cellular and Molecular Methods in Neuroscience ResearchEdited by A. Merighi and G. Carmignoto
Combined Electrophysiological andMorphological Analyses of CNSNeurons
Alfredo Ribeiro-da-Silva1,2 and Yves De Koninck1,3
Departments of 1Pharmacology and Therapeutics and 2Anatomy and CellBiology, McGill University, Montreal; 3Neurobiologie Cellulaire, Centrede Recherche Université Laval–Robert Gittard, Beauport, QC, Canada
11
Merighi11-aucorr.qxd 5/23/02 8:25 PM Page 181

lent. The main disadvantages of the in vivoapproach are (i) the low success rate, as onlyabout 25% of the experiments yield cellsthat have properly been characterized elec-trophysiologically and successfully labeledand recovered with good morphologicalpreservation for electron microscopy; and(ii) the difficulty in obtaining prolongedstable recordings and controlling the extra-cellular milieu. Over the years, weimproved success rates by using a morepowerful intracellular amplifier (17) foriontophoretic injection of the marker andmodifying the protocol to freeze-thaw thematerial prior to histochemistry, to avoidcracking of the tissue. We have successfullyapplied this approach to the study of thepeptidergic synaptic input to physiological-ly characterized neurons of the cat dorsalhorn (see Reference 9).
A very interesting complementaryapproach is the method of juxtacellularlabeling with biocytin or neurobiotin dur-ing in vivo extracellular recording (29).This approach has the advantage thatextracellular recording is less invasive (e.g.,avoiding disruption of the integrity of thecell) and allows prolonged stable recordingof undisturbed cellular activity. On theother hand, extracellular recording doesnot allow resolution of subliminal activity,measurement of conductance changes, andcontrol of membrane potential.
Another complementary approach thatis becoming increasingly popular is to per-form recordings in live slices of CNS tissue.Slice preparations are particularly useful toobtain stable recordings, for placement ofmultiple electrodes in the vicinity of a sin-gle neuron and to control the extracellularmilieu for detailed pharmacological studiesof synaptic events. In particular, with theincreasing use of tight seal whole cell patchclamp recording in CNS slices, the level ofresolution obtained allows the study of ele-mentary components of synaptic transmis-sion such as miniature (action potential
independent) synaptic currents that arethought to result from the release of trans-mitter contained in single vesicles from ter-minals in synaptic contact with the neuronfrom which the recording was obtained.Thus, the use of the whole cell patch clamptechnique allows the application of quanti-tative analyses to study in detail synapticevents and the properties of single channelsunderlying them. The high resolutionadvantages provided by the tight seal wholecell recording configuration can also beexploited in vivo (18,23,25). This latterapproach remains, however, difficult andlimited to recording from neurons locatedvery near the surface of the brain or spinalcord. In summary, advantages of the wholecell recording in slices include: (i) stableintracellular recording conditions; (ii) abil-ity to control and manipulate the extracel-lular milieu; (iii) ability to restrict drugapplication to subcellular compartments ofthe neurons; (iv) option to perform record-ings in voltage clamp mode; (v) the cell canbe visualized with a fluorescent dye duringor immediately at the end of the recording,providing an immediate identification ofthe cell type and assessment of the qualityof its morphology (or allowing imagingwith ion-sensitive dyes); (vi) simple diffu-sion of the label from the pipet into the celloccurs in the course of the recording anddoes not require active iontophoresis aswith conventional sharp electrodes; and(vii) the success rate is higher than withwhole animal approaches. The main chal-lenge with this approach, however, is toobtain morphological preservation of suffi-cient quality for electron microscopy (EM)studies. With proper optimization, we havebeen able to obtain excellent preservationfor light microscopy, and quite acceptablepreservation for EM studies. Yet, certainsubstances remain difficult to detect byimmunocytochemistry, because they aredepleted during the incubation of theslices. This is especially true for amino acid
182
A. Ribeiro-da-Silva and Y. De Koninck
Merighi11-aucorr.qxd 5/23/02 8:25 PM Page 182

neurotransmitters, such as GABA, glycine,and glutamate. However, in the case ofGABA for example, such inconveniencecan be avoided with the use of antibodiesagainst glutamic acid decarboxylase(GAD), as the enzyme is not depleted. Inthis chapter, we will show images from theadult rat neocortex in which pyramidalneurons were recorded from and filled witha marker and then processed for immuno-cytochemistry at either the light or electronmicroscopic levels.
In summary, each of the approachesdescribed above has its advantages and lim-itations with respect to the type of objec-tive sought. The ultimate choice of record-ing conditions and tissue preparationshould thus be mainly guided by the typeof question being asked. For the purpose ofthis chapter, we will contrast our in vivointracellular recording approach withwhole cell recording and labeling in slices.
PROTOCOLS
Protocols for the Whole Animal (InVivo) Approach
As an example, we provide the details ofthe protocol as applied to the lumbarregion of the cat spinal cord. The protocolcan obviously be applied to other CNSregions and other species with minor mod-ifications. A diagrammatic representationof this approach is shown in Figure 1.
Materials and Reagents
• α-Chloralose; halothane (Somnothane;Hoechst, Frankfurt, Germany).
• Lidocaine hydrochloride (Xylocane;Astra Scientific, Pleasanton, CA, USA).
• Pancuronium bromide (Pavulon, Org-anon Teknika, Durham, NC, USA).
• Borosilicate glass capillaries with inner
filament (WPI, Sarasota, FL, USA).• Horseradish peroxidase (HRP—Type
VI; Sigma, St. Louis, MO, USA).• Potassium chloride or acetate; Tris-
HCl or Tris-acetate buffers.• Heparin, sodium salt (Sigma).• Sodium nitrite (Fisher Scientific, Pitts-
burgh, PA, USA).• Paraformaldehyde (BDH Chemicals,
Poole, England, UK).• Glutaraldehyde (25% solution; EM
grade; Mecalab, Montreal, QC, Cana-da).
• Sucrose and glycerol (Fisher Scientif-ic).
• Liquid nitrogen; isopentane (FisherScientific).
• Tissue culture plates of 12 wells (Fal-con, Becton Dickinson, FranklinLakes, NJ, USA).
• Sodium borohydride (Sigma).• Monoclonal primary antibodies (e.g.,
mouse antienkephalin or rat antisub-stance P; Medicorp, Montreal, QC,Canada or PharMingen, San Diego,CA, USA).
• Monoclonal antiperoxidase antibody(mouse or rat; Seralab, Sussex, Eng-land, UK).
• Polyclonal secondary antibodies (anti-mouse or antirat IgG, respectively;(American Qualex, San Clemente,CA, USA).
• Sodium phosphate buffer (PB), pH7.4; phosphate-buffered saline (PBS),pH 7.4.
• 3,3′-diamiminobenzidine tetrahydro-chloride (DAB; Sigma).
• H2O2 (30%; American ChemicalsLtd., Montreal, QC, Canada).
• Cobalt chloride and nickel ammoni-um sulphate (Fisher Scientific).
• Osmium tetroxide (4% solution;Mecalab).
183
11. Electrophysiology/Morphology of CNS Neurons
Merighi11-aucorr.qxd 5/23/02 8:25 PM Page 183

184
A. Ribeiro-da-Silva and Y. De Koninck
Figure 1. Steps in the approach described for the combination of whole animal (in vivo) electrophysiology and intracellularinjection of HRP with the ultrastructural detection of multiple antigenic sites.
Merighi11-aucorr.qxd 5/23/02 8:25 PM Page 184
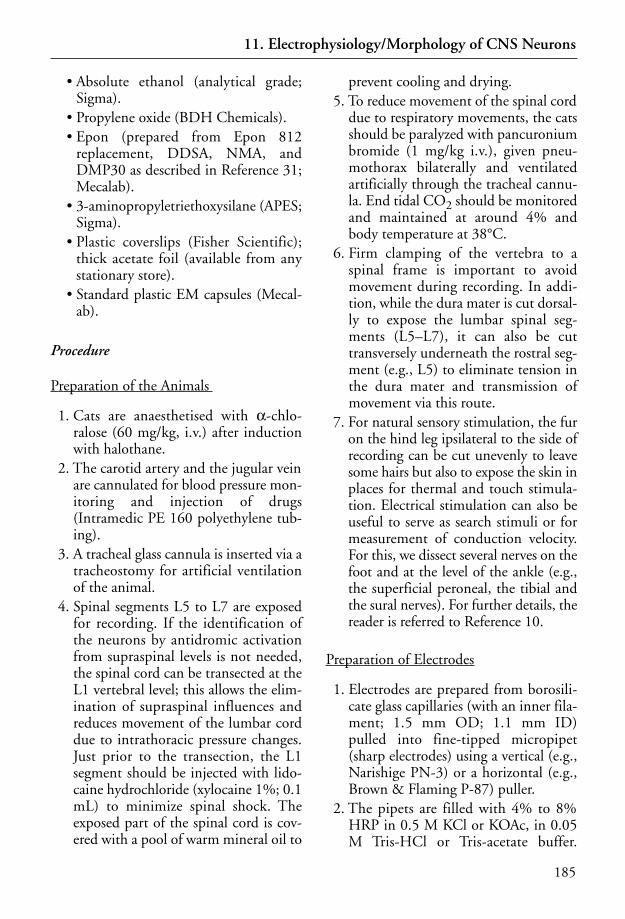
• Absolute ethanol (analytical grade;Sigma).
• Propylene oxide (BDH Chemicals). • Epon (prepared from Epon 812
replacement, DDSA, NMA, andDMP30 as described in Reference 31;Mecalab).
• 3-aminopropyletriethoxysilane (APES;Sigma).
• Plastic coverslips (Fisher Scientific);thick acetate foil (available from anystationary store).
• Standard plastic EM capsules (Mecal-ab).
Procedure
Preparation of the Animals
1. Cats are anaesthetised with α-chlo-ralose (60 mg/kg, i.v.) after inductionwith halothane.
2. The carotid artery and the jugular veinare cannulated for blood pressure mon-itoring and injection of drugs(Intramedic PE 160 polyethylene tub-ing).
3. A tracheal glass cannula is inserted via atracheostomy for artificial ventilationof the animal.
4. Spinal segments L5 to L7 are exposedfor recording. If the identification ofthe neurons by antidromic activationfrom supraspinal levels is not needed,the spinal cord can be transected at theL1 vertebral level; this allows the elim-ination of supraspinal influences andreduces movement of the lumbar corddue to intrathoracic pressure changes.Just prior to the transection, the L1segment should be injected with lido-caine hydrochloride (xylocaine 1%; 0.1mL) to minimize spinal shock. Theexposed part of the spinal cord is cov-ered with a pool of warm mineral oil to
prevent cooling and drying.5. To reduce movement of the spinal cord
due to respiratory movements, the catsshould be paralyzed with pancuroniumbromide (1 mg/kg i.v.), given pneu-mothorax bilaterally and ventilatedartificially through the tracheal cannu-la. End tidal CO2 should be monitoredand maintained at around 4% andbody temperature at 38°C.
6. Firm clamping of the vertebra to aspinal frame is important to avoidmovement during recording. In addi-tion, while the dura mater is cut dorsal-ly to expose the lumbar spinal seg-ments (L5–L7), it can also be cuttransversely underneath the rostral seg-ment (e.g., L5) to eliminate tension inthe dura mater and transmission ofmovement via this route.
7. For natural sensory stimulation, the furon the hind leg ipsilateral to the side ofrecording can be cut unevenly to leavesome hairs but also to expose the skin inplaces for thermal and touch stimula-tion. Electrical stimulation can also beuseful to serve as search stimuli or formeasurement of conduction velocity.For this, we dissect several nerves on thefoot and at the level of the ankle (e.g.,the superficial peroneal, the tibial andthe sural nerves). For further details, thereader is referred to Reference 10.
Preparation of Electrodes
1. Electrodes are prepared from borosili-cate glass capillaries (with an inner fila-ment; 1.5 mm OD; 1.1 mm ID)pulled into fine-tipped micropipet(sharp electrodes) using a vertical (e.g.,Narishige PN-3) or a horizontal (e.g.,Brown & Flaming P-87) puller.
2. The pipets are filled with 4% to 8%HRP in 0.5 M KCl or KOAc, in 0.05M Tris-HCl or Tris-acetate buffer.
185
11. Electrophysiology/Morphology of CNS Neurons
Merighi11-aucorr.qxd 5/23/02 8:25 PM Page 185

Avoiding the Cl- salts may be impor-tant to prevent reversal of Cl--mediatedinhibitory postsynaptic potentials(IPSPs). At the ranges of pH typicallyused (7.4–8.6), HRP has a net positivecharge and can therefore be injected byiontophoresis through the recordingelectrode using positive (depolarizing)current injection. To avoid the forma-tion of bubbles near the tip of themicropipet, we prefill the tip of theelectrode with distilled water and fillthe remainder of the electrode with thesolution containing HRP. As it isimportant that enough time is givenfor the HRP to diffuse to the tip of thepipet, we fill the pipets a few hoursprior to the recordings. The impedanceof these electrodes ranges from 40 to120 MΩ depending on tip size, giventhe type of cell targeted.
HRP Injection
HRP is injected after the intracellularphysiological characterization of the cell iscomplete. To ensure sufficient iontophoret-ic injection of HRP, we use an amplifier–current source that has an input voltagerange of ± 150 V. The high voltage sourceassures constant current ejection throughthe electrode even when the resistance ofthe electrode increases during ejection, forexample as a result of plugging of the elec-trode tip with HRP (17).1. We inject HRP using 500 to 700 ms
positive current pulses of 1 to 5 nA at afrequency of 1 Hz for a duration of 5to 15 minutes; these parameters areselected depending on the quality ofthe recording and the type of neuronstudied. For large neurons (40–80 µm)the equivalent of an injection of 40 nAfor 1 minute is used as a guideline;much less (as little as 1–5 nA for 1min) can be used for smaller cells.
Pulse injections are preferred to contin-uous current injections because thequality of the membrane potential andthe size of the action potential orsynaptically elicited responses can betested between the current pulses toensure that the electrode remains with-in the cell and to stop the injection assoon as the cell is lost.
2. After the end of the injection, the ani-mals are kept anaesthetized for a coupleof hours to allow the diffusion of HRPin the cell. However, we have obtainedexcellent results with a waiting time ofjust 30 minutes or even less.
Animal Perfusion
After the end of the electrophysiologicalpart of the study, the animal is moved to aperfusion table for histological fixation. Itis important that artificial ventilation ismaintained up to the moment in whichthe perfusion is started, to avoid CNSischaemia, leading to deterioration of ultra-structure. We usually connect the trachealtube to a bottle with a mixture of 95%O2/5% CO2 and manually ventilate thelungs with the help of a Y tube.1. The thorax of the animal is opened to
expose the heart. The pericardium isremoved. Slowly, 1 mL heparin (10USP U/mL) and 3 mL of 1% sodiumnitrite are injected into the left ventri-cle. The sodium nitrate solution shouldbe injected particularly slowly to avoidcardiac fibrillation.
2. The animal is perfused through theascending aorta with 2000 mL of amixture of 4% paraformaldehyde/0.5% glutaraldehyde in 0.1 M PB, pH7.4, after a brief washout of the vascu-lar system (20 s maximum) with perfu-sion buffer (for composition see Refer-ence 6). A high flow rate should beused at the beginning (for about 5
186
A. Ribeiro-da-Silva and Y. De Koninck
Merighi11-aucorr.qxd 5/23/02 8:25 PM Page 186

min) then reduced so that total perfu-sion time is about 30 minutes.
3. At the end of the perfusion, the rele-vant tissue is removed from the animaland immersed in the same fixative thatwas used for the perfusion at 4°C.Immersion postfixation should last 2hours, but we have also used overnightpostfixation with no loss of antigenici-ty, for the detection of the neuropep-tides substance P and enkephalin. Atthe end of the fixation, the tissue isplaced in 10 % sucrose in PB at 4°Cuntil used.
4.For antigens that are highly sensitive toglutaraldehyde, we advise perfusion with2000 mL a mixture of 4% par-aformaldehyde/0.1% glutaraldehyde/15%(vol/vol) saturated picric acid in PB for 30minutes followed by 2000 mL of the samemixture (but devoid of glutaraldehyde) fora further 30 minutes. Then, the animalshould be perfused with 2000 mL of 10%sucrose in PB for 30 minutes. Subse-quently, tissue is placed in 10% sucrose inPB in the refrigerator until use.
Tissue Processing for the Demonstrationof the Cell
After removal from the animals, thetissue is processed first for the demonstra-tion of the cell and then for immunocyto-chemistry.1. The tissue should be trimmed to the
proper size (block of about 1 × 0.5 ×0.5 cm), ensuring that the area con-taining the labeled cell is not cut off.Cut 50-µm-thick sections on a Vibra-tome (Technical Products International[TPI], St. Louis, MO, USA), usingcooled PBS or PB in the bath. We rec-ommend that the sections are collectedserially into a tissue culture plate with12 wells (5 sections per well maxi-mum).
2. The sections are cryoprotected byimmersion in a mixture of 30% sucroseand 10% glycerol followed by 30% su-crose and 20% glycerol, in PB (1 h ineach). Subsequently, the sections aresnap-frozen by immersion in liquidnitrogen-cooled isopentane and thawedat room temperature. The procedureshould be repeated 3 times. For thefreeze-thaw procedure, all sections fromeach well should be placed in a smallcup-like container made up of finemetal mesh and returned to the originalwell of the tissue culture plate at theend of the procedure.
3. The sections are rinsed twice in PBS(10 min each) and treated with 1%sodium borohydride in PBS for 30minutes. Then, the sections are washedextensively in PBS until all bubbles dis-appear (usually 5 times over a period of60 min is sufficient).
4. The sections are incubated in 0.05 %solution of DAB in PBS with cobaltchloride and nickel ammonium sulfateas described in detail elsewhere (31). Atthe end of 10 minutes, H2O2 is addedto a final concentration of 0.01%(dilute 500 µL of 30% H2O2 in 14.5mL of distilled water and add 5 µL ofthis solution to each 500 µL of DAB).After about 10 minutes, the reactionshould be stopped by replacing theDAB by PBS.
5. The sections are rinsed for 2 × 15 min-utes in PBS and mounted temporarilywith PBS between a glass slide and acoverslip. Examination with a lightmicroscope should be used to identifythe sections that contain the cell. Thesections that contain parts of the cellshould be photographed at this stage,preferentially with a digital camera.The cell appears black or dark greybecause of the metal intensification ofthe DAB reaction product.
187
11. Electrophysiology/Morphology of CNS Neurons
Merighi11-aucorr.qxd 5/23/02 8:25 PM Page 187

Immunocytochemistry
Subsequently, the sections that containthe cell should be processed for ultrastruc-tural immunocytochemistry. As it is themost likely approach to be used, wedescribe below a pre-embedding protocolfor the detection of a single antigenic sig-nal using a monoclonal primary antibodyand DAB.1. After washing in PBS, the sections
should be incubated in the primaryantibody and diluted to the properworking dilution in PBS overnight at4°C. We found that, when using mon-oclonal antibodies, preincubation innormal serum of the species of the sec-ondary antibody is not required. How-ever, we strongly recommend shakingduring incubations.
2. The following steps are all performedat room temperature. After washing 2× 15 minutes in PBS, incubate the sec-tions for 1½ to 2 hours in an antibodygenerated against the IgG of the speciesof the primary antibody (e.g., rabbit orgoat antimouse IgG). Usually, dilutionsvary from 1:30 to 1:50 in PBS, as theantibody has to be used in excess.
3. After 2 washes, the sections are incu-bated in a monoclonal antiperoxidaseantibody, diluted in PBS, of the samespecies as the primary antibody, for 2hours. Subsequently, after a 15-minutewash in PBS, the tissue is incubated in5 µg/mL of HRP in PBS for 1 to 2hours. After washing 3 × 10 minutes inPBS, the sections are incubated in0.06% DAB in PBS for 10 minutes,then H2O2 is added to a final concen-tration of 0.01%. The reaction shouldbe monitored under a stereomicro-scope and stopped by replacing theDAB solution with PBS. Wash 3 × 10minutes in PBS. At this stage, we rec-ommend that the sections be tem-
porarily mounted on glass slides usingPBS and a glass coverslip and pho-tographed in color. The cell (in back)will be easy to distinguish from thebrown color of the immunostaining(nonintensified DAB reaction).
Osmication and Epon Embedding
1. Contents of each well are moved toglass scintillation vials, and after a shortwash in PB, the material is osmicatedin 1% OsO4 in PB for 1½ hours at4°C. After use, OsO4 should be dis-carded into a bottle with corn oil. After2 washes in PB, tissue is dehydrated inascending alcohol concentrations(50%, 70%, 90%, and 95% for 5 mineach; 2 × 10 min in 100%) and propy-lene oxide (2 × 10 min), followed by a1:1 propylene oxide–Epon mixture(overnight or for 2 h), 2 hours inpropylene oxide–Epon 1:2, and 1 to 2hours in pure Epon.
2. Finally, each section is flat-embeddedin Epon between acetate foil and aplastic coverslip. It is important that allsections be flat-embedded with thesame side facing the plastic of the cov-erslip. The sections are cured in anoven overnight at 55°C.
Observation by Light Microscopy
The protocol described below allows theobservation of the same fields by lightmicroscopy and EM.1. The Epon should be separated from
the acetate foil so that the Epon-embedded sections remain attached tothe coverslips. The coverslips should belabeled and stored in small cardboardboxes.
2. Sections are examined with a micro-scope equipped with a camera lucida.The parts of the cell present in each
188
A. Ribeiro-da-Silva and Y. De Koninck
Merighi11-aucorr.qxd 5/23/02 8:25 PM Page 188

section are drawn. Blood vessels andother tissue landmarks can be used toproperly identify the location of eachsegment of the cell and how they con-nect. Figure 2 shows an example of areconstructed neuron. It facilitates thesubsequent identification of the partsof the cell present in each Vibratomesection if the sections are numberedand the parts of the cell present in eachsection are identified by the sectionnumber in a copy of the camera lucidareconstruction.
3. At this stage, all sections that containparts of the cell should be pho-tographed, preferentially with a digitalcamera.
Ultrastructural Observation
1. After photography, the flat-embeddedsections should be re-embedded inEpon (see Reference 31). After curingin the oven at 55°–60°C, pyramidsshould be trimmed to the largest sur-face compatible with semithin sections.Serial 4-µm-thick sections are obtainedusing an ultramicrotome and a dia-mond knife specialized for semithinsections. Sections should be attached toAPES-subbed glass slides, prepared inadvance as described elsewhere (10,21).Subsequently, the 4-µm-thick sectionsare photographed and re-embedded byplacing on top of each section a drop ofEpon. A previously polymerized Eponblock (cylinder with flat bases) with ablock label inside (prepared 24 hbefore) is placed on top of each section.The glass slide with the Epon cylindersover each section is cured in an oven at55°C for 24 to 48 hours. The blockswith sections attached are easy to sepa-rate from the glass when warm.
2. After trimming the blocks, ultrathinsections are cut with a diamond knife
and collected onto formvar-coated 1-slot copper grids. They are counter-stained lightly with uranyl acetate andlead citrate and observed under theelectron microscope.
3. If a second antigenic signal is to bedetected by postembedding immuno-gold, the ultrathin sections should becollected on nickel mesh grids. Detailson how to process the sections for post-embedding immunogold are given inseveral publications (see e.g., Reference22). We recommend that etching withsodium metaperiodate be reduced tothe minimum or abolished if possible(1,20). See also Chapter 10.
4. The micrographs of the semithin sec-tions can be used as a guide to identifythe parts of the cell when doing theEM observations.
Protocols for the Slice Approach
We have been using in recent years acombination of tight seal whole cell patchclamp electrophysiological recording withlight and electron microscopic immunocy-tochemistry. The protocols describedbelow have been optimized to obtain satis-factory recordings from cells in slices fromadult (> 30 day old) or even aged (> 28month old) animals and to allow the bestpossible preservation for confocal and elec-tron microscopic examination. The patchclamp set-up that we have been using forthese studies includes a fixed-stage uprightlight microscope equipped for infraredinterference contrast (differential interfer-ence contrast or gradient contrast) (11,12),videomicroscopy, and fluorescence imag-ing. This approach allows the cell to beinjected with a fluorescent dye duringrecording, it is possible to visualize the neu-ron being labeled and therefore get imme-diate direct information on the morpho-logical type of cell being studied. As an
189
11. Electrophysiology/Morphology of CNS Neurons
Merighi11-aucorr.qxd 5/23/02 8:25 PM Page 189

190
A. Ribeiro-da-Silva and Y. De Koninck
Figure 2. Dorsal horn neuron responding with a slow prolonged excitatory post-synaptic potential (EPSP) after noxious cutaneous stimulation. (A) Right: Cam-era lucida reconstruction of the cell body, located in lamina V, that was associatedwith a discrete area of substance P-immunoreactive (IR) fibers (see panel C). Left:Response of the neuron to low threshold mechanical stimulation (hair, H). Theperiod of application of each of two stimuli is represented by the horizontal barsbelow the trace. Inset: Enlargement, on a faster time scale, of a typical burst ofaction potentials riding on EPSPs during the stimulus. Center: The cutaneousreceptive field of the neuron is represented on the schematic diagram; darkenedarea represents the low threshold touch receptive field, and the larger hatched arearepresents the high threshold pinch receptive field. (B) Response of the neuron tohigh threshold mechanical stimulation (pinch, P). The period of the stimulus isrepresented by the horizontal bar below the trace. Note the marked depolarizationduring the noxious stimulus associated with action potential inactivation. Note alsothe prolonged depolarization after the end of the stimulus associated with increasedfiring frequency. (C) Light microscopic photograph of a parasagittal, 4-µm-thick,Epon flat-embedded section showing part of the neuronal cell body. Note thenumerous substance P-IR profiles apposed to the cell body (arrows). The cell bodywas located within a region of intense immunoreactivity corresponding to one ofthe clusters of substance P-IR fibers commonly found in lamina V. Scale bar = 20µm. (D) Electron microscopic photographs of an ultrathin section taken from the4-µm-thick section shown in panel C. Note the 2 substance P-containing varicosi-ties (arrows) apposed to the cell body. Synapses between these varicosities and thecell body could be demonstrated in adjacent sections (data not shown). Asterisksindicate non-IR axonal varicosities. Scale bar = 1 µm. (E) Electron micrographs ofan ultrathin section taken from the 4-µm-thick section in panel E′. The portion ofthe dendrite shown in panel E corresponds to the curved portion of the dendriteshown in panel E′ (the 2 arrows on the left of E′ indicate the 2 boutons pointed toby 2 of the arrows in E). The immunoreactive profiles (arrows) belong to an axonthat appears to wrap in a spiral-like fashion around the dendrite (arrows in panelE′) of the cell and make several contacts with the dendrite. Asterisks indicate non-immunoreactive varicosities apposed to the dendrite. Scale bar = 1 µm. (E′′) Detailsof the synapse (open arrow) established by the profile on the right in panel E (rightarrow in panel E) obtained from an adjacent ultrathin section. Scale bars in panelE′ = 20 µm; in panel E′′ = 0.5 µm. Reproduced from De Koninck et al. (9).

example of this type of approach, we pre-sent below protocols for recording fromand intracellular labeling of pyramidal neu-rons of the rat neocortex, followed byimmunocytochemical processing for thedemonstration of their cholinergic innerva-tion. A diagrammatic representation of theprotocols for confocal and electronmicroscopy is shown in Figure 3.
Materials and Reagents
• Sodium pentobarbital; sucrose; glyc-erol.
• NaCl, KCl, CaCl2, MgCl2, glucose,NaHCO3, NaH2PO4.
• Cyanoacrylate cement.• Borosilicate glass capillaries with inner
filament.• Cs-gluconate, CsCl, 4-(2-hydroxye-
thyl)-1-piperazine-ethanesulfonic acid(HEPES), BAPTA, ATP, GTP.
• Lucifer Yellow (Sigma).• Biocytin (Calbiochem-Novabiochem,
La Jolla, CA, USA) or neurobiotin(Vector Laboratories, Burlingame, CA,USA).
• Paraformaldehyde; glutaraldehyde (EMgrade); picric acid (Fisher Scientific).
• Gelatin (Sigma).• Tissue culture plates of 12 wells.• Sodium borohydride; PB, pH 7.4;
PBS, pH 7.4; Triton X-100; H2O2.• Normal donkey serum (Sigma).• Antiserum against the vesicular acetyl-
choline transporter (VAChT; generousoffer of Dr. R.H. Edwards, Universityof California, San Francisco).
• Rhodamine-tagged donkey antirabbitIgG (Jackson Immuno Research Labo-ratories, West Grove, PA, USA).
• Gelatin-subbed microscope glassslides.
• Glass coverslips (Fisher Scientific).
• Mounting medium: krystalon (Elec-tron Microscopy Science, Gibbstown,NJ, USA).
• Avidin–biotin complex (Vector Labo-ratories).
• Antirabbit IgG ABC kit (VectastainElite Kit; Vector Laboratories).
• Cobalt chloride.• Nickel ammonium sulfate. • Osmium tetroxide (4% solution).• Absolute ethanol (analytical grade).• Propylene oxide. • Epon (prepared from Epon 812
replacement, DDSA, NMA andDMP30 as described in Reference 13).
• APES.• Plastic coverslips.• Thick acetate foil (available from any
stationary store).• Standard plastic EM capsules.
Procedures
Slice Preparation
1. Adult rats (1–2 months old) are anaes-thetized with Na+-pentobarbital(30 mg/kg), and perfused intracardiallyfor 15 to 20 seconds with ice-cold oxy-genated (95% O2, 5% CO2) sucrose-substituted ACSF (S-ACSF) contain-ing (in mM): 252 sucrose, 2.5 KCl, 2CaCl2, 2 MgCl2, 10 glucose, 26NaHCO3, 1.25 NaH2PO4, (pH 7.35;340–350 mOsm).
2. After decapitation, the brain is rapidlyremoved and immersed in ice-coldoxygenated (95% O2, 5% CO2) S-ACSF for approximately 1 minute.
3. Slices are obtained using a Vibratome1000 with the specimen holder modi-fied to have a fluid chamber and a brassplatform. The brain is glued, caudalside down, to the brass platform with
191
11. Electrophysiology/Morphology of CNS Neurons
Merighi11-aucorr.qxd 5/23/02 8:25 PM Page 191

cyanoacrylate cement. The chamber isthen filled with oxygenated ice-cold S-ACSF and 400-µm-thick slices are cut.
4. The freshly cut slices are incubated inoxygenated S-ACSF for 30 minutes atroom temperature. The slices are thentransferred to a storage chamber filledwith oxygenated normal ACSF (126mM NaCl instead of sucrose, 300–310mOsm) and incubated at room tem-perature or 33°C for at least 1 hourbefore transferring to a recordingchamber.
Whole Cell Patch Clamp Recording
1. Whole cell patch pipets are pulled fromborosilicate glass capillaries and filledwith different combinations of elec-trolytes depending on the type ofmembrane mechanisms one wants tofocus on. In the present example, weused a Cs-gluconate-based-solution.The Cs was used to block K conduc-tances because we focused on synapti-cally elicited responses (Figure 4). Theanion used was gluconate to maintain
192
A. Ribeiro-da-Silva and Y. De Koninck
Figure 3. Steps in the approaches described for the combination of tight seal whole cell patch clamp electrophysiology in slicesand intracellular injection of biocytin (or neurobiotin) and/or Lucifer yellow with the immunocytochemical detection of anti-genic sites.
Merighi11-aucorr.qxd 5/23/02 8:25 PM Page 192

the normal chloride gradient. Whenfocusing exclusively on inhibitorysynaptic events (IPSPs/IPSCs [inhibi-tory postsynaptic currents]), a CsCl-filled solution has the advantage ofincreasing the driving force for Cl-,which can help amplify the currents.As an example, the intracellular solu-tion we used was composed of (inmM): 100 Cs gluconate, 5 CsCl, 10HEPES, 2 MgCl2, 1 CaCl2, 11BAPTA, 4 ATP, 0.4 GTP, 0.5% LuciferYellow, and/or 0.2% biocytin (a biotin-lysine complex) (pH adjusted to 7.2;osmolarity 275–280 mOsm).
2. Recordings are obtained by loweringthe patch electrode onto the surface ofvisually identified neurons (we do notapply positive pressure to the pipet toavoid extracellular leakage of biocytin).While monitoring current responses to5 mV pulses, a brief suction is appliedto form greater than 5 GΩ seals. Themembrane patch is then ruptured byfurther gentle suction to the electrode,establishing a whole cell recording con-figuration. The pressure is maintainedto atmospheric throughout the record-ing.
3. Tight seal whole cell recordings in volt-age clamp mode were performed usingan Axopatch 200B amplifier (AxonInstruments, Foster City, CA, USA)with greater than 80% series resistancecompensation for the recording. Theaccess resistance is monitored through-out each experiment, and only record-ings with stable access of 5 to15 MΩare used for analysis of synaptic activity.
4. At the beginning of each recording, aset of 200 millisecond long, 5 mVhyperpolarizating pulses are used tomeasure the input resistance and mem-brane time constant of each neuron.
5. Recordings of greater than 10 to 15minutes are sufficient to label the neu-
rons. Simple diffusion of the dyeincluded in the pipet into the cell dur-ing the course of the recording is suffi-cient to obtain complete labeling.
6. The recordings are stored on videotapeusing a digital data recorder (e.g., VR-10B; Instrutech, Great Neck, NY,USA). Stored recordings can then beplayed back off-line and sampled on acomputer using the appropriate soft-ware.
Processing of Slices for ConfocalMicroscopy
1. At the end of the recording, the slicesare fixed by immersion in 4% para-formaldehyde and 0.1% to 0.5% glu-taraldehyde in 0.1 M PB, pH 7.4, for 2hours at room temperature and post-fixed overnight in 4% paraformalde-hyde in PB at 4°C.
2. After fixation, the 400-µm-thick sliceshould be resectioned into 50-µm-thick sections for further histologicalprocessing. For this, the slices areembedded in 10% gelatin (3,5,15),fixed for 1 hour with 4% para-formaldehyde, 0.1% glutaraldehyde,and 15% picric acid in PB, and resec-tioned at 50 µm with a Vibratome.
3. Sections should be treated with 1%sodium borohydride in PBS andwashed extensively in PBS (see Protocolfor the In Vivo Approach for details).For subsequent processing, PBS with0.2% Triton X-100 (PBS+T) is used todilute the immunoreagents and forwashing. The sections are incubatedwith 5% normal donkey serum inPBS+T to reduce background staining,followed by a rabbit antivesicularacetylcholine transporter (VAChT)antibody (14) and Rhodamine-taggeddonkey antirabbit IgG. The sections aremounted on gelatin-subbed glass slides,
193
11. Electrophysiology/Morphology of CNS Neurons
Merighi11-aucorr.qxd 5/23/02 8:25 PM Page 193

air-dried in the dark, dehydrated inascending alcohols, cleared with xylene,and covered with a coverslip with krys-talon. Subsequently, they will be exam-ined with a laser confocal microscope.In our case, the slices are examinedunder an LSM 510 Laser scanningmicroscope (Carl Zeiss, North York,ON, Canada) equipped with an argonand 2 helium–neon lasers.
4. A 2D and 3D reconstruction of the celland processes can be obtained fromserial optical sections obtained with theconfocal microscope. The imagesobtained with the application of thismethod are comparable in quality tocamera lucida drawings, but have thefollowing advantages: (i) they can beacquired very quickly; and (ii) both the
morphological properties of the celland the general distribution of thetransmitter-specific innervation can beanalyzed. These 2D and 3D represen-tations allow one to rapidly obtain anevaluation of changes in the morpholo-gy of the cell and areas of predominantcholinergic input in the differentgroups of animals (Figure 5). It can befollowed by a more detailed analysis ofthe innervation of the cell, as describedin some publications (see e.g., Refer-ence 24), using stereology if required.
5. The serial optical sections can also beused to perform a 3D reconstruction ofthe neuron. This can be useful for rota-tion of the cell in space to obtain aview in different projection planes.Proper morphological identification of
194
A. Ribeiro-da-Silva and Y. De Koninck
Figure 4. Tight seal whole cell patch clamp recording from a layer V cortical pyramidal neuron in a 60-day-old rat. The advan-tage of the whole cell technique is that it allows one to perform high resolution voltage clamp recordings and thus resolve minia-ture synaptic currents (i.e., action potential independent synaptic events recorded in the presence of the Na channel blockertetrodotoxin). In this example, the membrane potential was held at 0 mV, the reversal potential for glutamate receptor-mediatedevents, to record exclusively miniature inhibitory postsynaptic currents (mIPSCs). Because the reversal potential for these eventsis approximately -65 mV, holding the membrane at 0 mV also helps amplify the events for optimal detection. The traces on theleft are continuous to show on-going mIPSCs. Note the high signal-to-noise ratio obtained with this recording configuration,yielding clear detection of the synaptic events. The inset in the middle is an average of 300 consecutive mIPSCs to illustrate thekinetics of the events. The histograms show the results of the detailed analysis that can be performed on these events to character-ize the rising and decaying kinetics as well as the amplitude distribution of the events.
Merighi11-aucorr.qxd 5/23/02 8:25 PM Page 194

certain cell types can require a view ofthe cell in several planes (4). Rotationcan also serve to test whether an axonalbouton, which appears in contact witha dendrite in a certain plane of view, isindeed in true contact with the den-drite by viewing it in a perpendicularplane (Figure 6).
Processing of Slices for ElectronMicroscopy
If the slices are to be processed for EM,the first 2 initial steps to follow are thesame as for confocal microscopy (seeabove). Triton X-100 should be omittedfrom all solutions. Other differences toconsider are:1. Endogenous peroxidase activity should
be removed by incubating sectionswith 0.3% H2O2 in PBS for 15 min-utes.
2. After inhibition of intrinsic peroxidaseactivity, the 50-µm-thick sections areinfiltrated for 2 hours in 30% sucroseand 10% glycerol for cryoprotection.
3. The tissue is quickly frozen in liquidnitrogen-cooled isopentane andthawed at room temperature, asdescribed above in the Protocols for theIn Vivo Approach.
4. After washing 2 × 15 minutes in PBS,the signal from the intracellularlylabeled neuron (byocitin or neurobi-otin) is revealed by incubating the sec-tions for 2 hours in an avidin–biotincomplex (1:1000), diluted in PBS. Fol-lowing 2 washes in PBS, a DAB reac-tion is performed with double intensi-fication as described above.
5. After 2 washes in PBS, the sections canbe temporarily covered by a coverslipwith PBS for photographic purposes.Then, those containing the cell areprocessed for EM immunocytochem-istry. Following incubation in the pri-
mary antibody (in this case a rabbitanti-VAChT serum) (14) for 48 hoursat 4°C and washing, tissue should beplaced for 2 hours in a biotinylatedgoat antirabbit IgG antibody, washedagain, and finally incubated for 2 hoursin an ABC complex.
6. The subsequent steps (DAB reactionwithout intensification, osmication,dehydration, and flat-embedding inEpon) should be performed asdescribed above (see Protocol for EMin the Whole Animal Approach).
7. For analysis of the material at the lightand electron microscopic levels, includ-ing the strategy to observe the samefields by light and electron microscopy,see the section above on Processing ofMaterial from the Whole AnimalExperiments.
RESULTS AND DISCUSSION
The protocols described in this chapterprovide different types of information con-cerning the physiological properties of neu-rons. These range from identifying thetypes of inputs the neurons respond to(e.g., the types of natural stimuli that evokeresponses in the recorded neuron and/orthe pharmacological and biophysical prop-erties of the synaptic events mediating spe-cific inputs to these cells), to detailedanalysis of membrane conductances specif-ic to the type of cell studied (Figures 2 and4). In the ultrastructural protocols, we pro-pose the use of DAB-based reactions toreveal both the intracellular labeling andthe immunocytochemical signal. Whilethis approach may at first glance appear tohave the drawback of potentially confusingthe two signals, in most situations this doesnot happen. At the light microscopic level,it is easy to distinguish the homogenousblack to grey-black labeling of the cell from
195
11. Electrophysiology/Morphology of CNS Neurons
Merighi11-aucorr.qxd 5/23/02 8:25 PM Page 195

the less homogeneous brown immunocyto-chemical labeling. At the EM level, suchdistinction is also possible because thehomogenous intracellular deposits ofintensified DAB contrast with the morevariable intensity of the boutons labeled bythe nonintensified DAB reaction. Even incases in which the distinction would be dif-ficult at the EM level, the observation ofthe same fields by light microscopy andEM allows the discrimination of the 2 sig-nals. The real limitation of using DAB toreveal both signals is in situations when the2 signals are colocalized. Alternativeapproaches to reveal the intracellular signalat the EM level have been proposed toavoid such a limitation (2).
In Vivo Approach
Over the years, we have used the wholeanimal approach with success in the cat,monkey, and rat. Recently, we modifiedthe protocol to enhance the penetration ofthe immunoreagents. We originally usedfreeze-thawing of the entire tissue fragmentcontaining the cell by direct immersion inliquid nitrogen followed by PB at roomtemperature; however, tissue fragmentation
was a frequent problem. An alternative weproposed in a previous publication (10)was to use immersion in isopentane at -70°C (either cooled by dry ice or kept in alow temperature freezer). However, whileisopentane at -70°C would completely pre-vent tissue cracking, the morphologywould suffer as well. Therefore, the revisedprotocol involves the freezing and thawingof Vibratome sections instead of the origi-nally proposed freezing and thawing ofblocked tissue about 5 mm in thickness.The revised protocol (described in theMethods section above) provides excellentmorphological preservation.
Two different antigenic signals can beeasily detected using a pre-embeddingmethod, and a third can be added subse-quently on ultrathin sections by a post-embedding approach. We have exploitedsuch possibilities in previous publications(20). In the past, we have used extensivelyinternally radiolabeled monoclonal anti-bodies for the detection of one of the sig-nals (19,30). However, such antibodies arenot widely available, as they have to beradiolabeled during biosynthesis. Further-more, they require the use of EM radioau-tography, an approach that requires long
196
A. Ribeiro-da-Silva and Y. De Koninck
Figure 5. Confocal reconstructionof a layer V pyramidal neuronwith surrounding VAChT-IRfibers illustrating the pattern ofinnervation of the cell. Note theabundance of immunoreactiveboutons in the area of the basaldendrites. This 3D reconstructionwas based on ten 1-µm-thick serialoptical sections. The reconstructionwas performed with the aid of theMCID-M4 image analysis system.Scale bar = 50 µm. (See color plateA7.)
Merighi11-aucorr.qxd 5/23/02 8:25 PM Page 196

photographic exposure times of 1 to 6months. This is unfortunate, as such anti-bodies possess unique characteristics, suchas superb penetration in the tissue and donot require any developing antibodies orcomplexes. The most logical approachtoday would be to use a DAB-based reac-tion for the detection of the first antigenicsite and a pre-embedding immunogoldapproach for the detection of the secondsite. However, there is an important limita-tion: the penetration of the 1 to 1.4 nmgold-labeled secondary antibodies in thesection (28) is much less satisfactory thanthat of the internally radiolabeled antibod-ies. This lack of penetration when applyingthe pre-embedding gold method is a majordrawback when investigating the innerva-tion of an intracellularly labeled neuronbecause the parts of the cell located deeplyin the Vibratome section cannot be stud-ied. It should be stressed that DAB-basedprotocols applying bispecific monoclonalantibodies or modified (4 step) peroxidase-antiperoxidase (PAP) approaches allow acomplete (or virtually complete) labeling ofthe entire thickness of the section (31), andthat even ABC approaches allow a reason-able penetration. The use of DAB-basedpre-embedding immunocytochemistry forone antigenic site and post-embeddingimmunogold for the other site avoids mostproblems of penetration. However, manyantigenic sites cannot be detected usingpost-embedding immunocytochemistry,unless osmication is omitted and specialresin embedding is applied (26) at the costof ultrastructural preservation. Therefore,an ideal approach does not exist. The com-bination of DAB-based immunocytochem-istry with the application of internally radi-olabeled monoclonal antibodies stillrepresents the best alternative for someonewith access to internally radiolabeled anti-bodies or with the technical capabilities toprepare them. For protocols used in thepreparation of radiolabeled monoclonal
antibodies see Reference 8.One of the advantages of the use of the
camera lucida reconstructions of the neu-rons from flat-embedded sections followedby serial semithin sections (that are re-embedded and re-cut for EM) is that wecan observe the same fields by the light andelectron microscope. An example of theestablishment of such light–electron micro-scopic correlation is given in Figure 2.
In the in vivo protocol, we have usedalmost exclusively HRP-filled pipet. How-
197
11. Electrophysiology/Morphology of CNS Neurons
Figure 6. Confocal reconstruction of a dendrite from a layerV cortical pyramidal neuron illustrating the close associa-tion with surrounding VAChT-IR terminals. This 3D recon-struction was based on four 1-µm-thick serial optical sections.The reconstruction was performed using an image analysissystem, as for Figure 5. The progressive 3D rotation from thetop to the bottom of the panel illustrates how this approachcan allow us to identify close association (but not synapses) ofboutons with postsynaptic dendrites of the cell. (See colorplate A8.)
Merighi11-aucorr.qxd 5/23/02 8:25 PM Page 197

ever, the injection of biocytin or neurobi-otin has been used for the intracellularlabeling of neurons (6,16,27,33). Theyhave a high affinity for avidin, whichallows greater flexibility for combinationwith other labeling techniques (e.g., fluo-rochromes, HRP-DAB reaction protocols).Also, biocytin and neurobiotin may be pre-ferred to HRP when the study of the axonis important, as they give a better and morecomplete labeling of axons. This said, westill prefer HRP when ultrastructural stud-ies are to be performed because of the sim-plicity of the approach (a single step reac-tion process to reveal it) and the absence ofbackground labeling. Therefore, wefocused on the use of HRP here.
Although in this chapter we exemplifiedthe use of confocal microscopy in combi-nation with the use of the slice approach,
there is no reason not to use it in combina-tion with the whole animal intracellularapproach. In this case, the cell could befilled intracellularly with Lucifer yellow orbiocytin. In the case of biocytin, the bestway is to reveal it with streptavidin com-bined with a fluorochrome. The protocolsdescribed in the Methods for slices can beeasily adapted to this end. However, onemajor drawback of confocal microscopy isthat it is not possible to study whether asynapse is present, because of the limita-tions in resolution of the approach com-pared to EM. This, combined with thelower success rate of in vivo intracellularlabeling make it almost a requirement to beable to combine confocal microscopy andEM. Fortunately, methods have beendeveloped that allow the observation of thesame fields by confocal microscopy and
198
A. Ribeiro-da-Silva and Y. De Koninck
Figure 7. Electron micrographs of a biocytin-labeled layer V pyramidal neuron illustratingthe concurrent detection of VAChT-IR fibers.(a) EM micrograph of a section of the cell bodyat low magnification. Scale bar = 5 µm. (b) EMmicrograph taken from an adjacent serial sectionshowing the area of the apical dendrite delineat-ed in panel a at higher magnification. Scale bar =1 µm. Note the VAChT-IR boutons (arrows) inclose proximity to the cell. The inset shows the4-µm-thick semithin Epon section, which wasre-embedded to obtain the ultrathin sectionsfrom which the EM micrographs in panels a andb were obtained. Scale bar = 10 µm.
Merighi11-aucorr.qxd 5/23/02 8:25 PM Page 198

EM, methods that can be easily adapted tointracellular labeling approaches (34).However, this combined confocal-EMapproach is complex (see Chapter 15) andtherefore the best compromise is still to usethe combined light and electron microscop-ic approaches we describe in the Methods.
Slice Approach
The protocol that we described above isthe result of an optimization by trial anderror to obtain ideal conditions for both
electrophysiological recording and mor-phological preservation (Figures 4–8).With our optimized approach, we havebeen able to obtain success rates of over90%, a result that can be considered excep-tional, particularly when comparing withthe low success rates of the whole animalapproach. An important factor determin-ing the success rate in slices is to aim forcells that are deeper (>100 µm deep) in thetissue. With both the blind or visual patchclamp approaches, one tends to recordfrom the first cell encountered at the sur-
199
11. Electrophysiology/Morphology of CNS Neurons
Figure 8. Electron micrographs in panels a to d illustrate VAChT-IR boutons (B) in contact with dendritic spines of a layer Vpyramidal neuron (same cell as in Figure 6). The micrographs in panels a, b, and c were taken from serial sections illustrating aVAChT-IR bouton approaching a dendritic spine (DS) of the cell and forming a synapse in panel c (arrow). Scale bar = 1 µm. (d) Another example of a VAChT-IR bouton in contact with a dendritic spine of the cell which can be seen here in continuitywith the dendritic shaft. Scale bar = 0.5 µm. Electron micrographs (e–f ) illustrate VAChT-IR terminals (B) presynaptic to a cellbody (in panel e) or a dendritic profile (in panel f ). Note the quality of the ultrastructural preservation of this slice preparationafter several hours of incubation and recording. Scale bar = 1 µm.
Merighi11-aucorr.qxd 5/23/02 8:25 PM Page 199

face of the slice. In this case, however, uponwithdrawal of the electrode, the cell isoften ripped out of the slice. Presumably,cells that are embedded deeper into the tis-sue are more firmly held in place. The useof thicker (400 µm thick) slices is alsopreferable because it provides better preser-vation of the dendritic tree of the cells.This is important for the quality of thephysiology of neurons (e.g., maintain theintegrity of synaptic events) and the elec-trophysiological recordings (13,32).
The morphological preservation that weachieve can be considered excellent forconfocal microscopy (see Figures 5 and 6)and quite satisfactory for EM (see Figures 7and 8). In Figure 5, we show a confocalreconstruction of the cholinergic innerva-tion of a physiologically and morphologi-cally characterized neuron, as obtainedwith a Zeiss confocal microscope and the3D module of an image analysis system(MCID-M4; Imaging Research, St.Catharines, ON, Canada). In Figure 6, weillustrate how rotation of a 3D-reconstruct-ed dendrite can help in the definition ofproximity of cholinergic varicosities to thedendrite. However, such an approach can-not provide evidence of the occurrence ofsynapses. EM analysis is still required.
Figures 7 and 8 provide examples of themorphological preservation that can beattained routinely with the approachdescribed in the methods. In Figure 7,observe the overall quality of the fixation ofthe cell, and in Figure 8, note the clear his-tological features of synapses established bycholinergic boutons.
ACKNOWLEDGMENTS
The studies in this chapter were sup-ported by grants from the Canadian Med-ical Research Council (MRC) to A.R.S.and Y. De K., the National Institute forAging to A.R.S., and the National Institute
of Neurological Disorders and Stroke to Y.De K. We also acknowledge a Team Grantfrom the Quebec FCAR. Some experimen-tal parts of these studies were performed incollaboration with Drs. J.L. Henry andA.C. Cuello. The authors are especiallygrateful to T.P. Wong for help with patchclamp experiments, to Marie Ballak forhelp with electron microscopy, and to AlanForster for photographic help. We are alsograteful to Drs. P. Somogyi and E.H. Buhlfor valuable advice on how to improve themorphological preservation of slices. Y. DeK. is a Scholar of the Canadian MRC.
REFERENCES
1.Alvarez, F.J., A.M. Kavookjian, and A.R. Light. 1993.Ultrastructural morphology, synaptic relationships,and CGRP immunoreactivity of physiologically identi-fied C-fiber terminals in the monkey spinal cord. J.Comp. Neurol. 329:472-490.
2.Branchereau, P., E.J. Van Bockstaele, J. Chan, andV.M. Pickel. 1995. Ultrastructural characterization ofneurons recorded intracellularly in vivo and injectedwith lucifer yellow: advantages of immunogold-silvervs. immunoperoxidase labeling. Microsc. Res. Tech.30:427-436.
3.Buhl, E.H., Z.S. Han, Z. Lorinczi, V.V. Stezhka, S.V.Karnup, and P. Somogyi. 1994. Physiological proper-ties of anatomically identified axo-axonic cells in therat hippocampus. J. Neurophysiol. 71:1289-1307.
4.Chéry, N. and Y. De Koninck. 2000. Visualisation oflamina I of the dorsal horn in live adult rat spinal cordslices. J. Neurosci. Methods 96:133-142.
5.Cobb, S.R., K.Halasy, I. Vida, G. Nyiri, G. Tamas,E.H. Buhl, and P. Somogyi. 1997. Synaptic effects ofidentified interneurons innervating both interneurons,and pyramidal cells in the rat hippocampus. Neuro-science 79:629-648.
6.Côté, S., A. Ribeiro-da-Silva, and A.C. Cuello. 1993.Current protocols for light microscopy immunocyto-chemistry, p. 147-168. In A.C. Cuello, (Ed.),Immunohistochemistry II. John Wiley & Sons, Chich-ester.
7.Cowan, R.L., S.R. Sesack, E.J. Van Bockstaele, P.Branchereau, J. Chan, and V.M. Pickel. 1994. Analy-sis of synaptic inputs and targets of physiologicallycharacterized neurons in rat frontal cortex: combinedin vivo intracellular recording and immunolabeling.Synapse 17:101-114.
8.Cuello, A.C. and A. Côté. 1993. Preparation andapplication of conventional and non-conventionalmonoclonal antibodies, p. 107-145. In Cuello, A.C.(Ed.), Immunohistochemistry II. John Wiley & Sons,Chichester.
9.De Koninck, Y., A. Ribeiro-da-Silva, J.L. Henry, and
200
A. Ribeiro-da-Silva and Y. De Koninck
Merighi11-aucorr.qxd 5/23/02 8:25 PM Page 200

A.C. Cuello. 1992. Spinal neurons exhibiting a specif-ic nociceptive response receive abundant substance P-containing synaptic contacts. Proc. Natl. Acad. Sci.USA 89:5073-5077.
10.De Koninck, Y., A. Ribeiro-da-Silva, J.L. Henry, andA.C. Cuello. 1993. Ultrastructural immunocytochem-istry combined with intracellular marking of physio-logically identified neurons in vivo, p. 369-393. InCuello, A.C. (Ed.), Immunohistochemistry II. JohnWiley & Sons, Chichester.
11.Dodt, H.U., A. Frick, K. Kampe, and W. Zieglgäns-berger. 1998. NMDA and AMPA receptors on neo-cortical neurons are differentially distributed. Eur. J.Neurosci. 10:3351-3357.
12.Dodt, H.U. and W. Zieglgänsberger. 1994. Infraredvideomicroscopy: a new look at neuronal structure andfunction. Trends Neurosci. 17:453-458.
13.Edwards, F.A. and A. Konnerth. 1992. Patch-clamp-ing cells in sliced tissue preparations. Methods Enzy-mol. 207:208-222.
14.Gilmor, M.L., N.R. Nash, A. Roghani, R.H.Edwards, H. Yi, S.M. Hersch, and A.I. Levey. 1996.Expression of the putative vesicular acetylcholine trans-porter in rat brain and localization in cholinergicsynaptic vesicles. J. Neurosci. 16:2179-2190.
15.Han, Z.-S., E.H. Buhl, Z. Lorinczi, and P. Somogyi.1993. A high degree of spatial selectivity in the axonaland dendritic domains of physiologically identifiedlocal-circuit neurons in the dentate gyrus of the rathippocampus. Eur. J. Neurosci. 5:395-410.
16.Horikawa, K. and W.E. Armstrong. 1988. A versatilemeans of intracellular labeling: injection of biocytinand its detection with avidin conjugates. J. Neurosci.Methods 25:1-11.
17.Jochem, W.J., A.R. Light, and D. Smith. 1981. A highvoltage electrometer for recording and iontophoresiswith fine-tipped, high resistance microelectrodes. J.Neurosci. Methods 3:261-269.
18.Light, A.R. and H.H. Willcockson. 1999. Spinal lam-inae I-II neurons in rat recorded in vivo in whole cell,tight seal configuration: properties and opioid respons-es. J. Neurophysiol. 82:3316-3326.
19.Ma, W., A. Ribeiro-da-Silva, Y. De Koninck, V. Rad-hakrishnan, A.C. Cuello, and J.L. Henry. 1997. Sub-stance P and enkephalin immunoreactivities in axonalboutons presynaptic to physiologically identified dorsalhorn neurons. An ultrastructural multiple-labellingstudy in the cat. Neuroscience 77:793-811.
20.Ma, W., A. Ribeiro-da-Silva, Y. De Koninck, V. Rad-hakrishnan, J.L. Henry, and A.C. Cuello. 1996.Quantitative analysis of substance P immunoreactiveboutons on physiologically characterized dorsal hornneurons in the cat lumbar spinal cord. J. Comp. Neu-rol. 376:45-64.
21.Maddox, P.H. and D. Jenkins. 1987. 3-Aminopropyl-triethoxysilane (APES): a new advance in section adhe-sion. J. Clin. Pathol. 40:1256-1260.
22.Merighi, A. and J.M. Polak. 1993. Post-embeddingimmunogold staining, p. 229-264. In A.C. Cuello,(Ed.), Immunohistochemistry II. John Wiley & Sons,Chichester.
23.Moore, C.I. and S.B. Nelson. 1998. Spatio-temporalsubthreshold receptive fields in the vibrissa representa-tion of rat primary somatosensory cortex. J. Neuro-physiol. 80:2882-2892.
24.Naim, M., R.C. Spike, C. Watt, S.A. Shehab, and A.J.Todd. 1997. Cells in laminae III and IV of the ratspinal cord that possess the neurokinin-1 receptor andhave dorsally directed dendrites receive a major synap-tic input from tachykinin-containing primary affer-ents. J. Neurosci. 17:5536-5548.
25.Nelson, S., L. Toth, B. Sheth, and M. Sur. 1994. Ori-entation selectivity of cortical neurons during intracel-lular blockade of inhibition. Science 265:774-777.
26.Nusser, Z., J.D. Roberts, A. Baude, J.G. Richards, W.Sieghart, and P. Somogyi. 1995. Immunocytochemi-cal localization of the alpha 1 and beta 2/3 subunits ofthe GABAA receptor in relation to specific GABAergicsynapses in the dentate gyrus. Eur. J. Neurosci. 7:630-646.
27.Paré, D., H.C. Pape, and J. Dong. 1995. Bursting andoscillating neurons of the cat basolateral amygdaloidcomplex in vivo: electrophysiological properties andmorphological features. J. Neurophysiol. 74:1179-1191.
28.Pickel, V.M., J. Chan, and C. Aoki. 1993. Electronmicroscopic labeling of endogenous and/or transportedantigens in rat brain using silver intensified onenanometer colloidal gold conjugated immunoglobu-lins, p. 265-280. In A.C. Cuello (Ed.), Immunohisto-chemistry. John Wiley & Sons, Chichester.
29.Pinault, D. 1996. A novel single-cell staining proce-dure performed in vivo under electrophysiological con-trol: morpho-functional features of juxtacellularlylabeled thalamic cells and other central neurons withbiocytin or Neurobiotin. J. Neurosci. Methods65:113-136.
30.Ribeiro-da-Silva, A., Y. De Koninck, A.C. Cuello, andJ.L. Henry. 1992. Enkephalin-immunoreactive noci-ceptive neurons in the cat spinal cord. Neuroreport3:25-28.
31.Ribeiro-da-Silva, A., J.V. Priestley, and A.C. Cuello.1993. Pre-embedding ultrastructural immunocyto-chemistry, pp. 181-227. In A.C. Cuello, (Ed.),Immunohistochemistry II. John Wiley & Sons, Chich-ester.
32.Soltesz, I. and I. Mody. 1995. Ca(2+)-dependent plas-ticity of miniature inhibitory postsynaptic currentsafter amputation of dendrites in central neurons. J.Neurophysiol. 73:1763-1773.
33.Tasker,J.G., N.W. Hoffman, and F.E. Dudek. 1991.Comparison of three intracellular markers for com-bined electrophysiological, morphological andimmunohistochemical analyses. J. Neurosci. Methods38:129-143.
34.Todd, A.J. 1997. A method for combining confocaland electron microscopic examination of sectionsprocessed for double- or triple-labelling immunocyto-chemistry. J. Neurosci. Methods 73:149-157.
201
11. Electrophysiology/Morphology of CNS Neurons
Merighi11-aucorr.qxd 5/23/02 8:25 PM Page 201

203
OVERVIEW
Tract tracing techniques provide toolsfor the study of the termination or originof central neural pathways or peripheralnerves. The understanding of the organiza-tion of neural circuits has represented oneof the major goals in neuroscience since itsbirth. In the second half of the 19th centu-ry, the pioneers in tract tracing discoveredthat retrograde degeneration of neuronalcell bodies and anterograde degeneration offibers could be used to trace pathways inthe nervous system. Thus, “the earliest wayto identify the neurons sending their axonsto a given neural structure was to destroythe structure” (20). In addition, the Golgimethod, which impregnates random sub-sets of neuronal cell bodies and processes intheir entirety, played a crucial role not onlyin unraveling the basic structure of the ner-vous system, but also in pioneering investi-gations on its connectivity. Cajal’s seminalstudies on the wiring of the nervous systemwere in fact based on Golgi-impregnatedmaterial (5). It is very hard, however, toeffectively impregnate the axons and toreconstruct their trajectory over long dis-tances with the Golgi staining. This tech-
nique, which is also very capricious, is thusbest suited for the study of local neuralconnections, i.e., at a limited distance fromthe cell body.
Before the introduction in the 1970s ofmethods taking advantage of the axonaltransport of molecules (7,15,17), the de-generation techniques represented the maintools for tract tracing. Anterograde tracingexploits the Wallerian degeneration ofentire axons or their distal portion that fol-lows lesion of the parent cell bodies or dis-connection from the axon proximal por-tion. These techniques became especiallyeffective after the introduction of stains forthe selective silver impregnation of degener-ating axons (9,21). In the retrograde de-generation technique, the loss of neuronalperikarya consequent to lesions of the targetand/or of the efferent axons can be detectedwith the Nissl cell staining. Degenerationmethods still represent the only techniquesavailable for the investigation of long dis-tance neural connections in adult humanpost-mortem material. This can be of inter-est, for example, in the case of restrictedlesions in autoptic human specimens.
The study of short (intrinsic, local) con-nections or of long connections (extrinsic, in
Cellular and Molecular Methods in Neuroscience ResearchEdited by A. Merighi and G. Carmignoto
Tract Tracing Methods at the LightMicroscopic Level
Marina Bentivoglio and Giuseppe BertiniDepartment of Morphological and Biomedical Sciences, University ofVerona, Verona, Italy, EU
12
Merighi12-aucorr.qxd 5/23/02 8:29 PM Page 203

which axons terminate at some distanceaway from the area that contains the parentcell bodies) requires distinct methodologicalapproaches. Besides the Golgi staining,intrinsic connections can be investigatedusing technologically sophisticated tech-niques based on the intracellular (includingintra-axonal) injection of dyes. Direct stain-ing can potentially visualize entire pathways,and new perspectives in the direct labelingof connections have been opened in recentyears by advances in molecular genetics,leading to the development of a new gener-ation of axonal tracers, the so-calledreporter-based tracers (6). For example, β-galactosidase, a reliable histochemical mark-er (the reporter molecule), is fused by genet-ic recombination to proteins that associatewith cytoskeletal components, thus enablingspecific targeting of axons, dendrites, orsynapses (6). Due to space limitations, thispromising experimental strategy will not bediscussed in the present chapter.
The classical tract tracing techniques aresuited for the study of extrinsic monosy-naptic connections. To this day, experi-mental investigation of polysynaptic con-nections has proven harder than that ofeach separate set of connections. Here, wewish to simply mention that neurotropicviruses can be used as retrograde transsy-naptic tracers. Briefly, viruses are transport-ed to and replicate in the cell bodiesthrough chains of interconnected neurons,and their presence can be detected withimmunohistochemistry (16). The use ofviruses as tracers requires special safetyrules in the laboratory (26). In transsynap-tic tracing with viruses, the virus is in gen-eral injected at the periphery (muscles orperipheral organs).
Chemically identified connections canalso be investigated selectively using labeled(e.g., isotope-conjugated) neurotransmitters(8), but in this chapter, we will focus on theexperimental, nonselective study of extrin-sic monosynaptic connections in vivo.
In particular, we will outline the generalprocedure for tract tracing in the centralnervous system, while it should be men-tioned that tracer injections in peripheraltissues (muscles, skin, and other peripheralorgans) may require special methodologicalapproaches. For tracing in the peripheraland autonomic nervous systems, or fortransganglionic tracing, it is therefore advis-able to run pilot experiments in order to testthe efficacy of the selected tracer(s) whentheir properties in the paradigm under studyare not well established in the literature.
Lipophilic dyes, which diffuse along theneuron membranes (14), are particularlysuited for in vitro tracing of neural connec-tions during development, as well as for thestudy of connections in tissue slices anddissociated cells (13). A detailed descrip-tion of these techniques is beyond thescope of the present discussion, but generalprinciples for tracing in fixed tissue speci-mens will be briefly mentioned.
BACKGROUND
A large number of retrograde and antero-grade tracers are available nowadays, andthe list keeps growing, especially for thosesuited for particular experimental purposessuch as developmental studies, tracing ofconnections in vitro, multiple tracing, trac-ing combined with immunohistochemistry,or in situ hybridization, tracing combinedwith intracellular dye filling.
The characteristics and properties ofcommonly used tracers are summarized inTables 1 and 2.
Classes of Tracers
General Concepts
Retrograde tracers, i.e., molecules trans-ported through axons to the parent cellbodies, are taken up by the axon terminals
204
M. Bentivoglio and G. Bertini
Merighi12-aucorr.qxd 5/23/02 8:29 PM Page 204

but can also be incorporated by the axonitself, as it occurs when the axon is dam-aged. The possibility of tracer uptake fromintact fibers of passage, however, has beendocumented for several tracers and shouldalways be taken into account and con-trolled experimentally if possible, especiallywhen it could be crucial for the interpreta-tion of the experimental findings.
Anterograde tracers are taken up by neu-ronal cell bodies and/or axons. The onlyanterograde tracers that are certainly nottaken up by fibers of passage, are the iso-tope-labeled amino acids (7), since aminoacids are used for protein synthesis, whosemachinery is located in the neuronal cellbodies. Anterograde tracing with tritiatedamino acids (most commonly a mixture ofproline and leucine) using autoradiographywas the first technique introduced foranterograde tracing based on axonal trans-port (7). Autoradiographic methods willnot be discussed in the present chapter, butthe basic protocol, still in use, is detailed inthe original paper (7).
Retrograde Tracers
Two main classes of retrograde tracersare listed in Table 1: the horseradish perox-idase (HRP)-based tracers [of which thesubunit B of cholera toxin (CTb)-HRP isan example], and fluorescent tracers: fluo-rescent microspheres (beads), fast blue(FB), diamidino yellow (DY), propidiumiodide (PI), Evans blue (EB) and nuclearyellow (NY). For the combination of retro-grade tracing with immunohistochemistry,wheat germ agglutinin (WGA) conjugatedwith inactivated HRP (WGA-apoHRP;Sigma, St. Louis, MO, USA) can also beeffectively used (see below).
Anterograde Tracers
Several classes of anterograde tracers areindicated in Table 2: Phaseolus vulgaris
leucoagglutinin (PHA-L), CTb, dextrans,and carbocyanine derivatives. As examplesof fluorescent dextrans we indicated tetram-ethyl rhodamine-dextran amine, called Flu-oro-Ruby (FR), and fluorescein-conjugateddextran, called Fluoro-Emerald (FE). Inaddition, a widely used tracer is representedby biotinylated dextran amine (BDA).Other biotin-based tracers are biocytin (η-biotinoyl-L-lysine), and neurobiotin [N-(2-aminoethyl) biotinamide hydrochloride].Lipophilic carbocyanine dyes include DiIand DiA, fluorescing in different colors.DiA can be substituted by DiO, which,however, is less effective (26). As an alterna-tive to DiI, Fast DiI is also available (26).
Criteria for Tracer Selection
The first criterion for the choice of thetracer lays, of course, in the experimentaldiscussion itself, i.e., whether an anterogradeor a retrograde tracer, or more than one trac-er, are needed. Keep in mind that the axon-al transport of most tracers is bidirectional,but all tracers exhibit a preference for eitherretrograde or anterograde transport.
Decide in advance whether the lightmicroscopy observations will be comple-mented by ultrastructural studies, sincetract tracing in electron microscopy hasspecial requirements, both in terms of trac-er selection and tissue fixation procedure(see Chapter 13).
For single labeling, a crucial parameter isthe spread of the tracer at the injection sites(Tables 1 and 2). Animal size and length ofthe pathways under study should also beconsidered. Retrograde fluorescent tracerswith limited diffusion at the injection sites,e.g., FB and DY, are very useful in rodents,but in order to fill a relatively large territory(for example in the monkey cortex) tracersresulting in more widespread diffusion,such as HRP and HRP conjugates, or NY,may be preferable. On the other hand, Flu-orogold (FG), a tracer that combines sensi-
205
12. Tract Tracing Methods at the Light Microscopic Level
Merighi12-aucorr.qxd 5/23/02 8:29 PM Page 205
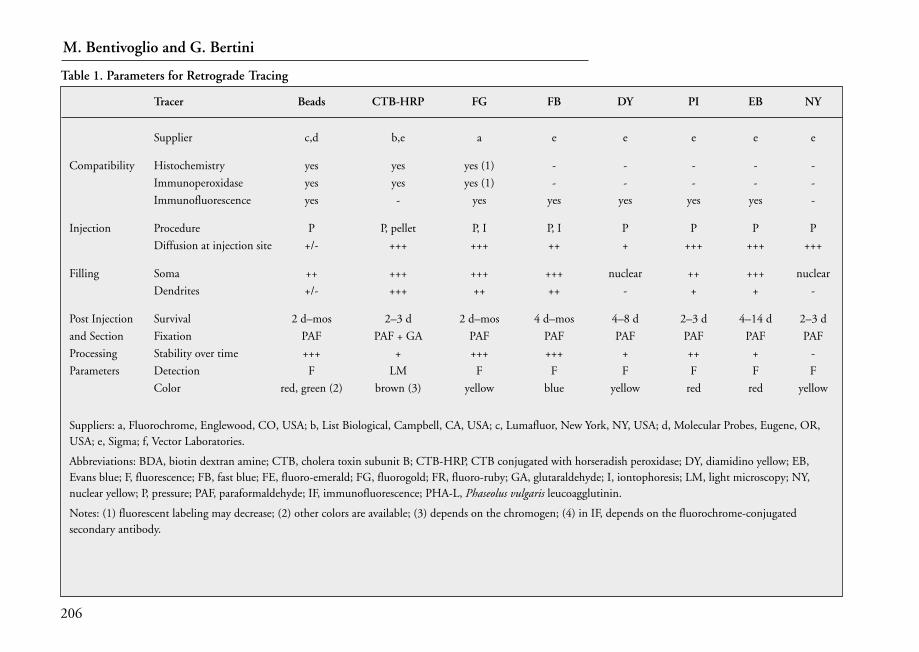
206
M. Bentivoglio and G. Bertini
Table 1. Parameters for Retrograde Tracing
Tracer Beads CTB-HRP FG FB DY PI EB NY
Supplier c,d b,e a e e e e e
Compatibility Histochemistry yes yes yes (1) - - - - -
Immunoperoxidase yes yes yes (1) - - - - -
Immunofluorescence yes - yes yes yes yes yes -
Injection Procedure P P, pellet P, I P, I P P P P
Diffusion at injection site +/- +++ +++ ++ + +++ +++ +++
Filling Soma ++ +++ +++ +++ nuclear ++ +++ nuclear
Dendrites +/- +++ ++ ++ - + + -
Post Injection Survival 2 d–mos 2–3 d 2 d–mos 4 d–mos 4–8 d 2–3 d 4–14 d 2–3 d
and Section Fixation PAF PAF + GA PAF PAF PAF PAF PAF PAF
Processing Stability over time +++ + +++ +++ + ++ + -
Parameters Detection F LM F F F F F F
Color red, green (2) brown (3) yellow blue yellow red red yellow
Suppliers: a, Fluorochrome, Englewood, CO, USA; b, List Biological, Campbell, CA, USA; c, Lumafluor, New York, NY, USA; d, Molecular Probes, Eugene, OR,USA; e, Sigma; f, Vector Laboratories.
Abbreviations: BDA, biotin dextran amine; CTB, cholera toxin subunit B; CTB-HRP, CTB conjugated with horseradish peroxidase; DY, diamidino yellow; EB,Evans blue; F, fluorescence; FB, fast blue; FE, fluoro-emerald; FG, fluorogold; FR, fluoro-ruby; GA, glutaraldehyde; I, iontophoresis; LM, light microscopy; NY,nuclear yellow; P, pressure; PAF, paraformaldehyde; IF, immunofluorescence; PHA-L, Phaseolus vulgaris leucoagglutinin.
Notes: (1) fluorescent labeling may decrease; (2) other colors are available; (3) depends on the chromogen; (4) in IF, depends on the fluorochrome-conjugatedsecondary antibody.

207
el
Table 2. Parameters for Anterograde Tracing
Tracer FE/FR CTB BDA Biocytin Neurobiotin PHA-L DiI DiA
Supplier d,e b,e d,e d,e f e,f d d
Compatibility Histochemistry yes yes yes yes yes yes -
Immunoperoxidase - - yes yes yes - -
Immunofluorescence yes yes - - - yes yes
Injection Procedure P P P, I, pellet P, I, pellet P, I, pellet I P, deposits
Diffusion at injection ++ ++ ++ + ++ +/- ++ (P), +/-
site (deposits)
Postinjection Survival 2–14 d 3–4 d 7–15 d 1–2 d 1–2 d 2–7 wks days (P), wks
and Section (deposits)
Processing Fixation PAF PAF PAF ± GA PAF ± GA PAF ± GA PAF PAF
Parameters Stability over time ++ +++ +++ +++ +++ +++ +/-
Sensitivity in decrease stable stable stable stable stable disappear
dehydration
Detection F LM, IF LM LM LM LM, IF F
Color green/red brown (3,4) brown (3) brown (3) brown (3) brown (3,4) red green
Suppliers: a, Fluorochrome, Englewood, CO, USA; b, List Biological, Campbell, CA, USA; c, Lumafluor, New York, NY, USA; d, Molecular Probes, Eugene, OR,USA; e, Sigma; f, Vector Laboratories.
Abbreviations: BDA, biotin dextran amine; CTB, cholera toxin subunit B; CTB-HRP, CTB conjugated with horseradish peroxidase; DY, diamidino yellow; EB,Evans blue; F, fluorescence; FB, fast blue; FE, fluoro-emerald; FG, fluorogold; FR, fluoro-ruby; GA, glutaraldehyde; I, iontophoresis; LM, light microscopy; NY,nuclear yellow; P, pressure; PAF, paraformaldehyde; IF, immunofluorescence; PHA-L, Phaseolus vulgaris leucoagglutinin.
Notes: (1) fluorescent labeling may decrease; (2) other colors are available; (3) depends on the chromogen; (4) in IF, depends on the fluorochrome-conjugatedsecondary antibody.
12. Tract Tracing Methods at the Light Microscopic Level

tivity of labeling and good filling of theinjected sites, is not effective in the monkeybrain, possibly due to its resemblance withautofluorescence (Bentivoglio, unpublishedobservations).
For multiple labeling, a crucial parame-ter for the selection of tracers is representedby the compatibility (both in terms of tis-sue fixation procedure and label visualiza-tion) between markers (see below).
Visualization of Tracers
Neuronal labeling obtained with fluo-rescent tracers can be visualized directly atthe microscope, using the light excitationwavelength appropriate for the fluoro-chrome. For most other tracers, however,labeling must be revealed indirectly. Thetechniques suitable for revealing tracers atthe light microscopic level can be summa-rized as follows:1. If the tracer is an enzyme or is conjugat-
ed to an enzyme, its presence in labeledcells can be revealed by specific histo-chemical procedures. This is the case forHRP, the prototype of retrograde trac-ers, which can be delivered either free orconjugated. The molecules most com-monly conjugated with HRP to obtainsensitive tracers are the lectin WGA andCTb (choleragenoid). Free HRP andHRP conjugates (WGA-HRP, CTb-HRP) are revealed through a histo-chemical reaction in which a chro-mogen is oxidized by HRP resulting incolored precipitates in the cell. There-fore, not only the tracer sensitivity butalso the staining procedure is a crucialparameter for successful labeling.
2. The tracer can be conjugated with anonenzymatic probe that allows itsvisualization. This can be a fluo-rochrome, but the most effective onesare isotopes, gold particles, or biotin.The conjugation of a tracer with anisotope requires the use of autoradiog-
raphy to visualize the labeling. Goldconjugates are detectable in lightmicroscopy after silver intensification,for which kits are commercially avail-able. Biotin-based tracers are revealedthrough histochemistry, exploitingtheir high affinity for avidin–peroxi-dase complexes.
3. The tracer can be revealed by immuno-histochemical techniques, using anti-bodies raised against the tracer mole-cule. This approach allows theflexibility of immunohistochemistry(based on immunoperoxidase orimmunofluorescence protocols), but ofcourse it requires that antibodiesagainst the tracer are available. Themost widely used tracer revealed byimmunohistochemistry is PHA-L (10).
PROTOCOLS
In outlining tract tracing protocols, wewill follow the steps of a general procedure(outlined in the flow chart of Figure 1)providing clues for retrograde and antero-grade tracing strategies.
Materials and Reagents
Tracers
• A list of tracers and their suppliers isindicated in Tables 1 and 2.
Tracer Preparation
To dissolve the tracer:• Distilled water or saline or phosphate-
buffered saline (PBS), 0.01 M, pH 7.2to 7.4.
• Dimethylsulfoxide (DMSO; Sigma).To prepare gold-conjugated tracers:• Colloidal gold solution, 6 to 12 nm
particles (Electron Microscopy Sci-
208
M. Bentivoglio and G. Bertini
Merighi12-aucorr.qxd 5/23/02 8:29 PM Page 208

ence, Fort Washington, PA, USA).• Polyethylene glycol (Sigma).
Injection
• Anesthetics (we commonly use sodiumpentobarbital, 50 mg/kg i.p.).
• Hamilton microsyringes (1, 5, and 10µL) or glass micropipets prepared witha pipet puller.
• Stereotaxic equipment (David KopfInstruments, Tujunga, CA, USA).
• Iontophoresis apparatus (Stoelting,Wood Dale, IL, USA).
209
12. Tract Tracing Methods at the Light Microscopic Level
Figure 1. Flow chart illustrating the main steps of classical procedures based on the axonal transport of tracers.
Merighi12-aucorr.qxd 5/23/02 8:29 PM Page 209

Perfusion
• Anesthetics (see above).• PBS.• Fixative: 1% to 4% paraformaldehyde
(Fluka, Neu-Ulm, Switzerland) or0.5% to 2.5% glutaraldehyde (Fluka)in 0.1 M phosphate buffer, pH 7.2 to7.4.
Tissue Sectioning
• Sucrose (10% to 30%) in PBS.• Freezing microtome or cryostat (e.g.,
Leitz, Stuttgart, Germany).• Vibratome (e.g., Ted Pella, Redding,
CA, USA).
Section Processing
For HRP histochemistry:• 3-3′ diaminobenzidine (DAB; Sigma).• Nickel ammonium sulphate (Sigma).• 3,3′,5,5′ tetramethyl benzidine (TMB;
Sigma).• Sodium nitroferricyanide (Sigma).• Ammonium heptamolybdate or
ammonium paratungstate (Sigma).• Tris-HCl buffer.• Hydrogen peroxide (Fluka).For immunohistochemistry:• Primary antibodies against the tracer.
For example, anti-FG polyclonal anti-bodies raised in rabbit (Sigma); anti-PHA-L polyclonal antibodies raised ingoat (Vector Laboratories, Burlingame,CA, USA).
• Secondary antibodies (Vector Laborato-ries), selected according to the immu-nohistochemical protocol. For immu-noperoxidase: biotinylated (e.g., goatantirabbit, rabbit antigoat, etc.) IgGs.For immunofluorescence: fluoresceinisothiocyanate (FITC)- or tetramethylrhodamine (TRITC)-conjugated IgGs.
• Avidin–biotin peroxidase complex(ABC kit, Vectastain; Vector Laborato-ries).
For biotin-based tracers:• ABC kit (see above).For silver intensification (to reveal gold-
conjugated tracers):• IntenSe-M kit (Amersham Pharma-
cia Biotech, Piscataway, NJ, USA)For mounting and covering with a
coverslip:• Ethanol (at different concentrations)
and xylene.• Glass slides and coverslips.• DPX or Entellan (Merck, Darmstadt,
Germany), glycerin.
Microscopy
• Light microscope, possibly equippedwith dark-field condenser.
• Fluorescence microscope and appro-priate filter systems. In our laboratory,we use a Leitz Ploemopack epifluores-cence illumination system (mercurylamp source: 100 W HBO), equippedwith the following filter blocks: A[band-pass (BP) filter: 340–380 nm];D (BP: 355–425 nm); N2 (BP: 530–560 nm).
Procedure
Preparation of the Tracer(s)
1. Dissolve the tracer in distilled water orPBS unless different solvents are specif-ically required. For example, biocytin(5%) is usually dissolved in Tris buffer,pH 8.0, and carbocyanine derivativescan be dissolved in ethanol (up to 5%),or 3% DMSO. Some tracers (e.g., DY,biocytin) are difficult to dissolve andremain in suspension. Therefore, payattention to potential clogging of the
210
M. Bentivoglio and G. Bertini
Merighi12-aucorr.qxd 5/23/02 8:29 PM Page 210

syringe or pipet during tracer delivery.Alternatively, pellet preparation may bedesired (see below).
Notes:a. For the use of HRP, keep in mind that
the enzymatic activity decays over time(check the expiration date of the chem-ical).
b. For the preparation of gold-conjugatedtracers, the protocol of Basbaum andMenétrey (2) can be followed (but seealso Bentivoglio and Chen, Reference3). This implies the use of a colloidalgold solution, to which polyethyleneglycol is added, mixed with the tracersolution, and centrifuged.
c. Store the tracer solutions at 4°C (thesolutions of most tracers are stable andcan be stored for months at 4°C) orstore it frozen at -20°C (this is neces-sary for HRP and its conjugates).
Tracer Delivery
When the procedure implies tracerinjection:2. Anesthetize and fix the animal on the
stereotaxic apparatus.3. Drill holes on the skull at the stereo-
taxic coordinates.4. Fix the injection device to the stereo-
taxic holder.5. Sonicate the tracer solutions just prior
to filling the syringe or pipet.6. Inject the tracer.
Notes:a. The tracers can be injected by direct
mechanical or air-pressure throughHamilton microsyringes or glass micro-pipets. Take care to avoid plugging thesyringe or pipet tip with the tracer solu-tion or suspension. Clean carefully thesyringe or pipet tip before penetratingthe tissue in order to avoid spurioustracer deposit along the injection track.
This is especially important when thetarget is located deeply in the brain andmust be reached stereotaxically.
b. While injecting tracer solutions or sus-pensions, divide the total volume intosmaller (e.g., 0.05–0.1 µL) deposits inmultiple tracks or at different heightsin the same track (if possible), sincethis procedure helps the tracer penetra-tion in the tissue and its uptake. Toavoid leakage along the needle trackwhile withdrawing the syringe or pipet,wait for 1 to 3 minutes at the end ofeach deposit.
c. Some tracers can also be applied by ion-tophoresis, a technique particularly indi-cated for small injection sites, restrictedto the chosen target. For each tracer, ion-tophoretic delivery parameters are welldefined. For example, injection of PHA-L (which, incidentally, can only beadministered iontophoretically) requiresa positive 4 to 7 µA current applied to a2.5% solution in PBS, pH 8.0.
d. When localized delivery of a highlyconcentrated tracer is necessary, solidpellets of some tracers can be preparedand inserted in the target (25,26)(Tables 1 and 2). Finally, HRP can bedelivered in several different ways(HRP gelfoam, polyacrylamide gelscontaining HRP, or implantation ofHRP crystals) (25).
e. As mentioned above, developmentalstudies have special requirements thatwill not be addressed in detail here. It isworth mentioning, however, that fortracing axon bundles in embryos, a pinbearing a dextran amines crystal can bedirectly applied to cut axons (11).
f. For the deposit of carbocyanines (DiI,DiA; see Table 2), which are especiallysuited for anterograde tracing inparaformaldehyde-fixed tissue, insertthe crystals directly into the tissue witha pin or a small forceps.
211
12. Tract Tracing Methods at the Light Microscopic Level
Merighi12-aucorr.qxd 5/23/02 8:29 PM Page 211

Postinjection Survival
7. After injection, suture the surgicalwound, and let the animal recoverbefore returning it to the animal carefacilities. Tracer injections are usuallywell tolerated and do not endanger theanimal’s survival. The anesthesia isoften responsible for postinjectioncomplications.
8. Allow the animal to survive for thetime appropriate for an effective label-ing of each tracer.
Notes:a. Most tracers (especially the retrograde
ones) are transported through axons byfast transport. However, the survivalrequired for effective labeling is highlyvariable (Tables 1 and 2). In general,HRP is degraded by lysosome enzymesin the labeled neurons within a fewdays, and the postinjection survivalshould, therefore, be limited. Biocytinalso requires short postinjection sur-vival (24–48 h). For most of the othertracers, metabolic degradation in thelabeled cells does not seem to be cru-cial. In particular, PHA-L requires along postinjection survival (10–20days), and fluorescent tracers are verystable over time and for some of them(e.g., FB) a relatively long survival (afew days to 2 or more weeks, depend-ing on the length of the pathway) isnecessary to obtain brilliant labeling.However, changes in the size of theinjection site with time are to be ex-pected. In addition, some fluorescenttracers, and in particular DY and NY,may leak over time from labeled neu-rons into the adjacent glial cells, andthis can result in spurious labeling. Toavoid this drawback, relatively shortsurvival should be adopted after injec-tions of DY or NY (the latter, especial-ly). This implies that for multiple retro-
grade labeling, or in protocols of com-bined retrograde and anterograde label-ing, the injections may have to be per-formed in 2 different surgical sessions.In these cases, HRP or HRP conju-gates, NY or DY should be injected inthe second session, a few days beforethe animal’s sacrifice.
b. Sequential injections of dyes may bedesired for special experimental para-digms in which the rearrangement ofcircuits is studied over time (for exam-ple, during development or in thestudy of postlesional axonal regenera-tion). In these cases, a long-lasting trac-er is injected first, and a second tracer isinjected in the same or a different tar-get after days, weeks, or even months.
c. Axonal transport of tracers is muchslower in cold-blooded animals than inmammals, and cold-blooded animalsshould be kept in a warm environmentduring the survival period.
Perfusion
9. Anesthetize the animal with a lethaldose and proceed to transcardial perfu-sion (through the left ventricle or theaorta). Flush out the blood first withsaline or PBS, and then perfuse withthe fixative solution.
Notes:a. Adequate pressure of the solutions is
necessary to ensure thorough perfusionof the parenchyma. Heparin may beadded to the perfusion solution to pre-vent blood clotting. Carefully washingout the blood is especially important inthe use of all tracers that imply oxida-tion of a chromogen with hydrogenperoxide (e.g., HRP and its conju-gates), since red blood cells possessendogenous catalases that precipitatethe chromogen. This may not representa problem for the data analysis (ery-
212
M. Bentivoglio and G. Bertini
Merighi12-aucorr.qxd 5/23/02 8:29 PM Page 212

throcytes can be easily distinguishedfrom neurons), but it results in lowquality photography.
b. Formaldehyde (4%, i.e., 10% formalin)or paraformaldehyde (most commonly4%), usually in phosphate-bufferedsolutions, are suited for the fixation ofall tracers for light microscopy (Tables 1and 2), but may at least in part inacti-vate the HRP enzymatic activity. Glu-taraldehyde fixation is optimal for HRPlabeling and may be required when theexperiments also imply an electronmicroscopic investigation (see Chapter13). Perfusion with mixed aldehydes(e.g., 1%–2% paraformaldehyde and1%–2% glutaraldehyde) can provide agood compromise in some cases. Glu-taraldehyde fixation results, however, inhigh background fluorescence andshould be avoided when using fluores-cent dyes or tracers to be visualized withimmunohistofluorescence. On the otherhand, glutaraldehyde fixation does notaffect gold-conjugated tracers, forwhich, therefore, fixation is not a criticalstep. Strong formaldehyde fixation isoptimal for a brilliant fluorescence (butmay also increase autofluorescence).
c. For in vitro tracing, the animal is per-fused prior to tracer delivery, and thetissue samples required for the experi-ment are dissected out and stored informaldehyde or paraformaldehyde,prior to and during tracer diffusion.
Cutting Sections
10. Cut frozen or Vibratome sections fromthe areas of interest.
Notes:a. The use of frozen sections (cut with a
freezing microtome or a cryostat)requires prior cryoprotective treatmentof the tissue blocks in sucrose solutions(10%–30% in phosphate buffer) until
they sink. Vibratome sectioning can beperformed even immediately after per-fusion and is required when the experi-ment also implies further processing forelectron microscopy.
b. In general, sections should be 20 to 50µm thick (30 µm is optimal in mostcases), but advance planning of sectionthickness and section sampling (theinterval between processed sections) iscritical when quantitative data analysishas to be performed.
Mounting Sections
11. Mount sections onto glass slidessubbed with chrome alum or gelatin.Immediate mounting is not crucial forsections processed for HRP histochem-istry, but for fluorescent tracers it isadvisable to mount the sections onslides soon after cutting.
12. Let sections air-dry.13. Dehydrate and mount.
Notes:a. Dehydration should, in general, be very
quick, as most tracers are sensitive toprolonged treatment in ethanol. Sec-tions can also simply be dipped inxylene just prior to covering with acoverslip. Permount (Electron Micro-scopy Sciences, Fort Washington, PA,USA), Entellan (Merck, Darmstadt,Germany), or DePeX (Merck) aremounting media suited for most trac-ing techniques. Glycerin is also used asmounting medium.
Section Processing for Tracer Visualization
14. Sections derived from material injectedwith fluorescent dyes can be observeddirectly at the microscope (see below).When nonfluorescent tracers are em-ployed, immunoperoxidase or immu-nofluorescence protocols can be used.
213
12. Tract Tracing Methods at the Light Microscopic Level
Merighi12-aucorr.qxd 5/23/02 8:29 PM Page 213

HRP-Based Tracers
For HRP histochemistry, the standardDAB recipe (0.05% DAB, 0.003% H2O2in TB) produces a brown reaction product.DAB is carcinogenic (requires caution inhandling and should be inactivated afteruse) and is not a sensitive chromogen forHRP histochemistry, but is optimal for thedefinition of the boundaries and extent ofthe HRP injection sites. DAB-processed sec-tions can be lightly counterstained with cre-syl violet. TMB (19), on the other hand, is avery sensitive chromogen but is less stablethan DAB over time and is sensitive todehydration; TMB-processed sections canbe lightly counterstained with neutral red.Several different recipes for HRP histochem-istry are available (22,25,27). Nickel-intensi-fied DAB reaction (0.05% DAB, 0.2%nickel ammonium sulfate, and 0.003%H2O2 in Tris-HCl buffer) results in blackreaction products and also enhances the sig-nal. Modified TMB stabilization (22,27)makes the reaction products more stable,allows counterstaining with cresyl violet,and is suited for further EM processing.
Biotin-Based Tracers
For biotin-based tracers, the detection oflabeling is achieved through the avidin–biotin complex (ABC)-peroxidase reac-tions, using DAB (or metal-intensifiedDAB) as chromogen.
Microscopic Study
• Use bright-field illumination for thestudy of free or conjugated HRP,biotin-based tracers, or immuno-stained labels. The labeling visualizedby some chromogens (e.g., DAB) isalso well visible under dark-field illu-mination (which increases the signal-to-noise ratio), but TMB, for example,is hard to identify in dark-field.
• A fluorescence microscope is obviouslyneeded for the study of the labeling offluorescent or fluorochrome-conjugat-ed dyes and immunofluorescent labels.Before starting the study, make sure thatthe fluorescence microscope is equippedwith the proper filter systems (excitationwith the appropriate light wavelength iscritical for fluorescence). If the fluores-cent label is not visible at relatively lowpower (e.g., using a 10× objective), al-ways check the field at higher power be-fore discarding the experiment (the labelor conditions of observation may not besufficiently sensitive at low power).In multiple labeling, when the proto-col does not allow the simultaneousvisualization of 2 fluorescent tracers inthe same light excitation wavelength,the same field must be observed usingdifferent filter systems. Fluorescenceand dark-field or even bright-field illu-mination can also be combined duringthe observation. Observe first underfluorescence, then turn on the micro-scope’s main light bulb and look forthe best compromise for observingboth signals at the same time.
• If labeling is analyzed with a digitalcamera and software for image analy-sis, make sure that the camera is suffi-ciently sensitive to record all the signalyou see under the microscope.
Tips for Tracing with Fluorescent Dyes
Fluorescent dyes or fluorochrome-conju-gated tracers are very appealing due to thesimplicity of their use, which requires fluo-rescence microscopy but does not implycomplicated protocols of tissue processing.Fluorescence, however, is not stable overtime; the quality of the preparations is betterpreserved if the slides are stored in darkboxes at 4°C. Since fading during the obser-vation may occur, it is always advisable toprepare more than one series of sections,
214
M. Bentivoglio and G. Bertini
Merighi12-aucorr.qxd 5/23/02 8:29 PM Page 214

examining only one series to check theexperimental findings. If the results aregood, the extra series can be used for chart-ing the label and/or for photography.Although fluorescent counterstains can beused (1,23), it is a good policy to prepareadjacent Nissl-stained serial sections, espe-cially if the cytoarchitectonic study (e.g., ofthe boundaries of a given structure) presentsdelicate problems of interpretation.
Autofluorescence, exhibiting granularfeatures, may occur in the cytoplasm ofneuronal cell bodies and increases with theanimal’s age. This may interfere with thedetection of fluorescent labeling, especiallywhen using orange-red or yellow fluores-cent tracers. However, autofluorescencecan be distinguished from the specific labelsince, at variance with the latter, it remainsvisible through all the different filter sets.
It should also be mentioned that fluores-cent labeling can, in some instances, betransformed into a stable DAB reactionproduct through photoconversion (4,18,24). Photoconversion could be due to oxi-dation of DAB by photoexcited molecules,but the physicochemical mechanism of thereaction is still unknown. In the procedure,the section is covered with a drop of fresh-ly made DAB solution (1.5 mg/mL Trisbuffer 0.1 M, pH 8.2, without any hydro-gen peroxide) and exposed to fluorescenceillumination. It should, however, be keptin mind that: (i) only fluorescent labels inthe field visualized by the microscopeobjective (e.g., 16×, 25×) are photocon-verted; (ii) in our experience, photoconver-sion of the labels resulting from fluorescentretrograde axonal tracers is not sensitive,whereas DiI photoconversion is effective;and (iii) photoconversion can be used toproceed towards the electron microscopicstudy of some of the labels.
Criteria for Multiple Labeling
Multiple labeling implies the visualiza-
tion of two or more markers in the sametissue. The markers can be used to labeldifferent subsets of the same neuronal pop-ulation or fiber tract or different neuronalpopulations or fibers simultaneously. Mul-tiple markers are needed to investigatesimultaneously more than one set of con-nections (double retrograde, double ante-rograde, and retrograde combined withanterograde) and/or the occurrence ofbranched connections reaching more thanone target through axon collaterals. Multi-ple markers can also be represented by trac-er(s) combined with other molecules,which characterize the connection(s). Forexample, for the study of chemically char-acterized circuits, tracing is combined withimmunohistochemistry or in situ hybridi-zation analysis of endogenous molecules(such as neurotransmitters or their synthet-ic enzymes, neuromodulator and neuroac-tive molecules, and receptors).
For the study of functional activation ofcircuits, tracing is commonly combinedwith the immunohistochemical revelation ofFos, the protein encoded by the immediateearly gene c-fos, which is induced in responseto a variety of stimuli, such as sensory stim-ulation or drug administration (12).
Whatever the experimental require-ments, in multiple labeling, the recipes ofthe fixatives and revelation protocols ofeach of the markers should be compatible.
The optimal goal for multiple labeling isthe simultaneous visualization of the labelsin the same sections. This can be achievedfollowing three main criteria:1. Different colors of the markers. This is
the most commonly adopted approachand is especially suited for fluorescencemicroscopy, since fluorochromes fluo-rescing in different colors can be easilydifferentiated with specific filter sets.Multiple colors can be used for thevisualization of different populations oflabeled cell bodies or different fiberbundles (Figure 2E), as well as for the
215
12. Tract Tracing Methods at the Light Microscopic Level
Merighi12-aucorr.qxd 5/23/02 8:29 PM Page 215

simultaneous visualization of cell bodiesand fibers in anterograde–retrogradecombined techniques or to study exoge-nous tracers and endogenous molecules(for example, the organization of fibersterminating on cell bodies characterizedby their immunoreactivity to a givenantigen). These approaches are becom-ing increasingly used, since they areespecially suited for studies at high reso-lution in confocal microscopy.
2. Different intraneuronal features of dis-tribution of the markers, i.e., cytoplas-mic labeling versus nuclear labeling.Although this strategy may seem diffi-cult to apply, it may actually result invery distinct signals of different labels(Figure 2B), allowing the detection ofboth markers even at low power micro-scopic observation. This is also facilitat-ed if the two markers bear different col-ors. Such strategy can be used fordouble retrograde labeling, combining atracer that labels preferentially the neu-ronal nucleus, such as DY, with a tracerthat labels preferentially the neuronalcytoplasm, such as FB (Figure 2B).
3. Different features of cytoplasmic label-ing of different markers, e.g., granularlabeling versus homogenously diffusestaining or granules of different sizes;the latter is, however, the approach ofchoice in electron microscopy, whereasparticles of different sizes are difficult todistinguish in light microscopy. Again,the visualization of different features oflabeling in the cytoplasm is enhancedby different colors of the labels. Forexample, this strategy is very sensitivewhen visualizing the retrograde labelingof gold-conjugated tracers such as CTb-gold and WGA-apoHRP-gold (blackgranules in the cytoplasm resultingfrom silver enhancement) combinedwith immunoreactivity revealed byDAB reaction products (brown diffuseimmunostaining) (Figure 2C).
RESULTS AND DISCUSSION
The procedures described in the Proto-cols sections, which have to be adapted toeach experimental design, result in effectiveretrograde labeling of neuronal cell bodies(Figure 2, A, B, C, and D) or anterogradelabeling of axons (Figure 2, E and F) andtheir preterminal and terminal arboriza-tions in vivo. It is peculiar, in this respect,that the HRP techniques, which belong tothe first generation of tract tracing meth-ods, are still among the most widely usedtracing strategies (25).
Tracing in vitro with lipophilic carbocya-nine derivatives (13,14) is especially effectivein developing (embryonic or early postnatal)fixed tissues. In the evaluation of the find-ings, the possibility of transmembrane dyediffusion should be considered (26). Carbo-cyanines can also be used in vivo, but theydo not present advantages over other tracers.
It should be also be taken into accountthat the bidirectional transport of tracersmay result in problems of interpretation inthe case of reciprocal connections (i.e., whenboth anterograde and retrograde labeling arefound in the area under study). For example,in tracing corticocortical connections, bothretrogradely labeled cell bodies and antero-gradely labeled terminals can be found in theareas interconnected via association or com-missural fibers. After tracer injection in acortical field, thalamocortical neurons andterminals of corticothalamic fibers can alsobe found in the interconnected thalamicarea. Bidirectional labeling is especiallymarked in HRP tracing. In general, in thesecases, caution should be taken in the inter-pretation of the neuropil labeling, whichcould be represented by cross-sectioned den-drites, fibers, and terminal elements.
By combining the different features oflabeling of retrograde tracers (Figure 2, Band D), the simultaneous visualization oftwo tracers in same neuronal cell body canbe achieved with high sensitivity. This
216
M. Bentivoglio and G. Bertini
Merighi12-aucorr.qxd 5/23/02 8:29 PM Page 216

217
12. Tract Tracing Methods at the Light Microscopic Level
Figure 2. Photomicrographs that illustrate different retrograde (A–D), anterograde (E,F) tracers, as well double retrograde(B,D), double anterograde (E) labeling, and retrograde labeling combined with an endogenous protein immunoreactivity. Pan-els A, B, and E show fluorescent dyes, panels C and F are in bright-field illumination, and panel D illustrates a combination offluorescence and dark-field illumination. Panels A through D and F were derived from experiments in rats and panel E in the frog.(A) FB retrogradely labeled reticulospinal neurons; note the labeling of the cytoplasm and proximal dendrites. (B) Neuron of thebrainstem reticular core double labeled after FB injection in the spinal cord and DY injection in the thalamus; FB labeling isrevealed by blue fluorescence in the cytoplasm and DY labeling by gold fluorescence in the nucleus; the inset illustrates a singleDY-labeled neuron. (C) Neurons of the substantia nigra retrogradely labeled by WGA-apoHRP-gold injection in the striatum(black granular labeling of the cytoplasm revealed by silver intensification) and combined with calbindin immunohistochemistry(brown diffuse cell immunostaining resulting from the use of DAB as chromogen). (D) Thalamic neurons double labeled after FBinjection in the cortex and WGA-apoHRP-gold injection in the thalamic reticular nucleus; FB labeling is revealed by blue fluo-rescence and the gold-conjugated tracer by the granular labeling (resulting from silver intensification) that assumes a gold colorin dark-field illumination (courtesy of Dr. Roberto Spreafico, Neurological Institute Besta, Milan, Italy). (E) Double anterogradelabeling of the optic chiasm with fluorescent dextran amines: Texas Red conjugated dextran amine (red fluorescent) in the leftoptic tract and fluorescein-conjugated dextran amine (green fluorescent) on the right side; the superimposition of the two colors(double exposure photograph) results in the yellowish labeling at the fiber crossing (courtesy of Dr. Bernd Fritzsch, CreightonUniversity, Omaha, NE, USA). (F) Biotin–dextran amine fiber labeling. (See color plate A9.)
Merighi12-aucorr.qxd 5/23/02 8:29 PM Page 217

reveals that the double labeled cell projectsto both the areas injected with each tracer.The possibility to use not only two fluores-cent tracers (Figure 2B) but also the com-bination of fluorescence and dark-fieldobservation (Figure 2D) allows flexibilityin the choice of the experimental strategy.
The combined approaches that exploitnuclear staining versus cytoplasmic label-ing are also well suited for the characteriza-tion of neurons whose functional activa-tion to a given stimulus is revealed byinduction of Fos immunopositivity. Thisstrategy is increasingly used when theexperiments require the definition of cir-cuits in which Fos, which is a nuclear pro-tein, is elicited as functional marker.
The combination of tract tracing with im-munohistochemistry allows one to character-ize the molecular (e.g., chemical) identity ofretrogradely labeled neurons (Figure 2C).
By the use of anterograde tracers of dif-ferent colors, different pathways can betraced simultaneously; in fluorescence rou-tine photography, they can be illustrated bydouble exposure photographs (Figure 2E).
Confocal microscopy opened novel per-spectives for the use and analysis of fluores-cent tracers.
Overall, the strategies for tract tracing arevery versatile, offer a wide range of tools andprocedures, most of which are relatively sim-ple, and are at a relatively low cost. For asuccessful application of the techniques, theexperiment requirements and planning arecrucial for the choice of the tracing proto-col. Basic training in the histological pro-cessing of the nervous tissue is undoubtedlyof help in applying the different protocols,and a good tissue preservation and sectionquality are very important for adequateanalysis and illustration of the findings.
ACKNOWLEDGMENTS
Experiments referred to in this chapter
and the preparation of this manuscriptwere supported by MIUR grants.
REFERENCES
1.Alvarez-Buylla, A., C.Y. Ling, and J.R. Kirn. 1990.Cresyl violet: a red fluorescent Nissl stain. J. Neurosci.Methods 33:129-133.
2.Basbaum, A.I. and D. Menétrey. 1987. Wheat germagglutinin-apoHRP gold: a new retrograde tracer forlight- and electron-microscopic single- and double-label studies. J. Comp. Neurol. 261:306-318.
3.Bentivoglio, M. and S. Chen. 1993. Retrograde neu-ronal tracing combined with immunocytochemistry, p.301-328. In A.C. Cuello (Ed.), IBRO HandbookSeries: Methods in Neurosciences, Vol. 14, Immuno-histochemistry II. John Wiley & Sons, Chichester.
4.Bentivoglio, M. and H.-S. Su. 1990. Photoconversionof fluorescent tracers. Neurosci. Lett. 113:127-133.
5.Cajal, S.R. 1911. Histologie du Système Nerveux del’Homme et des Vertébrés. Maloine, Paris.
6.Callahan, C.A., S. Yoshikawa, and J.B. Thomas.1998. Tracing axons. Curr. Opin. Neurobiol. 8:582-586.
7.Cowan, W.M., D.I. Gottlieb, A.E. Hendrickson, J.L.Price, and T.A. Woolsey. 1972. The autoradiographicdemonstration of axonal connections in the centralnervous system. Brain Res. 37:21-51.
8.Cuénod, M., P. Bagnoli, A. Beaudet, A. Rustioni, L.Wiklund, and P. Streit. 1982. Transmitter-specific ret-rograde labeling of neurons, p. 17-44. In V. Chan-Palay and S. Palay (Eds.), Cytochemical Methods inNeuroanatomy. A.R. Liss, New York.
9.Fink, R.P. and L. Heimer. 1967. Two methods forselective silver impregnation of degenerating axons andtheir synaptic endings in the central nervous system.Brain Res. 4:369-374.
10.Gerfen, C.R., P.E. Sawchenko, and J. Carlsen. 1989.The PHA-L anterograde axonal tracing method, p. 19-47. In L. Heimer and L. Zaborsky (Eds.), Neuro-anatomical Tract-Tracing Methods. Plenum Press, NewYork.
11.Glover, J.C. 1995. Retrograde and anterograde axonaltracing with fluorescent dextran-amines in the embry-onic nervous system. Neurosci. Prot. 30:1-13.
12.Herrera, D.G. and H.A. Robertson. 1996. Activationof c-fos in the brain. Prog. Neurobiol. 50:83-107.
13.Honig, M.G. and R.I. Hume. 1986. Fluorescent car-bocyanine dyes allow living neurons of identified ori-gin to be studied in long-term cultures. J. Cell Biol.103:171-187.
14.Honig, M.G. and R.I. Hume. 1989. Dil and DiO:versatile fluorescent dyes for neuronal labelling andpathway tracing. Trends Neurosci. 12:333-341.
15.Kristensson, K. and Y. Olsson. 1971. Retrogradeaxonal transport of protein. Brain Res. 29:363-365.
16.Kuypers, H.G. and G. Ugolini. 1990. Viruses astransneuronal tracers. Trends Neurosci. 13:71-75.
17.LaVail, J.H. and M.M. LaVail. 1972. Retrograde axon-al transport in the central nervous system. Science176:1416-1417.
218
M. Bentivoglio and G. Bertini
Merighi12-aucorr.qxd 5/23/02 8:29 PM Page 218

18.Lübke, J. 1993. Photoconversion of different fluores-cent substances for light and electron microscopy. Neu-rosci. Prot. 5:1-13.
19.Mesulam, M.M. 1978. Tetramethyl benzidine forhorseradish peroxidase neurohistochemistry: a non-carcinogenic blue reaction product with superior sensi-tivity for visualizing neural afferents and efferents. J.Histochem. Cytochem. 26:106-117.
20.Nauta, W.J.H. and M. Feirtag. 1986. FundamentalNeuroanatomy. Freeman & Co., New York.
21.Nauta, W.J.H. and P.A. Gygax. 1951. Silver impreg-nation of degenerating axon terminals in the centralnervous system: (1) technic (2) chemical notes. StainTechnol. 26:3-9.
22.Olucha, F., G.F. Martinez, and G.C. Lopez. 1985. Anew stabilizing agent for the tetramethyl benzidine(TMB) reaction product in the histochemical detec-tion of horseradish peroxidase (HRP). J. Neurosci.Methods 13:131-138.
23.Schmued, L.C. 1994. Anterograde and retrograde neu-
roanatomical tract tracing with fluorescent com-pounds. Neurosci. Prot. 5:1-15.
24.Schmued, L.C. and L.F. Snavely. 1993. Photoconver-sion and electron microscopic localization of the fluo-rescent axon tracer fluoro-ruby (rhodamine-dextran-amine). J. Histochem. Cytochem. 41:777-782.
25.van der Want, J.J., J. Klooster, B.N. Cardozo, H. deWeerd, and R.S. Liem. 1997. Tract-tracing in the ner-vous system of vertebrates using horseradish peroxidaseand its conjugates: tracers, chromogens and stabiliza-tion for light and electron microscopy. Brain Res. BrainRes. Protocol 1:269-279.
26.Vercelli, A., M. Repici, D. Garbossa, and A. Grimaldi.2000. Recent techniques for tracing pathways in thecentral nervous system of developing and adult mam-mals. Brain Res. Bull. 51:11-28.
27.Weinberg, R.J. and S.L. van Eyck. 1991. A tetram-ethylbenzidine/tungstate reaction for horseradish per-oxidase histochemistry. J. Histochem. Cytochem.39:1143-1148.
219
12. Tract Tracing Methods at the Light Microscopic Level
Merighi12-aucorr.qxd 5/23/02 8:29 PM Page 219

221
OVERVIEW
One of the major goals of research inneurobiology is the characterization of neu-ronal circuits, which are the basis of thefunctioning of the entire nervous system.Tract tracing methods are among the bestapproaches to elucidate the connectionsbetween neurons located in distinct areas ofthe nervous system since they allow an easyrecognition of large neuronal populationsand their structural characterization.Although the bulk of information isachieved at light microscope (LM) level,only electron microscopy allows one todemonstrate of the occurrence of biologicalinteraction between neurons and character-ize the synaptic circuitry involved. In thechoice of tracers for ultrastructural analysisof neuronal connections, neurobiologistsneed to consider specific characteristics ofthe tracer, in addition to those addressedfor tracing at LM (see Chapter 12). Highsensitivity is an essential requisite for tracersin ultrastructural studies, since synapticcontacts are mainly established with smalldiameter neuronal processes. Further
important demands are that the tracerresists to histological processing for ultra-structural analysis and that the tracingmethod can further be combined withother neurobiological techniques aimed toachieve a more complete characterization ofthe neuronal circuit. Under these perspec-tives, the most suitable tracers to performretrograde, anterograde, or bidirectionaltracing at the electron microscope (EM)level, are discussed. The elected techniquesare presented in a sole protocol that allowsa successful combination of retrograde,anterograde, and neurochemical analysis atLM and EM levels. Each technique can,however, be used separately or designed toachieve different goals, as pointed out atthe various steps of the protocol.
BACKGROUND
Tracing studies at the EM are mainlyaimed at the identification and characteri-zation of the synaptic specialization withinthe circuit studied, which is essential forthe recognition of a neuronal circuit and
Cellular and Molecular Methods in Neuroscience ResearchEdited by A. Merighi and G. Carmignoto
Tract Tracing Methods at theUltrastructural Level
Isaura Tavares, Armando Almeida, and Deolinda LimaInstitute of Histology and Embryology, Faculty of Medicine and IBMC,University of Oporto, Porto, Portugal, EU
13
Merighi13-aucorr.qxd 5/23/02 8:32 PM Page 221

gives some insights onto its excitatory orinhibitory nature. Inspection of labeledneurons in the LM prior to their examina-tion in the EM (correlated light and elec-tron microscopy analysis) is the most valu-able procedure to fully characterizeneuronal circuits (11). It avoids the time-consuming blind search for labeled struc-tures at the EM and allows to relate theultrastructural observations with thoroughLM characterization of the same neuronalelements, as to their structure and location.
In ultrastructural tract tracing studies,neurobiologists have to deal with problemsspecifically related to tissue preparation.The two main questions are the establish-ment of procedures that enable a satisfac-tory penetration of reagents without com-promising structural preservation andvisualization of multiple tracers. Therequirements for maintenance of ultra-structural integrity are difficult to concili-ate with detection of most tracers. Theclassical inclusion of glutaraldehyde in thealdehyde perfusion mixture reduces theactivity of enzymes revealed by histochem-ical reactions, masks antigenic sites, causesunspecific staining by fixing antibodies tofree aldehyde groups, and hinders penetra-tion of reagents into the tissue (10,63). Itmay be useful to restrict the presence ofglutaraldehyde to the first minutes of vas-cular perfusion (e.g., a 2% glutaraldehydeand 2% paraformaldehyde solution) sothat the bulk of the perfusion as well as thepostfixation use only paraformaldehyde(e.g., a 4% solution). This procedure hasproven to render a fair compromisebetween ultrastructural preservation andtracer visualization (72). Whenever thisreduction in glutaraldehyde concentrationis unable to produce such an aim, it may behelpful to treat thick sections, before theonset of tracer detection, with sodiumborohydride (e.g., a 0.1%–1% solution for10–30 min), which neutralizes Schiffsbases (18,32). Although osmication by
immersion in osmium tetroxide (OsO4)provides additional fixation by linkage tocomponents unreacted by aldehydes andcounterstains the tissue, it occasionallyremoves tracers from neurons (41) andalters the ultrastructural appearance ofsome chromagens (69,82).
In ultrastructural tract tracing studies ofnervous areas where axons course predomi-nantly in one direction (e.g., spinal cord), itmay be useful to cut sections perpendicular-ly to that plane in order to maximize pene-tration of reagents. This problem is particu-larly overwhelming for tracers detectedimmunocytochemically, since the deter-gents, which are commonly used at LMtracing to allow penetration of immunore-agents, are incompatible with ultrastructur-al preservation (23,38,39,63,79). Triton®
X-100, one of the most effective detergents,should be present only in solutions contain-ing primary antibodies in concentrationsnot exceeding 0.1% (3,72,91). In someinstances, it turns useful to replace thedetergent by ethanol treatment before theonset of tracer detection (38).
As to the question of visualization ofmultiple tracers, it may be recalled that themajority of ultrastructural studies of neu-ronal connections use peroxidase or immu-noperoxidase methods with diaminobenzi-dine (DAB) as chromagen, which results inan amorphous electrondense precipitate.The search for substances that can be dis-tinguished from DAB led to the use of par-ticulate markers, such as colloidal-gold orferritin (15,77) and crystalline markers liketetramethylbenzidine (TMB) (40,82,85).Other peroxidase substrates with suitableultrastructural appearances are availablesuch as Vector® VIP (92) (Vector Labora-tories, Burlingame, CA, USA) and benzi-dine dihydrochloride (BDHC) (69,79).However, Vector VIP can obscure ultra-structural details (92), whereas BDHC ishighly toxic and produces inconsistentresults (40,69).
222
I. Tavares et al.
Merighi13-aucorr.qxd 5/23/02 8:32 PM Page 222

Retrograde Tracers
There is a multitude of retrograde trac-ers available for the ultrastructural study ofneuronal connections. The tracers can begrouped into four classes: (i) horseradishperoxidase (HRP)-based tracers [HRP andwheat germ agglutinin (WGA)-HRP]; (ii)colloidal gold-labeled tracers (WGA-gold,WGA-HRP-gold, and WGA-apo-HRP-gold); (iii) fluorescent tracers (mainly Fluo-rogold; Fluorochrome Inc., Englewood,NJ, USA) and (iv) cholera toxin subunit b(CTb)-based tracers (unconjugated CTb,CTb-HRP, and CTb-gold). The choice ofthe tracer depends on the purpose of thestudy, but it should take into account therequisites addressed above.
CTb-tracers, mainly in its unconjugatedor gold-linked forms, have been elected formost neuroanatomical studies. Due to aparticularly low rate of diffusion, CTb pro-duces confined injections sites, a feature ofmajor importance in tracing studies, espe-cially those dealing with small nuclei(24,36,71). The mechanisms of neuronaluptake are well established and rely onbinding to the GM1 ganglioside receptor(30,57). It is disputable whether CTb-basedtracers are transported by passing fibers.This has been discarded based on the lack oflabeling following pressure (36,71) or ion-tophoretic (47) injections in several axonaltracts. However, a few neurons were labeledafter injections of CTb-tracers in other neu-ronal pathways (17,42). It is possible thatmolecular features such as the GM1 distrib-ution along different portions of the neu-ronal membrane account for the observedvariability of CTb uptake by passing fibers.
Several questions need to be consideredbefore electing the form of CTb-tracer touse. Due to proteolytic degradation ofHRP by lysosome enzymes, CTb-HRP canbe detected only for a few days upon injec-tion. On the contrary, the long-term reten-tion of unconjugated CTb and CTb-gold
by neurons renders flexibility to the exper-iments and allows time for other surgicalmanipulations to be carried out, namelyinjections of other tracers. CTb-gold isparticularly suitable for such multiplelabeling experiments due to the distinctultrastructural aspect of gold particles andthe possibility of combining the silverintensification procedures used for detect-ing CTb-gold with methods for tracer orneurotransmitter identification based onperoxidase histochemistry. An additionaladvantage of CTb-gold for ultrastructuralstudies is that glutaraldehyde fixation doesnot interfere with its visualization while itaffects immunodetection of unconjugatedCTb (24,72) and reduces the enzymaticactivity of CTb-HRP. In spite of beinginsensitive to glutaraldehyde concentra-tion, CTb-gold is affected by postfixationwith OsO4, which removes gold particles,unless gold toning is performed (41,42).
The main problem of CTb-gold forultrastructural tracing studies is that, as withcolloidal gold labeled tracers (7,53,66), dis-tal dendrites are seldom filled. Unconjugat-ed CTb, on the contrary, fills the dendritictree up to small distal dendrites (3,14,24,72), the neuronal structures which receivethe majority of synaptic input (11). Thisprompts neurobiologists to develop methodsto overcome the drawbacks discussed above(see Protocol), thus allowing the successfuluse of unconjugated CTb for EM studies.
Correlated confocal and electron micro-scopy emerges as a new tool in the ultra-structural study of retrogradely labeled neu-rons (see also Chapter 15). Optical sectionsof neuronal profiles to be observed at theEM can be used for three-dimensionalreconstruction of the neurons, which allowsfor their visualization in various perspec-tives, a procedure of particular value forregions where the similar orientation of neu-ronal processes imposes, as discussed above,the use of a single plane of sectioning.Another advantage is the easier match
223
13. Tract Tracing Methods at the Ultrastructural Level
Merighi13-aucorr.qxd 5/23/02 8:32 PM Page 223

between optical and ultrathin sections, ascompared to the thick sections of conven-tional correlated light and electron micro-scopy (21,70,76). Briefly, the techniquerelies on confocal observation of neuronsretrogradely labeled by a tracer identified bya fluorochrome, and the subsequent replace-ment of this marker by an electrondenseproduct suitable for ultrastructural observa-tion. The conversion procedure can be per-formed by photoconversion (6,45,46) orreplacement of immunofluorescence re-agents by immunoperoxidase products (55,56,60,76), a process which can be achieveddue to the higher affinity of the latter anti-serum to antigenic complexes as comparedto immunofluorescent substances.
Fluorescent tracers may be useful in cor-related confocal and ultrastructural analy-sis, since they are directly observed withoutany sort of histochemical treatment.Among the numerous fluorescent tracersavailable (9), Fluorogold stands out by itsability to produce extensive filling of thedendritic arbor either upon photoconver-sion (6) or immunoperoxidase detection ofthe tracer (16,22,81). It must, however, benoted that the tracer massively diffusesfrom the injection site and is taken up bypassing fibers even after iontophoreticdelivery (20,59,65). Unconjugated CTb,detected by the sequential immunofluor-escence–immunoperoxidase procedure de-scribed above, appears to be the method ofchoice for correlated confocal and ultra-structural analysis (Figure 1).
Another recent achievement in retrogradetracing at the ultrastructural level is the useof “suicide” tracers. Some lectins, like ricinand volkensin, bind to oligosaccarides inaxonal membranes and are internalized andtransported retrogradely to the cell body,where they inactivate protein synthesis,leading to neuronal death (86,88). Degen-erating profiles and reduction of the densityof mitochondria and synapses is then easilydetected at the EM (13,37,54,64). Other
toxins, like saporin, which are devoid ofbinding properties, can be used for the samepurpose upon conjugation with substancesthat bind to neuronal surface molecules. Inthis case, binding to neurochemical markersspecific for some neuronal populationsallows the selective destruction of particularafferents of the injected area (86,87).Recently, the use of saporin conjugated withCTb produced a very lethal “killer-tracer”that was successfully used at LM studies(43). Suicide tracing allows one to correlatebehavioral analysis with specific lesion ofneuronal pathways (48,50), thus openinginteresting possibilities of functional evalua-tion of neuronal circuits characterized at theultrastructural level.
Anterograde Tracers
Currently, anterograde tracing of neu-ronal connections at the ultrastructurallevel is mainly performed by the use of twotypes of tracers: (i) Phaseolus vulgaris leuco-agglutinin (PHA-L); and (ii) biotin-basedtracers [biotinylated dextran amine (BDA),biocytin, and neurobiotin]. In a mannersimilar to retrograde tracing, anterogradetracers should fill several requirements tobe used in ultrastructural studies. Highsensitivity is not a decisive issue in thechoice of tracer as all appear to fill axons ina Golgi-like fashion, enabling the examina-tion of fine morphological features(12,26,29,31,34,58,68,83). However, con-trary to the long immunocytochemicalprocedure needed to detect PHA-L, detec-tion of biotin-based tracers involves a sim-ple and fast avidin–biotin complex (ABC)-peroxidase reaction, favoring the use of thelatter tracer class. In fact, ultrastructuralpreservation is excellent, because higherglutaraldehyde concentrations are allowedduring the fixation, and the time betweenvascular perfusion and osmication is short-er (1,19,33,61,75,84,89). Moreover, mul-tiple labeling studies can be performed
224
I. Tavares et al.
Merighi13-aucorr.qxd 5/23/02 8:32 PM Page 224

more easily since the risk of cross-reactionbetween immunoreagents is decreased.BDA is preferable to biocytin and neurobi-otin since it is not transported transneu-ronally (28) and is suitable for tracing stud-ies of long pathways (25,35,67,68,78).
The disadvantages of biotin-based tracersover PHA-L need, however, to be envis-aged. Contrary to PHA-L, biotin-basedtracers are taken up by fibers of passage invariable degrees and can be transported inthe retrograde direction (12,26–28,35,67,68,90). In the case of BDA, the latter draw-back can be overcome by decreasing theconcentration of the tracer and diameter ofthe micropipets used for iontophoresis (61).
Bidirectional Transport of Tracers
Areas of the central nervous system areoften reciprocally connected, whichprompts a careful evaluation of themethodology available to study reciprocalcircuits. The bidirectional transport of asingle tracer proved to be preferable to theuse of retrograde and anterograde trans-ports of two different tracers from the samearea (52). Tracers commonly have distinctrates of diffusion and transport, whichimpairs the precise evaluation of the site oforigin of labeled structures and makes diffi-cult to find a postsurgery period suitable forthe detection of both anterogradely and ret-rogradely labeled structures. Furthermore,the uptake and migration of one tracer canbe influenced by the other (22). Detectingone single tracer instead of two improvesultrastructural preservation, since it mayreduce the time of incubation in reagentsand consequently decrease the lap betweenvascular fixation and osmication. Finally,the combination with other neurobiologymethods becomes easier, since the samereagents are used in the detection of theanterograde and retrograde tracing, whichdecreases the possibilities of cross-reactivity.
BDA and biocytin have been used for
the study of reciprocal connections, but thetransport of those tracers in the retrogradedirection is quite discrete (44,49). Uncon-jugated CTb is becoming the tracer of elec-tion for such studies (3,4,73,74) since itproduces an extensive filling of the den-dritic tree and the anterograde transportcan be considerably improved by introduc-ing simple changes in the method of detec-tion (see Protocol), namely: (i) increase ofthe concentration of primary antibodies;(ii) extension of the incubation time in theimmunoreagents; (iii) use of graded seriesof ethanol to increase penetration ofreagents; and (iv) incubation with sodiumborohydride to counteract the deleteriouseffects of glutaraldehyde (5,32,38,76). Inspite of the punctate appearance of antero-grade labeling due to the lack of intensestaining of axonal strands, anterogradelylabeled terminals can be clearly recognizedin correlated light and ultrastructuralobservation (Figure 1), and the method isexquisite for studies aimed at the morpho-logical characterization of the neuronsinvolved in reciprocal circuits, particularlyif the correlated confocal and ultrastructur-al method described before is employed.
Further important advantages of uncon-jugated CTb to detect reciprocal connec-tions is that it appears not to fill retro-gradely axonal collaterals of labeledneurons, in which case axonal arborizationsof retrogradely labeled neurons could betaken as anterograde labeling. Moreover, itis not transported transynaptically, whichdiscards the possibility that labeled bou-tons are generated by local circuit neuronstargeted by the afferent fibers (3,5,47,80).
PROTOCOL
We describe a method in which theexcellent features of unconjugated CTb forretrograde tracing and BDA for antero-grade tracing at the ultrastructural level
225
13. Tract Tracing Methods at the Ultrastructural Level
Merighi13-aucorr.qxd 5/23/02 8:32 PM Page 225

were explored to investigate the occurrenceof a dysynaptic pathway in the rat andcombined with immunocytochemical pro-cessing to characterize neurochemically onecomponent of the circuit. The general pro-tocol is also valid for the single use of eachtracer, as well as for bidirectional tracingwith CTb, provided that the changes,referred to in the Notes, are introduced.
Materials and Reagents
• Alkaline phosphatase streptavidin(Vector Laboratories, Burlingame, CA,USA).
• Ammonium paratungstate (FlukaChemicals, Buchs, Switzerland).
• Ammonium chloride (Sigma, St.Louis, MO, USA).
226
I. Tavares et al.
Figure 1. Confocal (A), light (B), and ultrastructural (C and D) photographs of a neuron in spinal lamina I, which is retro-gradely labeled by CTb from the VLM and receives appositions from CTb-labeled fibers from the same injection site (bidi-rectional tracing with CTb). The nucleus (N) is used as a landmark. In panel A, a single confocal section, in which CTb wasrevealed by immunofluorescence using a streptavinin-Alexa 594 antibody (Molecular Probes), shows the neuron and boutons 1to 3 in apposition with the perikarya. The same neuron is depicted in panel B in a thick section following immunoperoxidasereaction with the ABC method. Four additional boutons, marked with arrows, are seen in apposition with a dendrite. In panel C,an ultrathin section of the neuron was taken from a plane close to that depicted in the confocal image. The asterisk indicates CTblabeling at the perikaryon. In panel D, bouton 3 is shown at higher magnification. It establishes an asymmetrical synapse with theperikaryon (arrowheads). Scale bars are expressed in micrometers.
Merighi13-aucorr.qxd 5/23/02 8:32 PM Page 226

• Anti-CTb antiserum raised in goat(List Biological Laboratories, Camp-bell, CA, USA).
• Anti-dopamine-β-hydroxylase (DBH)antiserum raised in rabbit (Affinity,Excester, UK).
• BDA (mw 10 kDa)(Molecular Probes,Eugene, OR, USA).
• Biotinylated antirabbit antiserumraised in swine (Dakopatts, Glostrup,Denmark).
• Cobalt chloride ( Sigma).• CTb low salt (List Biological Labora-
tories).• Current source device (e.g., model CS-
3 from Transkinetics Systems, Canton,MA, USA).
• DAB (Sigma).• Donkey antigoat antiserum (Vector
Laboratories).• Epon (Fluka Chemicals). • Ethanol (Merck, Darmstadt, Ger-
many).• Fast Blue (Sigma).• Glass capillaries (e.g., 1.5 x 0.75
mm)(Clark Electromedical Instru-ments, Reading, England, UK).
• Glass microelectrode puller (e.g.,model PE-21 from Narishige Scientif-ic Instruments, Tokyo, Japan).
• Glucose-oxidase (Sigma).• Hydrogen peroxide (Merck).• Naphtol AS-MX-phosphate (Sigma).• Normal swine serum (Sigma).• OsO4 (Merck).• Peroxidase-antiperoxidase (PAP) anti-
serum raised in goat (Dakopatts).• Phosphate buffer (PB; 0.1 M, pH
7.2–7.4).• PB (0.1 M, pH 6.2).• Propylenoxide (Merck).• Phosphate-buffered saline (PBS; 0.1
M, pH 7.2).
• Silver wire (e.g., 200 µm x 7.6 m) (A-M Systems, Carlsborg, WA, USA).
• Stereotaxic frame (e.g., Model 900from David Kopf, Tujunga, CA, USA).
• Tris-HCl buffer (0.05 M, pH 7.6).• Tris-HCl buffer (0.1 M, pH 8.2).• TMB (Sigma).• Vibrating microtome (e.g., model VT
1000S from Leica Microsystems, Wet-zlar, Germany).
Procedure
1. Under halothane anesthesia (4% forinduction and 1%–1.5% for mainte-nance) and stereotaxic control, performiontophoretic injections of BDA usingmicropipets with 20 to 30 µm innerdiameter tips and positive 7 µA contin-uous current for a time to be settled upaccording to the aimed injection site(in general 10–30 min).
2. Seven to twelve days later, reanesthetizeanimals with halothane and inject ion-tophoretically 1% low salt CTb usingpositive continuous current. Settle upthe current intensity (2–5 µA), time ofdeliverance (3–20 min) and micropipetinner diameter tip (15–30 µm) for thedesired injection site.
3. Four to seven days later, reanesthetizeanimals with chloral hydrate (0.35 g/kgb.w. i.p.) and perfuse them through theascending aorta with PBS. After thefluid exiting from the right atrium isclear, change to a fixative mixture com-posed by 2% glutaraldehyde and 2%paraformaldehyde in 0.1 M PB, pH 7.2to 7.4 (100 mL), followed by 4%paraformaldehyde in the same buffer(1000 mL). A mixing chamber (“Y”shape glass tube) is useful to achieve agradual change from the vascular rinseto the fixative. The rate of perfusionshould be estimated in order to allowfast delivery of the vascular rinse and
227
13. Tract Tracing Methods at the Ultrastructural Level
Merighi13-aucorr.qxd 5/23/02 8:32 PM Page 227

first fixative (20–30 mL/min) and slow-er release of the final fixative (10–15mL/min). Dissect areas of interest andpostfix in 4% paraformaldehyde in 0.1M PB, pH 7.2 to 7.4, for 2 hours, fol-lowed by overnight washing in 8%sucrose, in the same buffer, both at 4°C.
Note: For single anterograde tracing withBDA, use a different fixative both on theperfusion and postfixation with higher glu-taraldehyde concentration (e.g., 2.5% glu-taraldehyde and 4% paraformaldehyde).4. Section nervous tissue pieces with a
vibrating microtome at 75 to 100 µmthrough the injection sites and 40 to60 µm trough the areas containing theretrograde and anterograde labeling.
5. Wash in 0.1 M PB, pH 7.2 to 7.4, for15 minutes. In order to keep the possi-bility of further ameliorate labeling byintroducing changes in the histo- orimmunocytochemical reactions, it maybe convenient to store some sections at-20°C in an antifreeze mixture com-posed of 160 mL of 0.05 M PB, pH7.2, 120 mL ethylene glycol, and 120mL glycerol. Before reacting these sec-tions, wash them thoroughly with 0.1M PB, pH 7.2 to 7.4, 3 x 10 minutes.
Note: For bidirectional tracing, incubatesections for 30 minutes with 50% ethanolin PB, pH 7.4, wash as in step 5, incubatewith 1% sodium borohydride (Sigma) for10 minutes and wash as in step 5, 3 times.6. Begin the histochemical reaction for
BDA by incubating sections in ABCdiluted in PBS at 1:200 for 2 hours.
7. Wash in PBS 3 x 15 minutes.8. Wash in 0.05 M Tris-HCl buffer, pH
7.6, 2 x 10 minutes.9. Incubate in a solution composed by 10
mg DAB, 4 µL H2O2 in 20 mL 0.05M Tris-HCl, pH 7.6. Control reactionspeed under light microscope observa-tion. Stop the reaction by washing as instep 8. Wash in PBS 2 x 10 minutes.
10. Begin the immunocytochemical reac-tion for CTb by incubating in goatanti-CTb antiserum at 1:40 000 to1:60 000 in PBS during 48 hours at4°C. Repeat washes as in step 7.
Note: For single retrograde or bidirectionaltracing with CTb, retitrate anti-CTb anti-serum to, respectively, 1:10 000 or 1:7500to 1:12 000 and, in the latter case, prolongincubation for 72 hours in a PBS solutioncontaining 0.1% sodium azide.11. Incubate in donkey antigoat diluted at
1:200 in PBS for 1 hour. Repeat wash-es as in step 7.
12. Incubate in goat PAP diluted at 1:100in PBS for 1 hour. Repeat washes as instep 7.
Note: For bidirectional tracing with CTb,incubation in steps 11 and 12 should lastfor 2 hours.13. Wash in PB, pH 6.2, 2 x 10 minutes.14. Incubate for 20 minutes in a solution
composed by 500 µL of 1% ammoni-um paratungstate, 125 µL of 0.2%TMB, 100 µL of 0.4% NH4Cl, 100µL of 20% D-glucose, and 10 mL 0.1M PB, pH 6.2 .
Note: For single retrograde or bidirectionaltracing with CTb, it is preferable to per-form the peroxidase reaction as in step 9. 15. Replace the former mixture by a new
solution to which 10 µL of glucose oxi-dase was added. Control the reactionspeed under light microscope observa-tion. Stop the reaction by washing as instep 13. Vigorous stirring and exten-sion of washing may be necessary toreduce the background.
16. Incubate for 10 minutes in a solutioncomposed by 10 mg of DAB, 100 µLof 0.4% NH4Cl, 100 µL of 20% D-glucose, 200 µL of 1% CoCl2, and 10µL glucose oxidase in 10 mL PB, pH6.2. Wash as in step 13 and in PBS 2 x10 minutes.
228
I. Tavares et al.
Merighi13-aucorr.qxd 5/23/02 8:32 PM Page 228

17. Incubate in 10% normal swine serumfor 1 hour.
18. Begin the immunocytochemical reac-tion for DBH by incubating in rabbitanti-DBH antiserum at 1:2000 in PBScontaining 1% normal swine serumovernight. Repeat washes as in step 7.
19. Incubate in biotinylated swine antirab-bit antiserum at 1:200 for 1 hour.Repeat washes as in step 7.
20. Incubate in alkaline phosphatase strep-tavidin at 1:150 for 1 hour. Repeatwashes as in step 7. Wash in 0.1 M Tris-HCl, pH 8.2, 2 times for 10 minutes.
21. Incubate in a filtered solution contain-ing 200 µL 10% naphtol, 20 µL 1 Mlevamisole, 10 mg Fast Blue in 9.8 mL0.1 M Tris-HCl, pH 8.2. Control thereaction speed under microscopeobservation. Stop the reaction by wash-ing in 0.1 M Tris-HCl, pH 8.2, 2 x 5minutes. Wash in PBS 2 x 5 minutes.
22. Mount between slides in a glycerol-based medium (3:1 in 0.1 M PB, pH7.2–7.4) and search for neurons con-taining CTb and DBH and apposed byBDA-fibers. Carefully draw and photo-graph selected areas and “landmarks”(e.g., blood vessels). Remove the cover-slips and wash slides in 0.1 M PB, pH7.2 to 7.4, for 10 to 30 minutes.
23. Postfix in 1% OsO4 0.1 M PB, pH 7.2to 7.4, for 1 hour at 4°C. Dehydratethrough graded series of ethanol inwater: 70% for 5 minutes, 80% for 5minutes, 90% for 10 minutes, 95% for10 minutes, and 100% 2 x 15 minutes.Embed with 1:1 epon/propylenoxide for30 minutes, followed by 3:1 overnight.Include in Epon for 30 minutes at 60°C.
24. With the aid of tissue and toothpick,remove excess resin and flat-embedbetween dymethylclorosilane-coatedslides (2). Use clips to hold slidestogether and allow polymerization totake place at 60°C overnight.
25. Separate the slides and select the areasidentified and photographed in step 19.Fill up flat-bottom embedding capsuleswith Epon and invert over selected sec-tion. Allow to polymerize at 60°C for atleast 24 hours. Alternatively, detach thesection from the slide and glue it into ablank tube of resin. Trim the area ofinterest and collect ultrathin sections onsingle-slot electron microscope grids.Counterstain the material with lead cit-rate (62) for 1 to 3 minutes and observethe sections in the EM.
RESULTS AND DISCUSSION
By applying the protocol described abovefollowing stereotaxic injections of BDA inthe caudal ventrolateral medulla (VLM)and unconjugated CTb in the spinal dorsalhorn, it was possible to conclude that axon-al boutons from fibers originated in theVLM (DAB chromagen; brown) apposed toneurons of the pontine A5 noradrenergicgroup (immunoreactive to DBH-Fast Blueas chromagen; blue), which project to thespinal dorsal horn (TMB chromagen; blackgranules) (Figure 2A).
Although processing for ultrastructuralanalysis removes Fast Blue from the tissue(Figure 2B), previous drawing and pho-tographing of CTb plus DBH double-labeled neurons allows the recognition ofthese cells. At low power EM magnifica-tions, these neurons can be easily identifiedby the characteristic aspect of TMB crystals(Figure 2C), which are often associated withthe microtubuli and rough endoplasmicreticulum. Anterogradely labeled boutonsare filled with amorphous DAB material,which is deposited between synaptic vesiclesand around mitochondria (Figure 2D).
Another chromagen, which can be usedin combination with BDA histochemistryand CTb immunodetection, is pyronin,which uses 1-naphthol as substrate for
229
13. Tract Tracing Methods at the Ultrastructural Level
Merighi13-aucorr.qxd 5/23/02 8:32 PM Page 229

peroxidase reaction and gives a pink colorto perikarya and dendrites (data not shownand Reference 51). Due to their high sensi-tivity and clear-cut difference from bothDAB and TMB reaction products, FastBlue and pyronin are markers of choice forcorrelated light and electron microscopystudies aimed at identifying the origin ofthe input received by neurochemicallycharacterized neurons that project to a cer-tain area. Fast Blue presents the additionaladvantage of using a nonperoxidase detec-tion system, which greatly reduces the riskof “cross-talk” with DAB and TMB reac-tions, although it does not avoid that ade-quate control experiments are performed.Whatever the chromagen chosen, it should
be kept in mind that both Fast Blue andpyronin reaction products are washed awayduring dehydration, implying that onlyneurons double labeled with another tracer(e.g., CTb with TMB as chromagen) canbe followed up at the EM.
Another caution is that the Fast Bluereaction should be the last to be performedin the multiple labeling procedures, sincethe chromagen may alter its appearance oreven be removed after prolonged incuba-tions (8). The higher sensitivity of TMBover other chromagens could producecross-reactivity between peroxidase reac-tions, but in our experiments TMB crystalswere not present over BDA-labeled bou-tons. If this problem arises, it can be over-
230
I. Tavares et al.
Figure 2. Correlated light (A and B)and electron (C and D) analysis of aneuron in the pontine A5 noradrener-gic cell group. A capillary (c) and aglial cell (g) are used as landmarks. Theneuron is retrogradely labeled withCTb (chromagen TMB; black gran-ules in panels A and B and electrondense crystals marked with an asteriskin panel C) from the cervical spinalcord dorsal horn. Its noradrenergicnature is demonstrated in panel A bythe diffuse blue staining due toimmunoreactivity for DBH (chroma-gen Fast Blue removed in panel B dur-ing processing for ultrastructuralanalysis). The neuron receives apposi-tions from axonal varicosities (chro-mogen DAB: brown staining in panelA, black product in panel B, and elec-trondense mark in panels C and D)labeled with BDA from the VLM (1–3in the thick sections in panels A and B;1 and 3 in the ultrathin section inpanel C). In panel D, bouton 3 isshown at a higher magnification. Anobliquely cut synapse is establishedbetween the bouton and the perikary-on (arrowhead) of the retrogradelylabeled neuron. Scale bars areexpressed in micrometers. (See colorplate A10.)
Merighi13-aucorr.qxd 5/23/02 8:32 PM Page 230

come by inverting the sequence of peroxi-dase reactions. Another important aspectto be aware of in the design of the protocolis that the chromagen TMB should be usedonly for immunoreactions with high speci-ficity and low background. Retitrating theprimary antibodies in the immunoreac-tion, as discussed by Llewellyn-Smith et. al.(40), can help in reducing background, butthe replacement of hydrogen peroxide byglucose oxidase, as proposed by theauthors, did not appear to produce thedesired effect in our hands.
ACKNOWLEDGMENTS
We are very grateful to Dr. MarianneWikström, University of Göteborg, Swe-den, who kindly offered us antibodiesagainst CTb when they were not yet com-mercially available. Isaura Tavares acknowl-edges the advises of Professors J.P. Bolam(MRC Anatomical NeuropharmacologyUnit, Oxford, England, UK) and TrevorBatten (Department of CardiovascularStudies, University of Leeds, England, UK)regarding the use of TMB and Fast Blue,respectively.
REFERENCES
1.Aicher, S.A., D.J. Reis, R. Nicolae, and T.A. Milner.1995. Monosynaptic projections from the medullarygigantocellular reticular formation to sympathetic pre-ganglionic neurons in the thoracic spinal cord. J.Comp. Neurol. 363:563-580.
2.Aldes, L.D. and T.B. Boone. 1984. A combined flat-embedding, HRP histochemical method for correlativelight and electron microscopic study of single neurons.J. Neurosci. Res. 11:27-34.
3.Almeida, A., I. Tavares, D. Lima, and A. Coimbra.1993. Descending projections from the medullary dor-sal reticular nucleus make synaptic contacts with spinalcord lamina I cells projecting to that nucleus: an elec-tron microscopic tracer study in the rat. Neuroscience55:1093-1106.
4.Almeida, A., I. Tavares, D. Lima, and A. Coimbra.1998. Reciprocal connections between the spinal dor-sal horn and the dorsal part of the medullary dorsalreticular nucleus. Society Neurosci. Abstr. 24:393.
5.Angelucci, A., F. Clascá, and M. Sur. 1996. Antero-grade axonal tracing with the subunit B of choleratoxin: a highly sensitive immunohistochemical proto-col for revealing fine axonal morphology in adult andneonatal brains. J. Neurosci. Methods 65:101-112.
6.Balercia, G., S. Chen, and M. Bentivoglio. 1992.Electron microscopic analysis of fluorescent neuronallabeling after photoconversion. J. Neurosci. Methods45:87-98.
7.Basbaum, A.I. and D. Menétrey. 1987. Wheat germagglutinin-apoHRP gold: a new retrograde tracer forlight- and electron microscopic single-and double-labelstudies. J. Comp. Neurol. 261:306-318.
8.Batten, T.F.C., K. Appenteng, and S. Saha. 1988.Visualization of CGRP and ChAT-like immunoreac-tivity in identified trigeminal neurones by combinedperoxidase and alkaline phosphatase enzymatic reac-tions. Brain Res. 447:314-324.
9.Bentivoglio, M. and S. Chen. 1993. Retrograde neu-ronal tracing combined with immunocytochemistry, p.301-328. In A.C. Cuello (Ed.), ImmunocytochemistryII. John Wiley & Sons, New York.
10.Bolam, J.P. 1992. Preparation of central nervous sys-tem tissue for light and electron microscopy, p. 1-29.In J.P. Bolam (Ed.), Experimental Neuroanatomy. APractical Approach. The Practical Approach Series, D.Rickwood and B.D. Hames (Eds.). Oxford UniversityPress, Oxford.
11.Bolam, J.P. and C.A. Ingham. 1990. Combined mor-phological and histochemical techniques for the studyof neuronal microcircuits, p. 125-198. In A. Björk-lund, T. Hökfelt, F.G. Wouterlood, and A.N. van denPol (Eds.), Handbook of Chemical Neuroanatomy.Elsevier Science Publishers, Amsterdam.
12.Brandt, H.M. and A.V. Apkarian. 1992. Biotin-dex-tran: a sensitive anterograde tracer for neuroanatomicstudies in rat and monkey. J. Neurosci. Methods45:35-40.
13.Brauer, K., G. Seeger, W. Härtig, S. Rossner, R. Poet-hke, J. Kacza, R. Schliebs, G. Brückner, and V. Bigl.1998. Electron microscopic evidence for a cholinergicinnervation of GABAergic parvalbumin-immunoreac-tive neurons in the rat medial septum. J. Neurosci. Res.54:248-253.
14.Bruce, K. and I. Grofova. 1992. Notes on a light andelectron microscopic double-labeling method combin-ing anterograde tracing with Phaseolus vulgaris leuco-agglutinin and retrograde tracing with cholera toxinsubunit B. J. Neurosci. Methods 45:23-33.
15.Chan, J., C. Aoki, and, V.M. Pickel. 1990. Optimiza-tion of differential immunogold-silver and peroxidaselabeling with maintenance of ultrastructure in brainsections before plastic embedding. J. Neurosci. Meth-ods 33:113-127.
16.Chang, H.T., H. Kuo, J.A. Whittaker, and N.G.Cooper. 1990. Light and electron microscopic analysisof projection neurons retrogradely labeled with Fluo-ro-Gold: notes on the application of antibodies to Flu-oro-Gold. J. Neurosci. Methods 35:31-37.
17.Chen, S. and G. Aston-Jones. 1995. Evidence thatcholera toxin B subunit (CTb) can be avidly taken upand transported by fibers of passage. Brain Res.674:107-111.
231
13. Tract Tracing Methods at the Ultrastructural Level
Merighi13-aucorr.qxd 5/23/02 8:32 PM Page 231

18.Clancy, B. and L.J. Cauller. 1998. Reduction of back-ground autofluorescence in brain sections followingimmersion in sodium borohydride. J. Neurosci. Meth-ods 83:97-102.
19.Cucchiaro, J.B. and D.J. Uhlrich. 1990. Phaseolus vul-garis leucoagglutinin (PHA-L): a neuroanatomical trac-er for electron microscopic analysis of synaptic circuit-ry in the cat’s dorsal lateral geniculate nucleus. J.Electron Microsc. Tech. 15:352-368.
20.Dado, R.J., R. Burstein, K.D. Cliffer, and G.J.Giesler, Jr. 1990. Evidence that Fluoro-Gold can betransported avidly through fibers of passage. Brain Res.533:329-333.
21.Deitch, J.S., K.L. Smith, J.W. Swann, and J.N. Turn-er. 1991. Ultrastructural investigation of neurons iden-tified and localized using confocal scanning lasermicroscope. J. Electron Microsc. Tech. 18:82.
22.Deller, T., C. Leranth, and M. Frotscher. 1994. Reci-procal connections of lateral septal neurons and neu-rons in the lateral hypothalamus in the rat: a combinedphaseolus vulgaris-leucoagglutinin and Fluoro-Goldimmunocytochemical study. Neurosci. Lett. 168:119-122.
23.Eldred, W.D., C. Zucker, H.J. Karten, and S. Yazulla.1983. Comparison of fixation and penetration en-hancement techniques for use in ultrastructural immu-nocytochemistry. J. Histochem. Cytochem. 31:285-292.
24.Ericson, H. and A. Blomqvist. 1988. Tracing of neu-ronal connections with cholera toxin subunit B: lightand electron microscopic immunohistochemistry. J.Neurosci. Methods 24:225-235.
25.Erisir, A., S.C. Van Horn, and S.M. Sherman. 1997.Relative numbers of cortical and brainstem inputs tothe lateral geniculate nucleus. Proc. Natl. Acad. Sci.USA 94:1517-1520.
26.Gerfen, C.R. and P.E. Sawchenko. 1984. An antero-grade neuroanatomical tracing method that shows thedetailed morphology of neurons, their axons and ter-minals: immunohistochemical localization of an axon-ally transported plant lectin, Phaseolus vulgaris leucoag-glutinin (PHA-L). Brain Res. 290:219-238.
27.Gerfen, C.R., P.E. Sawchenko, and J. Carlsen. 1989.The PHA-L anterograde axonal tracing method, p. 19-47. In L. Heimer and L. Záborszky (Eds.), Neu-roanatomical Tract Tracing Methods 2. Plenum Press,New York.
28.Huang, Q., D. Zhou, and M. DiFiglia. 1992. Neuro-biotin, a useful neuroanatomical tracer for in vivoanterograde, retrograde and transneuronal tract tracingand for in vitro labeling of neurons. J. Neurosci. Meth-ods 41:31-43.
29.Izzo, P.N. 1991. A note on the use of biocytin inanterograde tracing studies in the central nervous sys-tem: application at both light and electron microscop-ic level. J. Neurosci. Methods 36:155-166.
30.Joseph, K.C., S.U. Kim, A. Stieber, and N.K.Gonatas. 1978. Endocytosis of cholera toxin intoGERL. Proc. Natl. Acad. Sci. USA 75:2815-2819.
31.King, M.A., P.M. Louis, B.E. Hunter, and D.W.Walker. 1989. Biocytin: a versatile anterograde neu-roanatomical tract-tracing alternative. Brain Res.497:361-367.
32.Kosaka, T., I. Nagatsu, J.-Y. Wu, and K. Hama. 1986.Use of high concentrations of glutaraldehyde forimmunocytochemistry of transmitter-synthesizingenzymes in the central nervous system. Neuroscience18:975-990.
33.Lan, C.T., W.C. Wu, E.A. Ling, and C.Y. Chai. 1997.Evidence of a direct projection from the cardiovascu-lar-reactive dorsal medulla to the intermediolateral cellcolumn of the spinal cord in cats as revealed by lightand electron microscopy. Neuroscience 77:521-533.
34.Lanciego, J.L. and F.G. Wouterlood. 1993. Dualanterograde axonal tracing with Phaseolus vulgaris-leu-coagglutinin (PHA-L) and biotinylated dextran amine(BDA). Neurosci. Prot. 94-050:06-01-13.
35.Lapper, S.R. and J.P. Bolam. 1991. The anterogradeand retrograde transport of neurobiotin in the centralnervous system of the rat: comparison with biocytin. J.Neurosci. Methods 39:163-174.
36.Lima, D., J.A. Mendes-Ribeiro, and A. Coimbra.1991. The spino-latero-reticular system of the rat: pro-jections from the superficial dorsal horn and structuralcharacterization of marginal neurons involved. Neuro-science 45:137-152.
37.Ling, E.A., C.Y. Wen, J.Y. Shieh, T.Y. Yick, and W.C.Wong. 1991. Ultrastructural changes of the nodoseganglion cells following an intraneural injection ofRicinus communis agglutinin-60 into the vagus nervein hamsters. J. Anat. 179:23-32.
38.Llewellyn-Smith, I.J., and J.B. Minson. 1992. Com-plete penetration of antibodies into vibratome sectionsafter glutaraldehyde fixation and ethanol treatment:light and electron microscopy for neuropeptides. J.Histochem. Cytochem. 40:1741-1749.
39.Llewellyn-Smith, I.J., J.B. Minson, and P.M.Pilowsky. 1992. Retrograde tracing with cholera toxinB-gold or with immunocytochemically detectedcholera toxin B in central nervous system, p. 180-201.In P.M. Conn (Ed.), Methods in Neuroscience, Vol. 8.Academic Press, London.
40.Llewellyn-Smith, I.J., J.B. Minson, and P.M.Pilowsky. 1993a. The tungstate-stabilized tetramethyl-benzidine reaction for light and electron microscopicimmunocytochemistry and for revealing biocytin-filledneurons. J. Neurosci. Methods 46:27-40.
41.Llewellyn-Smith, I.J., P.M. Pilowsky, and J.B. Min-son. 1993b. Retrograde tracers for light and electronmicroscopy, p. 31-59. In J.P. Bolam (Ed.), Experimen-tal Neuroanatomy. A Practical Approach. The PracticalApproach Series, D. Rickwood, and B.D. Hames(Eds.). Oxford University Press, Oxford.
42.Llewellyn-Smith, I.J., J.B. Minson, A.P. Wright, andA.J. Hodgson. 1990. Cholera toxin B-Gold, a retro-grade tracer that can be used in light and electronmicroscopic immunocytochemical studies. J. Comp.Neurol. 294:179-191.
43.Llewellyn-Smith, I.J., C.L. Martin, L.F. Arnolda, andJ.B. Minson. 1999. Retrogradely transported CTB-saporin kills sympathetic preganglionic neurons. Neu-roreport 10:307-312.
44.Lozsádi, D.A. 1995. Organization of connectionsbetween the thalamic reticular and the anterior thala-mic nuclei in the rat. J. Comp. Neurol. 358:233-246.
45.Lübke, J. 1993a. Photoconversion of diaminobenzi-
232
I. Tavares et al.
Merighi13-aucorr.qxd 5/23/02 8:32 PM Page 232

dine with different fluorescent neuronal markers into alight and electron microscopic dense reaction product.Microsc. Res. Tech. 24:2-14.
46.Lübke, J. 1993b. Photoconversion of different fluores-cent substances for light and electron microscopy. Neu-rosci. Prot. 93-050:06-01-13.
47.Luppi, P.-H., P. Fort, and M. Jouvet. 1990. Ion-tophoretic application of unconjugated cholera toxin Bsubunit (CTb) combined with immunohistochemistryof neurochemical substances: a method for transmitteridentification of retrogradely labelled neurons. BrainRes. 534:209-224.
48.Manthy, P.W., S.D. Rogers, P. Honoré, B.J. Allen,J.R. Ghillardi, J. Li, R.S. Daughters, D.A. Lappi,R.G. Wiley, and D.A. Simone. 1997. Inhibition ofhyperalgesia by ablation of spinal lamina I neuronsexpressing substance P receptor. Science 278:275-279.
49.Marini, G., L. Pianca, and G. Tredici. 1996. Thalam-ocortical projection from the parafascicular nucleus tolayer V pyramidal cells in frontal and cingulate areas ofthe rat. Neurosci. Lett. 203:81-84.
50.Martin, W.J., N.K. Gupta, C.M. Loo, D.S. Rohde,and A.I. Basbaum. 1999. Differential effects of neuro-toxic destruction of descending noradrenergic path-ways on acute and persistent nociceptive processing.Pain 80:57-65.
51.Mauro, A., I. Germano, G. Giaccone, M.T. Giordana,and D. Schiffer. 1985. 1-naphtol basic dye (1-NBD).An alternative to diaminobenzidine (DAB) in immu-noperoxidase techniques. Histochemistry 83:97-102.
52.May, P.J., W. Sun, and W.C. Hall. 1997. Reciprocalconnections between the zona incerta and the pretec-tum and superior colliculus of the cat. Neuroscience77:1091-1114.
53.Menétrey, D. and C.L. Lee. 1985. Retrograde tracingof neural pathways with a protein-gold complex. II:electron microscopic demonstration of projections andcollaterals. Histochemistry 83:525-530.
54.Milner, T.A., J.R. Hammel, T.T. Ghorbani, R.G.Wiley, and J.P. Pierce. 1999. Septal cholinergic deaf-ferentation of the dentate gyrus results in a loss of asubset of neuropeptide Y somata and an increase insynaptic area on remaining neuropeptide Y dendrites.Brain Res. 831:322-336.
55.Naim, M.M., R.S. Spike, C. Watt, S.A.S. Shehab, andA.J. Todd. 1997. Cells in laminae III and IV of the ratspinal cord that possess the neurokinin-1 receptor andhave dorsally directed dendrites receive a major synap-tic input from tachykinin-containing primary affer-ents. J. Neurosci. 17:5536-5548.
56.Naim, M.M., S.A.S. Shehab, and A.J. Todd. 1998.Cells in laminae III and IV of the rat spinal cord whichpossess the neurokinin-1 receptor receive monosynap-tic input from myelinated primary afferents. Eur. J.Neurosci. 10:3012-3019.
57.Okada, E., T. Maeda, and T. Watanabe. 1982.Immunohistochemical study on cholera toxin bindingsites by monoclonal anti-cholera toxin antibody inneuronal culture. Brain Res. 242:233-241.
58.Paré, D. and Y. Smith. 1996. Thalamic collaterals ofcorticostriatal axons—their terminal field and synaptictargets in cats. J. Comp. Neurol. 372:551-567.
59.Pieribone, V.A. and G. Aston-Jones. 1988. The ion-
tophoretic application of Fluoro-Gold for the study ofafferents to deep brain nuclei. Brain Res. 475:259-271.
60.Pólgar, E., S.A.S. Shehab, C. Watt, and A.J. Todd.1999. GABAergic neurons that contain neuropeptideY selectively target cells with the neurokinin-1 recep-tor in laminae III and IV of the rat spinal cord. J. Neu-rosci. 19:2637-2646.
61.Reiner, A., C.L. Veenman, and M.G. Honig. 1993.Anterograde tracing using biotynilated dextran amine.Neurosci. Prot. 93-050:14-01-14.
62.Reynolds, E.S. 1963. The use of lead citrate at highpH as an electron opaque stain in electron microscopy.J. Cell Biol. 17:208-212.
63.Ribeiro-da-Silva, A., J.V. Priestley, and C. Cuello.1993. Pre-embedding ultrastructural immunocyto-chemistry, p. 181-227. In A.C. Cuello (Ed.), Immuno-histochemistry II. John Wiley & Sons, New York.
64.Roberts, R.C., C. Strain-Saloum, and R. Wiley. 1995.Effects of suicide transport lesions of the striatopallidalor striatonigral pathways on striatal ultrastructure.Brain Res. 701:227-237.
65.Schmued, L.C. and J.H. Fallon. 1986. Fluoro-Gold: anew fluorescent retrograde axonal tracer with numer-ous unique properties. Brain Res. 377:147-154.
66.Seeley, P.J. and P.M. Field. 1988. Use of colloidal goldcomplexes of wheat germ agglutinin as label for neuralcells. Brain Res. 449:177-181.
67.Sidibé, M. and Y. Smith. 1996. Differential innerva-tion of striatofugal neurones projecting to the internalor external segments of the globus pallidus by thalam-ic afferents in the squirrel monkey. J. Comp. Neurol.365:445-465.
68.Smith, Y. 1992. Anterograde tracing with PHA-L andbiocytin at the electron microscopic level, p. 61-79. InJ.P. Bolam (Ed.), Experimental Neuroanatomy. A Prac-tical Approach. The Practical Approach Series, D.Rickwood, and B.D. Hames (Eds.). Oxford UniversityPress, Oxford.
69.Smith, Y. 1993. Benzidine dihydrochloride: a substratefor immunoelectron microscopy. Neurosci. Prot. 93-050:03-01-07.
70.Sun, X.L., L.P. Tolbert, and J.G. Hildebrand. 1995.Using laser scanning confocal microscopy as a guidefor electron microscopic study: a simple method forcorrelation of light and electron microscopy. J. His-tochem. Cytochem. 43:329-335.
71.Tavares, I. and D. Lima. 1994. Descending projec-tions from the caudal medulla oblongata to the super-ficial or deep dorsal horn of the rat spinal cord. Exp.Brain Res. 99:455-463.
72.Tavares, I., D. Lima, and A. Coimbra. 1996. The ven-trolateral medulla of the rat is connected with thespinal cord dorsal horn by an indirect descending path-way relayed in the A5 noradrenergic cell group. J.Comp. Neurol. 374:84-95.
73.Tavares, I., D. Lima, and A. Coimbra. 1997. The pon-tine A5 noradrenergic cells which project to the spinalcord dorsal horn are reciprocally connected with thecaudal ventrolateral medulla in the rat. Eur. J. Neu-rosci. 9:2452-2461.
74.Tavares, I., A. Almeida, F. Esteves, D. Lima, and A.Coimbra. 1998. The caudal ventrolateral medullaryreticular formation is reciprocally connected with the
233
13. Tract Tracing Methods at the Ultrastructural Level
Merighi13-aucorr.qxd 5/23/02 8:32 PM Page 233

spinal cord. Society Neurosci. Abstr. 24:1132.75.Teune, T.M., J. Van der Burg, C.I. De Zeeuw, J.
Voogd, and T.J. Ruigrok. 1998. Single Purkinje cellcan innervate multiple classes of projection neurons inthe cerebellar nuclei of the rat: a light and ultrastruc-tural triple-tracer study in the rat. J. Comp. Neurol.392:164-178.
76.Todd, A.J. 1997. A method for combining confocaland electron microscopic examination of sectionsprocessed for double- or triple-labelling immunocyto-chemistry. J. Neurosci. Methods 73:149-157.
77.Todd, A.J., C. Watt, R.C. Spike, and W. Sieghart.1996. Colocalization of GABA, glycine, and theirreceptors at synapses in the rat spinal cord. J. Neurosci.16:974-982.
78.Totterdell, S. and G.E. Meredith. 1997. Topographicalorganization of projections from the entorhinal cortexto the striatum of the rat. Neuroscience 78:715-729.
79.Totterdell, S., C.A. Ingham, and J.P. Bolam. 1992.Immunocytochemistry I: pre-embedding staining, p.103-128. In J.P. Bolam (Ed.), Experimental Neu-roanatomy. A Practical Approach. The PracticalApproach Series, D. Rickwood, and B.D. Hames(Eds.). Oxford University Press, Oxford.
80.Trojanowsky, J.Q. and M.L. Schmidt. 1984. Interneu-ronal transfer of axonally transported proteins: studieswith HRP and HRP conjugates of wheat germ agglu-tinin, cholera toxin and the B subunit of cholera toxin.Brain Res. 311:366-369.
81.Van Blockstaele, E.J., A.M. Wright, D.M. Cestari,and V.M. Pickel. 1994. Immunolabeling of retro-gradely transported Fluoro-Gold: sensitivity and appli-cation to ultrastructural analysis of transmitter-specificmesolimbic circuitry. J. Neurosci. Methods 55:65-78.
82.Van der Want, J.J.L., J. Klooster, B. Nunes Cardozo,H. de Weerd, and R.S.B. Liem. 1997. Tract tracing inthe nervous system of vertebrates using horseradishperoxidase and its conjugates: tracers, chromogens andstabilization for light and electron microscopy. BrainRes. Protocols 1:269-279.
83.Veenman, C.L., A. Reiner, and M.G. Honig. 1992.Biotynilated dextran amine as an anterograde tracer forsingle- and double-labeling studies. J. Neurosci. Meth-ods 41:239-254.
84.Weedman, D.L. and D.K. Ryugo. 1996. Projectionsfrom auditory cortex to the cochlear nucleus in rats:synapses on granule cell dendrites. J. Comp. Neurol.371:311-324.
85.Weinberg, R.J. and S.L. van Eyck. 1991. A tetram-ethylbenzidine/tungstate reaction for horseradish per-oxidase histochemistry. J. Histochem. Cytochem.39:1143-1148.
86.Wiley, R.G. 1992. Neural lesioning with ribosome-inactivating proteins: suicide transport and immunole-sioning. Trends Neurosci. 15:285-290.
87.Wiley, R.G. and D.A. Lappi. 1993. Preparation ofanti-neuronal immunotoxins for selective neuralimmunolesioning. Neurosci. Prot. 93-020:02-01-12.
88.Wiley, R.G., W.W. Blessing, and D.J. Reis. 1982. Sui-cide transport: destruction of neurons by retrogradetransport of ricin, abrin and modeccin. Science216:889-890.
89.Wouterlood, F.G. and B. Jorritsma-Byham. 1993. Theanterograde neuroanatomical tracer biotynilated dex-tran-amine: comparison with the tracer Phaseolus vul-garis-leucoagglutinin in preparations for electronmicroscopy. J. Neurosci. Methods 48:75-87.
90.Wouterlood, F.G., P.H. Goede, and H.J. Groenewe-gen. 1990. The in situ detectability of the neu-roanatomical tracer Phaseolus vulgaris-leucoagglutinin(PHA-L). J. Chem. Neuroanat. 3:11-18.
91.Wouterlood, F.G., Y.M.H.F. Sauren, and A. Pattise-lanno. 1988. Compromises between penetration ofantisera and preservation of ultrastructure in pre-embedding electron microscopic immunocytochem-istry. J. Chem. Neuroanat. 1:65-80.
92.Zhou, M. and I. Grofova. 1995. The use of peroxidasesubstrate Vector® VIP in electron microscopic singleand double antigen localization. J. Neurosci. Methods62:149-158.
234
I. Tavares et al.
Merighi13-aucorr.qxd 5/23/02 8:32 PM Page 234

235
OVERVIEW
The balance between cell proliferationand death is fundamental in several mor-phogenetic processes and ultimately deter-mines the mass, shape, and function of thevarious tissues and organs that form theanimal body. Apoptosis is a gene-regulatedprocess of programmed cell death (PCD)that plays fundamental roles in several nor-mal and pathological conditions (56,126).This form of “cell suicide” is most oftendetected during embryonic development,but is also found in normal cell and tissueturnover (26,77,81,133). Although thenervous tissue is traditionally regarded asbeing fundamentally constituted by post-mitotic nonproliferating cells, analysis ofcell proliferation and apoptosis in vivo hasrecently gained an increasing importancemainly considering that: (i) proliferativeand/or apoptotic events have been exten-sively characterized not only during embry-onic development but also in several areasof the postnatal and adult brain (9,10,46,63–65,79,97,101); (ii) trophic factordeprivation often results in apoptotic celldeath of target neurons (25,82,131); and
(iii) links have been hypothesized betweenapoptosis and signal transduction (31,60).
We describe here a series of techniquesthat are currently employed in our labora-tory for the detection of proliferating andapoptotic cells in the central nervous sys-tem (CNS) directly on tissue sections bothat light and electron microscopic level. Wewill also briefly consider some biochemicalassays that may be of relevance for a morein-depth characterization of the apoptoticprocess in neural cells.
BACKGROUND
Identification of Proliferating Cells In Vivo
Direct observation of mitotic cells (i.e.,the estimation of the mitotic index) in tis-sue sections is clearly insufficient for a cor-rect estimation of the proliferating index(percentage of dividing cells) due to the(relatively) short duration of the M phaseof the cell cycle and asynchronism of mito-ses. Routinely used methods rely on thepossibility of: (i) labeling proliferating cellsduring the S phase of their cycle by incor-
Cellular and Molecular Methods in Neuroscience ResearchEdited by A. Merighi and G. Carmignoto
In Vivo Analysis of Cell Proliferationand Apoptosis in the CNS
Laura Lossi1,2, Silvia Mioletti1, Patrizia Aimar1,2, Renato Bruno1,and Adalberto Merighi1,2,3
1Department of Veterinary Morphophysiology, 2Neuroscience ResearchGroup, and 3Rita Levi Montalcini Center for Brain Repair, Universitàdegli Studi di Torino, Torino, Italy, EU
14
Merighi14-aucorr.qxd 5/23/02 8:37 PM Page 235

poration of exogenously administerednucleotide analogues into the newly syn-thesized DNA. These exogenous labels aresubsequently visualized by appropriate pro-cedures (see below); and (ii) directly visual-ize in situ certain molecules that are ex-pressed during different phases of the cellcycle once the cell is committed to divisionand are therefore regarded as specific mark-ers of cell proliferation.
The former methods are based on theuse of radiolabeled nucleotides (usually tri-tiated tymidine) or nucleotide analoguessuch as the 5-bromodeoxyuridine (BrdU)or the 5-iododeoxyuridine (IdU) that arespecifically incorporated into the DNA andare subsequently visualized by autoradiog-raphy or immunocytochemistry. Thesemethods are highly specific and allow for aprecise identification of the proliferatingcells and a correct estimation of the prolif-erating index. Historically, the isotopicmethods were developed first and havebeen widely employed for analysis of prolif-erative events into the developing andimmature CNS (see for example References2–9). Nonradioactive BrdU labeling is nowgenerally employed as the technique ofchoice because of its simplicity and lack ofsafety restrictions linked to the handling ofradioactive material (22,36,69,99,100).The isotopic and nonisotopic methods areperfectly overlapping in terms of specificityand, after an initial suspicion that theimmunocytochemical labeling was less sen-sitive, can be safely considered as equivalentalso under this aspect. Several anti-BrdUmonoclonal antibodies are now commer-cially available that can be successfullyemployed to label in situ proliferating cellsfollowing the systemic administration ofthe tracer, usually following the intraperi-toneal route. In addition, some antibodiesallow for the specific detection of BrdU orIdU and can be employed for dual labelingsin time window experiments (see alsoResults and Discussion), which have
opened the possibility to perform cell cyclekinetic studies (17,24,57,68,69,93,130).
An interesting feature of all these meth-ods is that once the marker has been incor-porated into the parent cell DNA, it is thenequally divided between the two daughtercells. Therefore, the label can be tracedover several cell generations, according tothe cell cycle kinetic parameters and thelength of animal survival. By calculatingthe time necessary for the halving of thetracer into the newly generated cells, it isthus possible to obtain reliable informationon the length of the different phases of thecell cycle. To this purpose, quantitativeestimation of silver grains after autoradiog-raphy has proved to be very useful andhighly reliable (16).
The immunocytochemical methodsrelying on the visualization of specificmarkers for proliferating cells have encoun-tered some favor in the recent past, mainlyfor studies on human material or retrospec-tive animal samples in which the experi-mental administration of the isotopic and/or nonisotopic nucleotides is not practica-ble for obvious reasons. A number of mol-ecules which are associated with differentphases of the cell cycle have been isolatedso far. Specific antibodies raised against atleast some of them, such as for example theKi67 nuclear antigen (50,89,91) and theproliferating cell nuclear antigen (PCNA)(103,121), allow for detection on tissuesections of frozen and/or wax-embeddedmaterial. Other molecules, which havebeen proposed as cell proliferation markers,are more indirectly linked to the cell cycleevents and, in general terms, offer an esti-mate of certain metabolic activities thatmay be increased during the proliferativestatus. A list of the most commonly usedmarkers of cell proliferation is reported inTable 1. There are some obvious advan-tages and disadvantages linked to the use ofthese endogenous markers as a tool foridentifying proliferating cells in compari-
236
L. Lossi et al.
Merighi14-aucorr.qxd 5/23/02 8:37 PM Page 236

son with the methods relying on the label-ing of newly synthesized DNA. Among theadvantages one has first to consider thetechnical simplicity and, second, thatexperimental labeling in vivo is notrequired. The disadvantages include someuncertainty regarding the real specificity ofthese markers considering the possibilitythat at least some of them may not beexpressed only in cells which are in theprocess of their division and/or committedto division. This caution may be substanti-ated by the observations indicating that: (i)some of these molecules persist for a moreor less extended period of time in postmi-totic elements; and (ii) fixation and tissueprocessing may significantly alter the pat-tern of staining (24,90). This aspect is par-ticularly relevant under certain experimen-tal conditions in which one has the need tocarefully label a proliferating cell popula-tion in a restricted temporal window. Fur-ther details are given in Table 1.
Identification of Apoptotic Cells In Vivo
Apoptotic cells can be directly visualizedin tissue sections by several means. Availablemethods include the use of fluorescent nu-clear, cytoplasmic and membrane stains,Annexin V binding assay, ultrastructuralanalysis, single-stranded DNA monoclonalantibodies, immunostaining for molecularmarkers of apoptosis, and molecular biologytechniques. Because no single parameterdefines apoptosis in all systems, reliabledetection (and quantification) of apoptoticcells may require a combination of strategies.
Fluorescent Nuclear Stains
Several fluorescent nuclear stains includ-ing propidium iodide (PI), 4′,6-diamidino-2-phenylindole (DAPI), a number ofHoechst dyes, SYTOX® Green, severalSYTO® stains, and YO-PRO-1 iodide
(the last three from Molecular Probes,Eugene, OR, USA), and ethidium homod-imer-2 (EthD-2) have been proposed astools for the identification of apoptoticcells in the fluorescence–confocal micro-scope and/or (less relevant to the purposeof this discussion) by flow and laser scan-ning cytometry. Basically, these dyes bindto the cell DNA and can be divided into 2main categories according to their capabil-ity of penetrating (permeant dyes) or notpenetrating (impermeant dyes) the intactplasma membrane of living cells.
The cell impermeant PI (59) and EthD-2 can be used to stain dead cells. Hoechst33342 (Bisbenzimide) is a cell permeantDNA binding dye that shows intense fluo-rescence when bound to the condensedchromatin in apoptotic cells (100). Thepermeability of this stain to cell mem-branes theoretically allows for the stainingof cells at very early stages of the apoptoticprogram when plasma membranes are stillintact. YO-PRO-1 iodide is a nucleic acidstain that crosses the plasma membranes ofapoptotic cells brightly staining dying cellswith a green fluorescence. YO-PRO-1 stainenters apoptotic cells at a stage when otherdyes such as PI are still excluded (33).
SYTOX Green is virtually nonfluores-cent when free in solution, but becomesbrightly fluorescent when binding tonucleic acids with excitation and emissionpeaks similar to fluorescein.
SYTO 13 was used in conjunction withPI to study apoptosis in cerebellar granulecells (11).
Fluorescent Cytoplasmic and MembraneStains
As for the nuclear stains, many of thecytoplasmic and membrane dyes have beendeveloped for use in flow cytometric analy-sis. However, the possibility to image slicepreparations of living tissue by laser scan-ning confocal microscopy (see Chapter 15)
237
14. In Vivo Analysis of Cell Proliferation and Apoptosis in the CNS
Merighi14-aucorr.qxd 5/23/02 8:37 PM Page 237

238
L. Lossi et al.
Table 1. Markers of Cell Proliferation in Use (or of Potential Interest) for CNS Analysis
Marker Main Characteristics and Biological Activity References Comments
PCNA/Cyclin 36 kDa polypeptide which acts as an auxiliary protein 18,24,27,72, • PCNA persists for a certain period of time in(mAb PC10) of DNA polymerase δ and is expressed at the 103,128 daughter cells after division has occurred.
transition of the phases G1/S of the cell cycle. • There is the possibility that under certain conditions of fixation the molecule is detected incells which are not committed to division (phase G0).
Ki-67 nuclear antigen Nonhistone protein containing 10 ProGluSerThr (PEST) 38,50,89,92, • Ki-67 is likely the most reliable marker of cell proliferation.(MAbs Ki-67, KiS5, motifs which are associated with high turnover proteins 95,114,117, •The Ki-67 antibody (mib-1) recognizes an epitopeand mib-1) and plays a pivotal role in maintaining cell proliferation. 118 detected, besides to humans, in several mammals (rat,
It is expressed in the G1, S, G2 and M phases of the rabbit, calf, lamb, dog). In other species, staining is weakcell cycle, but not in G0. (mouse) or totally absent (swine, cat, chicken, pigeon).
DNA polymerase α Key enzyme in DNA synthesis whose levels of activity 84gradually decrease during development.
Topoisomerase IIα DNA-modifying enzyme. The α isozyme has a role in 115,122,134 • Transcription of the topoisomerase II (MAb kiS4) cell proliferation and is expressed in the S, G2, and αmRNA closely correlates with expression of
M phases. BrdU in the developing rat brain.βmRNA has a generalized distribution in the developing brain.
MAb kiS2 The antibody recognizes a 100 kDa protein (p100) 87highly expressed in cells at the G1/S transition and persisting through G2 and M phase.
repp-86 Proliferation-specific protein (p86) expressed exclusively 20in the S, G2, and M phases of the cell cycle.
Telomerase Cellular reverse transcriptase that helps to provide 54,116,125, • Telomerase is expressed in highly proliferativegenomic stability by maintaining the 129 normal, immortal, and tumor cells.integrity of the chromosome ends, the telomeres.
Casein-kinase 2α Growth-related serine/threonine protein kinase. 70 • Expression of the molecule is mainly related to cell growth.
Transferrin receptor Glycoprotein participating in transferrin uptake. 105 • The transferrin receptor is expressed in all cells (except forerytrocytes) but it is particularly abundant in proliferating cells.
Statin Nuclear protein specifically expressed in quiescent 113(noncycling) G0-phase cells.
MAb Th-10a The antibody is specific for a 95 kDa nuclear protein 71appearing in the S phase of the cell cycle in normal mouse thymocytes.
Argyrophilic nucleolar Proteins that accumulate in highly proliferating cells. 98,112,139 • AgNORs are estimated in situ by quantification of the level oforganizer region Expression is low for G1 phase and high for S-G2 phase. silver staining using morphometry and image analysis.proteins (AgNORs)

makes them of potential interest also forthe detection of apoptotic cells in situ.These stains can be used to visualize apop-totic cells, basically by taking advantage ofcertain metabolic alterations which moreor less specifically take place during PCD.
Reduction of the intracellular pH oftenoccurs as an early event in apoptosis andmay be preceding DNA fragmentation (66).The fluorescent carboxy dye SNARF®-1(Molecular Probes) is a dual pH emissionindicator that shifts from deep red (about640 nm) in basic conditions to yellow-orange (about 580 nm) under acidic pH.The cell permeant acetoxymethyl (AM)esther can be added directly to the incuba-tion medium, and the dye becomes trappedinto the cells after hydrolyzation of theesther groups within the cytosol. Shifting ofthe emission spectrum allows for monitor-ing changes in the intracellular pH.
A similar principle is at the basis of theuse of the calcium indicators fluo-3, fura-2,and indo-1-AM (see Chapter 15) to studychanges of intracellular Ca2+ concentration([Ca2+]i) in living cells. Changes in [Ca2+]iare associated with numerous functionalevents within the cell, among which isapoptosis (13,75,85).
Increased oxidative activity is anotherearly event in apoptosis. Numerous dihydro,colorless, nonfluorescent leuco-dye deriva-tives of fluorescein and rhodamine are read-ily oxidized back to the fluorescent parentdye and can thus be used as fluorogenicprobes for detecting apoptosis (34,44,53).
Other fluorescent probes can be used tomonitor apoptosis-induced mitochondrialmembrane depolarization (Mito Tracker®
Red CMX Ros; Molecular Probes) ordepletion of reduced glutathione in apop-totic cells (monochlorobimane [mBCl]and monobromobimane [mBBr]; see Ref-erences 12 and 41).
Finally, the dye Merocyanine 450 under-goes an increase in fluorescence with theloss of cell membrane asymmetry in corre-
lation to the translocation of membranephosphatidylserine (PS), which occurs inapoptotic cells (see the section Annexin VBinding Assay and Reference 32).
All the above nuclear, cytoplasmic, andmembrane fluorescent stains are useful todistinguish live cells, dead cells, and apop-totic cells by flow cytometry. However, ingeneral terms, their properties make themnot satisfactory if not unsuitable for in situdetection, if one needs to stain fixed cells.
Annexin V Binding Assay
Annexin V is a 35.8 kDa protein thatpossesses a strong anticoagulant activityand belongs to a family of proteins withhigh calcium-dependent activities foraminophospholipids, among which is PS(32). This latter is a major component ofplasma membranes and is usually almostcompletely segregated to the cytoplasmicface of the membrane. Early in apoptosis,PS is externalized as a means of recognitionand uptake of apoptotic cells by phagocytes(39). The usefulness of fluorochrome-Annexin V conjugates (Annexin V-fluores-cein isothiocyanate [FITC] and AnnexinV-Cy3) as tools for the visualization ofapoptotic cells has been demonstrated byseveral authors, mainly in cultured cells(136), but they can be potentially utilizedalso for the in vivo analysis of apoptoticcells in unfixed tissues as discussed abovefor the fluorescent stains.
Ultrastructural Analysis
Apoptosis is characterized by a series ofstereotyped ultrastructural changes in cellmorphology, and thus, electron microscopyrepresents an ideal tool for an unequivocalidentification of apoptotic cells. Dying cellsmay adopt one of at least three differentmorphological types which have beenreferred to as apoptotic, autophagic, andnonlysosomal vesiculate (30). Changes in
239
14. In Vivo Analysis of Cell Proliferation and Apoptosis in the CNS
Merighi14-aucorr.qxd 5/23/02 8:37 PM Page 239

cell ultrastructure during apoptosis affectboth nuclear and cytoplasmic morphology.Nuclear changes include chromatin con-densation, blebbing of nuclear membranes,and fragmentation of the nucleus into high-ly electron-dense apoptotic bodies. Cyto-plasmic changes consist of condensationand fragmentation of the cell body intomembrane-bound vesicles, which containribosomes, morphologically intact mito-chondria, and nuclear material. To the pur-pose of the present discussion, it must bestressed that all of these changes take placein rather late stages of the apoptotic pro-gram (see the section Molecular BiologyTechniques and Results and Discussion),and that apoptotic cells are rapidly clearedfrom tissue by phagocytes. This explainswhy ultrastructural analysis is often insuffi-cient to the detection of apoptosis in tissuesections unless a very large population ofcells are undergoing PCD. Therefore, al-though ultrastructural analysis is perhapsthe most specific tool for the identificationof apoptotic cells in situ, it suffers from sev-eral pitfalls mainly related to the dramatical-ly low degree of sensitivity of this procedure.
Single-Stranded DNA MonoclonalAntibodies
Specific monoclonal antibodies to stainsingle-stranded DNA can be used to local-ize in situ cells undergoing PCD. Single-stranded DNA is produced in apoptoticcells as a consequence of an increased sensi-tivity of the nucleic acid to thermal denat-uration (for review see Reference 45). Thecritical step in this procedure is the heatingof tissues in conditions that prevent ther-mal denaturation of DNA in situ in non-apoptotic cells but induce DNA denatura-tion in apoptotic nuclei. Under optimalexperimental conditions, staining of single-stranded DNA with specific monoclonalantibodies nicely correlates with the apop-totic morphology of positive cells. More-
over, at least in certain cell types, it detectsearly apoptotic events already at a stageprior to chromatin condensation and inthe absence of intranucleosomal DNAfragmentation and allows for the distinc-tion of apoptosis and necrosis.
Immunostaining for Molecular Markers ofApoptosis
A few intracellular proteins normallyexpressed inside cells have been shown tobe translocated onto the cell surface dur-ing PCD, thereby allowing apoptotic cellsto be distinguished from normal cells, aspreviously described for PS. A number ofantibodies have been raised against thevarious molecules that appear to beinduced and/or activated during apopto-sis, including tissue glutaminase (42,80),the CD44 cell surface adhesion molecule(73), the activated type 1 insulin-likegrowth factor receptor (86), and a mito-chondrial membrane antigen that is specif-ically recognized by the 7A6 monoclonalantibody, which was developed by immu-nizing mice with apoptotic Jurkat cells(135). Finally, a series of antibodies and insitu hybridization probes for a number ofpositive or negative effector proteins ofapoptosis such as bcl-2 (19,58) or caspase3 (see the section Activation of ApoptoticCaspases and References 35 and 102) havebeen made available.
As it is often the case, the search for the“Holy Grail” marker of apoptosis is stillongoing, and the results obtained with thisapproach need to be interpreted with cau-tion, since in most cases the specificity ofat least some of the markers mentionedabove needs further confirmation.
Molecular Biology Techniques
DNA fragmentation in small size oligo-mers (127) is a biochemical hallmark ofapoptosis producing what has been referred
240
L. Lossi et al.
Merighi14-aucorr.qxd 5/23/02 8:37 PM Page 240

to as nucleosomal DNA “ladders”. Thisfeature can be appreciated after electro-phoretic separation of DNA in agarose gelsand is a consequence of the action of DNAnucleases on the chromatin to producedouble-stranded DNA fragments with asize reflecting oligomers of the nucleo-somes (see the section Biochemical Assaysfor Apoptosis).
An important advance in the detectionof dying cells in situ by light and fluores-cence microscopy was the development ofa series of molecular biology protocolswhich can be generally referred to as in situend-labeling (ISEL) techniques. Each ofthese ISEL techniques utilizes a differentDNA modifying enzyme to attach labelednucleotides to the free ends of fragmentedDNA. In fact, cleavage of the DNA duringthe apoptotic process may yield double-stranded mono- and/or oligonucleosomesof low molecular weight, as well as “nicks”(single strand breaks) in high molecularweight DNA. These DNA strand breakscan be detected by enzymatic labeling ofthe free 3′ OH termini with modifiednucleotides, usually dUTP linked to a fluo-rochrome, biotin, or digoxigenin (DIG).
The ISEL techniques include the in situnick translation with DNA polymerase I(51,55) or unmodified T7 polymerase(123), the end labeling with terminaldeoxynucleotidyl transferase (TdT)(49,51), and the ligation of DIG-labeled dou-ble-stranded DNA fragments with T4DNA ligase (37).
DNA polymerase I catalyzes the tem-plate-dependent addition of nucleotideswhen one strand of a double-stranded DNAmolecule is nicked. Theoretically, by suchan approach, not only the apoptotic DNAis detected, but also the random fragmenta-tion of DNA by multiple endonucleasesoccurring in cellular necrosis and as a conse-quence of nonproper tissue handling.
Unmodified T7 DNA polymerase is ahighly processive DNA template-depen-
dent 5′-3′ polymerase and a 3′-5′ exonucle-ase for 3′ OH acceptor groups at recessed,blunt, or overhanging ends. To detectapoptotic cells, the enzyme is utilized, first,to generate 5′ overhangs from any 3′ OHacceptor groups at DNA strand breaks, andsecond, to end-fill the overhangs andincorporate biotinylated dATP (123).
TdT is an unusual type of DNA poly-merase found only in lymphocyte precur-sors at early stages of their differentiation(28,108). It catalyzes the template-inde-pendent addition of deoxyribonucleosidetriphosphates to the 3′ OH ends of dou-ble- or single-stranded DNA. The nick endlabeling with TdT (TUNEL = TdT-medi-ated dUTP nick end labeling) is consideredto be more sensitive, faster, and specificthan the template-dependent nick transla-tion (108). This method for labeling apop-totic cells in situ has been successfullyemployed also at the electron microscopelevel. For ultrastructural examination, TdTwas used to enzymatically link 11-digoxi-geninated-dUTP to fragmented DNA inapoptotic cells in conjunction with anti-DIG gold-labeled antibodies (67,76).
T4 DNA ligase was used to ligate in situdouble-stranded DNA fragments labeledin vitro with DIG (or Texas Red) toDNA double-strand breaks with singlebase 3′ overhangs as well as blunt ends inapoptotic nuclei (37,63). This approachhas been shown to be very specific forapoptotic DNA, avoiding the false positiveresults that can derive by DNA damagefrom necrosis, in vitro autolysis, peroxidetoxicity, and heating.
Biochemical Assays for Apoptosis
Biochemical assays have been mainlydeveloped for assessment of apoptosis incultured cell systems and/or tissue extracts.Although these methods are not directlyrelated to the main topic of this chapter, wewill briefly review the most widely em-
241
14. In Vivo Analysis of Cell Proliferation and Apoptosis in the CNS
Merighi14-aucorr.qxd 5/23/02 8:37 PM Page 241

ployed protocols, considering that, in manyinstances, they are of value to confirm thetrue apoptotic nature of dead cells after insitu detection (see Results and Discussion).
Detection of DNA Fragmentation
As previously mentioned, agarose gelelectrophoresis of DNA extracted fromcells or tissues represents an extremely spe-cific method to ascertain the presence ofapoptosis. The formation of nucleosomalDNA ladders during PCD is a consistentfinding in those experimental systemswhere a significant population of cells cansimultaneously be induced to die throughapoptosis (for review see Reference 29).However, nucleosomal DNA ladders havenot been generally or routinely observed inseveral adult tissues where apoptosis isongoing as a part of the normal cellturnover, or during normal tissue develop-ment, and were not consistently detectedin a number of experimental cell systems(14,96). Indeed, the technique has low sen-sitivity, and millions of cultured cells ormilligrams of tissue are required to extractsufficient amounts of DNA for analysis. Inaddition, the quantitative estimation of theextent of intranucleosomal DNA fragmen-tation in a stained gel relies on optical den-sitometry and is not so technically straight.DNA nucleosomal ladders might not havebeen detected in normal tissues becauseapoptosis was asynchronous and/or itoccurred in a comparatively small popula-tion relative to the majority of survivingcells (for discussion see Reference 29).
To at least partly overcome these prob-lems, some alternatives have been proposedsuch as the direct gel-based DNA fragmen-tation assays using radioisotopes orbiotinylated nucleotides (96,123), the liga-tion-mediated polymerase chain reaction(PCR) fragmentation assay (29), and anenzyme-linked immunosorbent assay(ELISA) TdT detection method for cells
prelabeled with BrdU (53). Commerciallyavailable kits also include a cell deathdetection method based on the assessmentof intranucleosomal DNA fragmentationby an antihistone monoclonal antibodyusing an ELISA procedure (23,43,119).
Activation of Apoptotic Caspases
The term caspases (caspase = cysteineaspartate protease) is used to indicate afamily of cysteine proteases cleaving anaspartic acid residue which are thought tomediate very early stages of apoptosis(1,132). All these proteins are synthesizedas pro-enzymes and are activated followinga cleavage at aspartate residues that couldbe themselves the site of attack for othermembers of the family. Caspases are likelythe most important effector molecules sofar described for triggering the cellularapoptotic machinery. At present, the mam-malian caspase family consists of ten mem-bers (1), the most intensively studied ofwhich is caspase-3 (previously referred to asCPP32, Yama, or Apopain; see References40 and 74). Caspase-3 is usually detectedin the cell cytosol as an inactive precursorthat is activated when cells undergo apop-tosis (94,120). Several assays have beendeveloped so far for the quantitative esti-mation of caspase-3 activity. The mostwidely employed substrate for detection isthe tetrapeptide DEVD, which has beenconjugated with colorimetric or fluoro-genic substrates (137).
Cleavage of Poly-ADP-Ribose Polymerase
Poly-ADP-ribose polymerase (PARP) isa 113 kDa protein that binds specifically atDNA strand breaks and appears to beinvolved in DNA repair and genome sur-veillance and integrity at the onset of apop-tosis. PARP is a substrate for certain cas-pases, including caspase-3 and -7, which,as mentioned above, are activated during
242
L. Lossi et al.
Merighi14-aucorr.qxd 5/23/02 8:37 PM Page 242

early activation of the apoptotic pathway.The active form of caspase-3 is capable tocleave PARP at its consensus site, theDEVD tetrapeptide. Caspases cleave PARPto fragments of approximately 89 and 24kDa (74). Detection of the 89 kDa PARPfragment with an anti-PARP antibody inwestern blotting represents a specific toolfor detection of apoptosis.
PROTOCOLS
Protocol for Labeling Proliferating CellsIn Vivo
Materials and Reagents
• BrdU (Sigma, St. Louis, MO, USA).• IdU(Sigma).
Procedure
1. Dissolve BrdU or IdU in distilled wateror physiological saline at a final con-centration of 100 mg/mL. IdU is notreadily soluble at physiological pH.Therefore predilution in a smallamount of alkalinized distilled water(by addition of some drops of 4 NNaOH) is necessary.
2. Inject intraperitoneally the appropriateamount of the drug (0.1 mg/g bodyweight) and allow animals to survivefor the required time.
Protocol for the UltrastructuralVisualization of BrdU/IdU-Labeled Cells
Materials and Reagents
• Syringe filters; pore size 0.22 µm(Whatman, Maidstone, England, UK).
• 200 to 300 Mesh nickel grids (Elec-tron Microscopy Science, Fort Wash-ington, PA, USA).
• Sodium metaperiodate (Sigma).• Bovine serum albumin, Fraction V
(BSA; Sigma).• Triton® X-100. • Normal goat serum (NGS; Sigma).• Bispecific mouse monoclonal antibody
to BrdU/IdU (Caltag Laboratories,Burlingame, CA, USA).
• Monospecific mouse monoclonal anti-body to BrdU (Amersham PharmaciaBiotech, Buckinghamshire, England,UK).
• Goat antimouse IgG gold conjugates(20 or 30 nm) (British BioCell Inter-national, Cardiff, Wales, UK).
Procedure
1. Collect ultrathin sections onto uncoat-ed nickel grids (see also Protocols inChapter 10).Incubate sections for 5 minutes withsodium metaperiodate to remove osmi-um tetroxide.
3. Wash with 0.5 M TBS (Tris-bufferedsaline; pH 7.2–7.6) containing 1% Tri-ton X-100 to facilitate contact betweenthe hydrophobic surface of the sectionand immunoreagents.
4. Incubate grids1 hour at room tempera-ture in NGS to reduce aspecific back-ground.
5. Transfer over drops of the bispecificmouse monoclonal antibody toBrdU/IdU diluted 1:10 in TBS/BSAand incubate overnight at room tem-perature.
6. Wash sections with 3 washes ofTBS/BSA.
7. Incubate with 20 nm antimouse IgGgold conjugate diluted 1:15 inTBS/BSA for 1 hour at 37°C.
8. Rinse in TBS/BSA (3 times, for 10minutes each).
243
14. In Vivo Analysis of Cell Proliferation and Apoptosis in the CNS
Merighi14-aucorr.qxd 5/23/02 8:37 PM Page 243

9. Postfix in 2.5% glutaraldehyde for 10minutes and wash in double-distilledwater.
10. Leave grids to dry at room temperatureprotected from dust.
11. The same procedure is then applied onthe other side of the grid using theundiluted monospecific mouse mono-clonal antibody anti-BrdU and the anti-mouse IgG gold conjugate of 30 nm.
Protocol for Labeling Apoptotic Cells InSitu at the Light Microscopy Level
Materials and Reagents
• Proteinase K (Sigma).• Digoxigenin-11′-2′-3′-dideoxy-uri-
dine-5′ thriphosphate (DIG-11-ddUTP) (Roche Molecular Biochemi-cals, Mannheim, Germany).
• TdT (Roche Molecular Biochemicals).• AntiDIG-alkaline phosphatase Fab frag-
ments (Roche Molecular Biochemicals).• Nitro blue tetrazolium (NBT; Sigma).• 5-Bromo-3-inolylphosphate p-tolui-
dine salt (BCIP; Sigma). • BSA.
Procedure
1. Strip proteins from tissue sections byincubation in proteinase K (20 µg/mL)for 15 minutes.
2. Extensively wash in double-distilledwater.
3. Rinse in terminal transferase buffer(TdT buffer: 130 mM Trizma base,pH 6.5, 140 mM sodium cacodylate, 1mM cobalte chloride).
4. Incubate sections in TdT buffer con-taining terminal transferase (0.05 U/µL) and DIG-11-ddUTP (2 nM/mL)at 37°C for 120 minutes in a humidchamber.
5. Stop the reaction by transferring sec-tions in terminal buffer (TB: 300 mMsodium chloride, 30 mM sodium cit-rate) for 15 minutes.
6. Rinse in double-distilled water andincubate in 2.5% BSA for 10 minutes.Wash in phosphate-buffered saline(PBS).
7. Incubate overnight in the anti-DIG-alkaline phosphatase Fab fragmentsdiluted 1:5000 in PBS.
8. Reveal the alkaline phosphatase reac-tion using the NBT/BCIP procedureunder continuous microscope moni-toring.
9. Terminate the reaction by incubationin STM buffer (Tris 100 mM, NaCP100 mM, MgCP 1 mM).
10. Slides are counterstained (optional),dehydrated, and mounted.
Protocol for Labeling Apoptotic Cells InSitu at the Electron Microscopy Level
Material and Reagents
• DIG-11-ddUTP. • TdT.• Anti-DIG gold-labeled conjugate with
10 nm particles (British BioCell Inter-national).
• BSA.
Procedure
1. Grids with epoxy sections are washedwith TdT buffer (see previous proto-col).
2. Incubate grids in TdT buffer contain-ing terminal transferase (0.05 U/µL)and DIG-11-ddUTP (2 nM/mL) at37°C for 120 minutes in a humidchamber.
3. Stop the reaction by transferring sec-tions in terminal buffer (TB: 300 mM
244
L. Lossi et al.
Merighi14-aucorr.qxd 5/23/02 8:37 PM Page 244

sodium chloride, 30 mM sodiumcitrate).
4. Rinse grids (3 times for 10 minuteseach) with 0.5 M TBS, pH 7.2 to 7.6,containing 1% BSA (TBS/BSA).
5. Incubate in the same buffer with theanti-DIG gold-labeled conjugate at37°C for 1 hour.
6. Wash sections again in TBS/BSA (3times for 10 minutes each).
7. Postfix (10 minutes) in 2.5% glutaralde-hyde in sodium cacodylate buffer.
8. Wash extensively in double-distilledwater and leave to dry at room temper-ature.
9. Counterstain with Reynold’s lead cit-rate and uranyl acetate.
Preparation of Cerebellum Extracts
Materials and Reagents
• Triton X-100.• EDTA (Sigma).• Phenenylmethylsulfonyl fluoride (PM-
SF; Sigma).• Aprotinin (Sigma).• Leupeptin (Sigma).• Homogenizer (e.g., Polytron; Glen
Mills, Clifton, NJ, USA).• Ultracentrifuge (e.g., Beckman Instru-
ments, Fullerton, CA, USA).
Procedure
1. After animal euthanasia, remove thecerebellum, strip the meninges, andwash 2 times with cold NaCl 0.9%.
2. Suspend the cerebellum in 2.5 volumesof a cold general lysis buffer (20 mMTris, pH 8.0, 10 mM NaCl, 0.5% Tri-ton X-100, 5 mM EDTA, 3 mMMgCl2) containing protease inhibitors(1 mM PMSF, 1 mg/mL leupeptin,
and 5 mg/mL aprotinin).3. Homogenize gently.4. Centrifuge the homogenate at 105× g
for 1 hour at 4°C.5. Remove the supernatant and suspend
the pellet in homogenization buffer(1:1, vol/vol).
Immunochemical Detection of PARP
Materials and Reagents
• Modified Lowry protein assay reagent(Pierce Chemical, Rockford, IL, USA).
• Coomassie protein assay reagent(Pierce Chemical).
• Acrylamide (Sigma).• N,N′-Methylene-bis-acrylamide
(Sigma).• TEMED (Sigma).• Ammonium persulfate (Sigma).• Glycine (Sigma).• Lauryl sulfate, sodium salt (SDS;
Sigma).• Sample buffer, Laemmli (Sigma).• Methanol (Sigma).• Coomassie® Brilliant Blue dye
(Sigma).• Nitrocellulose membrane, electophor-
esis grade, 0.45 mm pore size (Sigma).• Polyvinylidene fluoride (PVDF) mem-
brane, electrophoresis grade (Sigma).• Tween® 20. • BSA.• Rabbit polyclonal antibody to PARP
(Santa Cruz Biotechnology, SantaCruz, CA, USA).
• Peroxidase-labeled antirabbit antibody(Amersham Pharmacia Biotech).
• Color markers for sodium dodecyl sul-fate polyacrylamide gel electrophoresis(SDS-PAGE) and protein transfer(Sigma).
245
14. In Vivo Analysis of Cell Proliferation and Apoptosis in the CNS
Merighi14-aucorr.qxd 5/23/02 8:37 PM Page 245

• Enhanced chemiluminescent detectionsystem (ECL Western blotting system;Amersham Pharmacia Biotech).
• Hyperfilm ECL (Amersham Phar-macia Biotech).
• Mini protean slab gel apparatus forelectrophoresis and transblot unit(available from Bio-Rad, Hercules,CA, USA).
Procedure
1. Measure the protein concentration ofresuspended pellet with modified lowryprotein assay reagent or CoomassieProtein Assay Reagent.
2. Prepare a 9% polyacrilamide separatinggel with a 4% polyacrilamide stackinggel.
3. Prepare a sample containing the colormarkers and samples containing 60 mgof pellet proteins in sample buffer;place samples in a boiling water bathfor 3 to 5 minutes.
4. Load all samples onto the gel lanes andelectrophorese the proteins at 180 Vfor 1 hour in a Tris-glycine runningbuffer (25 mM Tris, 192 mM glycine,0.1% SDS, pH 8.3 ± 0.2).
5. Transfer proteins onto a nitrocelluloseor a PVDF membrane using a Tris-glycine buffer (25 mM Tris, 192 mMglycine, 20% methanol) and the trans-blot unit at 100 V for 1 hour at 4°C.
6. To ensure consistency of loading, stainthe gel for 1 hour in a solution consist-ing of 50% (vol/vol) methanol, 10%(vol/vol) acetic acid, 40% (vol/vol)water, and 0.1% Comassie Brilliantblue dye.
7. Following transfer of the proteins,block nonspecific sites of PVDF ornitrocellulose membrane with TBSTbuffer (20 mM Tris-HCl, pH 7.5, 150mM NaCl, 0.2% Tween 20) contain-ing 5% BSA overnight at 4°C.
8. Dilute the rabbit polyclonal antibodyto PARP in blocking solution (1:500)and incubate the membrane for 3hours.
9. After washing 3 times in TBST (1 × 15minutes, 2 × 5 minutes) incubate themembrane with peroxidase-labeledantirabbit secondary antibody inblocking buffer (1:10 000) for 1 hourat room temperature.
10. Wash in TBST and detect proteins byECL western blotting system with anexposure time of 1 hour.
RESULTS AND DISCUSSION
Identification of Proliferating Cells InVivo
Light Microscopy
Figure 1 shows the localization of prolif-erating cells in the postnatal cerebellum atthe light microscope level after immunocy-tochemical visualization of exogenouslyadministered BrdU (or IdU) at differentsurvival time. The immunocytochemicallocalization of the Ki67 nuclear antigen isshown in Figure 2, A and B. As expected,labeling was mainly observed at the level ofthe external granular layer (EGL) and, at amuch lesser extent, within the molecularlayer (ML) and the internal granular layer(IGL) of the postnatal cerebellar cortex.This pattern is consistent with the wellknown migratory pathway followed bygranule cell precursors, which having beenoriginated by the proliferation of progeni-tor cells within the EGL, migrate past tothe ML and the Purkinje cell layer to reachtheir final destination, the IGL (9,83,88).The presence of proliferating cells withinthe ML and the IGL may also be linked tomigration of the GABAergic cerebellarinterneurons which are generated by inter-stitial proliferation within the white matter
246
L. Lossi et al.
Merighi14-aucorr.qxd 5/23/02 8:37 PM Page 246
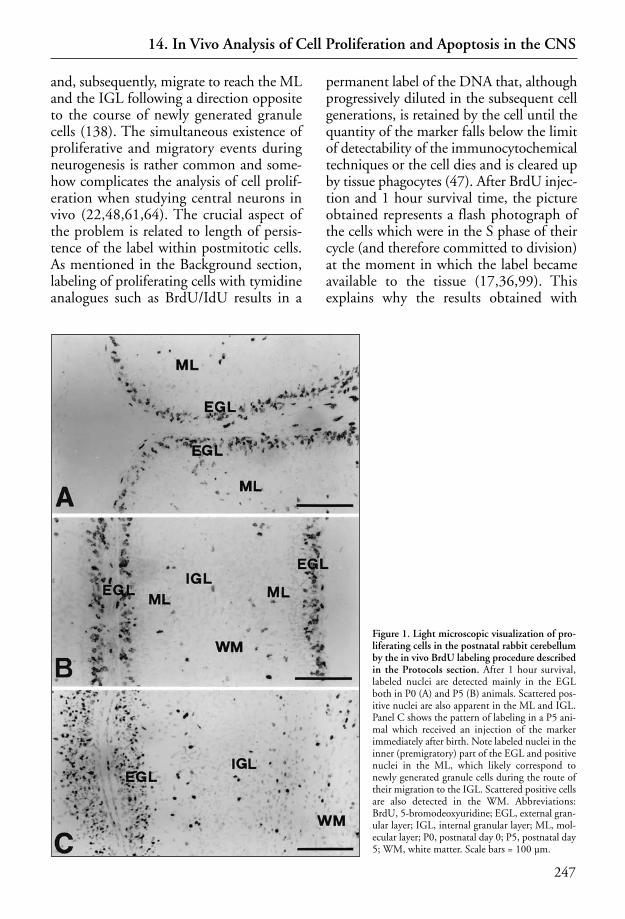
and, subsequently, migrate to reach the MLand the IGL following a direction oppositeto the course of newly generated granulecells (138). The simultaneous existence ofproliferative and migratory events duringneurogenesis is rather common and some-how complicates the analysis of cell prolif-eration when studying central neurons invivo (22,48,61,64). The crucial aspect ofthe problem is related to length of persis-tence of the label within postmitotic cells.As mentioned in the Background section,labeling of proliferating cells with tymidineanalogues such as BrdU/IdU results in a
permanent label of the DNA that, althoughprogressively diluted in the subsequent cellgenerations, is retained by the cell until thequantity of the marker falls below the limitof detectability of the immunocytochemicaltechniques or the cell dies and is cleared upby tissue phagocytes (47). After BrdU injec-tion and 1 hour survival time, the pictureobtained represents a flash photograph ofthe cells which were in the S phase of theircycle (and therefore committed to division)at the moment in which the label becameavailable to the tissue (17,36,99). Thisexplains why the results obtained with
247
14. In Vivo Analysis of Cell Proliferation and Apoptosis in the CNS
Figure 1. Light microscopic visualization of pro-liferating cells in the postnatal rabbit cerebellumby the in vivo BrdU labeling procedure describedin the Protocols section. After 1 hour survival,labeled nuclei are detected mainly in the EGLboth in P0 (A) and P5 (B) animals. Scattered pos-itive nuclei are also apparent in the ML and IGL.Panel C shows the pattern of labeling in a P5 ani-mal which received an injection of the markerimmediately after birth. Note labeled nuclei in theinner (premigratory) part of the EGL and positivenuclei in the ML, which likely correspond tonewly generated granule cells during the route oftheir migration to the IGL. Scattered positive cellsare also detected in the WM. Abbreviations:BrdU, 5-bromodeoxyuridine; EGL, external gran-ular layer; IGL, internal granular layer; ML, mol-ecular layer; P0, postnatal day 0; P5, postnatal day5; WM, white matter. Scale bars = 100 µm.
Merighi14-aucorr.qxd 5/23/02 8:37 PM Page 247

BrdU (IdU) labeling in several tissues andorgans, including the nervous tissue, andthose achieved after administration of triti-ated tymidine are, in practical terms, equiv-alent to each other. However, BrdU (IdU)injection has the drawback of a higher vari-ability between individuals in counts oflabeled cells and has the additional problemof presenting some difficulties in countingcells that are scattered along a spatial gradi-ent. To partly overcome this problem, mul-tiple injections (21) or pellets of BrdU
(IdU) may be implanted subcutaneously inexperimental animals (47). However, if ani-mals are left to survive for longer periods oftime, the interpretation of the resultsbecomes more difficult considering the pos-sibility that labeled cells undergo subse-quent divisions and that migratory phe-nomena also occur (22,79). In theseconditions, the calculation of the prolifera-tion index (percentage of proliferating cells)is not so straight. The difficulty in the eval-uation of the dilution of the label in repeat-
248
L. Lossi et al.
Figure 2. Visualization of proliferating (Aand B) and apoptotic (C and D) cells inthe postnatal cerebellum. Proliferatingcells have been detected by immunocyto-chemical labeling for the ki-67 nuclearantigen. (A) Rabbit cerebellum at P5.Note that the pattern of staining isremarkably similar to that shown in Figure1B. (B) Human cerebellum at P30. Dualcolor immunocytochemistry for ki-67(peroxidase, brown) and bcl-2 protein(alkaline phosphatase, blue), showsnumerous proliferating cells with nuclearki-67 positivity in the outer (proliferative)part of the EGL expressing in their cyto-plasm the bcl-2 protein, a negative modu-lator of apoptosis. (C) An apoptotic cell inthe cerebellar white matter of a P5 rabbit.TUNEL method. (D) Combined visual-ization of apoptotic cells (TUNEL alka-line phosphatase—new fuchsin = red) andvimentin (a marker of undifferentiatedneural precursors) immunoreactivity(nickel intensified peroxidase = black) inthe EGL. Abbreviations: EGL, externalgranular layer; IGL, internal granularlayer; ML, molecular layer; P5, postnatalday 5; P30, postnatal day 30; WM, whitematter. Scale bars: panel A = 100 µm; pan-els B and C = 25 µm; panel D = 10 µm.(See color plate A11.)
Merighi14-aucorr.qxd 5/23/02 8:37 PM Page 248

edly dividing cells represents one of themost important drawbacks of the BrdU(IdU) labeling methods in comparison withthe isotopic procedures relying on tritiatedtymidine autoradiography. In the latter, infact, halving of the label is apparent fromthe reduction of the number of silver grainsthat can be directly counted over the subse-quent generations of labeled cells (2).
Another very important issue linked tothe use of nonisotopic methods to label ofproliferating cells is represented by the needto open double-stranded DNA in tissuesand make incorporated BrdU (IdU) avail-able to binding by specific antibodies. Tothis purpose, it is necessary to pretreat sec-tions with proteinase K or other proteases todigest DNA-linked proteins and to incubateslides with HCl at different pH and molari-ty (47,99). All these procedures always havea more or less detrimental effect on tissuemorphology and may also interfere with thepossibility to successfully combine the visu-alization of BrdU (IdU)-labeled cells withthe immunocytochemical staining forspecific cell–tissue antigens (78,99). Theavailability of an anti-BrdU monoconalantibody, which is commercialized in anuclease-containing buffer (AmershamPharmacia Biotech), represents an usefultool to partly overcome the above problems.
The use of immunocytochemical mark-ers of cell proliferation represents an alter-native tool to the visualization of radioac-tive or nonradioactive exogenouslyintroduced DNA labels.
The most appealing feature of thisapproach is represented by the fact that itdoes not involve the experimental admin-istration of the label, and that, in generalterms, it is technically less demanding.However, there are several concerns relatedto the use of this approach mainly linkedto the specificity of the label and its persis-tence within the cells once they havestopped proliferating and are no longercommitted to cell division (15,52,90,121).
Electron Microscopy
Theoretically, all the methods describedso far for the in situ light microscopicdetection of proliferating cells can beemployed at the ultrastructural level. Inpractical terms, however, satisfactory resultshave been obtained by ultrastructuralautoradiography (9) or post-embeddingimmunogold staining of incorporatedBrdU (IdU) (57,104). Figure 3 shows theimmunocytochemical detection of exoge-nously administered BrdU-IdU in the post-natal cerebellar cortex. Labeling is scatteredinto the nucleoplasm of progenitor cellsand granule cell precursors within the EGLand appears to be associated with both eu-and eterochromatin. This pattern of local-ization is consistent with the data obtainedafter ultrastructural autoradiography. Itseems to be of relevance to stress here thatthe post-embedding immunogold approachallows for the ultrastructural visualization ofproliferating cells after conventional fixa-tion (glutaraldehyde plus osmium tetrox-ide) and embedding. In our opinion, thisrepresents a major advantage of theimmunogold approach with respect toultrastructural autoradiography, which is byfar technically more demanding. Anothersignificative advantage lies in the possibilityto simultaneously visualize 2 labels (i.e.,BrdU and IdU) in the same ultrathin sec-tion. This opens the way to perform ultra-structural cell kinetic studies in situ andrepresents a major implementation withrespect to the isotopic procedures (62).
Identification of Apoptotic Cells In Vivo
Light Microscopy
Figure 2, C and D shows the detectionof apoptotic cells in the postnatal cerebellarcortex by the TUNEL method for frag-mented DNA. By this or similar approach-es, several laboratories including ours have
249
14. In Vivo Analysis of Cell Proliferation and Apoptosis in the CNS
Merighi14-aucorr.qxd 5/23/02 8:37 PM Page 249

demonstrated the existence of an impres-sively high number of apoptotic neuronsand glial cells in the postnatal cerebellum ofaltricial animals (59,63,106,123,124). Asmentioned in the Background section ofthis chapter, several different alternatives areavailable to label apoptotic cells in situ.Nevertheless, the major concern, which islinked to all these techniques, regards theirtrue specificity for apoptotic cells. In gener-al terms, none of the existing methods canbe considered one hundred percent specific,basically as a consequence that most of thesteps involved in tissue preparation are like-ly to (or at least theoretically can) produceDNA damage that might produce false pos-itive results. Indeed, the TUNEL method,which nowadays represents the most widely
used procedure for the in situ detection ofapoptotic cells, suffers from a number ofpotential pitfalls due to the possibility that apositive reaction is observed in the presenceof necrotic or autolytic tissue, peroxidedamage, or excessive heating of normal tis-sue (37). To overcome these problems, it isadvisable to use more than one singleapproach to confirm the existence of trueapoptotic phenomena, at least when theyare found in unexpected locations or whenone can not exclude that the experimentalmaterial might have been damaged bynonoptimal preparative procedures. Forexample, we have recently used both theTUNEL and the T4 DNA ligase methodsto confirm the presence of apoptosis in thehuman postnatal cerebellum (63).
250
L. Lossi et al.
Figure 3. Ultrastructural visualization of prolifer-ating cells in the P5 rabbit cerebellum after BrdU(A) or BrdU + IdU (B) administration. After 1hour survival and BrdU injection (A), gold particlesindicative of labeling are mainly apparent over thenucleus of the granule cell precursors within theEGL (insert). After sequential BrdU (1 hour sur-vival) + IdU (12 hour survival) administration (B),double-labeled granule cells are present mainly inthe IGL (insert). BrdU, 10 nm gold particles; IdU,30 nm gold particles. Abbreviations: EGL, externalgranular layer; IGL, internal granular layer; et, ete-rochromatin; gc, granule cell; gcp, granule cell pre-cursor; P5, postnatal day 5; Scale bars = 1 µm.Inserts: panel A = 0.1 µm; panel B = 0.25 µm.
Merighi14-aucorr.qxd 5/23/02 8:37 PM Page 250

As an alternative or in addition to the useof more than one protocol in situ, it is use-ful to confirm the existence of apoptosis byDNA extraction and electrophoresis or bywestern blotting and demonstration of spe-cific cleavage of effector proteins (Figure 4).To do so it is important to stress the needfor specific antibodies that consistently rec-ognize the cleaved active form of the pro-tein(s), since the precursor molecule mayoften have an ubiquitous distribution andthus be expressed also in nonapoptotic cells.
Electron Microscopy
The possibility to label apoptotic cells atthe ultrastructural level relies on the avail-ability of nucleic acids at the surface ofepoxy sections. Under these conditions, theDNA can be specifically labeled with exo-genous transferases and modified nucleo-tides (107–110). The use of nonisotopicnucleotide analogues has considerably im-proved the potential applications of theISEL methods for ultrastructural analysisand has opened the way to successfully
combine such an approach with the goldlabeling procedures described in Chapter10 for the immunocytochemical detectionof cell and tissue antigens at the electronmicroscope level.
Although one has to consider that apop-totic cells show peculiar ultrastructural fea-tures (Figure 5) and can therefore be easilydistinguished in the electron microscope inthe absence of any labeling (30), the devel-opment of in situ methods allowed for thedetection of cells with fragmented DNA,i.e., positive TUNEL labeling, in the ab-sence of ultrastructural signs of apoptosis(see below). Molecular biology techniquesat the ultrastructural level are 2-step proce-dures which are often referred to as trans-ferase–immunogold techniques. Whenusing this approach, an enzymatic (trans-ferase) reaction is performed first, whichallows for labeling of the nucleic acid(DNA) fragments; then an immunogoldlabeling procedure is used to reveal theincorporated nucleotide analogues (107–109). The procedure described in theProtocols section of this chapter is a modi-fied TUNEL reaction which is based on theuse of TdT to end-label DNA fragmentswith digoxigeninated dd-UTP. This latter isfinally visualized in the electron microscopeby using a gold-conjugated anti-DIG anti-body (Figure 6). Similar protocols havebeen employed in other laboratories withcomparable results. As mentioned above, arather surprising observation followingultrastructural labeling of apoptotic cells insitu, was that some cells showed positivenuclei in the absence of the characteristicfeatures of chromatin condensation, bleb-bing, and fragmentation into apoptoticbodies, i.e., the characteristic ultrastructuralfeatures of apoptosis. Although these resultsshould be interpreted with some caution inrelation to the pitfalls of the TUNELmethod, a series of recent observations indi-cate that fragmentation of DNA is a veryearly event during apoptosis and that it
251
14. In Vivo Analysis of Cell Proliferation and Apoptosis in the CNS
Figure 4. Western blot detection of activated PARP (89 kDafragment) in P5 rabbit cerebellar extracts. Abbreviations:PARP, poly-ADP-ribose polymerase; P5, postnatal day 5.
Merighi14-aucorr.qxd 5/23/02 8:37 PM Page 251

occurs in situ prior to any ultrastructuralmodification of the cell morphology. Itseems also of relevance to remark here thatthe ultrastructural visualization of apoptot-ic cells by the TUNEL procedure can becarried out on sections of osmicated epoxy-embedded material and is thus compatiblewith several immunogold staining proto-cols. We have recently used such a com-bined approach for the simultaneous visu-alization of proliferating and apoptotic cellsin the postnatal rabbit cerebellum (62).
Combination with ImmunocytochemicalLabeling
Besides the need to specifically detect
apoptosis in situ, one is often faced withthe problem of identifying the nature ofapoptotic cells in a given experimental sys-tem. Due to the fact that: (i) cells mayundergo apoptosis very soon after they aregenerated; and (ii) they are rapidlyremoved from tissues by phagocytes, thedetection of specific antigens in apoptoticcells is a quite demanding task. Moreover,the following possibility are likely to occur:(i) apoptotic cells are labeled at a stage ofimmaturity in which any specific antigen isnot expressed yet; or (ii) they are already soheavily damaged that they do not retainspecific antigens to give some clues on theirorigin or nature. The relevance of all thepoints raised so far becomes even more evi-
252
L. Lossi et al.
Figure 5. Apoptotic cells in the P5 rabbit cerebel-lum. The dying cells in panels A and B show chro-matin masses (ch) typical of apoptosis and a variabledegree of nuclear and cytoplasmic condensation.Abbreviations: ch, chromatin; EGL, external granu-lar layer; P5, postnatal day 5; WM, white matter.Scale bars = 1 µm.
Merighi14-aucorr.qxd 5/23/02 8:37 PM Page 252

dent considering the relatively low degreeof sensitivity, particularly at the ultrastruc-tural level, of the immunocytochemicalmethods. The problem has assumed amajor relevance following the demonstra-tion that apoptosis in not a phenomenonrestricted to neurons, but it also affects glialcells. Some difficulties are at least partlybypassed after ultrastructural examination,considering that different cell types havegenerally very distinctive cytological fea-tures, even at very early stages of differenti-ation. Nevertheless, ultrastructural studiesare not always practical nor can they beemployed in all experimental conditions.Some authors have tried to overcome the
problem of identifying the nature of apop-totic cells in situ by combining immunocy-tochemistry and fluorescent dye nuclearstaining for apoptosis. However, the speci-ficity of these stains is often questionable asdiscussed in a previous section. Despite alldifficulties, successful attempts have beenmade to combine in situ labeling of apop-totic cells with immunocytochemical label-ing for markers of neuronal and/or glialdifferentiation (47,63,99,111). As men-tioned, other technical drawbacks addedfurther unpredictability to this combinedapproach, such as, for example, the need oftissue digestion for a proper exposure ofthe DNA to its modifying enzymes with
253
14. In Vivo Analysis of Cell Proliferation and Apoptosis in the CNS
Figure 6. Ultrastructural detection of DNA frag-mentation in apoptotic cells of the P5 rabbitcerebellum. Condensed chromatin masses (ch)after incorporation of digoxigeninated-dd-UTPfollowing the TUNEL method described in theProtocols section are heavily labeled with colloidalgold particles (10 nm) (inserts, short arrows). Theapoptotic cell in panel A also shows incorporationof BrdU (30 nm gold) (insert, long arrow) after 24hour survival. Abbreviations: ch, chromatin; IGL,internal granular layer; P5, postnatal day 5; WM,white matter. The asterisks indicate the areasshown at higher magnifications in the inserts.Scale bars = 1 µm. Inserts = 0.1 µm.
Merighi14-aucorr.qxd 5/23/02 8:37 PM Page 253

obvious detrimental consequences on anti-genicity. Nonetheless, an effective combi-nation of the detection of apoptotic cellswith immunocytochemistry would repre-sent a valuable tool to answer a number ofstill unsolved questions in several neuralsystems and deserves further exploitation.
ACKNOWLEDGMENTS
Much of the work described here was sup-ported by grants from the University of Tori-no, the Italian Ministero dell’Istruzione dell’Università e della Ricerca (MIUR—Cofin2000, Cofin 2001), Ministero della Sanità(Progretto Finalizzato Alzheimer), and Con-siglio Nazionale delle Ricerche (CNR).
REFERENCES
1.Alnemri, E.S., J.N. Livingston, D.W. Nicholson, G.Salvesen, N.A. Thornberry, W.W. Wong, and J. Yuan.1996. Human ICE/CED-3 protease nomenclature.Cell 87:171-181.
2.Altman, J. 1966. Autoradiographic and histologicalstudies of postnatal neurogenesis. A longitudinal inves-tigation of the kinetics, migration and transformationof cells incorporating tritiated thymidine in infant rat,with special reference to postnatal neurogenesis insome brain regions. J. Comp. Neurol. 128:431-474.
3.Altman, J. 1969. Autoradiographic and histologicalstudies of postnatal neurogenesis. Cell proliferationand migration in the anterior forebrain, with specialreference to persisting neurogenesis in the olfactorybulb. J. Comp. Neurol. 137:433-458.
4.Altman, J. 1972a. Postnatal development of the cere-bellar cortex in the rat. I. The external germinal layerand the transitional molecular layer. J. Comp. Neurol.145:353-398.
5.Altman, J. 1972b. Postnatal development of the cere-bellar cortex in the rat. II. Phases in the maturation ofthe Purkinje cells and of the molecular layer. J. Comp.Neurol. 145:399-464.
6.Altman, J. 1982. Morphological development of therat cerebellum and some of its mechanism, p. 8-46. InS.L. Palay and V. Chan-Palay (Eds.), TheCerebellum—New Vistas. Springer-Verlag, New York.
7.Altman, J. 1992. Programmed cell death: the paths tosuicide. Trends Neurol. Sci. 15:278-280.
8.Altman, J. and S.A. Bayer. 1978. Prenatal develop-ment of the cerebellar system in the rat. I. Cytogenesisand histogenesis of the deep nuclei and the cortex ofthe cerebellum. J. Comp. Neurol. 179:23-48.
9.Altman, J. and S.A. Bayer. 1997. Development of theCerebellar System in Relation to Its Evolution, Struc-ture and Functions. CRC Press, Boca Raton.
10.Alvarez-Buylla, A. 1997. Neurogenesis in the adultbrain: prospects for brain repair, p. 86-100. In F.H.Gage and Y. Christen (Eds.), Isolation, Characteriza-tion and Utilization of CNS Stem Cells. Springer-Ver-lag, Berlin.
11.Ankarcrona, M., J.M. Dypbukt, E. Bonfoco, B. Zhiv-otovsky, S. Orrenius, S.A. Lipton, and P. Nicotera.1995. Glutamate-induced neuronal death: a successionof necrosis or apoptosis depending on mitochondrialfunction. Neuron 15:961-973.
12.Banki, K., E. Hutter, E. Colombo, N.J. Gonchoroff,and A. Perl. 1996. Glutathione levels and sensitivity toapoptosis are regulated by changes in transaldolaseexpression. J. Biol. Chem. 271:32994-33001.
13.Barbiero, G., F. Duranti, G. Bonelli, J.S. Amenta, andF.M. Baccino. 1997. Intracellular ionic variations inthe apoptotic death of L cells by inhibitors of cell cycleprogression. Exp. Cell Res. 217:410-418.
14.Barres, B.A., I.K. Hart, H.S.R. Coles, J.F. Burne, J.T.Voyvodic, W.D. Richardson, and M.C. Raff. 1992.Cell death and control of cell survival in the oligoden-drocyte lineage. Cell 70:31-46.
15.Baum, H.-P., J. Reichrath, A. Theobald, and G.Schock. 1994. Fixation requirements for the immuno-histochemical reactivity of PCNA antibody PC10 oncryostat sections. Histochem. J. 26:929-933.
16.Bayer, S.A. 1983. 3H-Thymidine-radiographic studiesof neurogenesis in the rat olfactory bulb. Exp. BrainRes. 50:329-340.
17.Belecky-Adams, T., B. Cook, and R. Adler. 1996.Correlation between terminal mitosis and differentiat-ed fate of retinal precursor cells in vivo and in vitro:analysis with the “window-labeling” technique. Dev.Biol. 178:304-315.
18.Beppu, T., Y. Ishida, H. Arai, T. Wada, N. Uesugi,and K. Sasaki. 1994. Identification of S-phase cellswith PC10 antibody to proliferating cell nuclear anti-gen (PCNA) by flow cytometric analysis. J. His-tochem. Cytochem. 42:1177-1182.
19.Bernier, P.J. and A. Parent. 1998. Bcl-2 protein as amarker of neuronal immaturity in postnatal primatebrain. J. Neurosci. 18:2486-2497.
20.Bonatz, G., J. Luttges, J. Hedderich, D. Inform, W.Jonat, P. Rudolph, and R. Parwaresch. 1999. Prog-nostic significance of a novel proliferation marker,anti-repp 86, for endometrial carcinoma: a multivari-ate study. Hum. Pathol. 30:949-956.
21.Bonfanti, L., P. Peretto, A. Merighi, and A. Fasolo.1997. Newly generated cells from the rostral migrato-ry stream in the accessory olfactory bulb of the adultrat. Neuroscience 81:489-502.
22.Bonfanti, L. and D.T. Theodosis. 1994. Expression ofpolysialylated neural cell adhesion molecule by prolif-erating cells in the subependymal layer of the adult rat,in its rostral extension and in the olfactory bulb. Neu-roscience 62:291-305.
23.Bonfoco, E., D. Krainic, M. Ankarcrona, P. Nicotera, andS. Lipton. 1995. Apoptosis and necrosis: two distinctevents induced, respectively, by mild and intense insultswith N-methyl-D-aspartate or nitric oxide/superoxide incortical cell cultures. Proc. Natl. Acad. Sci. USA 92:7162-7166.
24.Bravo, R. and H. Macdonald-Bravo. 1987. Existence
254
L. Lossi et al.
Merighi14-aucorr.qxd 5/23/02 8:37 PM Page 254

of two populations of cyclin/proliferating cell nuclearantigen during the cell cycle: association with DNAreplication sites. J. Cell Biol. 105:1549-1554.
25.Bredesen, D.E. 1995. Neural apoptosis. Ann. Neurol.38:839-851.
26.Carrio, R., M. Lopez-Hoyos, J. Jimeno, M.A. Bene-dict, R. Merino, A. Benito, J.L. Fernandez-Luna, G.Nunez, J.A. Garcia-Porrero, and J. Merino. 1996. A1demonstrates restricted tissue distribution duringembryonic development and functions to protectagainst cell death. Am. J. Pathol. 149:2133-2142.
27.Celis, J.E., R. Bravo, P.M. Larsen, and S.J. Fey. 1984.Cyclin: a nuclear protein whose level correlates direct-ly with the proliferative state of normal as well as trans-formed cells. Leukemia Res. 8:143-157.
28.Chang, L.M.S. and F.J. Bollum. 1986. Molecular biol-ogy of terminal transferase. Crit. Rev. Biochem. 21:27-52.
29.Chun, J. 1998. Apoptotic DNA fragmentation detec-tion using ligation-mediated PCR, p. 23-33. In L. Zhuand J. Chun (Eds.), Apoptosis Detection and AssayMethods. Eaton Publishing, Natick, MA.
30.Clarke, P.G.H. 1990. Developmental cell death: mor-phological diversity and multiple mechanisms. Anat.Embryol. 181:195-213.
31.Cunningham, T.J. 1982. Naturally occurring neurondeath and its regulation by developing neural path-ways. Int. Rev. Cytol. 74:163-186.
32.Dachary-Prigent, J., J.M. Freyssinet, J.M. Pasquet,J.C. Carron, and A.T. Nurden. 1993. Annexin V as aprobe of aminophospolipid exposure and plateletmembrane vesiculation: a flow cytometry study show-ing a role for free sulfhydryl groups. Blood 81:2554-2565.
33.Daly, J.M., C.B. Jannot, R.R. Beerli, D. Grasus-Porta, F.G. Maurer, and N.E. Hynes. 1997. Neu dif-ferentiation factor induces ErbB2 down-regulation andapoptosis of ErbB2-overexpressing breast tumor cells.Cancer Res. 57:3804-3811.
34.Darzynkiewicz, Z., X. Li, and J. Gong. 1994. Assaysof cell viability: discrimination of cells dying by apop-tosis. Methods Cell Biol. 41:15-38.
35.De Bilbao, F., E. Guarin, P. Nef, P. Vallet, P. Gian-nakopoulos, and M. Dubois-Dauphin. 1999. Postna-tal distribution of cpp32/caspase 3 mRNA in themouse central nervous system: an in situ hybridizationstudy. J. Comp. Neurol. 409:339-357.
36.DelRio, J.A. and E. Soriano. 1989. Immunocyto-chemical detection of 5′-bromodeoxyuridine incorpo-ration in the central nervous system of the mouse. Dev.Brain Res. 49:311-317.
37.Didenko, V.V. and P.J. Hornsby. 1996. Presence ofdouble-strand breaks with single-base 3′ overhangs incells undergoing apoptosis but not necrosis. J. CellBiol. 135:1369-1376.
38.Duchrow, C. Schluter, G. Key, M.H. Kubbutat, C.Wohlenberg, H.D. Flad, and J. Gerdes. 1995. Cellproliferation-associated nuclear antigen defined byantibody Ki-67: a new kind of cell cycle-maintainingproteins. Arch. Immunol. Ther. Exp. 43:117-121.
39.Fadok, V.A., D. Voelker, P.A. Campbell, J.J. Cohen,D.L. Bratton, and P.M. Henson. 1992. Exposure ofphosphatidylserine on the surface of apoptotic lypm-
phocytes triggers specific recognition and removal bymacrophages. J. Immunol. 148:2207-2216.
40.Fernandez-Alnemri, T., G. Litwack, and E.S. Alnem-ri. 1994. CPP32, a novel human apoptotic proteinwith homology to Caenorhabditis elegans cell deathprotein Ced-3 and mammalian interleukin-1-beta-converting enzyme. J. Biol. Chem. 269:30761-30764.
41.Fernandez, A., J. Kiefer, L. Fosdick, and D.J. McCon-key. 1995. Oxygen radical production and thiol deple-tion are required for Ca(2+)-mediated endogenousendonuclease activation in apoptotic thymocytes. J.Immunol. 155:5133-5139.
42.Fesus, L., Z. Nemes, L. Piredda, A. Madi, M. di Rao,and M. Picentini. 1987. Induction and activation oftissue transglutaminase during programmed cell death.FEBS Lett. 224:104-108.
43.Frade, J.-M., P. Bovolenta, J.R. Martinez-Morales, A.Arribas, J.A. Barbas, and A. Rodríguez-Tébar. 1997.Control of early cell death by BDNF in the chick reti-na. Development 124:3313-3320.
44.France-Lanord, V., B. Brugg, P.P. Michel, Y. Agid, andM. Ruberg. 1997. Mitochondrial free radical signal inceramide-dependent apoptosis: a putative mechanismfor neuronal death in Parkinson’s disease. J. Neu-rochem. 69:1612-1621.
45.Frankfurt, O.S. 1998. Detection of apoptotic cellswith monoclonal antibodies to single-stranded DNA,p. 47-62. In L. Zhu and J. Chun (Eds.), ApoptosisDetection and Assay Methods. Eaton Publishing, Nat-ick, MA.
46.Gage, F.H. 1998. Stem cells of the central nervous sys-tem. Curr. Opin. Neurobiol. 8:671-676.
47.Galli-Resta, L. and M. Ensini. 1996. An intrinsic timelimit between genesis and death of individual neuronsin the developing retinal ganglion cell layer. J. Neu-rosci. 16:2318-2324.
48.Gates, M.A., L.B. Thomas, E.M. Howard, E.D. Lay-well, B. Sajin, A. Faissner, B. Gotz, J. Silver, and D.A.Steindler. 1995. Cell and molecular analysis of thedeveloping and adult mouse subventricular zone of thecerebral hemispheres. J. Comp. Neurol. 361:249-266.
49.Gavrieli, Y., Y. Sherman, and S.A. Ben-Sasson. 1992.Identification of programmed cell death in situ via spe-cific labeling of nuclear DNA fragmentation. J. CellBiol. 119:493-501.
50.Gerdes, J., U. Schwab, H. Lemke, and H. Stein.1983. Production of a mouse monoclonal antibodyreactive with a human antigen associated with cell pro-liferation. Int. J. Cancer 31:13-20.
51.Gold, R., M. Schmidt, G. Rothe, H. Zischler, H.Breitschopf, H. Wekerle, and H. Lassmann. 1993.Detection of DNA fragmentation in apoptosis: appli-cation of in situ nick translation to cell culture systemsand tissue sections. J. Histochem. Cytochem.41:1023-1030.
52.Hall, P.A., P.J. Coates, R.A. Goodlad, I.R. Hart, andD.P. Lane. 1994. Proliferating cell nuclear antigenexpression in non-cycling cells may be induced bygrowth factors in vivo. Br. J. Cancer 70:244-247.
53.Hines, M.D. and B.L. Allen-Hoffmann. 1996. Ker-atinocyte growth factor inhibits cross-linked envelopeformation and nucleosomal fragmentation in culturedhuman keratinocytes. J. Biol. Chem. 271:6245-6251.
255
14. In Vivo Analysis of Cell Proliferation and Apoptosis in the CNS
Merighi14-aucorr.qxd 5/23/02 8:37 PM Page 255

54.Holt, S.E. and J.V. Shay. 1999. Role of telomerase incellular proliferation and cancer. J. Cell. Physiol.180:10-18.
55.Jin, K., J. Chen, T. Nagayama, M. Chen, J. Sinclair,S.H. Graham, and R.P. Simon. 1999. In situ detec-tion of neuronal DNA strand breaks using the Klenowfragment of DNA polymerase I reveals different mech-anisms of neuron death after global cerebral ischemia.J. Neurochem. 72:1204-1214.
56.Kerr, J.F., A.H. Wyllie, and A.R. Currie. 1972. Apop-tosis: a basic biological phenomewith wide-rangingimplications in tissue kinetics. Br. J. Cancer 26:239-257.
57.Kondo, K. and T. Makita. 1996. Electron microscop-ic immunogold labeling of bromodeoxyuridine (BrdU)in routine electron microscopy. Acta Histochem.Cytochem. 29:115-119.
58.Korhonen, L., S. Hamner, P.A. Olsson, and D. Lind-holm. 1997. Bcl-2 regulates the levels of the cysteineproteases ICH and CPP32/Yama in human neuronalprecursor cells. Eur. J. Neurosci. 9:2489-2496.
59.Krueger, B.K., J.F. Burne, and M.C. Raff. 1995. Evi-dence for large-scale astrocyte death in the developingcerebellum. J. Neurosci. 15:3366-3374.
60.Lee, S., S. Christakos, and M.B. Small. 1993. Apop-tosis and signal transduction: clues to a molecularmechanism. Curr. Opin. Cell Biol. 5:286-291.
61.Lois, C., J.-M. Garcia-Verdugo, and A. Alvarez-Buyl-la. 1996. Chain migration of neuronal precursors. Sci-ence 271:978-981.
62.Lossi, L., S. Mioletti, and A. Merighi. 2000. Undif-ferentiated progenitors and granule cell precursorsundergo apoptosis within a few hours after their gen-eration, but represent an endogenous source of brain-derived neurotrophic factor for the post-natal cerebel-lar cortex. Soc. Neurosci. Abstr. 26:598.
63.Lossi, L., D. Zagzag, M.A. Greco, and A. Merighi.1998. Apoptosis of undifferentiated progenitors andgranule cell precursors in the post-natal human cere-bellar cortex correlates with expression of BCL-2, ICEand CPP-32 proteins. J. Comp. Neurol. 399:359-372.
64.Luskin, M.B. 1993. Restricted proliferation andmigration of postnatally generated neurons derivedfrom the forebrain subventricular zone. Neuron11:173-189.
65.Luskin, M.B. 1997. Characterization of neural prog-enitor cells of the neonatal forebrain, p. 67-86. In F.H.Gage and Y. Christen (Eds.), Isolation, Characteriza-tion and Utilization of CNS Stem Cells. Springer-Ver-lag, Berlin.
66.Meisenholder, G.W., S.G. Martin, D.R. Green, J.Nordber, B.M. Babior, and R.A. Gottlieb. 1996.Events in apoptosis. Acidification is downstream ofprotease activation and bcl-2 protection. J. Biol. Chem271:16260-12262.
67.Migheli, A., A. Attanasio, and D. Schiffer. 1995.Ultrastructural detection of DNA strand beaks inapoptotic neural cell by in situ end-labelling tech-niques. J. Pathol. 176:27-35.
68.Miller, M.A., C.M. Mazewski, Y. Sheikh, L.M. White,G.A. Yanik, D.M. Hyams, B.C. Lampkin, and A.Raza. 1991. Simultaneous immunohistochemicaldetection of IUdR and BrdU infused intravenously to
cancer patients. J. Histochem. Cytochem. 39:407-412.69.Miller, M.W. and R.S. Novakowski. 1988. Use of bro-
modeoxyuridine-immunohistochemistry to examinethe proliferation, migration and time of origin of cellsin the central nervous system. Brain Res. 457:44-52.
70.Mitev, V., A. Pauloin, and L.M. Houdebine. 1994.Purification and characterization of two casein kinasetype II isozymes from bovine gray matter. J. Neuro-chem. 63:717-726.
71.Muto, M., M. Utsuyama, T. Horiguchi, E. Kubo, T.Sado, and K. Hirokawa. 1995. The characterization ofthe monoclonal antibody Th-10a, specific for a nuclearprotein appearing in the S phase of the cell cycle innormal thymocytes and its unregulated expression inlymphoma cell lines. Cell Prolif. 28:645-657.
72.Nakajima, T., K. Kagawa, T. Deguchi, H. Hikita, T.Okanoue, K. Kashima, E. Konishi, and T. Ashihara.1994. Biological role of proliferating cell nuclear anti-gen (PCNA) expression during rat liver regeneration.Acta Histochem. Cytochem. 27:135-140.
73.Naot, D., R.V. Sionov, and D. Ish-Shalom. 1997.CD44: structure, function, and association with themalignant process. Adv. Cancer Res. 71:241-319.
74.Nicholson, D.W., A. Ali, N.A. Thornberry, J.P. Vail-lancourt, C.K. Ding, M. Gallant, Y. Gareau, and P.R.Griffin. 1995. Identification and inhibition of theICE/CED-3 protease necessary for mammalian apop-tosis. Nature 376:37-43.
75.Nicotera, P. and A.D. Rossi. 1994. Nuclear Ca2+:physiological regulation and role in apoptosis. Mol.Cell Biochem. 135:89-98.
76.Nishikawa, S. and F. Sasaki. 1995. DNA localizationin nuclear fragments of apoptotic ameloblasts usinganti-DNA immunoelectron microscopy: programmedcell death of ameloblasts. Histochem. Cell. Biol.104:151-159.
77.Oppenheim, R.W. 1985. Naturally occurring celldeath during neural development. Trends Neurosci.8:487-493.
78.Peretto, P., A. Merighi, A. Fasolo, and L. Bonfanti.1996. Glial tubes in the rostral migratory stream of theadult rat. Brain Res. Bull. 42:9-21.
79.Peretto, P., A. Merighi, A. Fasolo, and L. Bonfanti.1999. The subependymal layer in rodents: a site ofstructural plasticity and cell migration in the adultmammalian brain. Brain Res. Bull. 49:221-243.
80.Piacentini, M., L. Fesus, M.G. Farrace, L. Ghibelli,L. Piredda, and G. Melino. 1991. The expression of“tissue” transglutaminase in two human cancer celllines is related with programmed cell death (apopto-sis). Eur. J. Cell Biol. 54:246-254.
81.Polakowska, R.R., M. Piacentini, R. Batlett, L.A.Goldsmith, and A.R. Haake. 1994. Apoptosis inhuman skin development: morphogenesis, peridermand stem cells. Dev. Dynamics 199:176-188.
82.Raff, M.C., B.A. Barres, J.F. Burne, H.S.R. Coles, Y.Ishizaki, and M.D. Jacobson. 1994. Programmed celldeath and the control of cell survival. Philos. Trans. R.Soc. Lond. [Biol] 345:265-268.
83.Rakic, P. 1996. Radial versus tangential migration ofneuronal clones in the developing cerebral cortex.Proc. Natl. Acad. Sci. USA 92:11323-11327.
84.Ray, S., T.J. Kelley, S. Campion, A.P. Seve, and S.
256
L. Lossi et al.
Merighi14-aucorr.qxd 5/23/02 8:37 PM Page 256

Basu. 1991. Developmental expression of embryonicchicken brain DNA polymerase alpha and its bindingwith monoclonal antibodies against human KB cellDNA polymerase alpha. Cell Growth Differ. 2:567-573.
85.Reynolds, J.E. and A. Eastman. 1996. Intracellularcalcium stores are not required for Bcl-2-mediated pro-tection from apoptosis. J. Biol. Chem. 271:27739-27743.
86.Rubini, M., C. D’Ambrosio, S. Carturan, G. Yumet,E. Catalano, S. Shan, Z. Huang, M. Criscuolo, M.Pifferi, and R. Baserga. 1999. Characterization of anantibody that can detect an activated IGF-I receptor inhuman cancers. Exp. Cell Res. 251:22-32.
87.Rudolph, P., R. Knuchel, E. Endl, H.J. Heidebrecht,F. Hofstader. and R. Parwaresch. 1998. The immuno-histochemical marker Ki-S2: cell cycle kinetics and tis-sue distribution of a novel proliferation-specific anti-gen. Mod. Pathol. 11:450-456.
88.Ryder, E.F. and C.L. Cepko. 1994. Migration patternsof clonally related granule cells and their progenitorsin the developing chick cerebellum. Neuron 12:1011-1029.
89.Sadi, M.V. and E.R. Barrack. 1991. Determination ofgrowth fraction in advanced prostate cancer by Ki-67immunostaining and its relationship to the time oftumor progression after hormonal therapy. Cancer67:3065-3071.
90.Sallinen, P., H. Haapasalo, T. Kerttula, I. Rantala, H.Kalimo, Y. Collan, J. Isola, and H. Helin. 1994. Sour-ces of variation in the assesment of cell proliferationusing proliferating cell nuclear antigen histochemistry.Anal. Quant. Cytol. and Histol. 16:261-268.
91.Santisteban, M.S. and G. Brugal. 1994. Image analy-sis of in situ cell cycle related changes of PCNA andKi-67 proliferating antigen expression. Cell Prolif.27:435-453.
92.Sasaki, K., T. Murakami, M. Kawasaki, and M. Taka-hashi. 1987. The cell cycle associated change of the Ki-67 reactive nuclear antigen expression. J. Cell. Physiol.133:579-584.
93.Sato, Y., T. Ito, A. Nozawa, and M. Kanisawa. 1995.Bromodeoxyuridine and iododeoxyuridine doubleimmunostaining for epoxy resin sections. Biotech. His-tochem. 70:169-174.
94.Schlegel, J., I. Peter, S. Orrenius, D.K. Miller, N.A.Thornberry, T.T. Yamin, and D.W. Nicholson. 1996.CPP32/apopain is a key interleukin 1 beta converting-like protease involved in Fas-mediated apoptosis. J.Biol. Chem. 271:1841-1844.
95.Schluter, C., M. Duchrow, C. Vohlenberg, M.H.Becker, G. Key, H.D. Flad, and J. Gerdes. 1993. Thecell proliferation-associated antigen of antibody Ki-67:a very large, ubiquitous nuclear protein with numer-ous repeated elements, representing a new kind of cellcycle-maintaining proteins. J. Cell Biol. 123:513-522.
96.Schwartz, L.M., S.W. Smith, M.E. Jones, and B.A.Osborne. 1993. Do all programmed cell death occurvia apoptosis? Proc. Natl. Acad. Sci. USA 90:980-984.
97.Simonati, A., C. Tosati, T. Rosso, E. Piazzola, and N.izzuto. 1999. Cell proliferation and death: morpho-logical evidence during corticogenesis in the develop-ing human brain. Microsc. Res. Tech. 45:341-352.
98.Sirri, V., P. Roussel, and D. Hernandez-Verdun. 2000.The AgNOR proteins: qualitative and quantitativechanges during the cell cycle. Micron 31:121-126.
99.Soriano, E., J.A. Del Rio, and C. Auladell. 1993.Characterization of the phenotype and birthdates ofpyknotic dead cells in the nervous system by a combi-nation of DNA staining and immunocytochemistryfor 5′-bromodeoxyuridine and neural antigens. J. His-tochem. Cytochem. 41:819-827.
100.Soriano, E., J.A. Del Rio, F.J. Martinez-Guijarro, I.Ferrer, and C. Lopez. 1991. Immunocytochemicaldetection of 5′-bromodeoxyuridine in fluoro-gold-labeled neurons: a simple technique to combine retro-grade axonal. J. Histochem. Cytochem. 39:1565-1570.
101.Spreafico, R., P. Arcelli, C. Frassoni, P. Canetti, G.Giaccone, T. Rizzuti, M. Mastrangelo, and M. Ben-tivoglio. 1999. Development of layer I of the humancerebral cortex after midgestation: architectonic find-ings, immunocytochemical identification of neuronsand glia, and in situ labeling of apoptotic cells. J.Comp. Neurol. 410:126-142.
102.Srinivasan, A., K.A. Roth, R.O. Sayers, K.S.Schindler, A.M. Wong, L.C. Fritz, and K.J. Tomasel-li. 1998. In situ immunodetection of activated caspase-3 in apoptotic neurons in the developing nervous sys-tem. Cell Death Differ. 5:1004-1016.
103.Takahashi, T. and V.S. Caviness, Jr. 1993. PCNA-binding to DNA at the G1/S transition in proliferatingcells of the developing cerebral wall. J. Neurocytol.22:1096-1102.
104.Tamatani, R., Y. Taniguchi, and Y. Kawarai. 1995.Ultrastructural study of proliferating cells with animproved immunocytochemical detection of DNA-incorporated bromodeoxyuridine. J. Histochem.Cytochem. 43:21-29.
105.Tampanaru-Sarmesiu, A., L. Stefaneau, K. Thapar,G. Kontogeorgos, T. Sumi, and K. Kovacs. 1998.Transferrin and transferrin receptor in human hypoph-ysis and pituitary adenomas. Am. J. Pathol. 152:413-422.
106.Tanaka, M. and T. Marunouchi. 1998. Immunohis-tochemical analysis of developmental stage of externalgranular layer neurons which undergo apoptosis inpostnatal rat cerebellum. Neurosci. Lett. 242:85-88.
107.Thiry, M. 1992. Highly sensitive immunodetection ofDNA on sections with exogenous terminal deoxynu-cleotidyl transferase and non-isotopic nucleotide ana-logues. J. Histochem. Cytochem. 40:411-419.
108.Thiry, M. 1993. Immunodetection of RNA on ultra-thin sections incubated with polydenylated nucleotidyltranferase. J. Histochem. Cytochem. 41:657-665.
109.Thiry, M. 1995. Nucleic acid compartmentalizationwithin the cell nucleus by in situ transferase-immuno-gold techniques. Microsc. Res. Tech. 31:4-21.
110.Thiry, M. and F. Puvion Dutilleul. 1995. Differentialdistribution of single-stranded DNA, double- strandedDNA, and RNA in adenovirus-induced intranuclearregions of HeLa cells. J. Histochem. Cytochem.43:749-759.
111.Torunsciolo, D.R.Z., R.E. Schimdt, and K.A. Roth.1995. Simultaneous detection of TdT-mediateddUTP-biotyn nick end-labeling (TUNEL) positive
257
14. In Vivo Analysis of Cell Proliferation and Apoptosis in the CNS
Merighi14-aucorr.qxd 5/23/02 8:37 PM Page 257

cells and multiple immunohistochemical markers insingle tissue sections. BioTechniques 19:800-805.
112.Trere, D. 2000. AgNOR staining and quantification.Micron 31:127-131.
113.Tsanaclis, A.M., S.S. Brem, S. Gately, H.M. Shipper,and R. Wang. 1991. Statin immunolocalization inhuman brain tumors. Detection of noncycling cellsusing a novel marker of cell quiescence. Cancer 68:786-792.
114.Tsurusawa, M., M. Ito, Z. Zha, S. Kawai, Y. Takasa-ki, and T. Fujimoto. 1992. Cell-cycle-associated ex-pressions of proliferating cell nuclear antigen and Ki-67 reactive antigen of bone marrow blast cells inchildhood acute leukemia. Leukemia 6:669-674.
115.Tsutsui, K., S. Okada, M. Watanabe, T. Shohmori,S. Seki, and Y. Inoue. 1993. Molecular cloning of par-tial cDNAs for rat DNA topoisomerase II isoformsand their differential expression in brain development.J. Biol. Chem. 268:19076-19083.
116.Ulaner, G.A. and L.C. Giudice. 1997. Developmentalregulation of telomerase activity in human fetal tissuesduring gestation. Mol. Hum. Reprod. 3:769-773.
117.van Dierendonck, J.H., R. Verheijen, H.J. Kuijpers,R. van Driel, J.L. Beck, G.J. Brakenhoff, and F.C. Ra-maekers. 1989. Ki-67 detects a nuclear matrix-associ-ated proliferation-related antigen. II. Localization inmitotic cells and association with chromosomes. J. CellSci. 92:531-540.
118.van Dierendonck, J.H., J.H. Wijsman, R. Keijzer,C.J. van de Velde, and C.J. Cornelisse. 1991. Cell-cycle-related staining patterns of anti-proliferating cellnuclear antigen monoclonal antibodies. Comparisonwith BrdUrd labeling and Ki-67 staining. Am. J.Pathol. 138:1165-1172.
119.Villalba, M., J. Boeckart, and L. Journot. 1997. Pitu-itary adenylate cyclase-activating polypeptide(PACAP-38) protects cerebellar granule neurons fromapoptosis by activating the mitogen-activated proteinkinase (MAP Kinase) pathway. J. Neurosci. 17:83-90.
120.Wang, X., N.G. Zelenski, Y. Yang, J. Sakai, M.S.Brown, and J.L. Goldstein. 1996. Cleavage of sterolregulatory element binding proteins (SREBPs) byCPP32 during apoptosis. EMBO J. 15:1012-1020.
121.Waseem, N.H. and D.P. Lane. 1990. Monoclonalantibody analysis of the proliferating cell nuclear anti-gen (PCNA). Structural conversation and the detec-tion of a nucleolar form. J. Cell Sci. 96:121-129.
122.Watanabe, M., K. Tsutsui, K. Tstusui, and Y. Inoue.1994. Differential expression of the topoisomerase IIalpha and II beta mRNAs in developing rat brain.Neurosci. Res. 19:51-57.
123.Wood, K.A., B. Dipasquale, and R.J. Youle. 1993. Insitu labeling of granule cells for apoptosis-associatedDNA fragmentation reveals different mechanisms ofcell loss in developing cerebellum. Neuron 11:621-632.
124.Wood, K.A. and R.J. Youle. 1995. The role of freeradicals and p53 in neuron apoptosis in vivo. J. Neu-rosci. 15:5851-5857.
125.Wright, W.E., M.A. Piatyszek, W.E. Rainey, W. Byrd,and J.W. Shay. 1996. Telomerase activity in humangermline and embryonic tissues and cells. Dev. Genet.18:173-179.
126.Wyllie, A.H. 1980. Glucocorticoid-induced tymocyteapoptosis is associated with endogenous endonucleaseactivation. Nature 284:555-556.
127.Wyllie, A.H., R.G. Morris, A.L. Smith, and D. Dun-lop. 1984. Chromatin cleavage in apoptosis: associa-tion with condensed chromatin morphology anddependence on macromolecular synthesis. J. Pathol.142:67-77.
128.Xiong, Y., H. Zhang, and D. Beach. 1992. D typecyclins associate with multiple protein kinases and theDNA replication and repair factor PCNA. Cell71:505-514.
129.Yamaguchi, Y., K.S.E. Nozawa, N. Hayakawa, Y.Nimura, and S. Yoshida. 1998. Change in telomeraseactivity of rat organs during growth and aging. Exp.Cell Res. 242:120-127.
130.Yanik, G.A., N. Yousuf, M.A. Miller, S.H. Swerdlow,B.C. Lampkin, and A. Raza. 1992. In vivo determi-nation of cell cicle kinetics of non-Hodgkin’s lym-phomas using iododeoxyuridine and bromodeoxyuri-dine. J. Histochem. Cytochem. 40:723-728.
131.Yao, R. and G.M. Cooper. 1995. Requirement forphosphatidylinositol-3 kinase in the prevention ofapoptosis by nerve growth factor. Science 267:2003-2006.
132.Yuan, J. 1995. Molecular control of life and death.Curr. Opin. Cell Biol. 7:211-214.
133.Zakeri, Z. and R.A. Lockshin. 1994. Physiological celldeath during development and its relationship toaging. Ann. NY Acad. Sci. 719:212-229.
134.Zandvilit, D.W., A.M. Hanby, C.A. Austin, K.L.Marsch, I.B. Clak, N.A. Wright, and R. Poulsom.1996. Analysis of foetal expression sites of human typeII DNA topoisomerase alpha and beta mRNAs by insitu hybridization. Biochim. Biophys. Acta 1307:239-247.
135.Zhang, C. 1998. Monoclonal antibody as a probe forcharacterization and separation of apoptotic cells, p.63-73. In L. Zhu and J. Chun (Eds.), ApoptosisDetection and Assay Methods. Eaton Publishing, Nat-ick, MA.
136.Zhang, G., V. Gurtu, J.-T. Ma, and S.R. Kain. 1998.Sensitive detection of apoptosis using enhanced colorvariants of Annexin V conjugates, p. 1-6. In L. Zhuand J. Chun (Eds.), Apoptosis Detection and AssayMethods. Eaton Publishing, Natick, MA.
137.Zhang, G., V. Gurtu, C. Spencer, J.-T. Ma, and S.R.Kain. 1998. Detection of caspase activity associatedwith apoptosis using fluorimetric and colorimetricmethods, p. 7-14. In L. Zhu and J. Chun (Eds.),Apoptosis Detection and Assay Methods. Eaton Pub-lishing, Natick, MA.
138.Zhang, L. and J.E. Goldman. 1996. Generation ofcerebellar interneurons from dividing progenitors inthe white matter. Neuron 16:47-54.
139.Zurita, F., R. Himenez, R. Diaz de laGuardia, and M.Burgos. 1999. The relative rDNA content of a NORdetermines its level of expression and its probability ofbecoming active. A sequential silver staining and in-situ hybridization study. Chromosome Res. 7:563-570.
258
L. Lossi et al.
Merighi14-aucorr.qxd 5/23/02 8:37 PM Page 258

259
OVERVIEW
This chapter outlines the use of confocalmicroscopy combined with immunofluo-rescence staining for examining nerve cellsin the central nervous system (CNS) andstudying the synaptic connections betweenthem. A method for carrying out immuno-labeling with two or three different fluores-cent dyes is described, together with modi-fications that allow this to be combinedwith tract tracing, intracellular injection, orlectin labeling, and also a new techniquefor combining confocal and electron mi-croscopy (EM) on sections which havebeen processed for immunocytochemistry.With these approaches, it is possible tosearch for and quantify contacts betweenneurons at the light microscopic level andthen examine representative contacts at theultrastructural level to determine whethersynapses are present.
BACKGROUND
Immunocytochemistry has been used ex-tensively in anatomical studies of the CNS.
Early investigators used single antibodies,for example, to demonstrate the distribu-tion of neurons which used a particularneurotransmitter, however, more recently,the detection of two or even three differentantigens has become common. This ap-proach (multiple immunolabeling) hasmany applications in neurobiology. For ex-ample, it allows the demonstration of twotransmitters in a single neuron, which is im-portant for studies of cotransmission, andpermits the association between neurotrans-mitters and their receptors to be examined(20). Multiple immunolabeling has alsoproved very useful as a way of investigatingthe connections between nerve cells whichform the basis of neuronal circuits withinthe CNS. If two populations of neurons canbe revealed with different antibodies, thenimmunocytochemistry can be used to de-termine whether, for example, the axons ofone population form synapses with the cellbodies or dendrites of the other.
There are several ways of identifyingmore than one antigen in a piece of tissue,however the simplest (both conceptuallyand in practice) is to apply two or more(primary) antibodies raised in different
Cellular and Molecular Methods in Neuroscience ResearchEdited by A. Merighi and G. Carmignoto
Confocal Imaging of Nerve Cells and Their Connections
Andrew J. ToddLaboratory of Human Anatomy, Institute of Biomedical and LifeSciences, University of Glasgow, Glasgow, UK, EU
15
Merighi15-aucorr.qxd 5/23/02 8:43 PM Page 259

species to a single section, and then revealthem with different labels. These labels (forexample fluorescent dyes) are usually at-tached to secondary antibodies (anti-im-munoglobulins) which bind to the primaryantibodies when applied to the section. Be-cause secondary antibodies can be madespecific for the immunoglobulin of a par-ticular species (e.g., rabbit, mouse, rat), it ispossible to reveal each primary antibodywith a different label. This approach hasbecome more straightforward over the lastfew years because of the increased availabil-ity of primary antibodies raised in a varietyof different species, together with the devel-opment of secondary antibodies whichshow a high degree of species specificity.While it is possible to use this approachwith brightfield microscopy, by revealingeach antigen with a different colored dye, amore satisfactory method is to use fluores-cent dyes, since it is possible to excite theseselectively by means of appropriate filtersets, which means that each fluorescent dyecan be viewed independently of any others.Confocal microscopy has provided a partic-ularly useful way of examining such sec-tions for several reasons (3). Firstly, it pro-vides extremely good spectral separation ofdifferent fluorescent dyes with minimal“bleed-through” fluorescence, which meansthat each antigen can be identified with lit-tle interference from the others. Secondly,the very limited depth of focus permits thin“optical sections” through a thicker (e.g.,Vibratome) section to be viewed, which re-sults in a greatly improved image with in-creased spatial resolution. Thirdly, theseoptical sections can be reconstructed toprovide three-dimensional informationabout the distribution of immunostainingwith each antibody and the relationship be-tween immunolabeled structures.
In studies of neuronal circuitry, it is nec-essary to use EM in order to confirm thatsynapses are present at points of contact be-tween pairs of neurons (see also Chapter
10). Although the high resolution of theelectron microscope permits unequivocalidentification of synapses, the time-consum-ing nature of the technique together withthe small size of the volumes of tissue thatcan be examined make it difficult to studylarge numbers of contacts. Thus, although itmay be possible to determine whethersynapses are present between two neurons, itis not usually feasible to determine their fre-quency or the spatial distribution on thepostsynaptic cell. While confocal mi-croscopy does not allow identification ofsynapses, it is still extremely valuable instudies of neuronal connections, since itpossible to examine entire neurons with theconfocal microscope. This means that thedensity of contacts which these neurons re-ceive from particular types of axon can bedetermined, together with the distributionof such contacts on different parts of the cellbody or dendritic tree of the target neuron.It is clear that confocal microscopy and EM,therefore, have complementary strengths.Confocal microscopy can be used to samplecontacts over whole neurons, while EM al-lows confirmation that synapses are presentat these contacts. In principle, there are twoways of designing a study that involves bothconfocal microscopy and EM of immunos-tained material: (i) one can prepare differenttissue for each technique, using immunoflu-orescent labeling for confocal microscopyand electron-dense markers for EM; or (ii)one can attempt to carry out both tech-niques on the same tissue section. Althoughthe former approach is technically easier,there are some advantages to carrying outcombined confocal microscopy and EM onthe same tissue (see below), and we have re-cently developed a method which allowsthis to be done (14,15,19).
If the pre- and postsynaptic componentsof a neuronal circuit possess different anti-gens which allow them to be distinguished,then it is possible to use immunocytochem-istry and confocal microscopy to search for
260
A.J. Todd
Merighi15-aucorr.qxd 5/23/02 8:43 PM Page 260

contacts between the two neurons withoutthe need for any experimental intervention.Many different types of antibody can beused in studies of this kind, including anti-bodies directed against neurotransmitters(or their synthetic enzymes), neuropeptides,or receptors. The choice of antigens–anti-bodies will obviously be determined by thetypes of neurons that are to be examined, bythe subcellular distribution of antigens (forexample some antigens may only be presentin the axon or in the soma and dendrites ofthe neuron to be investigated), and also bythe availability of antibodies which havebeen raised in different species and cantherefore be used in combination.
Although immunocytochemistry alonecan be used to examine some circuits withinthe CNS, it is often necessary to combine itwith other techniques, such as tract tracingmethods or intracellular injection. The useof anterograde or retrograde tract tracing al-lows circuits that involve identified projec-tion neurons to be examined (see Chapters12 and 13). A simple way of combiningtract tracing with immunofluorescence forstudies of neuronal circuitry is to use tracerssuch as unconjugated cholera toxin B sub-unit (CTb) or Phaseolus leucoagglutinin(PHA-L), which can be detected with anti-bodies (14,15). Dextrans can also be used astracers in studies of this kind (9). They caneither be conjugated directly to a fluores-cent dye, or else to biotin, in which casethey are subsequently revealed with avidinconjugated to a suitable fluorochrome. Bycarrying out immunofluorescence on sec-tions which contain neurons that have beenlabeled by intracellular injection, the synap-tic inputs to or outputs from physiological-ly identified neurons can be examined(5,13). Two compounds that have beenused as intracellular markers in studies ofthis kind are neurobiotin (which is subse-quently detected with an avidin–fluo-rochrome conjugate) (13) and rhodamine–dextran (5). It is also possible to inject the
fluorescent dye Lucifer Yellow into neurons(1), however, Lucifer Yellow has very broadexcitation and emission spectra, whichmake it less suitable in combination withimmunofluorescence staining.
In certain situations, lectin binding canbe used to identify neuronal populations,for example, unmyelinated primary affer-ents in the spinal dorsal horn are able tobind a variety of lectins, including Ban-deiraea simplicifolia isolectin B4 (BSI-B4).The lectin, conjugated either to biotin or toa fluorescent dye, can be applied to tissuesections during immunocytochemical pro-cessing in order to reveal these afferents(18,21).
PROTOCOLS
Protocol for Double or Triple LabelingImmunofluorescence
Materials and Reagents
• Phosphate buffer (PB), 0.2 M stock:0.2 M NaH2PO4/Na2HPO4 mixed topH 7.4.
• Fixative: 4% freshly-depolymerizedparaformaldehyde in 0.1 M PB. Heat400 mL distilled water to 60°C andadd 40 g paraformaldehyde. Add con-centrated NaOH dropwise until sus-pension clears. Add 500 mL 0.2 M PBand make up to 1 L with distilled wa-ter. Filter and use within 24 hours.
• Phosphate-buffered saline (PBS): 0.01M NaH2PO4/Na2HPO4 to pH 7.4,0.3 M NaCl. Note that this solutioncontains a relatively high concentrationof NaCl. We have found that for certainantibodies, the higher ionic strengthgreatly improves immunostaining by re-ducing background staining, and wenow routinely use this recipe.
• PBS with Triton X-100 (PBST):PBS, 0.3% Triton X-100.
261
15. Confocal Imaging of Nerve Cells and Their Connections
Merighi15-aucorr.qxd 5/23/02 8:43 PM Page 261

• Appropriate primary and secondaryantibodies [we use secondary antibod-ies raised in donkey (Jackson Immuno-Research, West Grove, PA, USA), seebelow].
• Glycerol-based antifade mounting med-ium (e.g., Vectashield; Vector Laborato-ries, Peterborough, UK).
Procedure
1. Fix animal by perfusion with 4%formaldehyde under terminal anesthe-sia. Remove blocks of CNS and store insame fixative for 2 to 24 hours. Someantigens do not tolerate extended fixa-tion, and in cases of poor or absent im-munostaining when using a new anti-body, it is worth reducing the fixationtime to around 2 hours.
2. Rinse blocks in PB.3. Cut Vibratome sections (40–70 µm)
into PB.4. Place sections into 50% ethanol in dis-
tilled water for 30 minutes immediatelyafter cutting (10). This step greatly in-creases penetration of antibodies intoVibratome sections.
5. Rinse 3 × 5 minutes in PBS.6. Incubate 18 to 72 hours in cocktail of
primary antibodies (each raised in a dif-ferent species) at appropriate dilutionsin PBST. Note: Although many published meth-ods recommend adding normal block-ing serum (from the species in whichthe secondary antibodies were raised) tothe antibody cocktails in order to re-duce background staining, we have notfound any evidence that this improvesthe quality of immunostaining, and sowe do not use blocking serum.
7. Rinse 3 × 5 minutes in PBS.8. Incubate 2 to 24 hours in cocktail of flu-
orescent species-specific secondary anti-bodies diluted in PBST. It is vital that
the secondary antibodies are raised indifferent species from those of the pri-mary antibodies. For convenience, weroutinely use secondary antibodies raisedin donkey. Donkey has become a “uni-versal donor” for secondary antibodies inmultiple-immunolabeling studies, sincefew (if any) primary antibodies are raisedin this species. Obviously, the secondaryantibodies chosen must be directedagainst the species in which the primaryantibodies were raised, and each must beconjugated to a different fluorescent dye.The choice of fluorescent dyes dependson the wavelength of the laser lines (3).We use fluorescein isothiocyanate(FITC), lissamine rhodamine (LRSC),and cyanine 5.18 (Cy5), since theseare optimally excited by the lines of aKrypton-Argon laser (488 nm, 568 nm,647 nm, respectively).
9. Rinse 3 × 5 minutes in PBS.10. Mount sections on glass slides with an
appropriate antifade medium. This re-duces the rate of photobleaching,which is otherwise a problem, particu-larly with FITC.
11. Apply a coverslip and seal around theedges with nail varnish.
12. Store slides in a -20°C freezer untilneeded. Slides prepared in this way canbe kept for extended periods (severalyears).
13. Examine with the confocal microscope.
Notes for Combining ImmunofluorescenceStaining with Other Techniques
Tract Tracing Experiments (see alsoChapter 12)
The following additional reagents maybe needed according to the type of traceremployed:
• Rabbit antibodies against CTb andPHA-L (Sigma, St. Louis, MO, USA).
262
A.J. Todd
Merighi15-aucorr.qxd 5/23/02 8:43 PM Page 262
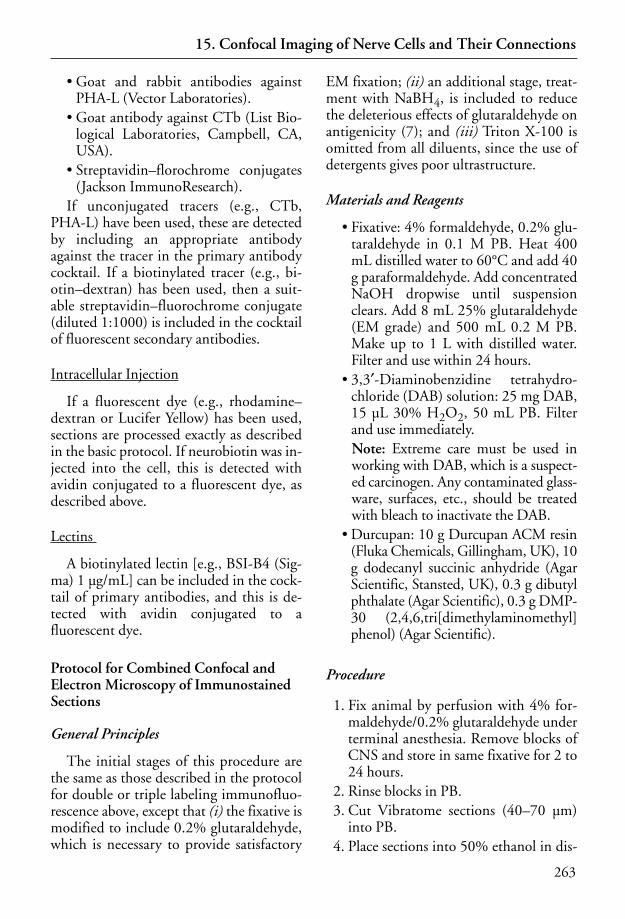
• Goat and rabbit antibodies againstPHA-L (Vector Laboratories).
• Goat antibody against CTb (List Bio-logical Laboratories, Campbell, CA,USA).
• Streptavidin–florochrome conjugates(Jackson ImmunoResearch).
If unconjugated tracers (e.g., CTb,PHA-L) have been used, these are detectedby including an appropriate antibodyagainst the tracer in the primary antibodycocktail. If a biotinylated tracer (e.g., bi-otin–dextran) has been used, then a suit-able streptavidin–fluorochrome conjugate(diluted 1:1000) is included in the cocktailof fluorescent secondary antibodies.
Intracellular Injection
If a fluorescent dye (e.g., rhodamine–dextran or Lucifer Yellow) has been used,sections are processed exactly as describedin the basic protocol. If neurobiotin was in-jected into the cell, this is detected withavidin conjugated to a fluorescent dye, asdescribed above.
Lectins
A biotinylated lectin [e.g., BSI-B4 (Sig-ma) 1 µg/mL] can be included in the cock-tail of primary antibodies, and this is de-tected with avidin conjugated to afluorescent dye.
Protocol for Combined Confocal andElectron Microscopy of ImmunostainedSections
General Principles
The initial stages of this procedure arethe same as those described in the protocolfor double or triple labeling immunofluo-rescence above, except that (i) the fixative ismodified to include 0.2% glutaraldehyde,which is necessary to provide satisfactory
EM fixation; (ii) an additional stage, treat-ment with NaBH4, is included to reducethe deleterious effects of glutaraldehyde onantigenicity (7); and (iii) Triton X-100 isomitted from all diluents, since the use ofdetergents gives poor ultrastructure.
Materials and Reagents
• Fixative: 4% formaldehyde, 0.2% glu-taraldehyde in 0.1 M PB. Heat 400mL distilled water to 60°C and add 40g paraformaldehyde. Add concentratedNaOH dropwise until suspensionclears. Add 8 mL 25% glutaraldehyde(EM grade) and 500 mL 0.2 M PB.Make up to 1 L with distilled water.Filter and use within 24 hours.
• 3,3′-Diaminobenzidine tetrahydro-chloride (DAB) solution: 25 mg DAB,15 µL 30% H2O2, 50 mL PB. Filterand use immediately. Note: Extreme care must be used inworking with DAB, which is a suspect-ed carcinogen. Any contaminated glass-ware, surfaces, etc., should be treatedwith bleach to inactivate the DAB.
• Durcupan: 10 g Durcupan ACM resin(Fluka Chemicals, Gillingham, UK), 10g dodecanyl succinic anhydride (AgarScientific, Stansted, UK), 0.3 g dibutylphthalate (Agar Scientific), 0.3 g DMP-30 (2,4,6,tri[dimethylaminomethyl]phenol) (Agar Scientific).
Procedure
1. Fix animal by perfusion with 4% for-maldehyde/0.2% glutaraldehyde underterminal anesthesia. Remove blocks ofCNS and store in same fixative for 2 to24 hours.
2. Rinse blocks in PB.3. Cut Vibratome sections (40–70 µm)
into PB.4. Place sections into 50% ethanol in dis-
263
15. Confocal Imaging of Nerve Cells and Their Connections
Merighi15-aucorr.qxd 5/23/02 8:43 PM Page 263

tilled water for 30 minutes immediatelyafter cutting.
5. Rinse 3 × 5 minutes in PBS.6. Place sections in 1% NaBH4 in PBS for
30 minutes. Leave lids off. Note: NaBH4 is toxic and potentiallyexplosive.
7. Rinse thoroughly in PBS (e.g., 10× over90 minutes). The lids can be placed onbottles once bubbles cease to appear.
8. Incubate 18 to 72 hours in cocktail ofprimary antibodies diluted in PBS.
9. Rinse 3 × 5 minutes in PBS.10. Incubate 4 to 24 hours in cocktail of
fluorescent species-specific secondaryantibodies (raised in donkey) diluted inPBS.
11. Rinse 3 × 5 minutes in PBS.12. Mount sections on glass slides with a
glycerol-based antifade mountingmedium.
13. Apply a coverslip and seal around theedges with nail varnish.
14. Store slides in a -20°C freezer untilneeded.
15. Examine sections with the confocal mi-croscope.
16. Remove coverslip and rinse section inPB (3 × 5 min).
17. Incubate 72 hours in species-specificbiotinylated secondary antibodies(raised in donkey, diluted 1:200 in PBS;Jackson ImmunoResearch). Choose sec-ondary antibodies directed against thoseprimary antibodies which are to be re-vealed with EM. Although the primaryantibodies already have fluorescent sec-ondaries attached, they are still able tobind biotinylated secondary antibodies.
18. Rinse 3 × 10 minutes PBS.19. Incubate 72 hours in avidin–peroxidase
conjugate (e.g., extravidin–peroxidasefrom Sigma, diluted 1:1000). We havefound that avidin–peroxidase conjugatepenetrates further into Vibratome sec-
tions than the avidin–biotin–peroxi-dase (ABC) complex and is, therefore,more suitable for this protocol.
20. Rinse 3 × 10 minutes PBS.21. Rinse 5 minutes PB.22. Incubate for approximately 5 minutes
in DAB solution.23. Rinse 3 × 5 minutes PB.24. Osmicate: 1% OsO4 in PB for 30 min-
utes. Note: OsO4 is highly toxic and volatile,so this must be carried out in a fumecupboard.
25. Rinse 3 × 5 minutes water.26. Dehydrate in acetone (70%, 90%, 3 ×
100%, 10 min each). Block staining inuranyl acetate (30 min in a saturatedsolution of uranyl acetate in 70% ace-tone) can be included during the dehy-dration stage.
27. 1:1 Acetone:Durcupan mixture for 1hour.
28. Pure Durcupan for 12 to 24 hours.29. Flat-embed sections from Durcupan be-
tween acetate sheets, lay on a flat surface(e.g., microscope slide) with weight ontop, and cure at 60°C for 48 hours.
30. Examine section and identify region ofinterest. Remove 1 acetate sheet andapply to a block of cured resin with adrop of liquid Durcupan. Cure over-night. Trim block, cut ultrathin sec-tions, and mount on Formvar-coatedsingle-slot grids.
31. Stain grids with lead citrate.32. Examine with electron microscope.
RESULTS AND DISCUSSION
Primary Afferent Input to Neurons inLamina III and IV of the Spinal DorsalHorn
The use of the approaches described
264
A.J. Todd
Merighi15-aucorr.qxd 5/23/02 8:43 PM Page 264
above can be illustrated by our recent stud-ies of the primary afferent input to a popu-lation of neurons with cell bodies in lami-nae III and IV of the spinal cord dorsalhorn (14,15,18) (Figures 1 and 2). Theneurokinin 1 (NK1) receptor, on whichsubstance P acts, is present on certain cellsthroughout the dorsal horn, including apopulation of large neurons with cell bod-ies in lamina III or IV, which have promi-nent dorsally-directed dendrites that passup into lamina I, as well as dendrites thatarborize in deeper laminae (2,4). On NK1receptor–immunoreactive neurons in thespinal cord, the receptor is found through-out the plasma membrane of the cell bodyand dendritic tree, but is not present ontheir axons. This means that antibodiesagainst the NK1 receptor can be used to re-veal the entire dendritic trees as well as thecell bodies of those neurons on which it ispresent (Figures 1c and 2a).
Since the large NK1 receptor–immu-noreactive neurons in laminae III and IV ofthe dorsal horn have dendritic trees that canextend from lamina I to lamina V, theycould potentially receive monosynaptic in-put from various types of primary afferent,including both unmyelinated (C) fibers,which terminate mainly in laminae I and II,and large myelinated afferents which ar-borize in laminae III through V (22). Un-myelinated primary afferents can be furthersubdivided into 2 major classes: (i) thosewhich contain neuropeptides and terminatemainly in lamina I and the outer part oflamina II (IIo); and (ii) those that do notcontain peptides and which end in the in-ner part of lamina II (IIi). In the rat, all pep-tidergic C fibers contain calcitonin gene-re-lated peptide (CGRP) and many alsocontain substance P (8). Although sub-stance P-containing axons in the dorsalhorn can originate from various sources (lo-cal neurons, descending axons, or primaryafferents), CGRP in the dorsal horn is de-rived exclusively from primary afferents.
This means that substance P-containingprimary afferents can be distinguished fromother axons which contain the peptide bythe presence of CGRP. By carrying outtriple labeling immunofluorescence stainingwith antibodies against NK1 receptor, sub-stance P, and CGRP (14), we were able todemonstrate that the large lamina III/IVNK1 receptor–immunoreactive neurons re-ceive numerous contacts from substance P-containing axons (Figure 2, c–f ), and thatover 90% of these are of primary afferentorigin, since they also contain CGRP (Fig-ure 1a). Interestingly, the substance P-con-taining afferents not only contact the den-drites of these cells in laminae I and IIo(where the afferents are very numerous),but also pass ventrally along the dendrites inlaminae IIi and III (Figure 2, d–f ). In orderto establish that the substance P-containingaxons formed synapses on the dendrites ofthese cells, we used the combined confo-cal–electron microscopic technique de-scribed above (Figures 3 and 4) (14). Asym-metrical synapses were found at all of thecontacts between substance P-immunoreac-tive primary afferents and dendrites of lam-ina III/IV NK1 receptor–immunoreactiveneurons which were examined (Figure 4).
We had previously found that some ofthe lamina III/IV NK1 receptor–immuno-reactive neurons projected to the thalamus(12). We therefore injected CTb into thethalamus and performed triple immunoflu-orescence labeling to detect CTb, NK1 re-ceptor, and substance P (Figure 2) and wereable to demonstrate that cells of this mor-phological type, which belonged to the spi-nothalamic tract, also received dense inner-vation from substance P-containing axons.
Nonpeptidergic C fibers bind BSI-B4,however the lectin also binds to some pep-tidergic afferents. Since all peptidergic af-ferents contain CGRP (6), it is possible toidentify nonpeptidergic C fibers with con-focal microscopy, since these will bind BSI-B4 but will not be CGRP immunoreactive.
265
15. Confocal Imaging of Nerve Cells and Their Connections
Merighi15-aucorr.qxd 5/23/02 8:43 PM Page 265

266
A.J. Todd
Figure 1. The association between largeNK1 receptor–immunoreactive laminaIII/IV neurons with long dorsal dendritesand three different types of primary affer-ent in the dorsal horn of the rat spinal cord,seen in transverse (a) or parasagittal (b andc) sections. Each image contains a dendritebelonging to a NK1 receptor–immunoreac-tive neuron (green), and in panel c, the cellbody of one of these neurons is also seen. (a)A section also reacted with a monoclonal an-tibody to substance P (blue) and an anti-serum against CGRP (red). Most of the im-munoreactive axons contain both peptidesand therefore appear pink, and where theseoverlap the NK1 receptor–immunoreactivedendrite, they appear white. The dendrite isassociated with many varicosities whichcontain both substance P and CGRP (i.e.,substance P-containing primary afferent ter-minals). (b) The section has been im-munostained with CGRP antiserum (blue)and incubated in biotinylated BSI-B4,which was revealed with avidin–rhodamine(red). Many of the CGRP-immunoreactiveaxons have also bound the lectin and appearpink or purple. Numerous red axons are pre-sent in the lower half of the field: these havebound the lectin but are not CGRP-im-munoreactive and, therefore, belong to non-peptidergic C fibers. Very few of these axonsmake contact with the NK1-immunoreac-tive dedrite. (c) Shown is the cell body andproximal dendrites of a lamina III NK1 re-ceptor–immunoreactive neuron from a ratin which CTb had been injected into thesciatic nerve 3 days previously. CTb (red)has been taken up and transported by myeli-nated afferents belonging to the sciaticnerve, which terminate extensively in lami-na III. Although there are many CTb-im-munoreactive axons surrounding the cell,very few make contact with it. Panel a wasgenerated from 8 optical sections at 1 µmseparation, panel b from 9 optical sections at0.5 µm separation, while panel c is from asingle optical section. Scale bar = 20 µm foreach image. Panel b is reprinted with per-mission from Neuroscience 94, Sakamoto,H., R.C. Spike, and A.J. Todd, Neurons inlaminae III and IV of the rat spinal cordwith the neurokinin-1 receptor receive fewcontacts from unmyelinated primary affer-ents which do not contain substance P, p.903-908, Copyright (1999), with permis-sion from Elsevier Science. Panel c is repro-duced with permission from Reference 15.(See color plate A12.)
Merighi15-aucorr.qxd 5/23/02 8:43 PM Page 266

Using this method, we found that althoughnumerous nonpeptidergic afferents werepresent in lamina IIi, very few of thesemade contact with the dorsal dendrites ofthe lamina III/IV NK1 receptor–immuno-reactive neurons which passed through thisregion (Figure 1b) (18).
Myelinated primary afferent terminalsin the dorsal horn can be identified bymeans of an anterograde (transganglionic)transport technique. If CTb is injectedinto an intact somatic nerve in the rat, it istaken up almost exclusively by myelinatedafferents and transported through the dor-sal root ganglion and into their axon ter-minals within the spinal cord (17). We
combined transganglionic transport ofCTb injected into the sciatic nerve withimmunofluorescence staining and foundthat although the dendrites of laminaIII/IV NK1 receptor–immunoreactiveneurons passed through regions that con-tained numerous terminals belonging tosciatic nerve myelinated afferents, they re-ceived only a limited number of contactsfrom these afferents (Figure 1c). With thecombined confocal–electron microscopictechnique, we were able to demonstratethat synapses were present at some of thesecontacts and, therefore, concluded that thecells receive a limited monosynaptic inputfrom myelinated primary afferents (15).
267
15. Confocal Imaging of Nerve Cells and Their Connections
Figure 2. Contacts formed by sub-stance P-containing axons onto alamina III NK1 receptor–im-munoreactive spinothalamic tractneuron. (a) Shown is the cell bodyand dendrites of the neuron in aparasagittal section scanned to re-veal only NK1 receptor-immuno-staining (green). Boxes indicate theregions shown in the remainingparts of the figure. (b) The cellbody of the neuron contains CTb(blue), which had been injectedinto the thalamus 3 days previously,thus allowing identification of thisas a spinothalamic neuron. (c–f )Different parts of the dendritic treereceive numerous contacts fromsubstance P-immunoreactive axons,which are orientated along thelengths of the dendrites (red). Panela was obtained from 9 optical sec-tions 1.5 µm apart, panels c and ethrough f from 4 optical sections,and panel d from 7 optical sections,each 0.5 µm apart. Scale bars: panela = 50 µm, panel b = 20 µm, panelsc through f = 10 µm. Reproducedwith permission from Reference 14.(See color plate A13.)
Merighi15-aucorr.qxd 5/23/02 8:43 PM Page 267

These results demonstrate that eventhough the large lamina III/IV neuronswith NK1 receptors have dendrites thatpass through several laminae, their primaryafferent input is highly selective. They re-ceive a dense innervation from substance P-containing afferents, which frequently runalong their dorsal dendrites and form nu-merous synapses on them (14), however,they are sparsely innervated by myelinatedafferents in laminae III and IV (15), and re-
ceive very few contacts from nonpeptider-gic C fibers (18).
Technical Aspects
Benefits of Triple Fluorescence Labeling
Although it is often possible to investi-gate neuronal circuits with only two labels(one each for the pre- and postsynapticcomponents of the circuit), there are many
268
A.J. Todd
Figure 3. Combined confocal mi-croscopy and EM of a dorsal den-drite belonging to a lamina IIINK1 receptor–immunoreactiveneuron from a parasagittal sectionthat had been reacted with NK1receptor, substance P, and CGRP.(a) NK1 receptor immunoreactivi-ty in a series of 7 optical sections at0.5 µm intervals. The arrow showsa small branch given off from themain dendritic shaft (D). (b) A sin-gle confocal section from the seriesused to generate panel b. In thiscase, NK1 receptor appears green,substance P is blue, and CGRP isred. Boutons, which contain bothpeptides, appear pink. Several sub-stance P-immunoreactive varicosi-ties are in contact with the NK1 re-ceptor–immunoreactive dendrite,and 4 of these are indicated withthe small numbered arrows. Thevaricosity numbered 2 is only sub-stance P-immunoreactive, whereasthose numbered 1, 3, and 4 haveboth substance P and CGRP im-munoreactivity. (c) The corre-sponding region seen with lightmicroscopy after the immuno-peroxidase reaction and at a focaldepth approximately equivalent tothe confocal image in panel b. Themain dendritic shaft (D) and partof its small branch (arrow) areclearly seen, whereas most of theright-hand branch is out of focus.Many substance P-immunoreactivevaricosities are visible, includingthe ones indicated with arrows inpanel b. (d) A low magnificationelectron micrograph of the corre-sponding region. The section is at adepth nearly equivalent to the con-focal image in panel b. Scale bar =10 µm. Modified and reproducedwith permission from Reference14. (See color plate A14.)
Merighi15-aucorr.qxd 5/23/02 8:43 PM Page 268

situations in which it is necessary or desir-able to use a third label. Thus, in some casesit is possible to refine the identification ofone of the two neurons which are involvedin the circuit by the use of two labels. Forexample, combining either substance P-im-munostaining or BSI-B4 binding with de-tection of CGRP allowed us to identify twodifferent neurochemical types of primary af-ferent terminal in the superficial dorsal horn(Figure 1, b and c). A third label can then be
used to reveal the other component of thecircuit (in this case, neurons with the NK1receptor). In addition, triple labeling can beused to examine inputs to a single neuronfrom two different axonal populations si-multaneously, thus allowing interactionsbetween the two inputs to be examined.This approach is also useful in studies ofneurons that have been labeled by intracel-lular injection, since it increases the amountof data that can be collected from each cell
269
15. Confocal Imaging of Nerve Cells and Their Connections
Figure 4. High magnification elec-tron micrographs to show synapsesbetween the substance P-immuno-reactive axonal boutons (A), whichwere indicated with numbered ar-rows in Figure 3, and the NK1 re-ceptor–immunoreactive dendriticshaft (D) or its small branch (B).(a–d) Shown are boutons numbered1 through 4, respectively. In eachcase an asymmetrical synaptic spe-cialization is clearly seen betweenthe arrows. Scale bar = 0.5 µm.Modified and reproduced with per-mission from Reference 14.
Merighi15-aucorr.qxd 5/23/02 8:43 PM Page 269

and may therefore reduce the number ofneurons that need to be injected.
Another situation in which a third labelcan be extremely useful is when studyingprojection neurons that have been identi-fied with retrograde tracers. Even the mostsensitive tracers used for retrograde labeling(e.g., CTb) seldom give complete filling ofthe dendritic trees of labeled neurons, andexamining connections formed by axons onthe distal dendrites of these cells is thereforeusually not possible. If the entire dendritictree of the retrogradely labeled neuron canbe immunostained, for example with an an-tibody against a membrane protein such asa receptor, then this allows even the distaldendrites to be examined (Figure 2). Pol-lock et al. (16) have recently refined this ap-proach to allow the simultaneous detectionof four different fluorescent labels in thesame section, by using the retrograde tracerFluorogold (which is excited by UV lightand was viewed with conventional epifluo-rescence) and carrying out triple immuno-fluorescence labeling and confocal micro-scopy with secondary antibodies conjugatedto FITC, LRSC, and Cy5.
Combined Confocal and ElectronMicroscopy
The advantages of being able to detectthree compounds simultaneously led us todevelop a method that would allow bothconfocal and electron microscopic exami-nation of the same immunostained section.With conventional (pre-embedding) im-munocytochemistry for EM, if more thanone antigen is to be detected, each must belabeled with a different electron-densemarker. Although it is relatively straightfor-ward to label two different antigens, for ex-ample with DAB and silver-intensified im-munogold (20), triple labeling is muchmore difficult. In the method which is de-scribed in this chapter, only one electron-dense marker (DAB) is used, and the dis-
tinction between profiles that were stainedwith different antibodies is made by corre-lating the appearance in electron micro-scope sections with that which had beenobtained with the confocal microscope(Figures 3 and 4).
There are two main limitations to thismethod. Firstly, although penetration ofthe immunofluorescence staining in the Vi-bratome sections is generally very good(even without the use of detergents), thepenetration of the peroxidase/DAB reac-tion product is much more limited andusually extends less than 5 µm from the cutsurfaces of the section. For this reason, it isnecessary to select contacts which lie closeto the section surface for analysis. Second-ly, ultrastructural preservation in tissue thathas been prepared in this way is usually notas good as that seen with conventional elec-tron microscopic methods, presumably dueto the large number of stages involved andthe prolonged processing time. However, itis good enough to allow identification ofsynaptic specializations, and this is themain reason for using this method in stud-ies of neuronal circuitry.
Quantification of Contacts
One of the advantages of confocal mi-croscopy for studies of neuronal circuits isthat the frequency of contacts which a neu-ron receives from a particular type of axoncan be measured (14,15,18). This meansthat, for example, the density of contactsformed by a population of axons onto twodifferent groups of target neurons can becompared to determine whether one groupis selectively innervated (14). In order toanalyze the density of contacts onto thedendritic trees of neurons, it is obviouslynecessary to measure the lengths of thesedendrites from confocal images. We havefound that the program Neurolucida forConfocal (MicroBrightField, Colchester,VT, USA) is particularly suitable for this
270
A.J. Todd
Merighi15-aucorr.qxd 5/23/02 8:43 PM Page 270

purpose, since it can be used to analyzestacks of confocal images.
Measurements along the z-axis (depththrough the section) in series of confocalimages are obtained from the focus motorthat moves the specimen up and down be-tween scans, and the vertical distance be-tween each image in the series (z separa-tion) is used by the program when itcalculates the length of dendrites. However,because of differences in refractive index be-tween the mounting medium of the speci-men and the medium which lies betweenthe objective lens and the coverslip (eitherair or immersion oil, depending on the ob-jective lens), the vertical distance moved bythe stage is not exactly the same as the ap-parent distance moved through the speci-men, and a correction factor is required(11). This problem is discussed in detail byMajlof and Forsgren (11), who provide cor-rection factors for various combinations ofmedia. With a glycerol-based mountingmedium, the correction factor for a dry lensis 1.47 and for an oil lens it is 0.97. Thus,for example, if a z-series is scanned with adry lens and the separation between eachimage is 1 µm (measured from the focusmotor), the actual vertical separation be-tween images in the series is 1.47 µm.
In quantitative studies of neuronal cir-cuits, it is obviously essential that penetra-tion of antibodies into the section is com-plete, otherwise the number of contactswill be underestimated. Since antibodiespenetrate from the cut surfaces of a section,the degree of penetration of immunostain-ing can usually be assessed by scanningthrough the full thickness of the section. Ifthe density of immunostained profiles isapproximately constant throughout thesection thickness, then penetration is prob-ably adequate. If there is a reduction in thenumber of stained profiles towards the cen-ter of the section thickness, then this clearlysuggests that penetration is not uniform.We have found that, for most of the anti-
bodies which we use, pretreatment withethanol (10) and the use of detergents (e.g.,Triton X-100) in the incubation buffers re-sults in complete penetration of immunos-taining. However, with certain antibodies itis not possible to achieve satisfactory pene-tration into the sections, and these anti-bodies are therefore not suitable for use inquantitative studies.
ACKNOWLEDGMENTS
I thank Dr. S. Vigna for the gift of NK1receptor antiserum, Drs. M. Naim, R.C.Spike, S.A.S. Shehab, and H. Sakamoto fortheir participation in the experiments de-scribed in this chapter, Mrs. C. Watt andMrs. M.M. McGill for expert technical as-sistance, and the Wellcome Trust for finan-cial support.
REFERENCES
1.Belichenko, P.V. and A. Dahlström. 1995. Confocallaser scanning microscopy and 3-D reconstructions ofneuronal structures in human brain cortex. Neuroim-age 2:201-207.
2.Bleazard, L., R.G. Hill, and R. Morris. 1994. The cor-relation between the distribution of NK1 receptor andthe actions of tachykinin agonists in the dorsal horn ofthe rat indicates that substance P does not have a func-tional role on substantia gelatinosa (lamina II) neurons.J. Neurosci. 14:7655-7664.
3.Brelje, T.C., M.W. Wessendorf, and R.L. Sorenson.1993. Multicolor laser scanning confocal immunofluo-rescence microscopy: practical applications and limita-tions, p. 97-181. In B. Matsumoto (Ed.), Cell Biologi-cal Applications of Confocal Microscopy. AcadamicPress, San Diego.
4.Brown, J.L., H. Liu, J.E. Maggio, S.R. Vigna, P.W.Mantyh, and A.I. Basbaum. 1995. Morphologicalcharacterization of substance P receptor-immunoreac-tive neurons in rat spinal cord and trigeminal nucleuscaudalis. J. Comp. Neurol. 356:327-344.
5.Jankowska, E., D.J. Maxwell, S. Dolk, and A. Dahl-ström. 1997. A confocal and electron microscopicstudy of contacts between 5-HT fibres and feline dorsalhorn interneurons in pathways from muscle afferents.J. Comp. Neurol. 387:430-438.
6.Ju, G., T. Hökfelt, E. Brodin, J. Fahrenkrug, J.A. Fis-cher, P. Frey, R.P. Elde, and J.C. Brown. 1987. Prima-ry sensory neurons of the rat showing calcitonin gene-related peptide immunoreactivity and their relation to
271
15. Confocal Imaging of Nerve Cells and Their Connections
Merighi15-aucorr.qxd 5/23/02 8:43 PM Page 271

substance P-, somatostatin-, galanin-, vasoactive in-testinal polypeptide- and cholecystokinin-immuno-reactive ganglion cells. Cell Tissue Res. 247:417-431.
7.Kosaka, T., I. Nagatsu, J.-Y. Wu, and K. Hama. 1986.Use of high concentrations of glutaraldehyde for im-munocytochemistry of transmitter-synthesizing en-zymes in the central nervous system. Neuroscience18:975-990.
8.Lawson, S.N. 1992. Morphological and biochemicalcell types of sensory neurons, p. 27-59. In S.A. Scott(Ed.), Sensory Neurones: Diversity, Development andPlasticity. Oxford University Press, New York.
9.Li, J.-L., T. Kaneko, S. Nomura, Y.-Q. Li, and N.Mizuno. 1997. Association of serotonin-like immuno-reactive axons with nociceptive projection neurons inthe caudal spinal trigeminal nucleus of the rat. J.Comp. Neurol. 384:127-141.
10.Llewellyn-Smith, I.J. and J.B. Minson. 1992. Com-plete penetration of antibodies into Vibratome sectionsafter glutaraldehyde fixation and ethanol treatment:light and electron microscopy for neuropeptides. J.Histochem. Cytochem. 40:1741-1749.
11.Mailof, L. and P.-O. Forsgren. 1993. Confocal micro-scopy: important considerations for accurate imaging,p. 79-95. In B. Matsumoto (Ed.), Cell Biological Ap-plications of Confocal Microscopy. Acadamic Press,San Diego.
12.Marshall, G.E., S.A.S. Shehab, R.C. Spike, and A.J.Todd. 1996. Neurokinin-1 receptors on lumbar spino-thalamic neurons in the rat. Neuroscience 72:255-263.
13.Mason, P., S.A. Back, and H.L. Fields. 1992. A confo-cal laser microscopic study of enkephalin-immunoreac-tive appositions onto physiologically identified neuronsin the rostral ventromedial medulla. J. Neurosci.12:4023-4036.
14.Naim, M., R.C. Spike, C. Watt, S.A.S. Shehab, andA.J. Todd. 1997. Cells in laminae III and IV of the ratspinal cord which possess the neurokinin-1 receptorand have dorsally-directed dendrites receive a major
synaptic input from tachykinin-containing primary af-ferents. J. Neurosci. 17:5536-5548.
15.Naim, M., S.A.S. Shehab, and A.J. Todd. 1998. Cellsin laminae III and IV of the rat spinal cord which pos-sess the neurokinin-1 receptor receive monosynapticinput from myelinated primary afferents. Eur. J. Neu-rosci. 10:3012-3019.
16.Pollock, R., R. Kerr, and D.J. Maxwell. 1997. An im-munocytochemical investigation of the relationship be-tween substance P and the neurokinin-1 receptor in thelateral horn of the rat thoracic spinal cord. Brain Res.777:22-30.
17.Robertson, B. and G. Grant. 1985. A comparison be-tween wheatgerm agglutinin and choleragenoid-horse-radish peroxidase as anterogradely transported markersin central branches of primary sensory neurones in therat with some observations in the cat. Neuroscience14:895-905.
18.Sakamoto, H., R.C. Spike, and A.J. Todd. 1999. Neu-rons in laminae III and IV of the rat spinal cord withthe neurokinin-1 receptor receive few contacts fromunmyelinated primary afferents which do not containsubstance P. Neuroscience 94:903-908.
19.Todd, A.J. 1997. A method for combining confocaland electron microscopic examination of sectionsprocessed for double- or triple-labeling immunocyto-chemistry. J. Neurosci. Methods 73:149-157.
20.Todd, A.J., C. Watt, R.C. Spike, and W. Sieghart.1996. Colocalization of GABA, glycine and their re-ceptors at synapses in the rat spinal cord. J. Neurosci.16:974-982.
21.Vulchanova, L., M.S. Riedl, S.J. Shuster, L.S. Stone,K.M. Hargreaves, G. Buell, A. Surprenant, R.A.North, and R. Elde. 1998. P2X3 is expressed by DRGneurons that terminate in inner lamina II. Eur. J. Neu-rosci. 10:3470-3478.
22.Willis, W.D. and R.E. Coggeshall. 1991. SensoryMechanisms of the Spinal Cord. Plenum, New York.
272
A.J. Todd
Merighi15-aucorr.qxd 5/23/02 8:43 PM Page 272

273
OVERVIEW
Measurements of intracellular calciumconcentrations ([Ca2+]i) using intracellu-larly trapped fluorescent dyes have becomea popular way to determine changes in[Ca2+]i in individual cells. Techniques forperforming such experiments are welldocumented (5,9,14,15). More recentadvancements in confocal laser scanningmicroscopy (CLSM) have made it possibleto perform these measurements even with-in tissue slices. Preparation of the CLSMtissue and performing an experiment on atissue slice is slightly different than that forsingle cells. In this chapter, we provide anoverview of the basics of confocal micro-scopy and subsequently describe how to setup and perform an experiment on brain
slices. We also show that neurons andastrocytes can be differentially loaded withthe Ca2+ indicator indo-1 depending onthe solution used during slice cutting anddye loading procedures.
BACKGROUND
CLSM is now established as a valuabletool for obtaining high resolution imagesand 3D reconstructions of a variety of bio-logical specimens. With the use of specificCa2+-sensitive dyes, this technique can alsobe used to obtain reproducible results onCa2+ dynamics. Here, a general descriptionof CLSM will be given.
In CLSM, a laser light beam is expandedto make optimal use of the optics in the
Cellular and Molecular Methods in Neuroscience ResearchEdited by A. Merighi and G. Carmignoto
Confocal Imaging of Calcium Signalingin Cells from Acute Brain Slices
Wim Scheenen1 and Giorgio Carmignoto2
1Department of Cellular Animal Physiology and Institute of Cellular Signalling, University of Nijmegen, Nijmegen, TheNetherlands, EU;2 Department of Experimental Biomedical Sciences and CNR Center for the Study of Biomembranes, University of Padova, Padova, Italy, EU
16
Merighi16-aucorr.qxd 5/23/02 8:45 PM Page 273

objective. This beam is turned into a scan-ning beam and focused to a small spotonto a fluorescent specimen by an objec-tive lens. The mixture of reflected light andemitted fluorescent light is captured by thesame objective and is directed through adichroic mirror (beam splitter). The re-flected light is deviated by this mirror whilethe emitted fluorescent light passesthrough in the direction of the detector, aphotomultiplier tube. In this way, only flu-orescence emission coming from the tissueis recorded. A confocal aperture (pinhole)is placed in front of the photodetector,such that the fluorescent light from pointson the specimen that are not within theplane of focus (the so-called out-of-focuslight) will be largely obstructed by the pin-hole. By optimizing the size of the confocalpinhole, out-of-focus light (both above andbelow the focal plane) is greatly reduced.This becomes especially important whendealing with thick specimens as brainslices. Generally, the plane of focus (Z-plane) is selected by a computer-controlledstepping motor that allows the experi-menter to focus through the specimen,thereby selecting the proper Z-plane forthe experiments.
The optical section, which is a 2Dimage of a small partial volume of the spec-imen centered around the focal plane isgenerated by performing an XY scan withthe focused laser spot over the specimen atthat focal plane. As the laser scans acrossthe specimen, the fluorescent light detectedby the photomultiplier is converted into adigital signal. This will lead to a pixel-basedimage that typically is displayed on a com-puter monitor attached to the CLSM. Therelative intensity of the fluorescent lightemitted from the specimen will thereforecorrespond to the grayscale value of theresulting pixel in the image. An experimentin which time effects need to be observedcan be performed by repeatedly scanningthe same XY plane with a fixed time inter-
val, leading to an XYt scan. This XYt scan-ning will typically be performed whenimaging Ca2+ dynamics in brain slices.
Considerations on the ExperimentalSetup
One of the physical properties of fluo-rescent dyes is bleaching; upon a certainnumber of excitations, a fluorescent mole-cule cannot be exited anymore and be-comes nonfluorescent. In generating a con-focal image, spatial resolution, imageintensity (or brightness), scanning speed,and dye bleaching are interconnected toeach other. In other words, if one wants avery bright and sharp confocal image, oneshould use a small pinhole, a slow scanningspeed combined with a high laser excitationintensity, and should allow for bleaching tooccur. However, performing an experimentthat follows Ca2+ dynamics in living cellsrequires that processes like bleachingshould be kept to an absolute minimum.Therefore, the laser power used should beset as low as possible. This can be done bydirectly reducing the laser output power orby introducing neutral density filters in theoptical path. As a consequence of thereduced excitation light, the intensity ofthe obtained fluorescence signal becomesvery low in comparison to system noise,i.e., one gets a low signal-to-noise ratio(S/N). Increasing the size of the pinholewill increase the S/N. However, by increas-ing the size of the pinhole, light from athicker plane is allowed to pass to thedetector, leading to a reduced optical sec-tioning. For brain slices, one can be inter-ested in: (i) different cells within a slice; or(ii) intracellular differences, for examplebetween the processes of a given cell. Forthe first example, a thick optical sectionwill be sufficient, and a good S/N can beobtained by increasing the confocal pin-hole. For the second example, i.e., intracel-lular Ca2+ dynamics in neuronal processes,
274
W. Scheenen and G. Carmignoto
Merighi16-aucorr.qxd 5/23/02 8:45 PM Page 274

a thin confocal section is required, hencethe confocal pinhole should be small, andintrinsically, these images will have a lowerS/N and look “noisy”.
Another option in obtaining better sig-nals is to average sequential images. Thedisadvantage of this option is the reductionof image acquisition speed, and as a conse-quence, fast Ca2+ changes will be missed.
The detector gain should be set as low aspossible to minimize the contribution ofsystem noise. However, care has to be takenthat anticipated changes in fluorescenceintensity fall within the dynamic range ofthe detector. Therefore, for increases in flu-orescence, the gain should not be set sohigh that intensity values reach the maxi-mum 8-bit value of 255, and decreases influorescence should be possible without thepixel values reaching 0. Most systems havea special color lookup table that will indi-cate when too many pixels fall out of thedynamic range of the detector. In experi-ments where the ratiometric dye indo-1 isused, special care has to be given to thistopic to allow reliable ratio values to beobtained (see below).
Relation Between Speed of theExperiment and Scanning Speed of the Equipment
The theory described in the previoussection applies to a point scanning micro-scope. Point scanning CLSM can be eithera fast or slow process depending on theequipment used. For most types of micro-scopes commercially available today, it gen-erally takes a few seconds to scan oneimage at full screen resolution. It will beclear that for most time-related Ca2+
dynamics, a time resolution of 2 to 5 sec-onds is an absolute minimum, and often,experiments with faster acquisition speedare required. A way to increase the sam-pling speed is to reduce the scanning box.
In practice, this means that the spatial reso-lution is decreased since the same informa-tion is presented in fewer pixels. A disad-vantage of reducing the screen size is thatthe spatial resolution can get too low (i.e.,only a few pixels per cell). This disadvan-tage can be overcome by performing anoptical zoom by which the area that isscanned by the laser is reduced. However,one has to take into consideration thatbleaching becomes a more serious problemwhen optical zooming is performed. Fromthese statements it will become clear thateach experimental situation and tissue willneed its own settings. As a general rule forbeginning experimenters to set up a properprotocol, keep in mind that dye bleachingand phototoxicity-related problems are thebiggest enemies of confocalists working onliving tissue.
Another development in confocalmicroscopy has led to a faster scanningtype. This faster scanning is achieved byscanning the specimen with the laser,which is transformed into a line, or byusing point scanning with fast scanningoptics. Generally, time-related problems donot occur when the experiments can beperformed on such fast scanning equip-ment.
A full description of all confocal micro-scopes is beyond the aim of this chapterand can be found in The Handbook of Bio-logical Confocal Microscopy (Reference 11;see also Reference 14).
PROTOCOLS
Protocol for Preparing Acute CentralNervous System Slices for Real TimeCa2+ Imaging with CLSM
Materials
All chemicals are from Sigma, (St. Louis,MO, USA) unless otherwise stated.
275
16. Confocal Imaging of Calcium Signaling in Cells from Acute Brain Slices
Merighi16-aucorr.qxd 5/23/02 8:45 PM Page 275

In both solutions N. 1 and N. 2, addNaHCO3 at pH 7.4 (with 5% CO2-95%O2).
• Indo-1/AM (Molecular Probes, Eu-gene, OR, USA).
• Dimethyl sulfoxide (DMSO).• Pluronic acid F-127.• Sulfinpyrazone.• Vibrating microtome (Electron
Microscopy Science, Fort Washington,PA, USA).
• Disposable 16-well culture plates(Nalge Nunc International, Roskilde,Denmark).
Procedure
Slice Preparation
The following is a typical procedure forcutting slices from developing rats (frompostnatal day 5 to 20).1. Rats are deeply anesthetized with a
276
W. Scheenen and G. Carmignoto
Table 1. Solution N. 1
Chemical MW mM g/L Stock (M) mL/L
NaCl 58.4 120.0 7.0 2.0 60.0 KCl 74.6 3.2 0.23 2.0 1.6 CaCl2 147.0 1.0 0.15 1.0 1.0 MgCl2 203.3 2.0 0.4 1.0 2.0 KH2PO4 136.1 1.0 0.14 1.0 1.0 NaHCO3 84.0 26.0 2.2 0.5 52.0 Glucose 180.2 2.8 0.5
The following antioxidants can be added:
Ascorbic Acid 176.1 0.57 0.1NaPyruvate 110.0 2.0 0.2 0.5 4.0
Chemical MW mM g/L Stock (M) mL/L
CholineCl 139.6 110.0 15.4 2.0 55.0 KCl 74.6 2.5 0.19 2.0 1.25CaCl2 147.0 0.5 0.07 1.0 0.5MgCl2 203.3 7.0 1.42 1.0 7.0NaH2PO4 137.1 1.2 0.14 1.0 1.0NaHCO3 84.0 25.0 2.1 0.5 50.0Ascorbic acid 176.1 1.3 0.23 NaPyruvate 110.0 2.4 0.26 0.5 4.8Glucose 180.2 20.0 3.6
Table 2. Solution N. 2
• Solutions for slice cutting and dye incubation (see Table 1).
• Solutions for slice cutting and dye incubation (see Table 2).
Merighi16-aucorr.qxd 5/23/02 8:45 PM Page 276

lethal dose of either ketamine ordiethyl ether. Cryoanesthesia can beused for very young animals. Afterdecapitation, the brain is rapidlyremoved and placed in ice-cold physio-logical saline (solution N. 1 or 2).
2. The tissue is immobilized with anacrylic glue on the dish of the Vibra-tome at orientation and angle forobtaining appropriate slices from theregion of interest. The tissue has to besubmerged in the same ice-cold solu-tion under continuous bubbling with5% CO2-95% O2. Slices of the desiredthickness are obtained. A thicknessbetween 200 and 300 µm is optimalfor most of the experimental approach-es. No support is, in general, necessaryfor cutting slices from the brain. Incontrast, for obtaining transverse slicesfrom the spinal cord, it is mandatory tostabilize the tissue, for example byattaching the segments of the spinalcord (4–6 mm long) to a shaped blockof silicon (small quantity of glue has tobe used).
3. Slices are allowed to recover for at least45 minutes at 37°C in the same physi-ological saline under continuous bub-bling with 5% CO2-95% O2. In thecase that slices have to be incubatedwith dyes, recovery periods shorterthan 45 minutes have to be used.
Dye-Loading
The dye loading described in this sec-tion is for using indo-1. For a discussionon the use of other probes, see the Resultsand Discussion section.4. Incubating slices in the physiological
saline added with the cell permeantacetoxymethyl derivative of indo-1(indo-1/AM; 20 µM) and 0.02%pluronic acid F-127 in a water bath at37°C for 40 to 50 minutes under con-
tinuous influx of the gas mixture (5%CO2-95% O2).
Notes:a. Continuous mild stirring is crucial for
optimizing the loading of the dye. Wefound it very convenient to performloading in a 16-well plate. By inflat-ing the gas mixture through an 18 to20 gauge needle onto the surface ofthe incubating medium, one canensure both a proper oxygenation ofthe medium and a slow continuousmovement of the slices.
b. Since AM esters of the dyes do notreadily dissolve in water, the stocksolution prepared in DMSO willform small crystals when diluted inmedium. In order to prevent this, andto optimize the actual loading con-centration, a small amount of thedetergent pluronic acid F-127 (12)can be added to the loading medium.
c. Although the use of dye AM shouldideally yield a strict cytoplasmic local-ization of the dye, cellular activitysuch as that of organic anion trans-porters might cause uptake of the dyein intracellular organelles or extrusionof the dye. In order to inhibit organicanion transporter activity, sulfinpyra-zone or probenicid can be added tothe loading medium and/or experi-mental solution (3). However, takeinto consideration that blockers ofintracellular compartmentalizationcan affect cellular functions. Forexample, probenicid has been shownto enlarge the duration of spon-taneous Ca2+ oscillations in pituitarymelanotrope cells (16).
d. For AM loading, a loading concentra-tion of 5 to 20 µM is sufficient to geta reasonable dye concentration in thetissue. Loading times vary, but forslices, an incubation in the loadingsolution, i.e., medium containing the
277
16. Confocal Imaging of Calcium Signaling in Cells from Acute Brain Slices
Merighi16-aucorr.qxd 5/23/02 8:45 PM Page 277

dye, should be between 30 and 60minutes at 37°C. Note that the viabil-ity of neurons can be significantlyincreased by adding to the incubationsolution antioxidants agents (see P-rotocols) as well as antagonists of theN-methyl-D-aspartate receptor(NMDAR), such as 10 µM D-2-ami-no-5-phosphonopentanoic acid. Afterdye loading, the slices should be keptat 20°C in constantly oxygenatedmedium for at least 30 minutes toallow complete de-esterification of thedye.
In the experiments that will be describedbelow, loading of cells is compared in slicesincubated with indo-1 either in the presenceor in the absence of antioxidant agents.
Confocal Analysis
5. Slices are mounted in a chamber which is placed on the stage of an inverted micro-scope (Diaphot 300; Nikon, Melville, NY,USA) equipped with a 40× water immer-sion objective (NA = 1.1; Nikon) connect-ed with a real time confocal microscope(RCM8000; Nikon). The 351-nm bandof the argon ion laser is used for excitation,and the emitted light, separated into its 2components (405 and 485 nm) by adichroic mirror at 455 nm, is collected by2 separate photomultiplier tubes. Theratio of the intensity of the light emitted atthe 2 wavelengths (R405/485) is displayedas a pseudocolor scale using a linearlookup table. Time series can be acquiredwith a frame interval of 1, 2, or 3 seconds,and 8 or 16 images are averaged for eachframe. During recordings, slices are con-tinuously perfused (3 mL/min) with phys-iological saline of the following composi-tion (in mM): NaCl, 120; KCl, 3.1;NaH2PO4, 1.25; NaHCO3, 25; dextrose,5; MgCl2, 1; CaCl2, 2; at pH 7.4 with5% CO2-95% O2.
Note: The R405/485 in basal condi-tions was observed to vary little in differentcells. Occasionally, a slight decrease couldbe observed in R405/485 basal levels.Indeed, prolonged UV irradiation of indo-1 can cause overall photobleaching andphotodamaging, a conversion to a fluores-cent, but Ca2+ insensitive, species (17).
Protocol for Performing ExtracellularCalibrations
After an experiment is done, one can getan idea of the actual free Ca2+ concentra-tions that were obtained by performing a cal-ibration. Calibration methods have beendescribed in great detail elsewhere (5,9,15).Since, for brain slices, an intracellular cali-bration is extremely difficult to accomplish,we will only describe how to perform extra-cellular calibrations based on experimentsusing indo-1. However, we would like toemphasize that extreme care has to be takenin interpreting the measured values asabsolute Ca2+ values. The most importantpitfall that occurs when performing extracel-lular calibrations is that the solutions used toperform the calibration do not reflect thecomposition of the cytoplasm. For example,the calibration solution lacks proteins pre-sent in the cytoplasm that may alter the Ca2+
binding characteristics of the dye. It is, there-fore, always wise to consider whether cali-brated Ca2+ values are absolutely necessary.In fact, for most experiments, the ratio orintensity values alone will be sufficient. For adetailed description of pitfalls in the calibra-tion procedure we would like to refer to Ref-erence 15.1. Add 100 µM of the dye in its free acid
form to 200 µL of Ca2+-free mediumadded with 10 mM EGTA. The compo-sition and pH of this medium have to beas close as possible to those of the cytosol.
2. Make a small well on a coverslip inwhich you place this dye solution.
278
W. Scheenen and G. Carmignoto
Merighi16-aucorr.qxd 5/23/02 8:45 PM Page 278

3. Measure the minimal ratio obtained inthis way (Rmin) and the fluorescenceintensity at 485 nm (sf ).
4. Without changing the focus of themicroscope, add to the well 5 µL 1 MCa2+ solution to obtain the high Ca2+
medium. 5. Measure the maximal ratio value ob-
tained (Rmax) and the fluorescenceintensity in this condition at 405 nm(sb).
Calculating Absolute Ca2+ Values
After obtaining the Rmin, Rmax, sf, andsb, the intracellular concentration can becalculated using the following formula (4):
Ca2+ = [(R-Rmin)/(Rmax-R)] × (sf/sb) × Kd
in which R is the ratio value for which theconcentration is desired, and Kd is the dis-sociation constant of the dye (250 nM forindo-1).
RESULTS AND DISCUSSION
Which Ca2+-Sensitive Dye to Use?
In order to detect Ca2+ dynamics, abrain slice needs to be loaded with a fluo-rescent dye. This dye loading can be donethrough microinjection, through a patchpipet, or through loading with membrane-permeable forms of the dye, the acetoxy-methyl-esters (dye AM). For dye AM load-ing, each dye and each tissue will givespecific loading results like a high or a lowloading, shallow or deep penetration in thetissue, etc. It will be up to the experimenterto select the most useful dyes. However,the choice of dye also depends on the typeof laser available.
Basically, the available dyes can be divid-ed into two groups, one showing only ashift in fluorescence intensity upon Ca2+
binding, the other also showing a spectral
shift, either in excitation or in emission.Since for the latter group a change in Ca2+
can be expressed as a change in ratiobetween the fluorescence intensities at twoselected wavelengths upon Ca2+ binding,this group is referred to as ratiometric dyes.The ratiometric dye that can be used inCLSM experiments is indo-1, and a work-ing and thoroughly tested protocol hasbeen described in the section Dye Loading.This dye can be excited in the UV at 351nm, and its emission maximum in theCa2+ -bound form lies at 405 nm and in itsCa2+ -free form at 485 nm. Hence, a ratioof the 405 nm emission over the 485 nmemission will give an optimal change inintensity upon Ca2+ changes.
Unfortunately, most confocal laser scan-ning microscopes are equipped with onlyvisible wavelength lasers, preventing theuse of indo-1. All dyes that can be used forCLSM equipped with a visible-wavelengthlaser are single wavelength dyes like fluo-3,Calcium Green, Oregon Green, and FuraRed. They are called single wavelengthbecause, as mentioned before, they willonly change their fluorescence intensity atone wavelength upon Ca2+ binding. All ofthe single wavelength dyes mentioned,except Fura Red, have a higher fluores-cence intensity in their Ca2+ bound form.Fura Red, in contrast, decreases its fluores-cence intensity upon Ca2+ binding.
As mentioned before, which dye is thebest to use depends largely on the tissueused and needs to be tested for each individ-ual case. For single cells, the use of two sin-gle wavelength dyes, Fura Red in combina-tion with either fluo-3 or Oregon Green,have been described, leading to “pseudo-ratio” images that overcome some of theproblems of single wavelength dyes (7,8). Intheory, this technique should also be applic-able to brain slices, although in practice,loading characteristics of the two dyes maybe too different to obtain reliable results.
Although both groups of dyes are use-
279
16. Confocal Imaging of Calcium Signaling in Cells from Acute Brain Slices
Merighi16-aucorr.qxd 5/23/02 8:45 PM Page 279

able, ratiometric dyes are clearly preferablesince the measured signal, being expressedas a ratio value, will be insensitive to factorssuch as dye concentration, bleaching,uneven distribution through the tissue, ormovement of the slice in the chamber.Using pseudo-ratio imaging will overcomeproblems with movement of the slice, butuneven distribution through the slice anddifferent bleaching rates will become moreof a problem. For example, in a pilot studyusing thalamic tissue, the bleaching rate forFura Red was found to be significantlyhigher than that of Oregon Green, prevent-ing proper use of the obtained pseudo-ratio
values (Scheenen, unpublished result). Inpractice, the use of two single wavelengthprobes is useful to check for possible move-ments of the slice. Final analysis of theresults should, however, be performed onone of the two dyes that has the lowestamount of bleaching, shows the leastamount of uptake into intracellular com-partments, and has a reliable loading profile.
Antioxidant Agents Help Cell Viabilityand Dye Loading
In general, optimal staining can beobserved in neurons from slices obtained
280
W. Scheenen and G. Carmignoto
Figure 1. Effects of antioxidant agents in loading of cells from acute brain slices with Ca2+ fluorescent dyes. (A) Indo-1 loadedcells from the CA1 hippocampal region of a young rat at postnatal day 10 following slicing and incubation procedures in the pres-ence of antioxidant agents. Most of the neuronal dendrites resulted well loaded. The time series of pseudocolor images illustratesthe [Ca2+]i changes occurring in these neurons following perfusion of the slice with 60 mM KCl. The sequence shows the [Ca2+]iincrease in pyramidal neurons occurring several seconds before that in astrocytes (open arrows). The R405/485 is displayed as apseudocolor scale. Sampling rate 2 seconds. The stimulation with high K+ extracellular solution was obtained by iso-osmoticreplacement of Na+ with K+. (B) Kinetics of the [Ca2+]i changes in the neurons (continuous lines) and astrocytes (dotted lines),indicated by arrows in panel A, following KCl stimulation, as expressed by the ratio between indo-1 emission wavelength at 405and 485 nm. Letters a through c correspond to images a through c in panel A. (C) Indo-1 loaded cells from the CA1 hippocam-pal region of a young rat at postnatal day 10 following slicing and incubation procedures in the absence of antioxidant agents.Under these conditions, dendrites are less loaded with indo-1 while astrocyte processes (arrow) are, in general, more loaded withthe dye. Furthermore, several dying neurons can be observed scattered in the CA1 pyramidal layer. (See color plate A15.)

from rats during the first 2 postnatalweeks. The number of labeled neuronsdecreases, however, in slices from older ani-mals, and the quality of the staining alsochanges dramatically depending on the ageof the animal.
A considerable improvement can beachieved by using antioxidant agents dur-ing slice cutting and dye loading proce-dures. Antioxidant agents such as ascorbicacid can protect neurons from the degener-ation caused by the slicing procedures (13).In our experience, antioxidant agents canincrease both the number of loaded neu-rons and, more importantly, the quality ofthe loading. This holds for cells in slicesobtained from different brain regions, suchas neocortex, hippocampus, and spinalcord. Figure 1 illustrates the advantage ofusing antioxidant agents such as ascorbicacid. Images illustrate two typical examplesof cells from the CA1 hippocampal regionloaded with indo-1 after cutting and incu-bating procedures are performed in thepresence (Figure 1A) or absence (Figure1B) of antioxidant agents. When antioxi-dant agents are used, dendrites of pyrami-dal neurons result well loaded. In somecases, by increasing the laser power andfocusing on different planes, dendrites canbe followed for most of their extension.The sequence of pseudocolor images ofFigure 1A illustrates the transient increasein the [Ca2+]i occurring in these neuronsupon slice perfusion with 60 mM KCl. Allneurons in the field are able to respondproperly to activation of voltage-activatedCa2+ channels by K+-induced depolariza-tion, thus providing a clue of their healthyconditions (Figure 1A).
When antioxidant agents are not includ-ed, good loading of the dye was, instead,obtained in very few neurons. Note alsothat in Figure 1B, the very thin processesof the astrocyte are well loaded, while inFigure 1A, only the astrocyte cell bodies arediscernible. The possibility of monitoring
the spatial and the temporal features of[Ca2+]i changes at the level of the processesfollowing different stimuli can provide cru-cial information for a better understandingof Ca2+ signaling in astrocytes. Indeed,highly localized [Ca2+]i elevations in dis-crete regions along the distal processes ofhippocampal astrocyte were observed fol-lowing stimulation of Schaffer collaterals(10). These [Ca2+]i elevations can eitherremain confined to the process or propa-gate intracellularly to the soma and otherprocesses, suggesting that each astrocyteprocess represents an independent com-partment of [Ca2+]i signaling.
Under conditions where antioxidantagents are absent, the number of dyingneurons is also greatly increased. In Figure1B, several neurons are well loaded withthe dye but display high [Ca2+]i and aremost likely destined to die in a short time.Curiously, small cells with a mean somadiameter of 5 to 10 µm are, in general, lessloaded in the presence than in the absenceof antioxidant agents. These cells are, mostlikely, astrocytes. On the basis of pure mor-phological criteria, however, astrocytes canbe hardly distinguished from small neuronswith a stellate or bipolar shape. We thusdeveloped a new experimental approach tofunctionally distinguish each astrocyte andneuron present in the recording field. Theexperiment illustrated in Figure 1 refers tothe CA1 hippocampal region, thoughidentical results are obtained in the visualcortex. We took advantage of the observa-tion that in mixed neuron–astrocyte cul-tures, while neurons, as identified byimmunocytochemical criteria, respondedpromptly with a [Ca2+]i increase to depo-larization induced by 60 mM K+, none ofthe immunocytochemically identifiableastrocytes were sensitive to this treatment.We thus applied the same protocol to brainslices in order to analyze whether neuronsand presumed astrocytes responded differ-ently, as in culture, to stimulation with 60
281
16. Confocal Imaging of Calcium Signaling in Cells from Acute Brain Slices
Merighi16-aucorr.qxd 5/23/02 8:45 PM Page 281

mM K+. All cells display a significant[Ca2+]i increase upon depolarization withhigh extracellular K+. The onset of theresponse from pyramidal neurons andsmaller cells (arrows) is, however, clearlydifferent. In pyramidal neurons, the perfu-sion with high K+ induces a prompt[Ca2+]i increase, which is followed by a fur-ther [Ca2+]i elevation. In contrast, small-sized cells with astrocyte-like morphologyinitially fail to respond and display a clear[Ca2+]i increase several seconds after thatof pyramidal neurons. This responseoccurred at approximately the same time ofthe second [Ca2+]i peak in the neurons.The delayed [Ca2+]i increase in these cellsis, to a large extent, attributable to therelease of glutamate and/or other neuro-transmitters by depolarized synaptic termi-nals and to the subsequent activation ofmetabotropic receptors linked to inosi-tol–trisphosphate (IP3) production (10).The remarkable delay that occurs in theresponse of astrocytes upon a depolarizingstimulus with 40 to 60 mM KCl withrespect to the prompt [Ca2+]i increase inneurons can be used as a functional tool toidentify astrocytes from acute brain slices(1,10). This type of response representsalso the first of a series of observations thatled us to conclude that astrocytes in acutebrain slices, at least from the visual cortexand the CA1 hippocampal region of youngrats at postnatal day 5 to 18, do not signif-icantly express functional voltage-operatedCa2+ channels (1).
Future Directions for Ca2+ Imaging inBrain Slices
Although a wealth of information canbe obtained using indo-1 in combinationwith CLSM, two major disadvantages needto be taken into consideration. The first isthat using UV excitation light may causedamage to the tissue, and the second isthat, since UV light has a short wave-
length, major light scattering will occur.The result of this last point is that imagingdeep into the tissue will become practicallyimpossible. Both disadvantages are over-come by the development of multiphotonexcitation microscopy (MPE) (for overviewsee Reference 2). In this microscopy mode,fast pulses of laser light are phased into thesame plane of focus in the tissue, and 2 or3 individual photons will cause dye excita-tion within the same excitation event. As aconsequence, laser light with a consider-ably longer wavelength and lower energy isused in this technique. Generally, MPEmicroscopes are equipped with nearinfrared lasers. Therefore, no UV light willdamage the specimen, and near infraredlight will undergo less scattering, makingimaging deeper in the tissue possible. Anadditional advantage is that only the planeof focus is illuminated, and photobleach-ing, photodamaging, and photon toxicityof the out-of-focus field (which is themajority of the slice) is avoided.
A limitation of the use of CLSM in thestudy of [Ca2+]i homeostasis in cells fromacute brain slices is the insufficient penetra-tion of the fluorescent dye in cells fromslices of fully mature animals. Recently, anew procedure (6) resulted in a greatimprovement of viability and dye loading ofcells from acute brain slices. After deep anes-thesia, rats are perfused through the heartwith cold physiological saline (see solutionN. 2). After removal, the brain is processedas usual. Slices obtained by using this proto-col could be maintained in excellent condi-tions for at least 8 hours, and cells are moreeasy to patch. In transverse spinal cord slices,we recently noticed that the number of sub-stantia gelatinosa neurons displaying goodloading with indo-1 is substantially in-creased. Even more importantly, under theseconditions patch clamp recordings can besuccessfully performed in cells from slicesobtained from animals of 2 months of age.Preliminary observations suggest that load-
282
W. Scheenen and G. Carmignoto
Merighi16-aucorr.qxd 5/23/02 8:45 PM Page 282

ing with indo-1 in these cells is also greatlyimproved, thus allowing the use of the con-focal microscope approach in future experi-ments also for the study of calcium signal-ing in slices from fully developed brain.
ACKNOWLEDGMENTS
This work was supported by the Ar-menise-Harvard University Foundationand Telethon-Italy Grant No. 1095 toG.C. We thank Cristina Fasolato and Tul-lio Pozzan for helpful discussion and criti-cal reading of the manuscript.
REFERENCES
1.Carmignoto, G., L. Pasti, and T. Pozzan. 1998. Onthe role of voltage-dependent calcium channels in cal-cium signaling of astrocytes in situ. J. Neurosci. 18:4637-4645.
2.Denk, W. and K. Svoboda. 1997. Photon upmanship:why multiphoton imaging is more that a gimmick.Neuron 18:351-357.
3.Di Virgilio, F., T.H. Steinberg, and S.C. Silverstein.1990. Inhibition of fura-2 sequestration and secretionwith organic anion transport blockers. Cell Calcium13:313-319.
4.Grynkiewicz, G., M. Poenie, and R.Y. Tsien. 1985. Anew generation of Ca2+ indicators with greatly im-proved fluorescence properties. J. Biol. Chem. 260:3440-3450.
5.Hofer, A.M. and W.J.J.M. Scheenen. 1999. Imagingcalcium in the cytoplasm and in organelles with fluo-rescent dyes: general principles, p. 53-91. In R. Rizzutoand C. Fasolato (Eds.), Imaging Living Cells. Springer-Verlag, Berlin.
6.Hoffman, D.A. and D. Johnston. 1998. Down regula-
tion of transient K+ channels in dendrites of hippo-campal CA1 pyramidal neurons by activation of PKAand PKC. J. Neurosci. 18:3521-3528.
7.Koopman, W.J.H., M.A. Hink, A.J.W.G. Visser, E.W.Roubos, and B.G. Jenks. 1999. Evidence that Ca2+-waves in Xenopus melanotropes depend on calcium-induced calcium release: a fluorescence correlationmicroscopy and linescanning study. Cell Calcium 26:59-67.
8.Lipp, P. and E. Niggli. 1993. Ratiometric Ca2+ mea-surements with visible wavelength indicators insolatedcardiac myocytes. Cell Calcium 14:359-372.
9.Nuccitelli, R. (Ed.). 1994. A practical guide to thestudy of calcium in living cells. In Methods in CellBiology, Vol. 40. Academic Press, New York.
10.Pasti, L., A. Volterra, T. Pozzan, and G. Carmignoto.1997. Intracellular calcium oscillations in astrocytes: ahighly plastic, bidirectional form of communicationbetween neurones and astrocytes in situ. J. Neurosci.17:7817-7830.
11.Pawley, J.B. (Ed.). 1995. Handbook of Biological Con-focal Microscopy. Plenum Press, New York.
12.Poenie, M., J. Alderton, J. Steinhart, and R.Y. Tsien.1986. Calcium rises abruptly and briefly throughoutthe cell at the onset of anaphase. Science 233:886-889.
13.Rice, M.E., M.A. Pérez-Pinzón, and E.J.K. Lee. 1994.Ascorbic acid, but not glutathione, is taken up by brainslices and preserves cell morphology. J. Neurophysiol.71:1591-1560.
14.Rizzuto, R. and C. Fasolato (Eds.) 1999. Imaging Liv-ing Cells. Springer-Verlag, Berlin.
15.Scheenen, W.J.J.M., A.M. Hofer, and T. Pozzan.1998. Intracellular measurements of calcium using flu-orescent probes, p. 363-374. In J.E. Celis (Ed.), CellBiology: A Laboratory Handbook. Academic Press,New York.
16.Scheenen, W.J.J.M., B.G. Jenks, E.W. Roubos, andP.H.G.M. Willems. 1994. Spontaneous calcium oscil-lations in Xenopus laevis melanotrope cells are mediatedby ω-conotoxin sensitive calcium channels. Cell Calci-um 15:36-44.
17.Scheenen, W.J.J.M., L.R. Makings, L.R. Gross, T.Pozzan, and R.Y. Tsien. 1996. Photodegradation ofIndo-1 and its effects on apparent Ca2+ concentration.J. Chem. Biol. 3:765-774.
283
16. Confocal Imaging of Calcium Signaling in Cells from Acute Brain Slices
Merighi16-aucorr.qxd 5/23/02 8:45 PM Page 283

This page intentionally left blank

AABC, 71–72, 162–163, 178, 191, 195, 197, 210,
214, 224, 226, 228, 264Acetylation, 136, 152–154, 157Acetylcholinesterase, 119, 176AChe, 119, 176Acridine Orange, 89Acrolein, 20, 25, 165Acrylamide, 245Acrylic embedding media, 166Adaptor proteins, 1, 12
Grb2, 1, 10–11Shc, 1–2, 12
Adeno-associated virus, 83Adenoviral vectors, 51Adenovirus, 36, 68Adrenergic receptor(s), 54Agarose gel electrophoresis, 41–42, 87, 96, 100, 106,
242AgNORs, 238Alkaline phosphatase. See APAlkaline phosphatase streptavidin. See AP-strepta-
vidinAmacrine cell(s), 86–87, 91, 107Amino acid(s), 167, 176, 178, 179, 182, 205
anterograde tracing with, 176, 178, 180, 203, 205,207–208, 211, 224–225, 228, 231–233
isotope-conjugated neurotransmitters, 204isotope labeled amino acids, 205tritiated amino acids, 205
7A6 monoclonal antibody, 240AMPA, 65–66, 87, 107, 201Amplicon, 146, 149, 156Amyloid precursor protein. See APPAnnealing temperature, 98, 156
Annexin V, 237, 239, 255, 258annexin V-Cy3, 57, 92–94, 100, 105annexin V-FITC, 19, 54, 57, 125, 127–128, 210,
239, 262, 270binding assays, 237, 239
Anterograde degeneration, 203Anterograde labeling. See Anterograde tracingAnterograde tracers. See Anterograde tracing;
Tracer(s)Anterograde tracing, 176, 178, 180, 203–205,
207–208, 211, 212, 216–218, 224–225, 228,231–233
BDA, 205–207, 224–225, 227–230, 232biocytin, 182, 191–193, 198, 201, 205, 207, 210,
212, 224–225, 232–233carbocyanine derivatives, 205, 210, 216CTb, 205–208, 223–231, 233, 261–263,
265–267, 270DiA, 205, 207, 211DiI, 205, 207, 211, 215DiO, 205, 218Fast DiI, 205Fluoro-Emerald, 205–207Fluoro-Ruby, 205–207, 219HRP, 128, 162, 176, 178, 183–186, 188, 198,
205, 208, 210–214, 216, 219, 223, 231, 234Lipophilic carbocyanine dyes, 205neurobiotin, 182, 191–192, 195, 198, 201, 205,
207, 224–225, 232, 261, 263PHA-L, 205–208, 211–212, 218, 224–225,
232–234, 261–263Antigenicity, 130, 136, 162, 165–168, 173, 179,
187, 254, 263antigen-antibody reaction, 161antigenic site, 197
285
Index
Indexnewnew.qxd 5/23/02 8:48 PM Page 285

antigen(s), 3, 8, 12, 17, 19, 87, 90, 120–121, 128,136, 141, 143, 161, 162, 165, 167,170–180, 187, 201, 216, 234, 236, 238,240, 246, 248, 249, 251–252, 254–262, 270
masking of antigenic sites, 137spatial distribution of antigen, 173, 260subcellular localization of antigens, 4, 65, 138,
142, 166, 170, 173Antisense primers, 98AP, 49, 51, 85, 107–108, 120, 122, 124–125, 130,
142, 145, 149–151, 153, 163, 176, 177,178, 226, 229, 231, 244, 248, 260, 272
streptavidin, 226, 229ApoHRP
WGA, 205Apopain. See Caspase 3Apoptosis, 100, 103, 106, 161, 235, 237, 239–243,
245, 247–259apoptotic bodies, 240, 251apoptotic cells, 235, 237, 239–241, 244,
248–255, 257–258apoptotic nuclei, 240–241apoptotic program, 237, 240biochemical assays, 235, 241in situ detection, 141, 158, 239, 242, 250, 256
APP, 33–36anti-human, 33distribution in axons, 34–35distribution in dendrites, 34–35
Argyrophilic nucleolar organizer region proteins. SeeAgNORs
Ascorbic acid, 276, 281, 283Astrocyte(s), 2, 31, 36, 39, 76, 78, 170, 173, 256,
273, 280–283Asymmetrical synapses, 265Autofluorescence, 208, 213, 215, 232Autolysis, 241Autoradiographic procedures, 137, 139, 205, 218,
254Autoradiography, 16, 49, 99, 122, 132, 178, 205,
208, 236, 249silver grains, 26, 124, 139, 236, 249tritiated amino acids, 205tritiated tymidine, 236, 248–249
Avidin-biotin-peroxidase complex. See ABCAvidin-fluorochrome, 261Axon(s)
axonal boutons, 201, 229, 269axonal tracers, 204, 215axonal transport, 203, 205, 209, 212, 218filling in ultrastructural tracing studies, 223silver impregnation of degenerating axons, 203,
218–219
BBackground, 2, 12, 16, 26, 29, 37, 39, 48, 53, 57,
67, 85, 120, 135–136, 145, 149, 154, 156,161, 170, 173, 175, 181, 193, 198, 204,213, 221, 228, 231–232, 235, 243, 247,250, 259, 261–262, 273
fluorescent tracers, 205, 208, 212–215, 218,223–224
subtraction (in confocal microscopy), 57, 193,195, 198, 200, 216
in ultrastructural tracing studies, 223BamHI, 55Banderaea simplicifolia. See BSI-B4; LectinsBCIP, 122, 130, 132, 150, 156, 244Bcl-2, 240, 248, 254, 256BDA, 176, 205–207, 224–225, 227–230, 232BDHC, 222Benzamidine, 12Benzidine dihyrochloride. See BDHCBenzodiazepine, 54, 58BET, 47Bicuculline, 53, 62Bi-directional tracing with CTb, 226, 228Bi-directional transport of tracers, 216, 225Binding studies, 140Biocytin, 182, 191–193, 198, 201, 205, 207, 210,
212, 224–225, 232–233Biolistics, 67–69, 71, 73, 76–78, 82–84
gene gun, 67–69, 73–76, 78, 83–84tungsten particles, 68
Biotin, 121, 125, 127, 130, 132, 134, 147, 162,191, 195, 206–208, 210, 214, 217, 224,241, 261, 263–264
biotin-based tracers, 205, 208, 210, 214, 224–225Biotinylated dextran amine. See BDABiotinylated nucleotides, 242Bisbenzimide, 237Bleaching, 274–275, 280Brain slices, 15–16, 18–19, 21, 23, 25, 69, 83–84,
88, 273–275, 277–283BrdU, 174, 236, 238, 242–243, 246–250, 253, 2565-bromodeoxyuridine, 236, 247BSI-B4, 261, 263, 265–266, 269B-tubulin CMV, 33, 35, 40, 78
CCA1 hippocampal region, 280–282[Ca2+]i increase, 65, 84, 107, 239, 256, 273–275,
277–283Calbindin D28k, 69Calcitonin gene-related peptide, 174, 179, 265, 271Calcium, 12, 29–30, 34–36, 54, 56, 67–69, 76, 78,
83, 88, 91, 95, 111, 239, 257, 273, 275,
Index
286
Indexnewnew.qxd 5/23/02 8:48 PM Page 286

277, 279, 281, 283binding proteins, 69, 83, 258[Ca2+]i increase, 65, 84, 107, 239, 256, 273–275,
277–283channels, 54, 60, 65, 83, 86–88, 90, 107–108,
111, 182, 281–283Green, 35, 39, 53, 57, 65–66, 69, 84, 90,
107–108, 124, 127, 137, 206–207, 217,237, 256, 266–268, 279–280
phosphate DNA co-precipitation. See Calciumphosphate precipitation
phosphate precipitation, 30, 56Calcium indicators, 239
calcium green, 279calibration, 278Fluo-3, 239, 279Fura-2, 239, 283
Calibrationcalculating absolute [Ca2+] values, 279extracellular calibration, 278, 280, 282intracellular calibration, 278solution, 276–280, 282
Carbocyanine derivatives, 205, 210, 216CARD, 124, 128, 140–142Casein-kinase 2a, 238Caspase 3, 240, 242, 255–258Caspase(s), 240, 242–243, 255, 258
caspase 3, 240, 242, 255, 257caspase-9, 2
CAT, 3, 6, 29, 39–40, 45–46, 51, 78–82, 177–180,182–183, 196, 201, 232–233, 238, 272
Catalase(s), 212Catalyzed reporter deposition. See CARDCatecholamines, 91Cationic lipid transfection, 29Cationic polymers, 38CD 44 cell surface adhesion molecule, 240CDNA, 17–19, 22–24, 34, 36, 56, 58–61, 85–88,
90, 92, 95–96, 98–100, 102, 104, 107–108,147, 149, 152–153, 155–158
CDNA template(s), 147Cell, 2, 5, 7, 9–10, 15–19, 21–25, 27–29, 32–34,
36, 38, 43, 45, 48, 51, 53–56, 58–62, 65,67–69, 73–74, 76–93, 95–98, 100, 102–104,106–108, 109–111, 115, 121, 124, 132,135, 138–139, 141–143, 145–146, 152, 154,157–158, 161, 171, 173–183, 186–190,192–201, 203–205, 208, 215–218, 224, 230,232–243, 245–260, 263, 265–267, 269,271–272, 274–275, 277, 280–281, 283
compartment-specific (cellular) antigens, 19cycle, 99–100, 155, 235–236, 238, 247, 254–257death, 2, 224, 235, 242, 254–258
death apoptotic. See Apoptosisdeath autophagic, 239death non-lysosomal vesiculate, 239division, 236–238, 247, 249grafting, 38lines, 38, 51, 54, 74, 76–77, 89, 107, 256, 262,
280lysates, 5, 9–10, 33, 36membrane asymmetry, 239proliferation, 1–2, 12, 55, 161, 235–239, 241,
243, 245–249, 251, 253–257proliferation markers, 236ultrastructure, 28, 161–162, 165–166, 171,
178–180, 186, 231, 233–234, 240, 263Cerebellum, 69–70, 109–114, 146, 180, 245–248,
250, 252–254, 256–258cerebellar cortex, 174, 246, 249, 254, 256cerebellar interneurons, 246, 258cerebellar neurons, 2, 53–54, 60, 63EGL, 246–250, 252granule cell precursors, 174, 246, 249–250, 256granule cells, 56, 65, 82, 88, 109–110, 112, 174,
234, 237, 246, 247, 249–250, 256, 257–258IGL, 246–248, 250, 253ML, 4–8, 11, 17, 20, 30–34, 40–41, 44–46,
55–57, 70–72, 75, 93–97, 100, 121,150–154, 156, 185–188, 215, 227–229,243–248, 261, 263, 276, 278
Purkinje cells, 69, 83, 89, 107, 146, 254C fibers, 265–266, 268C-fos, 1, 215, 218CGRP, 124, 174, 200, 231, 265–266, 268–269Chemiluminescence. See ECLChemiluminescent detection system. See ECLChloramphenicol acetyl transferase. See CATChloride, 33, 53–54, 60, 91, 150, 152, 156, 165,
183, 187, 191, 193, 205, 226–227,244–245, 263
current, 53, 56, 59, 158, 161, 186, 193, 200, 211,227
ions, 91, 95Choleragenoid. See CTbCholera toxin. See CTbCholera toxin B. See CTbChromatin, 237, 240–241, 251–253, 258
condensation, 37, 41, 47, 240, 251–252eterochromatin, 249–250
Chromatography, 47, 94–95, 100C-jun, 8Clathrin -coated pits, 114CLSM. See Confocal microscopeCMV-CAT, 45–46CMV promoter, 33, 35, 40, 78
Index
287
Indexnewnew.qxd 5/23/02 8:48 PM Page 287
CNTF, 8–9Colocalization, 54, 57, 61, 63, 79–80, 82, 142, 179,
234, 272Combination of transgenic technology with single-
cell RT-PCR, 101Combined confocal and electron microscopy, 263, 270Combined primer annealing, 156Compartment-specific cellular antigens, 19
lamp proteins, 19rab proteins, 19syntaxin, 6, 23–24
Concavalin A, 95–96, 97Cone bipolar(s), 86, 179Confocal laser scanning microscope. See Confocal
microscopeConfocal microscope, 16–19, 22, 28, 120, 122, 127,
138, 141, 193, 194, 195, 198, 200, 216,218, 233, 237, 259–260, 262, 264, 265,268, 270–275, 278, 279, 282, 283
confocal microscopy of retrogradely labeled neu-rons, 223, 225
correlated studies of confocal microscopy and elec-tron microscopy, 222
image acquisition speed, 275photobleaching, 54, 262, 278, 282photodamaging, 278, 282pinhole, 274–275point scanning, 275ratiometric dyes, 279–280ratio value, 279–280refractive index, 271sampling speed, 275signal-to-noise ratio, 194, 214, 274spatial resolution, 26, 173–174, 260, 274–275stacks of confocal images, 271three-dimensional reconstruction of neurons, 223UV, 41, 98, 167, 270, 278–279, 282
Confocal microscopy. See Confocal microscopeCorrection factors, 271Cortex, 49, 69–70, 83, 86, 109–114, 146, 174, 183,
191, 200–201, 205, 217, 234, 246, 249,254, 256–257, 271, 281–282
cortical neurons, 36, 55–56, 60–61, 63–64, 201pyramidal neurons, 183, 191, 280–283
COS-7 cells, 17–19, 22–24, 26, 28Cotransfection, 34–35, 67, 82CP, 29–30, 34–35CPP32. See Caspase 3CREB, 8, 84Cresyl violet, 214, 218Cross-contamination, 106Cross-reactivity in ultrastructural tracing studies,
223, 225, 230
Cryoprotectant medium, 71Cryoprotection, 195Cryostat sections, 46, 100, 121–122, 130, 132,
135–136, 138, 152, 165, 254Cryosubstitution, 162CTb, 205–208, 223–234, 261–263, 265–267, 270
bidirectional tracing, 221, 226, 228conjugate with saporin, 224gold, 208, 211, 217–218, 223, 231, 233,
243–244, 250–251, 253, 255neuronal uptake of CTb tracers, 223saporin-CTb conjugate, 224studying projection neurons, 270unconjugated CTb, 223–225, 229
Curing, 166, 173, 189Cy3.5, 57, 92–94, 100, 105Cyanine, 262Cy3-conjugated antibody, 90Cytokines, 1–2
interferon, 1, 115interleukin, 1, 257
DDA, 28, 49, 51, 85, 91–92, 95, 100, 102, 105–106,
107–108, 110–111, 142, 178–179biosynthesis, 85, 107, 196transporter. See DAT
DAB, 71–73, 125, 128, 130, 134, 163, 165,172–173, 175, 183, 187–188, 195–196, 210,214–217, 222, 227–230, 233, 263–264, 270.See also HRP substrate(s)
DAB reaction product, 187, 215, 270DAPI, 89, 237Dark-field observation (of tracers), 218DAT, 49, 51, 115, 179, 191, 193, 201, 277DATP, 241DBH, 227, 229–230Dead cells. See ApoptosisDegeneration methods, 176, 180–181
anterograde degeneration, 203retrograde degeneration, 203Wallerian degeneration, 203
Degeneration techniques. See Degeneration methodsDehydration in ultrastructural tracing studies, 223Dendrites, 23, 27, 30, 34–35, 57, 61–62, 69, 83, 95,
139, 142, 196–197, 201, 204, 206,216–217, 223, 230, 233–234, 259, 261,265–268, 270–272, 280–281, 283
dendritic processes, 76dendritic synthesis, 141density of contacts onto the dendritic tree, 260,
270filling in dendritic tree, 62, 200, 223, 225, 260,
Index
288
Indexnewnew.qxd 5/23/02 8:48 PM Page 288

265, 267, 270filling in ultrastructural tracing studies, 223length, 205, 236, 271
Densitometry, 242Density filters, 274Desensitization, 25, 58Detector gain, 275Detergents in ultrastructural tract tracing studies,
222–223DEVD tetrapeptide, 243Dextran(s), 121, 176, 205–207, 211, 217, 224,
232–234, 261, 263Diabete, 68
diabetic states, 684’,6-diamidino-2-phenylindole, 237Diamidino yellow, 206–2073,3’ diaminobenzidine, 71, 128, 263Dichroic mirror, 274, 278DIG, 121–122, 125, 147, 151–152, 154–156, 241
digoxigenin labeled oligoprobes, 121Digital camera, 57, 187, 189, 214. See also Image
analysisDigoxigenin. See DIGDilution of primary antibodies, 19–20, 168, 170Dimethyl-chloro-sylane, 96–97DiO, 205, 218Direct delivery of genes, 38Direct in situ PCR, 146–147, 149, 158Direct in situ RTPCR, 146–147, 149–150DNA, 2, 4, 9, 29–32, 36–39, 41–42, 47–48, 51,
55, 65, 67–68, 73–74, 76, 82–84, 87,98–100, 106, 121, 142, 145–147, 149,151–154, 156–159, 236–242, 247, 249–251,253, 255–258
agarose gel electrophoresis, 41–42, 87, 98–100,106, 121, 142, 242
annealing temperature, 98, 156condensation, 37, 41, 47, 240, 251–252fragmentation, 196, 239–242, 251, 253, 255, 258modifying enzyme(s), 241, 253nick(s), 241, 255, 257nick translation, 241, 255nuclease(s), 241nucleosome(s), 241polymerase, 55, 85, 88, 99, 103, 140, 145, 151,
153–154, 156, 158, 238, 241–242, 251,256–257
polymerase a, 238thermal denaturation, 240
DNAse, 96–97, 121, 150–154, 157Dopamine. See DADopamine-beta-hydoxylase. See DBHDopaminergic amacrine cell(s), 91
Dorsal horn, 111, 113–114, 174, 178–180, 182,190, 200–201, 229–233, 261, 264–267, 269,271
Dorsal root ganglion, 29, 111, 113–114Double face method. See Multiple immunolabelingDouble fluorescent detection, 142Double fluorescent ISH, 122–123, 128, 138Double immunogold staining, 170. See Multiple
immunolabelingDouble ISH at the electron microscope level, 125,
129, 138Durcupan, 263–264DUTP, 146, 241Dye(s), 87, 88, 89, 90, 92–94, 103, 120, 137, 182,
189, 193, 204–205, 212–214, 216, 217–218,233, 237, 239, 245–246, 253, 259–263,273–283. See also Fluorescent dyes
intra-axonal injection, 204intracellular injection, 184, 192, 259, 261, 263,
269lipophilic dyes, 204
Dying cells, 237, 239, 241, 252. See also ApoptosisDying neurons, 280–281. See also ApoptosisDynamic of neurotransmitter receptors, 54
EE6, 90, 92–93, 100, 103, 105ECL, 246EcoRi, 55E6-Cy3, 85, 90, 92–93, 95, 97, 100, 103, 105EGF, 1, 11EGFP-N1, 35–36, 55–56EGL, 246–248, 250, 252, 257E6-Hy hybridoma cells, 92, 100Electron microscope, 18, 20, 89–90, 91, 119–120,
125, 127, 128–129, 135–140, 142, 161,164, 166, 169, 177–180, 182, 189, 191,195, 197, 200, 205, 213, 216, 219,221–222, 229, 230–234, 241, 243–244, 249,251, 256, 259, 260, 263, 264, 270, 272, 276
correlated light and electron microscopy analysis,222
correlated light and ultrastructural observations inultrastructural tracing studies, 223
structural preservation, 167, 222Electron microscopy. See Electron microscopeElectrophoresis, 5, 7–8, 12, 33, 41–42, 47, 87, 94,
96, 100, 106, 156–157, 242, 245–246, 251agarose gel, 41–42, 87, 96, 100, 106, 242
Electroporation, 32, 35–36, 67–68, 76ELISA, 39, 242Embedding, 28, 120, 138, 162–163, 166–167, 173,
175–176, 178, 180, 188, 197, 229, 231, 249
Index
289
Indexnewnew.qxd 5/23/02 8:48 PM Page 289

Embedding (continued)acrylic embedding media, 166durcupan, 263–264epon, 21–22, 127, 130, 166–167, 179, 185,
188–191, 195, 198, 227, 229epoxy resins, 166, 171low temperature, 167, 180, 196paraffin, 32, 138, 157post-embedding immunocytochemistry, 90, 166,
168–169, 177, 179, 197post-embedding immunogold, 120, 163, 171,
173–176, 179, 189, 197, 201, 249pre-embedding immunocytochemistry, 162, 175,
197pre-embedding immunogold, 15, 19, 171, 197resin infiltration, 166
Embryos, 10–11, 141, 211embryonic development, 235, 255
Emission, 44, 90, 237, 239, 261, 274, 279–280End labeling, 241Endocytosis, 16, 23, 25–29, 90, 232
inhibitors, 10, 12, 136, 245, 254Endonuclease(s), 255, 258
enzyme histochemical techniques, 176Endosome(s), 16, 23, 28Epidermal growth factor. See EGFEpisomally-located sequences, 51Epitope(s), 2, 19–20, 34, 173, 238Etching, 166–167, 171, 177, 189Ethanol, 5, 7, 41, 44, 70, 75, 121, 153–155, 167,
169, 185, 191, 210, 213, 222, 225,227–229, 232, 262, 271–272
to increase tissue penetration, 163, 171–172EthD-2, 237Ethidium homodimer-2. See EthD-2Evans blue, 205–207Excitation, 57, 90, 98, 208, 214, 237, 261, 274,
278–279, 282emission filters, 44
Excitatory Synapses, 190Expression library, 36Expression vector(s), 32, 35, 47, 51, 53–56
pCDM8, 55pEGFP-N1, 35–36, 55–56
External granular layer. See EGLExtracellular recording, 182Extravidin-peroxidase, 264Ex vivo gene transfer, 68
FFab’ fragments, 165, 174, 244Fast Blue, 205–207, 227, 229–231Fast DiI, 205
Fast red, 122, 125, 128FDG, 45Ferritin, 28, 222FGF, 1Fiber(s) en (of ) passage, 203, 205Fibroblast Growth Factor. See FGFFilter(s), 10–11, 44, 55, 57, 70–73, 150, 169–170,
210, 214–215, 243, 260–261, 263, 274FITC, 19, 44–45, 54, 57, 90, 121, 125, 127–128,
147, 210, 237, 239, 262, 270Fixation, 21–22, 25, 39, 44–46, 91, 120, 127, 130,
132, 135–136, 140, 150, 152–154, 157,161, 162–163, 165–169, 171, 172, 173,175–176, 178, 186–187, 193, 200, 205–208,210, 212, 213, 222–225, 227–228, 232,237–238, 249, 254, 261–263, 272
acrolein, 20, 25, 165formaldehyde, 46, 57, 71–72, 91, 135, 141,
150–152, 166, 169, 175, 193, 213, 261–263glutaraldehyde, 20–21, 25, 91, 135, 165–170,
172, 175–178, 183, 186–187, 191, 193,206–207, 210, 213, 222–225, 227–228, 232,244–245, 249, 263, 272
glutaraldehyde as a fixative for ultrastructural trac-ing studies, 223
immersion, 135, 152, 187osmium ferrocyanide, 167, 169osmium in ultrastructural tracing studies, 222–223osmium tetroxide, 20–21, 25, 161, 166–169, 183,
191, 222, 243, 249paraformaldehyde, 17–18, 25, 33, 44, 122, 125,
127, 130, 132, 150, 152–153, 157, 165,167–169, 183, 186, 191, 193, 206–207,210, 213, 222, 227–228, 263
paraformaldehyde as a fixative for ultrastructuraltracing studies, 223
picric acid, 135, 165, 168, 191, 193post-fixation, 22, 25, 45, 137, 162, 166–167, 173,
187, 222–223, 228slides, 44, 132, 135–136, 149–150, 152–156,
165, 210, 262, 264tannic acid, 166, 180uranyl acetate, 167, 169–170, 189, 245, 264
Fixative. See FixationFlow cytometry, 159, 239, 255Fluo-3, 239, 279Fluorescein. See FITCFluorescein isothiocyanate, 19, 54, 127–128, 210,
262Fluorescence, 45, 57, 60–63, 90, 127, 137, 143, 189,
206–207, 210, 213–215, 217–218, 237, 239,241, 260, 268, 274–275, 279, 283
intensity, 57, 60–61, 274–275, 278–279
Index
290
Indexnewnew.qxd 5/23/02 8:48 PM Page 290

microscope, 45, 210, 214Fluorescence microscope. See FluorescenceFluorescen-conjugated dextran. See Fluoro EmeraldFluorescent bead. See Fluorescent microspheresFluorescent clusters, 53Fluorescent dye(s), 88, 182, 189, 237, 239, 253,
260–262, 279, 282acridine Orange, 89annexin V-Cy3, 57, 92–94, 100, 105annexin V-FITC, 19, 54, 57, 125, 127–128, 210,
239, 262, 270bisbenzimide, 237bodipy, 19Calcium Green, 35, 39, 53, 57, 65–66, 69, 84, 90,
107–108, 124, 127, 137, 206–207, 217,237, 256, 266–268, 279–280
Cy3.5, 57, 92–94, 100, 105cyanine, 262DAPI, 89, 237Dextran(s), 121, 176, 205–207, 211, 217, 224,
232–234, 261, 263Diamidino yellow, 206–207EthD-2, 237Ethidium bromide, 42, 47, 99–100Evans blue, 205–207Fast Blue, 205–207, 227, 229–231Fast DiI, 205Fast red, 122, 125, 128FITC, 19, 44–45, 54, 57, 90, 121, 125, 127–128,
147, 210, 237, 239, 262, 270Fluo-3, 239, 279Fluorogold, 206–207, 223–224, 231–234, 270Fura-2, 239, 283Fura Red, 279–280Hoechst 33342, 237Hoechst dyes, 237Indo-1, 273, 275–283Indocarbocyanine, 55Lipophilic carbocyanine dyes, 205Lissamine rhodamine (TRITC), 210, 262Lucifer yellow, 88, 191–193, 198, 200, 263mBBr, 239mBCl, 239Merocyanine 450, 239Mito Tracker Red CMX Ros, 239Oregon green, 279–280SNARF-1, 239SYTO stains, 237SYTOX Green, 237Texas Red, 22, 217, 241TRITC, 210YO-PRO(tm)-1 iodide, 205, 237
Fluorescent ligands, 15–16, 28, 140
Fluo-NT, 17, 22–25Fluo-SRIF, 17, 22–24Fluorescent microspheres, 205–208Fluorescent stains. See Fluorescent dye(s)Fluorescent tracer(s), 205, 208, 212–215, 218,
223–224. See also Fluorescent dye(s)carbocyanine derivatives, 205, 210, 216CTb, 205–208, 223–234, 261–263, 265–267,
270DiA, 205, 207, 211diamidino yellow, 206–207Evans blue, 205–207Fast Blue, 205–207, 227, 229–231Fast Dil, 205Fast red, 122, 125, 128Fluoro-Emerald, 205–207Fluoro-Ruby, 205–207, 219lipophilic carbocyanine dyes, 205nuclear yellow, 206–207PI, 205–206, 237
Fluorochrome(s), 92, 134, 198, 206–208, 215,223–224, 241, 261, 263
fluorochrome-conjugated secondary antibodies,210, 214
fluorochrome-conjugated streptavidin, 206–207,263
fluorogenic substrate(s), 242wavelength, 208, 214, 262, 279–280, 282–283
Fluoro-Emerald, 205–207Fluorogold, 206–207, 223–224, 231–234, 270Fluoro-Ruby, 205–207, 219Focus, 103, 120, 192, 204, 260, 268, 271, 274, 279,
282Forkhead factors, 2Formaldehyde, 46, 57, 71–72, 91, 135, 141,
150–152, 166, 169, 175, 193, 213, 261–263Freeze-thawing, 138, 165, 171, 196Frontal cortex, 70, 200Fura-2, 239, 283Fura Red, 279–280
GGABAA, 53–55, 57–61, 63, 65–67, 92, 102, 201
clusters, 32, 53, 57, 61–65, 162–163, 166, 174,190
colocalization, 61, 63, 79–80, 82gabaergic presynaptic terminals, 61gabaergic synapse(s), 53, 65, 178, 201GFP, 35–36, 39, 48–49, 53–55, 57–63, 65, 69,
78, 80–82, 90receptor, 1–2, 8, 34, 36, 51, 63, 65–66, 83,
86–88, 88, 92, 95, 102, 107, 109–110, 115,119, 124, 138, 158–159, 165, 181, 201,
Index
291
Indexnewnew.qxd 5/23/02 8:48 PM Page 291

GABAA (continued)215, 223, 233, 234, 238, 240, 257, 259, 261,
278, 282receptor clusters, 53, 61, 65receptor subunits, 53–54, 57–58, 61, 92, 102,
107, 141subunits, 53–66
GAD, 61, 63, 65, 87, 115, 178, 183Gal, 113, 115, 142
construct, 30–31, 38, 41–42, 45polyclonal antibody, 33, 46, 48–49, 77, 245–246Galactosidase. See GalGalanin, 115, 124, 127, 132, 138, 142–143, 272Gelatin, 20, 34, 45, 125, 127, 130, 138, 168, 191,
193, 213Gel-based DNA fragmentation assay, 242Gene, 1, 29, 32, 36–40, 46–51, 55, 67–69, 71,
73–89, 91–93, 95, 97, 99, 101–103, 105,107–108, 109, 124, 138–142, 149, 155,158, 215, 276
expression, 1, 28, 30, 32–33, 35–39, 45–47,49–51, 53–56, 65–69, 76, 78, 80–89,91–93, 95, 97, 99, 101–103, 105, 107–108,109, 138–139, 141–142, 158
Gene Gun, 67–69, 73–76, 78, 83–84product, 45, 46, 49, 55, 72–73, 86, 88–91,
98–102, 106–107, 109, 139–141, 149,155–157, 214–216, 219, 270
transfer, 12, 31, 33, 37–40, 50–51, 67–69, 71, 73,75, 77, 79–81, 83–84, 97
General lysis buffer, 245Genomic probe(s), 147GFAP, 39, 78, 113–115, 170–172GFAP monoclonal antibody, 170GFP, 39, 53, 65–66, 69, 90, 107–108Glia, 30, 78, 110, 257
Glial cell, 39, 78, 109–112, 114, 146, 212, 230,250, 253
glial filaments, 171–173Glial cell(s). See GliaGlial fibrillary acidic protein. See GFAPGlucose oxidase, 71–72, 228, 231GluR1, 34GluR2, 88, 115Glutamate receptor 1. See GluR1Glutamate receptor 2. See GluR2Glutamate receptors. See ReceptorsGlutamic acid decarboxylase. See GADGlutaraldehyde, 20–21, 25, 91, 135, 165–170, 172,
175–177, 183, 186–187, 191, 193, 206–207,210, 213, 222–225, 227–228, 232, 244–245,249, 263, 272. See also Fixation
Glycine, 5, 54, 65, 93–94, 142, 178, 183, 234,
245–246, 272glycine receptor, 54, 65, 142. See also Receptor
GM1 ganglioside receptor, 223Gold, 20, 23, 26–27, 67–68, 73–75, 78–79, 82,
120, 127–128, 130–132, 137, 139, 161–163,165–167, 169–180, 197, 201, 208, 211,217–218, 223, 231, 233, 243–244, 250–251,253, 255. See also Immunogold
clusters, 32, 53, 57, 61–65, 64, 162–163, 166,174, 190
colloidal gold particles, 162–163, 176, 253IgG gold conjugates, 171, 243–244Nanogold, 163, 166, 168, 171, 174, 178particles, 22–24, 26–27, 67–68, 73, 75, 78–79,
82, 128, 130–131, 137, 150, 162–163, 171,173–176, 178, 208, 216, 223, 244, 250, 253
protein A-gold, 169–170, 173, 177, 180protein G-gold, 177suspension, 7, 75, 95, 97, 210–211, 261, 263toning, 223ultra small gold, 120
Golgi impregnation, 86, 176, 178, 180, 203–204Golgi method. See Golgi impregnationGolgi staining. See Golgi impregnationGomori technique, 91Gonadotropin-releasing hormone neurons, 90, 108GPCR, 16Grb2, 1, 10–11Green fluorescent protein. See GFPGrowth factor(s), 1–2, 8, 10–11, 38, 149, 240, 255,
258CNTF, 8–9EGF, 1, 11FGF, 1NGF, 2, 142PDGF, 1
HHalogenated indolyl derivative, 90Hapten-labeled nucleotide(s), 155, 157Hapten-labeled primer(s), 146, 149, 157Heating, 135, 142, 150, 180, 240–241, 250Heterooligomeric proteins, 54HindIII, 55Hippocampus, 2, 39, 69, 86, 108–114, 170–172,
200–201, 281hippocampal neurons, 28–30, 34–36, 65, 82, 142hippocampal slice, 79hippocampal slice-explant culture, 84primary cultures, 17, 53–55, 65, 87–88pyramidal neurons, 183, 191, 280–283
Histochemical procedures. See HistochemistryHistochemical reactions. See Histochemistry
Index
292
Indexnewnew.qxd 5/23/02 8:48 PM Page 292

Histochemistry, 39, 48, 71, 119, 135, 141–143, 153,158, 177–178, 180, 182, 206–208, 210,213–214, 219, 222, 223, 229, 233–234, 257
HNP/Fast red, 122, 125, 128HNPP, 122, 125, 127–128, 137Hoechst 33342. See BisbenzimideHoechst dyes, 237HRP, 28, 72, 120, 127–128, 132, 134, 139–140,
162, 176, 178, 180, 183–186, 188, 195,198, 205–214, 216, 219, 222–224, 223,228, 230–231, 234, 248, 264, 268, 270, 272
based tracers, 205, 214, 223crystals, 5, 211, 229–230, 277gelfoam, 211
histochemistry, 71, 119, 141–143, 177–178, 180,182, 206–208, 210, 213–214, 219, 223,229, 233–234
modified TMB stabilization, 214Nickel-intensified DAB reaction, 214penetration of peroxidase/DAB reaction product,
187, 215, 270proteolytic degradation by lysosomal enzymes in
ultrastructural tracing studies, 223ultrastructural tracing studies, 223
HRP substrate(s)BDHC, 222DAB, 71–73, 125, 128, 130, 134, 163, 165,
172–173, 175, 183, 187–188, 195–196, 210,214–217, 222, 227–230, 233, 263–264, 270
modified TMB stabilization, 214Nickel-intensified DAB reaction, 214Pyronin, 229–230TMB, 210, 214, 219, 222, 227–231Vector VIP, 222, 234
Human placental alkaline phosphatase. See PLAP2-hydroxy-3-naphtoic acid-2’-phenylanilide phos-
phate, 122, 128Hypothalamus, 50–51, 70, 76–77, 83, 111,
113–114, 124, 142–143, 232hypothalamic cultures, 78, 81hypothalamic magnocellular neurons, 127, 132hypothalamic neurons, 69, 78, 80hypothalamic slice-explant culture, 83–84hypothalamo-neurohypophysial system, 76
Hypothermia, 43
IICC. See ImmunocytochemistryIdU, 236, 243, 246–250IgG, 3, 46, 55, 71–72, 93–94, 103, 169, 171, 183,
188, 191, 193, 195, 243–244IgG gold conjugate(s), 171, 243–244IgG-gold technique(s), 173
IGL, 246–248, 250, 253Image acquisition speed, 275Image analysis, 46, 178, 180, 196–197, 200, 214,
238, 257Immunoautoradiographic method. See
ImmunoautoradiographyImmunoautoradiography, 39Immunoblotting, 3Immunocytochemical labeling. See
ImmunocytochemistryImmunocytochemical staining. See
ImmunocytochemistryImmunocytochemical techniques. See
ImmunocytochemistryImmunocytochemistry, 3, 4, 8, 18, 22–23, 33, 39,
48–49, 57, 63, 71, 78–79, 85, 87, 90, 91,92, 102–103, 119–120, 121, 123, 124, 125,127, 129, 130–143, 145, 147, 157,161–180, 187–189, 188, 195, 196, 197,200–201, 204–205, 208, 210, 215-218,231–234, 236, 237, 240, 247, 248, 249,252–254, 257, 259–262, 271, 272
immunodetection of cancer cells, 90post-embedding immunocytochemistry, 90, 166,
168–169, 177, 179, 197pre-embedding immunocytochemistry, 162, 175,
197Immunoenzymatic techniques, 162, 173
immunofluorescence, 3, 10, 30, 33–35, 206–208,210, 224, 226, 259, 261–263, 265, 270–271
immunoperoxidase methods in ultrastructuralstudies, 221–224
immunoperoxidase reaction(s), 226–227photoconversion, 215, 218–219, 224, 231, 233
Immunogold, 15, 19, 25–27, 120, 163, 166,169–171, 173–180, 189, 197, 201, 249,251–252, 256, 270
IgG gold conjugate(s), 171, 243–244IgG-gold technique(s), 173post-embedding immunogold protocols, 120pre-embedding, 15, 19, 171, 197Protein A-gold, 169–171, 173, 177, 180Protein G-gold, 177silver intensification, 20–21, 162, 171, 175, 178,
208, 210, 217, 223silver intensified immunogold. See Silver intensifi-
cationsingle immunogold staining, 169–170sodium metaperiodate, 166–167, 169–171, 180,
189, 243spatial resolution, 26, 173–174, 260, 274–275transferase-immunogold technique(s), 257ultra small gold, 120
Index
293
Indexnewnew.qxd 5/23/02 8:48 PM Page 293

Immunogold (continued)ultrathin frozen sections, 162, 175, 178
Immunohistochemistry. See ImmunocytochemistryImmunolabeling. See ImmunocytochemistryImmunoprecipitation, 3–8, 10–12
assay, 4, 6–8, 10, 39, 43, 45–48, 51, 71, 77–78,146, 237, 239, 242, 245–246, 255, 258
of protein kinase, 1, 4, 7–8, 238, 258Immunostaining. See ImmunocytochemistryImpermeant dyes. See Fluorescent dye(s)Indirect in situ PCR, 146–147Indirect in situ RT-PCR, 146–149, 152, 154Indo-1, 273, 275–283Indocarbocyanine, 55Inhibitory post-synaptic potential(s). See IPSPsInhibitory synapses, 61Inositol-triphosphate. See IP3In situ detection, 141, 158, 239, 242, 250, 256In situ end-labeling techniques. See ISEL techniquesIn situ hybridization, 71, 86, 88, 119, 121, 123, 125,
127, 129, 131, 133, 135, 137, 139,141–143, 145–147, 152, 156–159, 161, 204,240, 255, 258
detection sensitivity, 146posthybridization washing, 121–122, 125, 127,
132, 136radioactive and enzymatic double ISH, 121, 123,
130, 133, 138–139riboprobe(s), 121–122, 136–138, 141triple labeling combining ICC and a radioactive
and enzymatic double ISH, 133In situ nick translation, 241, 255In situ PCR, 142, 145–147, 149–150, 152, 155–158
acetylation, 136, 152–154, 157amplicon, 146, 149, 156cDNA template(s), 147combined primer annealing, 156direct, 146–147, 149, 158genomic probe(s), 147hapten-labeled nucleotide(s), 155, 157hapten-labeled oligonucleotide primer(s), 154hapten-labeled primer(s), 146, 149, 157indirect, 146–147internal oligonucleotide probe(s), 149labeled oligonucleotide, 48, 147, 154non-specific nuclear staining, 154, 156–157random oligo (dT) primer(s), 155thermocyclers, 152
In situ polymerase chain reaction. See In situ PCRIn situ RT-PCR, 154, 156–157Insulin, 32, 56, 61, 63–66Insulin-like growth factor receptor, 240Interferon(s), 1, 115
Interleukin(s), 1, 257Internal granular layer. See IGLInterplexiform cell(s), 91In toto X-gal revelation, 45Intracellular calcium concentration, 30, 257, 273,
275, 277, 279, 283Intracellular dye filling, 204Intracellular pH, 239Intracellular recording, 181–183, 200Intraventricular delivery, 38Intron(s), 78, 80, 154, 156In vivo gene transfer, 40, 515-iododeoxyuridine, 236Ion channels, 86–87Iontophoresis, 56, 182, 186, 201, 206–209, 211,
225iontophoretic injection, 182, 186microionophoretic filling of single neurons, 176
IP3, 282IPSP(s), 186, 193ISEL techniques, 241, 251Isotope-conjugated neurotransmitters, 204Isotopic methods, 147, 236, 249Isotopic protocols. See Isotopic methods
JJAK, 2, 4, 12–13Janus Kinase(s), 2Jurkat cells, 240Juxtacellular labeling, 182
KKi-67, 236, 238, 246, 248, 255, 257–258Kinases, 1–2, 4, 8, 10, 12, 258–259
JAK, 2, 4, 12–13Janus, 2MEK, 1PKA, 283PKB, 2, 8PKC, 8, 115, 283Protein kinase assay, 6–7Raf1, 1RSK, 145, 149, 154, 156–158Serine/Threonine, 2, 10, 238Src, 1, 8
Kinases inhibitors, 12okadaic acid, 10sodium fluoride, 6, 10
Ki67 nuclear antigen, 236, 238, 246, 248KiS2, 238, 257KiS5, 238Kozak sequence, 90KpnI, 55
Index
294
Indexnewnew.qxd 5/23/02 8:48 PM Page 294

Krox-24 gene, 51
LLabeled oligonucleotide(s), 147, 154LacZ, 40, 69, 78, 89, 180Large dense-cored vesicles. See LGVsLaser, 194, 232–233, 237, 262, 271–275, 278–279,
281–282light, 28, 39, 43, 45, 47, 70, 89–92, 98, 130, 139,
142–143, 153, 156–157, 161, 163, 165,167–169, 176–183, 187–190, 195–197,199–201, 203, 205–211, 213–217, 219,221–222, 224–226, 228, 230–235, 241, 244,246–247, 249, 259, 268, 270, 272–274,278, 282
power, 77, 79, 171–172, 214, 216, 229, 274, 281scanning confocal microscopy. See Confocal
microscopescanning cytometry, 237
Laser scanning confocal microscopy. See Confocalmicroscope
Laser Scanning Microscope, 194Lead citrate, 91, 107, 127, 130, 167, 170, 189, 229,
233, 245, 264Lectins, 176, 224, 261, 263
binding to oligosaccarides in axonal membranes,223–224
BSI-B4, 261, 263, 265–266, 269Concanavalin A, 95–96, 97degenerating neuronal profiles, 223inactivation of protein synthesis, 139, 142, 205,
224internalization, 15–16, 18, 23–25, 28, 65, 142,
180neuronal death induced by, 224, 254–255PHA-L, 205–208, 211–212, 218, 224–225,
232–234, 261–263ricin, 224, 234suicide tracers in ultrastructural tracing studies,
224volkensin, 224WGA, 205, 208, 223WGA-gold, 223WGA-HRP, 178, 208WGA-HRP-gold, 223
Lesion(s) of neuronal pathways, 224Leupeptin, 4–5, 7, 12, 245LGV(s), 173–174Ligand-gated channel(s), 102Ligand(s), 9, 15–19, 22–24, 28, 54, 87, 119Ligation-mediated PCR, 242, 255Ligation-mediated polymerase chain reaction. See
Ligation-mediated PCR
Light microscope, 39, 89, 91, 139, 163, 168–169,169, 176, 182, 187, 188, 189, 196, 200,205–208, 210, 213, 216, 221, 228, 244,246, 249, 268
correlated light and electron microscopy analysis,222, 224–225
Light microscopy. See Light microscopeLipid-mediated cell transfection, 76Lissamine rhodhamine (TRITC), 210, 262Low temperature, 167, 180, 196Luciferase, 38–40, 43, 45–46, 48–51, 69, 78Luciferin, 43Lucifer yellow, 88, 191–193, 198, 200, 263
photoconversion, 215, 218–219, 224, 231, 233Luteinizing hormone receptor, 142Lymphocyte precursor(s), 241Lysosome, 212, 223
MMAP2, 34, 36, 113Markers, 18, 36, 39, 76, 86–89, 106, 112–113, 120,
127, 138–139, 176, 201, 208, 215–216,222, 224, 230, 233, 236–238, 240,245–246, 249, 253, 258, 260–261, 272
of apoptosis, 100, 103, 106, 237, 239, 242, 257single stranded DNA monoclonal antibodies,
237, 240of cell proliferation, 235–236, 238, 243, 246–250,
254, 257BrdU, 174, 236, 238, 242–243, 246–250, 253,
256Casein-kinase 2a, 238IdU, 236, 243, 246–250Ki67 nuclear antigen, 236, 238, 246, 248KiS2, 238, 257KiS5, 238Mib-1, 238Th-10a, 238, 256Topoisomerase IIa, 238transferrin receptor, 16, 238, 257
proliferating cells. See Markers of cell proliferationMBBr, 239MBCl, 239Melanotrope cells, 277, 283Meninges, 70, 152, 245Merocyanine 450, 239Messenger molecule(s), 139Metabotropic glutamate receptor. See MGluR2MGluR2, 34, 115Mib-1, 238Microinjection, 37–38, 43, 67, 279Microtubule-Associated Protein2. See MAP2Microvilli, 90
Index
295
Indexnewnew.qxd 5/23/02 8:48 PM Page 295

Microwave, 135, 142Migration, 23, 42, 157, 225, 246–247, 254,
256–257migratory events, 247migratory phenomena, 248
Miniature synaptic currents, 194Mitochondria, 68, 83, 224, 229, 240
mitochondrial membrane antigen, 240mitochondrial membrane depolarization, 239oxidative activity, 239
Mitosis, 51, 254Mitotic index, 235Mito Tracker Red CMX Ros, 239ML, 246–248, 254Modified calcium phosphate transfection, 34–35Molecular layer. See MLMonoamine neurons, 119Monobromobimane. See MBBrMonochlorobimane. See MBCLMonoclonal antibodies, 6, 10, 12, 45, 83, 90, 107,
188, 196–197, 200, 236–237, 240, 255,257–258
7A6, 240anti-HA, 33anti-histone, 242anti-phosphoserine/threonine, 2, 3, 10, 238anti-phosphotyrosine, 3, 6, 10–11BrdU, 174, 236, 238, 242–243, 246–250, 253,
256E6, 90, 92–93, 100, 103, 105GFAP, 39, 78, 113–115, 170–172IdU, 236, 243, 246–250Ki-67, 236, 238, 246, 248, 255, 257–258KiS2, 238, 257KiS5, 238luciferase, 38–40, 43, 45–46, 48–51, 69, 78Mib-1, 238NeuN, 39single stranded monoclonal antibodies, 237, 240Th-10a, 238, 256
MRNA, 86, 92, 95, 99–100, 102–103, 106, 109,124, 127, 130, 132, 135–143, 145–147,149, 152–159, 238, 255
Multi-photon excitation microscopy, 282Multiple immunolabeling, 170, 259
double immunogold staining, 170simultaneous labeling, 174–175triple labeling combining ICC and a radioactive
and enzymatic double ISH, 133Multiple labeling, 120, 130, 137–138, 141, 175,
208, 214–215, 223–224, 230Multiple staining. See Multiple immunolabelingMultiplex semi-nested RT-PCR, 102–103
Myelinated afferents, 265–268
NNADPH-d, 176, 180N-(2-aminoethyl) biotinamide hydrochloride. See
NeurobiotinNanogold, 163, 166, 168, 171, 174, 178NBT, 91, 122, 130, 132, 244NBT/BCIP, 122, 130, 132, 150, 156, 244Necrosis, 115, 240–241, 254–255Neocortex, 86, 109-110, 112-113, 183, 191, 281.
See CortexNeuN, 39Neurobiotin, 182, 191–192, 195, 198, 201, 205,
207, 224–225, 232, 261, 263Neurofilament, 39Neurogenesis, 2, 13, 247, 254Neurokinin 1. See NK1Neuronal circuits, 221–222, 224, 259, 268, 270–271Neuronal connection(s), 161, 175–176, 221–224,
232, 260Neurons, 2, 28–36, 39, 53–57, 60–61, 63–65,
67–69, 76–78, 80, 82–92, 95–98, 100–105,107–108, 119, 124, 127, 132, 139,141–143, 146, 161–162, 175–183, 185–187,189, 191, 193, 195, 197–201, 203–204,212–213, 216–218, 221–225, 229–235, 247,250, 253, 255–261, 264–273, 278, 280–283
Neuropeptide receptor antibodies, 15Neuropeptide(s), 15–16, 18–19, 28, 115, 124, 138,
141–143, 233Neuropil, 25, 171, 216Neurosteroid(s), 53, 58–59, 66Neurotensin, 15, 28, 142. See NTNeurotensin receptor 1. See NT1 receptor(s)Neurotrophins, 1, 83
NGF, 2, 142Neurotropic virus(es), 204Neutral Red, 214NGF, 2, 142NheI, 55Nickel grids, 169, 243Nick translation, 241, 255Nicotinamide adenine dinucleotide phosphate-
diaphorase. See NADPH-dNissl staining, 132, 203, 218Nitric oxide, 115, 176, 254Nitro blue tetrazolium/bromochloro-indolylphos-
phate. See NBT/BCIPNitro blue tetrazolium chloride. See NBTNK1, 28, 265–269, 271NMDA, 36, 54, 65–66, 201, 278NMDAR2A subunit, 107
Index
296
Indexnewnew.qxd 5/23/02 8:48 PM Page 296

NMDAR1 subunit, 109NO, 3, 6, 9, 12, 16, 24, 38, 45, 47–49, 54, 68, 70,
72–73, 78–79, 82, 89–90, 99, 102, 104,106, 122, 127, 135–137, 150, 154,156–157, 166, 176–177, 187, 198, 210,232, 237, 249, 254, 265, 267, 269, 272,277, 282–283
Non-isotopic methods, 146, 236, 249Non-isotopic protocols. See Non-isotopic methodsNon-specific nuclear staining, 154, 156-157. See in
situ RT-PCRNon-specific staining, 57, 92, 103, 163Non-viral vectors, 38Northern blot(ting), 86, 88, 145NSE, 78, 80, 113–115NT, 15, 17–18, 22, 24, 28, 99, 142, 172NT1, 22–24NT1 receptor(s), 22–24Nuclear staining, 154, 156–157, 218, 253Nuclear yellow, 205–207Nucleic acid(s), 73, 142, 145–146, 152–154,
157–158, 237, 240, 251, 257Nucleic acid thermal denaturation, 240Nucleosome(s), 241Nucleus, 1–2, 9–10, 22, 24, 29, 57–58, 70, 76, 79,
82, 109, 111–114, 124, 127, 132, 141,177–180, 216–217, 226, 231–234, 240, 250,257, 271–272
chromatin, 237, 240–241, 251–253, 258chromatin condensation, 37, 41, 47, 240,
251–252eterochromatin, 249–250nuclear staining, 154, 156–157, 218, 253
OOF-1 mouse, 42Okadaic acid, 10Olfactory lobes, 70Oligo(dT) primer(s), 98, 137, 151, 153, 155Oligomer(s), 241Oligonucleotide(s), 38, 47, 51, 99, 143, 145, 147,
149, 152–154Oligoprobe(s), 121, 136, 138Oligosaccaride in axonal membrane, 224Opioid(s), 15, 17, 28, 177–178, 201Optical section(s), 266, 274Optic nerves, 70Oregon green, 279–280Organotypic culture, 71, 73–81, 83–84Organotypic slice, 69, 73–75, 83Oscillations, 277, 283Osmicated material. See OsmiumOsmication. See Osmium
Osmium, 20–21, 25, 125, 130, 161–162, 166–169,171, 173, 175, 183, 188, 191, 195, 197,222, 224–225, 243, 249
ferrocyanide, 44, 167, 169post-fixation, 22, 25, 45, 137, 162, 166–167, 173,
187, 222–223, 228tetroxide, 20–21, 25, 161, 166–169, 183, 191,
222, 243, 249in ultrastructural tracing studies, 162, 198, 205,
221–224, 253Oxidative activity, 239Oxygenation, 277Oxytocin (OT), 76, 83, 113, 115, 124, 127,
142–143
PPancreatic islets, 68, 83, 178PAP, 162–163, 178, 196, 197, 227–228Papain, 95–97, 103–104Paraffin, 32, 138, 157Paraformaldehyde, 17–18, 25, 33, 44, 122, 125, 127,
130, 132, 150, 152–153, 157, 165,167–169, 183, 186, 191, 193, 206–207,210, 213, 222, 227–228, 263
as a fixative for ultrastructural tracing studies,221–224
vapors, 175Paraventricular nucleus (PVN), 76–77,
80–81PARP, 242–243, 245–246, 251Patch clamp, 56, 87–88, 90, 181–182, 189, 192,
194, 199–200, 282PC12 cells, 2PCD, 235, 239–240, 242, 254–257. See also
ApoptosisPcis-CMV-CAT, 41PCMV-luciferase, 40PCMV(nls)-Lac-Z, 40, 69PCNA, 236, 238, 254–258PCR, 55, 85, 87, 96, 98–100, 102, 104, 106–108,
140, 142, 145–147, 149–153, 155–159, 242,255
antisense primers, 98multiplex semi-nested RT-PCR, 102–103oligo(dT) primer(s), 98, 137, 151, 153,
155promoter constructs, 78single round PCR, 98two rounds PCR, 99
PDGF, 1PEG, 138, 209, 211PEGFP-N1, 35–36, 55–56PEI, 37–43, 39, 41, 43, 45-47, 49, 51
Index
297
Indexnewnew.qxd 5/23/02 8:48 PM Page 297

Penetration, 68, 82, 135, 140, 162–163, 165,171–172, 196–197, 211, 222, 225, 232,234, 262, 270–272, 279, 282
of antibodies, 162, 196–197, 232, 262, 271–272of peroxidase/DAB reaction product, 183, 195,
210, 214, 222, 228, 264of reagents for immunocytochemical studies,
161–164, 171, 195–196, 232, 281of reagents for ultrastructural tracing studies, 162,
198, 222Pepsin, 150–151, 153, 157Pepstatin, 4–5, 7, 12Peptidase inhibitor(s), 17
aprotinin, 4–5, 7, 245leupeptin, 4–5, 7, 12, 245
Peptide(s), 3–4, 12, 15–17, 76, 84, 87, 115, 119,124, 132, 139, 141–142, 173–174, 179,265–266, 268, 271
Perfusion, 44–45, 56, 62, 98, 135, 186–187, 210,212–213, 222, 224, 227–228, 262–263,280–282
Peroxidase. See HRPPeroxidase-anti-peroxidase. See PAPPeroxide toxicity, 241Phagocytes, 239–240, 247, 252PHA-L, 205–208, 211–212, 218, 224–225,
232–234, 261–264Phaseolus leucoagglutinin. See PHA-LPhaseolus vulgaris-leucoagglutinin. See PHA-LPhenilmethylsulfonyl fluoride, 4, 6, 10, 245Phosphatase(s), 5, 7, 49, 85, 91, 107–108, 120, 122,
124–125, 130, 142, 145, 149–151, 153,176, 178, 226, 229, 231, 244, 248
Phosphatidylserine, 239, 255Photobleaching, 54, 262, 278, 282Photoconversion, 215, 218–219, 224, 231, 233Photodamaging, 278, 282Photoreceptor, 86PI, 205, 237Picric acid, 135, 165, 168, 191, 193Pinhole, 274–275PKA, 283PKB, 2, 8PKC, 8, 115, 283Plancental alkaline phosphatase. See APPPLAP, 85, 90–92, 95, 100, 103–105, 107Plasmid(s), 30, 34, 37–38, 40–42, 46–57, 61, 65,
67, 73–74, 82, 83DNA, 2, 4, 9, 29–32, 36–39, 41–42, 47–48, 51,
55, 65, 67–68, 73–74, 76, 82–84, 87,98–100, 106, 121, 142, 145–147, 149,151–154, 156–159, 236–242, 247, 249–251,253, 255–258
pcis-CMV-CAT, 41pCMV-luciferase, 40pEGFP-N1, 35–36, 55–56plasmid-based genes, 37
Platlet-derived growth factor. See PDGFPluronic acid, 276–277Point scanning, 275Poly-ADP-ribose polymerase. See PARPPolyclonal antibodies, 12, 44, 210
anti-CTb, 227–228anti-DBH, 229anti-human APP, 33anti-MAP2, 33anti-PHA-L, 210to PAP, 162–163, 178, 196, 197, 227–228
Polyethylene glycol. See PEGPolyethylenimine. See PEIPoly-L-lysine, 55Polymerase a, 238Polymerase chain reaction. See PCRPost-embedding, 90, 120, 162–163, 166–177, 179,
189, 196–197, 201, 249Post-mitotic cell(s), 247Postmitotic primary neurons, 29Postsynaptic receptor genes, 102Pre-embedding, 15, 19, 137, 162–163, 165–166,
170–173, 175–177, 179–180, 188, 196–197,201, 233–234, 270
Primary fixation. See FixationPrimary hippocampal neurons, 29Primer(s), 87–88, 98–100, 102, 104, 106, 146–147,
149, 151-157antisense, 98custom designed forward, 155flanking introns, 154hapten-labeled, 146, 149, 157random oligo (dT), 155
Progenitor cells, 1–2, 8–12, 246, 249, 256Programmed cell death. See PCDProliferating cell nuclear antigen. See PCNAProliferating index, 235–236Promoter, 2, 33, 35, 37–40, 47, 50–51, 66, 68, 76,
78, 80, 83, 85, 88–90, 92, 104, 108constructs, 32, 35, 37–38, 57–58, 61, 67–68, 73,
76, 78, 80–82regulation, 2–4, 12, 28–29, 37–39, 47, 50–51, 58,
60–61, 63, 65, 69, 88, 141–142, 149, 158,255–256, 258, 283
Propidium iodide. See PIProtease digestion, 150, 153–154, 157Protease inhibitor(s), 10, 12, 245
aprotinin, 4–5, 7, 245benzamidine, 12
Index
298
Indexnewnew.qxd 5/23/02 8:48 PM Page 298

leupeptin, 4–5, 7, 12, 245pepstatin, 4–5, 7, 12phenilmethylsulfonyl fluoride, 4, 6, 10, 245
Proteinase K, 150, 154, 244, 249Protonation, 38PS, 77, 239–240PVN, 76–77, 80–81Pyramidal cells. See Pyramidal neuronsPyramidal neurons, 89, 109, 183, 191, 200, 233,
280–283Pyronin, 229–230
QQuantification, 39, 138, 174, 178, 180, 238, 258,
270Quantitative analysis, 26, 84, 178, 201
quantification of immunostaining, 174quantification of the radioactive signal, 138quantitative expression of transgene, 83, 180quantitative studies, 49, 271
RRab, 19, 23, 46Radioactive procedures, 32, 39, 99, 120–124, 127,
130, 133, 136–139, 141–142, 236, 249isotopic methods, 236non-isotopic methods, 146, 236, 249radioactive and enzymatic double ISH, 121, 123,
130, 133, 138–139radioimmunological procedures, 162radioisotopes, 242radiolabeled nucleotides, 2, 88, 143, 145, 176,
196–197tritiated tymidine, 236, 248–249
Raf1, 1Random examers, 98Ras, 1–2Ratiometric dye(s), 275, 279–280Ratio value, 279–280Receptors, 1–2, 8, 15–20, 22–28, 34, 36, 51, 53–55,
57–61, 63, 65–66, 83, 86–88, 92, 95, 102,107, 109–110, 115, 119, 124, 138,139–143, 158–159, 165, 177–179, 181, 201,215, 223, 233, 234, 238, 240, 257, 259,261, 265–272, 278, 282
adrenergic receptor(s), 54channel complex, 58cluster colocalization, 57cluster(s), 32, 53, 57, 61–65, 162–163, 166, 174,
190epitope-tagged, 18–19extrasynaptic clusters, 61for ganglioside GM1, 223
GluR1, 34GluR2, 88, 115glycine receptor, 54, 65, 142GPCR, 16insulin-like growth factor receptor, 240ligand-induced internalization, 16mGluR2, 34, 115neuropeptide(s), 15–16, 18–19, 28, 115, 124,
138, 141–143, 233NK1, 28, 265–269, 271NMDA, 36, 54, 65–66, 201, 278NMDAR1 subunit, 109NT1, 22–24receptor-ionophore complex, 88receptor-ligand complex, 16resensitization, 16sequestration, 16, 283sst2A, 22, 24–25, 27–28subunits, 53–54, 57–58, 61, 92, 102, 107, 141TR, 50, 122transferrin, 16, 28, 238, 257TrkA, 2
Reciprocal circuits, 225Recombinant virus, 29–30Reduced glutathione, 239Refractive index, 271Reporter-based tracers, 204Reporter gene(s), 38, 40, 48–49, 89, 176Repp86, 238Resin infiltration, 166Retina, 69, 84–87, 90–92, 95, 97–98, 100,
102–104, 107–110, 112, 178–179, 255amacrine cells, 86–87, 91, 107bipolar cells, 107, 110cone bipolar(s), 86, 179dopaminergic cells, 90, 107ganglion cells, 86, 95, 100, 102, 110, 232, 272interplexiform cell(s), 91Photoreceptor, 86rod bipolar, 89, 91, 95, 110
Retrograde degeneration, 203Retrograde labeling. See Retrograde tracingRetrograde tracing, 176, 204–206, 208, 212,
216–218, 223, 224–225, 231–233, 270with colloidal gold particles, 162–163, 176, 253CTb-HRP, 205–208, 223diamidino yellow, 206–207Evans blue, 205–207Fast Blue, 205–207, 227, 229–231fluorescent counterstains, 215fluorescent tracers, 205, 208, 212–215, 218,
223–224HRP-based tracers, 205, 214, 223
Index
299
Indexnewnew.qxd 5/23/02 8:48 PM Page 299

Retrograde tracing (continued)with HRP conjugated to plant lectins, 176Nuclear yellow, 205–207PI, 205, 237radiolabeled amino acids, 176retrograde degeneration, 203retrograde transport of tracers, 89, 232, 234WGA-apoHRP, 205
Retrovirus, 107Reverse transcriptase. See RTReverse transcriptase polymerase chain reaction. See
RT-PCRRhodamine. See TRITCRibosomal S6 kinase. See RSKRibosome(s), 240Ricin, 224, 234RNA, 35, 41, 83, 86, 88, 95–96, 98, 103–104, 108,
116, 121, 135, 141–143, 147, 150–151,158, 257
mRNA, 86, 92, 95, 99–100, 102–103, 106, 109,124, 127, 130, 132, 135–143, 145–147,149, 152–159, 238, 255
mRNA by single-cell RT-PCR, 92reverse transcriptase, 88, 96, 99, 104, 147,
151–152, 155, 157, 238RNAse inhibitor(s), 96, 100, 136
Rod(s), 89, 91, 95, 110RSK, 145, 149, 154, 156–158, 158RSV, 78RT, 88, 96, 98, 99, 104, 147, 151–152, 155, 157,
238RT-PCR, 85, 87–88, 92, 95–96, 98–104, 106–107,
109, 140, 142, 145–158
SSacl, 99–101, 106Sampling speed, 275Saporin, 224Sciatic nerve, 266–267Sepharose, 3, 12, 93–94Sequestration, 16, 283Shc, 1–2, 12Signal-to-noise ratio, 194, 214, 274Signal transducer and activator of transcription. See
TranscriptionSilver, 20–21, 26, 124–125, 127, 130, 137, 139,
162, 171, 174–175, 177–180, 201, 203,208, 210, 216–219, 223, 227, 236, 238,249, 255, 258
enhanced gold labeling, 137, 161, 166, 175–178,251
grains, 26, 124, 139, 236, 249impregnation of degenerating axons, 203, 218
intensified immunogold. See ImmunogoldSimultaneous labeling. See ImmunogoldSingle immunogold staining. See ImmunogoldSingle-stranded DNA. See ssDNASkin, 34, 67, 155, 185, 204, 256Slice preparation(s), 107, 176, 182, 191, 199, 237,
276SNARF-1, 239Sodium borohydride, 183, 187, 191, 193, 222, 225,
228, 232Sodium fluoride, 6, 10Sodium metaperiodate, 166–167, 169–171, 180,
189, 243Somatostatin. See SRIFSouthern blot(ting), 99, 145Spatial distribution, 173, 260Spatial resolution, 26, 173–174, 260, 274–275SpeI, 55Spermidine, 74Spinal cord, 29, 111, 113–114, 166, 170, 174,
177–180, 182–183, 185, 200–201, 217, 222,230–234, 265–267, 271–272, 277, 281–282
neurons, 28–36, 119, 124, 175–183, 185–187,189, 191, 193, 195, 197–201, 203–204,212–213, 216–218, 221–225, 229–235, 247,264–273, 278, 280–283
spinal dorsal horn, 180, 229, 231, 261, 264spinothalamic tract, 267substantia gelatinosa, 177–179, 271, 282in ultrastructural tract tracing studies, 162, 198,
205, 221–224, 253Spontaneous inhibitory postsynaptic currents, 61Src, 1, 8SRIF, 15, 17, 22, 23, 26–27, 28, 115, 272SsDNA, 237, 240–241, 255, 257STAT, 2, 4, 9, 12–13Statin, 238, 258STM buffer, 244Stratacooler, 104Streptavidin, 125, 127, 130, 134, 198, 226, 229, 263Structural preservation, 167, 222Substance P, 28, 115, 174, 179, 187, 201, 233,
265–266, 268, 271–272Substantia nigra, 47, 49, 110–112, 114, 217Suicide tracers in ultrastructural tracing studies, 224Survival, 1–2, 32, 70, 206–207, 212, 236, 246–247,
250, 253–254, 256post injection survival, 207, 212
Synapse(s), 28, 53, 60–61, 65, 161, 166, 171,178–179, 190, 197, 198–201, 204, 224,226, 230, 234, 259–260, 265, 267–269, 272
in degenerating neurons, 178, 203, 218, 224gabaergic, 53, 65, 178, 201
Index
300
Indexnewnew.qxd 5/23/02 8:48 PM Page 300

monosynaptic connections, 204polysynaptic connections, 204retrograde transsynaptic tracers, 204synaptic circuitry, 181, 221, 232synaptic connection(s), 86, 89–92, 177, 179–180,
259synaptic input to neurons in ultrastructural tracing
studies, 223synaptic specialization(s), 221, 269, 270synaptic vesicles, 172–174, 201, 229
Synaptophysin, 53Synthetic vectors, 38SYTO stains, 237SYTOX Green, 237
TTannic acid, 166, 180Taq DNA polymerase, 99, 151, 153–154, 156T4 DNA ligase, 241, 250TdT, 241–242, 244, 251Telomerase, 238, 256, 258Template(s), 88, 99–100, 106, 121, 147, 156Terminal deoxynucotidyl transferase. See TdTTetramethyl rhodamine-dextran amine. See Fluoro-
RubyTexas Red, 22, 217, 241TH, 56, 85, 89, 91–92, 99–100, 102, 104, 106,
107, 112–113, 115, 124, 178gene, 55, 67–69, 71, 73–89, 91–93, 95, 97, 99,
101–103, 105, 107–108, 109, 124Th-10a, 238, 256Thalamus, 217, 265, 267Three-dimensional reconstruction, 223Thyroid, 50–51Thyroid hormone receptor, 51. See TRThyrotropin Releasing Hormone, 51. See TRHTime lapse video microscopy. See Video microscopyTMB, 210, 214, 219, 222, 227–231Topoisomerase IIa, 238Toxin(s), 205–208, 223–224, 231–234, 261
CTb, 205–208, 223–234, 261–263, 265–267,270
saporin, 224TR, 50, 51, 122Tracer(s), 176–177, 204–219, 221–234, 236, 261,
262–263, 270anterograde tracing, 176, 178, 180, 203–205,
207–208, 211, 224–225, 228, 231–233axonal tracers, 204, 215axonal transport, 203, 205, 209, 212, 218BDA, 176, 205–207, 224–225, 227–230, 232bi-directional labeling. See Bidirectional transportbi-directional transport, 216, 225
biocytin, 182, 191–193, 198, 201, 205, 207, 210,212, 224–225, 232–233
biotin-based tracers, 205, 208, 210, 214, 224–225combined retrograde and anterograde labeling,
212CTb-HRP, 206–208, 223cytoplasmic labeling, 216, 218dark-field observation, 218Diamidino yellow, 206–207Evans blue, 205–207Fast Blue, 205–207, 227, 229–231fluorescent tracer(s), 205, 208, 212–215, 218,
223–224gold-conjugated tracers, 208, 210–211, 213, 216HRP-based tracers, 214isotope-conjugated neurotransmitters, 204juxtacellular labeling, 182labeled neurotransmitters, 178, 223lipophilic dyes, 204Neurobiotin, 182, 191–192, 195, 198, 201, 205,
207, 224–225, 232, 261, 263neurotropic virus(es), 204nuclear staining, 154, 156–157, 218, 253Nuclear yellow, 205–207PI, 205, 237post-injection survival, 207, 212reporter-based tracers, 204retrograde tracing, 176, 204–206, 208, 212,
216–218, 223, 224–225, 231–233, 270retrograde transsynaptic tracers, 204transganglionic tracing, 204transmembrane dye diffusion, 216in ultrasonic tracing studies, 223ultrastructural visualization, 171–172, 176, 179,
243, 249–250, 252Tracing studies, 221–223, 225, 232Tract-tracing methods, 176, 218Tranferase(s), 257
TdT, 241–242, 244, 251Transcription factor(s), 1–2, 4, 8, 47, 138–139,
158Transfection, 15–17, 19, 29–36, 39, 45, 47, 49–51,
53–57, 59–63, 65, 67–69, 71, 73, 75–85Biolistics, 67–69, 71, 73, 76–78, 82–84of cDNA in cultured mammalian cells, 29COS-7 cells, 17–19, 22–24, 26, 28efficiency, 29–30, 33, 35, 38–39, 45, 47–48, 54,
65, 68–69, 73, 82–83, 90, 92, 102, 135,137, 142, 154, 156, 166
Gene Gun, 67–69, 73–76, 78, 83–84heterologous (transfection) systems, 15–16, 124,
139hyperexpression, 82
Index
301
Indexnewnew.qxd 5/23/02 8:48 PM Page 301

Transfection (continued)integrated sequences, 51integrated transcriptional responses, 37lipid-mediated cell transfection, 76modified calcium phosphate transfection, 34–35transfected cell lines, 51viral transfection, 60in vivo gene transfer, 40, 51
Transfection methods. See TransfectionTransferase-immunogold technique(s), 257Transferrin receptor, 16, 28, 238, 257Transganglionic tracing, 204Transganglionic transport, 267Transgene(s), 38–39, 45–46, 48, 51, 82–83, 89, 108,
141, 180transgene expression, 38, 45, 83, 108transgenesis, 37–38transgenic mouse (mice), 66, 76, 78, 82, 90, 92,
102, 103, 107–108, 180transgenic retina, 100
Transmembrane dye diffusion (in tracing studies),216
TRH, 50–51TRH promoter, 50–51Triple labeling combining ICC and a radioactive and
enzymatic double ISH, 130, 133, 139TRITC, 210, 239, 261–263, 266Tritiated tymidine, 236, 248–249Triton, 5–6, 20, 33, 71–72, 138, 165, 168–171, 193,
195, 222, 243, 245, 261, 263, 271TrkA, 2Trophic factor(s), 235Tubulin CMV, 33, 35, 40, 78TUNEL, 241, 248–253, 257Tungsten particles, 68Two rounds PCR, 99Tymidine, 236, 247–249Tyramide, 128, 132, 134, 140, 142
amplification, 132, 134, 140–142Tyrosine hydroxylase. See THTyrosine kinase receptor(s), 8. See also Receptor(s)
UUltra small gold, 120Ultrastructural studies, 28, 161–162, 165–166, 171,
178–180, 186, 198, 205, 221–224, 231,233–234, 240, 253, 263
analysis, 161–163, 193–197, 221–222, 253–255neuronal connection(s), 161, 175–176, 221–224,
232, 260preservation, 162–163, 196–200, 222–225preservation in tracing studies, 223
Ultrastructural visualization, 171–172, 176, 179,
243, 249–250, 252Ultrastructure. See Ultrastructure studiesUltrathin frozen sections, 162, 175, 178Unmodified T7 polymerase, 241Unmyelinated fibers, 261, 265–266, 272Uranyl acetate, 167, 169–170, 189, 245, 264UV, 41, 98, 167, 270, 278–279, 282
VVaccinia virus, 38Vascular perfusion, 222, 224Vasopressin. See VPVector VIP, 113, 115, 222, 234Vibrating microtome. See VibratomeVibratome, 18, 21, 39, 44–45, 49, 95, 125, 136,
138, 165, 168–169, 177, 189, 191, 193,196–197, 210, 213, 227–228, 232, 260,262–264, 270, 272, 276
antifreeze mixtures for vibratome sections, 228sections, 17–18, 20, 22, 24–25, 44–46, 49, 95,
124–125, 135–136, 138, 161–163, 165–171,173, 175–180, 187–190, 193–199, 201,213–216, 228–232, 257–264, 266–268,270–272
Video microscopy, 35Viral messengers, 120Viral transfection methods, 60Viral vectors, 68, 76, 81–82
adeno-associated virus, 83for gene delivery, 51recombinant virus, 29–30retrovirus, 107vaccinia virus, 38
Visual cortex, 69, 83, 281–282Visual perception, 85VLM, 226, 229–230VOC(s), 54, 87–88, 90, 158, 282Volkensin, 224Voltage-gated calcium channel(s). See VOCVoltage-operated calcium channel(s). See VOCVP, 76, 78, 83, 115, 124, 127, 132, 138, 142–143
WWallerian degeneration, 203Wavelength, 208, 214, 262, 279–280, 282–283Western blot(ting), 3, 8, 10, 15, 30, 32, 33, 35–36,
243, 246, 251WGA, 205, 208, 223, 272
apoHRP, 205CTb, 205–208, 223–234, 261–263, 265–267,
270CTb-HRP, 206–208, 223gold, 208, 223
Index
302
Indexnewnew.qxd 5/23/02 8:48 PM Page 302

HRP, 178, 208, 223HRP-gold, 223
Wheat-germ agglutinin. See WGAWhite matter, 246–248, 252–253, 258
XXenopus oocyte(s), 37, 47, 54, 83, 142, 283X-gal, 44–45, 48, 69
YYama. See Caspase 3YO-PRO(tm)-1 iodide, 205, 237
ZZeta-sizing, 47Zinc, 58Zolpidem, 53, 56, 58–59
Index
303
Indexnewnew.qxd 5/23/02 8:48 PM Page 303
Copyright © 2022 FDOKUMEN