Constitutive hippocampal cholesterol loss underlies poor cognition in old rodents
Upload
khangminh22Category
view
0download
0
Camacho et al. EvoDevo (2020) 11:11 https://doi.org/10.1186/s13227-020-00156-9
RESEARCH
Differential cellular proliferation underlies heterochronic generation of cranial diversity in phyllostomid batsJasmin Camacho1,2* , Rachel Moon2, Samantha K. Smith1, Jacky D. Lin2, Charles Randolph2, John J. Rasweiler IV3, Richard R. Behringer4 and Arhat Abzhanov5,6*
Abstract
Background: Skull diversity in the neotropical leaf-nosed bats (Phyllostomidae) evolved through a heterochronic process called peramorphosis, with underlying causes varying by subfamily. The nectar-eating (subfamily Glossopha-ginae) and blood-eating (subfamily Desmondontinae) groups originate from insect-eating ancestors and generate their uniquely shaped faces and skulls by extending the ancestral ontogenetic program, appending new devel-opmental stages and demonstrating peramorphosis by hypermorphosis. However, the fruit-eating phyllostomids (subfamilies Carollinae and Stenodermatinae) adjust their craniofacial development by speeding up certain develop-mental processes, displaying peramorphosis by acceleration. We hypothesized that these two forms of peramorpho-sis detected by our morphometric studies could be explained by differential growth and investigated cell proliferation during craniofacial morphogenesis.
Results: We obtained cranial tissues from four wild-caught bat species representing a range of facial diversity and labeled mitotic cells using immunohistochemistry. During craniofacial development, all bats display a conserved spa-tiotemporal distribution of proliferative cells with distinguishable zones of elevated mitosis. These areas were identi-fied as modules by the spatial distribution analysis. Ancestral state reconstruction of proliferation rates and patterns in the facial module between species provided support, and a degree of explanation, for the developmental mecha-nisms underlying the two models of peramorphosis. In the long-faced species, Glossophaga soricina, whose facial shape evolved by hypermorphosis, cell proliferation rate is maintained at lower levels and for a longer period of time compared to the outgroup species Miniopterus natalensis. In both species of studied short-faced fruit bats, Carollia perspicillata and Artibeus jamaicensis, which evolved under the acceleration model, cell proliferation rate is increased compared to the outgroup.
Conclusions: This is the first study which links differential cellular proliferation and developmental modularity with heterochronic developmental changes, leading to the evolution of adaptive cranial diversity in an important group of mammals.
Keywords: Development, Evolution, Heterochrony, Cell proliferation, Craniofacial, Morphology, Bat
© The Author(s) 2020. This article is licensed under a Creative Commons Attribution 4.0 International License, which permits use, sharing, adaptation, distribution and reproduction in any medium or format, as long as you give appropriate credit to the original author(s) and the source, provide a link to the Creative Commons licence, and indicate if changes were made. The images or other third party material in this article are included in the article’s Creative Commons licence, unless indicated otherwise in a credit line to the material. If material is not included in the article’s Creative Commons licence and your intended use is not permitted by statutory regulation or exceeds the permitted use, you will need to obtain permission directly from the copyright holder. To view a copy of this licence, visit http://creat iveco mmons .org/licen ses/by/4.0/. The Creative Commons Public Domain Dedication waiver (http://creat iveco mmons .org/publi cdoma in/zero/1.0/) applies to the data made available in this article, unless otherwise stated in a credit line to the data.
Open Access
EvoDevo
*Correspondence: [email protected]; [email protected] Department of Organismic and Evolutionary Biology, Harvard University, Cambridge, MA 02138, USA5 Department of Life Sciences, Imperial College London, Silwood Park Campus Buckhurst Road, Ascot, Berkshire SL5 7PY, UKFull list of author information is available at the end of the article
Page 2 of 17Camacho et al. EvoDevo (2020) 11:11
IntroductionNeotropical leaf-nosed bats (family Phyllostomidae, superfamily Noctilionoidea) evolved fantastic cranial variation associated with adaptations into diverse die-tary niches. Among bats, phyllostomids have the largest array of distinct feeding strategies: sanguivory, insec-tivory, frugivory, nectarivory, carnivory, and omnivory [6, 7, 20]. The diversity of phyllostomid skulls encom-passes many skull phenotypes [18] found in phylogeneti-cally distant mammalian orders, such as carnivores and primates [17]. Therefore, this clade of closely related species of mammals offers a unique opportunity to gain key new insights into the origins of the order-level evo-lutionary diversity in Class Mammalia that have arisen over tens of millions of years (Fig. 1). In mammals, het-erochrony, a change in the exact timing of developmen-tal events relative to the ancestor, and, in particular, a change to the order and timing of cranial bone ossifica-tions (known as “sequence heterochrony”), has already been shown as a major source of skull diversification [24, 25, 28, 45]. These modifications can result in descendants either resembling juveniles of the ancestor (paedomor-phosis) or have gone beyond to become a more derived version of the ancestor (peramorphosis) [3]. Paedomor-phosis is quite well known from the popular example of the axolotl salamander, which retains the larval gills and aquatic lifestyle found in juveniles of close relatives [26, 68]. The “Irish elk”, an extinct deer species with enor-mous exaggerated antlers, is a textbook example of per-amorphosis [26]. Our recent morphometric studies on adult, juvenile and embryonic skulls demonstrated that several skull shapes within phyllostomid cranial diversity evolved by peramorphosis [11]. Long-faced nectar-eating (subfamily Glossophaginae) and short-faced blood-eating (subfamily Desmondontinae) bats generate ecomorph-specific skulls by extending the ancestral ontogenetic program and appending new late developmental stages, thus demonstrating peramorphosis by hypermorphosis [3]. Short-faced fruit-eating bats (subfamilies Carollinae and Stenodermatinae) adjust their craniofacial develop-ment by speeding up certain developmental processes, displaying peramorphosis by acceleration [3]. However, while our morphometric analyses implicated heterochro-nic modifications to the developmental programs during phyllostomid evolution, the precise cellular and molecu-lar mechanisms behind these developmental changes remained unknown. In fact, there are very few studies, especially in vertebrates, which dissect the cellular and molecular mechanisms behind heterochrony.
To better understand the mechanistic nature of het-erochrony-driven morphological evolution in phyllosto-mids, we aimed to investigate cell behavior during their craniofacial development and determine how alterations
in cellular biology affect cranial shapes in different spe-cies. Once morphogenesis is understood at the cellular level, we can begin to explain how diversity is generated by changes in the underlying developmental processes [29]. Knowledge of the alterations at the cellular level, in turn, creates a platform allowing further dissection at the molecular and genetic levels.
The most important proximal process underlying mor-phogenesis is species-specific differential growth via cellular proliferation [1, 2, 9, 33, 35, 38, 75, 76]. Cell pro-liferation depends on several factors, such as the num-ber of available precursor cells, the length of the period of mitosis, and the duration of the cell cycle [50]. Recent improvements in high-throughput, high-resolution imaging [19, 22] and in imaging analysis [65, 77] allow cells from a wide range of tissues and species to be stud-ied in great detail. Thus, comparative analyses on differ-ences in cellular behaviors across species, interpreted in an appropriate phylogenetic framework, can yield enhanced metrics for better characterization of morpho-logical evolution.
Here, we investigate cellular proliferation underlying distinct morphogenetic trajectories in facial develop-ment caused by peramorphosis in phyllostomid bats. Our previous geometric morphometric analysis of phyl-lostomid skull shape showed that the most significant axis of morphologic change was the length of the skull and snout [11], which was captured by principal com-ponent (PC) 1 (Fig. 2). Thus, we focus on phyllostomid species, which feature significant differences in over-all cranial length [15, 31] that we could collect from the wild: Carollia perspicillata, a predominantly frugivorous bat [56, 78] with a face near the center of cranial shape morphospace (Fig. 2); Artibeus jamaicensis, a predomi-nantly frugivorous bat [41] with a short and wide face; and Glossophaga soricina, a predominantly nectarivo-rous and pollenivorous bat [12] with an elongated head and narrow face. These dietary specialists were compared to Miniopterus natalensis (family Miniopteridae), a rep-resentative insect-feeding outgroup species with a rela-tively unmodified face from South Africa, the geographic area of origin for Neotropical species in Noctilionoidea [27, 44, 64]. Embryos from each species were collected during stages CS16, CS17, and CS18 (approximately 50, 54, and 60 days of gestation, respectively) undergoing craniofacial elongation [13]. Serial sagittal sections from each embryo head were used for immunohistochemis-try (Fig. 3) to detect a known mitotic marker, the Ser10-phosphorylated histone H3 or PH3. We hypothesized that if the alteration in developmental timing occurred at the cellular level, we would expect a localized temporal change in cell proliferation when compared to the ances-tral mode of development. More specifically, compared

Page 3 of 17Camacho et al. EvoDevo (2020) 11:11
to the ancestor, we anticipated a higher rate of prolifera-tion in fruit bats and a more extended period of cell pro-liferation in nectar bats associated with acceleration and hypermorphosis, respectively, as we previously detected in these taxa morphologically [11].
ResultsCraniofacial development in bat embryosWe collected a complete range of embryo ages for only one species, C. perspicillata, and we staged them with the Carnegie stage (CS) table (Additional file 1: Table S1) as CS16–CS24. For C. perspicillata, an emerging model for bat craniofacial development, we first summarize the main sequence of morphological changes (Table 1) and compare this to what is known for mouse embryonic development at comparable stages. We find that features of limb development normally used for stage-matching embryos in bats and mice [13, 32, 55, 67, 72, 73] reveal a global temporal shift in craniofacial development among these two groups. Thus, at equivalent developmental stages, based on limb morphology, the chiropteran head
matures more quickly than in the mouse (Additional file 2: Figure S1).
We also obtained three embryos per stage across stages CS16–CS18 from the outgroup M. natalensis (courtesy of Dr. Nicola Illing, University of Cape Town, SA) to inform the direction of evolutionary changes among phyllosto-mid species comparisons. We collected embryos from the morphologically derived phyllostomid bats A. jamaicen-sis and G. soricina, with two biological replicates for CS17 and three biological replicates for CS18, each. We were unable to collect CS16 embryos for A. jamaicensis and G. soricina due to unexpected environmental conditions during our 2014–2017 field studies (see Additional file 3: Sampling). While not as comprehensively sampled as C. perspicillata, embryonic development in M. natalensis, A. jamaicensis, and G. soricina, as compared to that in mouse, all show a heterochronic shift in head versus limb development.
Cellular proliferationProliferative cells were immunolabeled in all species with the molecular marker PH3 (phosphorylation of serine 10
Fig. 1 Order-level changes in mammals are reflected in closely related bat species. Cranial diversity in eutherian mammals (left) is mirrored in phyllostomid evolution (right). Variation in morphology is represented by the shrew Cryptotis parva (UTEP 1345) and Macrotus waterhousii (CMNA 13450), by carnivores Canis lupus (TMM 1709) and Vampyrum spectrum (RMNH 15914), by the long-faced whale-ancestor Pakicetus inachus (NHML) and long-faced nectar bat Platalina genovensium (CEBIOMAS 224), and by the short-faced primate Macaque mullata (DKY 0209) and short-faced fruit bat Ametrida centurio (UMMZ 53108). The simplified eutherian phylogeny is based on [70] and display members of the Orders Eulipotyphla, Carnivora, Artiodactyla, and Primate. The simplified phyllostomid phylogeny is based on [15]. All images are under a Creative Commons license. CEBIOMAS: Centro de Biotecnologia da Mata Atlântica; CMNA: Colección Nacional de Mamíferos; DKY: Dokkyo Medical University; NHML: Natural History Museum, London; RMNH: Rijksmuseum van Natuurlijke Historie; TMM: University of Texas; UMMZ: University of Michigan Museum of Zoology; UTEP: The University of Texas at El Paso

Page 4 of 17Camacho et al. EvoDevo (2020) 11:11
residue at the N-terminal tail of histone H3). For each specimen, sagittal serial sections were obtained to cap-ture the midfacial tissue between the eyes (Fig. 3). In all bat species, the expression of PH3 begins during the G2 phase of the cell cycle, peaks at metaphase and decreases at telophase (Additional file 2: Figure S2), similar to what has been previously characterized in other mammals [30, 43]. Generally, we observe an increase of PH3-signal when cells are in metaphase and a decrease of PH3-signal when cells are in telophase.
To evaluate proliferation during craniofacial develop-ment, the mean and median PH3-signal (cell-positive area) were scored for each embryonic stage of C. perspi-cillata. The base mean area of PH3 across all stages was 135.75 μm2 (cells sampled (n) = 86,584, Additional file 2: Figure S4) and similar ranges in cell size were observed at each stage (ANOVA, p < 2.2e−16, Additional file 2: Figure S4). To further examine the dynamics of cell size
and developmental stage, the median size of PH3-signal during development was calculated as percent change from the previous stage (Additional file 2: Figure S3). Compared to the base mean area, cells are larger at stages CS20, CS23 and smaller at CS16–19, CS22, and CS24.
In C. perspicillata, the mean number of PH3-positive cells per stage from CS16 to CS24 is dynamic (Additional file 2: Figure S4) and the overall base mean in the number of PH3-positive cells is 1240 (cells sampled (n) = 86,584). Across development, compared to the base mean, pro-liferation is higher in stages CS16–17, CS18–19, and CS20–22 (Additional file 2: Figure S6). No change in pro-liferation is observed from CS17–CS18. However, cell proliferation, compared to the base mean, decreases sub-stantially from stages CS19–20, CS22–23, and CS23–24 (ANOVA, p < 2.2e−16). As the C. perspicillata embryo progresses into the fetal stages (CS 22+), cell prolifera-tion is further reduced.
Fig. 2 Comparisons within a phylogenetic context. Species different in their diets and craniofacial length morphology were compared within a phylogenetic context. A silhouette of the primary source of food for each species is represented at each terminal node for M. natalensis (moth), G. soricina (neotropical bell-flower), C. perspicillata (piper fruit), and A. jamaicensis (fig). Dorsal views of µCT images capturing PC1 diversity from our prior principal component (PC) analysis [11] on skull shape show an ‘average’ or generalist shape in Carollia perspicillata, an extreme PC1-positive score in Platalina genovensium (nectarivore; MCZ-32948), and an extreme PC1-negative score in Centurio senex (frugivore; AMNH-M175651). AMNH: American Museum of Natural History; MCZ: Museum of Comparative Zoology at Harvard

Page 5 of 17Camacho et al. EvoDevo (2020) 11:11
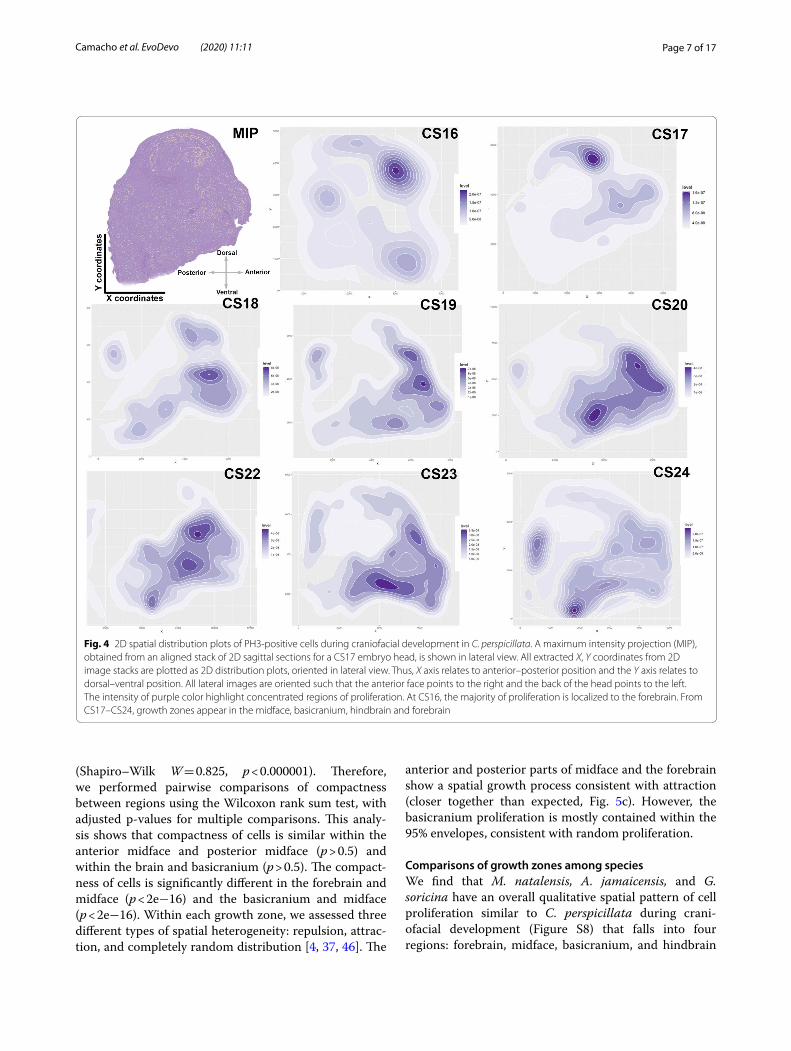
Growth zones during bat craniofacial developmentThe 3D spatiotemporal distribution of proliferating cells along the anterior–posterior (A–P) axis can be summa-rized with 2D density distribution plots (Fig. 4). These plots quantitatively and qualitatively illustrate differences in the distribution of PH3-positive cells at discrete stages of craniofacial development. In C. perspicillata, a model bat, we collected a relatively large range of embryonic specimens (Additional file 1: Table S1) and our analy-sis of microscopic organization of the developing facial
tissues demonstrates significant spatiotemporal differ-ences in the pattern of cell proliferation (Fig. 4). At CS16, cell proliferation is localized to the ventricular zone of the ganglionic eminences in the developing brain. By CS17, the number of proliferating cells increases nine-fold (Additional file 2: Figure S6), with intense prolifera-tion in the brain ventricles, midface, and basicranium. At CS18, the overall number of proliferative cells decreases by 14% (Additional file 2: Figure S6), which is not statisti-cally significant. At CS18, there is a noticeable decrease
Fig. 3 Serial sectioning for multiple experiments. Sagittal sections spanning midfacial tissue between the eyes were analyzed. Sagittal sections along the medial–lateral axes are shown for C. perspicillata at CS16 (a). Shown is slide series 10 stained with H&E and counterstained with alcian blue (b) for anatomical reference. Slide series 1 is used for immunohistochemistry (c) to target proliferating cells. Sagittal sections imaged at 20× magnification are positioned along the medial–lateral axis to visualize developing cranial tissue. H&E staining highlights the cytoplasm of cells in pink (eosin); cartilage cells in blue (alcian); and nuclei are stained black (hematoxylin) (d). Scale bar: 1 mm

Page 6 of 17Camacho et al. EvoDevo (2020) 11:11
in forebrain cell proliferation and an increase in midfa-cial growth, adjacent to the developing forebrain. In addi-tion, new areas of densely populated proliferative cells are observed in the hindbrain and along the basicranium. At CS19, as proliferating cells increase in number as the head grows, additional growth zones are found in the olfactory bulbs, lower jaw, tongue, and nose-tip. At CS20, the anterior growth of the upper midface correlates with increases in cell number dorsoventrally. By CS22, peak cell proliferation occurs, with the majority of divi-sions localized to facial tissues. The posterior growth of the midface, adjacent to the olfactory bulb, occurs in the developing cribriform plate and nasal septal cartilage. At CS23, cell proliferation decreases by 50%, with the major-ity of growth happening in the lower jaw and upper lip. At CS24, the number of proliferative cells drops by 64%, with the majority of growth remaining in the midface, hindbrain, and hyoid.
Qualitatively, the 2D plots of cell proliferation during craniofacial development in C. perspicillata reveal dis-crete cranial growth zones. To statistically assess these distribution patterns, we performed spatial distribution analysis with multi-distance K-means cluster analysis [36]
along the anterior–posterior axis in C. perspicillata. We determined that proliferating cells are organized into at least four and as many as six optimal clusters (Additional file 2: Figure S7a). The six proliferation clusters represent distinct growth zones that match with the anatomical features qualitatively described for the 2D point patterns: forebrain, hindbrain, anterior midface, posterior midface, anterior basicranium and posterior basicranium (Figure S7b). The four detected major clusters are the forebrain, hindbrain, midface, and basicranium.
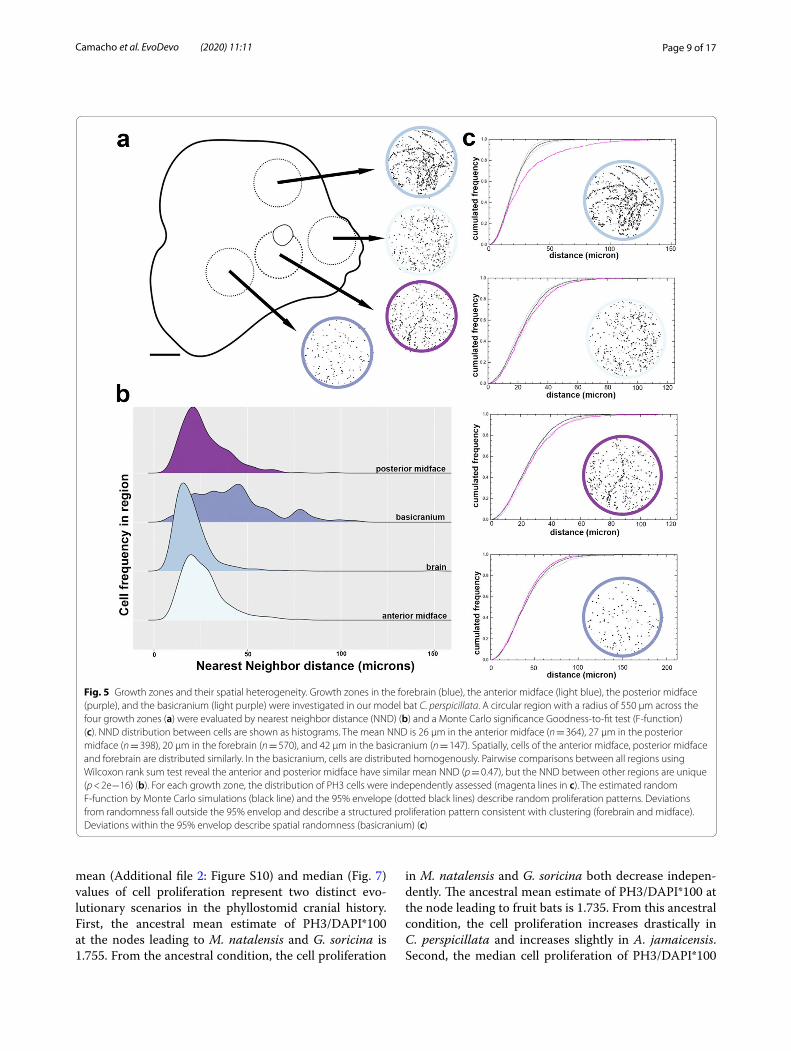
Cellular dynamics within the growth zonesTo further characterize the detected zones of elevated cell proliferation in C. perspicillata, we investigated cel-lular dynamics within a circular region (radius = 550 μm) spanning four such subareas, or growth zones, contribut-ing to the size and shape of the midface: forebrain, ante-rior midface, posterior midface, and anterior basicranium (Fig. 5a). We examined compactness and spatial het-erogeneity of cells by nearest neighbor distance (Fig. 5b) and a Monte Carlo significance goodness-to-fit test (F-function), respectively, as shown in Fig. 5c. In terms of compactness, variation is not normally distributed
Table 1 Carnegie stages and gestation age in the model bat C. perspicillata
Carnegie stage (CS)
Bat day of gestation
Mouse equivalent limbs
Mouse equivalent craniofacial
Key events
CS16 E50 E12.5 E14.5 Craniofacial prominences completely fusedUndifferentiated mesenchyme in medial midfaceMeckel’s cartilage as circular condensationPosterior cranial base cartilage begins to organize
CS17 E54 E13.0 E15.0 Thickening of presumptive leaf-noseLateral nasal capsule cartilage thickensMesenchymal thickenings of olfactory turbinatesTooth development similar to mouse (thickening)
CS18 E60 E13.5 E15.5 Dorsal ventral expansion at the resting zone of basisphenoidResting zone formation in presphenoidPalatal shelves begin separation of oral and nasal cavityMeckel’s cartilage is rod-like across length of mandibleTooth development similar to mouse (tooth bud)
CS19 E64 E14.0 E16.0 Cranial base fully connected along the anterior–posterior aspect of head
Lateral nasal capsule fuses with medial nasal septum.Palatal shelf fusionDermal papillae and induction of the sensory vibrissae.VNO as an epithelial tube with thicker sensory epithelium in its
ventromedial sideLeaf-nose bud increases in size as lancet development begins
CS20 E70 E14.5 E16.5 Hypertrophic chondrocytes appear in the posterior basisphenoidProliferation begins in the presphenoid
CS21 E75 E15.0 E17.0 Hypertrophic chondrocytes appear in anterior basisphenoidOssification begins in the posterior basisphenoid
CS22 E80 E15.5 E17.5 Hypertrophic chondrocytes in anterior presphenoidOssification in presphenoidOlfactory tract into olfactory epithelium
CS23 E85 E16.0 E18.0 Continued growth
CS24 E90 E16.5 E18.5/P1 Canine tooth appositional stage
Page 7 of 17Camacho et al. EvoDevo (2020) 11:11
(Shapiro–Wilk W = 0.825, p < 0.000001). Therefore, we performed pairwise comparisons of compactness between regions using the Wilcoxon rank sum test, with adjusted p-values for multiple comparisons. This analy-sis shows that compactness of cells is similar within the anterior midface and posterior midface (p > 0.5) and within the brain and basicranium (p > 0.5). The compact-ness of cells is significantly different in the forebrain and midface (p < 2e−16) and the basicranium and midface (p < 2e−16). Within each growth zone, we assessed three different types of spatial heterogeneity: repulsion, attrac-tion, and completely random distribution [4, 37, 46]. The
anterior and posterior parts of midface and the forebrain show a spatial growth process consistent with attraction (closer together than expected, Fig. 5c). However, the basicranium proliferation is mostly contained within the 95% envelopes, consistent with random proliferation.
Comparisons of growth zones among speciesWe find that M. natalensis, A. jamaicensis, and G. soricina have an overall qualitative spatial pattern of cell proliferation similar to C. perspicillata during crani-ofacial development (Figure S8) that falls into four regions: forebrain, midface, basicranium, and hindbrain
Fig. 4 2D spatial distribution plots of PH3-positive cells during craniofacial development in C. perspicillata. A maximum intensity projection (MIP), obtained from an aligned stack of 2D sagittal sections for a CS17 embryo head, is shown in lateral view. All extracted X, Y coordinates from 2D image stacks are plotted as 2D distribution plots, oriented in lateral view. Thus, X axis relates to anterior–posterior position and the Y axis relates to dorsal–ventral position. All lateral images are oriented such that the anterior face points to the right and the back of the head points to the left. The intensity of purple color highlight concentrated regions of proliferation. At CS16, the majority of proliferation is localized to the forebrain. From CS17–CS24, growth zones appear in the midface, basicranium, hindbrain and forebrain

Page 8 of 17Camacho et al. EvoDevo (2020) 11:11
(Additional file 2: Figure S7). However, there are sev-eral important peculiarities to the spatial distribution of cell proliferation among the species at CS18 (Additional file 2: Figure S8). In M. natalensis, three additional clus-ters of cell proliferation are present within the develop-ing midface. In G. soricina, an additional growth zone is observed in the midbrain. In A. jamaicensis, PH3-posi-tive cells also cluster in the olfactory bulb, adjacent to the forebrain. Additionally, while there is similar distribution in major areas of craniofacial development, the density of cells in each growth zone is locally modified (Additional file 2: Figure S8).
Species‑specific midfacial elongation is associated with differential cellular proliferationTo determine how and when the characteristic short faces of fruit bats and the long faces of nectar bats are generated during development, we examined embryos spanning a range of stages relevant to midfacial mor-phogenesis (Table 1). Due to the limited samples size of the wild-caught bat embryos, we incorporated museum-preserved embryonic specimens to supplement our mor-phometric dataset on facial length ratio (Additional file 2: Figure S9, Additional file 1: Table S2). The later batch also included embryos from additional phyllostomid species: Macrotus waterhousii with intermediate-length face (insect-feeding) and Desmodus rotundus with short-length face (blood-feeding), which we examined in our recent morphometric study [11]. These species allow for an even broader perspective on the species-specific cra-nial development among phyllostomid bats.
We report size-adjusted facial length measurements as the ratio between absolute facial length and total cranial length (Additional file 2: Figure S9, Additional file 1: Table S2). The phyllostomid bats C. perspicillata, A. jamaicensis, and G. soricina have more similar facial length (FL) to cranial length ratio (FL ratio = 0.28, 0.29, and 0.24, respectively) at CS17, whereas ecomorph-spe-cific facial length differences emerge at CS18 in the fruit bats. In C. perspicillata, the FL ratio (0.26) remains rela-tively constant until birth (Additional file 2: Figure S9). In A. jamaicensis, facial length ratio (0.21) separates from other species until CS20, at which point facial length ratio reaches 0.18. In G. soricina, the facial length ratio remains relatively constant from CS18 until CS20, when it reaches a FL ratio of 0.21. We were unable to obtain CS21 stage embryos for these species. At CS22, the early stages of skeletal development, facial length ratio is similar again for C. perspicillata (FL ratio = 0.25), A. jamaicensis (FL ratio = 0.26), and G. soricina (FL ratio = 0.24). Unlike the constant facial growth observed in C. perspicillata, both A. jamaicensis and G. soricina undergo a burst of rapid growth to achieve the ~ 44% and ~ 11% increases in
facial length at CS22, respectively. In C. perspicillata and A. jamaicensis, the facial length ratio is reduced to 0.21 at CS23. In C. perspicillata, facial length ratio increases and then stabilizes to ~ 0.24 at CS24 until birth. In A. jamaicensis, facial length ratio decreases to 0.16 at CS24 and the overall facial length ratio is maintained at ~ 0.16 until birth. In G. soricina, the facial length ratio is first reduced to 0.22 at CS24, after which point facial length ratio increases to 0.33 before birth.
We next compared the number of PH3-positive cells within the midface area in M. natalensis, C. perspicillata, A. jamaicensis and G. soricina at CS18 (Fig. 6). To control for differences in embryo sizes among these species, we performed a standardization on the mitotic cells by divid-ing the total number of PH3-positive cells by the total number of DAPI-positive cells and multiplied this by 100 (to obtain percent area fraction value). ANOVA pairwise comparisons between species are shown in Fig. 6, while a Tukey’s HSD (honestly significant difference) test identi-fied differences between group means (Table 2). Cell pro-liferation in C. perspicillata (2.423, n = 3) is significantly elevated (p = 0.0006) compared to M. natalensis (1.208, n = 3). In A. jamaicensis, cell proliferation is signifi-cantly elevated (2.055, n = 3) compared to M. natalensis (p = 0.013), but not relative to other phyllostomid bats. Cell proliferation does not differ significantly between G. soricina (1.686, n = 3) and M. natalensis (p = 0.66, n = 3). To further evaluate cell proliferation differences between species, we analyzed them within a phylogenetic context. Since we had a small sample size and the range in prolif-eration rates within these samples was large (Additional file 2: Figure S4), we evaluated both the mean (Additional file 2: Figure S10) and median cell proliferation rates (Fig. 7).
The cellular‑level perspective on heterochronyFurther analysis of the cell proliferation patterns in the developing embryonic faces reveal that species- and ecomorph-specific differences in facial growth could be detected at the cellular level. The ancestral cell prolifera-tion paradigm and the subsequent heterochronic changes in facial development were reconstructed from the embryonic cell proliferation data using square-change parsimony under a Brownian motion model of evolu-tion (Additional file 2: Figure S8). Both mean and median trees from squared-change parsimony reveal that facial growth in G. soricina is similar to facial growth in M. natalensis, with both exhibiting parallel decreases in cell proliferation when compared to a common ancestor. In contrast, an increase in cell proliferation at the ancestral node leads to the short-faced fruit bats.
Finally, we estimated ancestral cell proliferation with maximum likelihood using the phytools fastAnc [63]. The
Page 9 of 17Camacho et al. EvoDevo (2020) 11:11
mean (Additional file 2: Figure S10) and median (Fig. 7) values of cell proliferation represent two distinct evo-lutionary scenarios in the phyllostomid cranial history. First, the ancestral mean estimate of PH3/DAPI*100 at the nodes leading to M. natalensis and G. soricina is 1.755. From the ancestral condition, the cell proliferation
in M. natalensis and G. soricina both decrease indepen-dently. The ancestral mean estimate of PH3/DAPI*100 at the node leading to fruit bats is 1.735. From this ancestral condition, the cell proliferation increases drastically in C. perspicillata and increases slightly in A. jamaicensis. Second, the median cell proliferation of PH3/DAPI*100
Fig. 5 Growth zones and their spatial heterogeneity. Growth zones in the forebrain (blue), the anterior midface (light blue), the posterior midface (purple), and the basicranium (light purple) were investigated in our model bat C. perspicillata. A circular region with a radius of 550 μm across the four growth zones (a) were evaluated by nearest neighbor distance (NND) (b) and a Monte Carlo significance Goodness-to-fit test (F-function) (c). NND distribution between cells are shown as histograms. The mean NND is 26 μm in the anterior midface (n = 364), 27 μm in the posterior midface (n = 398), 20 μm in the forebrain (n = 570), and 42 μm in the basicranium (n = 147). Spatially, cells of the anterior midface, posterior midface and forebrain are distributed similarly. In the basicranium, cells are distributed homogenously. Pairwise comparisons between all regions using Wilcoxon rank sum test reveal the anterior and posterior midface have similar mean NND (p = 0.47), but the NND between other regions are unique (p < 2e−16) (b). For each growth zone, the distribution of PH3 cells were independently assessed (magenta lines in c). The estimated random F-function by Monte Carlo simulations (black line) and the 95% envelope (dotted black lines) describe random proliferation patterns. Deviations from randomness fall outside the 95% envelop and describe a structured proliferation pattern consistent with clustering (forebrain and midface). Deviations within the 95% envelop describe spatial randomness (basicranium) (c)

Page 10 of 17Camacho et al. EvoDevo (2020) 11:11
at the node for the most recent common ancestor of phyllostomids is estimated to be 1.636. Compared to the median ancestral cell proliferation, the prolifera-tion of G. soricina does not differ significantly (1.3–1.4), whereas the proliferation rate in C. perspicillata is ele-vated from ~ 1.6 to 2.2–2.3 and the proliferation of A. jamaicensis is elevated from ~ 1.6 to 1.7–1.8.
DiscussionOur recent morphometric studies on adult, juvenile and embryonic skulls revealed that heterochronic per-amorphic shifts in craniofacial development contributed to much of the phyllostomid cranial diversity [11]. We hypothesized that differences in timing and/or rate of important cellular-level processes, such as cell prolifera-tion, during embryonic and post-embryonic development in different phyllostomid lineages result in differential craniofacial growth and morphogenesis. This expecta-tion was based on the wealth of developmental studies on craniofacial variation in laboratory mice reporting the central role of cellular proliferation dynamics in midfa-cial morphogenesis [34, 37, 46, 62] and on evolutionary developmental studies demonstrating cellular prolifera-tion underlying species-specific facial differences [1, 2, 9, 33, 35, 75, 76]. The patterns of cellular proliferation we observed during craniofacial embryonic develop-ment align with our hypothesis and serve to better our
understanding of the developmental mechanisms under-lying the striking craniofacial diversity in phyllostomid bats.
The main dimension of phyllostomid cranial evolution is the length of the skull and snout, a morphological char-acteristic important to phyllostomid feeding ecology [5, 10, 15, 54]. The faces of phyllostomids show a full range of phenotypes from the extremely shortened-faces of the fruit bats to the highly elongated faces of the nectar-feeding bats, which encompass the majority of variation based on principal components (PC) analysis (Fig. 2). We chose three species both accessible in the wild and rep-resentative of the facial length variation captured along PC1: Carollia perspicillata, a predominantly piper-eat-ing bat with an intermediate length cranium; Artibeus jamaicensis, a predominantly fig-eating bat with a short
Fig. 6 Pairwise comparisons of proliferation (PH3-positive cells ) between species. Standardized mean proliferation (PH3/DAPI * 100) were scored in the midface along the parasagittal plane at CS18. Shown on the left are three parasagittal serial sections for A. jamaicensis. The midface is outlined with a dotted line. Proliferation rates (right violin plots) were compared between M. natalensis (MN, 1.208, n = 3), G. soricina (GS, 1.686, n = 3), C. perspicillata (CP, 2.423, n = 3), and A. jamaicensis (AJ, 2.055, n = 3). ANOVA pairwise comparisons were performed with M. natalensis as the reference outgroup. Compared to M. natalensis, G. soricina has similar proliferation (p = 0.66), C. perspicillata has elevated proliferation (p = 0.001), and A. jamaicensis has slightly elevated proliferation (p = 0.027). All p-values are adjusted for multiple comparisons. Silhouettes of cranial morphology in lateral view are shown for each species at CS18, where species differences in facial length begin among phyllostomids. Scale bar: 2 mm
Table 2 Tukey’s honest significance test
Difference Lower Upper p value adj
CP-AJ 0.368001827 − 0.265173035 1.00117669 0.384184404
GS-AJ − 0.722892044 − 1.589902431 0.144118344 0.122976424
MN-AJ − 0.847124335 − 1.634625627 − 0.059623043 0.032326069
GS-CP − 1.090893871 − 1.928505482 − 0.25328226 0.008240205
MN-CP
− 1.215126162 − 1.970139066 − 0.460113259 0.001215846
MN-GS
− 0.124232291 − 1.083836944 0.835372361 0.982997469

Page 11 of 17Camacho et al. EvoDevo (2020) 11:11
and wide face; and Glossophaga soricina, a primarily nectar-eating bat with an elongated head and narrow face. Related morphometric studies, each using different methodologies, identified embryonic stage CS18 as the starting point for morphological elaboration of phyllos-tomid skull shapes during development [11, 66]. In this study, we confirm that species- and ectomorph-specific facial length differences are first detected at stage CS18 for all the species studied (Additional file 2: Figure S9), with large differences in cell proliferation rates and dis-tribution in the developing midface area at CS18 (Fig. 4, Additional file 2: Figure S8). Thus, we chose to focus on stage CS18 as the most informative time period at the onset of species differences in phyllostomid cranial shape for all further comparisons.
At stage CS18, relatively higher or lower level of cell proliferation is expected to play an important role in gen-erating the correct size and shape of the developing mid-face. Ancestral state reconstruction of cell proliferation rates (Fig. 7) and distribution of proliferating cells within the midface region between species (n = 3 per species) provides a degree of explanation for the two models of peramorphosis suggested for short- and long-faced bats (Fig. 8). We find that the node leading to nectar bats and the node leading to fruit bats show similar cell prolifera-tion (Fig. 7). This result is consistent with an idea from
previous phylogenetic studies suggesting that all special-ized feeding morphologies are derived from an ancestor with similar adult and developmental features [7, 16].
Interestingly, embryos of fruit bats have a higher rate of proliferation when compared to that of the calculated stage-matched ancestor (Fig. 7). The increased rate of development is expected to result in peramorphosis by acceleration [3]. Therefore, we propose that the increase in cell proliferation rate is the main proximal develop-mental mechanism associated with facial length develop-ment in fruit bats (Fig. 8). At the cellular level, elevated proliferation rate in committed progenitors may trigger terminal cell divisions to occur earlier, likely at CS18, which can then lead to a shorter or truncated face. This is in contrast to short-face morphology resulting from deficient outgrowth of the facial processes, the proximate mechanism proposed by Usui and Tokita [71]. We note that since A. jamaicensis is a basal branching member of the short-face fruit-eating bats, the more extreme short-faced fruit bats may indeed undergo additional hetero-chronic shifts as described by Usui and Tokita, 2018, but currently no data from morphometric studies support this potential paedomorphic change.
In contrast, the long-faced nectar bats demonstrate a proliferation rate similar to their calculated stage-matched ancestor (Fig. 7). Under the hypermorphosis model, the constant growth rate likely relates to a tempo-ral extension in progenitor proliferation (i.e., delay in the offset of terminal cell division), which gives the face more time to grow—leading to a longer face (Fig. 8). After the stage CS18, their facial length remains relatively short until ~ CS22, when it begins to elongate (Additional file 2: Figure S9, Additional file 1: Table S2) and continues to elongate throughout fetal development. We propose that the development between stages CS18 and CS22 relates to a period of constant proliferation compared to other bat species. The relatively late onset of differential growth, observed as a change in proliferation rate and/or cellular differentiation, is likely associated with the observed peramorphosis by hypermorphosis in this phyl-lostomid ecomorph (Fig. 8). To further validate these hypotheses, more phyllostomid taxa and a higher number of embryos per species should be examined at the stages of development relevant to the differences in facial length (stages CS20, CS22, CS24).
In complex multi-part structures such as the verte-brate head, evolutionary changes, including those driven by heterochrony, can occur in a mosaic fashion as semi-independent modules [8, 21, 51]. One of the key aspects of heterochrony suggested by Gould [26] is evolution-ary modularity [40]. In fact modularity, characterized by strong internal integration within each module and weak interactions with components of other modules,
Fig. 7 Ancestral state reconstruction of proliferation during development at CS18. Standardized proliferation (PH3/DAPI*100) was evaluated on a molecular tree pruned to relevant taxa (Fig. 2). Maximum likelihood ancestral state estimates at each node are shown for median proliferation rate and the evolutionary history is colored along each branch. Ancestral proliferation at each node was compared to modern species proliferation at the tips of the tree. The ancestral bat leading to M. natalensis (MN), G. soricina (GS) and the ancestral bat leading to fruit-feeding bats have similar proliferation (1.636). In M. natalensis, proliferation is decreased (1.158). In the long-face of G. soricina, the estimated proliferation (1.332) is not statistically different (p > 0.05). Compared to ancestral proliferation, the growth process in the short-face of C. perspicillata (CP) is elevated to 2.247 (p = 0.001). In the short-face of A. jamaicensis (AJ), compared to ancestral proliferation, the proliferation is slightly elevated to 1.755 (p = 0.03). Silhouettes of cranial morphology in lateral view are shown for each species and the proliferation data within the midface at CS18 likely relate to the growth zone (asterisk) shown in Fig. 7

Page 12 of 17Camacho et al. EvoDevo (2020) 11:11
was demonstrated to be an important phenomenon in sequence heterochrony during mammalian skull evolu-tion [24, 39, 57]. For this study, we consider stage CS18 as a good representative ontogenetic time point to study possible heterochronic modifications during craniofacial development. Our analysis of cell proliferation is primar-ily based on using C. perspicillata as a model, and we determined that the proliferating cells are organized into at least four and up to six optimal clusters (Additional file 2: Figure S7). These proliferative regions of the devel-oping cranium belong to multiple tissues that develop along their own growth trajectories, in concert, to form the adult structures: the forebrain, hindbrain, posterior basicranium, anterior basicranium, posterior midface, and anterior midface.
When we assessed the growth trajectory pattern within the proliferative regions, we observed that the midface and forebrain both had an aggregated spatial distribu-tion pattern, while the basicranium had a random spa-tial distribution pattern (Fig. 5). The aggregated pattern indicates a structured and directional model of cell pro-liferation. Indeed, both the forebrain and midface have been shown to develop in an inside-out organization; that is, growth at one basal surface displaces tissue to the apical surface through the movement of cells [53, 74]. For example, in the midface, the organized growth plate along the caudal end of the cartilage nasal septum “pushes” the septum anteriorly [74]. Similarly, the organ-ized zones of progenitor cells found at the basal surface of the forebrain produce cells that migrate apically and expand the size of the cortex [47, 48, 53]. In contrast, the basicranium has dynamic and transient growth sites [46] that develop into an organized, bi-polar growth plate during the later stages of bone development [79]. Since we identify a random pattern of proliferation in the basi-cranium, we conclude the organized growth sites have not yet appeared by stage CS18.
While we directly measured cell proliferation differ-ences within a phylogenetically meaningful compara-tive framework, we cannot yet rule out other potential cellular mechanisms contributing to differential cranial growth, such as changes in cell size, shape and move-ment. Additionally, we chose to focus our comparative analysis at embryonic stage CS18, and we do not evalu-ate in detail the entire range of possible cellular hetero-chronies. However, we do expect to find local or mosaic cellular-level heterochronies during craniofacial morpho-genesis, as suggested by the detailed 2D cell proliferation maps for C. perspicillata.
This descriptive study finds correlations between dif-ferential growth of macroscopic structures and the behavior of cells at the microscopic level that both con-tribute to morphogenesis. Our cellular proliferation data
in the developing midface are largely interpreted within the framework and with a priori knowledge of peramor-phosis, a mode of heterochrony previously suggested to play an important role in the evolution of phyllosto-mid facial diversity. Due to the relatively small sample sizes and limited taxonomic sampling available for this study, it is too early to conclude that the reported hetero-chronic modifications to cell proliferation patterns can explain craniofacial evolution of the phyllostomid radia-tion in its entirety. However, our previous morphological studies strongly suggest that the species we selected for
Fig. 8 Proliferation model depicting extended development (peramorphosis) regulating facial length. We summarize key phases of craniofacial development between the short-faced C. perspicillata, the shorter face of A. jamaicensis, and the longer face of G. soricina at CS16 (early), CS17 (mid), and CS18 (late). The overall window of proliferation is the same duration of time between species. The colored regions of the midface represent cell proliferation and relate to aspects of facial development. In phyllostomid evolution, compared to the ancestor, skull shape is changed through heterochrony by increasing the rate of growth (acceleration) in fruit bats and by extending the duration of growth (hypermorphosis) in nectar bats. At the cellular level, the facial development is shown to undergo three phases of cellular division: early (green), mid (yellow), and late (red). Early divisions may relate to neural crest cells (NCC) during mesenchymal condensations (green) that give rise to pre-cartilage and pre-bone progenitors (yellow) and mature into cartilage and bone progenitors (yellow/red). Cartilage and bone cells proliferate and mature with a terminal division (red). With acceleration, elevated growth rate in committed progenitors (yellow) may trigger terminal divisions to occur (red) at an earlier time, which can then led to a shorter or truncated face. With hypermorphosis, constant growth rate (yellow) may relate to an extension in progenitor proliferation (delay in terminal division), which gives the face more time to grow and leads to a longer face. The figure is adapted from [71]

Page 13 of 17Camacho et al. EvoDevo (2020) 11:11
this study are indeed representative of the Glossopha-ginae nectar bats, the Carollinae fruit bats, and for the Stenodermatinae short-faced fruit bats. Additional taxa, particularly those representing the basal insect-feeding phyllostomids, vampire bats, and the more morphologi-cally extreme nectar and fruit-eating bats, will need to be investigated to understand more comprehensively how differential cell proliferation contributes to cranial morphogenesis. Likewise, extending these comparative analyses to the molecular and genetic levels should reveal precise developmental mechanisms involved in the evo-lution of phyllostomids.
ConclusionComparing cell proliferation rates and patterns to an observed phenotypic variation is a valuable approach for investigating heterochronic shifts in growth and result-ing morphological evolution. Quantitative maps of pro-liferation during development show how craniofacial growth occurs at stereotypical locations in the craniofa-cial region. Our fine-scale morphogenetic analysis of bat embryos with distinct faces emphasizes how facial length changes correlate with altered cellular proliferation to the midface. Ancestral state reconstructions of cell pro-liferation in the most recent common ancestor of Noc-tilionoidea suggest that the elevated cell proliferation in fruit bats is an apomorphic trait and the lower cell prolif-eration in nectar bats is plesiomorphic. Variation in the rate and/or duration of cell proliferation during crani-ofacial development appears to be an important proxi-mal mechanism of heterochronic growth that facilitated evolutionary diversification of phyllostomid faces. Fur-thermore, the widespread employment of heterochrony implicated by many evolutionary developmental studies on mammals and other vertebrate animals [14, 21, 23, 42, 51, 52, 69] implies that similar heterochronic changes at the cellular level are broadly important in morphological evolution.
Experimental proceduresField workMiniopterus natalensis (South Africa), Carollia perspi-cillata (Trinidad), Artibeus jamaicensis (Trinidad), and Glossophaga soricina (Trinidad) were wild collected under permits issued by the Western Cape Nape Nature Conservation Board (South Africa) and the Wildlife Sec-tion, Forestry Division, Ministry of Agriculture, Land and Marine Resources (Republic of Trinidad and Tobago). M. natalensis pregnant females were originally collected in September to October of 2008 from the De Hoop Guano Cave in South Africa for studies in bat limb development [32, 55]. Cranial tissues unused in bat limb studies were generously shared by Professor Nicola Illing (University
of Cape Town). C. perspicillata, A. jamaicensis, and G. soricina pregnant females were collected from reproduc-tively synchronized, wild populations living on Trinidad (Additional file 2: Figure S11) during the March to May for studies of embryonic development. In the case of C. perspicillata (the best studied of the three species), this period would overlap portions of two successive, syn-chronized reproductive periods exhibited by most adult females in the population [58, 59]. Pregnant females were humanely caged and transported, and generally eutha-nized within 6 and 10 h after collection.
Embryo collection and storageImmediately after euthanasia of the mothers, their embryos (one per female) were harvested as described previously [60]. Embryos were gently rinsed in chilled 1× phosphate buffered saline (PBS), pH 7.4 (Invitro-gen), and quickly staged based on limb development fea-tures according to a Carnegie staging table [13, 32, 67]. Embryos were perfused intracardially with chilled 1× PBS followed by perfusion with chilled 4% paraformalde-hyde in 1× PBS (PFA). Tissues were then incubated in 4% PFA overnight at 4 °C. Post-fixation, tissues were rinsed three times in chilled 1× PBS for 5 min, then dehydrated through a methanol series (25%, 50%, 75% in 1× PBS and 100%) for 20 min each wash, and stored in 100% methanol at − 20 °C [61]. Embryonic heads were stored separately from bodies. For Carollia perspicillata, we were able to obtain tissues spanning stages CS16–CS24. For Miniopterus natalensis, we were able to obtain tis-sue spanning stages CS16–CS18. We obtained tissue at CS17–CS24 for A. jamaicensis and G. soricina, but were not able to obtain many biological replicates. Therefore, stages with less than two specimens were excluded from analysis. Tissues were exported with the permission of the Wildlife Section, Forestry Division of the Ministry of Agriculture, Land and Fisheries of the Republic of Trini-dad and Tobago and imported with the permission of U.S. Fish and Wildlife Service.
ImmunohistochemistryBat embryonic cranial tissue were rehydrated to 0.1 M PBS, cryo-protected in 10% sucrose overnight at 4 °C, fol-lowed by 30% sucrose wash overnight at 4 °C, and then another overnight wash in 1:1 sucrose: OCT mix (Tis-sue-Tek; Sakura Finetek USA) at 4 °C. Tissue was briefly embedded in OCT for 30 min at 4 °C prior to flash freez-ing on dry ice. To maximize molecular and morphologi-cal information, we serially sectioned embryo heads at 10 μm with a cryostat (Leica CM3050S) along the sagit-tal plane to capture craniofacial length. Serial 10 μm sec-tions were collected every 100 μm and mounted onto glass suprafrost slides (Fisher; Fig. 3). One series was
Page 14 of 17Camacho et al. EvoDevo (2020) 11:11
stained for histological reference for archiving into the Museum of Comparative Zoology at Harvard. Another series was used to assay proliferation. All remaining serial sections were stored in − 80 °C freezer for future experi-ments. For antigen unmasking, the slides were steamed in pre-warmed 1 mM sodium citrate buffer with 0.05% Tween20, pH 6.0 for 30 min. Sections were blocked in 10% donkey serum (Gibco), 0.1% Tween20, and 0.3 M glycine. Immunodetection was performed with a primary antibody targeting PH3 (1:1000, Millipore 06-570) and incubated for 24 h at 4 °C. Sections were rinsed in 1× PBS (phosphate buffered saline) and incubated for 1 h with a secondary antibody conjugated with Cy2 (1:200, Jack-son Lab). Antibodies were diluted in 1% donkey serum with 0.01% Tween20 and 0.03 M glycine. The sections were counterstained with DAPI (4’,6-diamidino-2-phe-nylindole) fluorescent DNA stain (1:1000, ThermoFisher D1306).
Fluorescent imagingAll embryo heads are imaged with the snout pointing to the right. Serial sections of the entire head were cap-tured with a wide-field scanning microscope (Olympus VS120) at 20× magnification. Imaging large fields of view was achieved by imaging multiple, smaller images and combining them to a larger overview, which were auto-matically aligned by the imaging software (Olympus). All imaging was done at the Harvard Medical School Neurobiology Imaging Facility at the Department of Neurobiology.
3D image visualizationSagittal sections of immunostained tissue representing medial–lateral aspects of the head (Fig. 3) were imaged, aligned, and reconstructed as a virtual image stack in Fiji [65]. Original image formats from Olympus VS120 were imported into FIJI using Bio-formats importer and saved as a 16-bit TIF. Each 10 μm serial section spanning the medial–lateral aspects of the head were combined as 2D stack of images with each 10 μm serial section restrict-ing data to a particular spatial plane of focus along the medial–lateral aspects of the head. The distance between each serial section of a series is 100 μm, so the depth data is set to 100 μm. Since the 2D images have depth data, the 2D stack contains data as X, Y, Z. To reconstruct an 3D object, the 2D images were aligned by two Procrustes transformations, translation and rotation, with the FIJI Plugin StackReg.
Cell segmentationAligned 2D stacks of unprocessed 16-bit fluorescent image data were used for quantitative analysis. Each channel in the aligned 2D stack was similarly processed.
Each image channel of the 2D stack was isolated and ana-lyzed separately as outlined in (Additional file 2: Figure S12) with a custom java script. Individual cells were seg-mented (i.e., detected) with the watershed-based func-tion with a noise tolerance of 100 within the FIJI module Find Maxima. Since PH3 is a nuclear marker, cell signal was relatively compact in the center of each cell, which is ideal for the Find Maxima function. Each maxima gener-ates a binary segmented particle with X, Y coordinates. To define the area occupied by cell signal, a threshold was adjusted on the original 16-bit image with an Otsu algorithm to minimize intraclass variance of the black (background) and white (signal) intensity. Thresholding generates a binary image defining the total area of cell signal. Individual cell signal was generated by combin-ing the segment binary image with the threshold binary image.
Object‑based quantificationObject-based identification of PH3-positive cells used for analysis is described in the supplemental text and Addi-tional file 2: Figure S12. Cell information (position, size, shape) was quantified using a custom script in FIJI. Posi-tional information coordinates (X, Y) of each cell center maxima during mitosis was obtained. Size of each cell is presented as the area. Shape descriptors are used to help evaluate cellular behavior (i.e., a round cell likely G2 or prophase and an elongated cell likely metaphase or tel-ophase). Roundness of PH3-signal was determined by dividing the major axis of the cell body with the minor axis of the cell body (Figure S13).
Spatial pattern analysisThe extracted positional information (X, Y) of detected objects in a 2D image stack was used to generate a point pattern in R. The 3D spatial distribution of proliferating cells is represented as a 2D maximum intensity projec-tion of density data on 2D contour plots for easy visu-alization, where dark regions relate to concentrated cells and lighter regions are less dense.
Multi-distance K-mean cluster analysis assessed clus-tering patterns among the entire distribution of coor-dinates. K-means cluster analysis finds groups in data without defined categories, with the number of groups defined by the variable K. The unsupervised learning works iteratively to assign data points to a group based on feature similarity. The collection of features which define a group are used to interpret what type of group each cluster represents. We evaluate a range of K values with the commonly used visual metric, the “elbow point”. Increasing the K value will always decrease the mean dis-tance between points in a cluster, so the ideal K value is where the rate of decrease sharply shifts, or bends.
Page 15 of 17Camacho et al. EvoDevo (2020) 11:11
A subset of concentrated regions of growth identified by 2D contour plots and K-means cluster analysis were further analyzed by nearest neighbor distance analy-sis and a Monte Carlo significance goodness-to-fit test (F-function). These four regions are shown in Fig. 5. The spatial statistics were evaluated within a circular region with a radius of 550 μm spanning subareas, or growth zones: forebrain, anterior midface, posterior midface and anterior basicranium. Nearest neighbor analysis measures the closest distance between each point and then compares it to a random sample of points to aide in evaluating the distribution pattern of cells. Cells closer together than expected from random are clustered. Addi-tional patterns of distribution are random or dispersed.
The F-function evaluates distribution pattern devia-tion from spatial randomness to determine the statistical significance of clustering patterns. For each cluster (i.e., growth zone), random shuffling of point patterns within the reference region is used to generate a random distri-bution pattern. This randomization is done five times to generate an average random distribution. A second set of random point patterns is then generated to calculate the expected variation around the average random distribu-tion. The distribution pattern for each cluster is plotted alongside the average random distribution. The distribu-tion pattern can fall within the expected variation around the average random distribution, which is then inter-preted as a random distribution pattern. The distribution pattern can shift ahead of the random distribution, which is then interpreted as attraction (closer together than expected). The distribution pattern can shift behind the random distribution, which is then interpreted as repul-sion (further apart than expected).
Ancestral state reconstructionThe proliferation data between species was normalized to account for size differences. To standardize, the total amount of PH3-positive cells was divided by the total amount of DAPI-positive cells and multiplied by 100 (percent area fraction). Group mean and median prolifer-ation were mapped onto the tips of the phylogeny shown in Fig. 2. The phylogeny used was a pruned tree from [11], which was based on the molecular phylogeny from [15]. Estimates of ancestral states were performed with parsimony using Mesquite [49] and performed with max-imum likelihood using Phytools fastAnc [63] in R. The ancestral states were visualized as a color gradient repre-senting continuous values projected onto the phylogeny.
Supplementary informationSupplementary information accompanies this paper at https ://doi.org/10.1186/s1322 7-020-00156 -9.
Additional file 1: Additional Tables. (1) Specimens collected, (2) Facial Length ratio.
Additional file 2: Additional Figs. (1) Heads matched to same stage in mouse & bat, (2) PH3 cell panel, (3) Delta change of cell size, (4) Base mean summary area CP PH3, (5) MN PH3 cell size mean, (6) Percent change number of cells (count), (7) K-mean cluster, (8) CS18 ASR distribution map, (9) Facial length ratio, (10) ASR Mean Proliferation, (11) Sampling sites, (12) Cell segmentation, (13) PH3 CP & MN cell size vs shape.
Additional file 3. Supplemental methods: (1)Sampling, (2) Maximizing experiments with few biological replicates, (3) Automatic cell quantifica-tion (4) PH3 as a mitotic marker, (5) Cellular development.
AcknowledgementsThe project benefits from working collaborations with Drs. Veronica Martínez-Cerdeño, Nicola Illing and the late Chris Cretekos. We gratefully acknowledge the assistance of local bat experts associated with the research group Trinibats (trinibats.com) in some of the field work: Dr. Janine Seetahal, DVM, Vernie Ramkisson, Dr. Luke Rostant, and Darshan Narang. Lab and field support was provided by students associated with the University of West Indies, Trinidad: Renoir J. Auguste, Nicolas Mohammed, Shane Manchouck, and Laura Baboolal. Lab and field support was also provided by Aaron Harns-berger, Katrina Bloom, Kristin Jonasson, PhD, and ecologist Jolie Henricks. We also regard Richard Smith, a naturalist, and the late Simeon Williams, a local bushman from Brasso Seco, as instrumental to the safety and well-being of all researchers. We thank Drs. Elena Kramer, James Hanken, Mansi Srivastava, Ter-ence Capellini and Clifford Tabin for their advice and comments for improving this study. Members of the Tabin and Cepko labs at Harvard Medical School (HMS) provided assistance in detection of molecular targets in tissue, as well as advice with quantitative fluorescent image analysis. The Image and Data Analysis Core (IDAC) at HMS provided technical assistance in writing custom scripts to create 3D image stacks, object segmentation and quantification.
Author’s contributionsJC and AA designed the study and co-wrote the manuscript. JC, SKS, JDL, and CR performed histological and immunolabeling experiments. JC and CR produced imaging data. JC analyzed morphological and cellular data. JC, RM, JJR, and RRB performed field work for this study. All authors contributed to the final manuscript. All authors read and approved the final manuscript.
FundingThis work was supported by NSF Doctoral Dissertation Improvement Grant in the Directorate for Biological Sciences (DDIG) DEB-1501690 to J.C. and NIH NINDS P30 Core Center Grant NS072030 to the HMS Neurobiology Imaging Facility. J.C. is supported by NSF GRFP DGE-1144152 and AAUW American Fellowship.
Availability of data and materialsData analyzed during this study are included in this article and in the sup-plementary information. Reference specimens are deposited as a Trichrome series into the Museum of Comparative Zoology (MCZ) at Harvard. All raw and processed 2D stack-images of imaged Trichrome (40×) and immunohis-tochemistry (20x) are available to others for analysis. We have focused on the midface, but we hope others will be interested in analyzing other aspects of craniofacial development. In addition, body and limbs for all specimens (Addi-tional file 1: Table S1) are stored in methanol at − 20 °C and are available upon request and might eventually be acquisitioned into the MCZ for archiving.
Ethics approval and consent to participateAll animals were collected in accordance with ethics guidelines from the University of Cape Town Faculty of Science Animal Experimentation Commit-tee and additional sampling permission granted by the Western Cape Nature Conservation Board and by Harvard University Faculty of Arts and Sciences Institutional Animal Care and Use Committee.
Consent for publicationNot applicable.

Page 16 of 17Camacho et al. EvoDevo (2020) 11:11
Competing interestsThe authors declare that they have no competing interests.
Author details1 Department of Organismic and Evolutionary Biology, Harvard University, Cambridge, MA 02138, USA. 2 Department of Genetics, Blavatnik Institute, Harvard Medical School, Boston, MA 02115, USA. 3 Department of Obstetrics and Gynecology, State University Downstate Medical Center, Brooklyn, USA. 4 Department of Genetics, University of Texas MD Anderson Cancer Center, Houston, USA. 5 Department of Life Sciences, Imperial College London, Silwood Park Campus Buckhurst Road, Ascot, Berkshire SL5 7PY, UK. 6 Natural History Museum, Cromwell Road, London SW7 5BD, UK.
Received: 12 March 2020 Accepted: 22 May 2020
References 1. Abramyan J, Leung KJM. Richman JM Divergent palate morphology in
turtles and birds correlates with differences in proliferation and BMP2 expression during embryonic development. J Exp Zool Part B Mol Dev Evol. 2014;322:73–85.
2. Abzhanov A, Protas M, Grant BR, Grant PR, Tabin CJ. Bmp4 and morpho-logical variation of beaks in Darwin’ s finches. Science. 2004;305:1462–5.
3. Alberch P, Gould SJ, Oster GF, Wake DB. Size and shape in ontogeny and phylogeny. Paleobiology. 1979;5:296–317.
4. Andrey P, Kiêu K, Kress C, Lehmann G, Tirichine L, Liu Z, Biot E, Adenot PG, Hue-Beauvais C, Houba-Hérin N, Duranthon V, Devinoy E, Beaujean N, Gaudin V, Maurin Y, Debey P. Statistical analysis of 3D images detects regular spatial distributions of centromeres and chromocenters in animal and plant nuclei. Biol PLoS Comput. 2010;6:e1000853.
5. Arbour JH, Curtis AA, Santana SE. Signatures of echolocation and dietary ecology in the adaptive evolution of skull shape in bats. Nat Commun. 2019;10:1–3.
6. Baker RJ, Jones JK, Carter DC. Biology of bats of the new world family Phyllostomatidae. Special publications the Museum Texas Tech University. Lubbock: Texas Tech University; 1976.
7. Baker RJ, Olaf R, Bininda-Emonds HM-M, Calvin A, Van Den Bussche R. Molecular timescale of diversification of feeding strategy and morphol-ogy in new world leaf-nosed bats (Phyllostomidae): a phylogenetic perspective. In: Gunnell GF, Simmons NB, editors. Evolutionary history of bats: fossils, molecules and morphology. Cambridge: Cambridge Univer-sity; 2012. p. 385–409.
8. Bastir M, Rosas A. Mosaic evolution of the basicranium in Homo and its relation to modular development. Evol Biol. 2009;36:57–70.
9. Brugmann SA, Kim J, Helms JA. Looking different: understanding diversity in facial form. Am J Med Genet Part A. 2006;140:2521–9.
10. Van Cakenberghe V, Herrel A, Aguirre LF. Evolutionary relationships between cranial shape and diet in bats (Mammalia: Chiroptera). Düren: Shaker Publishing; 2002. p. 205–236.
11. Camacho J, Heyde A, Bhullar B-AS, Haelewaters D, Simmons NB, Abzh-anov A. Peramorphosis, an evolutionary developmental mechanism in neotropical bat skull diversity. Dev Dyn. 2019;248:1129–43.
12. Clare EL, Goerlitz HR, Drapeau VA, Holderied MW, Adams AM, Nagel J, Dumont ER, Hebert PDN, Brock Fenton M. Trophic niche flexibility in Glos-sophaga soricina: how a nectar seeker sneaks an insect snack. Funct Ecol. 2014;28:632–41.
13. Cretekos CJ, Weatherbee SD, Chen CH, Badwaik NK, Niswander L, Behringer RR, Rasweiler JJ IV. Embryonic staging system for the short-tailed fruit bat, Carollia perspicillata, a model organism for the mammalian order Chiroptera, based upon timed pregnancies in captive-bred animals. Dev Dyn. 2005;233:721–38.
14. Daza JD, Mapps AA, Lewis PJ, Thies ML, Bauer AM. Peramorphic traits in the tokay gecko skull. J Morphol. 2015;276:915–28.
15. Dumont ER, Samadevam K, Grosse I, Warsi OM, Baird B, Davalos LM. Selec-tion for mechanical advantage underlies multiple cranial optima in new world leaf-nosed bats. Evolution. 2014;68:1436–49.
16. Fenton MB. Wounds and the origin of blood-feeding in bats. Biol J Linn Soc. 1992;47:161–71.
17. Ferraz T, Rossoni DM, Althoff SL, Pissinatti A, Paixão-Cortês VR, Bortolini MC, González-José R, Marroig G, Salzano FM, Gonçalves GL, Hünemeier T. Contrasting patterns of RUNX2 repeat variations are associated with palate shape in phyllostomid bats and new world primates. Sci Rep. 2018;8:1.
18. Freeman PW. Form, Function, and Evolution in Skulls and Teeth of Bats. Pap Nat Resour. 1998;9:140–56.
19. Fu X, Lennerz JK, Onozato M, Iafrate A, Yagi Y. Evaluation of a confocal WSI scanner for FISH slide imaging and image analysis. Diagn Pathol. 2017;3:249.
20. Gardner AL. Feeding habits. In: Baker RJ, Jones K, Carter DC, editors. Biology of bats of the new world family Phyllostomatidae. Part II. Lubbok: Texas Tech Press; 1977. p. 293–350.
21. Gerber S, Hopkins MJ. Mosaic heterochrony and evolutionary modu-larity: the trilobite genus zacanthopsis as a case study. Evolution. 2011;65:3241–52.
22. Ghaznavi F, Evans A, Madabhushi A, Feldman M. Digital imaging in pathology: whole-slide imaging and beyond. Annu Rev Pathol Mech Dis. 2013;8:331–59.
23. Godoy PL, Ferreira GS, Montefeltro FC, Vila Nova BC, Butler RJ, Langer MC. Evidence for heterochrony in the cranial evolution of fossil crocodyli-forms. Palaeontology. 2018;61:543–58.
24. Goswami A. Cranial modularity and sequence heterochrony in mammals. Evol Dev. 2007;9:290–8.
25. Goswami A, Polly PD, Mock OB, Sánchez-Villagra MR. Shape, variance and integration during craniogenesis: contrasting marsupial and placental mammals. J Evol Biol. 2012;25:862–72.
26. Gould SJ. Ontogeny and Phylogeny. Harvard: Harvard University Press; 1977.
27. Gunnell GF, Simmons NB, Seiffert ER. New myzopodidae (Chiroptera) from the late paleogene of Egypt: emended family diagnosis and biogeo-graphic origins of noctilionoidea. PLoS ONE. 2014;9:e86712.
28. Hafner JC, Hafner MS. Heterochrony in rodents. In Heterochrony in Evolu-tion; Boston: Springer; 1988. pp. 217–235.
29. Hallgrímsson B, Lieberman DE. Mouse models and the evolutionary developmental biology of the skull. Integr Comp Biol. 2008;48:373–84.
30. Hans F, Dimitrov S. Histone H3 phosphorylation and cell division. Onco-gene. 2001;20(24):3021–7.
31. Hedrick BP, Mutumi GL, Munteanu VD, Sadier A, Davies KTJ, Rossiter SJ, Sears KE, Dávalos LM, Dumont E. Morphological diversification under High Integration in a Hyper Diverse Mammal Clade. J Mamm Evol. 2019;. https ://doi.org/10.1007/s1091 4-019-09472 -x.
32. Hockman D, Mason MK, Jacobs DS, Illing N. The role of early development in mammalian limb diversification: a descriptive comparison of early limb development between the natal long-fingered bat (Miniopterus natalen-sis) and the mouse (Mus musculus). Dev Dyn. 2009;238:965–79.
33. Hu D, Helms JA. The role of Sonic hedgehog in normal and abnormal craniofacial morphogenesis. Development. 1999;126:4873–84.
34. Hu D, Marcucio RS. Unique organization of the frontonasal ectodermal zone in birds and mammals. Dev Biol. 2009;325:200–10.
35. Iovine MK. Conserved mechanisms regulate outgrowth in zebrafish fins. Nat Chem Biol. 2007;3:613.
36. Kanungo T, Mount DM, Netanyahu NS, Piatko CD, Silverman R, Wu AY. An efficient k-means clustering algorithm: Analysis and implementation. IEEE Trans Pattern Anal Mach Intell. 2002;24(7):881–92.
37. Kaucka M, Ivashkin E, Gyllborg D, Zikmund T, Tesarova M, Kaiser J, Xie M, Petersen J, Pachnis V, Nicolis SK, Yu T, Sharpe P, Arenas E, Brismar H, Blom H, Clevers H, Suter U, Chagin AS, Fried K, Hellander A, Adameyko I. Analysis of neural crest–derived clones reveals novel aspects of facial development. Sci Adv. 2016;2(8):e1600060.
38. Kaucka M, Zikmund T, Tesarova M, Gyllborg D, Hellander A, Jaros J, Kaiser J, Petersen J, Szarowska B, Newton PT, Dyachuk V, Li L, Qian H, Johans-son AS, Mishina Y, Currie JD, Tanaka EM, Erickson A, Dudley A, Brismar H, Southam P, Coen E, Chen M, Weinstein LS, Hampl A, Arenas E, Chagin AS, Fried K, Adameyko I. Oriented clonal cell dynamics enables accurate growth and shaping of vertebrate cartilage. Elife. 2017;6:e25902.
39. Koyabu D, Endo H, Mitgutsch C, Suwa G, Catania KC, Zollikofer CPE, Oda SI, Koyasu K, Ando M, Sánchez-Villagra MR. Heterochrony and devel-opmental modularity of cranial osteogenesis in lipotyphlan mammals. Evodevo. 2011;2:21.

Page 17 of 17Camacho et al. EvoDevo (2020) 11:11
• fast, convenient online submission
•
thorough peer review by experienced researchers in your field
• rapid publication on acceptance
• support for research data, including large and complex data types
•
gold Open Access which fosters wider collaboration and increased citations
maximum visibility for your research: over 100M website views per year •
At BMC, research is always in progress.
Learn more biomedcentral.com/submissions
Ready to submit your research ? Choose BMC and benefit from:
40. Koyabu D, Werneburg I, Morimoto N, Zollikofer CPE, Forasiepi AM, Endo H, Kimura J, Ohdachi SD, TruongSon N, Sánchez-Villagra MR. Mammalian skull heterochrony reveals modular evolution and a link between cranial development and brain size. Nat Commun. 2014;5:1–9.
41. Kunz TH, Diaz CA. Folivory in fruit-eating bats, with new evidence from Artibeus jamaicensis (Chiroptera: Phyllostomidae). Biotropica. 1995;27:106.
42. Leigh SR, Shah NF, Buchanan LS. Ontogeny and phylogeny in papionin primates. J Hum Evol. 2003;45:285–316.
43. Li DW, Yang Q, Chen JT, Zhou H, Liu RM, Huang XT. Dynamic distribution of Ser-10 phosphorylated histone H3 in cytoplasm of MCF-7 and CHO cells during mitosis. Cell Res. 2005;15:120–6.
44. Lim BK. Review of the origins and biogeography of bats in South America. Chiropt Neotrop. 2009;15:391–410.
45. Luo ZX. Transformation and diversification in early mammal evolution. Nature. 2007;450:1011–9.
46. Ma W, Lozanoff S. Spatial and temporal distribution of cellular prolifera-tion in the cranial base of normal and midfacially retrusive mice. Clin Anat. 1999;12:315–25.
47. Martínez-Cerdeño V, Camacho J, Ariza J, Rogers H, Horton-Sparks K, Kreutz A, Behringer R, Rasweiler JJ IV, Noctor SC. The bat as a new model of cortical development. Cereb Cortex. 2018;28:3880–93.
48. Martínez-Cerdeño V, Cunningham CL, Camacho J, Antczak JL, Prakash AN, Cziep ME, Walker AI, Noctor SC. Comparative analysis of the subventricu-lar zone in rat, ferret and macaque: evidence for an outer subventricular zone in rodents. PLoS ONE. 2012;7:30178.
49. Massidon W.P., Maddison D.R. 2018. Mesquite: a modular system for evolutionary analysis. Version 3.51. http://www.mesqu itepr oject .org.
50. Matson JP, Cook JG. Cell cycle proliferation decisions: the impact of single cell analyses. FEBS J. 2017;284:362–75.
51. Mitteroecker P, Gunz P, Weber GW, Bookstein FL. Regional dissociated heterochrony in multivariate analysis. Ann Anat. 2004;86:463–70.
52. Morris ZS, Vliet KA, Abzhanov A, Pierce SE. Heterochronic shifts and con-served embryonic shape underlie crocodylian craniofacial disparity and convergence. Proc R Soc B. 2019;286:20182389.
53. Noctor SC, Flint AC, Weissman TA, Dammerman RS, Kriegstein AR. Neurons derived from radial glial cells establish radial units in neocortex. Nature. 2001;409:714–20.
54. Nogueira MR, Peracchi AL, Monteiro LR. Morphological correlates of bite force and diet in the skull and mandible of phyllostomid bats. Funct Ecol. 2009;23:715–23.
55. Nolte MJ, Hockman D, Cretekos CJ, Behringer RR, Rasweiler JJ IV. Embry-onic staging system for the black mastiff bat, Molossus rufus (Molossidae), correlated with structure-function relationships in the adult. Anat Rec. 2009;292:155–68.
56. Pereira AS, Da Rocha PA, Santana JP, Beltrão R, Ruiz-Esparza J, Ferrari SF. Consumption of leaves by Carollia perspicillata (Chiroptera, Phyllosto-midae): a new dimension of the species’ feeding ecology. Mammalia. 2018;82:303–7.
57. Porto A, de Oliveira FB, Shirai LT, de Conto V, Marroig G. The evolution of modularity in the mammalian skull I: morphological integration patterns and magnitudes. 2009;36:118–35.
58. Rasweiler JJ IV, Badwaik NK. 2020. Embryonic diapause in the short-tailed fruit bat, Carollia perspicillata: why this is postimplantational. Biosci Proc. (In press).
59. Rasweiler JJ IV, Cretekos CJ, Behringer RR. The short-tailed fruit bat Carollia perspicillata: a model for studies in reproduction and development. Cold Spring Harb Protoc. 2009;3:pdb-emo118.
60. Rasweiler JJ IV, Cretekos CJ, Behringer RR. Collection of embryos from short-tailed fruit bats (Carollia perspicillata). Cold Spring Harb Protoc. 2009;3:pdb–prot5162.
61. Rasweiler JJ IV, Cretekos CJ, Behringer RR. Fixation and storage of embryos from short-tailed fruit bat (Carollia perspicillata). Cold Spring Harb Protoc. 2009;3:pdb-rot5163.
62. Reid BS, Yang H, Melvin VS, Taketo MM, Williams T. Ectodermal WNT/β-catenin signaling shapes the mouse face. Dev Biol. 2011;349:261–9.
63. Revell LJ. phytools: an R package for phylogenetic comparative biology (and other things). Methods Ecol Evol. 2012;3:217–23.
64. Rojas D, Warsi OM, Davalos LM. Bats (Chiroptera: Noctilionoidea) challenge a recent origin of extant neotropical diversity. Syst Biol. 2016;65:432–48.
65. Schindelin J, Arganda-Carreras I, Frise E, Kaynig V, Longair M, Pietzsch T, Preibisch S, Rueden C, Saalfeld S, Schmid B, Tinevez JY, White DJ, Harten-stein V, Eliceiri K, Tomancak P, Cardona A. Fiji: an open-source platform for biological-image analysis. Nat Methods. 2012;9:676–82.
66. Sears K. Differences in growth generate the diverse palate shapes of new world leaf-nosed bats (Order Chiroptera, Family Phyllostomidae). Evol Biol. 2014;41:12–21.
67. Sears KE, Behringer RR, Rasweiler JJ IV, Niswander LA. Development of bat flight: morphologic and molecular evolution of bat wing digits. Proc Natl Acad Sci USA. 2006;103:6581–6.
68. Taurog A, Oliver C, Eskay RL, Porter JC, McKenzie JM. The role of TRH in the neoteny of the Mexican axolotl (Ambystoma mexicanum). Gen and Comp Endocrinol. 1974;24(3):267–79.
69. Tokita M, Kiyoshi T, Armstrong KN. Evolution of craniofacial novelty in parrots through developmental modularity and heterochrony. Evol Dev. 2007;9:590–601.
70. Tsagkogeorga G, Parker J, Stupka E, Cotton JA, Rossiter SJ. Phylogenomic analyses elucidate the evolutionary relationships of bats. Curr Biol. 2013;23:2262–7.
71. Usui K, Tokita M. Creating diversity in mammalian facial morphology: a review of potential developmental mechanisms. EvoDevo. 2018;9:15.
72. Ventura A, Nogueira MR, Peracchi AL, Nascimento AA, Vieira-Lopes DA, Pinheiro NL. Comparative prenatal development and embryonic staging of neotropical fruit bats (genus Artibeus). Zool Anz. 2018;274:131–46.
73. Wang Z, Han N, Racey PA, Ru B, He G. A comparative study of prenatal development in Miniopterus schreibersii fuliginosus, Hipposideros armiger and H. pratti. BMC Dev Biol. 2010;10:10.
74. Wealthall RJ, Herring SW. Endochondral ossification of the mouse nasal septum. Anat Rec Part A Discov Mol Cell Evol Biol. 2006;288:1163–72.
75. Wu P, Jiang TX, Shen JY, Widelitz RB, Chuong CM. Morphoregulation of avian beaks: comparative mapping of growth zone activities and mor-phological evolution. Dev Dyn. 2006;235:1400–12.
76. Yamaguchi TP, Bradley A, McMahon AP, Jones S. A Wnt5a pathway underlies outgrowth of multiple structures in the vertebrate embryo. Development. 1999;126:1211–23.
77. Yan K, Verbeek FJ. Segmentation for high-throughput image analysis: watershed masked clustering. Lect Notes Comput Sci. 2012;7610:25–41.
78. York HA, Billings SA. Stable-isotope analysis of diets of short-tailed fruit bats (Chiroptera: Phyllostomidae: Carollia). J Mammal. 2009;90:1469–77.
79. Young B, Minugh-Purvis N, Shimo T, St-Jacques B, Iwamoto M, Enomoto-Iwamoto M, Koyama E, Pacifici M. Indian and sonic hedgehogs regulate synchondrosis growth plate and cranial base development and function. Dev Biol. 2006;299:272–82.
Publisher’s NoteSpringer Nature remains neutral with regard to jurisdictional claims in pub-lished maps and institutional affiliations.
Copyright © 2022 FDOKUMEN