THE KINETICS OF CELLULAR PROLIFERATION IN ... - NCBI
15
THE KINETICS OF CELLULAR PROLIFERATION IN REGENERATING LIVER JACOB I. FABRIKANT From the Department of Biophysics, The Institute of Cancer Research, Surrey Branch, Sutton, Surrey, England. Dr. Fabrikant's present address is the Department of Radiological Science, The Johns Hopkins University, Baltimore, Maryland 21205 ABSTRACT The study concerns the kinetics of cellular proliferation in the different cell populations of the normal and regenerating rat liver. A detailed analysis is presented, which includes techniques of in vivo labeling of DNA with tritiated thymidine and high-resolution radio- autography, of the temporal and spatial patterns of DNA synthesis and cell division in the parenchymal cells, littoral cells, bile duct epithelium, and other cellular components in the liver during the first 64 hr of regeneration after partial hepatectomy. The analysis of cell population kinetics indicates that (a) the rate of entry of parenchymal cells into synthesis, after an initial burst of proliferative activity, was an orderly progression at 3-4%/hr; (b) most cells divided once and a few twice, a large proportion of the cell deficit being replaced by 72 hr after the onset of proliferation; (c) T, was -8.0 hr; Tg2+m,/2, 3.0 hr; and M, - 1.0 hr. Littoral cell proliferation began about 24 hr after the onset of parenchymal cell prolifera- tion; the rate of entry of littoral cells into synthesis was greater than 4%/hr. Interlobular bile duct cell proliferation lagged well behind the parenchymal and littoral cell populations both in time and extent of proliferation. INTRODUCTION The mammalian liver is a conditional cell re- newal system which ordinarily undergoes little proliferation, but may do so in response to a de- mand situation to compensate for a loss of cells, for example, after partial hepatectomy. While a considerable amount is known about the bio- chemical events in the regenerating liver (3, 13, 30, 31), the complex cellular kinetics of the con- trolled compensatory growth are not, as yet, elucidated. In particular, the rapid changes in the patterns of DNA synthesis and cell division in the different cell populations which are constantly altering the relevant kinetic parameters, such as proliferation rates, transit rates, and compartment sizes, have not been fully investigated. The present research is a radioautographic study of DNA synthesis and the cell cycle in the regenerating rat liver and is concerned with the analysis of cell population kinetics' (15, 24) during the period of 'The following abbreviations are used in analysis of cell population kinetics (24): C, cells in cell cycle; M, cells in mitosis (M period); S, cells in DNA synthesis (S period); G, cells in presynthetic period; G2, cells in postsynthetic period; Go, potentially prolifera- tive cells; Tr, transitional and mature cells; N, num- ber of cells in the population; Nt, number of cells in the population at time t; Nm, number of cells in the population in mitosis; N, number of cells in the popu- lation in DNA synthesis; T,, duration of cell cycle; Tn, duration of M period; T., duration of S period; T,, duration of G1 period; T, duration of G2 period; Tg+m,/2, duration of (G2 + M/2) complex period; MI, itotic index (Nm/N), LI, labeling index (N,/N). 551
-
Upload
khangminh22 -
Category
Documents
-
view
2 -
download
0
Transcript of THE KINETICS OF CELLULAR PROLIFERATION IN ... - NCBI
THE KINETICS OF CELLULAR
PROLIFERATION IN REGENERATING LIVER
JACOB I. FABRIKANT
From the Department of Biophysics, The Institute of Cancer Research, Surrey Branch, Sutton,Surrey, England. Dr. Fabrikant's present address is the Department of Radiological Science, TheJohns Hopkins University, Baltimore, Maryland 21205
ABSTRACT
The study concerns the kinetics of cellular proliferation in the different cell populations ofthe normal and regenerating rat liver. A detailed analysis is presented, which includestechniques of in vivo labeling of DNA with tritiated thymidine and high-resolution radio-autography, of the temporal and spatial patterns of DNA synthesis and cell division in theparenchymal cells, littoral cells, bile duct epithelium, and other cellular components in theliver during the first 64 hr of regeneration after partial hepatectomy. The analysis of cellpopulation kinetics indicates that (a) the rate of entry of parenchymal cells into synthesis,after an initial burst of proliferative activity, was an orderly progression at 3-4%/hr; (b)most cells divided once and a few twice, a large proportion of the cell deficit being replacedby 72 hr after the onset of proliferation; (c) T, was -8.0 hr; Tg2+m,/2, 3.0 hr; and M, - 1.0hr. Littoral cell proliferation began about 24 hr after the onset of parenchymal cell prolifera-tion; the rate of entry of littoral cells into synthesis was greater than 4%/hr. Interlobularbile duct cell proliferation lagged well behind the parenchymal and littoral cell populationsboth in time and extent of proliferation.
INTRODUCTION
The mammalian liver is a conditional cell re-newal system which ordinarily undergoes littleproliferation, but may do so in response to a de-mand situation to compensate for a loss of cells,for example, after partial hepatectomy. While aconsiderable amount is known about the bio-chemical events in the regenerating liver (3, 13,30, 31), the complex cellular kinetics of the con-trolled compensatory growth are not, as yet,elucidated. In particular, the rapid changes in thepatterns of DNA synthesis and cell division in thedifferent cell populations which are constantlyaltering the relevant kinetic parameters, such asproliferation rates, transit rates, and compartmentsizes, have not been fully investigated. The presentresearch is a radioautographic study of DNAsynthesis and the cell cycle in the regenerating rat
liver and is concerned with the analysis of cell
population kinetics' (15, 24) during the period of
'The following abbreviations are used in analysis ofcell population kinetics (24): C, cells in cell cycle; M,cells in mitosis (M period); S, cells in DNA synthesis(S period); G, cells in presynthetic period; G2,cells in postsynthetic period; Go, potentially prolifera-tive cells; Tr, transitional and mature cells; N, num-ber of cells in the population; Nt, number of cells inthe population at time t; Nm, number of cells in thepopulation in mitosis; N, number of cells in the popu-lation in DNA synthesis; T,, duration of cell cycle;Tn, duration of M period; T., duration of S period;T,, duration of G1 period; T, duration of G2period; Tg+m,/2, duration of (G2 + M/2) complexperiod; MI, itotic index (Nm/N), LI, labeling index(N,/N).
551
rapid cell proliferation following two-thirds
partial hepatectomy. By using techniques of invivo labeling with tritiated thymidine (TdR-3H),
a specific DNA precursor, combined with high-
resolution radioautography, we made a detailed
investigation of the kinetics of cellular prolifera-
tion of the parenchymal cells, littoral cells, bile
duct epithelium, and other cell populations of the
resting liver and during the first 64 hr after partial
hepatectomy of the regenerating liver in order to
(a) examine their temporal and spatial patterns
of proliferation and (b) evaluate the dynamic
contributions of the cell populations taking part in
the regenerative process leading to restoration of
the hepatic tissue deficit.
2.0-
1.5-
1.0
.5 -0
1200
tive and used for all quantitative histological studiesunless stated otherwise. Liver tissue (1-2 g) was fixedfor 24 hr (20 parts 70%0 ethanol, two parts 10%formalin, CaCO3 in excess, and one part glacialacetic acid). Histological sections (4 5 A thick) wereobtained from wax-embedded tissue and stained withhematoxylin and eosin after radioautography.
Radioautography
The liquid emulsion-dipping method for high-resolution radioautography was used. Tissue sectionsprepared on chemically clean gelatin-alum-coatedmicroscopic slides were dipped in Ilford K-5 Nuclear(Ilford, Ltd., Ilford, Essex, Eng.) emulsion (50%emulsion, 50%o distilled water at 50 0 C), dried, andstored with desiccant in light-tight boxes at 40 C. The
NORMAL LIVER
11 11 /^-^_ ' ' 0 LITTORAL CELLS
'0--0--__----__--__o PARENCHYMAL CELLS
. .-....-... e-, . a-' --,- ®_...-A.. -.. 3 BILE DUCT CELLS1800 2400 0600
NOON MIDNIGHT1200 1200 1200 TIMENOON NOON NOON
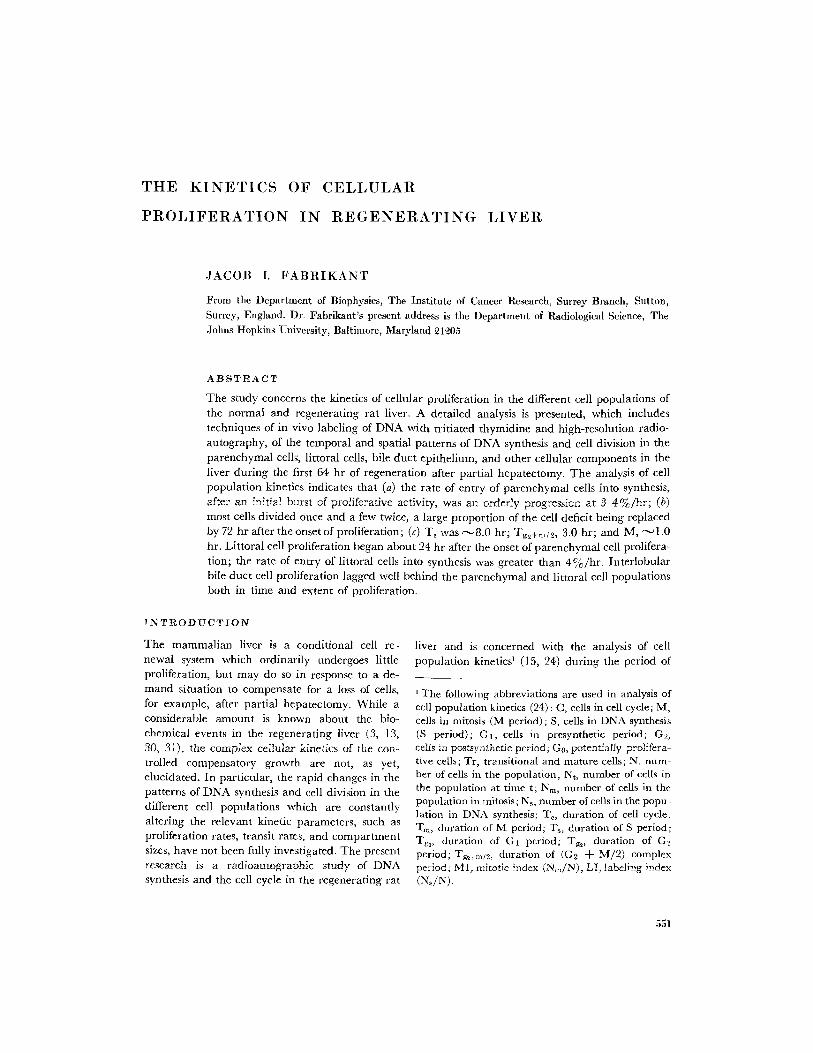
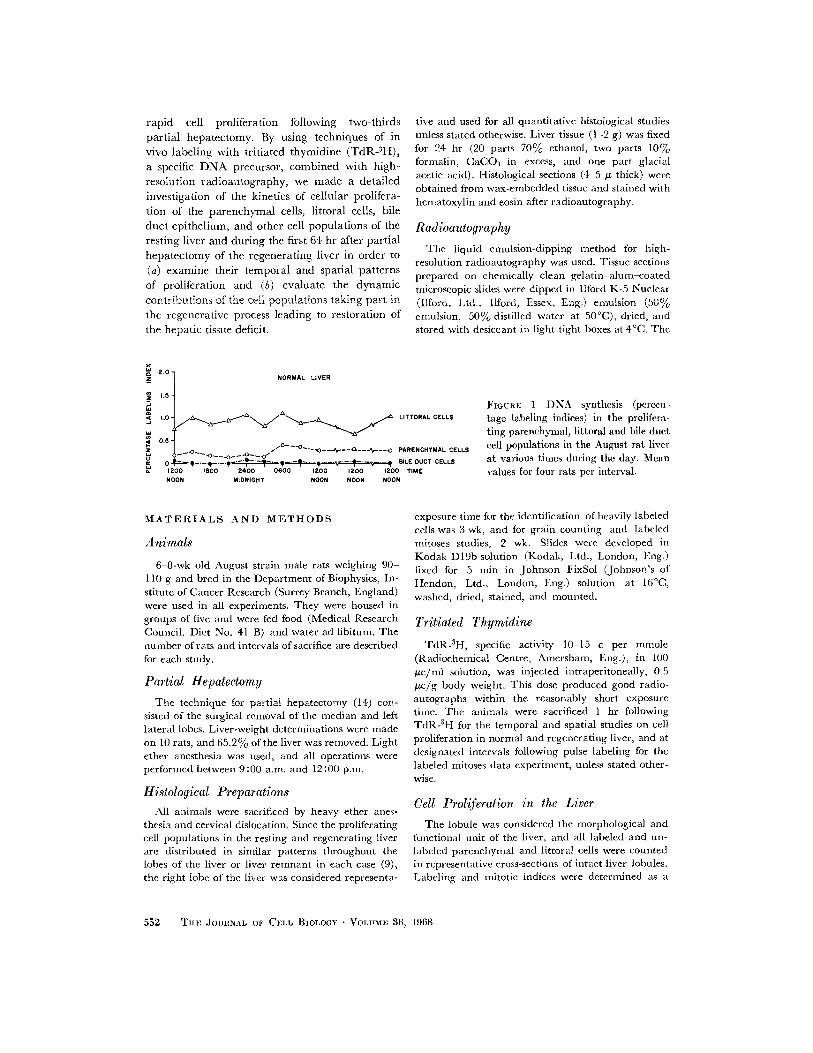
FIGUeE 1 DNA synthesis (percen-tage labeling indices) in the prolifera-ting parenchymal, littoral and bile ductcell populations in the August rat liverat various times during the day. Meanvalues for four rats per interval.
MATERIALS AND METHODS
Animals
6-8-wk old August strain male rats weighing 90-1 10 g and bred in the Department of Biophysics, In-stitute of Cancer Research (Surrey Branch, England)were used in all experiments. They were housed ingroups of five and were fed food (Medical ResearchCouncil. Diet No. 41 B) and water ad libitum. Thenumber of rats and intervals of sacrifice are describedfor each study.
Partial Hepatectomy
The technique for partial hepatectomy (14) con-sisted of the surgical removal of the median and leftlateral lobes. Liver-weight determinations were madeon 10 rats, and 65.2% of the liver was removed. Lightether anesthesia was used, and all operations wereperformed between 9:00 a.m. and 12:00 p.m.
Histological Preparations
All animals were sacrificed by heavy ether anes-thesia and cervical dislocation. Since the proliferatingcell populations in the resting and regenerating liverare distributed in similar patterns throughout thelobes of the liver or liver remnant in each case (9),the right lobe of the liver was considered representa-
exposure time for the identification of heavily labeledcells was 3 wk, and for grain counting and labeledmitoses studies, 2 wk. Slides were developed inKodak D19b solution (Kodak, Ltd., London, Eng.)fixed for 5 min in Johnson FixSol (Johnson's ofHendon, Ltd., London, Eng.) solution at 16°C,washed, dried, stained, and mounted.
Tritiated Thymidine
TdR-3 H, specific activity 10-15 c per mmole(Radiochemical Centre, Amersham, Eng.), in 100kpc/ml solution, was injected intraperitoneally, 0.5,uc/g body weight. This dose produced good radio-autographs within the reasonably short exposuretime. The animals were sacrificed 1 hr followingTdR-3H for the temporal and spatial studies on cellproliferation in normal and regenerating liver, and atdesignated intervals following pulse labeling for thelabeled mitoses data experiment, unless stated other-wise.
Cell Proliferation in the Liver
The lobule was considered the morphological andfunctional unit of the liver, and all labeled and un-labeled parenchymal and littoral cells were countedin representative cross-sections of intact liver lobules.Labeling and mitotic indices were determined as a
552 THE JOUTNeAL OF CELL BIOI,OGY . VOLITME 36, 1968
IFzIII
II
oJ
percentage of all nuclei of cells of that population inthe lobule. Counts of 5000-7500 parenchymal andlittoral cell nuclei and of all interlobular bile ductcells, mesothelial lining cells, vascular endothelium,and other connective tissue cells in a section wererecorded. Radioautographs were selected for lowbackground, and in slides with background counts ofless than 1-2 grains per nucleus, parenchymal cellnuclei with more than 10 grains, and nonparenchymalcell nuclei which were smaller, with more than 5grains were scored as labeled. These values werechosen arbitrarily, but the lower limits did not seri-ously affect interpretation, since most cells scoredwere heavily labeled.
Studies on Resting Liver
The distribution of the different cell populations inthe normal liver was examined in 44 rats, four ratsper group, at 3-hr intervals for 24 hr, and at noon on 2consecutive days. Percentage labeling indices, mitotic
during DNA synthesis, and following them throughthe cell cycle. The cell cycle consists of at least fourphases: M, G1, S, and G2. In the regenerating liver,the system may contain a Go population of potentiallyproliferative cells. 30 rats were partially hepatec-toinized, injected with TdR-3 H 20 hr later, and sacri-ficed in pairs at frequent intervals from 1 to 44 hrthereafter. A minimum of 100 mitoses were countedfor each interval, and the percentage of mitoseslabeled (5 grains or more) with time was scored. Tg2,Tm, and T, were measured according to the methodof Quastler and Sherman (25). These data are re-ported in detail separately (10).
RESULTS
Resting Liver
The distribution of labeled nuclei of the differentcell populations of the liver is presented in TableI. Fig. 1 shows the temporal pattern of labeling of
TABLE I
Distribution of Labeled Nuclei in the Rat Liver
Percentage of Percentage of nuclei Percentage of all Mean grainCell type all cells labeled (range) labeled nuclei count (SE)
Parenchymal 60.2 0.3 (0.2-0.4) 34.1 44.6 - 14.5Littoral 35.8 0.9 (0.7-1.2) 60.7 35.3 - 7.8Bile ductal 1.1 0.02(0.0-0.1) 0.2 33.2 6.9Miscellaneous 2.9 0.8 (0.5-1.0) 5.0
indices, and mean grain counts of parenchymal, lit-toral and bile duct cells, and a miscellaneous groupof nonparenchymal cells, were determined.
Studies on Regenerating Liver
The temporal and spatial changes in the patternsof DNA synthesis and mitosis in the parenchymal andlittoral cell populations after partial hepatectomywere examined in 92 rats at very frequent intervalsduring the initial 64 hr of regeneration, i.e., theperiod of greatest proliferative activity. Animals werepartially hepatectomized, and sacrificed in groups offour 1 hr after TdR-3H labeling at 2-hr intervalsfrom 8-40 hr, and then at 4-hr intervals to 64 hr,thereafter. Percentage labeling and mitotic indices inthe parenchymal, littoral, and bile duct cell popula-tions were determined.
Studies on the Phases of Proliferating
Parenchymal Cells During Regeneration
The percentage labeled mitoses technique involvespulse labeling a population of proliferating cells
parenchymal cells, littoral cells, and bile ductepithelium. All labeled parenchymal and littoralcells were distributed randomly throughout theliver and within the individual lobes and lobules.No appreciable diurnal variation was noted in thelabeling patterns of the different cell populations.The mean percentage labeling indices agreed withresults of previously reported studies (6, 7, 12,20, 26). Parenchymal cell percentage labelingindices and mean grain counts were approxi-mately the same during a 24 hr period. Littoralcells were most frequently labeled and synthesizedmore than half of the DNA in the liver; graincounts varied greatly and were less than overhepatocytes. Bile duct cells were rarely labeled,and often no labeled cells were seen in numeroussections from the same liver.
Regenerating Liver
TEMPORAL PATTERN OF PARENCHYMAL
CELL PROLIFERATION: The temporal pattern
JACOB . FABRIKANT Regenerating Liver 553

®
PARENCHYMAL CELLS
o~~~~~~~~~
. U
I * 2~~~~~
o0 4 l I. . 1 . 20 2 24 26 8 s ;o 320 2 34 36 e 40 48 4 4244 46 48 50 52 54 56 58 60 62 64
HOURS AFTER PARTIAL HEPATECTOMY
FIGTnE 2 a, temporal pattern of incorporation of TdR- 8H into proliferating parenchymal cells i therat liver during the 64 hr following partial hepatectomy. Mean values for four rats per interval. b, timetemporal pattern of parenchymal cell mitoses during the 64 hr following partial hepatectomy. Mean valuesfor four rats per interval.
of labeling of parenchymal cells during the 64 hrfollowing partial hepatectomy is illustrated inFig. 2 a. There was little or no DNA synthesisuntil 12 hr at which time the first labeled cellswere seen; this was followed by a rapid rise in thepercentage labeling index to a peak of 44% at 25hr, and then by a gradual decline to 64 hr. Thebinucleate cells had higher labeling indices andtherefore accounted for a greater proportion of theproliferative activity than their number wouldsuggest. Labeling indices remained elevated for anumber of days thereafter, and returned to normalafter 2-3 wk when regeneration was complete.
Cells in mitosis first appeared at 21 hr; themitotic index rose rapidly to 5 at 33 hr; this wasfollowed by a gradual decline to approximately1 % at 44 hr (Fig. 2 b). A second and smaller waveoccurred between 52 and 60 hr. The initial waveof mitosis followed that of labeling by some 8 hr,and allowing for this interval, there were 5-10times as many cells labeled as in division. Themitotic index remained elevated for a number ofdays thereafter, and occasionally cells in divisionwere observed 1 and 2 wk later.
SPATIAL DISTRIBUTION OF PROLIFERAT-
ING PARENCHYMAL CELLS: The distance be-
tween the portal triad and the central vein in the
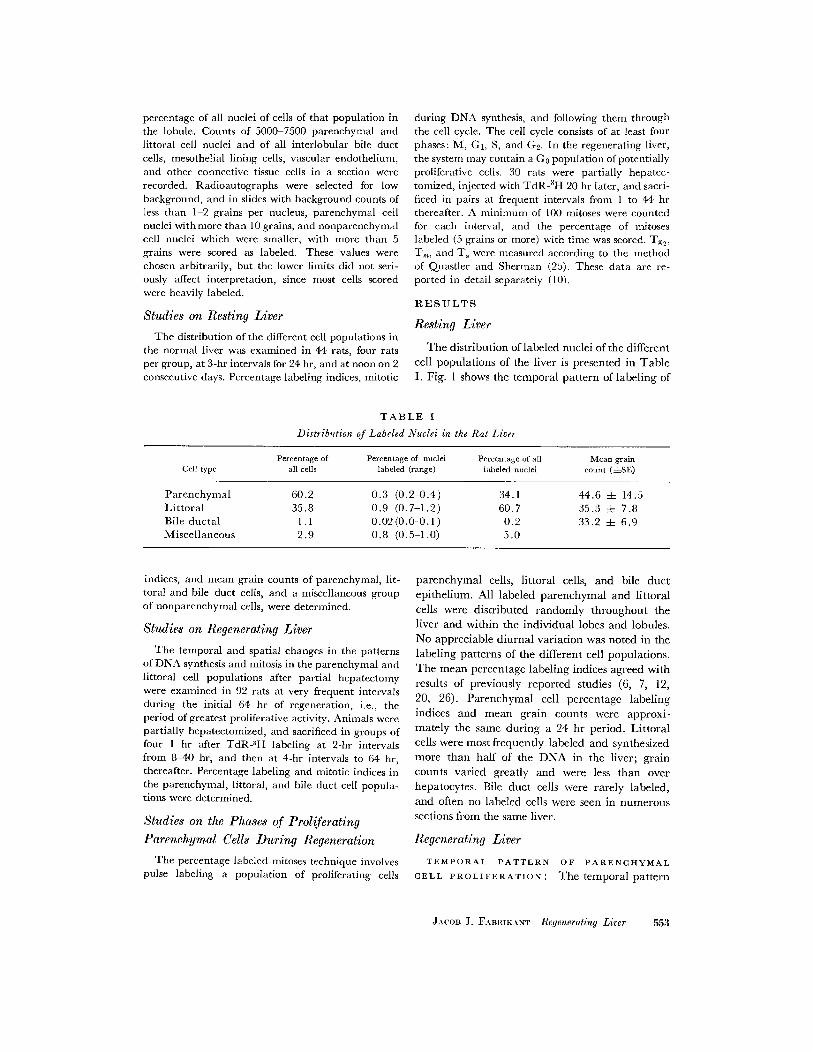
liver lobule was subdivided into thirds; an outer,middle, and inner zone (Fig. 3) were thereby de-fined. During the first 64 hr after partial hepatec-
tomy, all lobules in the remnant were similarlylabeled. That mean grain counts were of the sameorder indicates that the TdR- 2H was available
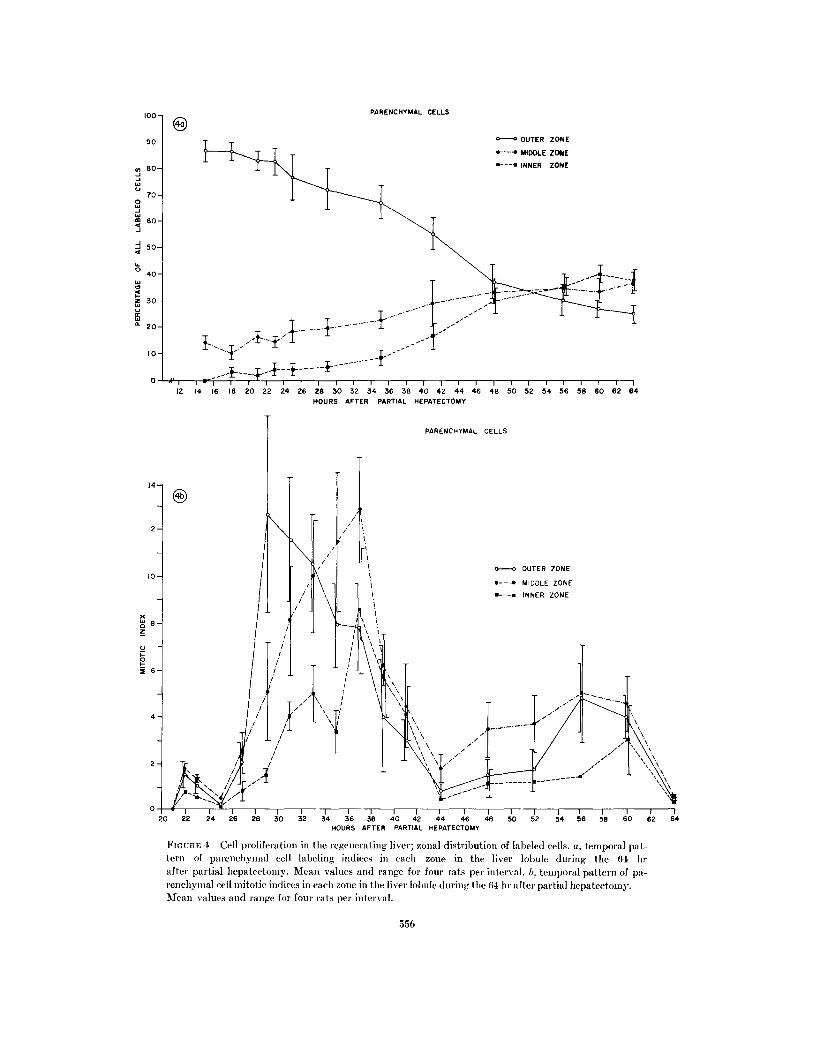
equally to all cells in synthesis. The earliest evi-dence of labeling of parenchymal cells occurredin the periportal area; at the peak of syntheticactivity, the labeled nuclei were concentrated inthe outer zone and, with time, labeling of cellsappeared to extend toward the middle and innerzones, and eventually became randomly distrib-uted throughout the lobule. Counts of the percent-age of parenchymal cells labeled in each zone withtime after partial hepatectomy indicated thatduring the 64 hr the proliferative activity ap-peared earliest and was greatest in the outer zoneand was least and appeared much later in theinner zone (Fig. 4 a). During the peak of DNAsynthesis approximately 75% of labeled cells were
554 THE JOURNAL OF CELL BIOLOGY VOLUME 36, 1968
X0
_j
I
20(3
2WU
W
6.0-
5.0-1 -
4.0-
U 3.0-I'- -0- 2.0-
. -1.0 -
Y_ __ ·r · · . . . . . . . . . . . . . . . I . . . . . . . . . . . . . . . . . . . . . . ..· · · _ _ · · · · _n
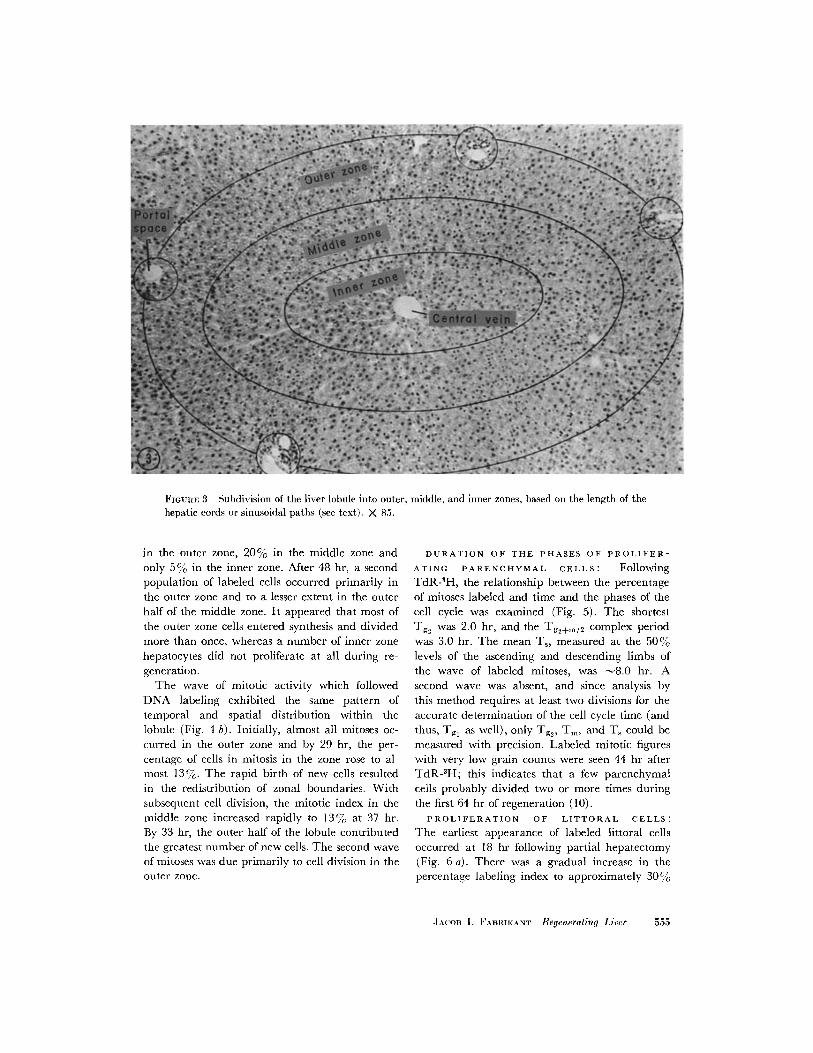
FIGURE 3 Subdivision of the liver lobule into outer, middle, and inner zones, based on the length of thehepatic cords or sinusoidal paths (see text). X 85.
in the outer zone, 20% in the middle zone andonly 5% in the inner zone. After 48 hr, a secondpopulation of labeled cells occurred primarily inthe outer zone and to a lesser extent in the outerhalf of the middle zone. It appeared that most ofthe outer zone cells entered synthesis and dividedmore than once, whereas a number of inner zonehepatocytes did not proliferate at all during re-generation.
The wave of mitotic activity which followedDNA labeling exhibited the same pattern oftemporal and spatial distribution within thelobule (Fig. 4 b). Initially, almost all mitoses oc-curred in the outer zone and by 29 hr, the per-centage of cells in mitosis in the zone rose to al-most 13%. The rapid birth of new cells resultedin the redistribution of zonal boundaries. Withsubsequent cell division, the mitotic index in themiddle zone increased rapidly to 13% at 37 hr.By 33 hr, the outer half of the lobule contributedthe greatest number of new cells. The second waveof mitoses was due primarily to cell division in theouter zone.
DURATION OF THE PHASES OF PROLIFER-
ATING PARENCHYMAL CELLS: FollowingTdR-3 H, the relationship between the percentageof mitoses labeled and time and the phases of thecell cycle was examined (Fig. 5). The shortest
Tg2 was 2.0 hr, and the Tg2 +m/2 complex periodwas 3.0 hr. The mean Ts, measured at the 50%levels of the ascending and descending limbs ofthe wave of labeled mitoses, was -8.0 hr. Asecond wave was absent, and since analysis bythis method requires at least two divisions for the
accurate determination of the cell cycle time (andthus, Tg, as well), only Tg2, Tm, and T, could bemeasured with precision. Labeled mitotic figureswith very low grain counts were seen 44 hr afterTdR-3H; this indicates that a few parenchymalcells probably divided two or more times during
the first 64 hr of regeneration (10).PROLIFERATION OF LITTORAL CELLS:
The earliest appearance of labeled littoral cells
occurred at 18 hr following partial hepatectomy(Fig. 6 a). There was a gradual increase in thepercentage labeling index to approximately 30%
JAC(OB I. FABIKANT Regenerating Liver
PARENCHYMAL CELLS
®
12 14 16 18 20 22 24 26 28 30 32 34 36 38 40 42 4 48 48 50 52 54 56 58 60 62 64HOURS AFTER PARTIAL HEPATECTOMY
HOURS AFTER PARTIAL HEPATECTOMY
FIGUrRE 4 Cell proliferation in the regenerating liver; zonal distribution of labeled cells. a, temporal pat-tern of parenchymlal cell labeling indices in each zone in the liver lobule during the 64 hrafter partial hepatectomy. Mean values and range for four rats per interval. bi, temporal pattern of pa-
renchymlal cell mitotic indices in each zone in the liver lobule during the 64 hr after partial hepatectomy.Mean values and range for four rats per interval.
556
90-
w 80-
70-
W 60-
40-
0-
01-2 30-
20-
10-
2wz
-01-
I tnql 100-
l
O- ·· --
4
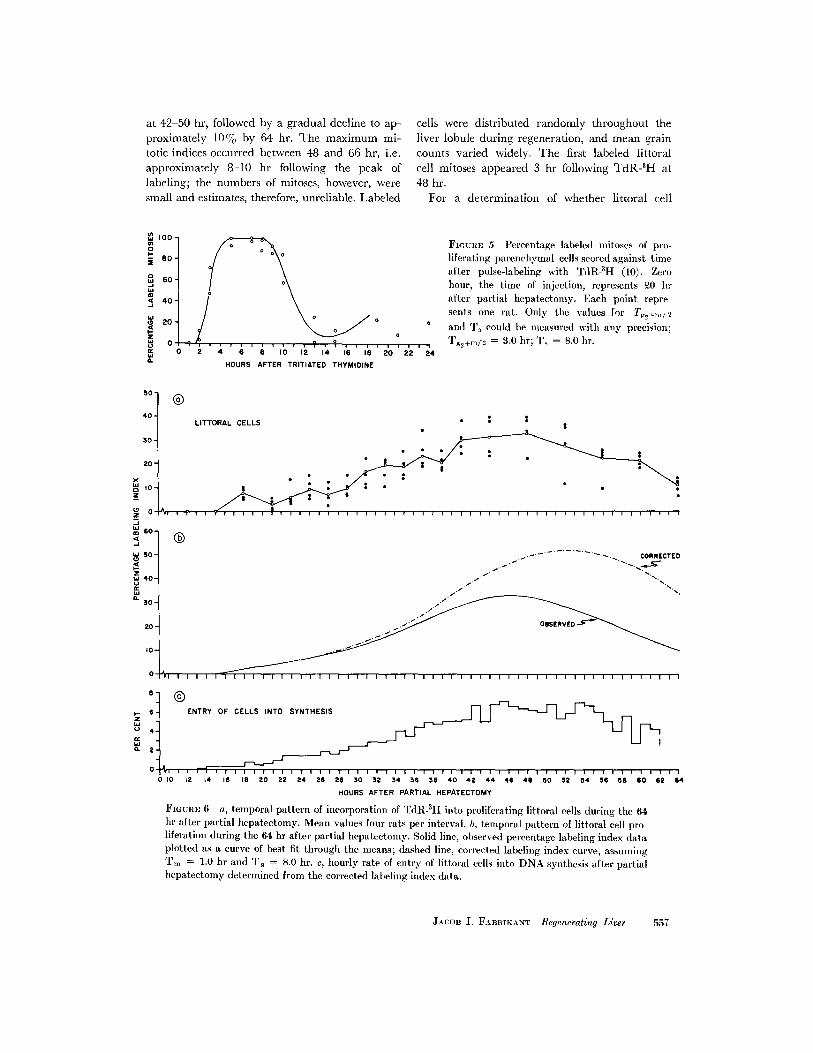
at 42-50 hr, followed by a gradual decline to ap-proximately 10%o by 64 hr. The maximum mi-totic indices occurred between 48 and 66 hr, i.e.approximately 8-10 hr following the peak oflabeling; the numbers of mitoses, however, weresmall and estimates, therefore, unreliable. Labeled
100
o
E
0 60
O 40
o 20
(0
40-
0 2 4 6 B 10 12 14 16 18 20 22
HOURS AFTER TRITIATED THYMIDINE
cells were distributed randomly throughout theliver lobule during regeneration, and mean graincounts varied widely. The first labeled littoralcell mitoses appeared 3 hr following TdR-3 H at48 hr.
For a determination of whether littoral cell
FIGUaF, 5 Percentage labeled mitoses of pro-liferating parenchymal cells scored against timeafter pulse-labeling with TdR-3H (10). Zerohour, the time of injection, represents 20 hrafter partial hepatectomy. Each point repre-sents one rat. Only the values for T2+,,,,/ 2and T, could be measured with any precision;Tg2+m/I = 3.0 hr; T, = 8.0 hr.
24
LITTORAL CELLS
I~~~~~~~:: =
I e' ! . . . . . . . .
60-
50- -~--' CORRECTED
40- .' ' ,
30-
20- .- 0OBSERVED
10
6 ENTRY OF CELLS INTO SYNTHESIS
010 12 14 15 18 20 22 24 26 2 30 32 34 36 36 40 42 44 46 48 50 52 54 56 58 60 62 64
HOURS AFTER PARTIAL HEPATECTOMY
FIGURE 6 a, temporal pattern of incorporation of TdR-SH into proliferating littoral cells during the 64hr after partial hepatectomy. Mean values four rats per interval. b, temporal pattern of littoral cell pro-liferation during the 64 hr after partial hepatectomy. Solid line, observed percentage labeling index dataplotted as a curve of best fit through the means; dashed line, corrected labeling index curve, assumingT,,, = 1.0 hr and T = 8.0 hr. c, hourly rate of entry of littoral cells into DNA synthesis after partialhepatectomy determined from the corrected labeling index data.
JACOB I. FABRIKANT Regenerating Liver 5157
30-
20-
o0-
0 -
x
z
z1(
W
0
-q2
W0.2
'A
(0
F
2
0.
-· . . . . . . .. . . . . . . . . . .___oi ·. . . . . . . . . . . . . . . . .
soin _w C3
IOU'
®. ..
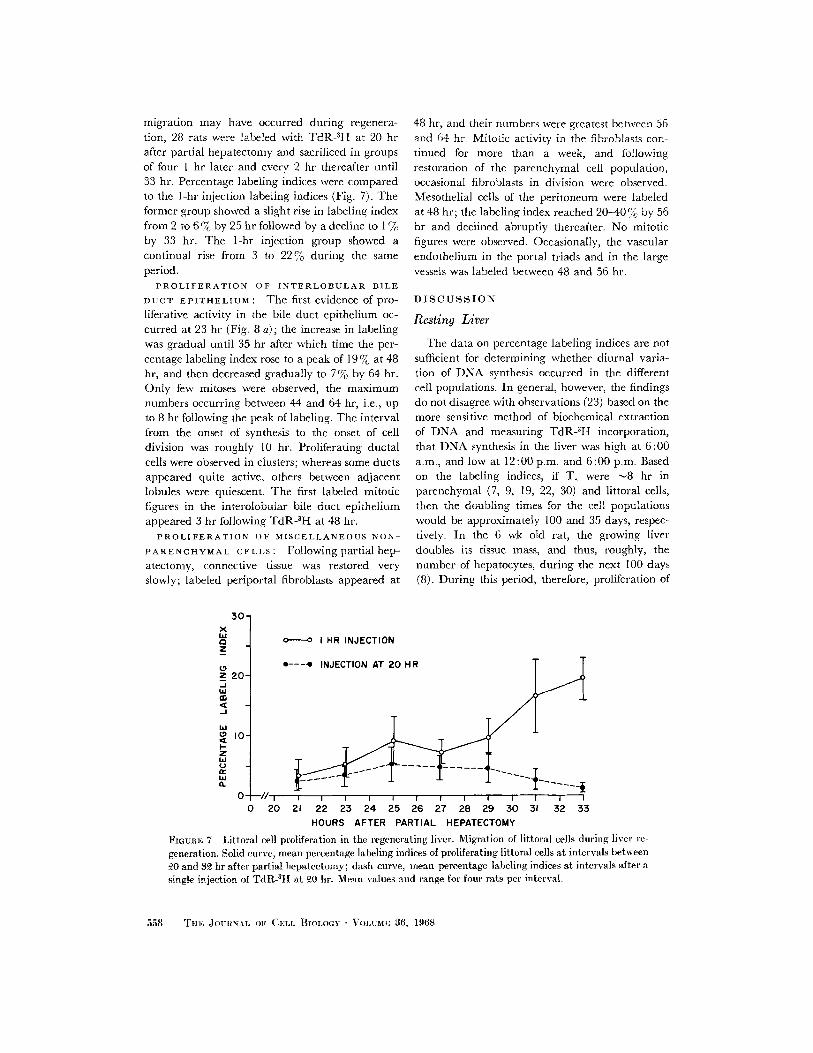
migration may have occurred during regenera-tion, 28 rats were labeled with TdR-3H at 20 hrafter partial hepatectomy and sacrificed in groupsof four I hr later and every 2 hr thereafter until33 hr. Percentage labeling indices were comparedto the 1-hr injection labeling indices (Fig. 7). Theformer group showed a slight rise in labeling indexfrom 2 to 6%7c by 25 hr followed by a decline to I %by 33 hr. The 1-hr injection group showed acontinual rise from 3 to 22 % during the sameperiod.
PROLIFERATION OF INTERLOBULAR BILE
DUCT EPITHELIUM: The first evidence of pro-
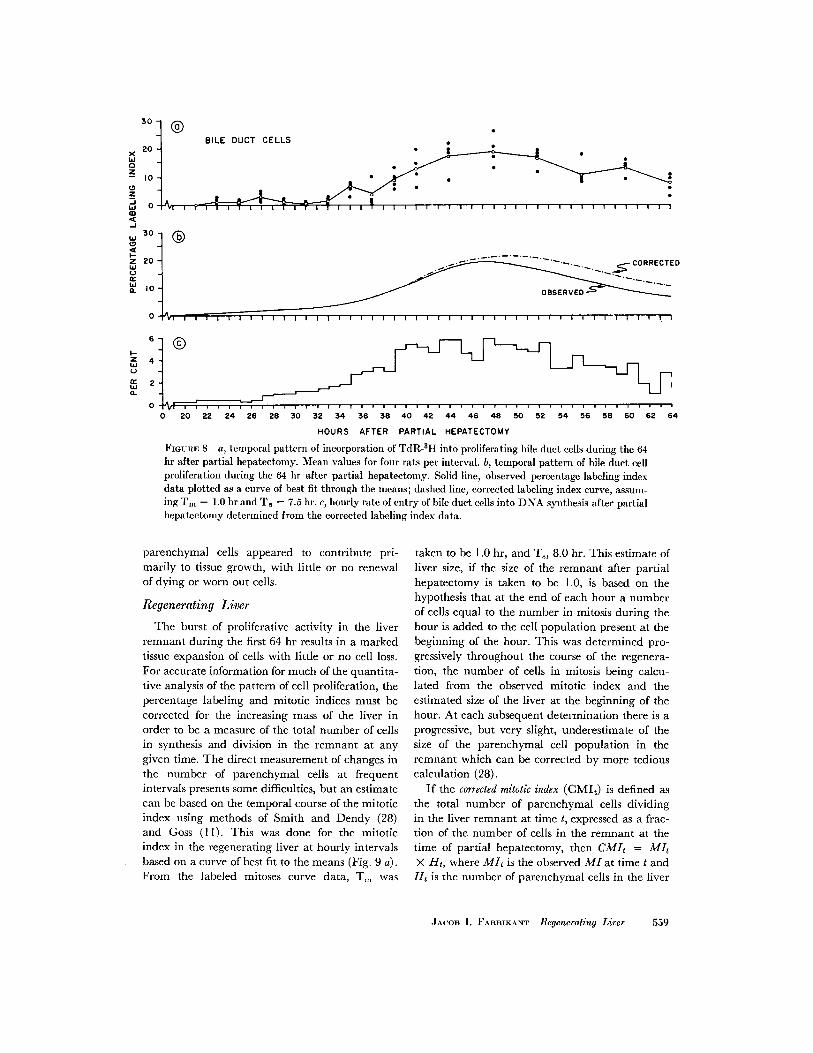
liferative activity in the bile duct epithelium oc-curred at 23 hr (Fig. 8 a); the increase in labelingwas gradual until 35 hr after which time the per-centage labeling index rose to a peak of 19% at 48hr, and then decreased gradually to 7% by 64 hr.Only few mitoses were observed, the maximumnumbers occurring between 44 and 64 hr, i.e., upto 8 hr following the peak of labeling. The intervalfrom the onset of synthesis to the onset of celldivision was roughly 10 hr. Proliferating ductalcells were observed in clusters; whereas some ductsappeared quite active, others between adjacentlobules were quiescent. The first labeled mitoticfigures in the interolobular bile duct epitheliumappeared 3 hr following TdR-3 H at 48 hr.
PROLIFERATION OF MISCELLANEOUS NON-
PARENCHYMAL CELLS: Following partial hep-atectomy, connective tissue was restored veryslowly; labeled periportal fibroblasts appeared at
30-x
az
z 20-
-1
W
.I
t-ZL.a .Li
n.la-
48 hr, and their numbers were greatest between 56and 64 hr. Mitotic activity in the fibroblasts con-tinued for more than a week, and followingrestoration of the parenchymal cell population,occasional fibroblasts in division were observed.Mesothelial cells of the peritoneum were labeledat 48 hr; the labeling index reached 20-40% by 56hr and declined abruptly thereafter. No mitoticfigures were observed. Occasionally, the vascularendothelium in the portal triads and in the largevessels was labeled between 48 and 56 hr.
DISCUSSION
Resting Liver
The data on percentage labeling indices are notsufficient for determining whether diurnal varia-tion of DNA synthesis occurred in the differentcell populations. In general, however, the findingsdo not disagree with observations (23) based on themore sensitive method of biochemical extractionof DNA and measuring TdR-3H incorporation,that DNA synthesis in the liver was high at 6:00a.m., and low at 12:00 p.m. and 6:00 p.m. Basedon the labeling indices, if T, were 8 hr inparenchymal (7, 9, 19, 22, 30) and littoral cells,then the doubling times for the cell populationswould be approximately 100 and 35 days, respec-tively. In the 6 wk old rat, the growing liverdoubles its tissue mass, and thus, roughly, thenumber of hepatocytes, during the next 100 days(8). During this period, therefore, proliferation of
---o I HR INJECTION
o 20 21 22 23 24 25 26 27 28 29 30 31 32 33
HOURS AFTER PARTIAL HEPATECTOMY
FIGURE 7 Littoral cell proliferation in the regenerating liver. Migration of littoral cells during liver regeneration. Solid curve, mean percentage labeling indices of proliferating littoral cells at intervals between20 and 32 hr after partial hepatectomy; dash curve, mean percentage labeling indices at intervals after asingle injection of TdR-3 H at 20 hr. Mean values and range for four rats per interval.
558 TuI; JoulNAL OF CELL, BIOLOGY · VOLUME 36, 19t68
.-
ly -V_ -fl r-- I -- 1 I I I I I I I I I
BILE DUCT CELLS
_JL . ~. a
0CORRECTED
A. . . . . . .. . . . IOBSERVED
_ A
6-
4]
0 20 22 24 26 28 30 32 34 36 38 40 42 44 46 48 50 52 54 56 58 60 62 64
HOURS AFTER PARTIAL HEPATECTOMY
FIunRE 8 a, temporal pattern of incorporation of TdR-3I into proliferating bile duct cells during the 64hr after partial hepatectomy. Mean values for four rats per interval. b, temporal pattern of bile duct cellproliferation during the 64 hr after partial hepatectomy. Solid line, observed percentage labeling indexdata plotted as a curve of best fit through the means; dashed line, corrected labeling index curve, assum-ing Tm = 1.0 hr and T = 7.5 hr. c, hourly rate of entry of bile duct cells into DNA synthesis after partialhepatectomy determined from the corrected labeling index data.
parenchymal cells appeared to contribute pri-marily to tissue growth, with little or no renewalof dying or worn out cells.
Regenerating Liver
The burst of proliferative activity in the liverremnant during the first 64 hr results in a markedtissue expansion of cells with little or no cell loss.For accurate information for much of the quantita-tive analysis of the pattern of cell proliferation, thepercentage labeling and mitotic indices must becorrected for the increasing mass of the liver inorder to be a measure of the total number of cellsin synthesis and division in the remnant at anygiven time. The direct measurement of changes inthe number of parenchymal cells at frequentintervals presents some difficulties, but an estimatecan be based on the temporal course of the mitoticindex using methods of Smith and Dendy (28)and Goss (11). This was done for the mitoticindex in the regenerating liver at hourly intervalsbased on a curve of best fit to the means (Fig. 9 a).From the labeled mitoses curve data, T was
taken to be 1.0 hr, and T,, 8.0 hr. This estimate ofliver size, if the size of the remnant after partialhepatectomy is taken to be 1.0, is based on thehypothesis that at the end of each hour a numberof cells equal to the number in mitosis during thehour is added to the cell population present at thebeginning of the hour. This was determined pro-gressively throughout the course of the regenera-tion, the number of cells in mitosis being calcu-lated from the observed mitotic index and theestimated size of the liver at the beginning of thehour. At each subsequent determination there is aprogressive, but very slight, underestimate of thesize of the parenchymal cell population in theremnant which can be corrected by more tediouscalculation (28).
If the corrected mitotic index (CMIt) is defined asthe total number of parenchymal cells dividingin the liver remnant at time t, expressed as a frac-tion of the number of cells in the remnant at thetime of partial hepatectomy, then CMIt = MI,X H, where Mlt is the observed MI at time t andHt is the number of parenchymal cells in the liver
JACOB I. FARBIKANT Regenerating Liver 559
30 -
20 -
10 -I
30-
.s -
z
CLa-
20 -
10 -
0-
ZzU
idaW0.
. . . . . . --- 1 - . . . .1l . . . . I . , , , . . . . . . . . . . . . . . . . . . . . . .
®/. ..,
CORRECTED ' '.-
0SERVED0
r l l l l l l l ll l l l I I I I I I I I I I I I I I I I I I I I I I I I I I I
@
CORRECTED
6- ENTRY OF CELLS INTO SYNTHESIS4-
2-
0-010 12 14 16 18 20 22 24 2 28 30 32 34 36 38 40 42 44 46 48 30 32 54 56 58 60 62 64
HOURS AFTER PARTIAL HEPATECTOMY
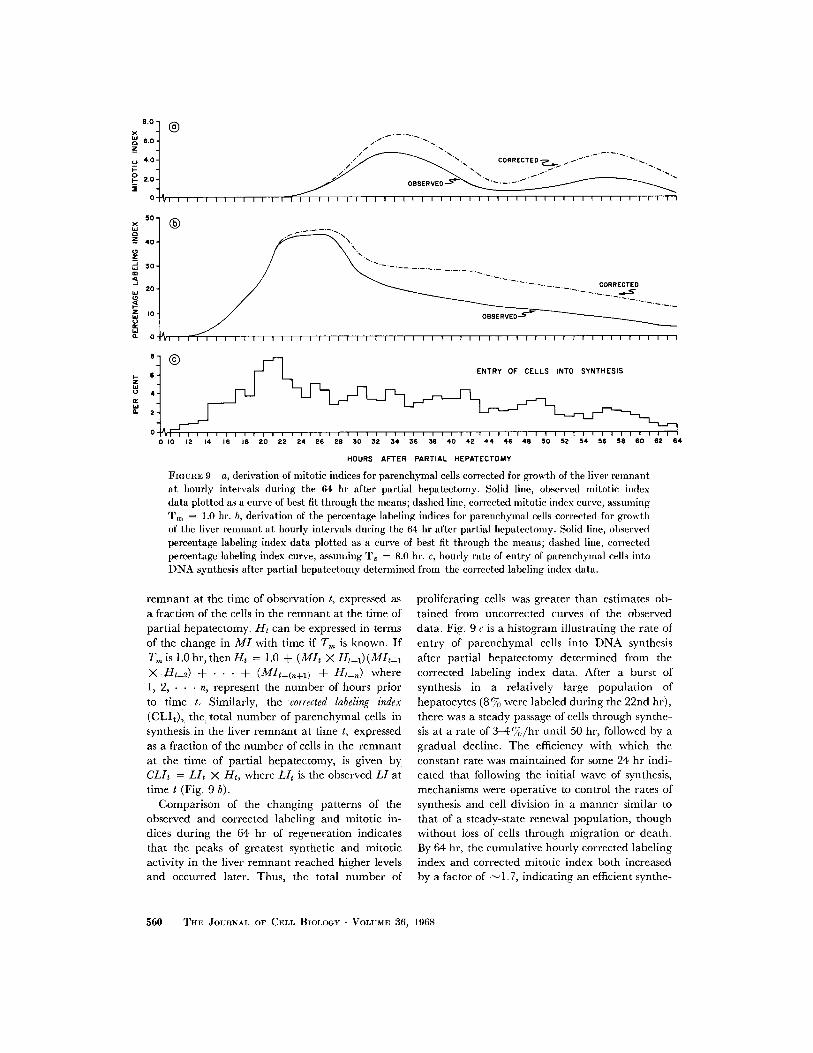
FIGUE 9 a, derivation of miitotic indices for parenchymal cells corrected for growth of the liver remnantat hourly intervals during the 64 hr after partial hepatectomy. Solid line, observed mitotic indexdata plotted as a curve of best fit through the means; dashed line, corrected mitotic index curve, assumingTm= 1.0 hr. b, derivation of the percentage labeling indices for parenchymal cells corrected for growthof the liver remnant at hourly intervals during the 64 hr after partial hepatectomy. Solid line, observedpercentage labeling index data plotted as a curve of best fit through the means; dashed line, correctedpercentage labeling index curve, assuming T. = 8.0 hr. c, hourly rate of entry of parenchymal cells intoDNA synthesis after partial hepatectomy determined from the corrected labeling index data.
remnant at the time of observation t, expressed asa fraction of the cells in the remnant at the time ofpartial hepatectomy. Ht can be expressed in termsof the change in MI with time if Tm is known. IfTm is 1.0 hr, then Ht = 1.0 + (MiA X Ht_1) (MItlX Ht-2) +- + (Mlt_(.+l) ± Htn) where1, 2, · · · n, represent the number of hours priorto time t, Similarly, the corrected labeling index(CLIt), the total number of parenchymal cells insynthesis in the liver remnant at time t, expressedas a fraction of the number of cells in the remnantat the time .of partial hepatectomy, is given byCLI = Lit X Hi, where Lit is the observed LI attime t (Fig. 9 b).
Comparison of the changing patterns of theobserved and corrected labeling and mitotic in-dices during the 64 hr of regeneration indicatesthat the peaks of greatest synthetic and mitoticactivity in the liver remnant reached higher levelsand occurred later. Thus, the total number of
proliferating cells was greater than estimates ob-tained from uncorrected curves of the observeddata. Fig. 9 c is a histogram illustrating the rate ofentry of parenchymal cells into DNA synthesisafter partial hepatectomy determined from thecorrected labeling index data. After a burst ofsynthesis in a relatively large population ofhepatocytes (8%70 were labeled during the 22nd hr),there was a steady passage of cells through synthe-sis at a rate of 3-4%/hr until 50 hr, followed by agradual decline. The efficiency with which theconstant rate was maintained for some 24 hr indi-cated that following the initial wave of synthesis,mechanisms were operative to control the rates ofsynthesis and cell division in a manner similar tothat of a steady-state renewal population, thoughwithout loss of cells through migration or death.By 64 hr, the cumulative hourly corrected labelingindex and corrected mitotic index both increasedby a factor of -1.7, indicating an efficient synthe-
560 THE JOUnNAL OF CELL BIOLOGY VOLUME 6, 1968
8.0-
o 6.0-
o 4.0--. O -
- 2.0-
30-
C
ds2
42
I.1;
0
zWU
a.
z
I-'i
(.2
x.
sis-mitosis sequence, and that a large proportionof the cell deficit was replaced within 3 days.
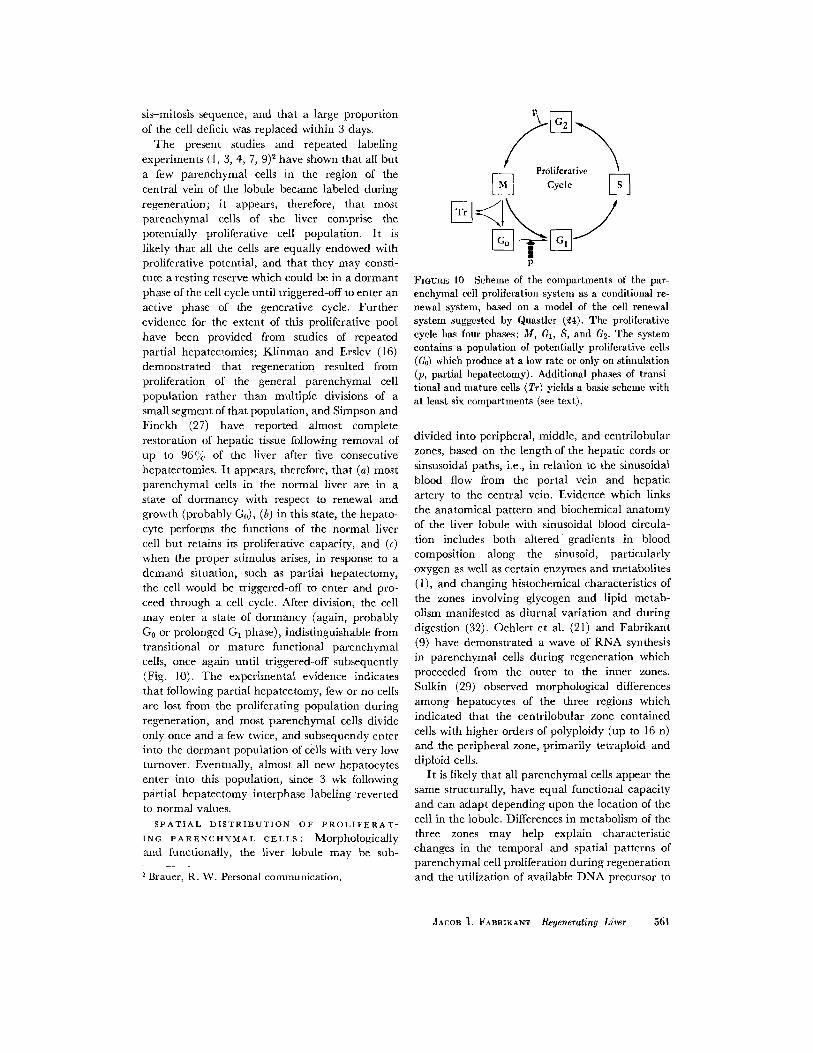
The present studies and repeated labelingexperiments (1, 3, 4, 7, 9)2 have shown that all buta few parenchymal cells in the region of thecentral vein of the lobule became labeled duringregeneration; it appears, therefore, that mostparenchymal cells of the liver comprise thepotentially proliferative cell population. It islikely that all the cells are equally endowed withproliferative potential, and that they may consti-tute a resting reserve which could be in a dormantphase of the cell cycle until triggered-off to enter anactive phase of the generative cycle. Furtherevidence for the extent of this proliferative poolhave been provided from studies of repeatedpartial hepatectomies; Klinman and Erslev (16)demonstrated that regeneration resulted fromproliferation of the general parenchymal cellpopulation rather than multiple divisions of asmall segment of that population, and Simpson andFinckh (27) have reported almost completerestoration of hepatic tissue following removal ofup to 96% of the liver after five consecutivehepatectomies. It appears, therefore, that (a) mostparenchymal cells in the normal liver are in astate of dormancy with respect to renewal andgrowth (probably Go), (b) in this state, the hepato-cyte performs the functions of the normal livercell but retains its proliferative capacity, and (c)when the proper stimulus arises, in response to ademand situation, such as partial hepatectomy,the cell would be triggered-off to enter and pro-ceed through a cell cycle. After division, the cellmay enter a state of dormancy (again, probably
Go or prolonged G1 phase), indistinguishable fromtransitional or mature functional parenchymalcells, once again until triggered-off subsequently(Fig. 10). The experimental evidence indicatesthat following partial hepatectomy, few or no cellsare lost from the proliferating population duringregeneration, and most parenchymal cells divideonly once and a few twice, and subsequently enterinto the dormant population of cells with very lowturnover. Eventually, almost all new hepatocytesenter into this population, since 3 wk followingpartial hepatectomy interphase labeling revertedto normal values.
SPATIAL DISTRIBUTION OF PROLIFERAT-
ING PARENCHYMAL CELLS: Morphologicallyand functionally, the liver lobule may be sub-
2 Brauer, R. W. Personal communication.
ProliferativeCycle
FIURE 10 Scheme of the compartments of the par-
Fenhyal 10 Scheme of the compartments of the par-enchymal cell proliferation system as a conditional re-newal system, based on a model of the cell renewalsystem suggested by Quastler (4). The proliferativecycle has four phases: M, G1, 8, and G2. The systemcontains a population of potentially proliferative cells(Go) which produce at a low rate or only on stimulation(p, partial hepatectomy). Additional phases of transi-tional and mature cells (Tr) yields a basic scheme withat least six compartments (see text).
divided into peripheral, middle, and centrilobularzones, based on the length of the hepatic cords or
sinsusoidal paths, i.e., in relation to the sinusoidalblood flow from the portal vein and hepaticartery to the central vein. Evidence which linksthe anatomical pattern and biochemical anatomyof the liver lobule with sinusoidal blood circula-
tion includes both altered gradients in bloodcomposition along the sinusoid, particularly
oxygen as well as certain enzymes and metabolites(1), and changing histochemical characteristics ofthe zones involving glycogen and lipid metab-
olism manifested as diurnal variation and duringdigestion (32). Oehlert et al. (21) and Fabrikant
(9) have demonstrated a wave of RNA synthesisin parenchymal cells during regeneration whichproceeded from the outer to the inner zones.
Sulkin (29) observed morphological differences
among hepatocytes of the three regions whichindicated that the centrilobular zone contained
cells with higher orders of polyploidy (up to 16 n)and the peripheral zone, primarily tetraploid anddiploid cells.
It is likely that all parenchymal cells appear the
same structurally, have equal functional capacity
and can adapt depending upon the location of thecell in the lobule. Differences in metabolism of the
three zones may help explain characteristicchanges in the temporal and spatial patterns ofparenchymal cell proliferation during regenerationand the utilization of available DNA precursor to
JACOB I. FABRIKANT Regenerating Liver 561
proliferating cells. RNA and DNA synthesis andcell division occur in sequence beginning in theouter zone and progressing in waves toward thecentral zone. Peripheral zone cells divide once,and a few twice, whereas some of the centrilobularzone cells do not proliferate at all. It thereforeappears that the signal for proliferation does notaffect all the parenchymal cells to the same extent.After regeneration, the degree of ploidy increases,particularly in the peripheral zone, and ap-proaches the complex pattern characteristic of thecentrilobular zone cells. The signal to enter syn-thesis is independent of and proceeds with greaterefficiency than that to enter cell division, and suchevents which apparently initiate cell proliferationfollowing partial hepatectomy are operative pri-marily on peripheral zone parenchymal cells.
ANALYSIS OF KINETIC PARAMETERS OF
PARENCHYMAL CELL PROLIFERATION: Pro-
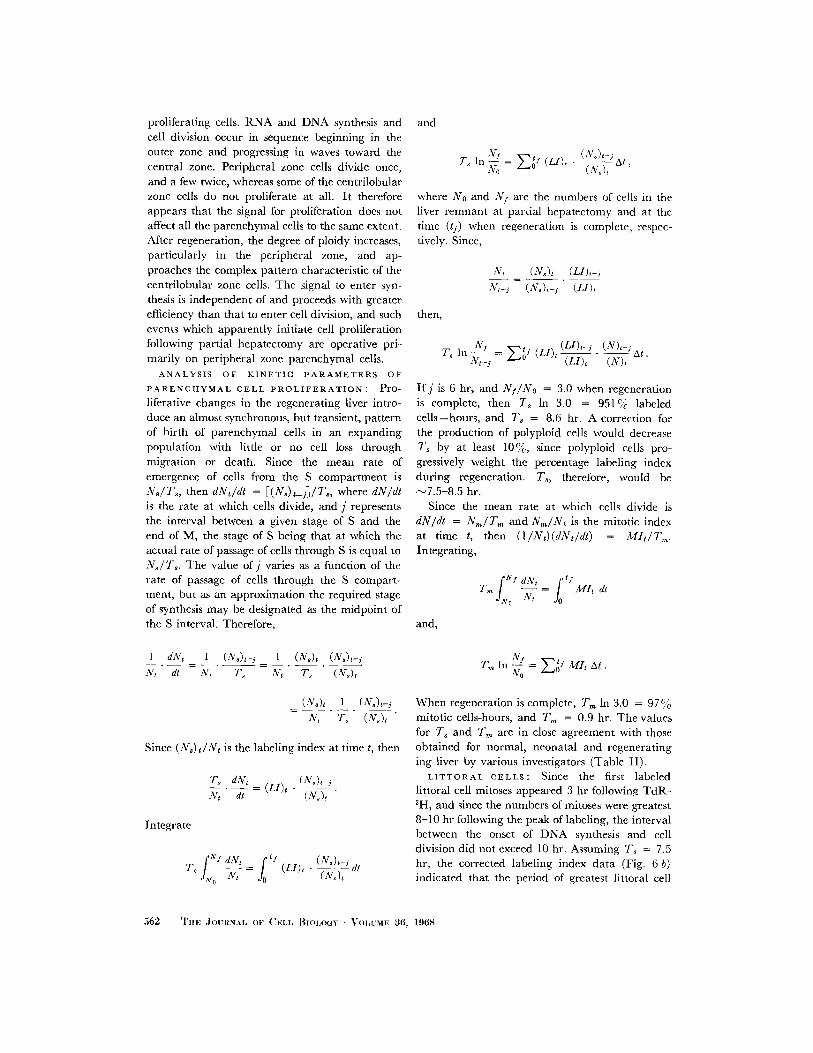
liferative changes in the regenerating liver intro-duce an almost synchronous, but transient, patternof birth of parenchymal cells in an expandingpopulation with little or no cell loss throughmigration or death. Since the mean rate ofemergence of cells from the S compartment isN,/7,, then dNt/dt = [(N,)t_i]/T,, where dN/dtis the rate at which cells divide, and j representsthe interval between a given stage of S and theend of M, the stage of S being that at which theactual rate of passage of cells through S is equal toN,/T,. The value ofj varies as a function of therate of passage of cells through the S compart-ment, but as an approximation the required stageof synthesis may be designated as the midpoint ofthe S interval. Therefore,
1 dN, I (N,),-j 1 (N,), (N,),-j
N, dt N, T, N, T, (N,)t
and
7, In = f(LI), (V), -At
where No and Nf are the numbers of cells in theliver remnant at partial hepatectomy and at thetime (t) when regeneration is complete, respec-tively. Since,
N, (N,), (Ll)t-j
N,-j (N)t-j (Ll),
then,
-j 0 ~ (LI), (N),
If j is 6 hr, and Nf/No = 3.0 when regenerationis complete, then T In 3.0 = 951% labeledcells-hours, and T = 8.6 hr. A correction forthe production of polyploid cells would decrease7', by at least 10%, since polyploid cells pro-gressively weight the percentage labeling indexduring regeneration. T, therefore, would be~7.5-8.5 hr.
Since the mean rate at which cells divide isdN/dt = N/Tm and Nm/Nt is the mitotic indexat time t, then (1 /Nt)(dNt/dt) = MI/T7.Integrating,
Nf dN, ftfo Nt = fo
t MI
t
and,
T, In Nf = E f Mi t At.
(N,), 1 (N,)t-6N, T (N,)t
Since (N,) tNt is the labeling index at time t, then
T, dNtd = (LI)t
N, dt(N),
Integrate
T ---- = j (LI), (N) dtJN 0 At o ~(N.,t
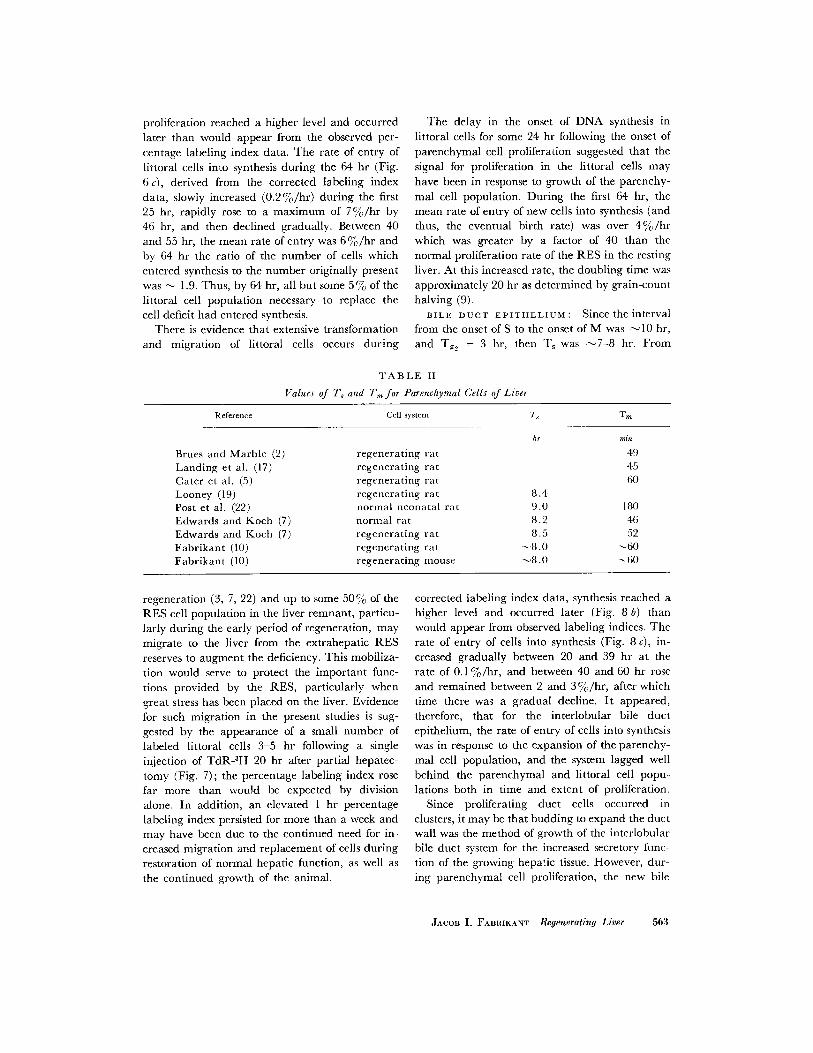
When regeneration is complete, T In 3.0 = 97 %mitotic cells-hours, and 7m = 0.9 hr. The valuesfor T and T are in close agreement with thoseobtained for normal, neonatal and regeneratinging liver by various investigators (Table II).
LITTORAL CELLS: Since the first labeledlittoral cell mitoses appeared 3 hr following TdR-3H, and since the numbers of mitoses were greatest8-10 hr following the peak of labeling, the intervalbetween the onset of DNA synthesis and celldivision did not exceed 10 hr. Assuming 'T, = 7.5hr, the corrected labeling index data (Fig. 6 b)indicated that the period of greatest littoral cell
562 I'ir .JOUTINAL OF (r,, BoloGY VOILtME 36, 1968
proliferation reached a higher level and occurredlater than would appear from the observed per-centage labeling index data. The rate of entry oflittoral cells into synthesis during the 64 hr (Fig.
6 c), derived from the corrected labeling indexdata, slowly increased (0.2 %/hr) during the first25 hr, rapidly rose to a maximum of 7%/hr by46 hr, and then declined gradually. Between 40and 55 hr, the mean rate of entry was 6%/hr andby 64 hr the ratio of the number of cells whichentered synthesis to the number originally presentwas - 1.9. Thus, by 64 hr, all but some 5% of thelittoral cell population necessary to replace thecell deficit had entered synthesis.
There is evidence that extensive transformationand migration of littoral cells occurs during
The delay in the onset of DNA synthesis inlittoral cells for some 24 hr following the onset ofparenchymal cell proliferation suggested that thesignal for proliferation in the littoral cells mayhave been in response to growth of the parenchy-mal cell population. During the first 64 hr, themean rate of entry of new cells into synthesis (andthus, the eventual birth rate) was over 4%/hrwhich was greater by a factor of 40 than thenormal proliferation rate of the RES in the restingliver. At this increased rate, the doubling time wasapproximately 20 hr as determined by grain-counthalving (9).
BILE DUCT EPITHELIUM: Since the intervalfrom the onset of S to the onset of M was -10 hr,and T., = 3 hr, then T was --7-8 hr. From
TABLE II
Values of 7' and T for Parenchymal Cells of Liver
Reference Cell system 7 Tm
hr min
Brues and Marble (2) regenerating rat 49Landing et al. (17) regenerating rat 45
Cater et al. (5) regenerating rat 60Looney (19) regenerating rat 8.4Post et al. (22) normal neonatal rat 9.0 180Edwards and Koch (7) normal rat 8.2 46Edwards and Koch (7) regenerating rat 8.5 52Fabrikant (10) regenerating rat -8.0 ;60Fabrikant (10) regenerating mouse -8.0 -60
regeneration (3, 7, 22) and up to some 50% of theRES cell population in the liver remnant, particu-larly during the early period of regeneration, maymigrate to the liver from the extrahepatic RESreserves to augment the deficiency. This mobiliza-tion would serve to protect the important func-tions provided by the RES, particularly whengreat stress has been placed on the liver. Evidencefor such migration in the present studies is sug-gested by the appearance of a small number oflabeled littoral cells 3-5 hr following a singleinjection of TdR-3H 20 hr after partial hepatec-tomy (Fig. 7); the percentage labeling index rosefar more than would be expected by divisionalone. In addition, an elevated 1 hr percentagelabeling index persisted for more than a week andmay have been due to the continued need for in-creased migration and replacement of cells duringrestoration of normal hepatic function, as well asthe continued growth of the animal.
corrected labeling index data, synthesis reached a
higher level and occurred later (Fig. 8 b) than
would appear from observed labeling indices. The
rate of entry of cells into synthesis (Fig. 8 c), in-
creased gradually between 20 and 39 hr at the
rate of 0.1 %/hr, and between 40 and 60 hr rose
and remained between 2 and 3%/hr, after which
time there was a gradual decline. It appeared,
therefore, that for the interlobular bile duct
epithelium, the rate of entry of cells into synthesis
was in response to the expansion of the parenchy-
mal cell population, and the system lagged well
behind the parenchymal and littoral cell popu-
lations both in time and extent of proliferation.
Since proliferating duct cells occurred in
clusters, it may be that budding to expand the ductwall was the method of growth of the interlobular
bile duct system for the increased secretory func-
tion of the growing hepatic tissue. However, dur-
ing parenchymal cell proliferation, the new bile
JACOB I. FABRIKANT Regenerating Liver 563
canaliculi forming within the anastomosing per-forated plates of the new parenchyma were re-sponsible primarily for the large increase in thebiliary system associated with the increase in sizeof the liver lobules during regeneration. Thiswould agree with the observation that followingpartial hepatectomy an increased flow of bilelagged some 24-36 hr behind the growth of theparenchymal cell population, and that an in-creased flow exceeding the control level continuedfor 15-20 days (3, 18, 31, 32). Thus, duringregeneration, it may be that the response of growthextended over a longer period than for the paren-chymal and littoral cells, and that the growth ofthe biliary system was effected primarily by an
increase in the network of bile canaliculi, and only
secondarily by proliferation of the interlobular
duct epithelium.
CONNECTIVE TISSUE CELLS: The onset of
DNA synthesis and cell division in the connective
tissue cells, mesothelial lining cells, vascular endo-
thelium, etc., during regeneration also appeared to
occur in response to the rapid expansion of the
parenchymal cell population. However, cell
proliferation lagged behind the parenchymal and
littoral cell populations both in time and extent ofproliferation. Growth extended over a longerperiod during the regenerative process, therebyproviding the architectural framework necessaryfor the subsequent remodeling of the organ.
I am indebted to Professor L. F. Lamerton, Directorof the Department of Biophysics, for his generoushelp, instruction, suggestions, and criticism. I amgrateful to Professor W. V. Mayneord, formerlyDirector of the Physics Department, to Dr. Russell H.Morgan, Professor of Radiological Science at TheJohns Hopkins University, and to the James PickerFoundation, for their constant support and encour-agement. I also wish to thank the many members ofthe Department of Biophysics who gave so freely oftheir time, experience, and technical assistance andMiss Barbara Grossman for help with the illustrations.
This study was carried out while the author was anAdvanced Fellow in Academic Radiology of theJames Picker Foundation on recommendation of theCommittee on Radiology, NAS-NRC. The work wassupported, in part, by grant GM 108002-06 of theNational Institutes of Health, United States PublicHealth Service.
Received for publication 23 August 1967, and in revised form
6 November 1967.
REFERENCES
1. BRAUER, R. W. 1963. Liver circulation and
function. Physiol. Rev. 43:115.2. BRUES, A. M., and B. B. MARBLE. 1937. An
analysis of mitosis in liver regeneration. J.Exptl. Med. 65:15.
3. BUCHER, N. L. R. 1963. Regeneration of mam-malian liver. 1963. Intern. Rev. Cytol. 15:245.
4. BUCHER, N. L. R., M. N. SWAFFIELD, and J. F.DITROIA. 1964. The influence of age upon theincorporation of thymidine-2-C 4 into DNAof regenerating rat liver. Cancer Res. 24:509.
5. CATER, D. B., B. E. HOLMES, and L. K. MEE.1956. Cell division and nucleic acid synthesisin the regenerating liver of the rat. Acta Radiol.46:655.
6. EDWARDS, J. L., and R. E. KLEIN. 1961. Cell re-newal in adult mouse tissues. Am. J. Pathol. 38:437.
7. EDWARDS, J. L., and A. KOCH. 1964. Paren-
chymal and littoral cell proliferation duringliver regeneration. Lab. Invest. 13:32.
8. ENESCO, M., and C. P. LEBLOND. 1962. Increasein cell number as a factor in the growth oforgans and tissues of the young male rat. J.Embryol. Exptl. Morphol. 10:530.
9. FABRIKANT, J. I. 1964. Cell proliferation in the
regenerating liver and the effect of prior con-tinuous irradiation. Ph.D. Thesis. Universityof London, London.
10. FABRIKANT, J. I. 1967. The effect of prior con-tinuous irradiation on the G2, M, and S phasesof proliferating parenchymal cells in the re-generating liver. Radiation Res. 31:304.
11. Goss, R. J. 1965. Kinetics of compensatorygrowth. Quart. Rev. Biol. 40:123.
12. GRISHAM, J. W. 1962. A morphologic study ofdeoxyribonucleic acid synthesis and cell pro-liferation in regenerating rat liver. Autoradiog-raphy with thymidine-H3. Cancer Res. 22:842.
13. HARKNESS, R. D. 1961. Liver regeneration. In
The Scientific Basis of Medicine Annual Re-views. Athlone Press of the University of Lon-don, London. 236.
14. HIGGINS, G. M., and R. M. ANDERSON. 1931. Ex-
perimental pathology of the liver. I. Restora-tion of the liver of the white rat followingpartial surgical removal. Arch. Pathol. 12:186.
15. HOWARD, A., and S. R. PELC. 1953. Synthesis of
desoxyribonucleic acid in normal and ir-
564 THE JOURNAL OF CELL BIOLOGY VOLUME 3, 1968
radiated cells, and its relation to chromosomebreakage. Heredity. 6 (Suppl.) :261.
16. KLINMAN, N. R., and A. J. ERSLEV. 1963. Cellu-lar response to partial hepatectomy, Proc. Soc.Exptl. Biol. Med. 112:338.
17. LANDING, B. H., J. C. SEED, and W. G. BANFIELD.
1949. The effects of a nitrogen mustard (tris(2-chloroethyl) amine) on regenerating ratliver. Cancer. 2:1067.
18. LEONG, G. F., R. L. PESSOTTI, and R. W. BRAUER.
1959. Liver function in regenerating rat liver.CrPO 4 colloid uptake and bile flow. Am. J.Physiol. 197:880.
19. LOONEY, W. B. 1960. The replication of desoxy-ribonucleic acid in hepatocytes. Proc. Natl.Acad. Sci. U.S. 46:690.
20. MESSIER, B., and C. P. LEBLOND. 1960. Cell pro-liferation and migration as revealed by radio-autography after injection of thymidine-H3
into male rats and mice. Am. J. Anat. 106:247.21. OEHLERT, W., W. HXMMERLING, W. and F.
BiUCHNER. 1962. Der zeitliche Ablauf und dasAusmass der DesoxyribonukleinsAure -Synthese in der regenerierenden Leber derRatte nach Teilhepatektomie. Beitr. Pathol.Anat. Allgem. Pathol. 121:91.
22. POST, J., C.-Y. HUANG, and J. HOFFMAN. 1963.The replication time and pattern of the livercell in the growing rat. J. Cell Biol. 18:1.
23. POTTER, V. R., R. A. GEBERT, H. C. PITOT, C.
PERAINO, C. LAMAR, JR., S. LESHER, and H. P.
MORRIS. 1966. Systemic oscillations in meta-
bolic activity in rat liver and in hepatomas. I.Morris hepatoma no. 7793. Cancer Res. 26:1547.
24. QUASTLER, H. 1963. The analysis of cell popula-tion kinetics. In Cell Proliferation. L. F.Lamerton and R. J. M. Fry, editors. Phila-delphia, F. A. Davis Co., 18.
25. QUASTLER, H., and F. G. SHERMAN. 1959. Cell
population kinetics in the intestinal epitheliumof the mouse. Exptl. Cell Res. 17:420.
26. SCHULTZE, B., and W. OEHLERT. 1960. Auto-
radiographic investigation of incorporation ofH3-thymidine into cells of the rat and mouse.Science. 131:737.
27. SIMPSON, G. E. C., and E. S. FINCKH. 1963. Thepattern of regeneration of rat liver after re-peated partial hepatectornies. J. Pathol. Bac-teriol. 86:361.
28. SMITH, C. L., and P. P. DENDY. 1962. Relation
between mitotic index, duration of mitosis,generation time and fraction of dividing cellsin a population. Nature. 193:555.
29. SULKIN, N. M. 1943. A study of nucleus in normal
and hyperplastic liver of the rat. Am. J. Anat.73:107.
30. VAN LANCKER, J. L. 1962. Cytochemical injuryof X-radiation. Federation Proc. 20:1118.
31. WEINBREN, K. 1959. Regeneration of the liver.Gastroenterology. 37:657.
32. WILSON, J. W. 1958. Liver structure in relationto liver function. In Liver Function. R. W.Brauer, editor. Washington, D.C., AmericanInstitute of Biological Sciences. 175.
JAcos I. FABRIKANT Regenerating Liver 565