PROX1 Gene is Differentially Expressed in Oral Cancer and Reduces Cellular Proliferation
11
PROX1 Gene is Differentially Expressed in Oral Cancer and Reduces Cellular Proliferation Maria F.S.D. Rodrigues, MD, PhD, Camila de Oliveira Rodini, MD, PhD, Fla´via C. de Aquino Xavier, MD, PhD, Katiu´cia B. Paiva, MD, PhD, Patrı´cia Severino, MD, PhD, Raquel A. Moyses, MD, PhD, Rossana M. Lo´pez, MD, PhD, Rafael DeCicco, MD, PhD, Lı´lia A. Rocha, MD, PhD, Marcos B. Carvalho, MD, PhD, Eloiza H. Tajara, MD, PhD, and Fabio D. Nunes, MD, PhD Abstract: Homeobox genes are a family of transcription factors that play a pivotal role in embryogenesis. Prospero homeobox 1 (PROX1) has been shown to function as a tumor suppressor gene or oncogene in various types of cancer, including oral squamous cell carcinoma (OSCC). We have previously identified PROX1 as a downregulated gene in OSCC. The aim of this study is to clarify the underlying mechanism by which PROX1 regulates tumorigenicity of OSCC cells. PROX1 mRNA and protein expression levels were first investigated in 40 samples of OSCC and in nontumor margins. Methylation and amplification analysis was also performed to assess the epigenetic and genetic mechanisms involved in controlling PROX1 expression. OSCC cell line SCC9 was also transfected to stably express the PROX1 gene. Next, SCC9-PROX1-overexpressing cells and controls were subjected to proliferation, differentiation, apoptosis, migration, and invasion assays in vitro. OSCC samples showed reduced PROX1 expression levels compared with nontumor margins. PROX1 amplifica- tion was associated with better overall survival. PROX1 overexpression reduces cell proliferation and downregulates cyclin D1. PROX1-over- expressing cells also exhibited reduced CK18 and CK19 expression and transcriptionally altered the expression of WISP3, GATA3, NOTCH1, and E2F1. Our results suggest that PROX1 functions as a tumor suppressor gene in oral carcinogenesis. (Medicine 93(28):e192) Abbreviations: FBS = fetal bovine serum, IHC = immuno- histochemistry, OSCC = oral squamous cell carcinoma, PROX1 = prospero homeobox 1. INTRODUCTION O ral squamous cell carcinoma (OSCC) is the most common malignancy of the oral cavity and a major cause of cancer morbidity and mortality worldwide. 1 Oral carcinogenesis is a multifactorial process associated with cumulative genetic mutations that alter proto-oncogenes and tumor suppressor gene function, resulting in disturbed cellular proliferation and cell differentiation. 2 Homeobox genes encode transcriptional factors that con- trol cellular proliferation and differentiation during embryonic development. 3 These genes have been aberrantly expressed in solid tumors, including OSCC. 4–8 The prospero homeobox 1 (PROX1) gene encodes a nuclear transcription factor (prospero homeobox protein 1/PROX1) that plays a major role during embryonic lymphangiogenesis, 9 differentiation of the central nervous system, 10 lens fiber elongation, 11 and hepatocyte migration. 12 PROX1 gene inactivation results in abnormal cell proliferation, probably because of downregulation of cell cycle inhibitors. 13 In human cancers, PROX1 gene acts in a tissue-dependent manner, as a transcriptional activator or repressor, leading to variable effects on cellular proliferation and differentiation. 14 PROX1 overexpression promotes aggressive behavior of many endothelial tumors, 15,16 colon cancer, 15,16 and gliomas. 17 How- ever, in hepatocellular carcinoma, high PROX1 expression inhibits transforming activity and cellular proliferation and is associated with well-differentiated tumors and better prog- nosis. 18 Hagiwara et al 19 also found PROX1 overexpression to suppress cell growth and tumor formation in HeLa cells, partially mediated by protein kinase C b. Additionally, it was also demonstrated that PROX1 strongly inhibits the pro- liferation of neuroblastoma cell lines as well as cyclin D1, cyclin-A, and cyclin B1, consistent with a role in cell cycle arrest. 20 In contrast, loss of PROX1 function has been detected in hematologic malignancies, sporadic breast cancer, and carci- nomas of the biliary system. 21–23 Mutations and DNA meth- ylation appear to be the major causes behind loss of PROX1 function in some tumors. 22–24 Recently, an antimetastatic role of PROX1 was observed in PROX1-silenced hepatocarcinoma cell lines via TWIST1 gene inhibition. 25 In OSCC, Sasahira et al 26 demonstrated that PROX1 and FOXC2 act as oncogenes by inducing lymphangiogenesis and angiogenesis. Addition- ally, PROX1 was associated with tumor progression (pT and Editor: Chun-Xia Cao. Received: September 10, 2014; revised and accepted: September 15, 2014. From the Department of Estomatology (MFSDR, LAR, FDN), School of Dentistry; Department of Biochemistry (KBP), Chemistry Institute; Department of Head and Neck Surgery (RAM), School of Medicine; Department of Epidemiology (RML), Public Health; Department of Genetics and Evolutionary Biology (EHT), Institute of Biosciences, University of Sa ˜o Paulo; Albert Einstein Research and Education Institute (PS), Albert Einstein Israelita Hospital, Center for Experimental Research; Department of Head and Neck Surgery (RDC), Arnaldo Vieira de Carvalho Cancer Institute; Department of Head and Neck Surgery (MBC), Heliopolis Hospital Complex, Sa ˜o Paulo; Department of Estomatology (FCdAX), School of Dentistry, Federal University of Bahia, Salvador; Department of Histology (CdOR), School of Dentistry, University of Sa ˜o Paulo, Bauru; and Department of Molecular Biology (EHT), School of Medicine, Sa ˜o Jose ´ do Rio Preto, Brazil. Correspondence: Fabio D. Nunes, Department of Estomatology, School of Dentistry, University of Sa ˜o Paulo, Sa ˜o Paulo, Brazil (e-mail: [email protected]). This work was supported by Fundac ¸a ˜o de Amparo a ` Pesquisa do Estado de Sa ˜o Paulo (FAPESP, process number 2004/12054–9, 2008/06263–2, and 2008/06223–3). The authors have no conflicts of interest to disclose. Copyright # 2014 Wolters Kluwer Health | Lippincott Williams & Wilkins. This is an open access article distributed under the Creative Commons Attribution License 4.0, which permits unrestricted use, distribution, and reproduction in any medium, provided the original work is properly cited. ISSN: 0025-7974 DOI: 10.1097/MD.0000000000000192 Medicine Volume 93, Number 28, December 2014 www.md-journal.com | 1
Transcript of PROX1 Gene is Differentially Expressed in Oral Cancer and Reduces Cellular Proliferation
PROX1 Gene is Differentially Expressed in Oral Cancer andReduces Cellular Proliferation
Maria F.S.D. Rodrigues, MD, PhD, Camila de Oliveira Rodini, MD, PhD,Flavia C. de Aquino Xavier, MD, PhD, Katiucia B. Paiva, MD, PhD, Patrıcia Severino, MD, PhD,
opez, MD, PhD, Rafa D, PhD,lh
Raquel A. Moyses, MD, PhD, Rossana M. LLılia A. Rocha, MD, PhD, Marcos B. Carva
u
suppressor gene in oral carcinogenesis.
(Medicine 93(28):e192)
et al26 demonstrated thby inducing lymphangally, PROX1 was asso
Editor: Chun-Xia Cao.Received: September 10, 2014; revised and accepted: September 15, 2014.From the Department of Estomatology (MFSDR, LAR, FDN), School ofDentistry; Department of Biochemistry (KBP), Chemistry Institute;Department of Head and Neck Surgery (RAM), School of Medicine;Department of Epidemiology (RML), Public Health; Department ofGenetics and Evolutionary Biology (EHT), Institute of Biosciences,University of Sao Paulo; Albert Einstein Research and Education Institute(PS), Albert Einstein Israelita Hospital, Center for Experimental Research;Department of Head and Neck Surgery (RDC), Arnaldo Vieira de CarvalhoCancer Institute; Department of Head and Neck Surgery (MBC), HeliopolisHospital Complex, Sao Paulo; Department of Estomatology (FCdAX),School of Dentistry, Federal University of Bahia, Salvador; Department ofHistology (CdOR), School of Dentistry, University of Sao Paulo, Bauru;and Department of Molecular Biology (EHT), School of Medicine, SaoJose do Rio Preto, Brazil.Correspondence: Fabio D. Nunes, Department of Estomatology, School of
Dentistry, University of Sao Paulo, Sao Paulo, Brazil (e-mail:[email protected]).
This work was supported by Fundacao de Amparo a Pesquisa do Estado deSao Paulo (FAPESP, process number 2004/12054–9, 2008/06263–2,and 2008/06223–3).
The authors have no conflicts of interest to disclose.Copyright # 2014 Wolters Kluwer Health | Lippincott Williams & Wilkins.This is an open access article distributed under the Creative CommonsAttribution License 4.0, which permits unrestricted use, distribution, andreproduction in any medium, provided the original work is properly cited.ISSN: 0025-7974DOI: 10.1097/MD.0000000000000192
Medicine � Volume 93, Number 28, December 2014
el DeCicco, Ma H. Tajara, M
and Fabio D. N
Abstract: Homeobox genes are a family of transcription factors that
play a pivotal role in embryogenesis. Prospero homeobox 1 (PROX1)
has been shown to function as a tumor suppressor gene or oncogene in
various types of cancer, including oral squamous cell carcinoma
(OSCC). We have previously identified PROX1 as a downregulated
gene in OSCC. The aim of this study is to clarify the underlying
mechanism by which PROX1 regulates tumorigenicity of OSCC cells.
PROX1 mRNA and protein expression levels were first investigated in
40 samples of OSCC and in nontumor margins. Methylation and
amplification analysis was also performed to assess the epigenetic
and genetic mechanisms involved in controlling PROX1 expression.
OSCC cell line SCC9 was also transfected to stably express the PROX1
gene. Next, SCC9-PROX1-overexpressing cells and controls were
subjected to proliferation, differentiation, apoptosis, migration, and
invasion assays in vitro. OSCC samples showed reduced PROX1
expression levels compared with nontumor margins. PROX1 amplifica-
tion was associated with better overall survival. PROX1 overexpression
reduces cell proliferation and downregulates cyclin D1. PROX1-over-
expressing cells also exhibited reduced CK18 and CK19 expression and
transcriptionally altered the expression of WISP3, GATA3, NOTCH1,
and E2F1. Our results suggest that PROX1 functions as a tumor
o, MD, PhD, Eloiz D, PhD,nes, MD, PhD
Abbreviations: FBS = fetal bovine serum, IHC = immuno-
histochemistry, OSCC = oral squamous cell carcinoma, PROX1 =
prospero homeobox 1.
INTRODUCTION
O ral squamous cell carcinoma (OSCC) is the most commonmalignancy of the oral cavity and a major cause of cancer
morbidity and mortality worldwide.1 Oral carcinogenesis is amultifactorial process associated with cumulative geneticmutations that alter proto-oncogenes and tumor suppressor genefunction, resulting in disturbed cellular proliferation and celldifferentiation.2
Homeobox genes encode transcriptional factors that con-trol cellular proliferation and differentiation during embryonicdevelopment.3 These genes have been aberrantly expressed insolid tumors, including OSCC.4–8 The prospero homeobox 1(PROX1) gene encodes a nuclear transcription factor (prosperohomeobox protein 1/PROX1) that plays a major role duringembryonic lymphangiogenesis,9 differentiation of the centralnervous system,10 lens fiber elongation,11 and hepatocytemigration.12 PROX1 gene inactivation results in abnormal cellproliferation, probably because of downregulation of cell cycleinhibitors.13
In human cancers, PROX1 gene acts in a tissue-dependentmanner, as a transcriptional activator or repressor, leading tovariable effects on cellular proliferation and differentiation.14
PROX1 overexpression promotes aggressive behavior of manyendothelial tumors,15,16 colon cancer,15,16 and gliomas.17 How-ever, in hepatocellular carcinoma, high PROX1 expressioninhibits transforming activity and cellular proliferation and isassociated with well-differentiated tumors and better prog-nosis.18 Hagiwara et al19 also found PROX1 overexpressionto suppress cell growth and tumor formation in HeLa cells,partially mediated by protein kinase C b. Additionally, itwas also demonstrated that PROX1 strongly inhibits the pro-liferation of neuroblastoma cell lines as well as cyclin D1,cyclin-A, and cyclin B1, consistent with a role in cell cyclearrest.20
In contrast, loss of PROX1 function has been detected inhematologic malignancies, sporadic breast cancer, and carci-nomas of the biliary system.21–23 Mutations and DNA meth-ylation appear to be the major causes behind loss of PROX1function in some tumors.22–24 Recently, an antimetastatic roleof PROX1 was observed in PROX1-silenced hepatocarcinomacell lines via TWIST1 gene inhibition.25 In OSCC, Sasahira
at PROX1 and FOXC2 act as oncogenesiogenesis and angiogenesis. Addition-ciated with tumor progression (pT and
www.md-journal.com | 1
clinical stage), nodal metastasis, and lymphovessel density.26
These studies suggest that PROX1 may function as an oncogeneor a tumor suppressor gene in a cancer type-specific manner.
Interestingly, a previous microarray study done by ourgroup revealed that PROX1 transcripts were downregulated inOSCC when compared with tumor-free margins.7,27 However,the underlying mechanism by which PROX1 acts in oral canceris still unclear. In this study, we analyzed the expression levelsof PROX1 transcripts and proteins as well as PROX1 amplifica-tion and methylation status in OSCC tissues and tumor-freesurgical margins. We also investigated how PROX1 affects cellproliferation, differentiation, survival, migration, and invasionin a squamous cell carcinoma cell line.
METHODS
Tumor SamplesSpecimens were obtained by surgical resection from
OSCC patients (men, �40 years old) admitted for diagnosisand treatment at the Arnaldo Vieira de Carvalho Cancer Insti-tute, Heliopolis Hospital, and Hospital das Clınicas (School ofMedicine, University of Sao Paulo, Brazil). Histopathologicaldiagnosis was performed according to World Health Organiz-ation classification for tumors. Clinicopathological staging wasdetermined by the TNM classification of the InternationalUnion Against Cancer.28 All patients have provided writteninformed consent to participate in this study that was approvedby the Brazilian National Ethics Committee (Process #16491)and meets the Declaration of Helsinki.
Forty fresh surgical samples of primary OSCC and theircorresponding nonneoplastic margin tissues were immediatelysnap-frozen in liquid nitrogen. After histological confirmation,all tissue samples were checked prior to RNA extraction so eachOSCC sample contained at least 70% tumor cells. The corre-sponding surgical margins were reported as ‘tumor-free.’ TheGENCAPO (Head and Neck Genome Project) consortium wasresponsible for collecting samples and initial processing, col-lecting clinical data, performing histopathological analysis, andobtaining informed consent from each patient.
Cell CultureThe human OSCC cell lines SCC4, SCC9, and SCC25
were obtained from the American Type Culture Collection(ATCC, Manassas, VA) and cultured as recommended in 1:1mixture of Dulbecco Modified Eagle medium (DMEM) andHam F12 medium (DMEM/F12; Invitrogen, Carlsbad, CA)supplemented with 10% fetal bovine serum (FBS), 400 ng/mL hydrocortisone (Sigma-Aldrich, St. Louis, MO), 100 mg/mL penicillin, and 100 mg/mL streptomycin. Cell lines wereauthenticated using the AmpFLSTR Identifiler PCR Amplifica-tion kit (Life Technologies) at the Special Techniques Labora-tory of the Israelita Albert Einstein Hospital (LATE-HIAE), SaoPaulo, Brazil. Cell line matched (100% identity) the STR profiledescribed by the ATCC database.
Plasmid DNA Transfection for PROX1 ExpressionSCC9 cells were transfected with pCMV6 empty vector
(mock) or pCMV6-PROX1 expression vector (OriGene, Rock-ville, MD), containing full-length human PROX1 cDNA, using
Rodrigues et al
Lipofectamine 2000 (Invitrogen), following the manufacturer’sinstructions. Transfected cells were selected in medium with300 mg/mL G418 (Invitrogen).
2 | www.md-journal.com
Real-Time RT-PCRTotal RNA was extracted from cells using TRIzol (Invitro-
gen, Carlsbad, CA) according to the manufacturer’s instructions.First-strand cDNAs were synthesized with a High CapacitycDNA Archive kit (Applied Biosystems, Grand Island, NY,USA). Quantitative RT-PCR (RT-qPCR) reactions were per-formed using an Applied Biosystems 7500 Real-Time PCRSystem with SYBR Green I Dye (Applied Biosystems) accordingto the manufacturer’s instructions. The following primers wereused to detect PROX1 and endogenous ‘‘housekeeping’’ geneHPRT: PROX1 (forward 5’-CTCCGTGGAACTCAGCGC-3’and reverse 5’-GCCGG CTTAAGAGGGCTG-3’) and HPRT(forward 5’-CCACC ACCCTGTTGCTGTA-3’ and reverse 5’-TCCCCTGTTGA CTGGTCAT-3’).
The following primers were used to investigate genesidentified as deregulated in oral cancer (data not shown):GATA3 (forward 5’-CGTCCTGTGCGAACTGTCA-3’ andreverse 5’-GTCCCCATTGGCATTCCTCC-3’), NOTCH1 (for-ward 5’-GGTGAACTGCTCTGAGGAGATC-3’ and reverse5’-GGATTGCAGTCGTCCACGTTGA-3’), E2F1 (forward5’-CATCCCAGGTCACTTCTG-3’ and reverse 5’-GACAACAGCGGTTCTTGCTC-3’), and WISP3 (forward 5’-ACTGTAGCCTGGAACCATTACT-3’ and reverse 5’-TGGTCACCCTGTTAGATATTCCC-3’).
All RT-qPCR reactions were performed in total volume of25 mL, containing 1 mL of cDNA sample, 400 nM of eachprimer, 12.5 mL of SYBR Green Master Mix (Applied Biosys-tems). The PCR amplifications were performed under thefollowing conditions: initial denaturation for 10 minutes at958C, followed by 40 cycles of 10 seconds at 958C and 1minute at 608C. Melting curve analysis was performed at theend of each cycling to confirm amplification specificity and lackof primer dimer. Quantitative analysis was performed accordingto the Pfaffl mathematical model.29
The differential expression of PROX1 in OSCC sampleswas divided into high and low according to the value obtainedfrom RT-qPCR normalized with the respective tumor-freemargins. The cut-off value was set up at the median expressionlevel of OSCC samples.
Gene Amplification AssayGene amplification analysis of the OSCC tissue and tumor-
free margins was performed by qPCR using an Applied Bio-systems 7500 Real-Time PCR System with SYBR Green I Dye.The following primers were used to detect PROX1 (F: 5’-AGCCTCCGTGGAACTCAGC-3’ and R: 5’-CCACCAGCAGGAAAGAGAAA-3’) and ZNF80 (F: 5’-CTGTGACCTGCAGCTCATCCT-3’ and R: 5’-TAAGTTCTCTGACGTTGACTGATGTG-3’). ZNF80 was used as a reference gene tonormalize the qPCR data.30 Next, both primer sets generatedwere validated in silico. Quantitative analysis was per-formed according to Terribas et al.29,31 Briefly, we calculatedthe DCq value for the difference between the unknown andcalibrator samples. The relative quantity was calculated asRQ¼E-DCq and the normalized relative quantity (NRQ) asNRQ¼ RQPROX1/RQZNF80. Further, we calculated relativecopy number (RCN) as RCN¼NRQ/RF, where RF is rescal-ing factor, which is the geometric mean of the NRQ values ofa set of 17 normal oral mucosa bearing 2 PROX1 copies.
Medicine � Volume 93, Number 28, December 2014
RCN values close to 1 indicate the presence of 2 PROX1copies and RCN values >1 indicate PROX1 positive amplifica-tion.
# 2014 Lippincott Williams & Wilkins
Methylation AssayMethylation status of PROX1 in OSCC tissue and tumor-
free margins was evaluated by the EpiTect Methyl CustomqPCR Array technology according to the manufacturer’sinstructions (Qiagen, Valencia, CA). Thirty fresh OSCCsamples and 17 corresponding nonneoplastic margins weretreated with a simple DNA methylation-sensitive andmethylation-dependent restriction enzyme digestion withoutbisulfite conversion. After digestion, the remaining DNA wasquantified using DNA methylation real-time PCR arrays inan ABI 7500 Real-time system. Methylation status wasexpressed as percentage of inputted DNA that was methy-lated as determined using EpiTect Methyl DNA methylationPCR data analysis (Qiagen, http://www.sabiosciences.com/dna_methylation_data_ analysis.php), following the manu-facturer’s instructions. The methylated DNA status in thesamples was divided into 2 groups based on the followingcut-off values: >50% (hypermethylated) or <50% (hypo-methylated).
ImmunohistochemistryImmunohistochemical analysis of PROX1 protein expres-
sion was performed using the polymer-linked method in 30OSCC samples and 8 nonneoplastic tissues. Four-mm-thick tissuesections were cut, deparaffinized, and subjected to antigenrecovery treatment with 1 mM EDTA buffer target retrievalsolution, pH 8.0 at 958C, in a water bath for 20 minutes.Endogenous peroxidase activity was blocked by incubating withphosphate-buffered saline (PBS) and 3% hydrogen peroxidase for30 minutes. After washing with PBS, the sections were treatedwith protein block (Dako, X0909, Carpinteria, CA) and thenincubated with monoclonal rabbit anti-PROX1 (Abcam, clone5G10, Cambridge, UK) diluted 1:50, followed by the EnvisionDual Link System horseradish peroxidase (HRP) method (Dako,K4061). Reactions were initiated by incubating the sections with3,3’-diaminobenzidine tetrahydrochloride (Dako, K3468). Thenegative controls were obtained by substituting the primaryantibody with nonimmune serum. To quantify PROX1 proteinexpression in OSCC samples and nonneoplastic margins, immu-nohistochemistry (IHC) scores were used as described by Yama-toji et al,32 with minor modifications. Next, the percentage ofPROX-1 positive epithelial cells was evaluated at x100 magni-fication throughout each entire section and scored as follows: 1,0% to 25%; 2, 25% to 50%; 3, 25% to 75%; and 4, 75% to 100%.PROX1 immunoreaction intensity was also scored as 1, weak; 2,moderate; and 3, intense. The percentage of PROX1 positivetumor cells and staining intensity were then multiplied to obtaineach PROX1 IHC score. We considered these samples positivewhen PROX1 IHC score was >7.37 (average score for nonneo-plastic margins).
Western BlottingCells were lysed in RIPA buffer (50 mM Tris–HCl pH 7.4,
150 mM NaCl, 1 mM EDTA, 1% NP-40, 1% deoxycholic acid,0.5% sodium dodecyl sulfate, 1 mM phenylmethylsulfonylfluoride, 1 mM N-ethylmaleimide, 1 mM dithiothreitol, 10 mg/mL soybean trypsin inhibitor, 1 mg/mL leupeptin, and 1 mg/mLaprotinin). We revealed 30 mg of total protein per sample using8% sodium dodecyl sulfate (SDS) polyacrylamide gel electro-phoresis. The primary antibody to detect PROX-1 (Abcam, clone
Medicine � Volume 93, Number 28, December 2014
5G10), p21 (Abcam, ab7960), cyclin D1 (Santa Cruz, sc-20044,Dallas, Texas, USA) and actin (Sigma, clone CA-74) wereincubated overnight at 48-C at the dilution 1:300. The
# 2014 Lippincott Williams & Wilkins
nitrocellulose membranes were developed using a chemilumi-nescent Western blot system (Enhanced Chemiluminescent Wes-tern blot kit; GE Healthcare, Vienna, Austria).
Bromodeoxyuridine Labeling IndexCells were plated in chamber slides (30,000 cells/well) and
serum starved for 48 hours. Next, cell culture medium supple-mented with 10% FBS was added for 24 hours followed bybromodeoxyuridine reagent incubation for 2 hours at 378C.Bromodeoxyuridine (BrdU) incorporation in proliferating cellswas estimated using an immunohistochemical analysis kit(Invitrogen, BrdU Staining Kit). The BrdU-labeling index,expressed as the percentage of cells labeled with BrdU, wasdetermined by counting 1000 cells in 3 independent reactionsusing the Kontron 400 image analysis system (Zeiss AxioImager A1, Dublin, California, USA).
Ki-67 IndexCells were cultured as described above and fixed after
incubation with culture medium supplemented with 10% FBSfor 24 hours. Cells were incubated with monoclonal antibodiesagainst Ki-67 (Clone MIB-5, Dako), followed by the EnvisionDual Link System HRP (Dako). The Ki-67 index was calculatedusing an image analysis system by counting labeled nuclei of1000 cells in 3 independent reactions, expressed as percentageof Ki-67-positive cells.
Proliferation CurvesCells were seeded in 24-well plates in DMEM/F12 con-
taining 10% FBS and incubated in serum-free medium for 48hours. After this period, DMEM/F12 10% FBS was added backand cells from triplicate wells were trypsinized after 24, 48, 72,96, 120, and 144 hours and counted in the Neubauer chamber.
Flow CytometryFor cell cycle analysis, SCC9 cells were seeded in 100-mm
dishes and serum starved for 48 hours. Next, the cell culturemedium supplemented with 10% FBS was added and the cellswere collected after 24 hours. Cells were fixed in cold 70%ethanol, stored at �208C, washed in cold PBS, and treated with10 mg/mL of RNase for 1 hour at 378C. After staining with 50 mg/mL of propidium iodide for 2 hours at 48C, cell distribution in thecell cycle was analyzed by flow cytometry.
Cells were analyzed on a FACSCalibur flow cytometerequipped with an argon laser (Becton-Dickinson, San Jose,CA). At least 10,000 events were analyzed in each sample.Quantitative flow cytometric analysis was performed usingCellQuest software (Becton-Dickinson).
ImmunocytochemistryImmunostaining was performed on cytokeratins (CK) 1, 10,
13, 14, 16, 18, and 19 using the Envision Dual Link System HRP(Dako, K4061). Cells were incubated with mouse anti-CK10(1:100, DEK-10, BioGenex, Fremont, California, USA), anti-CK16 (1:300, ab8741, Abcam), anti-CK18 (1:1500, DC10,Dako), anti-CK19 (1:2000, RCK108, Dako), rabbit anti-CK1(1:200, ab24643, Abcam), anti-CK13 (1:100, ab92551, Abcam),and anti-CK14 (1:2000, ab7800, Abcam) followed by the poly-mer-link method. The slides were scanned into high-resolutionimages using an Aperio ScanScope XT (Aperio Technology, Inc),
PROX1 Gene in Oral Cancer
Vista, CA). The images were then viewed in an Image Scope(Aperio Technology, Inc) and immunostaining was quantifiedusing the Positive Pixel Count algorithm, v9 (Aperio).
www.md-journal.com | 3
Apoptosis AnalysisApoptosis index was determined by annexin V-FITC label-
ing. The cells were collected, washed with PBS, and resuspendedin the binding buffer (10 mM HEPES pH 7.4, 150 mM NaCl,5 mM KCl, 1 mM MgCl2, and 1.8 mM CaCl2) containing annexinV-FITC at 1:500. After 20 minutes incubation in the dark at roomtemperature, the cells were also stained with propidium iodide(PI, Sigma-Aldrich). Apoptosis was analyzed on a FACSCaliburflow cytometer equipped with an argon laser (Becton Dickinson)and quantified as the number of annexin V-FITC positive and PInegative cells divided by the total number of cells. At least 10,000events were analyzed in each sample.
Migration and Invasion AssaysThe in vitro cell migration and invasion assays were per-
formed in 24-well plates (Corning, Inc, New York, NY) usingmodified Boyden chamber inserts with a polycarbonate filtermembrane containing 8-mm pores. For the invasion assay, the BDBioCoat Matrigel Invasion Chamber was used in 24-well plates(BD Biosciences). The cells (1� 105) were suspended in 200 mLof serum-free DMEM/F12 and seeded onto the upper compart-ment of the transwell chamber and DMEM/F12 containing 10%FBS was used in the lower chamber for stimulation. After 24hours of incubation for the migration and invasion analysis, themedium in the upper chamber was removed, and the filters werefixed in 4% paraformaldehyde following 20 minutes in methanol100%. The cells on the lower surface were stained with toluidineblue solution in 1% borax for 15 minutes. A cotton swabmechanically removed cells that did not migrate through thepores. The die was eluted using 1% SDS and the absorbance wasmeasured at 560 nm. Two independent experiments were per-formed with triplicates.
Statistical AnalysisTo analyze PROX1 mRNA expression levels in tissue
samples and OSCC cell lines, we used Wilcoxon nonparametrictest and one-way analysis of variance (ANOVA) with Tukey post-test, respectively. The different PROX1 expression levels in tissuesamples were divided into 2 groups (high vs low) and the medianexpression level was used as the cut-off value. We used one-wayANOVAwith Tukey post-test to analyze proliferation of PROX1-overexpressing SCC9 and control cells, CK immunoexpression,and apoptosis index. We used Fisher exact test to estimate thestatistical difference between PROX1 gene expression levels andclinicopathological parameters such as mean age, tumor location,tumor size-pT, nodal metastasis-pN, pathological grade, lym-phatic and/or perineural invasion, and recurrence. When clinicalinformation was not described in the files, it was considered asmissing data. Kaplan–Meier product-limit estimation with log-rank (P< 0.05) was used for survival analysis from lifetime dataaccording to gene expression levels. The GraphPad Prism 5statistical package (GraphPad Software, Inc, La Jolla, CA,USA) was used for statistical analysis.
RESULTS
PROX1 Gene and Protein Expression isDownregulated in OSCC Compared With NormalOral Mucosa
Rodrigues et al
We performed RT-qPCR amplifications on 40 fresh sur-gical samples of primary OSCC and their corresponding non-neoplastic margin tissues and OSCC cell lines to assess the
4 | www.md-journal.com
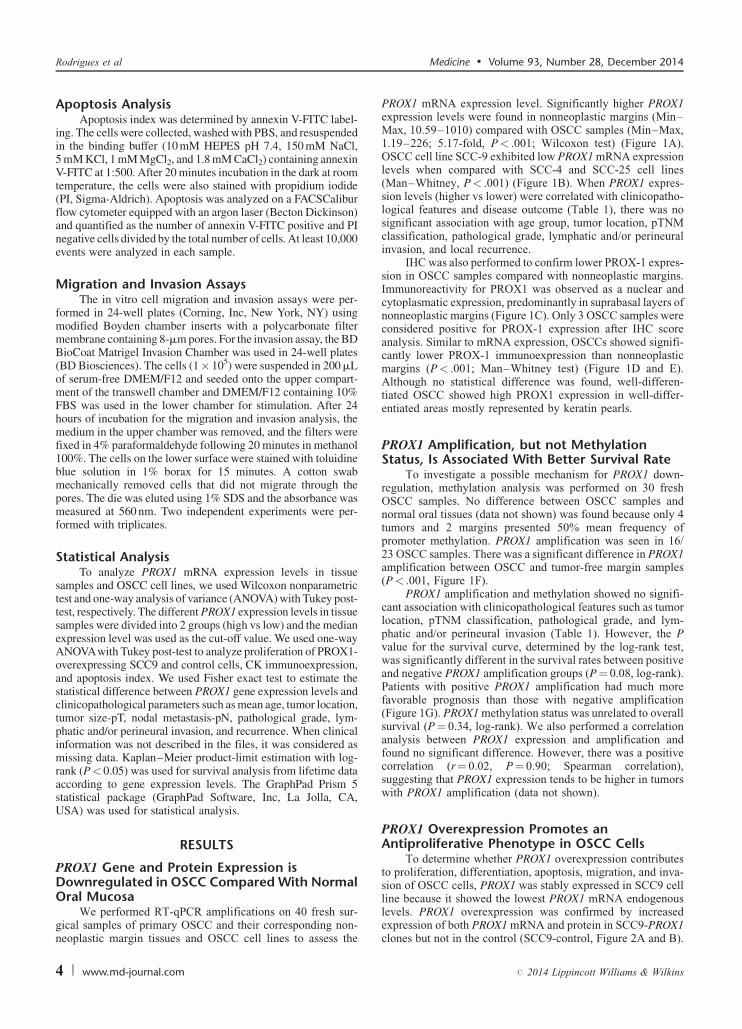
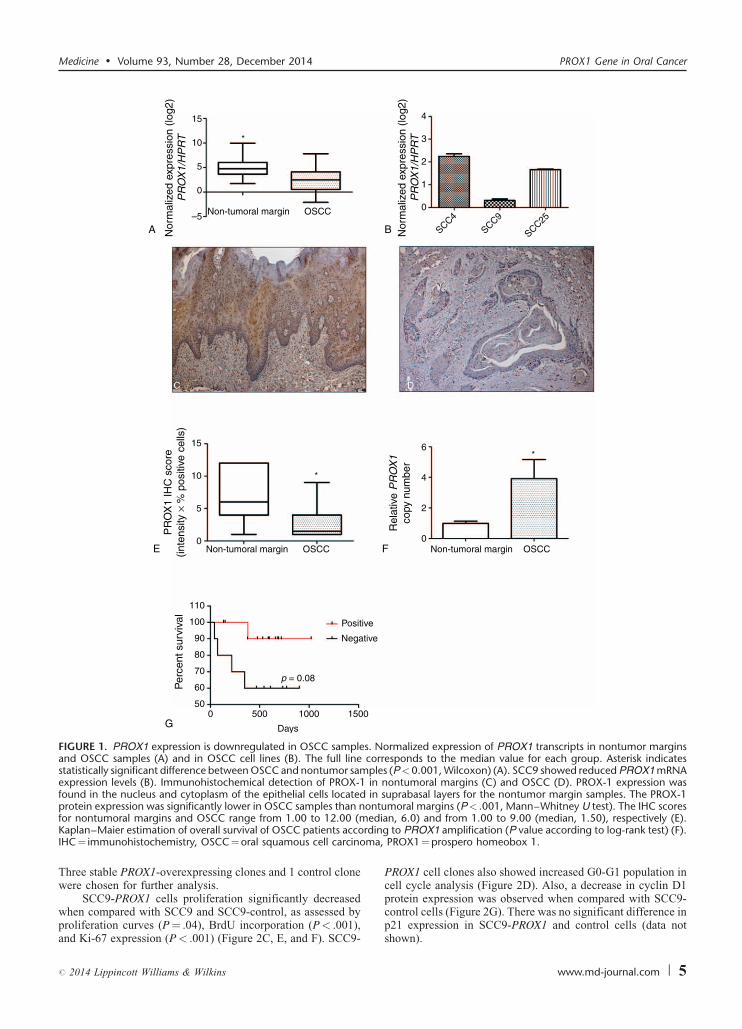
PROX1 mRNA expression level. Significantly higher PROX1expression levels were found in nonneoplastic margins (Min–Max, 10.59–1010) compared with OSCC samples (Min–Max,1.19–226; 5.17-fold, P< .001; Wilcoxon test) (Figure 1A).OSCC cell line SCC-9 exhibited low PROX1 mRNA expressionlevels when compared with SCC-4 and SCC-25 cell lines(Man–Whitney, P< .001) (Figure 1B). When PROX1 expres-sion levels (higher vs lower) were correlated with clinicopatho-logical features and disease outcome (Table 1), there was nosignificant association with age group, tumor location, pTNMclassification, pathological grade, lymphatic and/or perineuralinvasion, and local recurrence.
IHC was also performed to confirm lower PROX-1 expres-sion in OSCC samples compared with nonneoplastic margins.Immunoreactivity for PROX1 was observed as a nuclear andcytoplasmatic expression, predominantly in suprabasal layers ofnonneoplastic margins (Figure 1C). Only 3 OSCC samples wereconsidered positive for PROX-1 expression after IHC scoreanalysis. Similar to mRNA expression, OSCCs showed signifi-cantly lower PROX-1 immunoexpression than nonneoplasticmargins (P< .001; Man–Whitney test) (Figure 1D and E).Although no statistical difference was found, well-differen-tiated OSCC showed high PROX1 expression in well-differ-entiated areas mostly represented by keratin pearls.
PROX1 Amplification, but not MethylationStatus, Is Associated With Better Survival Rate
To investigate a possible mechanism for PROX1 down-regulation, methylation analysis was performed on 30 freshOSCC samples. No difference between OSCC samples andnormal oral tissues (data not shown) was found because only 4tumors and 2 margins presented 50% mean frequency ofpromoter methylation. PROX1 amplification was seen in 16/23 OSCC samples. There was a significant difference in PROX1amplification between OSCC and tumor-free margin samples(P< .001, Figure 1F).
PROX1 amplification and methylation showed no signifi-cant association with clinicopathological features such as tumorlocation, pTNM classification, pathological grade, and lym-phatic and/or perineural invasion (Table 1). However, the Pvalue for the survival curve, determined by the log-rank test,was significantly different in the survival rates between positiveand negative PROX1 amplification groups (P¼ 0.08, log-rank).Patients with positive PROX1 amplification had much morefavorable prognosis than those with negative amplification(Figure 1G). PROX1 methylation status was unrelated to overallsurvival (P¼ 0.34, log-rank). We also performed a correlationanalysis between PROX1 expression and amplification andfound no significant difference. However, there was a positivecorrelation (r¼ 0.02, P¼ 0.90; Spearman correlation),suggesting that PROX1 expression tends to be higher in tumorswith PROX1 amplification (data not shown).
PROX1 Overexpression Promotes anAntiproliferative Phenotype in OSCC Cells
To determine whether PROX1 overexpression contributesto proliferation, differentiation, apoptosis, migration, and inva-sion of OSCC cells, PROX1 was stably expressed in SCC9 cellline because it showed the lowest PROX1 mRNA endogenous
Medicine � Volume 93, Number 28, December 2014
levels. PROX1 overexpression was confirmed by increasedexpression of both PROX1 mRNA and protein in SCC9-PROX1clones but not in the control (SCC9-control, Figure 2A and B).
# 2014 Lippincott Williams & Wilkins
15
10
5
0
–5 Non-tumoral margin OSCC
Non-tumoral margin OSCC Non-tumoral margin OSCC
Nor
mal
ized
exp
ress
ion
(log2
)P
RO
X1/
HP
RT
PR
OX
1 IH
C s
core
(inte
nsity
× %
pos
itive
cel
ls)
Rel
ativ
e P
RO
X1
copy
num
ber
4
3
2
1
0
0
5
10
15
0
2
4
6
SCC4
SCC9
SCC25
Nor
mal
ized
exp
ress
ion
(log2
)P
RO
X1/
HP
RT
Positive
Negative
Days
Per
cent
sur
viva
l
p = 0.08
0 500 1000 150050
60
70
80
90
100
110
*
*
*
A B
E
G
F
C D
FIGURE 1. PROX1 expression is downregulated in OSCC samples. Normalized expression of PROX1 transcripts in nontumor marginsand OSCC samples (A) and in OSCC cell lines (B). The full line corresponds to the median value for each group. Asterisk indicatesstatistically significant difference between OSCC and nontumor samples (P<0.001, Wilcoxon) (A). SCC9 showed reduced PROX1 mRNAexpression levels (B). Immunohistochemical detection of PROX-1 in nontumoral margins (C) and OSCC (D). PROX-1 expression wasfound in the nucleus and cytoplasm of the epithelial cells located in suprabasal layers for the nontumor margin samples. The PROX-1protein expression was significantly lower in OSCC samples than nontumoral margins (P< .001, Mann–Whitney U test). The IHC scores
edidinma,
Medicine � Volume 93, Number 28, December 2014 PROX1 Gene in Oral Cancer
Three stable PROX1-overexpressing clones and 1 control clonewere chosen for further analysis.
SCC9-PROX1 cells proliferation significantly decreased
for nontumoral margins and OSCC range from 1.00 to 12.00 (mKaplan–Maier estimation of overall survival of OSCC patients accorIHC¼ immunohistochemistry, OSCC¼oral squamous cell carcino
when compared with SCC9 and SCC9-control, as assessed byproliferation curves (P¼ .04), BrdU incorporation (P< .001),and Ki-67 expression (P< .001) (Figure 2C, E, and F). SCC9-
# 2014 Lippincott Williams & Wilkins
PROX1 cell clones also showed increased G0-G1 population incell cycle analysis (Figure 2D). Also, a decrease in cyclin D1protein expression was observed when compared with SCC9-
an, 6.0) and from 1.00 to 9.00 (median, 1.50), respectively (E).g to PROX1 amplification (P value according to log-rank test) (F).PROX1¼prospero homeobox 1.
control cells (Figure 2G). There was no significant difference inp21 expression in SCC9-PROX1 and control cells (data notshown).
www.md-journal.com | 5
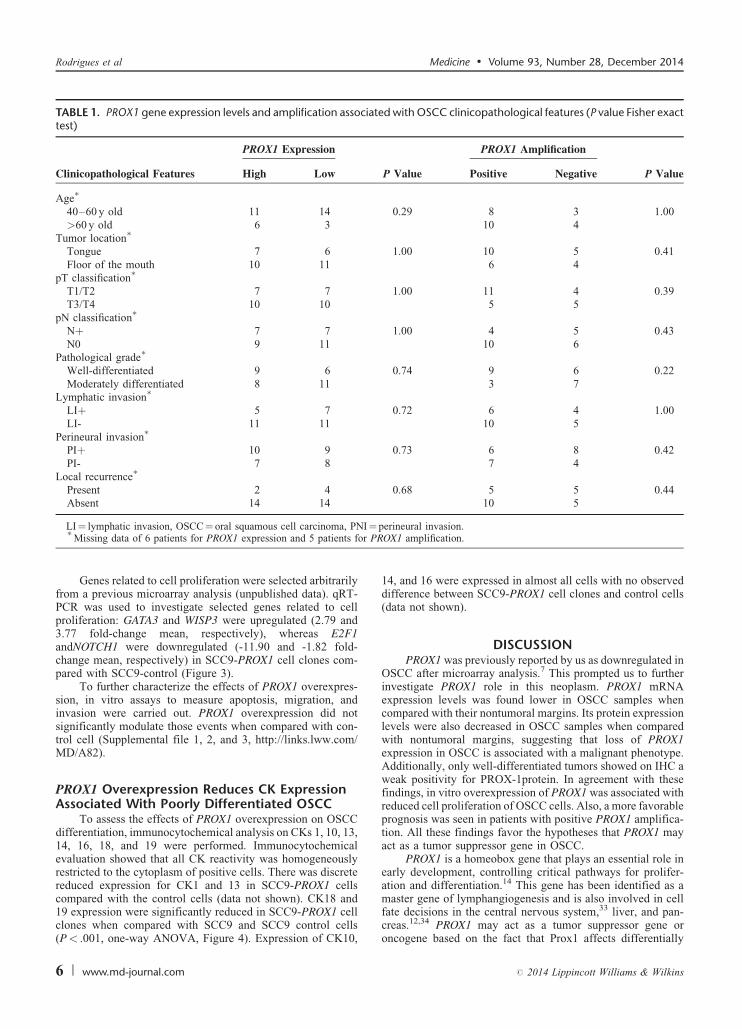
TABLE 1. PROX1 gene expression levels and amplification associated with OSCC clinicopathological features (P value Fisher exacttest)
PROX1 Expression PROX1 Amplification
Clinicopathological Features High Low P Value Positive Negative P Value
Age�
40–60 y old 11 14 0.29 8 3 1.00>60 y old 6 3 10 4
Tumor location�
Tongue 7 6 1.00 10 5 0.41Floor of the mouth 10 11 6 4
pT classification�
T1/T2 7 7 1.00 11 4 0.39T3/T4 10 10 5 5
pN classification�
Nþ 7 7 1.00 4 5 0.43N0 9 11 10 6
Pathological grade�
Well-differentiated 9 6 0.74 9 6 0.22Moderately differentiated 8 11 3 7
Lymphatic invasion�
LIþ 5 7 0.72 6 4 1.00LI- 11 11 10 5
Perineural invasion�
PIþ 10 9 0.73 6 8 0.42PI- 7 8 7 4
Local recurrence�
Present 2 4 0.68 5 5 0.44Absent 14 14 10 5
I¼r PR
Rodrigues et al Medicine � Volume 93, Number 28, December 2014
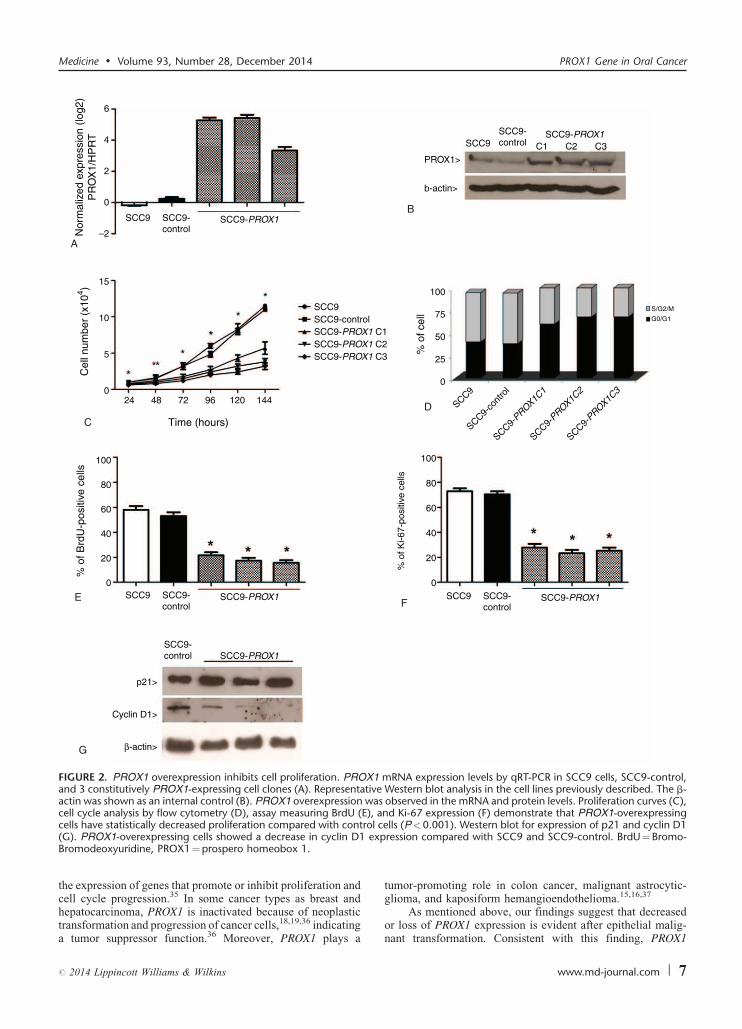
Genes related to cell proliferation were selected arbitrarilyfrom a previous microarray analysis (unpublished data). qRT-PCR was used to investigate selected genes related to cellproliferation: GATA3 and WISP3 were upregulated (2.79 and3.77 fold-change mean, respectively), whereas E2F1andNOTCH1 were downregulated (-11.90 and -1.82 fold-change mean, respectively) in SCC9-PROX1 cell clones com-pared with SCC9-control (Figure 3).
To further characterize the effects of PROX1 overexpres-sion, in vitro assays to measure apoptosis, migration, andinvasion were carried out. PROX1 overexpression did notsignificantly modulate those events when compared with con-trol cell (Supplemental file 1, 2, and 3, http://links.lww.com/MD/A82).
PROX1 Overexpression Reduces CK ExpressionAssociated With Poorly Differentiated OSCC
To assess the effects of PROX1 overexpression on OSCCdifferentiation, immunocytochemical analysis on CKs 1, 10, 13,14, 16, 18, and 19 were performed. Immunocytochemicalevaluation showed that all CK reactivity was homogeneouslyrestricted to the cytoplasm of positive cells. There was discretereduced expression for CK1 and 13 in SCC9-PROX1 cellscompared with the control cells (data not shown). CK18 and
LI¼ lymphatic invasion, OSCC¼ oral squamous cell carcinoma, PN�Missing data of 6 patients for PROX1 expression and 5 patients fo
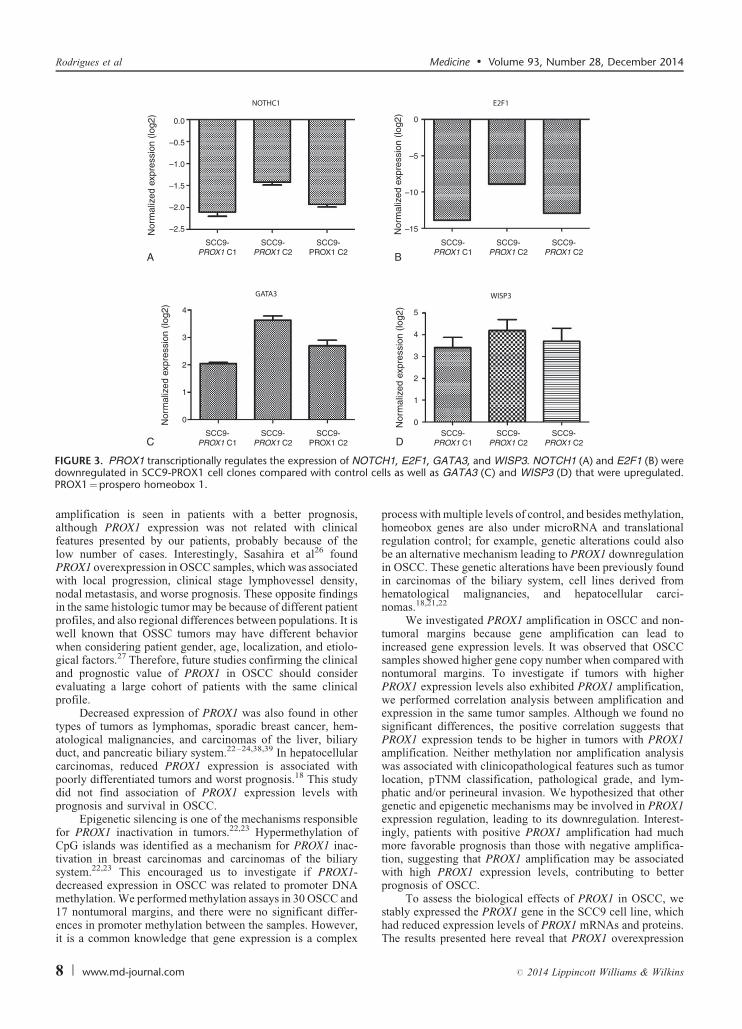
19 expression were significantly reduced in SCC9-PROX1 cellclones when compared with SCC9 and SCC9 control cells(P< .001, one-way ANOVA, Figure 4). Expression of CK10,
6 | www.md-journal.com
14, and 16 were expressed in almost all cells with no observeddifference between SCC9-PROX1 cell clones and control cells(data not shown).
DISCUSSIONPROX1 was previously reported by us as downregulated in
OSCC after microarray analysis.7 This prompted us to furtherinvestigate PROX1 role in this neoplasm. PROX1 mRNAexpression levels was found lower in OSCC samples whencompared with their nontumoral margins. Its protein expressionlevels were also decreased in OSCC samples when comparedwith nontumoral margins, suggesting that loss of PROX1expression in OSCC is associated with a malignant phenotype.Additionally, only well-differentiated tumors showed on IHC aweak positivity for PROX-1protein. In agreement with thesefindings, in vitro overexpression of PROX1 was associated withreduced cell proliferation of OSCC cells. Also, a more favorableprognosis was seen in patients with positive PROX1 amplifica-tion. All these findings favor the hypotheses that PROX1 mayact as a tumor suppressor gene in OSCC.
PROX1 is a homeobox gene that plays an essential role inearly development, controlling critical pathways for prolifer-ation and differentiation.14 This gene has been identified as amaster gene of lymphangiogenesis and is also involved in cell
perineural invasion.OX1 amplification.
fate decisions in the central nervous system,33 liver, and pan-creas.12,34 PROX1 may act as a tumor suppressor gene oroncogene based on the fact that Prox1 affects differentially
# 2014 Lippincott Williams & Wilkins
0
0
25
50
75
100
0
Time (hours)
24 48 72 96 120 144
5
10
Cel
l num
ber
(x10
4 )
% o
f cel
l
15
–2
0
2
4
6
20
40
60
80
100
% o
f Brd
U-p
ositi
ve c
ells
0
20
40
60
80
100
% o
f Ki-6
7-po
sitiv
e ce
lls
SCC9 SCC9-control
SCC9-control
SCC9-PROX1
SCC9 SCC9-controlN
orm
aliz
ed e
xpre
ssio
n (lo
g2)
PR
OX
1/H
PR
T
SCC9-PROX1
SCC9
SCC9
SCC9-control
SCC9-PROX1
PROX1>
b-actin>
β-actin>
Cyclin D1>
p21>
SCC9
SCC9-co
ntro
l
SCC9-PROX1C
1
SCC9-PROX1C
2
SCC9-PROX1C
3
SCC9SCC9-controlSCC9-PROX1 C1SCC9-PROX1 C2SCC9-PROX1 C3
SCC9-PROX1
SCC9-control
SCC9-PROX1C1 C2 C3
S/G2/M
G0/G1
A
B
C
D
E F
G
FIGURE 2. PROX1 overexpression inhibits cell proliferation. PROX1 mRNA expression levels by qRT-PCR in SCC9 cells, SCC9-control,and 3 constitutively PROX1-expressing cell clones (A). Representative Western blot analysis in the cell lines previously described. The b-actin was shown as an internal control (B). PROX1 overexpression was observed in the mRNA and protein levels. Proliferation curves (C),cell cycle analysis by flow cytometry (D), assay measuring BrdU (E), and Ki-67 expression (F) demonstrate that PROX1-overexpressing
ol cexp
Medicine � Volume 93, Number 28, December 2014 PROX1 Gene in Oral Cancer
the expression of genes that promote or inhibit proliferation andcell cycle progression.35 In some cancer types as breast and
cells have statistically decreased proliferation compared with contr(G). PROX1-overexpressing cells showed a decrease in cyclin D1Bromodeoxyuridine, PROX1¼prospero homeobox 1.
hepatocarcinoma, PROX1 is inactivated because of neoplastictransformation and progression of cancer cells,18,19,36 indicatinga tumor suppressor function.36 Moreover, PROX1 plays a
# 2014 Lippincott Williams & Wilkins
tumor-promoting role in colon cancer, malignant astrocytic-glioma, and kaposiform hemangioendothelioma.15,16,37
ells (P<0.001). Western blot for expression of p21 and cyclin D1ression compared with SCC9 and SCC9-control. BrdU¼Bromo-
As mentioned above, our findings suggest that decreasedor loss of PROX1 expression is evident after epithelial malig-nant transformation. Consistent with this finding, PROX1
www.md-journal.com | 7
Nor
mal
ized
exp
ress
ion
(log2
)N
orm
aliz
ed e
xpre
ssio
n (lo
g2)
Nor
mal
ized
exp
ress
ion
(log2
)
Nor
mal
ized
exp
ress
ion
(log2
)
NOTHC1 E2F1
GATA3 WISP3
–10
–5
–15
0
1
2
3
4
0
5
2
1
3
0
4
–2.0
–1.5
–1.0
–0.5
–2.5
0.0
SCC9-PROX1 C1
SCC9-PROX1 C2
SCC9-PROX1 C2
SCC9-PROX1 C1
SCC9-PROX1 C2
SCC9-PROX1 C2
SCC9-PROX1 C1
SCC9-PROX1 C2
SCC9-PROX1 C2
SCC9-PROX1 C1
SCC9-PROX1 C2
SCC9-PROX1 C2
A B
C D
TCl ce
Rodrigues et al Medicine � Volume 93, Number 28, December 2014
amplification is seen in patients with a better prognosis,although PROX1 expression was not related with clinicalfeatures presented by our patients, probably because of thelow number of cases. Interestingly, Sasahira et al26 foundPROX1 overexpression in OSCC samples, which was associatedwith local progression, clinical stage lymphovessel density,nodal metastasis, and worse prognosis. These opposite findingsin the same histologic tumor may be because of different patientprofiles, and also regional differences between populations. It iswell known that OSSC tumors may have different behaviorwhen considering patient gender, age, localization, and etiolo-gical factors.27 Therefore, future studies confirming the clinicaland prognostic value of PROX1 in OSCC should considerevaluating a large cohort of patients with the same clinicalprofile.
Decreased expression of PROX1 was also found in othertypes of tumors as lymphomas, sporadic breast cancer, hem-atological malignancies, and carcinomas of the liver, biliaryduct, and pancreatic biliary system.22–24,38,39 In hepatocellularcarcinomas, reduced PROX1 expression is associated withpoorly differentiated tumors and worst prognosis.18 This studydid not find association of PROX1 expression levels withprognosis and survival in OSCC.
Epigenetic silencing is one of the mechanisms responsiblefor PROX1 inactivation in tumors.22,23 Hypermethylation ofCpG islands was identified as a mechanism for PROX1 inac-tivation in breast carcinomas and carcinomas of the biliarysystem.22,23 This encouraged us to investigate if PROX1-decreased expression in OSCC was related to promoter DNAmethylation. We performed methylation assays in 30 OSCC and
FIGURE 3. PROX1 transcriptionally regulates the expression of NOdownregulated in SCC9-PROX1 cell clones compared with controPROX1¼prospero homeobox 1.
17 nontumoral margins, and there were no significant differ-ences in promoter methylation between the samples. However,it is a common knowledge that gene expression is a complex
8 | www.md-journal.com
process with multiple levels of control, and besides methylation,homeobox genes are also under microRNA and translationalregulation control; for example, genetic alterations could alsobe an alternative mechanism leading to PROX1 downregulationin OSCC. These genetic alterations have been previously foundin carcinomas of the biliary system, cell lines derived fromhematological malignancies, and hepatocellular carci-nomas.18,21,22
We investigated PROX1 amplification in OSCC and non-tumoral margins because gene amplification can lead toincreased gene expression levels. It was observed that OSCCsamples showed higher gene copy number when compared withnontumoral margins. To investigate if tumors with higherPROX1 expression levels also exhibited PROX1 amplification,we performed correlation analysis between amplification andexpression in the same tumor samples. Although we found nosignificant differences, the positive correlation suggests thatPROX1 expression tends to be higher in tumors with PROX1amplification. Neither methylation nor amplification analysiswas associated with clinicopathological features such as tumorlocation, pTNM classification, pathological grade, and lym-phatic and/or perineural invasion. We hypothesized that othergenetic and epigenetic mechanisms may be involved in PROX1expression regulation, leading to its downregulation. Interest-ingly, patients with positive PROX1 amplification had muchmore favorable prognosis than those with negative amplifica-tion, suggesting that PROX1 amplification may be associatedwith high PROX1 expression levels, contributing to betterprognosis of OSCC.
To assess the biological effects of PROX1 in OSCC, we
H1, E2F1, GATA3, and WISP3. NOTCH1 (A) and E2F1 (B) werells as well as GATA3 (C) and WISP3 (D) that were upregulated.
stably expressed the PROX1 gene in the SCC9 cell line, whichhad reduced expression levels of PROX1 mRNAs and proteins.The results presented here reveal that PROX1 overexpression
# 2014 Lippincott Williams & Wilkins
A B
C D
E F
100
80
60
40
20
0
SCC9
% e
xpre
ssio
n of
CK
18
SCC9-control
SCC9-PROX1
* * *
**
*
100
80
60
40
20
0
SCC9
% e
xpre
ssio
n of
CK
19
SCC9-control
SCC9-PROX1
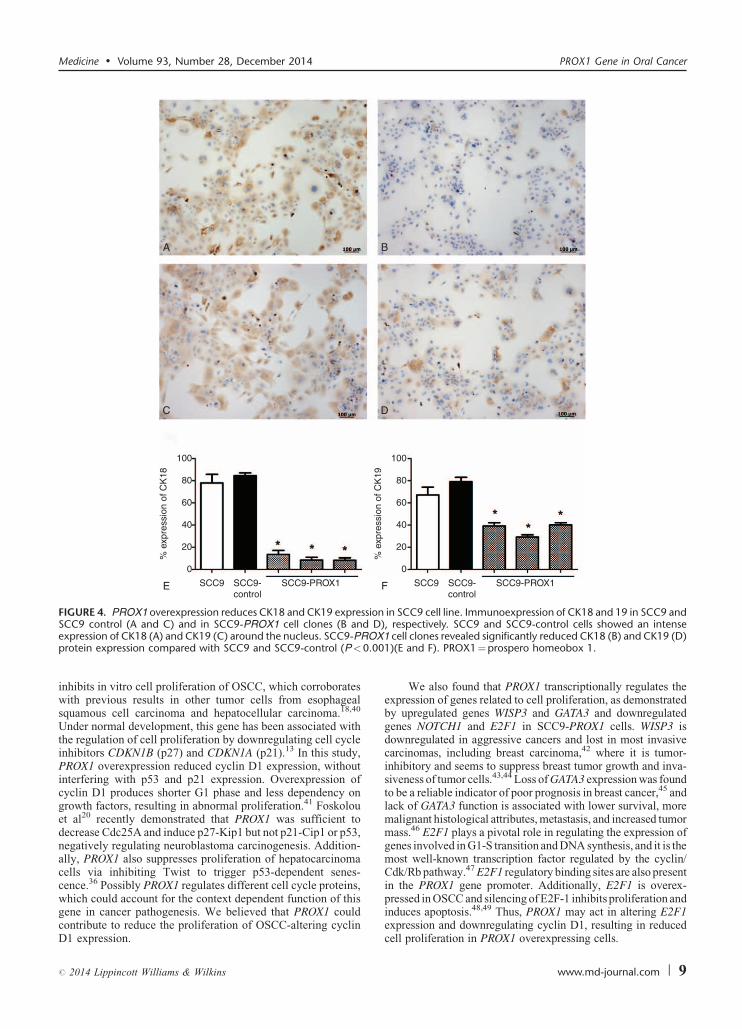
FIGURE 4. PROX1 overexpression reduces CK18 and CK19 expression in SCC9 cell line. Immunoexpression of CK18 and 19 in SCC9 andD
OX.00
Medicine � Volume 93, Number 28, December 2014 PROX1 Gene in Oral Cancer
inhibits in vitro cell proliferation of OSCC, which corroborateswith previous results in other tumor cells from esophagealsquamous cell carcinoma and hepatocellular carcinoma.18,40
Under normal development, this gene has been associated withthe regulation of cell proliferation by downregulating cell cycleinhibitors CDKN1B (p27) and CDKN1A (p21).13 In this study,PROX1 overexpression reduced cyclin D1 expression, withoutinterfering with p53 and p21 expression. Overexpression ofcyclin D1 produces shorter G1 phase and less dependency ongrowth factors, resulting in abnormal proliferation.41 Foskolouet al20 recently demonstrated that PROX1 was sufficient todecrease Cdc25A and induce p27-Kip1 but not p21-Cip1 or p53,negatively regulating neuroblastoma carcinogenesis. Addition-ally, PROX1 also suppresses proliferation of hepatocarcinomacells via inhibiting Twist to trigger p53-dependent senes-cence.36 Possibly PROX1 regulates different cell cycle proteins,which could account for the context dependent function of this
SCC9 control (A and C) and in SCC9-PROX1 cell clones (B andexpression of CK18 (A) and CK19 (C) around the nucleus. SCC9-PRprotein expression compared with SCC9 and SCC9-control (P<0
gene in cancer pathogenesis. We believed that PROX1 couldcontribute to reduce the proliferation of OSCC-altering cyclinD1 expression.
# 2014 Lippincott Williams & Wilkins
We also found that PROX1 transcriptionally regulates theexpression of genes related to cell proliferation, as demonstratedby upregulated genes WISP3 and GATA3 and downregulatedgenes NOTCH1 and E2F1 in SCC9-PROX1 cells. WISP3 isdownregulated in aggressive cancers and lost in most invasivecarcinomas, including breast carcinoma,42 where it is tumor-inhibitory and seems to suppress breast tumor growth and inva-siveness of tumor cells.43,44 Loss of GATA3 expression was foundto be a reliable indicator of poor prognosis in breast cancer,45 andlack of GATA3 function is associated with lower survival, moremalignant histological attributes, metastasis, and increased tumormass.46 E2F1 plays a pivotal role in regulating the expression ofgenes involved in G1-S transition and DNA synthesis, and it is themost well-known transcription factor regulated by the cyclin/Cdk/Rb pathway.47 E2F1 regulatory binding sites are also presentin the PROX1 gene promoter. Additionally, E2F1 is overex-pressed in OSCC and silencing of E2F-1 inhibits proliferation and
), respectively. SCC9 and SCC9-control cells showed an intense1 cell clones revealed significantly reduced CK18 (B) and CK19 (D)1)(E and F). PROX1¼prospero homeobox 1.
induces apoptosis.48,49 Thus, PROX1 may act in altering E2F1expression and downregulating cyclin D1, resulting in reducedcell proliferation in PROX1 overexpressing cells.
www.md-journal.com | 9
CKs are structural components of the epithelial cytoske-leton and constitute major proteins for cellular differentiation.Alterations in the expression pattern of some specific CKs havebeen reported to contribute to progression of OSCC.50,51
PROX1 overexpressing cells showed significantly reducedexpression of CK18 and CK19. These CKs were previouslyassociated with worse prognosis, poorer pathologic differen-tiation grade, tumor recurrence, and metastasis to lymph nodesin OSCC.50–52 Thus, the PROX1 gene may contribute in thedifferentiation of OSCC by downregulating these CKs becausedifferentiated cells did not express CK18 and CK19. Interest-ingly, PROX1 also contributes to tumor differentiation in hepa-tocellular carcinomas and pancreatic carcinoma.38
In summary, our results provide evidence that PROX1 isdifferentially expressed between nontumoral margins andOSCC, its overexpression reduces proliferative activity andcontributes to the differentiation of OSCC cells, and its ampli-fication is related to better prognosis of OSCC samples,suggesting that the downregulation of this gene in oral cancercontributes to the malignant phenotype.
ACKNOWLEDGMENTS
We acknowledge the GEN CAPO (Head and Neck GenomeProject) consortium and its members (http://www.gencapo.fa-merp.br/) for sample collection and initial processing, clinicaldata collection, providing histopathological analysis of thetissue samples, acquiring informed consent from each patient,and commenting on the draft manuscript. We thank the SpecialTechniques Laboratory, Hospital Israelita Albert Einstein (LA-TE-HIAE) for providing and performing the STR analysis. Wethank Elena Outon Alonso for performing the assay and DrRoberta Sitnik for data analysis.
REFERENCES
1. Argiris A, Karamouzis MV, Raben D, et al. Head and neck cancer.
Lancet. 2008;371:1695–1709.
2. Scully C, Bagan J. Oral squamous cell carcinoma overview. Oral
Oncol. 2009;45:301–308.
3. Abate-Shen C. Deregulated homeobox gene expression in cancer:
cause or consequence? Nat Rev Cancer. 2002;2:777–785.
4. Hassan NM, Hamada J, Murai T, et al. Aberrant expression of HOX
genes in oral dysplasia and squamous cell carcinoma tissues. Oncol
Res. 2006;16:217–224.
5. Zhu F, Li J, Li WX, et al. Overexpression and clinicopathological
significance of homeobox gene Quox-1 in oral squamous cell
carcinoma. J Biochem Mol Biol. 2004;37:671–675.
6. Destro MFSS, Bitu CC, Zecchin KG, et al. Overexpression of
HOXB7 homeobox gene in oral cancer induces cellular proliferation
and is associated with poor prognosis. Int J Oncol. 2010;36:141–
149.
7. Rodini CO, Xavier FC, Paiva KB, et al. Homeobox gene expression
profile indicates HOXA5 as a candidate prognostic marker in oral
squamous cell carcinoma. Int J Oncol. 2012;40:1180–1188.
8. Bitu CC, Destro MF, Carrera M, et al. HOXA1 is overexpressed in
oral squamous cell carcinomas and its expression is correlated with
poor prognosis. BMC Cancer. 2012;12:146.
9. Wigle JT, Harvey N, Detmar M, et al. An essential role for Prox1 in
the induction of the lymphatic endothelial cell phenotype. EMBO J.
2002;21:1505–1513.
Rodrigues et al
10. Vaessin H, Grell E, Wolff E, et al. Prospero is expressed in neuronal
precursors and encodes a nuclear protein that is involved in the
control of axonal outgrowth in Drosophila. Cell. 1991;67:941–953.
10 | www.md-journal.com
11. Wigle JT, Oliver G. Prox1 function is required for the development
of the murine lymphatic system. Cell. 1999;98:769–778.
12. Sosa-Pineda B, Wigle JT, Oliver G. Hepatocyte migration during
liver development requires Prox1. Nat Genet. 2000;25:254–255.
13. Wigle JT, Chowdhury K, Gruss P, et al. Prox1 function is crucial
for mouse lens-fibre elongation. Nat Genet. 1999;21:318–322.
14. Elsir T, Smits A, Lindstrom MS, et al. Transcription factor PROX1:
its role in development and cancer. Cancer Metastasis Rev.
2012;31:793–805.
15. Dadras SS, Skrzypek A, Nguyen L, et al. Prox-1 promotes invasion
of kaposiform hemangioendotheliomas. J Invest Dermatol.
2008;128:2798–2806.
16. Petrova TV, Nykanen A, Norrmen C, et al. Transcription factor
PROX1 induces colon cancer progression by promoting the transi-
tion from benign to highly dysplastic phenotype. Cancer cell.
2008;13:407–419.
17. Elsir T, Qu M, Berntsson SG, et al. PROX1 is a predictor of
survival for gliomas WHO grade II. Br J Cancer. 2011;104:1747–
1754.
18. Shimoda M, Takahashi M, Yoshimoto T, et al. A homeobox protein,
PROX1, is involved in the differentiation, proliferation, and prog-
nosis in hepatocellular carcinoma. Clin Cancer Res. 2006;12 (20 pt
1):6005–6011.
19. Hagiwara K, Ito H, Murate T, et al. PROX1 overexpression inhibits
protein kinase C beta II transcription through promoter DNA
methylation. Genes Chromosomes Cancer. 2012;51:1024–1036.
20. Foskolou IP, Stellas D, Rozani I, et al. PROX1 suppresses the
proliferation of neuroblastoma cells via a dual action in p27-Kip1
and Cdc25A. Oncogene. 2013;32:947–960.
21. Nagai H, Li Y, Hatano S, et al. Mutations and aberrant DNA
methylation of the PROX1 gene in hematologic malignancies. Genes
Chromosomes Cancer. 2003;38:13–21.
22. Laerm A, Helmbold P, Goldberg M, et al. Prospero-related homeo-
box 1 (PROX1) is frequently inactivated by genomic deletions and
epigenetic silencing in carcinomas of the bilary system. J Hepatol.
2007;46:89–97.
23. Versmold B, Felsberg J, Mikeska T, et al. Epigenetic silencing of
the candidate tumor suppressor gene PROX1 in sporadic breast
cancer. Int J Cancer. 2007;121:547–554.
24. Nagai MA, Ros N, Bessa SA, et al. Differentially expressed genes
and estrogen receptor status in breast cancer. Int J Oncol.
2003;23:1425–1430.
25. Chang TM, Hung WC. Transcriptional repression of TWIST1 gene
by Prospero-related homeobox 1 inhibits invasiveness of hepatocel-
lular carcinoma cells. FEBS Lett. 2012;586:3746–3752.
26. Sasahira T, Ueda N, Yamamoto K, et al. PROX1 and FOXC2 act as
regulators of lymphangiogenesis and angiogenesis in oral squamous
cell carcinoma. PloS One. 2014;9:e92534.
27. Severino P, Alvares AM, Michaluart P Jr et al. Global gene
expression profiling of oral cavity cancers suggests molecular
heterogeneity within anatomic subsites. BMC Res Notes. 2008;1:113.
28. Greene FL, Sobin LH. A worldwide approach to the TNM staging
system: collaborative efforts of the AJCC and UICC. J Surg Oncol.
2009;99:269–272.
29. Pfaffl MW. A new mathematical model for relative quantification in
real-time RT-PCR. Nucleic Acids Res. 2001;29:e45.
30. D’Haene B, Vandesompele J, Hellemans J. Accurate and objective
copy number profiling using real-time quantitative PCR. Methods.
Medicine � Volume 93, Number 28, December 2014
2010;50:262–270.
31. Terribas E, Garcia-Linares C, Lazaro C, et al. Probe-based quantita-
tive PCR assay for detecting constitutional and somatic deletions in
# 2014 Lippincott Williams & Wilkins
the NF1 gene: application to genetic testing and tumor analysis. Clin
Chem. 2013;59:928–937.
32. Yamatoji M, Kasamatsu A, Yamano Y, et al. State of homeobox
A10 expression as a putative prognostic marker for oral squamous
cell carcinoma. Oncol Rep. 2010;23:61–67.
33. Lavado A, Oliver G. PROX1 expression patterns in the developing
and adult murine brain. Dev Dyn. 2007;236:518–524.
34. Burke Z, Oliver G. PROX1 is an early specific marker for the
developing liver and pancreas in the mammalian foregut endoderm.
Mech Dev. 2002;118:147–155.
35. Li L, Vaessin H. Pan-neural Prospero terminates cell proliferation
during Drosophila neurogenesis. Genes Dev. 2000;14:147–151.
36. Chang TM, Hung WC. The homeobox transcription factor PROX1
inhibits proliferation of hepatocellular carcinoma cells by inducing
p53-dependent senescence-like phenotype. Cancer Biol Ther.
2013;14:222–229.
37. Elsir T, Eriksson A, Orrego A, et al. Expression of PROX1 is a
common feature of high-grade malignant astrocytic gliomas. J
Neuropathol Exp Neurol. 2010;69:129–138.
38. Schneider M, Buchler P, Giese N, et al. Role of lymphangiogenesis
and lymphangiogenic factors during pancreatic cancer progression
and lymphatic spread. Int J Oncol. 2006;28:883–890.
39. Takahashi M, Yoshimoto T, Shimoda M, et al. Loss of function of
the candidate tumor suppressor PROX1 by RNA mutation in human
cancer cells. Neoplasia. 2006;8:1003–1010.
40. Akagami M, Kawada K, Kubo H, et al. Transcriptional factor
PROX1 plays an essential role in the antiproliferative action of
interferon-gamma in esophageal cancer cells. Ann Surg Oncol.
2011;18:3868–3877.
41. Todd R, Hinds PW, Munger K, et al. Cell cycle dysregulation in
Medicine � Volume 93, Number 28, December 2014
42. Huang W, Zhang Y, Varambally S, et al. Inhibition of CCN6 (Wnt-
1-induced signaling protein 3) downregulates E-cadherin in the
# 2014 Lippincott Williams & Wilkins
breast epithelium through induction of snail and ZEB1. Am J Pathol.
2008;172:893–904.
43. Huang W, Gonzalez ME, Toy KA, et al. Blockade of CCN6
(WISP3) activates growth factor-independent survival and resistance
to anoikis in human mammary epithelial cells. Cancer Res.
2010;70:3340–3350.
44. Pal A, Huang W, Li X, et al. CCN6 modulates BMP signaling via
the Smad-independent TAK1/p38 pathway, acting to suppress
metastasis of breast cancer. Cancer Res. 2012;72:4818–4828.
45. Chou J, Provot S, Werb Z. GATA3 in development and cancer
differentiation: cells GATA have it! J Cell Physiol. 2010;222:42–49.
46. Mehra R, Varambally S, Ding L, et al. Identification of GATA3 as a
breast cancer prognostic marker by global gene expression meta-
analysis. Cancer Res. 2005;65:11259–11264.
47. Chen HZ, Tsai SY, Leone G. Emerging roles of E2Fs in cancer: an
exit from cell cycle control. Nat Rev Cancer. 2009;9:785–797.
48. Du Y, Zhang S, Wang Z, et al. Induction of apoptosis and cell cycle
arrest by NS398 in oral squamous cell carcinoma cells via down-
regulation of E2 promoter-binding factor-1. Oncol Rep.
2008;20:605–611.
49. Yuan H, Jiang F, Wang R, et al. Lentivirus-mediated RNA
interference of E2F-1 suppresses Tca8113 cell proliferation. Mol
Med Rep. 2012;5:420–426.
50. Zhong LP, Chen WT, Zhang CP, et al. Increased CK19 expression
correlated with pathologic differentiation grade and prognosis in oral
squamous cell carcinoma patients. Oral Surg Oral Med Oral Pathol
Oral Radiol Endod. 2007;104:377–384.
51. Mikami T, Cheng J, Maruyama S, et al. Emergence of keratin 17 vs.
loss of keratin 13: their reciprocal immunohistochemical profiles in
oral carcinoma in situ. Oral Oncol. 2011;47:497–503.
PROX1 Gene in Oral Cancer
oral cancer. Crit Rev Oral Biol Med. 2002;13:51–61.
52. Fillies T, Werkmeister R, Packeisen J, et al. Cytokeratin 8/18expression indicates a poor prognosis in squamous cell carcinomas
of the oral cavity. BMC Cancer. 2006;6:10.
www.md-journal.com | 11