The balance of reproducibility, sensitivity, and specificity of lists of differentially expressed...
19
BioMed Central Page 1 of 19 (page number not for citation purposes) Open Access Proceedings The balance of reproducibility, sensitivity, and specificity of lists of differentially expressed genes in microarray studies Leming Shi* 1 , Wendell D Jones 2 , Roderick V Jensen 3 , Stephen C Harris 1 , Roger G Perkins 4 , Federico M Goodsaid 5 , Lei Guo 1 , Lisa J Croner 6 , Cecilie Boysen 7 , Hong Fang 4 , Feng Qian 4 , Shashi Amur 5 , Wenjun Bao 8 , Catalin C Barbacioru 9 , Vincent Bertholet 10 , Xiaoxi Megan Cao 4 , Tzu- Ming Chu 8 , Patrick J Collins 11 , Xiao-hui Fan 1,12 , Felix W Frueh 5 , James C Fuscoe 1 , Xu Guo 13 , Jing Han 14 , Damir Herman 15 , Huixiao Hong 4 , Ernest S Kawasaki 16 , Quan-Zhen Li 17 , Yuling Luo 18 , Yunqing Ma 18 , Nan Mei 1 , Ron L Peterson 19 , Raj K Puri 14 , Richard Shippy 20 , Zhenqiang Su 1 , Yongming Andrew Sun 9 , Hongmei Sun 4 , Brett Thorn 4 , Yaron Turpaz 12 , Charles Wang 21 , Sue Jane Wang 5 , Janet A Warrington 13 , James C Willey 22 , Jie Wu 4 , Qian Xie 4 , Liang Zhang 23 , Lu Zhang 24 , Sheng Zhong 25 , Russell D Wolfinger 8 and Weida Tong 1 Address: 1 National Center for Toxicological Research, US Food and Drug Administration, 3900 NCTR Road, Jefferson, AR 72079, USA, 2 Expression Analysis Inc., 2605 Meridian Parkway, Durham, NC 27713, USA, 3 University of Massachusetts Boston, Department of Physics, 100 Morrissey Boulevard, Boston, MA 02125, USA, 4 Z-Tech Corporation, an ICF International Company at NCTR/FDA, 3900 NCTR Road, Jefferson, AR 72079, USA, 5 Center for Drug Evaluation and Research, US Food and Drug Administration, 10903 New Hampshire Avenue, Silver Spring, MD 20993, USA, 6 Biogen Idec Inc., 5200 Research Place, San Diego, CA 92122, USA, 7 ViaLogy Inc., 2400 Lincoln Avenue, Altadena, CA 91001, USA, 8 SAS Institute Inc., SAS Campus Drive, Cary, NC 27513, USA, 9 Applied Biosystems, 850 Lincoln Centre Drive, Foster City, CA 94404, USA, 10 Eppendorf Array Technologies, rue du Séminaire 20a, 5000 Namur, Belgium, 11 Agilent Technologies Inc., 5301 Stevens Creek Boulevard, Santa Clara, CA 95051, USA, 12 Pharmaceutical Informatics Institute, Zhejiang University, Hangzhou 310027, China, 13 Affymetrix Inc., 3420 Central Expressway, Santa Clara, CA 95051, USA, 14 Center for Biologics Evaluation and Research, US Food and Drug Administration, 8800 Rockville Pike, Bethesda, MD 20892, USA, 15 National Center for Biotechnology Information, National Library of Medicine, National Institutes of Health, 8600 Rockville Pike, Bethesda, MD 20894, USA, 16 National Cancer Institute Advanced Technology Center, 8717 Grovemont Circle, Gaithersburg, MD 20877, USA, 17 University of Texas Southwestern Medical Center, 6000 Harry Hines Boulevard, Dallas, TX 75390, USA, 18 Panomics Inc., 6519 Dumbarton Circle, Fremont, CA 94555, USA, 19 Novartis Institutes for Biomedical Research, 250 Massachusetts Avenue, Cambridge, MA 02139, USA, 20 GE Healthcare, 7700 S River Parkway, Tempe, AZ 85284, USA, 21 UCLA David Geffen School of Medicine, Transcriptional Genomics Core, Cedars- Sinai Medical Center, 8700 Beverly Boulevard, Los Angeles, CA 90048, USA, 22 Ohio Medical University, 3000 Arlington Avenue, Toledo, OH 43614, USA, 23 CapitalBio Corporation, 18 Life Science Parkway, Changping District, Beijing 102206, China, 24 Solexa Inc., 25861 Industrial Boulevard, Hayward, CA 94545, USA and 25 University of Illinois at Urbana-Champaign, Department of Bioengineering, 1304 W. Springfield Avenue, Urbana, IL 61801, USA Email: Leming Shi* - [email protected]; Wendell D Jones - [email protected]; Roderick V Jensen - [email protected]; Stephen C Harris - [email protected]; Roger G Perkins - [email protected]; Federico M Goodsaid - [email protected]; Lei Guo - [email protected]; Lisa J Croner - [email protected]; Cecilie Boysen - [email protected]; Hong Fang - [email protected]; Feng Qian - [email protected]; Shashi Amur - [email protected]; Wenjun Bao - [email protected]; Catalin C Barbacioru - [email protected]; Vincent Bertholet - [email protected]; Xiaoxi Megan Cao - [email protected]; Tzu-Ming Chu - [email protected]; Patrick J Collins - [email protected]; Xiao- hui Fan - [email protected]; Felix W Frueh - [email protected]; James C Fuscoe - [email protected]; Xu Guo - [email protected]; Jing Han - [email protected]; Damir Herman - [email protected]; Huixiao Hong - [email protected]; Ernest S Kawasaki - [email protected]; Quan-Zhen Li - [email protected]; Yuling Luo - [email protected]; Yunqing Ma - [email protected]; Nan Mei - [email protected]; Ron L Peterson - [email protected]; Raj K Puri - [email protected]; Richard Shippy - [email protected]; Zhenqiang Su - [email protected]; Yongming Andrew Sun - [email protected]; Hongmei Sun - [email protected]; Brett Thorn - [email protected]; Yaron Turpaz - [email protected]; Charles Wang - [email protected]; Sue Jane Wang - [email protected]; Janet A Warrington - [email protected]; James C Willey - [email protected]; Jie Wu - [email protected]; Qian Xie - [email protected]; Liang Zhang - [email protected]; Lu Zhang - [email protected]; Sheng Zhong - [email protected]; Russell D Wolfinger - [email protected]; Weida Tong - [email protected]
-
Upload
independent -
Category
Documents
-
view
2 -
download
0
Transcript of The balance of reproducibility, sensitivity, and specificity of lists of differentially expressed...
BioMed Central
ss
Open AcceProceedingsThe balance of reproducibility, sensitivity, and specificity of lists of differentially expressed genes in microarray studiesLeming Shi*1, Wendell D Jones2, Roderick V Jensen3, Stephen C Harris1, Roger G Perkins4, Federico M Goodsaid5, Lei Guo1, Lisa J Croner6, Cecilie Boysen7, Hong Fang4, Feng Qian4, Shashi Amur5, Wenjun Bao8, Catalin C Barbacioru9, Vincent Bertholet10, Xiaoxi Megan Cao4, Tzu-Ming Chu8, Patrick J Collins11, Xiao-hui Fan1,12, Felix W Frueh5, James C Fuscoe1, Xu Guo13, Jing Han14, Damir Herman15, Huixiao Hong4, Ernest S Kawasaki16, Quan-Zhen Li17, Yuling Luo18, Yunqing Ma18, Nan Mei1, Ron L Peterson19, Raj K Puri14, Richard Shippy20, Zhenqiang Su1, Yongming Andrew Sun9, Hongmei Sun4, Brett Thorn4, Yaron Turpaz12, Charles Wang21, Sue Jane Wang5, Janet A Warrington13, James C Willey22, Jie Wu4, Qian Xie4, Liang Zhang23, Lu Zhang24, Sheng Zhong25, Russell D Wolfinger8 and Weida Tong1Address: 1National Center for Toxicological Research, US Food and Drug Administration, 3900 NCTR Road, Jefferson, AR 72079, USA, 2Expression Analysis Inc., 2605 Meridian Parkway, Durham, NC 27713, USA, 3University of Massachusetts Boston, Department of Physics, 100 Morrissey Boulevard, Boston, MA 02125, USA, 4Z-Tech Corporation, an ICF International Company at NCTR/FDA, 3900 NCTR Road, Jefferson, AR 72079, USA, 5Center for Drug Evaluation and Research, US Food and Drug Administration, 10903 New Hampshire Avenue, Silver Spring, MD 20993, USA, 6Biogen Idec Inc., 5200 Research Place, San Diego, CA 92122, USA, 7ViaLogy Inc., 2400 Lincoln Avenue, Altadena, CA 91001, USA, 8SAS Institute Inc., SAS Campus Drive, Cary, NC 27513, USA, 9Applied Biosystems, 850 Lincoln Centre Drive, Foster City, CA 94404, USA, 10Eppendorf Array Technologies, rue du Séminaire 20a, 5000 Namur, Belgium, 11Agilent Technologies Inc., 5301 Stevens Creek Boulevard, Santa Clara, CA 95051, USA, 12Pharmaceutical Informatics Institute, Zhejiang University, Hangzhou 310027, China, 13Affymetrix Inc., 3420 Central Expressway, Santa Clara, CA 95051, USA, 14Center for Biologics Evaluation and Research, US Food and Drug Administration, 8800 Rockville Pike, Bethesda, MD 20892, USA, 15National Center for Biotechnology Information, National Library of Medicine, National Institutes of Health, 8600 Rockville Pike, Bethesda, MD 20894, USA, 16National Cancer Institute Advanced Technology Center, 8717 Grovemont Circle, Gaithersburg, MD 20877, USA, 17University of Texas Southwestern Medical Center, 6000 Harry Hines Boulevard, Dallas, TX 75390, USA, 18Panomics Inc., 6519 Dumbarton Circle, Fremont, CA 94555, USA, 19Novartis Institutes for Biomedical Research, 250 Massachusetts Avenue, Cambridge, MA 02139, USA, 20GE Healthcare, 7700 S River Parkway, Tempe, AZ 85284, USA, 21UCLA David Geffen School of Medicine, Transcriptional Genomics Core, Cedars-Sinai Medical Center, 8700 Beverly Boulevard, Los Angeles, CA 90048, USA, 22Ohio Medical University, 3000 Arlington Avenue, Toledo, OH 43614, USA, 23CapitalBio Corporation, 18 Life Science Parkway, Changping District, Beijing 102206, China, 24Solexa Inc., 25861 Industrial Boulevard, Hayward, CA 94545, USA and 25University of Illinois at Urbana-Champaign, Department of Bioengineering, 1304 W. Springfield Avenue, Urbana, IL 61801, USA
Email: Leming Shi* - [email protected]; Wendell D Jones - [email protected]; Roderick V Jensen - [email protected]; Stephen C Harris - [email protected]; Roger G Perkins - [email protected]; Federico M Goodsaid - [email protected]; Lei Guo - [email protected]; Lisa J Croner - [email protected]; Cecilie Boysen - [email protected]; Hong Fang - [email protected]; Feng Qian - [email protected]; Shashi Amur - [email protected]; Wenjun Bao - [email protected]; Catalin C Barbacioru - [email protected]; Vincent Bertholet - [email protected]; Xiaoxi Megan Cao - [email protected]; Tzu-Ming Chu - [email protected]; Patrick J Collins - [email protected]; Xiao-hui Fan - [email protected]; Felix W Frueh - [email protected]; James C Fuscoe - [email protected]; Xu Guo - [email protected]; Jing Han - [email protected]; Damir Herman - [email protected]; Huixiao Hong - [email protected]; Ernest S Kawasaki - [email protected]; Quan-Zhen Li - [email protected]; Yuling Luo - [email protected]; Yunqing Ma - [email protected]; Nan Mei - [email protected]; Ron L Peterson - [email protected]; Raj K Puri - [email protected]; Richard Shippy - [email protected]; Zhenqiang Su - [email protected]; Yongming Andrew Sun - [email protected]; Hongmei Sun - [email protected]; Brett Thorn - [email protected]; Yaron Turpaz - [email protected]; Charles Wang - [email protected]; Sue Jane Wang - [email protected]; Janet A Warrington - [email protected]; James C Willey - [email protected]; Jie Wu - [email protected]; Qian Xie - [email protected]; Liang Zhang - [email protected]; Lu Zhang - [email protected]; Sheng Zhong - [email protected]; Russell D Wolfinger - [email protected]; Weida Tong - [email protected]
Page 1 of 19(page number not for citation purposes)
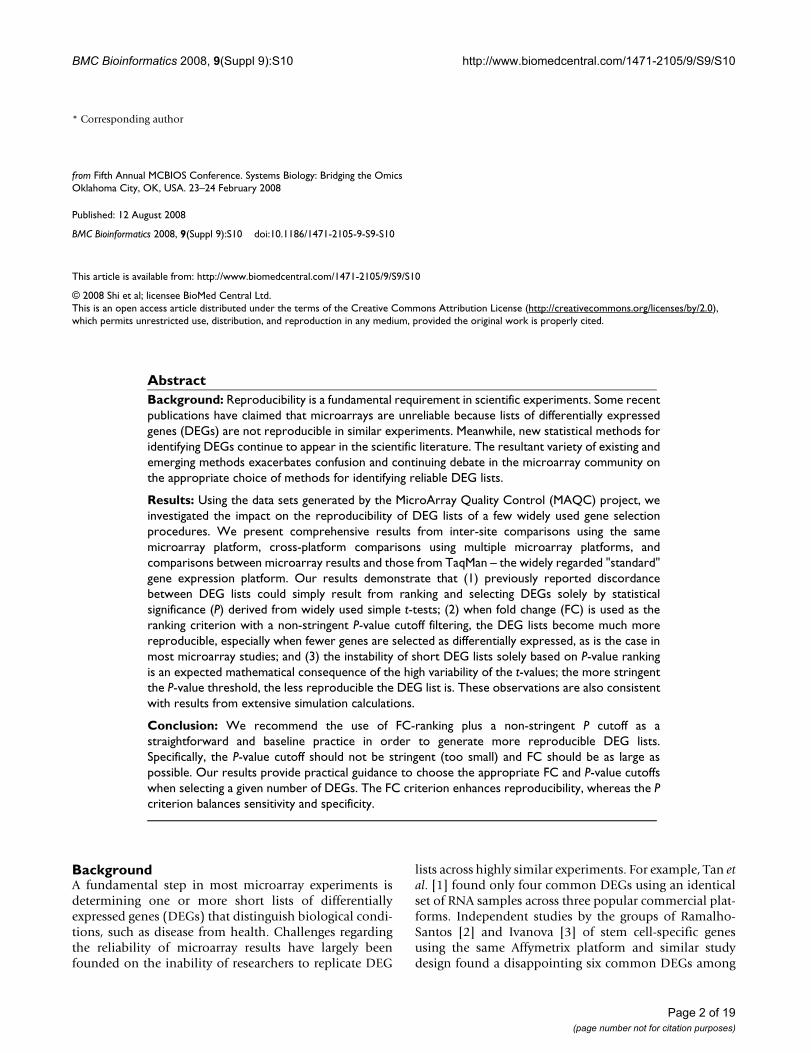
BMC Bioinformatics 2008, 9(Suppl 9):S10 http://www.biomedcentral.com/1471-2105/9/S9/S10
* Corresponding author
AbstractBackground: Reproducibility is a fundamental requirement in scientific experiments. Some recentpublications have claimed that microarrays are unreliable because lists of differentially expressedgenes (DEGs) are not reproducible in similar experiments. Meanwhile, new statistical methods foridentifying DEGs continue to appear in the scientific literature. The resultant variety of existing andemerging methods exacerbates confusion and continuing debate in the microarray community onthe appropriate choice of methods for identifying reliable DEG lists.
Results: Using the data sets generated by the MicroArray Quality Control (MAQC) project, weinvestigated the impact on the reproducibility of DEG lists of a few widely used gene selectionprocedures. We present comprehensive results from inter-site comparisons using the samemicroarray platform, cross-platform comparisons using multiple microarray platforms, andcomparisons between microarray results and those from TaqMan – the widely regarded "standard"gene expression platform. Our results demonstrate that (1) previously reported discordancebetween DEG lists could simply result from ranking and selecting DEGs solely by statisticalsignificance (P) derived from widely used simple t-tests; (2) when fold change (FC) is used as theranking criterion with a non-stringent P-value cutoff filtering, the DEG lists become much morereproducible, especially when fewer genes are selected as differentially expressed, as is the case inmost microarray studies; and (3) the instability of short DEG lists solely based on P-value rankingis an expected mathematical consequence of the high variability of the t-values; the more stringentthe P-value threshold, the less reproducible the DEG list is. These observations are also consistentwith results from extensive simulation calculations.
Conclusion: We recommend the use of FC-ranking plus a non-stringent P cutoff as astraightforward and baseline practice in order to generate more reproducible DEG lists.Specifically, the P-value cutoff should not be stringent (too small) and FC should be as large aspossible. Our results provide practical guidance to choose the appropriate FC and P-value cutoffswhen selecting a given number of DEGs. The FC criterion enhances reproducibility, whereas the Pcriterion balances sensitivity and specificity.
BackgroundA fundamental step in most microarray experiments isdetermining one or more short lists of differentiallyexpressed genes (DEGs) that distinguish biological condi-tions, such as disease from health. Challenges regardingthe reliability of microarray results have largely beenfounded on the inability of researchers to replicate DEG
lists across highly similar experiments. For example, Tan etal. [1] found only four common DEGs using an identicalset of RNA samples across three popular commercial plat-forms. Independent studies by the groups of Ramalho-Santos [2] and Ivanova [3] of stem cell-specific genesusing the same Affymetrix platform and similar studydesign found a disappointing six common DEGs among
from Fifth Annual MCBIOS Conference. Systems Biology: Bridging the OmicsOklahoma City, OK, USA. 23–24 February 2008
Published: 12 August 2008
BMC Bioinformatics 2008, 9(Suppl 9):S10 doi:10.1186/1471-2105-9-S9-S10
<supplement> <title> <p>Proceedings of the Fifth Annual MCBIOS Conference. Systems Biology: Bridging the Omics</p> </title> <editor>Jonathan D Wren (Senior Editor), Yuriy Gusev, Dawn Wilkins, Susan Bridges, Stephen Winters-Hilt and James Fuscoe</editor> <note>Proceedings</note> </supplement>
This article is available from: http://www.biomedcentral.com/1471-2105/9/S9/S10
© 2008 Shi et al; licensee BioMed Central Ltd. This is an open access article distributed under the terms of the Creative Commons Attribution License (http://creativecommons.org/licenses/by/2.0), which permits unrestricted use, distribution, and reproduction in any medium, provided the original work is properly cited.
Page 2 of 19(page number not for citation purposes)
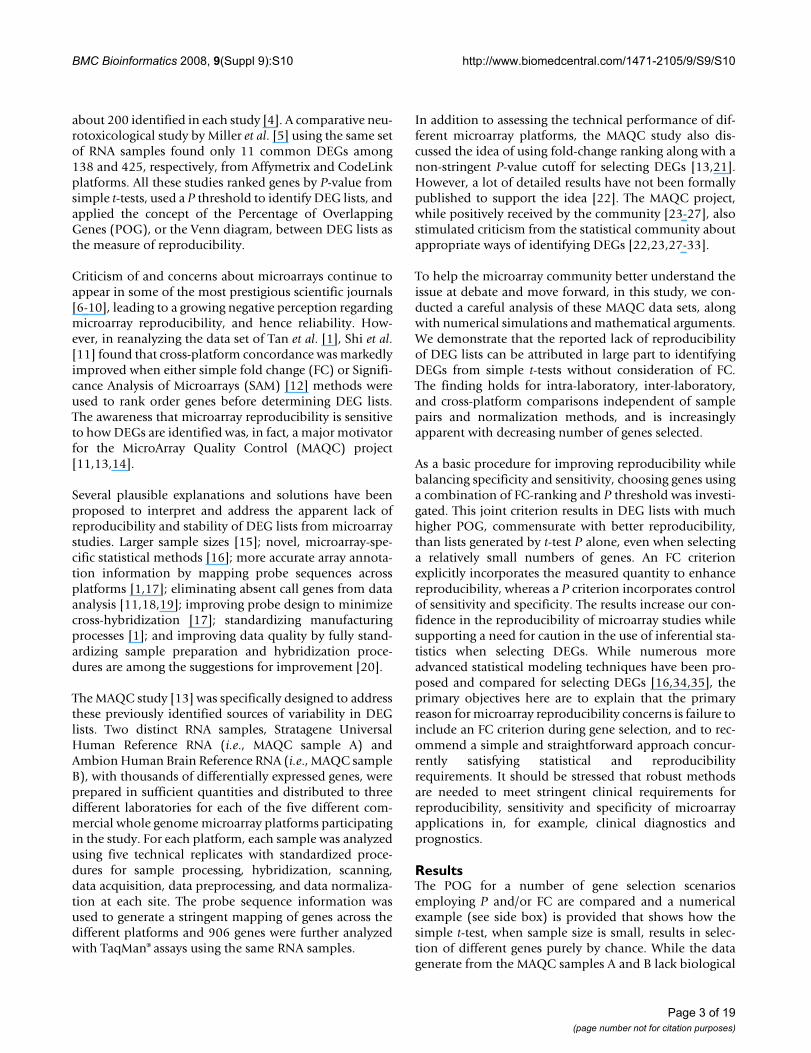
BMC Bioinformatics 2008, 9(Suppl 9):S10 http://www.biomedcentral.com/1471-2105/9/S9/S10
about 200 identified in each study [4]. A comparative neu-rotoxicological study by Miller et al. [5] using the same setof RNA samples found only 11 common DEGs among138 and 425, respectively, from Affymetrix and CodeLinkplatforms. All these studies ranked genes by P-value fromsimple t-tests, used a P threshold to identify DEG lists, andapplied the concept of the Percentage of OverlappingGenes (POG), or the Venn diagram, between DEG lists asthe measure of reproducibility.
Criticism of and concerns about microarrays continue toappear in some of the most prestigious scientific journals[6-10], leading to a growing negative perception regardingmicroarray reproducibility, and hence reliability. How-ever, in reanalyzing the data set of Tan et al. [1], Shi et al.[11] found that cross-platform concordance was markedlyimproved when either simple fold change (FC) or Signifi-cance Analysis of Microarrays (SAM) [12] methods wereused to rank order genes before determining DEG lists.The awareness that microarray reproducibility is sensitiveto how DEGs are identified was, in fact, a major motivatorfor the MicroArray Quality Control (MAQC) project[11,13,14].
Several plausible explanations and solutions have beenproposed to interpret and address the apparent lack ofreproducibility and stability of DEG lists from microarraystudies. Larger sample sizes [15]; novel, microarray-spe-cific statistical methods [16]; more accurate array annota-tion information by mapping probe sequences acrossplatforms [1,17]; eliminating absent call genes from dataanalysis [11,18,19]; improving probe design to minimizecross-hybridization [17]; standardizing manufacturingprocesses [1]; and improving data quality by fully stand-ardizing sample preparation and hybridization proce-dures are among the suggestions for improvement [20].
The MAQC study [13] was specifically designed to addressthese previously identified sources of variability in DEGlists. Two distinct RNA samples, Stratagene UniversalHuman Reference RNA (i.e., MAQC sample A) andAmbion Human Brain Reference RNA (i.e., MAQC sampleB), with thousands of differentially expressed genes, wereprepared in sufficient quantities and distributed to threedifferent laboratories for each of the five different com-mercial whole genome microarray platforms participatingin the study. For each platform, each sample was analyzedusing five technical replicates with standardized proce-dures for sample processing, hybridization, scanning,data acquisition, data preprocessing, and data normaliza-tion at each site. The probe sequence information wasused to generate a stringent mapping of genes across thedifferent platforms and 906 genes were further analyzedwith TaqMan® assays using the same RNA samples.
In addition to assessing the technical performance of dif-ferent microarray platforms, the MAQC study also dis-cussed the idea of using fold-change ranking along with anon-stringent P-value cutoff for selecting DEGs [13,21].However, a lot of detailed results have not been formallypublished to support the idea [22]. The MAQC project,while positively received by the community [23-27], alsostimulated criticism from the statistical community aboutappropriate ways of identifying DEGs [22,23,27-33].
To help the microarray community better understand theissue at debate and move forward, in this study, we con-ducted a careful analysis of these MAQC data sets, alongwith numerical simulations and mathematical arguments.We demonstrate that the reported lack of reproducibilityof DEG lists can be attributed in large part to identifyingDEGs from simple t-tests without consideration of FC.The finding holds for intra-laboratory, inter-laboratory,and cross-platform comparisons independent of samplepairs and normalization methods, and is increasinglyapparent with decreasing number of genes selected.
As a basic procedure for improving reproducibility whilebalancing specificity and sensitivity, choosing genes usinga combination of FC-ranking and P threshold was investi-gated. This joint criterion results in DEG lists with muchhigher POG, commensurate with better reproducibility,than lists generated by t-test P alone, even when selectinga relatively small numbers of genes. An FC criterionexplicitly incorporates the measured quantity to enhancereproducibility, whereas a P criterion incorporates controlof sensitivity and specificity. The results increase our con-fidence in the reproducibility of microarray studies whilesupporting a need for caution in the use of inferential sta-tistics when selecting DEGs. While numerous moreadvanced statistical modeling techniques have been pro-posed and compared for selecting DEGs [16,34,35], theprimary objectives here are to explain that the primaryreason for microarray reproducibility concerns is failure toinclude an FC criterion during gene selection, and to rec-ommend a simple and straightforward approach concur-rently satisfying statistical and reproducibilityrequirements. It should be stressed that robust methodsare needed to meet stringent clinical requirements forreproducibility, sensitivity and specificity of microarrayapplications in, for example, clinical diagnostics andprognostics.
ResultsThe POG for a number of gene selection scenariosemploying P and/or FC are compared and a numericalexample (see side box) is provided that shows how thesimple t-test, when sample size is small, results in selec-tion of different genes purely by chance. While the datagenerate from the MAQC samples A and B lack biological
Page 3 of 19(page number not for citation purposes)
BMC Bioinformatics 2008, 9(Suppl 9):S10 http://www.biomedcentral.com/1471-2105/9/S9/S10
variability, the results are supported by the toxicogenomicdata of Guo et al. [21] While P could be computed frommany different statistical methods, for simplicity and con-sistency, throughout this article P is calculated with thetwo-tailed t-test that is widely employed in microarraydata analysis.
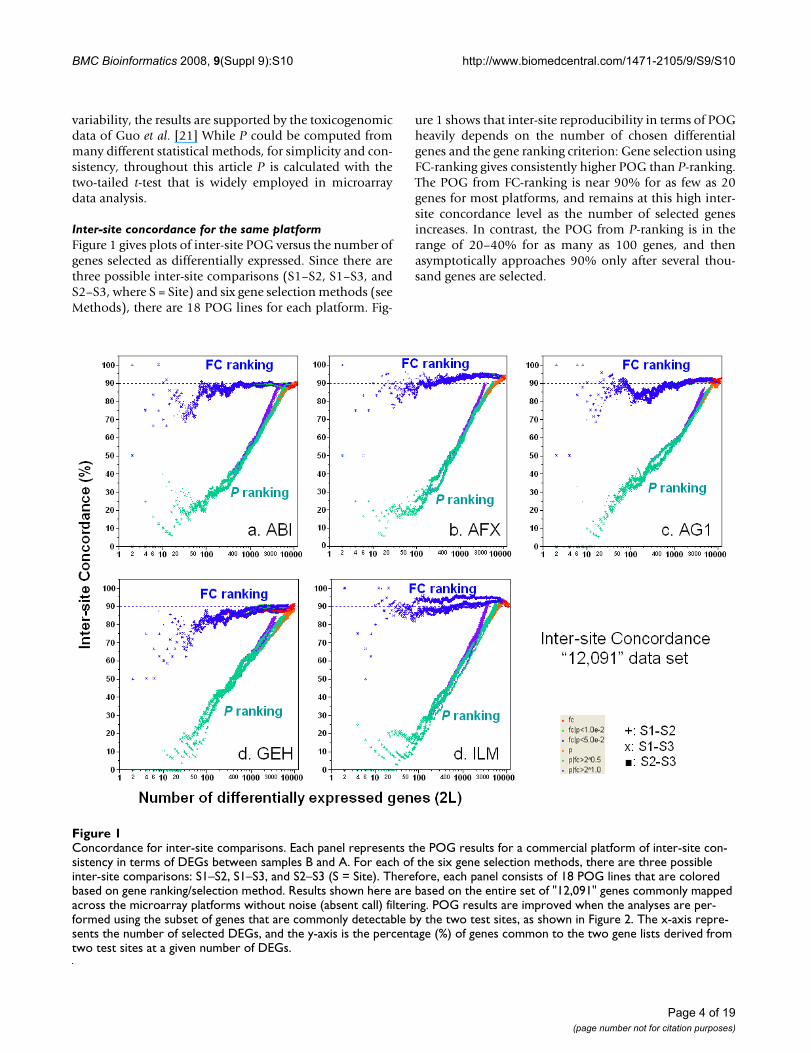
Inter-site concordance for the same platformFigure 1 gives plots of inter-site POG versus the number ofgenes selected as differentially expressed. Since there arethree possible inter-site comparisons (S1–S2, S1–S3, andS2–S3, where S = Site) and six gene selection methods (seeMethods), there are 18 POG lines for each platform. Fig-
ure 1 shows that inter-site reproducibility in terms of POGheavily depends on the number of chosen differentialgenes and the gene ranking criterion: Gene selection usingFC-ranking gives consistently higher POG than P-ranking.The POG from FC-ranking is near 90% for as few as 20genes for most platforms, and remains at this high inter-site concordance level as the number of selected genesincreases. In contrast, the POG from P-ranking is in therange of 20–40% for as many as 100 genes, and thenasymptotically approaches 90% only after several thou-sand genes are selected.
Concordance for inter-site comparisonsFigure 1Concordance for inter-site comparisons. Each panel represents the POG results for a commercial platform of inter-site con-sistency in terms of DEGs between samples B and A. For each of the six gene selection methods, there are three possible inter-site comparisons: S1–S2, S1–S3, and S2–S3 (S = Site). Therefore, each panel consists of 18 POG lines that are colored based on gene ranking/selection method. Results shown here are based on the entire set of "12,091" genes commonly mapped across the microarray platforms without noise (absent call) filtering. POG results are improved when the analyses are per-formed using the subset of genes that are commonly detectable by the two test sites, as shown in Figure 2. The x-axis repre-sents the number of selected DEGs, and the y-axis is the percentage (%) of genes common to the two gene lists derived from two test sites at a given number of DEGs.
Page 4 of 19(page number not for citation purposes)
BMC Bioinformatics 2008, 9(Suppl 9):S10 http://www.biomedcentral.com/1471-2105/9/S9/S10
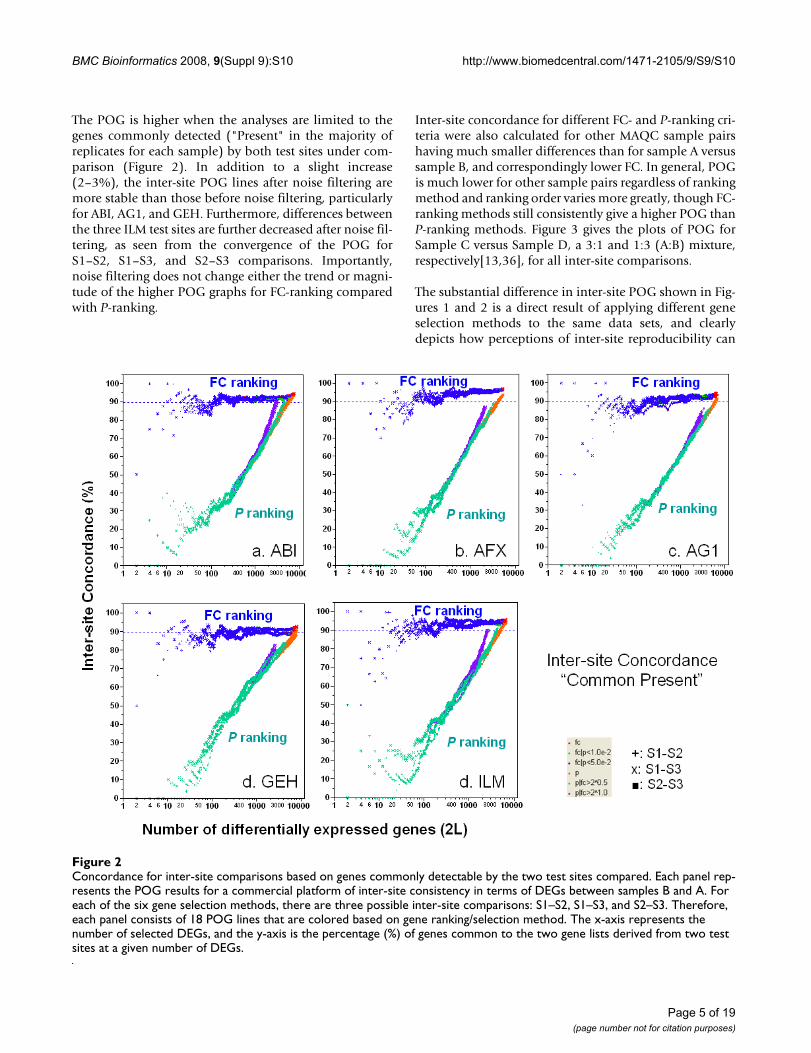
The POG is higher when the analyses are limited to thegenes commonly detected ("Present" in the majority ofreplicates for each sample) by both test sites under com-parison (Figure 2). In addition to a slight increase(2–3%), the inter-site POG lines after noise filtering aremore stable than those before noise filtering, particularlyfor ABI, AG1, and GEH. Furthermore, differences betweenthe three ILM test sites are further decreased after noise fil-tering, as seen from the convergence of the POG forS1–S2, S1–S3, and S2–S3 comparisons. Importantly,noise filtering does not change either the trend or magni-tude of the higher POG graphs for FC-ranking comparedwith P-ranking.
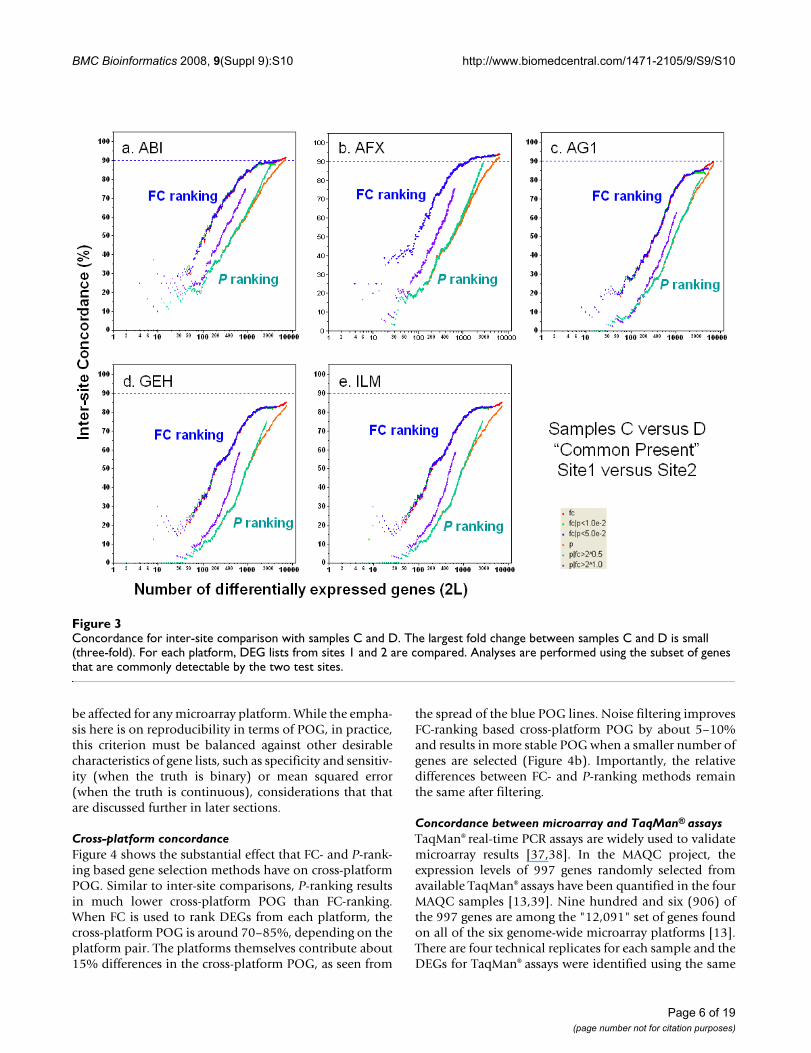
Inter-site concordance for different FC- and P-ranking cri-teria were also calculated for other MAQC sample pairshaving much smaller differences than for sample A versussample B, and correspondingly lower FC. In general, POGis much lower for other sample pairs regardless of rankingmethod and ranking order varies more greatly, though FC-ranking methods still consistently give a higher POG thanP-ranking methods. Figure 3 gives the plots of POG forSample C versus Sample D, a 3:1 and 1:3 (A:B) mixture,respectively[13,36], for all inter-site comparisons.
The substantial difference in inter-site POG shown in Fig-ures 1 and 2 is a direct result of applying different geneselection methods to the same data sets, and clearlydepicts how perceptions of inter-site reproducibility can
Concordance for inter-site comparisons based on genes commonly detectable by the two test sites comparedFigure 2Concordance for inter-site comparisons based on genes commonly detectable by the two test sites compared. Each panel rep-resents the POG results for a commercial platform of inter-site consistency in terms of DEGs between samples B and A. For each of the six gene selection methods, there are three possible inter-site comparisons: S1–S2, S1–S3, and S2–S3. Therefore, each panel consists of 18 POG lines that are colored based on gene ranking/selection method. The x-axis represents the number of selected DEGs, and the y-axis is the percentage (%) of genes common to the two gene lists derived from two test sites at a given number of DEGs.
Page 5 of 19(page number not for citation purposes)
BMC Bioinformatics 2008, 9(Suppl 9):S10 http://www.biomedcentral.com/1471-2105/9/S9/S10
be affected for any microarray platform. While the empha-sis here is on reproducibility in terms of POG, in practice,this criterion must be balanced against other desirablecharacteristics of gene lists, such as specificity and sensitiv-ity (when the truth is binary) or mean squared error(when the truth is continuous), considerations that thatare discussed further in later sections.
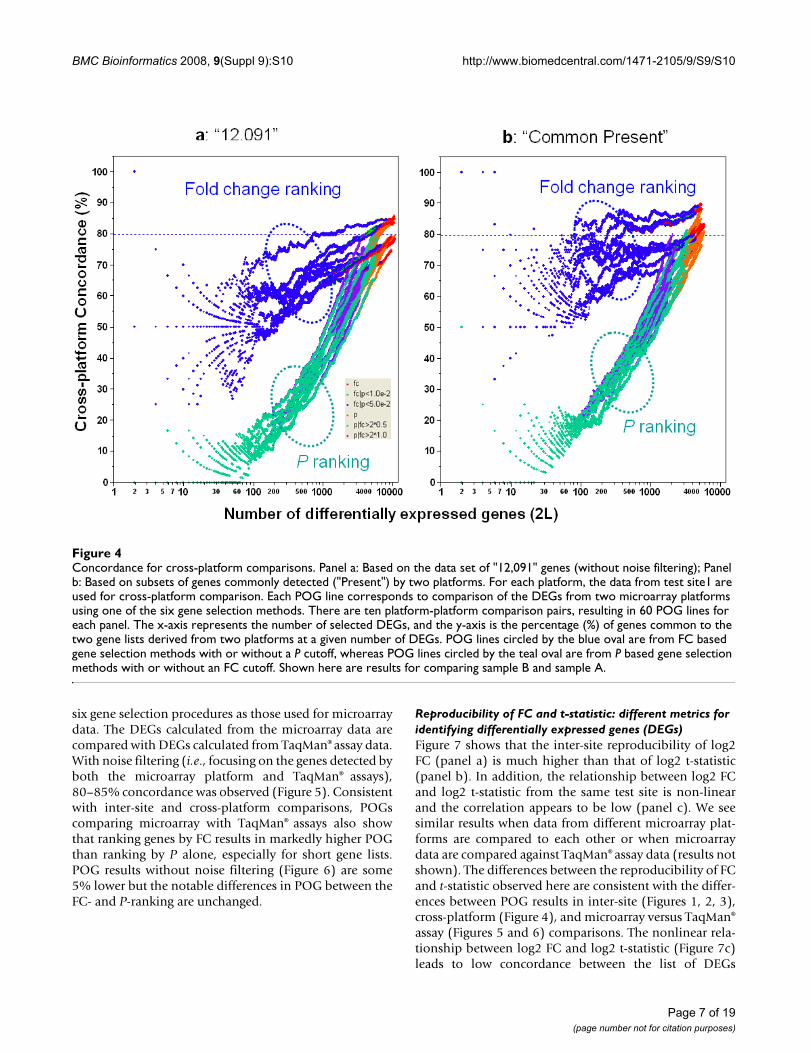
Cross-platform concordanceFigure 4 shows the substantial effect that FC- and P-rank-ing based gene selection methods have on cross-platformPOG. Similar to inter-site comparisons, P-ranking resultsin much lower cross-platform POG than FC-ranking.When FC is used to rank DEGs from each platform, thecross-platform POG is around 70–85%, depending on theplatform pair. The platforms themselves contribute about15% differences in the cross-platform POG, as seen from
the spread of the blue POG lines. Noise filtering improvesFC-ranking based cross-platform POG by about 5–10%and results in more stable POG when a smaller number ofgenes are selected (Figure 4b). Importantly, the relativedifferences between FC- and P-ranking methods remainthe same after filtering.
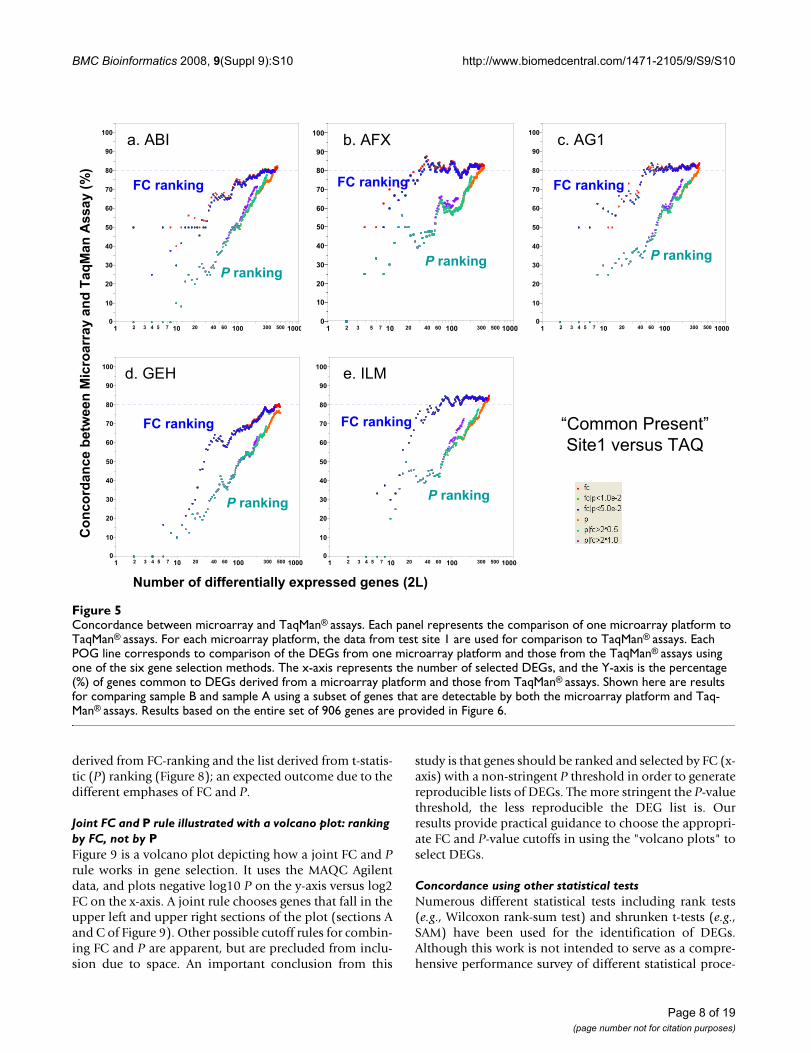
Concordance between microarray and TaqMan® assaysTaqMan® real-time PCR assays are widely used to validatemicroarray results [37,38]. In the MAQC project, theexpression levels of 997 genes randomly selected fromavailable TaqMan® assays have been quantified in the fourMAQC samples [13,39]. Nine hundred and six (906) ofthe 997 genes are among the "12,091" set of genes foundon all of the six genome-wide microarray platforms [13].There are four technical replicates for each sample and theDEGs for TaqMan® assays were identified using the same
Concordance for inter-site comparison with samples C and DFigure 3Concordance for inter-site comparison with samples C and D. The largest fold change between samples C and D is small (three-fold). For each platform, DEG lists from sites 1 and 2 are compared. Analyses are performed using the subset of genes that are commonly detectable by the two test sites.
Page 6 of 19(page number not for citation purposes)
BMC Bioinformatics 2008, 9(Suppl 9):S10 http://www.biomedcentral.com/1471-2105/9/S9/S10
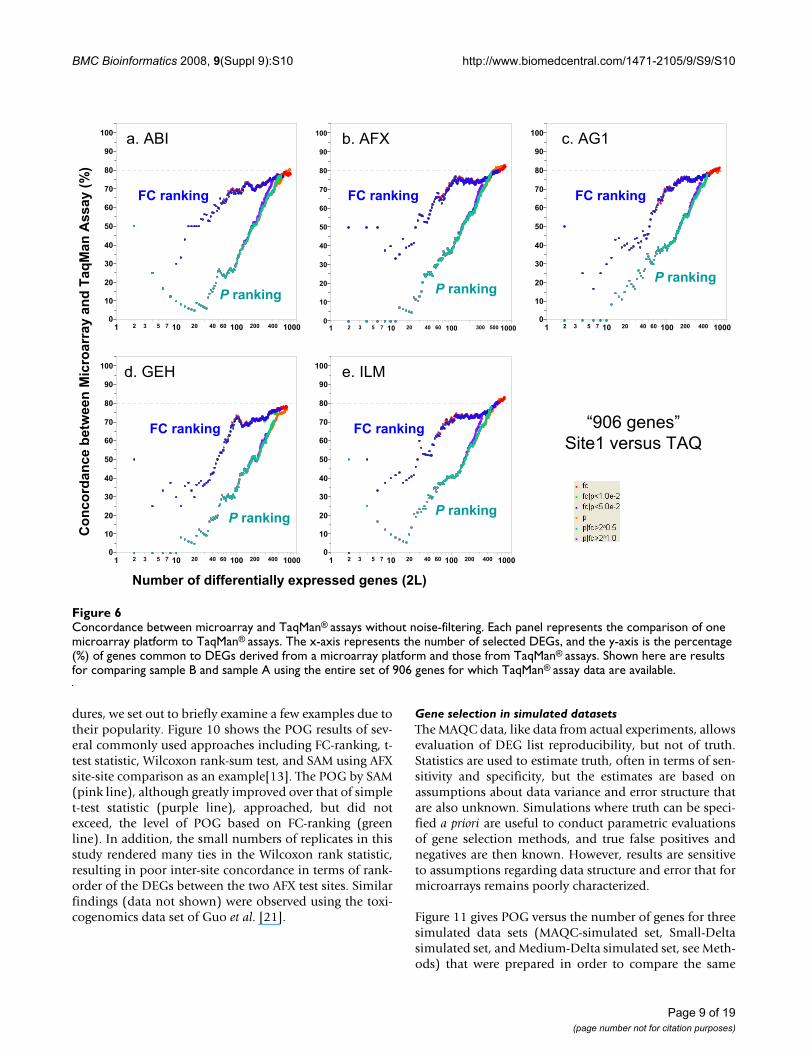
six gene selection procedures as those used for microarraydata. The DEGs calculated from the microarray data arecompared with DEGs calculated from TaqMan® assay data.With noise filtering (i.e., focusing on the genes detected byboth the microarray platform and TaqMan® assays),80–85% concordance was observed (Figure 5). Consistentwith inter-site and cross-platform comparisons, POGscomparing microarray with TaqMan® assays also showthat ranking genes by FC results in markedly higher POGthan ranking by P alone, especially for short gene lists.POG results without noise filtering (Figure 6) are some5% lower but the notable differences in POG between theFC- and P-ranking are unchanged.
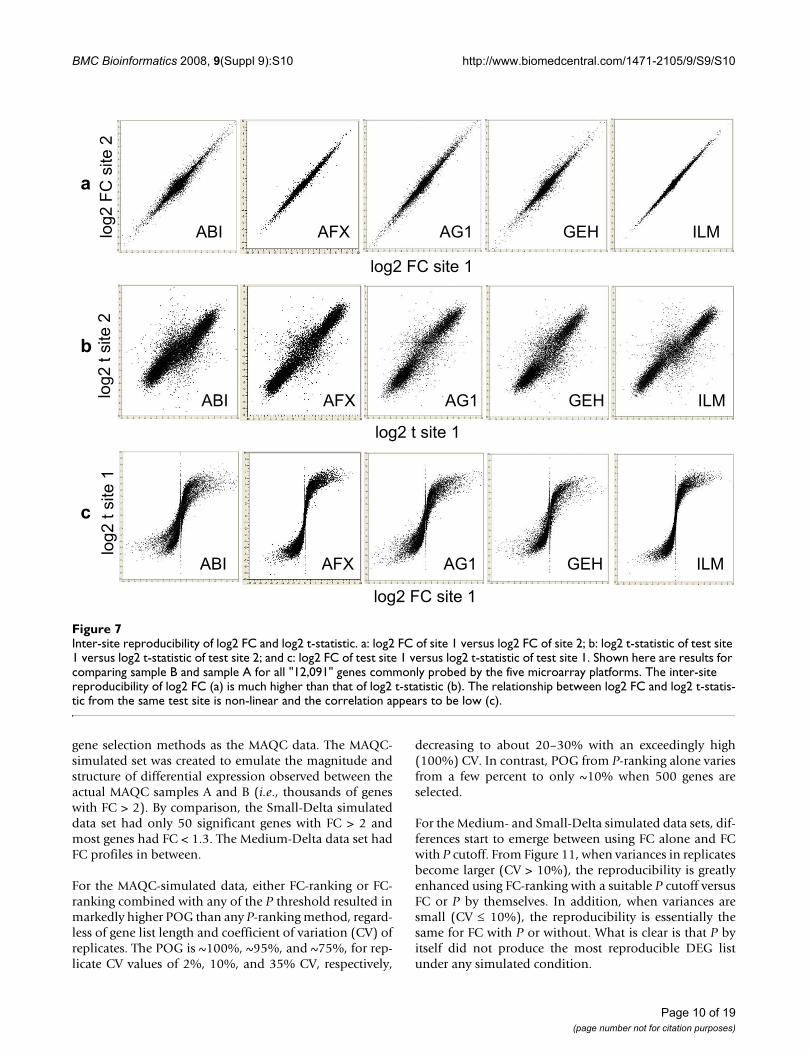
Reproducibility of FC and t-statistic: different metrics for identifying differentially expressed genes (DEGs)Figure 7 shows that the inter-site reproducibility of log2FC (panel a) is much higher than that of log2 t-statistic(panel b). In addition, the relationship between log2 FCand log2 t-statistic from the same test site is non-linearand the correlation appears to be low (panel c). We seesimilar results when data from different microarray plat-forms are compared to each other or when microarraydata are compared against TaqMan® assay data (results notshown). The differences between the reproducibility of FCand t-statistic observed here are consistent with the differ-ences between POG results in inter-site (Figures 1, 2, 3),cross-platform (Figure 4), and microarray versus TaqMan®
assay (Figures 5 and 6) comparisons. The nonlinear rela-tionship between log2 FC and log2 t-statistic (Figure 7c)leads to low concordance between the list of DEGs
Concordance for cross-platform comparisonsFigure 4Concordance for cross-platform comparisons. Panel a: Based on the data set of "12,091" genes (without noise filtering); Panel b: Based on subsets of genes commonly detected ("Present") by two platforms. For each platform, the data from test site1 are used for cross-platform comparison. Each POG line corresponds to comparison of the DEGs from two microarray platforms using one of the six gene selection methods. There are ten platform-platform comparison pairs, resulting in 60 POG lines for each panel. The x-axis represents the number of selected DEGs, and the y-axis is the percentage (%) of genes common to the two gene lists derived from two platforms at a given number of DEGs. POG lines circled by the blue oval are from FC based gene selection methods with or without a P cutoff, whereas POG lines circled by the teal oval are from P based gene selection methods with or without an FC cutoff. Shown here are results for comparing sample B and sample A.
Page 7 of 19(page number not for citation purposes)
BMC Bioinformatics 2008, 9(Suppl 9):S10 http://www.biomedcentral.com/1471-2105/9/S9/S10
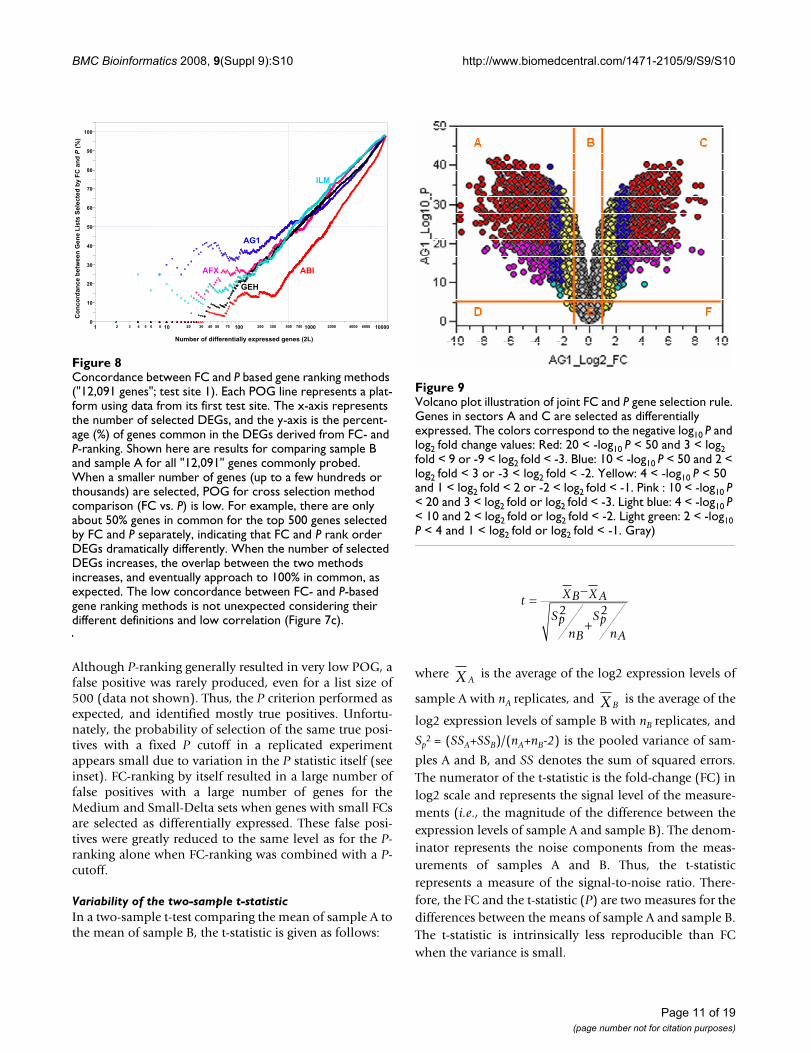
derived from FC-ranking and the list derived from t-statis-tic (P) ranking (Figure 8); an expected outcome due to thedifferent emphases of FC and P.
Joint FC and P rule illustrated with a volcano plot: ranking by FC, not by PFigure 9 is a volcano plot depicting how a joint FC and Prule works in gene selection. It uses the MAQC Agilentdata, and plots negative log10 P on the y-axis versus log2FC on the x-axis. A joint rule chooses genes that fall in theupper left and upper right sections of the plot (sections Aand C of Figure 9). Other possible cutoff rules for combin-ing FC and P are apparent, but are precluded from inclu-sion due to space. An important conclusion from this
study is that genes should be ranked and selected by FC (x-axis) with a non-stringent P threshold in order to generatereproducible lists of DEGs. The more stringent the P-valuethreshold, the less reproducible the DEG list is. Ourresults provide practical guidance to choose the appropri-ate FC and P-value cutoffs in using the "volcano plots" toselect DEGs.
Concordance using other statistical testsNumerous different statistical tests including rank tests(e.g., Wilcoxon rank-sum test) and shrunken t-tests (e.g.,SAM) have been used for the identification of DEGs.Although this work is not intended to serve as a compre-hensive performance survey of different statistical proce-
Concordance between microarray and TaqMan® assaysFigure 5Concordance between microarray and TaqMan® assays. Each panel represents the comparison of one microarray platform to TaqMan® assays. For each microarray platform, the data from test site 1 are used for comparison to TaqMan® assays. Each POG line corresponds to comparison of the DEGs from one microarray platform and those from the TaqMan® assays using one of the six gene selection methods. The x-axis represents the number of selected DEGs, and the Y-axis is the percentage (%) of genes common to DEGs derived from a microarray platform and those from TaqMan® assays. Shown here are results for comparing sample B and sample A using a subset of genes that are detectable by both the microarray platform and Taq-Man® assays. Results based on the entire set of 906 genes are provided in Figure 6.
Number of differentially expressed genes (2L)
0
10
20
30
40
50
60
70
80
90
100
1 10 7 5 4 3 2 100 60 40 20 1000 500 300
0
10
20
30
40
50
60
70
80
90
100
1 10 7 5 4 3 2 100 60 40 20 1000 500 300 0
10
20
30
40
50
60
70
80
90
100
1 10 7 5 4 3 2 100 60 40 20 1000 500 300
0
10
20
30
40
50
60
70
80
90
100
1 10 7 5 4 3 2 100 60 40 20 1000 500 300
P ranking
a. ABI c. AG1
P ranking
FC rankingFC ranking
P ranking P ranking
FC ranking FC ranking
d. GEH e. ILM
Con
cord
ance
bet
wee
n M
icro
arra
y an
d Ta
qMan
Ass
ay (%
)
0
10
20
30
40
50
60
70
80
90
100
1 10 7 5 3 2 100 60 40 20 1000 500 300
b. AFX
P ranking
FC ranking
“Common Present”Site1 versus TAQ
Page 8 of 19(page number not for citation purposes)
BMC Bioinformatics 2008, 9(Suppl 9):S10 http://www.biomedcentral.com/1471-2105/9/S9/S10
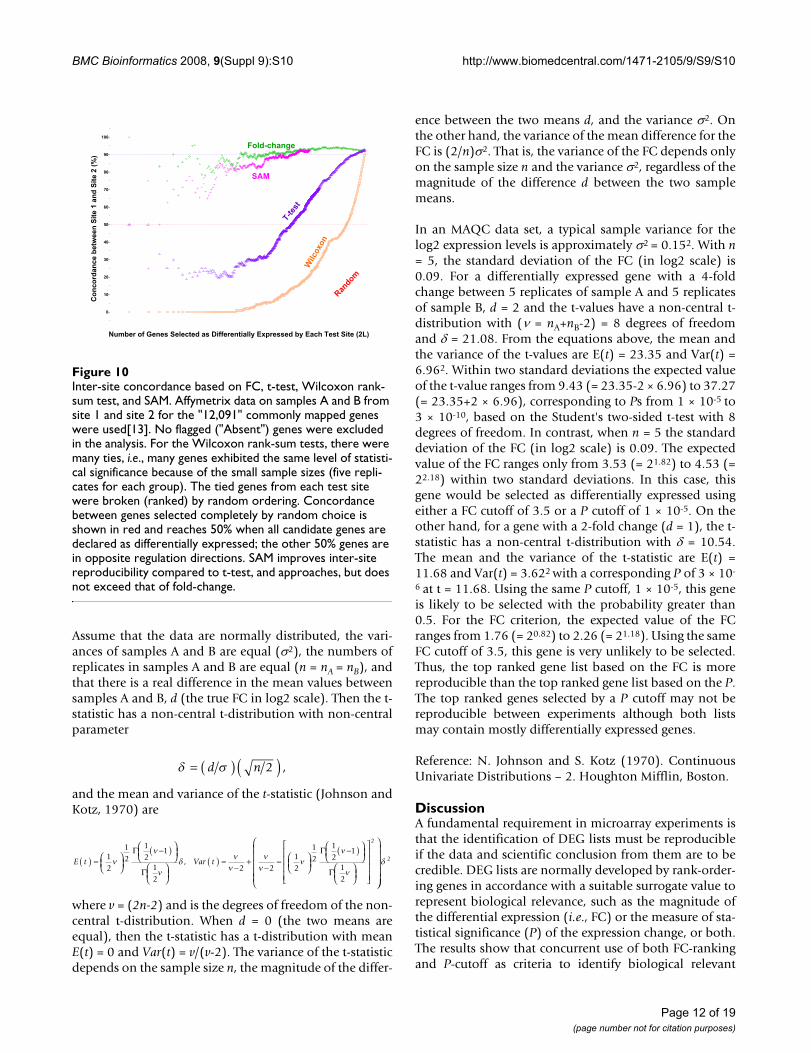
dures, we set out to briefly examine a few examples due totheir popularity. Figure 10 shows the POG results of sev-eral commonly used approaches including FC-ranking, t-test statistic, Wilcoxon rank-sum test, and SAM using AFXsite-site comparison as an example[13]. The POG by SAM(pink line), although greatly improved over that of simplet-test statistic (purple line), approached, but did notexceed, the level of POG based on FC-ranking (greenline). In addition, the small numbers of replicates in thisstudy rendered many ties in the Wilcoxon rank statistic,resulting in poor inter-site concordance in terms of rank-order of the DEGs between the two AFX test sites. Similarfindings (data not shown) were observed using the toxi-cogenomics data set of Guo et al. [21].
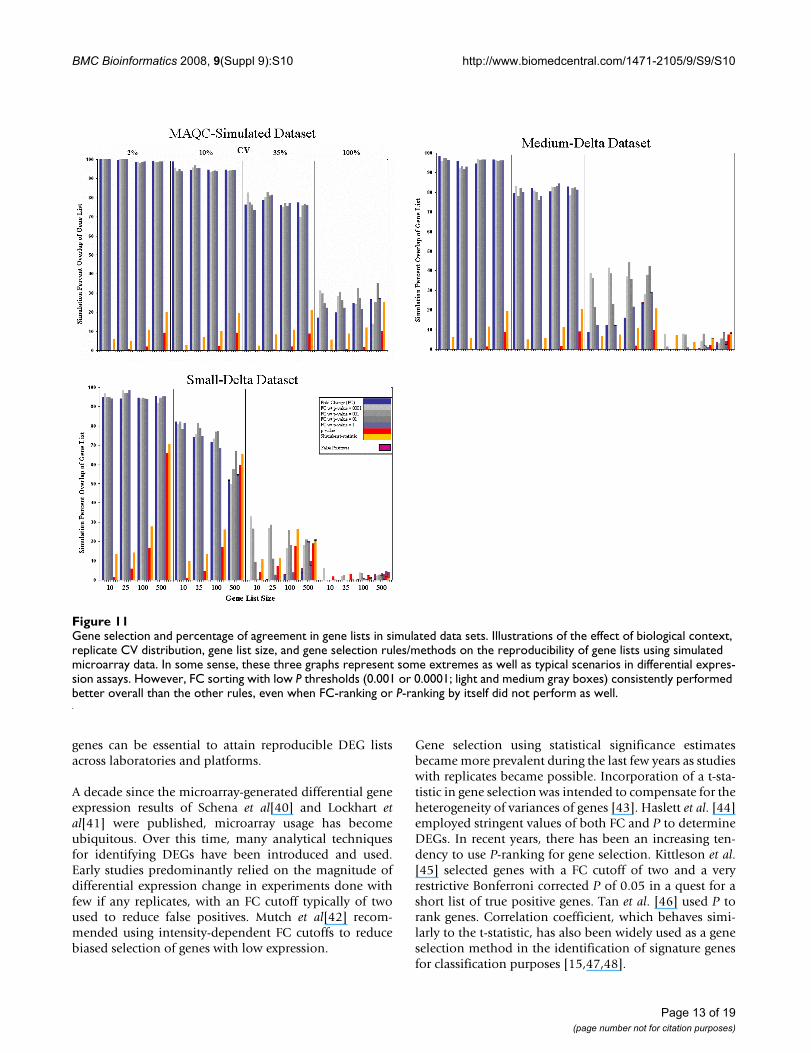
Gene selection in simulated datasetsThe MAQC data, like data from actual experiments, allowsevaluation of DEG list reproducibility, but not of truth.Statistics are used to estimate truth, often in terms of sen-sitivity and specificity, but the estimates are based onassumptions about data variance and error structure thatare also unknown. Simulations where truth can be speci-fied a priori are useful to conduct parametric evaluationsof gene selection methods, and true false positives andnegatives are then known. However, results are sensitiveto assumptions regarding data structure and error that formicroarrays remains poorly characterized.
Figure 11 gives POG versus the number of genes for threesimulated data sets (MAQC-simulated set, Small-Deltasimulated set, and Medium-Delta simulated set, see Meth-ods) that were prepared in order to compare the same
Concordance between microarray and TaqMan® assays without noise-filteringFigure 6Concordance between microarray and TaqMan® assays without noise-filtering. Each panel represents the comparison of one microarray platform to TaqMan® assays. The x-axis represents the number of selected DEGs, and the y-axis is the percentage (%) of genes common to DEGs derived from a microarray platform and those from TaqMan® assays. Shown here are results for comparing sample B and sample A using the entire set of 906 genes for which TaqMan® assay data are available.
0
10
20
30
40
50
60
70
80
90
100
1 10 7 5 3 2 100 60 40 20 1000 400 200 0
10
20
30
40
50
60
70
80
90
100
1 10 7 5 3 2 100 60 40 20 1000 400 200
0
10
20
30
40
50
60
70
80
90
100
1 10 7 5 3 2 100 60 40 20 1000 400 200 0
10
20
30
40
50
60
70
80
90
100
1 10 7 5 3 2 100 60 40 20 1000 400 200
Number of differentially expressed genes (2L)
P ranking
FC ranking
d. GEH
P ranking
FC ranking
e. ILM
P ranking
a. ABI
FC ranking
c. AG1
P ranking
FC ranking
Con
cord
ance
bet
wee
n M
icro
arra
y an
d Ta
qMan
Ass
ay (%
)
0
10
20
30
40
50
60
70
80
90
100
1 10 7 5 3 2 100 60 40 20 1000 500 300
b. AFX
P ranking
FC ranking
“906 genes”Site1 versus TAQ
Page 9 of 19(page number not for citation purposes)
BMC Bioinformatics 2008, 9(Suppl 9):S10 http://www.biomedcentral.com/1471-2105/9/S9/S10
gene selection methods as the MAQC data. The MAQC-simulated set was created to emulate the magnitude andstructure of differential expression observed between theactual MAQC samples A and B (i.e., thousands of geneswith FC > 2). By comparison, the Small-Delta simulateddata set had only 50 significant genes with FC > 2 andmost genes had FC < 1.3. The Medium-Delta data set hadFC profiles in between.
For the MAQC-simulated data, either FC-ranking or FC-ranking combined with any of the P threshold resulted inmarkedly higher POG than any P-ranking method, regard-less of gene list length and coefficient of variation (CV) ofreplicates. The POG is ~100%, ~95%, and ~75%, for rep-licate CV values of 2%, 10%, and 35% CV, respectively,
decreasing to about 20–30% with an exceedingly high(100%) CV. In contrast, POG from P-ranking alone variesfrom a few percent to only ~10% when 500 genes areselected.
For the Medium- and Small-Delta simulated data sets, dif-ferences start to emerge between using FC alone and FCwith P cutoff. From Figure 11, when variances in replicatesbecome larger (CV > 10%), the reproducibility is greatlyenhanced using FC-ranking with a suitable P cutoff versusFC or P by themselves. In addition, when variances aresmall (CV ≤ 10%), the reproducibility is essentially thesame for FC with P or without. What is clear is that P byitself did not produce the most reproducible DEG listunder any simulated condition.
Inter-site reproducibility of log2 FC and log2 t-statisticFigure 7Inter-site reproducibility of log2 FC and log2 t-statistic. a: log2 FC of site 1 versus log2 FC of site 2; b: log2 t-statistic of test site 1 versus log2 t-statistic of test site 2; and c: log2 FC of test site 1 versus log2 t-statistic of test site 1. Shown here are results for comparing sample B and sample A for all "12,091" genes commonly probed by the five microarray platforms. The inter-site reproducibility of log2 FC (a) is much higher than that of log2 t-statistic (b). The relationship between log2 FC and log2 t-statis-tic from the same test site is non-linear and the correlation appears to be low (c).
ABI AG1 GEH ILM
ABI AG1 GEH ILMlog2
t si
te 2
log2
FC
site
2
a
b
AFX
AFX
log2 FC site 1
log2 t site 1
ABI
log2
t si
te 1
c
AFX AG1 GEH ILM
log2 FC site 1
Page 10 of 19(page number not for citation purposes)
BMC Bioinformatics 2008, 9(Suppl 9):S10 http://www.biomedcentral.com/1471-2105/9/S9/S10
Although P-ranking generally resulted in very low POG, afalse positive was rarely produced, even for a list size of500 (data not shown). Thus, the P criterion performed asexpected, and identified mostly true positives. Unfortu-nately, the probability of selection of the same true posi-tives with a fixed P cutoff in a replicated experimentappears small due to variation in the P statistic itself (seeinset). FC-ranking by itself resulted in a large number offalse positives with a large number of genes for theMedium and Small-Delta sets when genes with small FCsare selected as differentially expressed. These false posi-tives were greatly reduced to the same level as for the P-ranking alone when FC-ranking was combined with a P-cutoff.
Variability of the two-sample t-statisticIn a two-sample t-test comparing the mean of sample A tothe mean of sample B, the t-statistic is given as follows:
where is the average of the log2 expression levels of
sample A with nA replicates, and is the average of the
log2 expression levels of sample B with nB replicates, and
Sp2 = (SSA+SSB)/(nA+nB-2) is the pooled variance of sam-
ples A and B, and SS denotes the sum of squared errors.The numerator of the t-statistic is the fold-change (FC) inlog2 scale and represents the signal level of the measure-ments (i.e., the magnitude of the difference between theexpression levels of sample A and sample B). The denom-inator represents the noise components from the meas-urements of samples A and B. Thus, the t-statisticrepresents a measure of the signal-to-noise ratio. There-fore, the FC and the t-statistic (P) are two measures for thedifferences between the means of sample A and sample B.The t-statistic is intrinsically less reproducible than FCwhen the variance is small.
t BX AX
SpBn
SpAn
=−
+2 2
AX
BX
Volcano plot illustration of joint FC and P gene selection ruleFigure 9Volcano plot illustration of joint FC and P gene selection rule. Genes in sectors A and C are selected as differentially expressed. The colors correspond to the negative log10 P and log2 fold change values: Red: 20 < -log10 P < 50 and 3 < log2 fold < 9 or -9 < log2 fold < -3. Blue: 10 < -log10 P < 50 and 2 < log2 fold < 3 or -3 < log2 fold < -2. Yellow: 4 < -log10 P < 50 and 1 < log2 fold < 2 or -2 < log2 fold < -1. Pink : 10 < -log10 P < 20 and 3 < log2 fold or log2 fold < -3. Light blue: 4 < -log10 P < 10 and 2 < log2 fold or log2 fold < -2. Light green: 2 < -log10 P < 4 and 1 < log2 fold or log2 fold < -1. Gray)
Concordance between FC and P based gene ranking methods ("12,091 genes"; test site 1)Figure 8Concordance between FC and P based gene ranking methods ("12,091 genes"; test site 1). Each POG line represents a plat-form using data from its first test site. The x-axis represents the number of selected DEGs, and the y-axis is the percent-age (%) of genes common in the DEGs derived from FC- and P-ranking. Shown here are results for comparing sample B and sample A for all "12,091" genes commonly probed. When a smaller number of genes (up to a few hundreds or thousands) are selected, POG for cross selection method comparison (FC vs. P) is low. For example, there are only about 50% genes in common for the top 500 genes selected by FC and P separately, indicating that FC and P rank order DEGs dramatically differently. When the number of selected DEGs increases, the overlap between the two methods increases, and eventually approach to 100% in common, as expected. The low concordance between FC- and P-based gene ranking methods is not unexpected considering their different definitions and low correlation (Figure 7c).
0
10
20
30
40
50
60
70
80
90
100
1 10 8 6 5 4 3 2 100 70 50 40 30 20 1000 700 500 300 200 10000 6000 4000 2000
Number of differentially expressed genes (2L)
Con
cord
ance
bet
wee
n G
ene
List
s Se
lect
ed b
y FC
and
P (%
)
AFX
AG1
ILM
GEH
ABI
Page 11 of 19(page number not for citation purposes)
BMC Bioinformatics 2008, 9(Suppl 9):S10 http://www.biomedcentral.com/1471-2105/9/S9/S10
Assume that the data are normally distributed, the vari-ances of samples A and B are equal (σ2), the numbers ofreplicates in samples A and B are equal (n = nA = nB), andthat there is a real difference in the mean values betweensamples A and B, d (the true FC in log2 scale). Then the t-statistic has a non-central t-distribution with non-centralparameter
and the mean and variance of the t-statistic (Johnson andKotz, 1970) are
where v = (2n-2) and is the degrees of freedom of the non-central t-distribution. When d = 0 (the two means areequal), then the t-statistic has a t-distribution with meanE(t) = 0 and Var(t) = v/(v-2). The variance of the t-statisticdepends on the sample size n, the magnitude of the differ-
ence between the two means d, and the variance σ2. Onthe other hand, the variance of the mean difference for theFC is (2/n)σ2. That is, the variance of the FC depends onlyon the sample size n and the variance σ2, regardless of themagnitude of the difference d between the two samplemeans.
In an MAQC data set, a typical sample variance for thelog2 expression levels is approximately σ2 = 0.152. With n= 5, the standard deviation of the FC (in log2 scale) is0.09. For a differentially expressed gene with a 4-foldchange between 5 replicates of sample A and 5 replicatesof sample B, d = 2 and the t-values have a non-central t-distribution with (ν = nA+nB-2) = 8 degrees of freedomand δ = 21.08. From the equations above, the mean andthe variance of the t-values are E(t) = 23.35 and Var(t) =6.962. Within two standard deviations the expected valueof the t-value ranges from 9.43 (= 23.35-2 × 6.96) to 37.27(= 23.35+2 × 6.96), corresponding to Ps from 1 × 10⁻⁵ to3 × 10-10, based on the Student's two-sided t-test with 8degrees of freedom. In contrast, when n = 5 the standarddeviation of the FC (in log2 scale) is 0.09. The expectedvalue of the FC ranges only from 3.53 (= 21.82) to 4.53 (=22.18) within two standard deviations. In this case, thisgene would be selected as differentially expressed usingeither a FC cutoff of 3.5 or a P cutoff of 1 × 10⁻⁵. On theother hand, for a gene with a 2-fold change (d = 1), the t-statistic has a non-central t-distribution with δ = 10.54.The mean and the variance of the t-statistic are E(t) =11.68 and Var(t) = 3.622 with a corresponding P of 3 × 10-
6 at t = 11.68. Using the same P cutoff, 1 × 10⁻⁵, this geneis likely to be selected with the probability greater than0.5. For the FC criterion, the expected value of the FCranges from 1.76 (= 20.82) to 2.26 (= 21.18). Using the sameFC cutoff of 3.5, this gene is very unlikely to be selected.Thus, the top ranked gene list based on the FC is morereproducible than the top ranked gene list based on the P.The top ranked genes selected by a P cutoff may not bereproducible between experiments although both listsmay contain mostly differentially expressed genes.
Reference: N. Johnson and S. Kotz (1970). ContinuousUnivariate Distributions – 2. Houghton Mifflin, Boston.
DiscussionA fundamental requirement in microarray experiments isthat the identification of DEG lists must be reproducibleif the data and scientific conclusion from them are to becredible. DEG lists are normally developed by rank-order-ing genes in accordance with a suitable surrogate value torepresent biological relevance, such as the magnitude ofthe differential expression (i.e., FC) or the measure of sta-tistical significance (P) of the expression change, or both.The results show that concurrent use of both FC-rankingand P-cutoff as criteria to identify biological relevant
δ σ= ( ) ( )d n 2 ,
E t Var t( ) = ⎛⎝⎜
⎞⎠⎟
−( )⎛⎝⎜
⎞⎠⎟
⎛⎝⎜
⎞⎠⎟
( ) =−
+−
12
12
12
1
12
2 2ν
ν
νδ ν
νν
ν
Γ
Γ, −− ⎛
⎝⎜⎞⎠⎟
−( )⎛⎝⎜
⎞⎠⎟
⎛⎝⎜
⎞⎠⎟
⎡
⎣
⎢⎢⎢⎢
⎤
⎦
⎥⎥⎥⎥
⎛
⎝
⎜⎜⎜⎜⎜
⎞
12
12
12
1
12
2
νν
ν
Γ
Γ⎠⎠
⎟⎟⎟⎟⎟
δ 2
Inter-site concordance based on FC, t-test, Wilcoxon rank-sum test, and SAMFigure 10Inter-site concordance based on FC, t-test, Wilcoxon rank-sum test, and SAM. Affymetrix data on samples A and B from site 1 and site 2 for the "12,091" commonly mapped genes were used[13]. No flagged ("Absent") genes were excluded in the analysis. For the Wilcoxon rank-sum tests, there were many ties, i.e., many genes exhibited the same level of statisti-cal significance because of the small sample sizes (five repli-cates for each group). The tied genes from each test site were broken (ranked) by random ordering. Concordance between genes selected completely by random choice is shown in red and reaches 50% when all candidate genes are declared as differentially expressed; the other 50% genes are in opposite regulation directions. SAM improves inter-site reproducibility compared to t-test, and approaches, but does not exceed that of fold-change.
0
10
20
30
40
50
60
70
80
90
100
Con
cord
ance
bet
wee
n Si
te 1
and
Site
2 (%
)
Number of Genes Selected as Differentially Expressed by Each Test Site (2L)Ran
dom
Wilc
oxon
T-tes
t
SAM
Fold-change
Page 12 of 19(page number not for citation purposes)
BMC Bioinformatics 2008, 9(Suppl 9):S10 http://www.biomedcentral.com/1471-2105/9/S9/S10
genes can be essential to attain reproducible DEG listsacross laboratories and platforms.
A decade since the microarray-generated differential geneexpression results of Schena et al[40] and Lockhart etal[41] were published, microarray usage has becomeubiquitous. Over this time, many analytical techniquesfor identifying DEGs have been introduced and used.Early studies predominantly relied on the magnitude ofdifferential expression change in experiments done withfew if any replicates, with an FC cutoff typically of twoused to reduce false positives. Mutch et al[42] recom-mended using intensity-dependent FC cutoffs to reducebiased selection of genes with low expression.
Gene selection using statistical significance estimatesbecame more prevalent during the last few years as studieswith replicates became possible. Incorporation of a t-sta-tistic in gene selection was intended to compensate for theheterogeneity of variances of genes [43]. Haslett et al. [44]employed stringent values of both FC and P to determineDEGs. In recent years, there has been an increasing ten-dency to use P-ranking for gene selection. Kittleson et al.[45] selected genes with a FC cutoff of two and a veryrestrictive Bonferroni corrected P of 0.05 in a quest for ashort list of true positive genes. Tan et al. [46] used P torank genes. Correlation coefficient, which behaves simi-larly to the t-statistic, has also been widely used as a geneselection method in the identification of signature genesfor classification purposes [15,47,48].
Gene selection and percentage of agreement in gene lists in simulated data setsFigure 11Gene selection and percentage of agreement in gene lists in simulated data sets. Illustrations of the effect of biological context, replicate CV distribution, gene list size, and gene selection rules/methods on the reproducibility of gene lists using simulated microarray data. In some sense, these three graphs represent some extremes as well as typical scenarios in differential expres-sion assays. However, FC sorting with low P thresholds (0.001 or 0.0001; light and medium gray boxes) consistently performed better overall than the other rules, even when FC-ranking or P-ranking by itself did not perform as well.
Page 13 of 19(page number not for citation purposes)
BMC Bioinformatics 2008, 9(Suppl 9):S10 http://www.biomedcentral.com/1471-2105/9/S9/S10
New and widely employed methods have appeared inrecent years and implicitly correct for the large variance inthe t-statistic that results when gene variance is estimatedwith a small number of samples. Allison et al. [16] collec-tively described these methods as "variance shrinkage"approaches. They include the popular permutation-based"SAM" procedure [5,12,49,50], Bayesian-basedapproaches [43,51] and others [52]. Qin et al. [34] com-pared several variance shrinkage methods with a simple t-statistic and FC for spike-in gene identification on a two-color platform, concluding that all methods except P per-formed well. All these methods have the effect of reducinga gene's variance to be between the average for the sam-ples, and the average over the arrays.
In some cases, however, the use of FC for gene selectionwas criticized and entirely abandoned. For example, Cal-low et al. [53], using P alone for identifying DEGs, con-cluded that P alone eliminated the need for filtering lowintensity spots because the t-statistic is uniformly distrib-uted across the entire intensity range. Reliance on P aloneto represent a gene's FC and variability in gene selectionhas become commonplace. Norris and Kahn [54] describehow false discovery rate (FDR) has become so widely usedas to constitute a standard to which microarray analysesare held. However, FDR usually employs a shrunken t-sta-tistic and genes are ranked and selected similar to P (seeFigure 11).
Prior to MAQC, Irizarry et al. [55] compared data fromfive laboratories and three platforms using the CAT plotsthat are essentially the same as the POG graphs used inour study. Lists of less than 100 genes derived from FC-ranking showed 30 to 80% intra-site, inter-site, and inter-platform concordance. Interestingly, important disagree-ments were attributable to a small number of genes withlarge FC that they posit resulted from a laboratory effectdue to inexperienced technicians and sequence-specificeffects where some genes are not correctly measured.
Exactly how to best employ FC with P to identify genes isa function of both the nature of the data, and the inevita-ble tradeoff between sensitivity and specificity that isfamiliar across research, clinical screening and diagnos-tics, and even drug discovery. But how the tradeoff ismade depends on the application. Fewer false negatives atthe cost of more false positives may be desirable when theapplication is identifying a few hundred genes for furtherstudy, and FC-ranking with a non-stringent P value cutofffrom a simple t-test could be used to eliminate somenoise. The gene list can be further evaluated in terms ofgene function and biological pathway data, as illustratedin Guo et al. [21] for toxicogenomic data. Even for rela-tively short gene lists, FC-ranking together with a non-stringent P cutoff should result in reproducible lists. In
addition, DEG lists identified by the ranking of FC ismuch less susceptible to the impact of normalizationmethods. In fact, global scaling methods (e.g., median- ormean-scaling) do not change the relative ranking of genesbased on FC; they do, however, impact gene ranking by P-value [21].
The tradeoffs between reproducibility, sensitivity, andspecificity become pronounced when genes are selectedby P alone without consideration of FC, especially when astringent P cutoff is used to reduce false positives. Whensample numbers are small, any gene's t-statistic canchange considerably in repeated studies within or acrosslaboratories or across platforms. Each study can select dif-ferent significant genes, purely by chance. It is entirelypossible that separately determined lists will have a smallproportion of common genes even while each list com-prises mostly true positives. This apparent lack of repro-ducibility of the gene lists is an expected outcome ofstatistical variation in the t-statistic for small numbers ofsample replicates. In other words, each study fails to pro-duce some, but not all, of the correct results. The side boxprovides a numerical example of how gene list discord-ance can result from variation in the t-statistic across stud-ies. Decreasing the P cutoff will increase the proportion oftrue positives, but also diminish the number of selectedgenes, diminish genes common across lists, and increasefalse negatives. Importantly, selecting genes based on asmall P cutoff derived from a simple t-test without consid-eration of FC renders the gene list non-reproducible.
Additional insight is gained by viewing gene selectionfrom the perspective of the biologist ultimately responsi-ble for interpreting microarray results. Statistically speak-ing, a microarray experiment tests 10,000 or more nullhypotheses where essentially all genes have non-zero dif-ferential expression. Statistical tests attempt to account foran unknowable error structure, in order to eliminate thegenes with low probability of biological relevance. To thebiologist, however, the variance of a gene with a large FCin one microarray study may be irrelevant if a similarexperiment again finds the gene to have a large FC; the sec-ond experiment would probably be considered a validat-ing reproduction. This conclusion would be reasonablesince the gene's P depends on a poor estimate of varianceacross few samples, whereas a repeated FC measurementis tangible reproducibility which tends to increase demon-strably with increasing FC. The biological interpreter canalso consider knowledge of gene function and biologicalpathways before finally assigning biological relevance,and will be well aware that either P or FC is only anotherindicator regarding biological significance.
This study shows that genes with smaller expression foldchanges generated from one platform or laboratory are, in
Page 14 of 19(page number not for citation purposes)
BMC Bioinformatics 2008, 9(Suppl 9):S10 http://www.biomedcentral.com/1471-2105/9/S9/S10
general, less reproducible in another laboratory with thesame or different platforms. However, it should be notedthat genes with small fold changes may be biologicallyimportant [56]. When a fixed FC cutoff is chosen, sensitiv-ity could be sacrificed for reproducibility. Alternatively,when a high P cutoff (or no P cutoff) is used, specificitycould be sacrificed for reproducibility. Ultimately, theacceptable trade-off is based on the specific questionbeing asked or the need being addressed. When searchingfor a few reliable biomarkers, high FC and low P cutoffscan be used to produce a highly specific and reproduciblegene list. When identifying the components of geneticnetworks involved in biological processes, a lower FC andhigher P cutoff can be used to identify larger, more sensi-tive but less specific, gene lists. In this case, additional bio-logical information about putative gene functions can beincorporated to identify reliable gene lists that are specificto the biological process of interest.
Truly differentially expressed genes should be more likelyidentified as differentially expressed by different plat-forms and from different laboratories than those geneswith no differential expression between sample groups. Inthe microarray field, we usually do not have the luxury ofknowing the "truth" in a given study. Therefore, it is notsurprising that most microarray studies and data analysisprotocols have not been adequately evaluated against the"truth". A reasonable surrogate of such "truth" could bethe consensus of results from different microarray plat-forms, from different laboratories using the same plat-form, or from independent methods such as TaqMan®
assays, as we have extensively explored in this study.
The fundamental scientific requirement of reproducibilityis a critical dimension to consider along with balancingspecificity and sensitivity when defining a gene list. Irre-producibility would render microarray technology gener-ally, and any research result, specifically, vulnerable tocriticism. New methods for the identification of DEGscontinue to appear in the scientific literature. These meth-ods are typically promoted in terms of improved sensitiv-ity (power) while retaining nominal rates of specificity.However, reproducibility is seldom emphasized.
ConclusionThe results show that selecting DEGs based solely on Pfrom a simple t-test most often predestines a poor con-cordance in DEG lists, particularly for small numbers ofgenes. In contrast, using FC-ranking in conjunction with anon-stringent P-cutoff results in more concordant genelists concomitant with needed reproducibility, even forfairly small numbers of genes. Moreover, enhanced repro-ducibility holds for inter-site, cross-platform, andbetween microarray and TaqMan® assay comparisons, andis independent of platforms, sample pairs, and normaliza-
tion methods. The results should increase confidence inthe reproducibility of data produced by microarray tech-nology and should also expand awareness that gene listsidentified solely based on P will tend to be discordant.This work demonstrates the need for a shift from the com-mon practice of selecting differentially expressed genessolely on the ranking of a statistical significance measure(e.g., t-statistic) to an approach that emphasizes fold-change, a quantity actually measured by microarray tech-nology.
Conclusions and recommendations1. A fundamental step of microarray studies is the identi-fication of a small subset of DEGs from among tens ofthousands of genes probed on the microarray. DEG listsmust be concordant to satisfy the scientific requirement ofreproducibility, and must also be specific and sensitive forscientific relevance. A baseline practice is needed for prop-erly assessing reproducibility/concordance alongside spe-cificity and sensitivity.
2. Reports of DEG list instability in the literature are oftena direct consequence of comparing DEG lists derived froma simple t-statistic when the sample size is small and var-iability in variance estimation is large. Therefore, the prac-tice of using P alone for gene selection should bediscouraged.
3. A DEG list should be chosen in a manner that concur-rently satisfies scientific objectives in terms of inherenttradeoffs between reproducibility, specificity, and sensi-tivity.
4. Using FC and P together balances reproducibility, spe-cificity, and sensitivity. Control of specificity and sensitiv-ity can be accomplished with a P criterion, whilereproducibility is enhanced with an FC criterion. Sensitiv-ity can also be improved by better platforms with greaterdynamic range and lower variability or by increased sam-ple sizes.
5. FC-ranking should be used in combination with a non-stringent P threshold to select a DEG list that is reproduc-ible, specific, and sensitive, and a joint rule is recom-mended as a baseline practice.
MethodsMAQC data setsThe MAQC data sets analyzed in this study are availablefrom GEO under series accession number GSE5350. Anal-yses identified differentially expressed genes between theprimary samples A (Stratagene Universal Human Refer-ence RNA, Catalog #740000) and B (Ambion HumanBrain Reference RNA, Catalog #6050) of the MAQC study.Analyses are additionally limited to data sets from the fol-
Page 15 of 19(page number not for citation purposes)
BMC Bioinformatics 2008, 9(Suppl 9):S10 http://www.biomedcentral.com/1471-2105/9/S9/S10
lowing five commercial genome-wide microarray plat-forms: ABI (Applied Biosystems), AFX (Affymetrix), AG1(Agilent one-color), GEH (GE Healthcare), and ILM (Illu-mina), and to the subset of "12,091" genes commonlyprobed by them. TaqMan® assay data for 906 genes areused to examine gene list comparability between microar-rays and TaqMan® assays. For more information about theMAQC project and the data sets, refer to Shi et al [13].
Normalization methodsThe following manufacturer's preferred normalizationmethods were used: quantile normalization for ABI andILM, PLIER for AFX, and median-scaling for AG1 and GEH[13]. For quantile normalization (including PLIER), eachtest site is independently considered.
Gene ranking (selection) rulesSix gene ranking (selection) methods were examined: (1)FC (fold change ranking); (2) FC_P0.05 (FC-ranking withP cutoff of 0.05); (3) FC_P0.01 (FC-ranking with P cutoffof 0.01); (4) P (P-ranking, simple t-test assuming equalvariance); (5) P_FC2 (P-ranking with FC cutoff of 2); (6)P_FC1.4 (P-ranking with FC cutoff of 1.4). When a cutoffvalue (e.g., P < 0.05) is imposed for a ranking metric (e.g.,FC), it is likely that the lists of candidate genes that meetthe cutoff value may not be the same for the two test sitesor two platforms as a result of differences in inter-site orcross-platform variations. Such differences are part of thegene selection process and have been carried over to thegene ranking/selection stage.
Evaluation criterion – POG (percentage of overlapping genes)The POG (percentage of overlapping genes) calculation[11,13] was applied in three types of comparisons: (1)Inter-site comparison using data from the three test sitesof each platform; (2) Cross-platform comparison betweenABI, AFX, AG1, GEH, and ILM using data from test site 1;for each sample pair, there are ten cross-platform pairs forcomparison; (3) Microarray versus TaqMan® assay com-parisons.
POG is calculated for many different cutoffs that can beconsidered as arbitrary.
The number of genes considered as differentiallyexpressed is denoted as 2L, where L is both the number ofgenes up- and down-regulated. The number of genesavailable for ranking and selection in one direction, L, var-ies from 1 to 6000 (with a step of one) or when there areno more genes in one regulation direction, correspondingto 2L varying from 2 to 12,000. Directionality of gene reg-ulation is considered in POG calculations; genes selectedby two sites or platforms but with different regulation
directionalities are considered as discordant. Therefore,POG can hardly reach 100% in reality.
The formula for calculating POG is: POG =100*(DD+UU)/2L, where DD and UU are the number ofcommonly down- or up-regulated genes, respectively,from the two lists, and L is the number of genes selectedfrom the up- or down-regulation directionality. To over-come the confusion of different numbers for the denomi-nator, in our POG calculations we deliberately selected anequal number of up-regulated and down-regulated genes,L [11]. The POG graphs shown in this study are essentiallythe same as the CAT (correspondence at the top) plotsintroduced by Irizarry et al. [55] and the POG graphs thatwe introduced previously [11] except that in the currentPOG graphs the x-axis is in log-scale to emphasize thedetails when fewer genes are selected.
Noise-filteringMost of the analyses in this study exclude flagging infor-mation; that is, the entire set of "12,091" genes is used inthe analyses. Some calculations are limited to subsets ofgenes commonly detectable ("common present") by thetwo test sites or two platforms under comparison. To bedenoted as "commonly present", the gene is detected("present") in the majority of replicates (e.g., three ormore when there are five replicates) for each sample in asample-pair comparison and for each test site or platform.
Gene selection simulationA simulation was created to emulate the characteristics ofthe MAQC dataset. Fifteen thousand simulated genes werecreated where 5,000 were undifferentiated in expressionbetween simulated biological samples A and B and10,000 were differentiated but at various levels (exponen-tial distribution for the log FC, where almost 4,000 are dif-ferentiated two-fold or higher, similar to a typicalplatform in the MAQC study, divided equally into up anddown regulated genes). To simulate instances of technicalor biological replicates, multiplicative noise (error) wasadded to the signal for each gene for each of five simulatedreplicates for each sample using an error distribution thatwould produce a replicate CV similar to that typically seenin the MAQC data set (i.e., the mean replicate CV wouldbe roughly 10%). The CV for any given gene was ran-domly selected from a trimmed exponential distribution.To address a variety of additional error scenarios but pre-serving the same distribution of fold change, we also con-sidered three additional mean CV values (2%, 35%, and100%). To understand the impact of gene list size on thestability of the DEG list, list sizes of 10, 25, 100, and 500genes were examined for each mean CV scenario. Severalgene selection rules were compared: FC-ranking only, P-ranking only, and shrunken t-statistic ranking. Note: P-ranking is equivalent to t-statistic ranking as well as rank-
Page 16 of 19(page number not for citation purposes)
BMC Bioinformatics 2008, 9(Suppl 9):S10 http://www.biomedcentral.com/1471-2105/9/S9/S10
ing based on FDR that monotonically transforms the P-value. In addition, shrunken t-statistic ranking is equiva-lent to ranking based on the test statistic used by SAM andrelated methods. In addition, rules based on FC-rankingwith a P threshold were also compared (for P = 0.1, 0.01,0.001, and 0.0001). Finally, to simulate differences in thevariation patterns of analytes between platforms and evenbetween laboratories, covariance between laboratories/platforms of the variance for each gene was included inthe simulations. For a given mean CV, 20 or more simu-lated instances of five replicates of simulated biologicalsamples A and B were created and DEG lists were preparedfor each instance that were rank ordered using the meth-ods described above. To determine reproducibility of agiven method for a given mean CV under a given gene listsize, the rank-ordered gene lists from these 20 instanceswere pair-wise compared for consistency and reproduci-bility. The results presented in the graphs are averagesfrom those pair-wise comparisons.
The MAQC actual data is characterized by large magni-tudes of differential expression among the vast majority ofthe 12,091 common genes, with some 4000 exhibiting FC> 2 and hundreds with FC > 10. As such, the data may beatypical of commonplace microarray experiments withbiological effects. Consequently, two other simulationdata sets were created with far fewer genes with large FC,as might be expected in some actual microarray experi-ments. Specifically, the Small-Delta data set was createdwith fewer than 50 genes with FC > 2, and a FC < 1.3 formost differentiated genes, and 10,000 undifferentiatedgenes. In addition, the variances of the genes were corre-lated similar to that observed in the MAQC data. The thirdsimulated dataset, termed the Medium-Delta set, had alarge number of differentiated genes similar to the MAQCsimulated dataset, but with small FC similar to the Small-Delta set. Again, gene variances were correlated similar tothat observed in the MAQC data.
DisclaimerThis document has been reviewed in accordance withUnited States Food and Drug Administration (FDA) pol-icy and approved for publication. Approval does not sig-nify that the contents necessarily reflect the position oropinions of the FDA nor does mention of trade names orcommercial products constitute endorsement or recom-mendation for use. The findings and conclusions in thisreport are those of the author(s) and do not necessarilyrepresent the views of the FDA. James C. Willey is a con-sultant for and has significant financial interest in GeneExpress, Inc.
List of abbreviations usedA: The MAQC sample A (Stratagene Universal HumanReference RNA); ABI: Applied Biosystems microarray plat-
form; AFX: Affymetrix microarray platform; AG1: Agilentone-color microarray platform; B: The MAQC sample B(Ambion Human Brain Reference RNA); C: The MAQCsample C (75%A+25%B mixture); CV: Coefficient of var-iation; D: The MAQC sample D (25%A+75%B mixture);DEG: Differentially expressed genes; FC: Fold change inexpression levels; GEH: GE Healthcare microarray plat-form; ILM: Illumina microarray platform; MAQC: Micro-Array Quality Control project; P: The P-value calculatedfrom a two-tailed two-sample t-test assuming equal vari-ance; POG: Percentage of Overlapping (common) Genesbetween two lists of differentially expressed genes. It isused as a measure of concordance of microarray results.
Competing interestsThe authors declare that they have no competing interests.
Authors' contributionsLS conceived of, designed, and coordinated the study. LS,WDJ, RVJ, SCH, and RDW carried out the data analyses. LSdrafted the manuscript. All authors contributed to thedesign of the study, the preparation of the manuscript,and the sometimes-heated discussions on the topic of thispaper. All authors read and approved the final manu-script.
AcknowledgementsWe thank participants of the MicroArray Quality Control (MAQC) project for generating the large data sets that were used in this study. Many MAQC participants contributed to the sometimes-heated discussions on the topic of this paper during MAQC teleconferences and face-to-face project meet-ings. The common conclusions and recommendations evolved from this extended discourse. Leming Shi and Feng Qian would like to dedicate this work in memory of Prof. Dr. Zhiliang Li of Chongqing University, China.
This article has been published as part of BMC Bioinformatics Volume 9 Sup-plement 9, 2008: Proceedings of the Fifth Annual MCBIOS Conference. Sys-tems Biology: Bridging the Omics. The full contents of the supplement are available online at http://www.biomedcentral.com/1471-2105/9?issue=S9
References1. Tan PK, Downey TJ, Spitznagel EL Jr, Xu P, Fu D, Dimitrov DS, Lem-
picki RA, Raaka BM, Cam MC: Evaluation of gene expressionmeasurements from commercial microarray platforms.Nucleic Acids Res 2003, 31(19):5676-5684.
2. Ramalho-Santos M, Yoon S, Matsuzaki Y, Mulligan RC, Melton DA:"Stemness": transcriptional profiling of embryonic and adultstem cells. Science 2002, 298(5593):597-600.
3. Ivanova NB, Dimos JT, Schaniel C, Hackney JA, Moore KA, LemischkaIR: A stem cell molecular signature. Science 2002,298(5593):601-604.
4. Fortunel NO, Otu HH, Ng HH, Chen J, Mu X, Chevassut T, Li X,Joseph M, Bailey C, Hatzfeld JA, et al.: Comment on " 'Stemness':transcriptional profiling of embryonic and adult stem cells"and "a stem cell molecular signature". Science 2003,302(5644):393. author reply 393.
5. Miller RM, Callahan LM, Casaceli C, Chen L, Kiser GL, Chui B, Kay-sser-Kranich TM, Sendera TJ, Palaniappan C, Federoff HJ: Dysregu-lation of gene expression in the 1-methyl-4-phenyl-1,2,3,6-tetrahydropyridine-lesioned mouse substantia nigra. J Neuro-sci 2004, 24(34):7445-7454.
6. Miklos GL, Maleszka R: Microarray reality checks in the contextof a complex disease. Nat Biotechnol 2004, 22(5):615-621.
Page 17 of 19(page number not for citation purposes)
BMC Bioinformatics 2008, 9(Suppl 9):S10 http://www.biomedcentral.com/1471-2105/9/S9/S10
7. Michiels S, Koscielny S, Hill C: Prediction of cancer outcomewith microarrays: a multiple random validation strategy.Lancet 2005, 365(9458):488-492.
8. Ioannidis JP: Microarrays and molecular research: noise dis-covery? Lancet 2005, 365(9458):454-455.
9. Frantz S: An array of problems. Nat Rev Drug Discov 2005,4(5):362-363.
10. Marshall E: Getting the noise out of gene arrays. Science 2004,306(5696):630-631.
11. Shi L, Tong W, Fang H, Scherf U, Han J, Puri RK, Frueh FW, GoodsaidFM, Guo L, Su Z, et al.: Cross-platform comparability of micro-array technology: intra-platform consistency and appropri-ate data analysis procedures are essential. BMC Bioinformatics2005, 6(Suppl 2):S12.
12. Tusher VG, Tibshirani R, Chu G: Significance analysis of micro-arrays applied to the ionizing radiation response. Proc NatlAcad Sci USA 2001, 98(9):5116-5121.
13. Shi L, Reid LH, Jones WD, Shippy R, Warrington JA, Baker SC, CollinsJ, Longueville Fd, Kawasaki ES, Lee KY, et al.: The MicroArrayQuality Control (MAQC) project shows inter- and intraplat-form reproducibility of gene expression measurements. NatBiotechnol 2006, 24(9):1151-1161.
14. Shi L, Perkins RG, Fang H, Tong W: Reproducible and reliablemicroarray results through quality control: good laboratoryproficiency and appropriate data analysis practices areessential. Curr Opin Biotechnol 2008, 19(1):10-18.
15. Ein-Dor L, Zuk O, Domany E: Thousands of samples are neededto generate a robust gene list for predicting outcome in can-cer. Proc Natl Acad Sci USA 2006, 103(15):5923-5928.
16. Allison DB, Cui X, Page GP, Sabripour M: Microarray data analy-sis: from disarray to consolidation and consensus. Nat RevGenet 2006, 7(1):55-65.
17. Mecham BH, Klus GT, Strovel J, Augustus M, Byrne D, Bozso P, Wet-more DZ, Mariani TJ, Kohane IS, Szallasi Z: Sequence-matchedprobes produce increased cross-platform consistency andmore reproducible biological results in microarray-basedgene expression measurements. Nucleic Acids Res 2004,32(9):e74.
18. Barczak A, Rodriguez MW, Hanspers K, Koth LL, Tai YC, Bolstad BM,Speed TP, Erle DJ: Spotted long oligonucleotide arrays forhuman gene expression analysis. Genome Res 2003,13(7):1775-1785.
19. Shippy R, Sendera TJ, Lockner R, Palaniappan C, Kaysser-Kranich T,Watts G, Alsobrook J: Performance evaluation of commercialshort-oligonucleotide microarrays and the impact of noise inmaking cross-platform correlations. BMC Genomics 2004,5(1):61.
20. Hoffman EP: Expression profiling – best practices for data gen-eration and interpretation in clinical trials. Nat Rev Genet 2004,5(3):229-237.
21. Guo L, Lobenhofer EK, Wang C, Shippy R, Harris SC, Zhang L, MeiN, Chen T, Herman D, Goodsaid FM, et al.: Rat toxicogenomicstudy reveals analytical consistency across microarray plat-forms. Nat Biotechnol 2006, 24(9):1162-1169.
22. Shi L, Jones W, Jensen RV, Harris SC, Perkins R, Goodsaid FM, GuoL, Croner LJ, Boysen C, Fang H, et al.: The reproducibility of listsof differentially expressed genes in microarray studies.Nature Precedings 2007 [http://precedings.nature.com/documents/306/version/302].
23. Strauss E: Arrays of hope. Cell 2006, 127(4):657-659.24. Eisenstein M: Microarrays: quality control. Nature 2006,
442(7106):1067-1070.25. Couzin J: Genomics. Microarray data reproduced, but some
concerns remain. Science 2006, 313(5793):1559.26. Kiermer V: Microarray quality in the spotlight again. Nat Meth-
ods 2006, 3(10):772.27. Sage L: Do microarrays measure up? Anal Chem 2006,
78(21):7358-7360.28. Klebanov L, Qiu X, Welle S, Yakovlev A: Statistical methods and
microarray data. Nat Biotechnol 2007, 25(1):25-26.29. Shi L, Jones WD, Jensen RV, Wolfinger RD, Kawasaki ES, Herman D,
Guo L, Goodsaid FM, Tong W: Reply to Statistical methods andmicroarray data. Nat Biotechnol 2007, 25(1):26-27.
30. Shi L: New hot paper comment. ESI Special Topics 2007 [http://www.esi-topics.com/nhp/2007/march-07-LemingShi.html].
31. Chen JJ, Wang SJ, Tsai CA, Lin CJ: Selection of differentiallyexpressed genes in microarray data analysis. Pharmacogenom-ics J 2007, 7(3):212-220.
32. Chen J, Hsueh HM, Delongchamp R, Lin CJ, Tsai CA: Reproducibil-ity of microarray data: a further analysis of microarray qual-ity control (MAQC) data. BMC Bioinformatics 2007, 8(1):412.
33. Perkel JM: Six things you won't find in the MAQC. The Scientist2007, 20(11):68.
34. Qin LX, Kerr KF: Empirical evaluation of data transformationsand ranking statistics for microarray analysis. Nucleic Acids Res2004, 32(18):5471-5479.
35. Kim S, Lee J: Comparison of various statistical methods foridentifying differential gene expression in replicated micro-array data. Statistical Methods in Medical Research 2006, 15:1-18.
36. Shippy R, Wolber P, Jones WD, Jensen RV, Fulmer-Smentek S, John-son CD, Pine PS, Boysen C, Guo X, Chudin E, et al.: Using RNAsample titrations to assess microarray platform perform-ance and normalization techniques. Nat Biotechnol 2006,24(9):1123-1131.
37. Wang Y, Barbacioru C, Hyland F, Xiao W, Hunkapiller KL, Blake J,Chan F, Gonzalez C, Zhang L, Samaha RR: Large scale real-timePCR validation on gene expression measurements from twocommercial long-oligonucleotide microarrays. BMC Genomics2006, 7:59.
38. Kuo WP, Liu F, Trimarchi J, Punzo C, Lombardi M, Sarang J, WhippleME, Maysuria M, Serikawa K, Lee SY, et al.: A sequence-orientedcomparison of gene expression measurements across differ-ent hybridization-based technologies. Nat Biotechnol 2006,24(7):832-840.
39. Canales RD, Luo Y, Willey JC, Austermiller B, Barbacioru CC, BoysenC, Hunkapiller K, Jensen RV, Knight C, Lee KY, et al.: Evaluation ofDNA microarray results with quantitative gene expressionplatforms. Nat Biotechnol 2006, 24(9):1115-1122.
40. Schena M, Shalon D, Davis RW, Brown PO: Quantitative monitor-ing of gene expression patterns with a complementary DNAmicroarray. Science 1995, 270(5235):467-470.
41. Lockhart DJ, Dong H, Byrne MC, Follettie MT, Gallo MV, Chee MS,Mittmann M, Wang C, Kobayashi M, Horton H, et al.: Expressionmonitoring by hybridization to high-density oligonucleotidearrays. Nat Biotechnol 1996, 14(13):1675-1680.
42. Mutch DM, Berger A, Mansourian R, Rytz A, Roberts MA: Microar-ray data analysis: a practical approach for selecting differen-tially expressed genes. Genome Biol 2001, 2(12):PREPRINT0009.
43. Baldi P, Long AD: A Bayesian framework for the analysis ofmicroarray expression data: regularized t-test and statisticalinferences of gene changes. Bioinformatics 2001, 17(6):509-519.
44. Haslett JN, Sanoudou D, Kho AT, Bennett RR, Greenberg SA, KohaneIS, Beggs AH, Kunkel LM: Gene expression comparison of biop-sies from Duchenne muscular dystrophy (DMD) and normalskeletal muscle. Proc Natl Acad Sci USA 2002, 99(23):15000-15005.
45. Kittleson MM, Minhas KM, Irizarry RA, Ye SQ, Edness G, Breton E,Conte JV, Tomaselli G, Garcia JG, Hare JM: Gene expression ingiant cell myocarditis: Altered expression of immuneresponse genes. Int J Cardiol 2005, 102(2):333-340.
46. Tan FL, Moravec CS, Li J, Apperson-Hansen C, McCarthy PM, YoungJB, Bond M: The gene expression fingerprint of human heartfailure. Proc Natl Acad Sci USA 2002, 99(17):11387-11392.
47. Ein-Dor L, Kela I, Getz G, Givol D, Domany E: Outcome signaturegenes in breast cancer: is there a unique set? Bioinformatics2005, 21(2):171-178.
48. Tan Y, Shi L, Tong W, Wang C: Multi-class cancer classificationby total principal component regression (TPCR) usingmicroarray gene expression data. Nucleic Acids Res 2005,33(1):56-65.
49. Kerr MK, Churchill GA: Experimental design for gene expres-sion microarrays. Biostatistics 2001, 2(2):183-201.
50. Wellmer F, Riechmann JL, Alves-Ferreira M, Meyerowitz EM:Genome-wide analysis of spatial gene expression in Arabi-dopsis flowers. Plant Cell 2004, 16(5):1314-1326.
51. Newton MA, Kendziorski CM, Richmond CS, Blattner FR, Tsui KW:On differential variability of expression ratios: improving sta-tistical inference about gene expression changes frommicroarray data. J Comput Biol 2001, 8(1):37-52.
52. Cui X, Hwang JT, Qui J, Blades NJ, Churchill GA: Improved statis-tical tests for differential gene expression by shrinking vari-ance components estimates. Biostatistics 2005, 6:59-75.
Page 18 of 19(page number not for citation purposes)
http://www.ncbi.nlm.nih.gov/entrez/query.fcgi?cmd=Retrieve&db=PubMed&dopt=Abstract&list_uids=7569999
http://www.ncbi.nlm.nih.gov/entrez/query.fcgi?cmd=Retrieve&db=PubMed&dopt=Abstract&list_uids=7569999
http://www.ncbi.nlm.nih.gov/entrez/query.fcgi?cmd=Retrieve&db=PubMed&dopt=Abstract&list_uids=7569999
http://www.ncbi.nlm.nih.gov/entrez/query.fcgi?cmd=Retrieve&db=PubMed&dopt=Abstract&list_uids=9634850
http://www.ncbi.nlm.nih.gov/entrez/query.fcgi?cmd=Retrieve&db=PubMed&dopt=Abstract&list_uids=9634850
BMC Bioinformatics 2008, 9(Suppl 9):S10 http://www.biomedcentral.com/1471-2105/9/S9/S10
Publish with BioMed Central and every scientist can read your work free of charge
"BioMed Central will be the most significant development for disseminating the results of biomedical research in our lifetime."
Sir Paul Nurse, Cancer Research UK
Your research papers will be:
available free of charge to the entire biomedical community
peer reviewed and published immediately upon acceptance
cited in PubMed and archived on PubMed Central
yours — you keep the copyright
Submit your manuscript here:http://www.biomedcentral.com/info/publishing_adv.asp
BioMedcentral
53. Callow MJ, Dudoit S, Gong EL, Speed TP, Rubin EM: Microarrayexpression profiling identifies genes with altered expressionin HDL-deficient mice. Genome Res 2000, 10(12):2022-2029.
54. Norris AW, Kahn CR: Analysis of gene expression in patho-physiological states: balancing false discovery and false nega-tive rates. Proc Natl Acad Sci USA 2006, 103(3):649-653.
55. Irizarry RA, Warren D, Spencer F, Kim IF, Biswal S, Frank BC, Gabri-elson E, Garcia JG, Geoghegan J, Germino G, et al.: Multiple-labora-tory comparison of microarray platforms. Nat Methods 2005,2(5):345-350.
56. Hughes TR, Marton MJ, Jones AR, Roberts CJ, Stoughton R, ArmourCD, Bennett HA, Coffey E, Dai H, He YD, et al.: Functional discov-ery via a compendium of expression profiles. Cell 2000,102(1):109-126.
Page 19 of 19(page number not for citation purposes)