Differentially expressed genes in gastric tumors identified by cDNA array
13
Differentially expressed genes in gastric tumors identified by cDNA array Sibele I. Meireles a,b , Alex F. Carvalho b , Roberto Hirata Jr c,d , Andre ´ L. Montagnini a , Waleska K. Martins b , Franco B. Runza b , Beatriz S. Stolf b,e , Lara Termini a , Chamberlein E.M. Neto b , Ricardo L.A. Silva b , Fernando A. Soares a , E. Jorda ˜o Neves c , Luiz F.L. Reis a,b, * a Hospital do Ca ˆncer A.C. Camargo, Rua Professor Antonio Prudente 109, 01509-010 Sa ˜o Paulo, SP, Brazil b Ludwig Institute for Cancer Research, Rua Professor Antonio Prudente 109, 01509-010 Sa ˜o Paulo, SP, Brazil c Instituto de Matema ´tica e EstatI ´ stica and BIOINFO, Universidade de Sa ˜o Paulo, Sa ˜o Paulo, SP, Brazil d SENAC College of Computer Science and Technology, Sa ˜o Paulo, SP, Brazil e Instituto de QuI ´ mica, Universidade de Sa ˜o Paulo, Sa ˜o Paulo, SP, Brazil Received 21 August 2002; received in revised form 8 October 2002; accepted 10 October 2002 Abstract Using cDNA fragments from the FAPESP/lICR Cancer Genome Project, we constructed a cDNA array having 4512 elements and determined gene expression in six normal and six tumor gastric tissues. Using t-statistics, we identified 80 cDNAs whose expression in normal and tumor samples differed more than 3.5 sample standard deviations. Using Self-Organizing Map, the expression profile of these cDNAs allowed perfect separation of malignant and non-malignant samples. Using the supervised learning procedure Support Vector Machine, we identified trios of cDNAs that could be used to classify samples as normal or tumor, based on single-array analysis. Finally, we identified genes with altered linear correlation when their expression in normal and tumor samples were compared. Further investigation concerning the function of these genes could contribute to the understanding of gastric carcinogenesis and may prove useful in molecular diagnostics. q 2002 Elsevier Science Ireland Ltd. All rights reserved. Keywords: Gene expression; Gastric cancer; cDNA array; Molecular marker 1. Introduction During the last 10 years, the incidence of gastric cancer is declining worldwide but, nevertheless, it is still a tumor of high incidence [1]. Worldwide, tumors of the stomach are the fourth in incidence and second in cancer-related deaths (IARC home page: http:// www.dep.iarc.fr). At the molecular level, little is known about the mechanisms involved in gastric carcinogenesis. As established for tumors in general, it was proposed that, for gastric adenocarcinomas, accumulation of genetic alterations in a multistep fashion would correlate with disease progression and differences between diffuse and intestinal type adenocarcinomas would be linked to distinct mutation pathways [2]. These genetic 0304-3835/02/$ - see front matter q 2002 Elsevier Science Ireland Ltd. All rights reserved. doi:10.1016/S0304-3835(02)00587-6 Cancer Letters 190 (2003) 199–211 www.elsevier.com/locate/canlet * Corresponding author. Tel.: þ55-11-3207-4922; fax: þ 55-11- 3207-7001. E-mail address: [email protected] (L.F.L. Reis).
-
Upload
independent -
Category
Documents
-
view
0 -
download
0
Transcript of Differentially expressed genes in gastric tumors identified by cDNA array

Differentially expressed genes in gastric tumors identified by
cDNA array
Sibele I. Meirelesa,b, Alex F. Carvalhob, Roberto Hirata Jrc,d, Andre L. Montagninia,Waleska K. Martinsb, Franco B. Runzab, Beatriz S. Stolfb,e, Lara Terminia, Chamberlein
E.M. Netob, Ricardo L.A. Silvab, Fernando A. Soaresa,E. Jordao Nevesc, Luiz F.L. Reisa,b,*
aHospital do Cancer A.C. Camargo, Rua Professor Antonio Prudente 109, 01509-010 Sao Paulo, SP, BrazilbLudwig Institute for Cancer Research, Rua Professor Antonio Prudente 109, 01509-010 Sao Paulo, SP, Brazil
cInstituto de Matematica e EstatIstica and BIOINFO, Universidade de Sao Paulo, Sao Paulo, SP, BrazildSENAC College of Computer Science and Technology, Sao Paulo, SP, Brazil
eInstituto de QuImica, Universidade de Sao Paulo, Sao Paulo, SP, Brazil
Received 21 August 2002; received in revised form 8 October 2002; accepted 10 October 2002
Abstract
Using cDNA fragments from the FAPESP/lICR Cancer Genome Project, we constructed a cDNA array having 4512
elements and determined gene expression in six normal and six tumor gastric tissues. Using t-statistics, we identified 80 cDNAs
whose expression in normal and tumor samples differed more than 3.5 sample standard deviations. Using Self-Organizing Map,
the expression profile of these cDNAs allowed perfect separation of malignant and non-malignant samples. Using the
supervised learning procedure Support Vector Machine, we identified trios of cDNAs that could be used to classify samples as
normal or tumor, based on single-array analysis. Finally, we identified genes with altered linear correlation when their
expression in normal and tumor samples were compared. Further investigation concerning the function of these genes could
contribute to the understanding of gastric carcinogenesis and may prove useful in molecular diagnostics.
q 2002 Elsevier Science Ireland Ltd. All rights reserved.
Keywords: Gene expression; Gastric cancer; cDNA array; Molecular marker
1. Introduction
During the last 10 years, the incidence of gastric
cancer is declining worldwide but, nevertheless, it is
still a tumor of high incidence [1]. Worldwide, tumors
of the stomach are the fourth in incidence and second
in cancer-related deaths (IARC home page: http://
www.dep.iarc.fr).
At the molecular level, little is known about the
mechanisms involved in gastric carcinogenesis. As
established for tumors in general, it was proposed that,
for gastric adenocarcinomas, accumulation of genetic
alterations in a multistep fashion would correlate with
disease progression and differences between diffuse
and intestinal type adenocarcinomas would be linked
to distinct mutation pathways [2]. These genetic
0304-3835/02/$ - see front matter q 2002 Elsevier Science Ireland Ltd. All rights reserved.
doi:10 . 10 1 6 /S0 3 04 -3 83 5 (0 2) 00 5 87 -6
Cancer Letters 190 (2003) 199–211
www.elsevier.com/locate/canlet
* Corresponding author. Tel.: þ55-11-3207-4922; fax: þ55-11-
3207-7001.
E-mail address: [email protected] (L.F.L. Reis).
alterations can be either chromosomal aberrations or
confined to mutations in one or more genes.
For chromosomal aberrations, several studies
applying comparative genomic hybridization ident-
ified the 20q region as the most frequent gain. Other
frequent gains were observed at 6p, 7q, 8q, and 17q
and losses were at 4q, 5q, 9p, and 18q [3–5]. A high
level amplification of the region 17q12-21 was
observed in the intestinal type of tumors [4] and
fluorescent in situ hybridization analyses using probes
for either gastrin or ERBB2 revealed that both genes
were simultaneously amplified [6]. Using at least two
highly polymorphic microsatellite markers for each
nonacrocentric chromosomal arm, an exhaustive
scanning for loss of heterozygosity (LOH) revealed
significant LOH at several loci such as 3p, 4p, 5q, 8p,
9p, 13q, 17p, and 18q, suggesting the presence of
potential tumor suppressor genes [7].
Altered expression of genes known to play a role in
oncogenic transformation has also been detected in
gastric cancer, either in freshly isolated tissue or in
cell lines. It is well documented that mutations in the
p53 gene is a frequent event in gastric cancer and
detected in as much as 50% of advanced cases [8,9].
Interestingly, p53 knockout mice, carrying either one
or two mutated alleles appear to be more sensitive to
experimental Helicobacter infection [10]. Other genes
with altered expression or frequently amplified in
gastric cancer are cErbB2 and c-met [11], TGF-bII
receptor [12], e-Cadherin [13,14], b-Catenin [15],
among others.
Another tumor type of gastric cancer that accounts
for 2% of the cases is designated GIST (gastrointes-
tinal stromal tumor) and comprises the majority of
gastrointestinal mesenchymal tumors (reviewed by
Miettinen and colleagues [16]). At the molecular
levels, GIST is commonly associated with losses in
chromosomes 14 and 22 whereas gain or high-level
amplification is observed in 3q, 8q, 5p, and Xp [17,
18]. Mutations in the c-Kit gene have been frequently
associated with GIST [19,20] and these tumors
showed a remarkably homogeneous gene expression
profile [21].
More recently, several groups described the
utilization of high throughput methodology in order
to identify genes differentially expressed in gastric
cancer [3,22–24].
The FAPESP/lICR Human Genome Cancer Pro-
ject finished a major effort in sequencing over
1 100 000 ORESTES (open reading frame ESTs)
derived from various tumor types and a significant
proportion of yet unknown sequences were generated
[25]. Taking advantage of the clone collection
generated by this project, we constructed a cDNA
array and searched for genes differentially expressed
in normal versus tumor gastric mucosa and searched
for differentially expressed genes that could dis-
tinguish between normal and tumor tissues. Detailed
analysis of the genes could help in understanding the
molecular events related to gastric carcinogens and
also, could bring some improvement towards diag-
nostics and prognostics of gastric cancer.
2. Materials and methods
2.1. Tissue specimens and RNA extraction
Fresh tissues from surgically resected gastric
cancers were collected by the Gastric Surgery
Department from Hospital do Cancer AC Camargo,
Sao Paulo. All patients signed an informed consent
and the project was approved by the in-house ethics
committee. Six gastric tumors (four adenocarcinomas
and two gastrointestinal stromal tumors) and six, not
paired, disease-free gastric mucosa were used. Dis-
ease-free tissue from tumor margins or obtained from
radical gastrectomy was considered as normal tissue.
At the time of RNA extraction, histological confir-
mation of normal or tumor status was performed by
hematoxylin–eosin staining of frozen sections. The
frozen sections were also used for dissection of
samples in order to enrich for tumor cells (see Fig. 1,
upper panels). Only samples with at least 70% of
tumor tissue and negative for infiltrating inflammatory
cells were further processed. In the case of normal
samples, only gastric mucosa was used. Total RNA
was extracted using TRIzol Reagent (Life Technol-
ogies, Grand Island, NY) following the procedure
recommended by manufacturer.
2.2. Production of cDNA arrays
A collection of 4512 ORESTES fragments derived
from the FAPESP/LICR Human Cancer Genome
Project [25] was immobilized in nylon membranes.
S.I. Meireles et al. / Cancer Letters 190 (2003) 199–211200

As positive control for labeling and hybridization, we
spotted, in serial dilutions, a cDNA corresponding to a
fragment of the lambda phage Q gene. Bacterial
clones were grown in LB medium containing 7.5%
glycerol and, from each clone, the cDNA insert was
amplified by polymerase chain reaction (PCR), using
M13 reverse and forward primers in a final volume of
100 ml. From all 4512 PCR products, 5 ml were
fractionated through a 1% agarose gel in order to
quality control DNA products and the remaining 95 ml
were purified with QIAquick 96 PCR purification kit
(Qiagen) or Sephadex G50 (Amershan Pharmacia).
Purified DNA was printed onto nylon membranes by
Flexys robot (Genomic Solutions, UK) using a 96 flat
pinhead in 96 blocks of 7 £ 7 elements.
2.3. Labeling, hybridization, and scanning of arrays
Thirty micrograms of total RNA were contami-
nated with a defined concentration of synthetic,
polyadenylated RNA corresponding to the lambda
phage Q gene. To this mix, we added 2.0 mg (dT)15 in
a final volume of 11 ml of water, and the mix was
heated to 70 8C for 10 min and subsequently cooled to
43 8C. Reverse transcription was performed in a total
volume of 50 ml using Superscript II reverse
transcriptase (Life Technologies Inc.) for 2 h at 43
8C in the presence of 0.25 mM each of dATP, dGTP
and dTTP, 1.66 mM-dCTP and 30 mCi of
[a-33P]dCTP (3000 Ci/mmol; Amersham, UK).
Subsequently, 1.5 ml 1% SDS, 1.5 ml 0.5 M EDTA
and 3 ml 3 M NaOH were added and the RNA was
hydrolyzed for 30 min at 65 8C and 15 min at room
temperature. The solution was then neutralized with
1.5 ml 1 M Tris–HCl (pH 8) and 4.5 ml 2 M HCl.
Probes were purified by gel chromatography (BioSpin
6; Bio-Rad). Prior to hybridization, the solution was
boiled for 2 min, and then cooled on ice. Arrays were
prehybridized for at least 1 h in 0.25 M Na2HPO4 (pH
7.2), SDS 7%, BSA 1%, 1 mM EDTA. Hybridization
was conducted in the same buffer at 65 8C overnight
[26]. For each cDNA sample, three identical mem-
branes were hybridized simultaneously (normal
samples correspond to membranes 1–18 and tumor
samples correspond to membranes 19–36). The filters
were then washed for 30 min in 0.5 M Na2HPO4 (pH
7.2), SDS 1%, 1 mM EDTA and image acquired by a
phosphorimager (Molecular Dynamics Storm Imager,
Molecular Dynamics, USA).
2.4. Data acquisition
Data acquisition was performed with the ArrayVi-
sion software (Amersham, UK), using.gel files. To
quantify signal intensities of the hybridized spots, a
template composed by equal-sized ellipses were
drawn around all spots. Following the identification
of the spots, the software calculated the spot-intensity
value and array background intensity.
Fig. 1. Identification of genes differentially expressed in gastric
tumors. Schematic representation of our experimental design. (A,B)
Representation of the dissecting procedure were only the invasive
portion of an adenocarcinoma was excised and processed for RNA
extraction. Each RNA sample was hybridized with three identical
arrays. (C) Representative image of our nylon array after
hybridization with [a-33P]dCTP-labeled cDNA. Signals were
captured on a phosphorimager and data was acquired by the
ArrayVision software using.gel files.
S.I. Meireles et al. / Cancer Letters 190 (2003) 199–211 201

2.5. Data normalization
The background from a given array was subtracted
from all 4512 spot-intensity values and we considered
in our analysis only the 4388 genes with positive
background-corrected values across all 36 arrays.
Next we normalized the data in all arrays using total
energy (4388 spots) on each given array.
2.6. Statistical analysis
Single genes with difference in expression when
comparing normal and tumor samples were identified
by their t-values, denoted by tnc, which is the
difference between Normal and Tumor sample-mean
log-transformed gene expressions, standardized by
the corresponding sample standard deviation. For a
given gene, say gene k, and j ¼ 1;…; 18, let Nkj denote
its log-transformed gene expression on the j th normal
sample and Tkj its log-transformed gene expression on
the j th tumor sample. The tnc value for gene k is
computed as follows:
tknc ¼
Nk 2 TkffiffiffiffiffiffiffiffiffiffiffiffiffiffiffiS2
Nk
18þ
S2Tk
18
s
where Nk (respectively Tk) denotes gene k sample
mean expression value in normal (tumor) arrays, SNk
(respectively STk ) denotes its sample standard devi-
ation in normal (tumor) arrays. We choose the
normalization term for tnc as in Ref. [27] even though
our experimental setting is different because it
penalises strongly replica measurement errors and
therefore provides a simple and yet stringent statistics
to evaluate differences in gene expression.
Elements with tnc values equal or higher than 3.5 in
absolute values were considered as differentially
expressed. This set of cDNAs was then analyzed by
Self-Organizing Map (SOM) and hierarchical cluster-
ing algorithms, both implemented in Matlab (Math-
Works) neural networks and statistics toolboxes.
To find pairs and trios of genes that would allow
perfect linear separation of Normal and Tumor
samples we used a supervised learning technique
known as Support Vector Machines, also
implemented in Matlab (Cawley, G.C., Support
Vector MachineToolbox v0.50, http://theoval.sys.
uea.ac.uk/ , gcc/svm/toolbox, Support Vector
Machine toolbox for Matlab Version 2.4, August,
2001, copyright Anton Schwaighofer (2001) mailto:
Write ðNk ¼ Nk1 ;N
k2 ;…Nk
18Þ and ðTk ¼
Tk1 ;T
k2 ;…Tk
18Þ for the vectors of expressions of gene
k, respectively, among normal and tumor samples. To
look for pairs of genes whose coordinated patterns of
expression would change in comparing the two
conditions we computed, for each pair of genes k
and l, their Pearson linear correlation coefficient
among normals, corrðNk;NlÞ , and among tumors,
corrðTk;TlÞ.
3. Results
In order to determine the profile of gene expression
in gastric tissues, we isolated total RNA from six
tumor samples and from six samples of disease free
gastric mucosa. For each sample, three identical nylon
arrays were simultaneously hybridized, giving 18
membranes corresponding to normal tissue and 18
membranes corresponding to tumor tissues. Fig. 1
represents a scheme of our experimental design.
3.1. Identification of 80 cDNAs differentially
expressed in gastric cancer
The data obtained from all 36 membranes were
normalized by total energy as described in Section 2.
Therefore, after normalization, all our 36 arrays have
the same total expression values and one can mean-
ingfully compare gene expressions from different
arrays [27,28].
With normalized data, we computed the t-statistic,
tnc, for each single cDNA. In Fig. 2A, we plotted data
from all 4388 cDNA clones based on their tnc value.
Fig. 2B represents the histogram with the tnc values
and in Fig. 2C we represent a quantile–quantile plot
of this data versus theoretical quantiles from a normal
distribution. The heavy tails of the empirical distri-
bution of tnc indicate the presence of several genes
whose expression levels differ between normal and
tumor samples.
Before the application of more elaborated, but also
more computer-intensive, exploratory methods, it is
quite natural to first select a smaller subset of genes to
S.I. Meireles et al. / Cancer Letters 190 (2003) 199–211202

deal with. This important step, sometimes called
feature selection [29,30], was done here with the help
of tnc as genes with larger tnc, in absolute value, are
good candidates for playing a role in carcinogenesis as
well as in the discrimination among normal and tumor
tissues. We arbitrarily choose a threshold of 3.5 for tnc
we found a set of 80 cDNAs, 43 with tnc larger than
3.5 (indicated in green in Fig. 3) and 37 with tnc
smaller than 23.5 (indicated in red in Fig. 3). All
these 80 cDNAs were sequence verified.
In Fig. 3, we have a graphic representation of all 80
differentially expressed cDNAs with their respective
tnc value. As can be observed, five genes are
represented by two or more distinct cDNA fragments.
Ribosomal protein L 10 (RPL10) is represented by
five cDNA clones, a2-glycoprotein 1 is represented
by three clones, and metallothionein IG, Elongation
Factor 1-a1, and lactate dehydrogenase A are
represented by two clones. Clones representing the
same gene showed very similar tnc values and
appeared together in the same side of Fig. 3,
confirming the reproducibility of our experimental
conditions and the consistence of our statistical
analysis. From these 80 cDNAs, we identified 35
known genes, 31 ESTs with no functional annotation
and three ORESTES sequences not yet submitted to
GenBank. If a more relaxed threshold for tnc is used,
namely 3 instead of 3.5, 61 extra cDNAs are identified
and a list with these 141 cDNAs can be visualized in
our web page (http://www.array.ludwig.org.br/
gastriccancer/canlettersmeireles). The sequence of
all 141 cDNAs was verified experimentally.
We selected ten genes in order to experimentally
confirm their differential expression in 26 new RNA
samples (13 from normal tissue and 13 from tumor
tissue). The levels of mRNA were estimated by RT–
Fig. 2. Distribution of tnc values for 4388 cDNAs tested in gastric tumors: Normalized data from 36 arrays hybridized with complex cDNA
probes derived from normal or tumor samples were used to compute the tnc value for each of the 4388 cDNAs. (A) Representation of the tnc
value for each single cDNA. In red, we represent 80 cDNAs with tnc greater than 3.5 in absolute values. (B) Histogram representing data from
(A). (C) Quantile–quantile plot of data represented in (A) against the expected value from a normal distribution.
S.I. Meireles et al. / Cancer Letters 190 (2003) 199–211 203

PCR followed by Southern blot and phosphorimager
analysis. For normalization, we used three distinct
housekeeping genes (b-actin, a-tubulin, and TBP)
and, for each gene, we determined its arbitrary
expression unit (ratio of signal for gene/normalizing
gene). A gene was considered as confirmed when the
ratio of its average expression units (normal/tumor)
followed its tnc value. Seven of the ten genes (RPL10,
CLTC, EEF1A1, TARDBP, HSPCA, NBS1, Est
AW812624) could be experimentally confirmed.
Nevertheless, validation of array data by RT–PCR
must take in consideration the tremendous variability
of housekeeping genes [31] and, more importantly,
that in our case, a gene can have a high tnc value even
if its fold change in rather small. Similar observations
were published by [32]. For instance, in our array
data, b-Catenin differs only 1.3-fold between normal
and tumor samples but its tnc value is 4.32 due to its
small SD.
3.2. Clustering algorithms: SOM and hierarchical
After selecting the 80 cDNA clones with absolute
tnc value higher than 3.5, we applied a SOM algorithm
[33] to identify clusters of expression profiles
according to samples. Two clusters were identified
and they represented a precise separation of normal
and tumor samples (data not shown). When we
applied a hierarchical cluster algorithm, we observed
that all replicas from a given patient are grouped
together, further confirming reproducibility of our
data (data not shown). Next, we applied again the
SOM algorithm, now to separate genes according to
their expression across all 36 membranes, into six
clusters. In Fig. 4, we represent these clusters and,
within each cluster, we further ordered genes accord-
ing to their hierarchical distance, as indicated by each
dendrogram.
3.3. Genes with coordinated pattern of expression
Next we used a supervised computer learning
method called Support Vector Machine (SVM) to
search for trios of genes with a coordinated pattern of
expression. We searched the dataset corresponding to
the 80 cDNAs with tnc, in absolute value, larger than
3.5 to find trios of genes whose pattern of expression
in individual membranes would be such that, when
plotted on three dimensional space, a plane could be
found separating perfectly the 36 data points into two
groups, one with 18 normal samples and another with
the remaining 18 tumor samples. We found several
interesting trios with this property. One trio is
composed of b-Catenin, Clathrin, and Retinoic Acid
Fig. 3. Genes with differential expression in gastric tumors. Based
on data presented in Fig. 2A, we list genes (with respective
accession numbers indicated within brackets) and indicate their tnc
values. In green, genes with lower expression in tumor tissue
(positive tnc values); in red, genes with higher expression in tumor
tissue (negative tnc values).
S.I. Meireles et al. / Cancer Letters 190 (2003) 199–211204

Receptor-a (Fig. 5A) and represents genes that can be
mapped into a common biochemical pathway known
to be implicated in gastric carcinogenesis. Another
trio is composed of Ribosomal Protein L10, Humanin,
and b-Catenin (Fig. 5B).
3.4. Genes with changes in their Pearson linear
correlation
We also looked for pairs of genes whose pattern of
expression would show changes in their Pearson
linear correlation when normal and tumor samples
Fig. 5. Trios of genes that allow sample classification. From a gene
list having cDNAs with absolute values of tnc greater than 2, we
applied the SVM algorithm and identified trios of genes that
allowed perfect separation of all 18 normal and 18 tumor arrays.
(A,B) Three-dimensional space where the log-transformed normal-
ized signal intensity for each cDNA is plotted. Each data point in
space represents one individual array; data from normal samples are
represented in open squares and tumor samples are represented by
dots.
Fig. 4. Schematic representation of samples and genes clustered by
Self-Organizing Map (SOM). Using the 80 cDNAs with tnc higher
than 3.5 in absolute values we applied SOM to cluster samples
based on the expression profile of the 80 cDNAs. The resulting two
clusters are represented at the top of the figure by the blue and red
bars. Next, cDNAs were grouped into six clusters based on their log-
transformed normalized signal intensity. For each cDNA, a
maximum value is represented in bright red, minimum value in
bright green and the intermediate value in black. At the left side of
each cluster is a dendrogram representing hierarchical distances.
S.I. Meireles et al. / Cancer Letters 190 (2003) 199–211 205
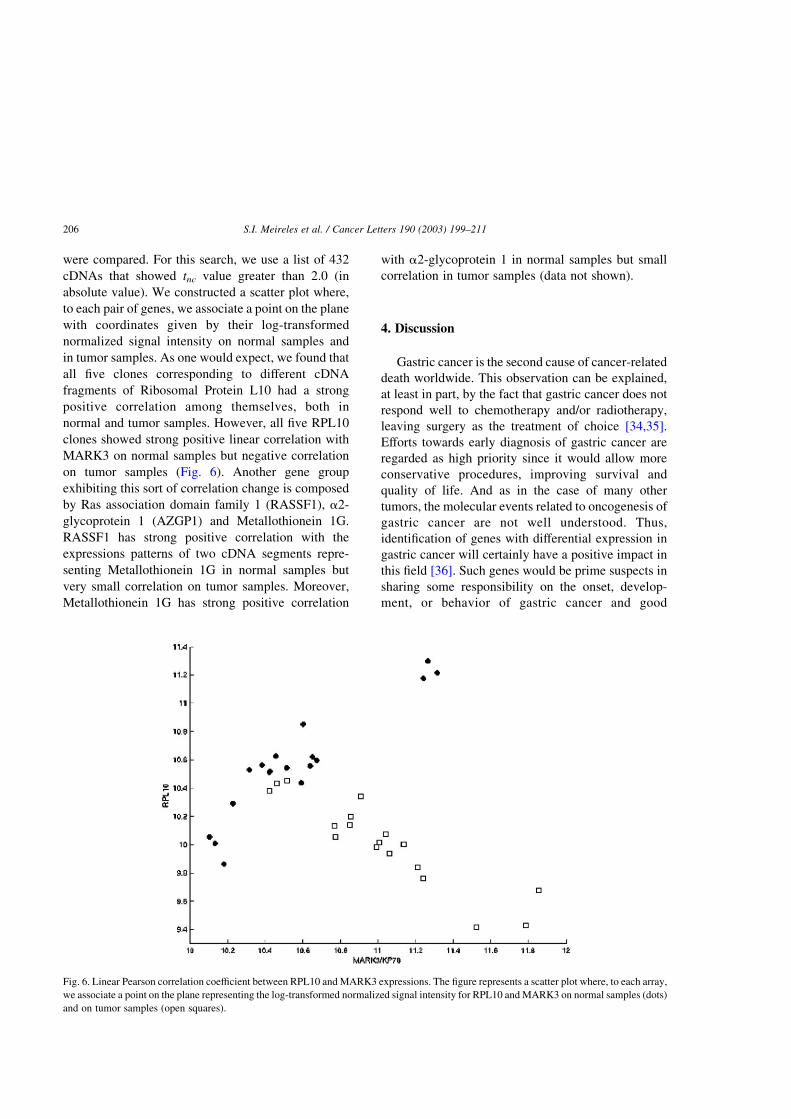
were compared. For this search, we use a list of 432
cDNAs that showed tnc value greater than 2.0 (in
absolute value). We constructed a scatter plot where,
to each pair of genes, we associate a point on the plane
with coordinates given by their log-transformed
normalized signal intensity on normal samples and
in tumor samples. As one would expect, we found that
all five clones corresponding to different cDNA
fragments of Ribosomal Protein L10 had a strong
positive correlation among themselves, both in
normal and tumor samples. However, all five RPL10
clones showed strong positive linear correlation with
MARK3 on normal samples but negative correlation
on tumor samples (Fig. 6). Another gene group
exhibiting this sort of correlation change is composed
by Ras association domain family 1 (RASSF1), a2-
glycoprotein 1 (AZGP1) and Metallothionein 1G.
RASSF1 has strong positive correlation with the
expressions patterns of two cDNA segments repre-
senting Metallothionein 1G in normal samples but
very small correlation on tumor samples. Moreover,
Metallothionein 1G has strong positive correlation
with a2-glycoprotein 1 in normal samples but small
correlation in tumor samples (data not shown).
4. Discussion
Gastric cancer is the second cause of cancer-related
death worldwide. This observation can be explained,
at least in part, by the fact that gastric cancer does not
respond well to chemotherapy and/or radiotherapy,
leaving surgery as the treatment of choice [34,35].
Efforts towards early diagnosis of gastric cancer are
regarded as high priority since it would allow more
conservative procedures, improving survival and
quality of life. And as in the case of many other
tumors, the molecular events related to oncogenesis of
gastric cancer are not well understood. Thus,
identification of genes with differential expression in
gastric cancer will certainly have a positive impact in
this field [36]. Such genes would be prime suspects in
sharing some responsibility on the onset, develop-
ment, or behavior of gastric cancer and good
Fig. 6. Linear Pearson correlation coefficient between RPL10 and MARK3 expressions. The figure represents a scatter plot where, to each array,
we associate a point on the plane representing the log-transformed normalized signal intensity for RPL10 and MARK3 on normal samples (dots)
and on tumor samples (open squares).
S.I. Meireles et al. / Cancer Letters 190 (2003) 199–211206
candidates as markers for diagnosis [37]. Using cDNA
arrays, we searched for genes modulated in gastric
tumors and applied several statistical tools to identify
correlations in their expression pattern.
We first identify single genes, whose expression
would be different in normal and cancer samples.
Instead of considering differences in fold expression,
as is usual in the literature, we computed the t-statistic
for each cDNA. The well-known problem in evaluat-
ing differences in expression simply by fold change is
that one does not know whether a fixed value, for a
given gene, is sufficiently large to characterize that
gene as differently expressed without taking into
account its variation of expression across all samples.
By using the t-statistic this variation is taken into
account and genes that can be considered differen-
tially expressed would be those with larger tnc, in
absolute value. Among the genes with differential
expression, we identified well-known tumor suppres-
sor genes and proto-oncogenes, known to play a role
in gastric cancer. We found that RASSF1, known as
tumor suppressor gene [38], was underexpressed in
tumor samples (tnc ¼ 3:7). Loss or abnormal down-
regulation of RASSF1 is observed in a considerable
proportion of lung, breast, ovarian, bladder, nasophar-
yngeal [39 –44] and, more relevant, in gastric
adenocarcinomas [45].
We also detected overexpression of known onco-
genes. Of notice, b-Catenin was overexpressed in
tumor samples (tnc ¼ 24:1). The role of the WNT
pathway in development and oncogenesis has been
widely investigated [46–48]. In the case of gastric
tumors, e-Cadherins and b-Catenin are of particular
importance [13,49,50]. Indeed, mutations in e-Cad-
herin gene has been associated with familial cases of
gastric cancer [51,52].
Interestingly, two other genes involved in the
WNT pathway were also found as differentially
expressed in our samples. Clathrin and Retinoic
Acid Receptor a were both underexpressed in tumor
samples (tnc ¼ 4:4 and 4.8, respectively). Reduced
levels of Clathrin leads to reduced recycling e-
Cadherin, lowering its level at cell surface and, as
consequence, more b-Catenin would be available in
the cytoplasm for signaling via interaction with
LEF/TCF [53,54]. Recently, it was shown that
retinoic acid (RA) decreases the activity of the b-
Catenin-TCF/lEF signaling pathway by inducing
ubiquitin-dependent degradation of cytoplasmic b-
Catenin as well as by competition with TCF for b-
Catenin binding [55,56]. Thus reduced levels of
Clathrin and RAR might also contribute to increased
WNT signaling.
Two other genes identified as overexpressed in
tumor samples might have important implications in
the oncogenesis of gastric cancer, Nibrin (tnc ¼ 23:7)
and Humanin mRNA (tnc ¼ 23:6). Nibrin is a
member of the Mre11/Rad50/Nbs1 complex, impli-
cated in numerous aspects of double-strand break
repair, and considered as a typical tumor suppressor
gene (reviewed by Wang [57]). In agreement with our
data, Nibrin mRNA was also found to be augmented
in GIST [21]. This is also confirmed by SAGE
analysis (http://cgap.nci.nih.gov/Pathways). It is poss-
ible that, based on the findings by Paull and co-
workers [58], Nibrin overexpression might favor the
nucleolytic activity of the Mre11/Rad50/Nbs1 com-
plex. Humanin was recently described as a small
polypeptide that could rescue neuronal cells from
specific death signals [59,60]. To the best of our
knowledge, this is the first report of augmented
expression of Humanin in tumor tissues and its
overexpression by cancer cells could represent yet
another survival signal, favoring tumor development.
Based on published observations, it is clear that
molecular classification of cancer is not only feasible
but also, might prove to be the method of choice to
identify sub groups of a given tumor [61–65]. Having
identified these 80 cDNAs, we applied other statistical
tools to classify our normal and tumor samples. It has
been suggested that the SOM has some important
advantages for interpreting gene expression patterns,
when compared to other clustering algorithms [66].
When we applied SOM to group samples, two
predominant clusters of expression profile were
identified and they could precisely separate normal
and tumor samples (Fig. 4). Using a support vector
machine algorithm, recently described as a tool to
build classifiers for cancer samples [63], we per-
formed an exhaustive search for trios of cDNAs that
would allow precise separation between normal and
tumor samples. We identified several trios composed
by the 80 genes from Fig. 3 that, when plotted on a
three-dimensional space, normal and tumor samples
could be precisely separated by a plane (Fig. 5). It is
possible that combination of various trios with the
S.I. Meireles et al. / Cancer Letters 190 (2003) 199–211 207

properties described here might have an added
accuracy for molecular classification when compared
to a list of differentially expressed genes as currently
suggested [62,65,67]
The identification of these trios was based on their
simultaneous expression levels on each given array
and one could use this information to investigate
whether, in such trios, the genes would fall into a
common biochemical pathway or whether they belong
to distinct pathways that, together, would point to
some metabolic advantage for tumor cells. Indeed, the
three genes from Fig. 5A, Clathrin, b-Catenin, and
Retinoic Acid Receptor can all be mapped into a
common pathway, as discussed earlier. In other trio
(Fig. 5B), the three genes cannot be directly linked to
a single pathway. RPL10, might have tumor suppres-
sor activities and negatively regulate c-Jun activity
[68]. Thus, reduced RPL10 and augmented b-Catenin
in tumor samples would favor mitogenic signals,
whereas elevated Humanin could provide a survival
advantage for tumor cells, as mentioned above.
We also searched for genes with change in their
linear Pearson correlation. This kind of analysis
would allow the identification of genes whose
expression occurs in a coordinated fashion in one
group of samples but either are not correlated or,
perhaps more interestingly, with inverse correlation in
the other group. Importantly, it could be that, genes
with this behavior might have low tnc values in
absolute numbers and thus not identified as differen-
tially expressed. In Fig. 6, we represent the changes in
linear correlation between RPL10 and MARK3. This
pair of genes has a positive linear correlation in
normal samples that changes to a negative linear
correlation in tumor samples. As we discussed before
RPL10 might function as a negative regulator c-Jun-
mediated mitogenic pathway. In contrast, overexpres-
sion of b-Catenin and consequent activation of the
WNT pathway activates c-Jun gene expression [69]
and, possibly, MARK3 [24,70]. Hence, in tumor cells,
a negative linear correlation, would favor a mitogenic
signaling pathways.
Finally, it is clear that gastric adenocarcinomas
and gastrointestinal stromal tumors are conse-
quences of the transformation of different cell
lineages and hence, we made no efforts neither in
distinguishing nor in comparing these two tumor
types. Intentionally, we simply looked for genes
with conserved alterations in all tumor samples. It
is not surprising that a common set of genes can be
identified in two distinct tumor types. As discussed
above RASSF1, Clusterin, b-Catenin, and many
others genes are commonly altered in a variety of
tumors. Specifically, NBS1 that we identified as
overexpressed in tumor samples was also found
augmented in GIST by Allander and co-workers
[21]. As expected, we did identify differences in
the expression profile of the two tumor types,
especially in genes from cluster 1 (uppermost
cluster, second and third last triplicates from the
right). However, based on our findings (Figs. 5 and
6) we can suggest that, as for gastric adenocarci-
nomas, the WNT pathway might also be altered in
GIST. We can also conclude that classifiers based
on genes commonly altered in adenocarcinomas
and GIST can precisely distinguish both tumor
types from normal gastric mucosa (Fig. 5) and this
would imply that, regardless of differences in
oncogenesis, a single classifier could be applied
for gastric tumors.
Taken together, the information extracted from our
dataset can contribute to the better understanding of
oncogenesis of gastric cancer as well as to the
development of molecular-based diagnostic tools.
Acknowledgements
We would like to thank all members of the
Department of Abdominal Surgery, Hospital do
Cancer for tissue collection, Anna Christina de Mattos
Salim and Elizangela Monteiro, Laboratory of
Genetics from LICR, for helping with sequence
verification, and Carlos Ferreira and Miyuki F. da
Silva for technical assistance in tissue sections. We
also thank Dr. Junior Barrera for discussions, Marcel
Brun for developing some of the software used in this
work and Dr. Ricardo Brentani for critically reading
the manuscript. This work was supported, in part, by
the CEPID/FAPESP (98/1435-2). The Clone Collec-
tion is funded by the FAPESP/lICR consortium and.
S.I.M., L.T., and B.S.S are supported by a pre-
doctoral fellowship from FAPESP. R.L.A.S is sup-
ported by a post-doctoral fellowship from FAPESP.
S.I. Meireles et al. / Cancer Letters 190 (2003) 199–211208

References
[1] A.O. Chan, B.C. Wong, S.K. Lam, Gastric cancer: past,
present and future, Can. J. Gastroenterol. 15 (2001) 469–474.
[2] W. Yasui, H. Yokozaki, J. Fujimoto, K. Naka, H. Kuniyasu, E.
Tahara, Genetic and epigenetic alterations in multistep
carcinogenesis of the stomach, J. Gastroenterol. 35 (Suppl.
12) (2000) 111–115.
[3] W. El Rifai, H.F. Frierson Jr., J.C. Harper, S.M. Powell, S.
Knuutila, Expression profiling of gastric adenocarcinoma
using cDNA array, Int. J. Cancer 92 (2001) 832–838.
[4] A. Kokkola, O. Monni, P. Puolakkainen, M.L. Larramendy,
M. Victorzon, S. Nordling, R. Haapiainen, E. Kivilaakso, S.
Knuutila, 17q12–21 amplicon, a novel recurrent genetic
change in intestinal type of gastric carcinoma: a comparative
genomic hybridization study, Genes Chromosomes Cancer 20
(1997) 38–43.
[5] M. Nessling, S. Solinas-Toldo, K.K. Wilgenbus, F. Borchard,
P. Lichter, Mapping of chromosomal imbalances in gastric
adenocarcinoma revealed amplified protooncogenes MYCN,
MET, WNT2, and ERBB2, Genes Chromosomes Cancer 23
(1998) 307–316.
[6] V. Vidgren, A. Varis, A. Kokkola, O. Monni, P. Puolakkainen,
S. Nordling, F. Forozan, A. Kallioniemi, M.L. Vakkari, E.
Kivilaakso, S. Knuutila, Concomitant gastrin and ERBB2
gene amplifications at 17q12-q21 in the intestinal type of
gastric cancer, Genes Chromosomes Cancer 24 (1999) 24–29.
[7] A.S. Yustein, J.C. Harper, G.R. Petroni, O.W. Cummings,
C.A. Moskaluk, S.M. Powell, Allelotype of gastric adenocar-
cinoma, Cancer Res. 59 (1999) 1437–1441.
[8] G.N. Ranzani, O. Luinetti, L.S. Padovan, D. Calistri, B.
Renault, M. Burrel, D. Amadori, R. Fiocca, E. Solcia, p53
gene mutations and protein nuclear accumulation are early
events in intestinal type gastric cancer but late events in diffuse
type, Cancer Epidemiol. Biomarkers Prev. 4 (1995) 223–231.
[9] T. Shepherd, D. Tolbert, J. Benedetti, J. Macdonald, G.
Stemmermann, J. Wiest, G. De Voe, M.A. Miller, J. Wang, A.
Noffsinger, C. Fenoglio-Preiser, Alterations in exon 4 of the
p53 gene in gastric carcinoma, Gastroenterology 118 (2000)
1039–1044.
[10] J.G. Fox, X. Li, R.J. Cahill, K. Andrutis, A.K. Rustgi, R. Odze,
T.C. Wang, Hypertrophic gastropathy in Helicobacter felis-
infected wild-type C57BL/6 mice and p53 hemizygous
transgenic mice, Gastroenterology 110 (1996) 155–166.
[11] K. Tsugawa, Y. Yonemura, Y. Hirono, S. Fushida, M. Kaji, K.
Miwa, I. Miyazaki, H. Yamamoto, Amplification of the c-met,
c-erbB-2 and epidermal growth factor receptor gene in human
gastric cancers: correlation to clinical features, Oncology 55
(1998) 475–481.
[12] K. Park, S.J. Kim, Y.J. Bang, J.G. Park, N.K. Kim, A.B.
Roberts, M.B. Sporn, Genetic changes in the transforming
growth factor beta (TGF-beta) type II receptor gene in human
gastric cancer cells: correlation with sensitivity to growth
inhibition by TGF-beta, Proc. Natl. Acad. Sci. USA 91 (1994)
8772–8776.
[13] Y. Shimoyama, S. Hirohashi, Expression of E- and P-cadherin
in gastric carcinomas, Cancer Res. 51 (1991) 2185–2192.
[14] K. Matsuura, J. Kawanishi, S. Fujii, M. Imamura, S. Hirano,
M. Takeichi, Y. Niitsu, Altered expression of E-cadherin in
gastric cancer tissues and carcinomatous fluid, Br. J. Cancer 66
(1992) 1122–1130.
[15] D.K. Woo, H.S. Kim, H.S. Lee, Y.H. Kang, H.K. Yang, W.H.
Kim, Altered expression and mutation of beta-catenin gene in
gastric carcinomas and cell lines, Int. J. Cancer 95 (2001)
108–113.
[16] M. Miettinen, M. Sarlomo-Rikala, J. Lasota, Gastrointestinal
stromal tumors: recent advances in understanding of their
biology, Hum. Pathol. 30 (1999) 1213–1220.
[17] W. El Rifai, M. Sarlomo-Rikala, L.C. Andersson, M.
Miettinen, S. Knuutila, DNA copy number changes in
gastrointestinal stromal tumors – a distinct genetic entity,
Ann. Chir. Gynaecol. 87 (1998) 287–290.
[18] W. El Rifai, M. Sarlomo-Rikala, M. Miettinen, S. Knuutila,
L.C. Andersson, DNA copy number losses in chromosome 14:
an early change in gastrointestinal stromal tumors, Cancer
Res. 56 (1996) 3230–3233.
[19] S. Sakurai, T. Fukasawa, J.M. Chong, A. Tanaka, M.
Fukayama, C-kit gene abnormalities in gastrointestinal
stromal tumors (tumors of interstitial cells of Cajal), Jpn.
J. Cancer Res. 90 (1999) 1321–1328.
[20] R. Fukuda, N. Hamamoto, Y. Uchida, K. Furuta, T. Katsube,
H. Kazumori, S. Ishihara, K. Amano, K. Adachi, M.
Watanabe, Y. Kinoshita, Gastrointestinal stromal tumor with
a novel mutation of KIT proto- oncogene, Intern. Med. 40
(2001) 301–303.
[21] S.V. Allander, N.N. Nupponen, M. Ringner, G. Hostetter,
G.W. Maher, N. Goldberger, Y. Chen, J. Carpten, A.G.
Elkahloun, P.S. Meltzer, Gastrointestinal stromal tumors with
KIT mutations exhibit a remarkably homogeneous gene
expression profile, Cancer Res. 61 (2001) 8624–8628.
[22] M.H. Jung, S.C. Kim, G.A. Jeon, S.H. Kim, Y. Kim, K.S.
Choi, S.I. Park, M.K. Joe, K. Kimm, Identification of
differentially expressed genes in normal and tumor human
gastric tissue, Genomics 69 (2000) 281–286.
[23] Y. Hippo, M. Yashiro, M. Ishii, H. Taniguchi, S. Tsutsumi, K.
Hirakawa, T. Kodama, H. Aburatani, Differential gene
expression profiles of scirrhous gastric cancer cells with high
metastatic potential to peritoneum or lymph nodes, Cancer
Res. 61 (2001) 889–895.
[24] Y. Hippo, H. Taniguchi, S. Tsutsumi, N. Machida, J.M.
Chong, M. Fukayama, T. Kodama, H. Aburatani, Global gene
expression analysis of gastric cancer by oligonucleotide
microarrays, Cancer Res. 62 (2002) 233–240.
[25] A.A. Camargo, H.P. Samaia, E. Dias-Neto, D.F. Simao, I.A.
Migotto, M.R. Briones, F.F. Costa, M.A. Nagai, S. Verjovski-
Almeida, M.A. Zago, L.E. Andrade, H. Carrer, H.F. El Dorry,
E.M. Espreafico, A. Habr-Gama, D. Giannella-Neto, G.H.
Goldman, A. Gruber, C. Hackel, E.T. Kimura, R.M. Maciel,
S.K. Marie, E.A. Martins, M.P. Nobrega, M.L. Paco-Larson,
M.I. Pardini, G.G. Pereira, J.B. Pesquero, V. Rodrigues, S.R.
Rogatto, I.D. da Silva, M.C. Sogayar, M.F. Sonati, E.H.
Tajara, S.R. Valentini, F.L. Alberto, M.E. Amaral, I. Aneas,
L.A. Arnaldi, A.M. de Assis, M.H. Bengtson, N.A. Bergamo,
V. Bombonato, M.E. de Camargo, R.A. Canevari, D.M.
S.I. Meireles et al. / Cancer Letters 190 (2003) 199–211 209

Carraro, J.M. Cerutti, M.L. Correa, R.F. Correa, M.C. Costa,
C. Curcio, P.O. Hokama, A.J. Ferreira, G.K. Furuzawa, T.
Gushiken, P.L. Ho, E. Kimura, J.E. Krieger, L.C. Leite, P.
Majumder, M. Marins, E.R. Marques, A.S. Melo, M. Melo,
C.A. Mestriner, E.C. Miracca, D.C. Miranda, A.L. Nasci-
mento, F.G. Nobrega, E.P. Ojopi, J.R. Pandolfi, L.G. Pessoa,
A.C. Prevedel, P. Rahal, C.A. Rainho, E.M. Reis, M.L.
Ribeiro, N. da Ros, R.G. deSa, M.M. Sales, S.C. Sant’anna,
M.L. dos Santos, A.M. da Silva, N.P. da Silva, W.A. Silva Jr.,
R.A. da Silveira, J.F. Sousa, D. Stecconi, F. Tsukumo, V.
Valente, F. Soares, E.S. Moreira, D.N. Nunes, R.G. Correa, H.
Zalcberg, A.F. Carvalho, L.F. Reis, R.R. Brentani, A.J.
Simpson, S.J. deSouza, The contribution of 700 000 ORF
sequence tags to the definition of the human transcriptome,
Proc. Natl. Acad. Sci. USA 98 (2001) 12103–12108.
[26] G.M. Church, W. Gilbert, Genomic sequencing, Proc. Natl.
Acad. Sci. USA 81 (1984) 1991–1995.
[27] M.J. Callow, S. Dudoit, E.L. Gong, T.P. Speed, E.M. Rubin,
Microarray expression profiling identifies genes with altered
expression in HDL-deficient mice, Genome Res. 10 (2000)
2022–2029.
[28] J. Schuchhardt, D. Beule, A. Malik, E. Wolski, H. Eickhoff, H.
Lehrach, H. Herzel, Normalization strategies for cDNA
microarrays, Nucleic Acids Res. 28 (2000) E47.
[29] T.M. Mitchell, Machine Learning, McGraw-Hill, New York,
1997.
[30] S. Theodoridis, K. Koutroumbas, Pattern Recognition, Aca-
denic Press, New York, 1999.
[31] P.D. Lee, R. Sladek, C.M. Greenwood, T.J. Hudson, Control
genes and variability: absence of ubiquitous reference
transcripts in diverse mammalian expression studies, Genome
Res. 12 (2002) 292–297.
[32] W. Jin, R.M. Riley, R.D. Wolfinger, K.P. White, G. Passador-
Gurgel, G. Gibson, The contributions of sex, genotype and age
to transcriptional variance in Drosophila melanogaster, Nat.
Genet. 29 (2001) 389–395.
[33] T. Kohonen, Self-Organizing Maps, Springer, Berlin, 1997.
[34] R. De Vivo, S. Pignata, R. Palaia, V. Parisi, B. Daniele, The
role of chemotherapy in the management of gastric cancer,
J. Clin. Gastroenterol. 30 (2000) 364–371.
[35] H.H. Hartgrink, H.J. Bonenkamp, C.J. van de Velde, Influence
of surgery on outcomes in gastric cancer, Surg. Oncol. Clin.
North Am. 9 (2000) 97-viii.
[36] A. Boussioutas, D. Taupin, Towards a molecular approach to
gastric cancer management, Intern. Med. J. 31 (2001)
296–303.
[37] K.F. Becker, G. Keller, H. Hoefler, The use of molecular
biology in diagnosis and prognosis of gastric cancer, Surg.
Oncol. 9 (2000) 5–11.
[38] K. Dreijerink, E. Braga, I. Kuzmin, L. Geil, F.M. Duh, D.
Angeloni, B. Zbar, M.I. Lerman, E.J. Stanbridge, J.D. Minna,
A. Protopopov, J. Li, V. Kashuba, G. Klein, E.R. Zabarovsky,
The candidate tumor suppressor gene, RASSF1A, from human
chromosome 3p21.3 is involved in kidney tumorigenesis,
Proc. Natl. Acad. Sci. USA 98 (2001) 7504–7509.
[39] R. Dammann, C. Li, J.H. Yoon, P.L. Chin, S. Bates, G.P.
Pfeifer, Epigenetic inactivation of a RAS association domain
family protein from the lung tumour suppressor locus 3p21.3,
Nat. Genet. 25 (2000) 315–319.
[40] R. Dammann, G. Yang, G.P. Pfeifer, Hypermethylation of the
cpG island of Ras association domain family 1A (RASSF1A),
a putative tumor suppressor gene from the 3p21.3 locus,
occurs in a large percentage of human breast cancers, Cancer
Res. 61 (2001) 3105–3109.
[41] D.G. Burbee, E. Forgacs, S. Zochbauer-Muller, L. Shivaku-
mar, K. Fong, B. Gao, D. Randle, M. Kondo, A. Virmani, S.
Bader, Y. Sekido, F. Latif, S. Milchgrub, S. Toyooka, A.F.
Gazdar, M.I. Lerman, E. Zabarovsky, M. White, J.D. Minna,
Epigenetic inactivation of RASSF1A in lung and breast
cancers and malignant phenotype suppression, J. Natl. Cancer
Inst. 93 (2001) 691–699.
[42] A. Agathanggelou, S. Honorio, D.P. Macartney, A. Martinez,
A. Dallol, J. Rader, P. Fullwood, A. Chauhan, R. Walker, J.A.
Shaw, S. Hosoe, M.I. Lerman, J.D. Minna, E.R. Maher, F.
Latif, Methylation associated inactivation of RASSF1A from
region 3p21.3 in lung, breast and ovarian tumours, Oncogene
20 (2001) 1509–1518.
[43] K.W. Lo, J. Kwong, A.B. Hui, S.Y. Chan, K.F. To, A.S. Chan,
L.S. Chow, P.M. Teo, P.J. Johnson, D.P. Huang, High
frequency of promoter hypermethylation of RASSF1A in
nasopharyngeal carcinoma, Cancer Res. 61 (2001)
3877–3881.
[44] M.G. Lee, H.Y. Kim, D.S. Byun, S.J. Lee, C.H. Lee, J.I. Kim,
S.G. Chang, S.G. Chi, Frequent epigenetic inactivation of
RASSF1A in human bladder carcinoma, Cancer Res. 61
(2001) 6688–6692.
[45] D.S. Byun, M.G. Lee, K.S. Chae, B.G. Ryu, S.G. Chi,
Frequent epigenetic inactivation of RASSF1A by aberrant
promoter hypermethylation in human gastric adenocarcinoma,
Cancer Res. 61 (2001) 7034–7038.
[46] R. Cavallo, D. Rubenstein, M. Peifer, Armadillo and dTCF: a
marriage made in the nucleus, Curr. Opin. Genet. Dev. 7
(1997) 459–466.
[47] M.J. Smalley, T.C. Dale, Wnt signalling in mammalian
development and cancer, Cancer Metastasis Rev. 18 (1999)
215–230.
[48] M. Peifer, P. Polakis, Wnt signaling in oncogenesis and
embryogenesis–a look outside the nucleus, Science 287
(2000) 1606–1609.
[49] T. Oda, Y. Kanai, T. Oyama, K. Yoshiura, Y. Shimoyama, W.
Birchmeier, T. Sugimura, S. Hirohashi, E-cadherin gene
mutations in human gastric carcinoma cell lines, Proc. Natl.
Acad. Sci. USA 91 (1994) 1858–1862.
[50] K.F. Becker, H. Hofler, Frequent somatic allelic inactivation
of the E-cadherin gene in gastric carcinomas, J. Natl. Cancer
Inst. 87 (1995) 1082–1084.
[51] G. Keller, H. Vogelsang, I. Becker, J. Hutter, K. Ott, S.
Candidus, T. Grundei, K.F. Becker, J. Mueller, J.R. Siewert,
H. Hofler, Diffuse type gastric and lobular breast carcinoma in
a familial gastric cancer patient with an E-cadherin germline
mutation, Am. J. Pathol. 155 (1999) 337–342.
[52] S.A. Gayther, K.L. Gorringe, S.J. Ramus, D. Huntsman, F.
Roviello, N. Grehan, J.C. Machado, E. Pinto, R. Seruca, K.
Halling, P. MacLeod, S.M. Powell, C.E. Jackson, B.A. Ponder,
S.I. Meireles et al. / Cancer Letters 190 (2003) 199–211210

C. Caldas, Identification of germ-line E-cadherin mutations in
gastric cancer families of European origin, Cancer Res. 58
(1998) 4086–4089.
[53] J. Behrens, J.P. von Kries, M. Kuhl, L. Bruhn, D. Wedlich, R.
Grosschedl, W. Birchmeier, Functional interaction of beta-
catenin with the transcription factor LEF-1, Nature 382 (1996)
638–642.
[54] T.L. Le, A.S. Yap, J.L. Stow, Recycling of E-cadherin: a
potential mechanism for regulating cadherin dynamics, J. Cell
Biol. 146 (1999) 219–232.
[55] S. Byers, M. Pishvaian, C. Crockett, C. Peer, A. Tozeren, M.
Sporn, M. Anzano, R. Lechleider, Retinoids increase cell-cell
adhesion strength, beta-catenin protein stability, and localiz-
ation to the cell membrane in a breast cancer cell line: a role
for serine kinase activity, Endocrinology 137 (1996)
3265–3273.
[56] V. Easwaran, M. Pishvaian, Salimuddin, S. Byers, Cross-
regulation of beta-catenin-LEF/TCF and retinoid signaling
pathways, Curr. Biol. 9 (1999) 1415–1418.
[57] J.Y. Wang, Cancer. New link in a web of human genes, Nature
405 (2000) 404–405.
[58] T.T. Paull, D. Cortez, B. Bowers, S.J. Elledge, M. Gellert,
From the Cover: Direct DNA binding by Brca1, Proc. Natl.
Acad. Sci. USA 98 (2001) 6086–6091.
[59] Y. Hashimoto, T. Niikura, H. Tajima, T. Yasukawa, H. Sudo,
Y. Ito, Y. Kita, M. Kawasumi, K. Kouyama, M. Doyu, G.
Sobue, T. Koide, S. Tsuji, J. Lang, K. Kurokawa, I. Nishimoto,
A rescue factor abolishing neuronal cell death by a wide
spectrum of familial Alzheimer’s disease genes and Abeta,
Proc. Natl. Acad. Sci. USA 98 (2001) 6336–6341.
[60] Y. Hashimoto, T. Niikura, Y. Ito, H. Sudo, M. Hata, E.
Arakawa, Y. Abe, Y. Kita, I. Nishimoto, Detailed character-
ization of neuroprotection by a rescue factor humanin against
various Alzheimer’s disease-relevant insults, J. Neurosci. 21
(2001) 9235–9245.
[61] A. Bhattacharjee, W.G. Richards, J. Staunton, C. Li, S. Monti,
P. Vasa, C. Ladd, J. Beheshti, R. Bueno, M. Gillette, M. Loda,
G. Weber, E.J. Mark, E.S. Lander, W. Wong, B.E. Johnson,
T.R. Golub, D.J. Sugarbaker, M. Meyerson, Classification of
human lung carcinomas by mRNA expression profiling
reveals distinct adenocarcinoma subclasses, Proc. Natl.
Acad. Sci. USA 98 (2001) 13790–13795.
[62] T.R. Golub, D.K. Slonim, P. Tamayo, C. Huard, M.
Gaasenbeek, J.P. Mesirov, H. Coller, M.L. Loh, J.R. Down-
ing, M.A. Caligiuri, C.D. Bloomfield, E.S. Lander, Molecular
classification of cancer: class discovery and class prediction
by gene expression monitoring, Science 286 (1999) 531–537.
[63] S. Ramaswamy, P. Tamayo, R. Rifkin, S. Mukherjee, C.H.
Yeang, M. Angelo, C. Ladd, M. Reich, E. Latulippe, J.P.
Mesirov, T. Poggio, W. Gerald, M. Loda, E.S. Lander, T.R.
Golub, Multiclass cancer diagnosis using tumor gene
expression signatures, Proc. Natl. Acad. Sci. USA 98 (2001)
15149–15154.
[64] C.M. Perou, T. Sorlie, M.B. Eisen, M. van de Rijn, S.S.
Jeffrey, C.A. Rees, J.R. Pollack, D.T. Ross, H. Johnsen, L.A.
Akslen, O. Fluge, A. Pergamenschikov, C. Williams, S.X.
Zhu, P.E. Lonning, A.L. Borresen-Dale, P.O. Brown, D.
Botstein, Molecular portraits of human breast tumours, Nature
406 (2000) 747–752.
[65] A.A. Alizadeh, M.B. Eisen, R.E. Davis, C. Ma, I.S. Lossos, A.
Rosenwald, J.C. Boldrick, H. Sabet, T. Tran, X. Yu, J.I.
Powell, L. Yang, G.E. Marti, T. Moore, J. Hudson Jr., L. Lu,
D.B. Lewis, R. Tibshirani, G. Sherlock, W.C. Chan, T.C.
Greiner, D.D. Weisenburger, J.O. Armitage, R. Warnke, L.M.
Staudt, Distinct types of diffuse large B-cell lymphoma
identified by gene expression profiling, Nature 403 (2000)
503–511.
[66] P. Tamayo, D. Slonim, J. Mesirov, Q. Zhu, S. Kitareewan, E.
Dmitrovsky, E.S. Lander, T.R. Golub, Interpreting patterns of
gene expression with self-organizing maps: methods and
application to hematopoietic differentiation, Proc. Natl. Acad.
Sci. USA 96 (1999) 2907–2912.
[67] L.J. ‘t Veer, H. Dai, M.J. van de Vijver, Y.D. He, A.A. Hart,
M. Mao, H.L. Peterse, K. van der Kooij, M.J. Marton, A.T.
Witteveen, G.J. Schreiber, R.M. Kerkhoven, C. Roberts, P.S.
Linsley, R. Bernards, S.H. Friend, Gene expression profiling
predicts clinical outcome of breast cancer, Nature 415 (2002)
530–536.
[68] F.S. Monteclaro, P.K. Vogt, A Jun-binding protein related to a
putative tumor suppressor, Proc. Natl. Acad. Sci. USA 90
(1993) 6726–6730.
[69] B. Mann, M. Gelos, A. Siedow, M.L. Hanski, A. Gratchev, M.
Ilyas, W.F. Bodmer, M.P. Moyer, E.O. Riecken, H.J. Buhr, C.
Hanski, Target genes of beta-catenin-T cell-factor/lymphoid-
enhancer-factor signaling in human colorectal carcinomas,
Proc. Natl. Acad. Sci. USA 96 (1999) 1603–1608.
[70] T. Kato, S. Satoh, H. Okabe, O. Kitahara, K. Ono, C. Kihara,
T. Tanaka, T. Tsunoda, Y. Yamaoka, Y. Nakamura, Y.
Furukawa, Isolation of a novel human gene, MARKL1,
homologous to MARK3 and its involvement in hepatocellular
carcinogenesis, Neoplasia. 3 (2001) 4–9.
S.I. Meireles et al. / Cancer Letters 190 (2003) 199–211 211