Influence of the newly identified Mos10 interaction partner ...
194
Influence of the newly identified Mos10 interaction partner Vps68 on ESCRT-III function Dissertation zur Erlangung des Doktorgrades der Naturwissenschaften (Dr. rer. nat.) Fakultät Naturwissenschaften Universität Hohenheim Institut für Lebensmittelwissenschaft und Biotechnologie Vorgelegt von Sören Alsleben aus Mülheim an der Ruhr Stuttgart, 2021
-
Upload
khangminh22 -
Category
Documents
-
view
0 -
download
0
Transcript of Influence of the newly identified Mos10 interaction partner ...

Influence of the newly identified Mos10 interaction partner Vps68
on ESCRT-III function
Dissertation zur Erlangung des Doktorgrades
der Naturwissenschaften
(Dr. rer. nat.)
Fakultät
Naturwissenschaften
Universität Hohenheim
Institut für Lebensmittelwissenschaft und Biotechnologie
Vorgelegt von
Sören Alsleben
aus Mülheim an der Ruhr
Stuttgart, 2021

1. Gutachter: Prof. Dr. Ralf Kölling
Institut für Lebensmittelwissenschaften und Biotechnologie
Fachgebiet für Hefegenetik und Gärungstechnologie
2. Gutachter: Dekan:
Prof. Dr. Armin Huber
Institut für Biologie
Fachgebiet Biochemie Prof. Dr. Uwe Beifuss
Eingereicht am: 06.12.2021
Tag der mündlichen Prüfung: 22.02.2022
Die vorliegende Arbeit wurde am 17.12.2021 von der Fakultät der Naturwissenschaften der
Universität Hohenheim als „Dissertation zur Erlangung des Grades eines Doktors der
Naturwissenschaften“ angenommen.

3
TABLE OF CONTENT
LIST OF FIGURES ........................................................................................................................ 7
LIST OF FIGURES (SUPPLEMENTARY) ........................................................................................ 8
LIST OF TABLES ....................................................................................................................... 10
LIST OF TABLES (SUPPLEMENTARY) ....................................................................................... 10
ABBREVIATIONS ....................................................................................................................... 11
1 INTRODUCTION ................................................................................................................ 14
1.1 Clathrin-mediated endocytosis .............................................................................. 15
1.2 Endomembrane system .......................................................................................... 16
1.3 The ESCRT machinery .......................................................................................... 18
1.3.1 ESCRT-0 .............................................................................................................. 20
1.3.2 ESCRT-I ............................................................................................................... 20
1.3.3 ESCRT-II ............................................................................................................. 21
1.3.4 ESCRT-III ............................................................................................................ 22
1.3.5 Vps4 ..................................................................................................................... 26
1.4 ESCRT functions .................................................................................................... 26
1.4.1 Cytokinesis ........................................................................................................... 27
1.4.2 Virus budding ....................................................................................................... 28
1.4.3 The nuclear envelope (NE) .................................................................................. 29
1.4.4 Autophagy ............................................................................................................ 29
1.4.5 Exosomes & Microvesicles .................................................................................. 30
1.4.6 Other functions ..................................................................................................... 30
1.5 Aim of this thesis .................................................................................................... 31
2 MATERIAL AND METHODS ............................................................................................... 32
2.1 Strains and media ................................................................................................... 32
2.1.1 Bacteria strains ..................................................................................................... 32
2.1.2 E. coli growth conditions ..................................................................................... 32

4
2.1.3 Yeast strains ......................................................................................................... 32
2.1.4 Yeast growth conditions ....................................................................................... 36
2.2 Plasmids ................................................................................................................... 37
2.3 Designed oligonucleotides ...................................................................................... 38
2.4 Materials ................................................................................................................. 44
2.4.1 Chemicals and solutions ....................................................................................... 44
2.4.2 Facilities and consumables ................................................................................... 46
2.4.3 Software ............................................................................................................... 48
2.5 Molecular biological methods ............................................................................... 49
2.5.1 PCR (Polymerase chain reaction) ........................................................................ 49
2.5.2 Colony Test PCR .................................................................................................. 49
2.5.3 Agarose gel electrophoresis ................................................................................. 49
2.5.4 Isolation of DNA fragments ................................................................................. 50
2.5.5 Calculating DNA concentration ........................................................................... 50
2.5.6 Enzymatic Digestion ............................................................................................ 50
2.5.7 SDS PAGE ........................................................................................................... 50
2.5.8 Coomassie staining ............................................................................................... 51
2.5.9 Silver staining for mass spectrometry .................................................................. 51
2.5.10 Western Blot analysis ....................................................................................... 52
2.6 Microbiological methods ........................................................................................ 53
2.6.1 S. cerevisiae genomic DNA extraction (for Western Blot) .................................. 53
2.6.2 Yeast transformation ............................................................................................ 54
2.6.3 E. coli transformation ........................................................................................... 55
2.7 Antibody Purification ............................................................................................ 55
2.7.1 Protein expression in E. coli ................................................................................. 55
2.7.2 Lysing E. coli cells ............................................................................................... 56
2.7.3 Protein purification from E. coli cells .................................................................. 57
2.7.4 Protein Dialysis .................................................................................................... 57

5
2.7.5 Affigel purification ............................................................................................... 57
2.7.6 Antibody purification ........................................................................................... 58
2.8 Cell fractionation .................................................................................................... 58
2.8.1 Sucrose Gradient .................................................................................................. 58
2.8.2 Flotation ............................................................................................................... 59
2.8.3 Differential centrifugation .................................................................................... 60
2.9 Protein purification from yeast cells ..................................................................... 60
2.9.1 Co-Immunoprecipitation ...................................................................................... 60
2.9.2 Crosslinking experiment ...................................................................................... 61
2.9.3 AEKTA purification ............................................................................................. 62
2.10 Cycloheximide chase .............................................................................................. 63
2.11 Fluorescence microscopy ....................................................................................... 64
2.12 SILAC Experiments ............................................................................................... 64
3 RESULTS ........................................................................................................................... 65
3.1 Finding interacting partners of ESCRT-III subunit Mos10 .............................. 65
3.1.1 IMAC purification of His-tagged Mos10 ............................................................. 66
3.1.2 AEKTA purification of His-tagged Mos10 .......................................................... 67
3.1.3 AEKTA purification of His-tagged Mos10 with SILAC ..................................... 74
3.1.4 Improved batch purification by sedimentation and SILAC ................................. 77
3.1.5 Purification of untagged Mos10 ........................................................................... 81
3.1.6 The first set of potential Mos10 interacting partners ........................................... 85
3.1.7 Tagged Mos10 purification via IP ........................................................................ 88
3.1.8 The second set of potential Mos10 interacting partners ....................................... 91
3.1.9 ESCRT-III interacting partners of Mos10 ............................................................ 94
3.2 Influence of VPS68 deletion on ESCRT-III ......................................................... 95
3.2.1 IP and Co-IP in WT .............................................................................................. 95
3.2.2 IP and Co-IP in the Δvps68 strain RKY3222 ....................................................... 97
3.2.3 Effect of VPS68 deletion on the intracellular ESCRT-III protein distribution .... 99

6
3.3 Cell-fractionation ................................................................................................. 102
3.3.1 Differential centrifugation experiments ............................................................. 102
3.3.2 Flotation ............................................................................................................. 105
3.3.3 Sucrose Gradients ............................................................................................... 106
3.4 Perturbations in endocytic cargo degradation and transport .......................... 110
3.5 Synchronized ESCRT-III assembly .................................................................... 113
3.6 Linking ESCRT-III to non-endosomal functions .............................................. 115
3.6.1 Potential association of ESCRT-III with nucleic acids ...................................... 115
3.6.2 P-bodies and stress markers ............................................................................... 119
4 DISCUSSION .................................................................................................................... 122
4.1 The Mos10 crosslinking pattern .......................................................................... 122
4.2 Choosing a proper tag .......................................................................................... 124
4.3 Choosing suitable Mos10 interaction candidates .............................................. 125
4.4 Influence of VPS68 deletion ................................................................................. 126
4.5 Non-endosomal functions .................................................................................... 128
5 LITERATURE .................................................................................................................. 130
6 SUPPLEMENTARY MATERIAL ........................................................................................ 149
SUMMARY ............................................................................................................................... 188
ZUSAMMENFASSUNG .............................................................................................................. 190
DANKSAGUNG ........................................................................................................................ 192
APPENDIX ............................................................................................................................... 193
CURRICULUM VITAE.............................................................................................................. 194

7
LIST OF FIGURES Figure 1: Phagocytosis pathway, adapted from “INTRACELLULAR DIGESTION”(De Duve, 1963). ............. 14 Figure 2: Clathrin-mediated vesicle formation, adapted from the poster (Lu et al., 2016). .................................. 15 Figure 3: Endomembrane trafficking in mammals and yeast, adapted from (Day et al., 2018). ........................... 17 Figure 4: Scheme of the ESCRT machinery assembly, adapted from (Teis et al., 2009). .................................... 19 Figure 5: The ESCRT-III proteins in yeast, redrawn from (Schoneberg et al., 2017)........................................... 22 Figure 6: ESCRT-III open and closed conformational structure, adapted from (McCullough et al., 2018). ........ 24 Figure 7: Membrane fission by ESCRT-III exchange, adapted from (McCullough and Sundquist, 2020). ......... 25 Figure 8: Summary of ESCRT-III mediated cellular processes, adapted from (McCullough et al., 2018). .......... 27 Figure 9: Identification of Mos10 interacting partners by a characteristic WB pattern. ....................................... 66 Figure 10: AEKTA purification of Mos10-6His from S. cerevisiae culture with Ni-NTA column. ..................... 68 Figure 11: Isocratic AEKTA purification of Mos10-6His using a Ni-NTA column. ............................................ 69 Figure 12: WB results of a gradient AEKTA purification of Mos10-6His using a Ni-NTA column. .................. 71 Figure 13: Gradient AEKTA purification of Mos10-6His using a Ni-NTA column Coomassie staining. ........... 72 Figure 14: Lane intensity distribution of Coomassie-stained SDS PAGE. ........................................................... 73 Figure 15: AEKTA purified samples for MS analysis. ......................................................................................... 73 Figure 16: Validating crosslinker induced WB pattern of 6His tagged Mos10 with Arg auxotrophy in YNB. .... 75 Figure 17: WB results of the Mos10-6His AEKTA purification using a Ni-NTA column with SILAC. ............. 76 Figure 18: Crosslinking pattern sub-division by differential centrifugation. ........................................................ 78 Figure 19: Mos10-6His purification with Ni2+- and Co2+-NTA column with P13 separation. .............................. 79 Figure 20: SILAC samples for MS analysis from batch Mos10-6His purification. .............................................. 80 Figure 21: Autoinduction media used for Mos10-6His heterologous expression in E. coli. ................................. 82 Figure 22: Testing antibody sera against native Mos10 extract. ........................................................................... 83 Figure 23: Crosslinking pattern of native Mos10 by α-Mos10 immunoprecipitation. .......................................... 84 Figure 24: Purification of potential Mos10-6His interacting partners by α-13myc immunoprecipitation. ........... 86 Figure 25: Identification of co-immunoprecipitated Mos10-6His by potential interacting partners. .................... 87 Figure 26: Crosslinking pattern of crosslinked Mos10-6His and 13myc tagged interacting partners. .................. 88 Figure 27: Evaluating Mos10 affinity tags for immunoprecipitation compared to IMAC. ................................... 89 Figure 28: Purification of Mos10-sfGFP by α-GFP antibodies on WB and silver-stained gel for MS. ................ 90 Figure 29: Purification of potential Mos10 interacting partners by α-13myc immunoprecipitation. .................... 92 Figure 30: Identification of co-immunoprecipitated Mos10 by potential interacting partners. ............................. 93 Figure 31: Comparison of Mos10-6His specific IMAC WB patterns of ESCRT-III single deletions. ................. 95 Figure 32: Molar fraction of ESCRT-III proteins in ESCRT-III complexes in the WT strain RKY1558. ........... 96 Figure 33: Simplified ESCRT-III complex composition based on the co-IP in WT strain RKY1558. ................. 97 Figure 34: Difference between the co-immunoprecipitated values of strains RKY1558 and RKY3222. ............. 98 Figure 35: Co-IP values of strain Δvps68 RKY3222 in comparison to the WT strain RKY1558. ....................... 98 Figure 36: Intracellular distribution of ESCRT-III proteins by fluorescence microscopy. ................................. 100 Figure 37: Vps68-mCherry induced localization shift of Mos10-sfGFP. ........................................................... 101 Figure 38: Reverse Vps68 and Mos10 tagging to visualize protein distribution................................................. 102

8
Figure 39: ESCRT-III distribution in the WT strain RKY 1558 with and without Triton X-100 treatment. ...... 103 Figure 40: Sedimentation comparison between WT strain RKY1558 and Vps68 deletion strain RKY3222. .... 104 Figure 42: Flotation comparison between WT strain RKY1558 and Vps68 deletion strain RKY3222. ............. 105 Figure 43: Flotation comparison between the WT strain RKY1558 and the Δsnf7 strain RKY2790. ................ 106 Figure 44: ESCRT-III distribution fractionation by sucrose density gradient separation. .................................. 107 Figure 45: Gradient of tagged Mos10 in WT and Δvps68 background in comparison with marker proteins. .... 109 Figure 46: Cycloheximide chases of Ste6 in WT strain RKY1558 and Δvps68 strain RKY3222. ..................... 111 Figure 47: Classifying Vps68 deletion by established Class D & E protein null mutations. .............................. 112 Figure 48: Perturbation of CPS cargo sorting by Vps68 deletion. ...................................................................... 113 Figure 49: Heat-induced alteration of ESCRT-III assembly and disassembly by a Vps27 variant. .................... 114 Figure 50: ESCRT-III distribution on sucrose density gradients after pre-incubation. ....................................... 116 Figure 51: Flotation experiment with WT strain RKY1558 with and without incubation. ................................. 117 Figure 52: Sucrose gradients of N-& C-terminally tagged Did2 in comparison with marker proteins. .............. 118 Figure 53: C- & N-terminal tagging of Did2 by GFP/sfGFP. ............................................................................. 119 Figure 54: Heat and sodium azide-induced stress granule formation visualized by Pub1-sfGFP. ...................... 120 Figure 55: Heat and sodium azide-induced replication stress visualized by Dcp2-sfGFP. ................................. 120 Figure 56: Heat and sodium azide-induced mRNA stress visualized by Nmd2-sfGFP. ..................................... 121
LIST OF FIGURES (SUPPLEMENTARY) Figure S 1: Color Pre-stained Protein Standard, Broad Range (11–245 kDa). ................................................... 149 Figure S 2: Gradient AEKTA purification protocol of Mos10-6His from RKY2999 with Ni-NTA column. .... 151 Figure S 3: SDS PAGE of gradient Mos10-6His AEKTA purification using a Ni-NTA column and SILAC. .. 152 Figure S 4: Ni2+- vs. Co2+-NTA column assay for purifying crosslinked Mos10-6His. ...................................... 152 Figure S 5: SILAC Experiment with mixed “light” and “heavy” RKY2998 and RKY2999 purification........... 153 Figure S 6: Analyzing antibody sera efficiency against native Mos10 extract. .................................................. 155 Figure S 7: Comparison of WT and ΔMos10 purification on SDS PAGE with Coomassie and silver staining. 155 Figure S 8: Samples for MS once stained with Coomassie and once with silver staining. ................................. 156 Figure S 9: Graphing electrophoresis results of WB bands. ............................................................................... 156 Figure S 10: Crosslink pattern of Mos10-13myc OD 1 and OD 4 cultures. ....................................................... 157 Figure S 11: IP of potential Mos10 interacting partners with a GFP-tag and Co-IP of Mos10. .......................... 160 Figure S 12: IP of potential Mos10 interacting partners with a sfGFP-tag and Co-IP of Mos10. ....................... 161 Figure S 13: IMAC purification of WT (RKY1558) strain with RKY2889 (Mos10-6His) control sample. ...... 162 Figure S 14: IMAC purification of RKY2889 (Mos10-6His). ............................................................................ 162 Figure S 15: IMAC purification of RKY3228 (Mos10-6His +Δchm7). ............................................................. 163 Figure S 16: IMAC purification of RKY2788 (Mos10-6His +Δdid2). ............................................................... 163 Figure S 17: IMAC purification of RKY2789 (Mos10-6His +Δist1). ................................................................ 164 Figure S 18: IMAC purification of RKY2790 (Mos10-6His +Δsnf7). ............................................................... 164 Figure S 19: IMAC purification of RKY2841 (Mos10-6His +Δvps2). ............................................................... 165 Figure S 20: IMAC purification of RKY2893 (Mos10-6His +Δvps20). ............................................................. 165

9
Figure S 21: IMAC purification of RKY2830 (Mos10-6His +Δvps24). ............................................................. 166 Figure S 22: IP and Co-IP of all ESCRTs in WT strain. RKY1558. ................................................................... 166 Figure S 23: Total amount of protein co-immunoprecipitated by ESCRT-III IP in WT strain RKY1558.......... 169 Figure S 24: IP and Co-IP of all ESCRTs in VPS68 deletion strain RKY3222. ................................................. 169 Figure S 25: Total amount of protein co-immunoprecipitated by ESCRT-III IP in Δvps68 strain RKY3222. ... 172 Figure S 26: Differential centrifugation experiment without Triton X-100 in the WT strain RKY 1558. .......... 173 Figure S 27: Differential centrifugation experiment with Triton X-100 in the WT strain RKY 1558. ............... 173 Figure S 28: Western Blots of differential centrifugation of WT strain RKY1558 in triplets. ........................... 174 Figure S 29: Protein distribution in the Δvps68 strain RKY 3221 with and without Triton X-100 treatment. ... 175 Figure S 30: Differential centrifugation experiment without TX-100 in the Δvps68 strain RKY 3221. ............. 175 Figure S 31: Differential centrifugation experiment with TX-100 in the Δvps68 strain RKY 3221. .................. 176 Figure S 32: Sedimentation comparison between RKY1558 and RKY3222 with Triton X-100 treatment. ....... 176 Figure S 33: Western Blots of differential centrifugation results from the Δvps68 strain RKY 3221. ............... 177 Figure S 34: Summary of the flotation results from the WT strain RKY1558. ................................................... 177 Figure S 35: Summary of the flotation results from the Δvps68 strain RKY3222. ............................................. 178 Figure S 36: Summary of the flotation results from the Δsnf7 strain RKY2790. ................................................ 178 Figure S 37: Summary of the flotation results from the WT strain RKY1558 after incubation. ......................... 179 Figure S 38: WB results of the flotation experiments of WT strain RKY1558................................................... 180 Figure S 39: WB results of the flotation experiments of Δsnf7 strain RKY2790................................................ 180 Figure S 40: Flotation results regarding WT incubation, Dpm1 marker protein, and Vps68 deletion. ............... 181 Figure S 41: Sucrose gradient incubated Did2 WB results of RNaseA treated cells. ......................................... 181 Figure S 42: ESCRT-III proteins sucrose profiles in the Vps68 deletion strain RKY3222. ............................... 182 Figure S 43: ESCRT-III proteins sucrose profiles in the Vps68 deletion strain RKY3222 after incubation. ..... 183 Figure S 44: WB results of the sucrose gradient from the WT strain RKY1558. ............................................... 184 Figure S 45: WB results of the sucrose gradient from the WT strain RKY1558 after incubation. ..................... 184 Figure S 46: WB results of the sucrose gradient from the Δvps68 strain RKY3222. .......................................... 185 Figure S 47: WB results of the sucrose gradient from the Δvps68 strain RKY3222 after incubation. ................ 185 Figure S 48: Sucrose profiles of marker and tagged proteins.............................................................................. 186 Figure S 49: Evaluating Vps68 induced alterations in ER-PM tethering visualized by Ist2- & Tcb1-sfGFP. .... 187 Figure S 50: Alterations in Mos10-sfGFP distribution by Vps68 and Vps55 single and double deletions. ........ 187

10
LIST OF TABLES Table 1: The ESCRT nomenclature in yeast and metazoans (Hurley, 2010). ....................................................... 18 Table 2: Escherichia coli (E. coli) strains. ............................................................................................................ 32 Table 3: Saccharomyces cerevisiae (S. cerevisiae) strains.................................................................................... 32 Table 4: Constructed S. cerevisiae strains according to (Longtine et al., 1998). .................................................. 33 Table 5: Constructed S. cerevisiae strains using various techniques. .................................................................... 36 Table 6: Plasmid register. ...................................................................................................................................... 37 Table 7: Synthesized oligonucleotides register. .................................................................................................... 38 Table 8: Chemicals and solutions register. ............................................................................................................ 44 Table 9: Facility register. ...................................................................................................................................... 46 Table 10: Consumables register. ........................................................................................................................... 47 Table 11: Software register. .................................................................................................................................. 48 Table 12: PCR protocol for Q5 polymerase. ......................................................................................................... 49 Table 13: PCR protocol for OneTaq. .................................................................................................................... 49 Table 14: Pipetting scheme for the SDS PAGE separating gel. ............................................................................ 50 Table 15: Pipetting scheme for the SDS PAGE stacking gel. ............................................................................... 51 Table 16: Antibody list. ........................................................................................................................................ 53 Table 17: Transformation mixture. ....................................................................................................................... 55 Table 18: Autoinduction medium according to Studier. ....................................................................................... 56 Table 19: Table of used sucrose solutions............................................................................................................. 59 Table 20: Testing Buffer conditions according to Affi-Gel 15 manufactures guidelines. ..................................... 83 Table 21: Selected crosslinking partners of Mos10. ............................................................................................. 85 Table 22: Extended set of Mos10 crosslinking partners. ...................................................................................... 91 Table 24: Half-life of CPS in WT and Vps68 depleted strain. ............................................................................ 111
LIST OF TABLES (SUPPLEMENTARY) Table S 1: CSM Single Drop-out media (-Trp left; -His right). .......................................................................... 149 Table S 2: Corresponding sample concentrations of the gradient purification.................................................... 150 Table S 3: Mos-6His to Ni-NTA binding condition test. .................................................................................... 154 Table S 4: Calculation of the unknown protein bands sized of the established crosslinking pattern partner. ..... 157 Table S 5: MS Results overview (ESCRT-III in bold). ....................................................................................... 158 Table S 6: Co-IP Overview in WT strain. ........................................................................................................... 167 Table S 7: Co-IP Overview in Δvps68 strain RKY3222. .................................................................................... 170 Table S 8: ESCRT-III molecules per cell. ........................................................................................................... 172

11
ABBREVIATIONS
AAA ATPases associated with a variety of cellular activities
ALIX ALG-2 interacting protein X
APS Ammonium persulfate
Bro BCK1-like resistance to osmotic shock
BSA Bovine serum albumin
CCP Clathrin-coated pit
CCV Clathrin-coated vesicle
CHMP Chromatin modifying protein
CME Clathrin-mediated endocytosis
CPY Carboxypeptidase Y
CTD C-terminal domain
DAPI 4,6-Diamidino-2-Phenylindol
dH2O Distilled water
Did Doa4-independent degradation
DMSO Dimethyl sulfoxide
DNA Deoxyribonucleic acid
Doa Degradation of anti-2
DSP Dithiobis[succinimidylpropionate]
DSS Disuccinimidyl suberate
DTT Dithiothreitol
EAP ELL-associated protein
EDTA Ethylenediaminetetraacetic acid
EE Early endosome
EGFR Epidermal growth factor receptor
ER Endoplasmic reticulum
ESCRT Endosomal sorting complex required for transport
Et al Et alii
FYVE Fab1, YOTB, Vac1, EFA1
GAT GGA and TOM (target of myb)
GGA Golgi-localized, gamma ear-containing ADP ribosylation factor-binding protein
GLUE GRAM-like ubiquitin binding in EAP45
GTP Guanosine triphosphate
HEPES 4-(2-hydroxyethyl)-1-piperazineethanesulfonic acid
HRS Hepatocyte growth factor-regulated tyrosine kinase substrate
Hse Has symptoms of class E mutants; resembles Hrs, STAM, East
ILV Intraluminal vesicle
IMAC Immobilized metal affinity chromatography
IP Immunoprecipitation

12
Ist Increased sodium tolerance
LB Lysogeny broth
LE Late endosome
MAPB MVB12-associated b-prism domain
MIM MIT-interacting motif
MIT Microtubule interacting and trafficking
MOPS 3-(N-morpholino)propanesulfonic acid
Mos More of Ste6
MVB Multivesicular body
MWCO Molecular weight cut-off
NE Nuclear envelope
NHS N-hydroxysuccimide
NPC Nuclear pore complex
NSF N-ethylmaleimide sensitive fusion protein
NTA Nitrilotriacetic acid
NZF Np14 zinc finger
OD Optical density
PAGE Polyacrylamide Gel Electrophoresis
PBS Phosphate-buffered saline
PCR Polymerase chain reaction
PEG Polyethylenglykol
pH Potentia Hydrogenii
pI Isoelectric point
PI3P Phosphatidylinositol 3-phosphate
PM Plasma membrane
PMSF Phenylmethylsulfonyl fluoride
PPxY proline-proline-x-tyrosine
PRD proline-rich domain
PVC Prevacuolar compartment
PVE Prevacuolar endosome
rpm Rounds per minute
RT Room temperature
SD Synthetic defined
SDS Sodium Dodecyl Sulfate
SH3 src homology-3
SILAC Stable isotope labeling with amino acids in cell culture
SN Supernatant
SNAP Soluble NSF attachment protein
SNARE SNAP Receptor
Snf Sucrose non-fermenting
ssDNA Single-stranded DNA

13
STAM Signal transducing adaptor molecule
TAE Tris bace acetic acid and EDTA
TCA Trichloroacetic acid
TEMED Tetramethylethylenediamine
TGN Trans-Golgi Network
ts Temperature-sensitive
TSG Tumor suppressor gene
Ub Ubiquitin
UEV unusual E2 variant
UIM Ubiquitin-interacting motif
UV Ultraviolet
V V-shaped ubiquitin and the signal binding central domain of Bro1 and ALIX
VHS Vps27, HRS, STAM
VPS/Vps Vacuolar protein sorting
Vta Vps twenty associated
WH Winged-helix
WT Wild type
YNB Yeast nitrogen base
YPD Yeast extract peptone dextrose
TSG101 Tumor susceptibility gene 101
Names of measurement units are abbreviated following the SI base unit system, and
proteinogenic amino acids are referred to either by their single or multiple letter code.

14
1 INTRODUCTION
Microorganisms are microscopic scaled and unicellular organisms considered one of the earliest
life-forms on earth (Schopf et al., 2018). Grouped into archaea, bacteria, and eukaryotes,
microorganisms are highly abundant in the earth’s ecosphere, which drives their dispersal into
vastly diverse environments (Finlay and Clarke, 1999). As ubiquitously found species, the
ability to sense and adapt to continually changing environments is essential for all
microorganism domains, necessitating common stress responses (Mosesso et al., 2019).
Thus, despite morphological diversities in the cellular organization that differ in the three
domains, a unifying characteristic is the possession of a cell enwrapping biological membrane.
This cell membrane, also known as a plasma membrane, serves as a natural barrier for directed
interactions between the cell’s interior and the environment. Inflammation studies discovered
the phenomenon of intracellular digestion in which products coming from the environment are
internalized and digested inside the cell (Ambrose, 2006). This active motion and absorption of
foreign particles as a protective response and the underlying mechanism against an external
agent was initially named phagocytosis (Mechnikov, 1908).
The advent of electron microscopy led to more profound insight into intracellular digestion
morphology by a putative cascade-like membrane remodeling pathway. In this pathway,
distinct membrane-enclosed compartments drift from the plasma membrane to the cell interior
(Figure 1). By endocytic invagination of the plasma membrane, a compartment called
phagosome has formed that harbors extracellular cargo material and is supplementarily
enriched by internal cell products targeted for degradation. The pathway proceeds to the fusion
of the phagosome with the digestive vacuole/lysosome to release the cargo material targeted
for hydrolyzation, thus concluding the intracellular digestion cascade.
Figure 1: Phagocytosis pathway, adapted from “INTRACELLULAR DIGESTION”(De Duve, 1963).
Scheme of external cargo uptake by endocytic invagination into phagosomes delivered to the digestive vacuole.

15
1.1 Clathrin-mediated endocytosis
Engulfing molecules, bacteria, and other external resources by de novo generation of internal
membranes from the plasma membrane lipid bilayer is generally referred to as endocytosis (De
Duve, 1963). Many different co-existing routes of endocytic uptake into the cell’s interior exist
and ensure a precise regulation of the interactions between the environment and the cell
(Hoeller et al., 2005). These individual pathways create endosomal compartments with distinct
lumina and surfaces given the cell the possibility of delivering cargoes to different intracellular
destinations (Doherty and McMahon, 2009).
Postulated over 40 years ago, one essential and best-characterized endocytic pathway in yeast
comprises clathrin-coated vesicles and is specified as clathrin-mediated endocytosis (CME)
(Goldstein et al., 1979). CME involves the chronological assembly and disassembly of many
associated proteins and cellular structures for cargo uptake at the plasma membrane (Figure 2).
Figure 2: Clathrin-mediated vesicle formation, adapted from the poster (Lu et al., 2016).
Chronological pathway of membrane deformation and scission; Early protein in green, early coat in bright blue,
mid-coat in blue, late coat in dark blue, WASp/Myosin in purple, actin in orange, and cargo in yellow
Clathrin-mediated endocytosis can be sub-divided into clustering coat proteins and cargo at the
endocytic site, membrane deformation, and membrane scission to release a membrane
enwrapped vesicle (Conibear, 2010). Initially, early proteins and furrow plasma membrane
domains named eisosomes assemble at the putative organizing sites, followed by the
accumulation of cargo molecules for endocytosis (Walther et al., 2006).
CME uptake and vesicle formation is regulated via cascade-like phosphorylation of almost all
endocytic proteins and the ubiquitylation of the cytosolic domains of endocytic cargo (Haglund
and Dikic, 2012). The coating-protein clathrin functions as a molecular scaffold for vesicular
uptake by self-assembling into cage-like, polyhedral lattices on and around the plasma
membrane called clathrin-coated pit (CCP) (Roth and Porter, 1964). The clathrin-coat and the

16
membrane bilayer are linked together by four subunits of the heterotetrameric adaptor complex
AP2 (Kirchhausen et al., 2014). The subsequent WASp/Myosin protein complex recruitment
promotes actin polymerization, pulling the coated plasma membrane towards the cell’s interior
and allowing the matured clathrin-coated pit to commit invagination. Bringing the two
membrane bilayers in close proximity activates scission effectors like the GTPase dynamin to
pinch off the vesicle from the plasma membrane (Weinberg and Drubin, 2012). The fully
matured clathrin-coated vesicle (CCV) sheds the clathrin coat before associated actin cables
transport and fuse the endocytic vesicle to accepting organelles of the endomembrane system
(Toshima et al., 2006).
1.2 Endomembrane system
The endomembrane system consists of a combination of intracellular sorting organelles like the
early, late, and recycling endosomes, the trans-Golgi network (TGN), vesicles, and the
lysosome. Traffic between these organelles form branched and often bi-directional routes to
sort, recycle and degrade cargo material (Scott et al., 2014).
The early endosome serves as the initial sorting organelle in mammalian cells which membrane
composition and volume mainly derives and constantly regenerates from fused endocytic
vesicles (Murphy, 1991). Upon vesicle fusion, cargo material gradually dissociates from the
corresponding receptor allowing the receptor molecules to detach from the EE and recycle back
to the plasma membrane via the trans-Golgi network and the recycling endosome (Delic et al.,
2013). Proteins exported from the endoplasmic reticulum (ER) likewise pass by the TGN,
sorted for endosomal or plasma membrane delivery. The exchange of material between the
TGN and the recycling endosome serves as a critical nexus between the endocytic and secretory
pathways in endosomal trafficking (Maxfield and McGraw, 2004). Cargo material targeted for
degradation and cell material for lysosomal maintenance remains associated with the EE, which
maturation process involves changes in the lipid composition, acidity, and membrane markers
(Huotari and Helenius, 2011). Membrane markers, including Rab proteins, vesicle coats,
tethering molecules, and proteins of the SNARE family, characterize each endomembrane
compartment (Cai et al., 2007). Tethering factors and Rab proteins mediate docking of vesicles
to the proper target endomembrane, whereas membrane-bound soluble N-ethylmaleimide-
sensitive-factor (NSF) attachment receptor (SNARE) proteins mediate vesicle fusion (Wang et
al., 2017). Specific target-SNAREs (t-SNAREs) on the membrane interact with vesicle-
SNAREs (v-SNAREs) to form a structured SNAREpin harboring a hydrophobic coiled-coil

17
structure to bring the organelles in close proximity for membrane fusion (Sollner et al., 1993).
Conversion of Rab GTPases drives endosome maturation, crucial for sorting endocytic cargo
and receptors after membrane fusion. In mammalian cells, the early endosome's development
to the late endosome (LE) is advanced by exchanging the Ras-related protein Rab5 with Rab7a
(Rink et al., 2005). Rab7a recruitment implements LE maturation, enabling lysosomal targeting
and concluding the endocytic pathway (Hesketh et al., 2018).
In contrast, yeast's putative minimal endomembrane system functions like an endosomal
shuttling model rather than by endosomal maturation, in which the TGN serves as an early and
recycling endosome (Skjeldal et al., 2021) (Figure 3). Yeast expression of the early endosome
marker Rab5 homologs Vps21 and Ypt52 colocalize with a joint prevacuolar compartment
(PVC) marker protein (Day et al., 2018). Cargo material targeted for degradation in the yeast
vacuole is exchanged via vesicles from the TGN to the prevacuolar endosome (PVE),
resembling the mammalian's late endosome in yeast (Grissom et al., 2020).
Maturation of the early endosome or PVE involves membrane invagination and budding
towards the endosome’s lumen, processing cargo into intraluminal vesicles (ILVs) (Luzio et
al., 2007). Mature endosomal compartments feature a round morphology, harboring numerous
ILVs, forming a multivesicular body (MVB) located close to the cell nucleus (Mellman, 1996).
MVB undergoes transient fusion (“kiss and run”) with the lysosome in which proteases and
lipases drive the hydrolyzation of the mono- or polyubiquitinated target proteins marked for
degradation (Haglund and Dikic, 2012). Recognition of ubiquitin added to the target protein and
proper cargo sorting into forming ILVs is mediated by the endosomal sorting complex required for
transport (ESCRT) (Hurley, 2010).
Figure 3: Endomembrane trafficking in mammals and yeast, adapted from (Day et al., 2018).
In mammalian cells, endocytic and secretory pathways include early, late, and recycling endosomes, which
communicate with the TGN through bidirectional traffic. In yeast cells, endocytosed cargo is sorted in the TGN,
recycled back to the PM, or transported to the PVE for degradation.

18
1.3 The ESCRT machinery
Genetic screens in yeast led to the identification of mutants secreting vacuolar proteins, like the
well-documented soluble vacuolar glycoprotein carboxypeptidase Y (CPY), usually sorted
from the TGN to the vacuole, out of the cell (Stevens et al., 1986). Proteins initiating the
absence of a sorting signal are identified as vacuolar protein sorting (vps) associated proteins,
which mutants also commence defects in sorting several other cargo proteins (Robinson et al.,
1988, Rothman et al., 1989). Miss sorting of cargo proteins like CPY into morphological
distinct prevacuolar compartments led to a further classification into class A-F phenotypes.
Fourteen genes grouped into the phenotypic class E show a miss localization of transmembrane
proteins onto the vacuole membrane processed by an exaggerated endosome classified as a
class E compartment (Raymond et al., 1992). Class E Vps proteins form the highly conserved
ESCRT (endosomal sorting complex required for transport) machinery consisting of ESCRT-
0, -I, -II, and -III, and the AAA-ATPase Vps4 (Leung et al., 2008) (Table 1).
Table 1: The ESCRT nomenclature in yeast and metazoans (Hurley, 2010).
Complex Yeast Protein Metazoan protein Domains and motifs
ESCRT-O Vps27 VPS27/Hrs/HGS VHS, UIM, GAT, FYVE
Hse1 HSE1/STAM1, 2 VHS, UIM, GAT, SH3
ESCRT-I Vps23/Stp22 VPS23/TSG101 UEV, PRD, coiled-coil
Vps28 VPS28 Vps28 CTD, coiled-coil
Vps37/Srn2 VPS37A, B, C, D Coiled coil
Mvb12 MVB12A, B/UBAP1(L) MAPB, UBD, coiled-coil
ESCRT-II Vps22/Snf8 VPS22/EAP30 WH, coiled-coil
Vps25 VPS25/EAP20 WH, PPxY
Vps36 VPS36/EAP45 GLUE, NZF1, 2, WH
ESCRT-III Chm7 CHMP7 MIM1, 2
Did2/Chm1/Vps46 DID2A, B/CHMP1A, B MIM1
Ist1 IST1 MIM1, 2
Mos10/Chm5/Vps60 VPS60/CHMP5 MIM1
Snf7/Vps32 SNF7A, B, C/CHMP4A, B, C MIM2
Vps2/Chm2/Did4 VPS2A, B/CHMP2A, B MIM1
Vps20/Chm6 VPS20/CHMP6 MIM2
Vps24 VPS24CHMP3 Weak MIM1
Vps4-Vta1 Vps4 VPS4A, B/SKD1 AAA, MIT
Vta1 VTA1/LIP5 MIT
Bro1/ALIX Bro1/Vps31 ALIX/AIP1 Bro1, V, PRD

19
Although found highly conserved amongst all eucaryotes, the ESCRT machinery and the vps
proteins were first characterized in yeast for the essential role in ILV formation and MVB
biogenesis (Bryant and Stevens, 1998). Early electron microscopy elucidated MVB biogenesis
and structure with ILV’s without an associated function (Palade, 1955). Later on, the discovery
of MVB’s limiting membrane invagination with contemporaneous cargo receptor uptake, such
as the epidermal growth factor receptor (EGFR), into the formed vesicle, linked the MVB to
the endocytic pathway (Felder et al., 1990). Here, the interplay between all four ESCRT
complexes with the AAA-ATPase Vps4 leads to the detection and assembly of endocytic cargo
on the endosomal membrane destined for degradation in the vacuole (Saksena et al., 2007).
Selective cargo detection and incorporation into ILVs is initiated by the post-translational
modification of the target protein with ubiquitin (Ub) (Katzmann et al., 2001, Piper and Lehner,
2011). A single Ub is covalently attached to the cargo by the lysine residue 63 (K63), which
sufficiently targets the protein substrate for Ub-binding protein recognition. (Stringer and Piper,
2011). The modification leads to signal termination by segregating the still active receptor
domain from the cytoplasmic downstream signaling molecule. The interplay between the
attached Ub and ESCRT’s containing ubiquitin-binding domains (UBD) concludes receptor
inactivation (Katzmann et al., 2002). To accomplish ILV biogenesis, most Ub is removed from
the cargo by ESCRT proteins which assemble into a piece of complex multi-subunit machinery
with membrane deforming and constricting abilities, as depicted in Figure 4. Each ESCRT
complex is recruited in a cascade-like manner to consecutively fulfill a distinct function leading
to membrane invagination and luminal vesicle abscission (Piper and Katzmann, 2007).
Figure 4: Scheme of the ESCRT machinery assembly, adapted from (Teis et al., 2009).
Sequentially recruitment of the ESCRT machinery for incorporation of transmembrane proteins into ILVs. The
machinery consists of cargo recognition by ESCRT-0, recruiting ESCRT-I and ESCRT-II, and subsequent
assembly and oligomerization of ESCRT-III proteins before vesicle abscission and ESCRT disassembly by Vps4.

20
1.3.1 ESCRT-0 The primer of ESCRT machinery recruitment is the ESCRT-0 complex required to sort plasma
membrane proteins and receptors into the endocytic pathway for MVB biogenesis. The complex
is responsible for binding and clustering ubiquitinated cargo at the putative membrane locus for
ILV formation, further recruiting clathrin, ubiquitin ligases, and de-ubiquitinating enzymes to
the specific endosomal membrane (Meister et al., 2017).
ESCRT-0 complex development comprises a 1:1 heterodimer of Vps27 and Hse1 in yeast and
Hrs and STAM1, 2 in metazoa (Ren et al., 2007). The none transient complex exists in a
cytosolic persistent state, recruited and dislodged to and from the endosomal membrane upon
request (Prag et al., 2007). Vps27 and Hse1 contain an N-terminal ubiquitin-binding VHS
(Vps27, HRS, STAM) domain, followed by an FYVE (Fab1, YOTB, Vac1, EFA1) domain in
Vps27 (Ren and Hurley, 2010). The FYVE domain of Vps27 and the metazoa homolog Hrs1
bind phosphatidylinositol 3-phosphate (PI3P) to guide the ESCRT-0 complex to the target
endomembrane (Raiborg et al., 2001, Stahelin et al., 2002). Additional to the FYVE domain,
Vps27 contains two ubiquitin-interacting motifs (UIM) for binding up to five Ub moieties
attached to the target cargo and thus commencing ESCRT-0 governed Ub cargo clustering
(Swanson et al., 2003). Vps27 interacts with clathrin, which polymerizes into a flat bi-layered
membrane coat, limiting ESCRT-0 distribution on the local Ub cargo cluster (Raiborg et al.,
2006). The protein Hse1 (or STAM1) contains a VHS domain for membrane targeting and
cargo recognition and an SH3 (src homology-3) domain to recruit de-ubiquitinating enzymes
such as UBPY or Ub ligases like Rsp5 to the local protein cluster (Kato et al., 2000). The
constitutively assembled ESCRT-0 heterodimer shapes into an antiparallel coiled-coil structure
through an elongated, rigid core, mediated by SNARE structural like GAT domains (Ren et al.,
2009). The overall unstructured C-terminus of Vps27 holds a short PTAP motif for binding the
ESCRT-I subunit Vps23, thus enhancing ESCRT recruitment (Katzmann et al., 2003).
1.3.2 ESCRT-I The role of ESCRT-I, much like ESCRT-0, is to ensure clustering of ubiquitinated cargo and
generating ILV’s by recognizing target membranes, thus further bridging ESCRT-0 to the
upstream ESCRT machinery (Morita et al., 2011). The ESCRT-I subunits Vps23, Vps28,
Vps37, and Mvb12 form a rigid long, cytosolic persistent heterotetramer in a 1:1:1:1 ratio with
two contiguous but distinct core complexes (Curtiss et al., 2007).
The first sub-complex consists of Vsp23, Vps37, and Mvb12, which form a rod-shaped stalk
with an antiparallel coiled-coil structure, whereas Vps23, Vps28, and Mvb12 form a fanned cap

21
headpiece complex of three pairs of antiparallel helices (Kostelansky et al., 2007). Vps23
(human tumor susceptibility gene 101 or TSG101 in humans) contains one N-terminal
ubiquitin E2 Variant (UEV) domain for binding ubiquitinated cargo like the UIM of Vps27 and
a PTAP motif for bilateral binding and connecting ESCRT-0 to ESCRT-I (Chu et al., 2006).
Targeting ESCRT-I to the midbody connecting the two daughter cells during cytokinesis,
Vps23 harbors a GPPX3Y motif after the UEV domain spaced by a pro-rich linker sequence
(Carlton and Martin-Serrano, 2007). The ESCRT-I subunit Vps37 contains an N-terminal basic
helix mediating membrane binding of the complex, and the subunit Mvb12 has an additional
C-terminal UBD for Ub cargo binding (Oestreich et al., 2007). Vps28 core region linked to a
C-terminal four-helix bundle domain (CTD) is responsible for ESCRT-I co-assembly with
ESCRT-II in a 1:1 super complex at the ESCRT-0 locus (Gill et al., 2007).
1.3.3 ESCRT-II ESCRT-II functions as an essential partner of ESCRT-I in MVB biogenesis and bud formation
since overexpression of ESCRT-II bypasses ESCRT-I presence during MCB cargo sorting
(Babst et al., 2002b). Like the ESCRT-0 and ESCRT-I complex, ESCRT-II is constitutively
assembled to form a stable hetero-oligomeric complex in the cytoplasm. Partly involved in Ub
cargo binding, the pivotal role of ESCRT-II is the bridging of ESCRT-I to ESCRT-III (Wang
and Hong, 2006). Thus, the ESCRT-I and ESCRT-II super complex indirectly promotes
membrane budding by recruiting ESCRT-III to induce local membrane deformation. ESCRT-
II modulates the ordered assembly of ESCRT-III into a ring-like polymer with a defined
diameter to mediate cargo capture and vesicle formation (Henne et al., 2012). The Y-shaped
ESCRT-II complex consists of a 1:2:1 heterotetramer of Vps22 (ELL-associated protein of 30
kDa, or EAP30 in metazoa), Vps36 (EAP45), and two units of Vps25 (EAP20). Vps22 and
Vps36 resemble the core complex of ESCRT-II, where each subunit consists of a tandem
winged-helix motif to stabilize the sub complex and is flexibly associated with Vps25 (Teo et
al., 2004). Vps22 promotes membrane targeting by a basic helix motif at the N-terminus of the
protein (Im and Hurley, 2008). The N-terminus of Vps36 contains a variant pleckstrin
homology (PH) domain named “GLUE” (GRAM-like ubiquitin binding in EAP45) domain that
mediates binding preferred to PI3P and Vps28 of ESCRT-I (Slagsvold et al., 2005). The GLUE
domain harbors two Np14 zinc finger (NZF) domains by which the NZF1 acts as the locus for
the Vps28-CTD of ESCRT-I and NZF2 interacts with a single Ub moiety of clustered cargo
(Alam et al., 2004). Both Vps25 subunits are essential for MVB sorting by interacting with
Vps20 of ESCRT-III and thereby promoting ESCRT-III assembly (Hierro et al., 2004).

22
1.3.4 ESCRT-III The ESCRT-III complex resembles the heart of the ESCRT system as the central membrane
scission machinery. Only ESCRT-III and Vps4 homologs are conserved in all life domains for
catalyzing cell division (Lindas et al., 2008). The complex is considered to be the most ancient
remodeling complex found in archaea and lokiarchaeota, a phylum seen as the missing link
between archaea and eukaryotes, to possibly participate in prokaryotic to eukaryotic transition
by the inside out model (Baum and Baum, 2014, Spang et al., 2015).
The ESCRT-III complex in budding yeast consists of Vps20, Snf7, Vps24, Vps2 and Did2, Ist1,
Vps60 (Mos10), and Chm7, the latter four considered as ESCRT-III associated or ESCRT-III-
like proteins in previous works (Babst et al., 2002a). The human genome encodes twelve
ESCRT-III proteins corresponding to the eight yeast homologs comprising several isoforms
named CHMPs (chromatin-modifying protein) (Bertin et al., 2020). All ESCRT-III subunits
contain diverse sequences, unified by an identical domain organization with an asymmetrical
charge distribution (Lata et al., 2009).
ESCRT-III proteins commonly harbor six α-helices that reside within the positively charged N-
terminal region comprising α1 – α2 followed by an acidic C-terminal, electronegatively charged
domain of α3 – α6 (Schoneberg et al., 2017) (Figure 5).
Figure 5: The ESCRT-III proteins in yeast, redrawn from (Schoneberg et al., 2017).
All eight ESCRT-III complex-associated proteins are schemed with the secondary structure, motifs, and charge.
The length of the black line describes the number of amino acids per protein, thus the total protein size. Secondary
α-helices are colored as follows: α1 in purple, α2 in blue, α3 in cyan, α4 in green, αA and αB in bright green, α5
in orange, and α6 in red. The C-terminal MIM1 and MIM2 domains are highlighted in black and grey boxes.

23
All ESCRT-III subunits are related 200 to 240 amino acid large proteins besides Ist1 that
contains an elongated N-terminal domain and Chm7, which appears to be twice as large as the
other members with an ESCRT-III domain in the C-terminal half (Bauer et al., 2015, Horii et
al., 2006). The C-terminus of all ESCRT-III proteins contains a MIT (microtubule-interacting
and transport)-interacting motif (MIM) for mediating successional Vps4 binding. Did2, Vps2,
and Vps24 carry a MIM1 domain at the C-terminus, whereas Snf7, Mos10, and Vps60 contain
a MIM2 domain. The enlarged ESCRT-III subunits Ist1 and Chm7 contain both motifs (Kieffer
et al., 2008, Stuchell-Brereton et al., 2007). MIM1 contains a sequence-conserved amphipathic
helix (D/E)xxLxxRLxxL(K/R) motif, critical for Vps4 recruitment by Vps24, and MIM2 is a
proline-rich sequence for selective ESCRT-III recognition by the MIT domains of Vps4 (Obita
et al., 2007, Shestakova et al., 2010). Vps20 carries a myristoylation site at the N-terminus
important for targeting the protein to the membrane (Yorikawa et al., 2005). The positively
charged N-terminus of Vps2 and Vps24 further promotes the association of ESCRT-III to the
membrane (Scott et al., 2005). The lack of a PI3P binding or Ub-cargo recognition domain
leads to the ability of ESCRT-III to perform remodel function and catalyze membrane fission
on all cellular membranes like the PM, endosomal or nuclear envelope (Schoneberg et al.,
2017). The ESCRT-III subunit Snf7 carries an N-terminal ANCHR (N-terminus containing
hydrophobic residues motif) domain acting as a high-affinity anchor for MVB sorting
(Buchkovich et al., 2013). Snf7 also contains a Bro1 binding site at the C-terminus for ESCRT-
III disassembly and promoting de-ubiquitination of cargo before entering the ILV by recruiting
the ubiquitin hydrolase Doa4 (Richter et al., 2007, Wemmer et al., 2011). All considered core
complex subunits of ESCRT-III consisting of Vps20, Snf7, Vps24, and Vps2 contain an N-
terminal lipid interacting domain to allow for the assembly and oligomerization on the lipid
surface for membrane budding and scission.
For the assembly of the ESCRT-III complex, many ESCRT-III subunits interconvert between
two conformations, namely the closed, monomeric conformation in the cytoplasm and an open
conformation for polymerization at the membrane (McCullough et al., 2015). Crystal structures
of Vps24 revealed an asymmetric, antiparallel, N-terminal region comprising the α1 and α2
helices, which form a 70 Å rigid hairpin followed by two short helices (Lata et al., 2009). The
crystal structure of the ESCRT-III subunit IST1 reveals the closed state to be organized by an
N-terminal helical hairpin followed by α3 and α4 linker connected to the regulatory α5 domain
(McCullough et al., 2018) (Figure 6). The entire N-terminal conserved region of the α1 - α4
core functions as the structural scaffold of ESCRT-III filament biogenesis, whereas the C-
terminal α5 - α6 part governs autoinhibitory and regulatory roles (Shim et al., 2007).

24
Figure 6: ESCRT-III open and closed conformational structure, adapted from (McCullough et al., 2018).
The secondary structure of IST1 and CHMP1B (Did2 in yeast) consists of five conserved helices following the
color scheme in Figure 5. The crystal structure reveals (from left to right) the open IST1and closed CHMP1B
conformation and the superposition of both conformations in a light and dark shade.
The closed conformation defines a folded back α5 helix against the closed end of the α1 - α2
helical hairpin to maintain the protein in a soluble, inactive state in the cytoplasm. The Vps24
protein crystallizes as an antiparallel dimer by which the α5 helix mediates intermolecular
contact between neighboring monomers hardening the regulatory character of the C-terminal
domain of ESCRT-III members (Bajorek et al., 2009). Snf7 and CHMP1B (Did2 in yeast)
structurally rearrange into a continuous elongated α2 – α3 helix after converting into the open
conformation (McMillan et al., 2016). CHMP1B and IST1 form co-polymers of two distinct
strands with an inner strand of open CHMP1B and an outer strand of IST1 in a close
conformation tightly associated in a 1:1 ratio (Nguyen et al., 2020).
Elucidating the structural composition and ambivalent conformation of ESCRT-III subunits
allows for predictive ESCRT-III assembly and putative functions within the ILV formation and
abscission. Each subunit is present as a cytosolic monomer that transiently assembles on
membranes into the active ESCRT-III complex, unlike the heteropolymers ESCRT-0, -I, and -
II that exists in persistent complexes (Saksena et al., 2009). Nucleation of ESCRT-III requires
the ESCRT-II subunit Vps25, where a single Vps25 arm at the Y-shaped structure is sufficient
to promote ESCRT-III assembly, although the complex lacks functional formation capability
(Teis et al., 2010). Functional ESCRT-III assembly is thereby initiated by the interaction of the
N-terminal half of two Vps20 to ESCRT-II via the WH2 domain of two Vps25 (Im et al., 2009).
Tightly associated with the membrane, Vps20 turns into the nucleator of Snf7 oligomerization,
which converts from the inactive, closed conformation to the activated, open state to induce
filament formation. Vps24 caps Snf7 filamentation, which recruits Vps2 and eventually Vps4

25
to recycle the complex (Teis et al., 2008). In vitro experiments revealed that Snf7, Vps24, and
Vps2 are sufficient to form polymers like short helical and non-helical filaments, rings, spirals,
and tube structures, some with the capacity to deform membranes (Hanson et al., 2008). The
cited conventional pathway of sequential ESCRT-III assembly was recently refined to a
dynamic self-assembly pathway of continuous ESCRT-III/Vps4 exchange catalyzed by ATP
hydrolysis, further including the ESCRT-III-like proteins Did2 and Ist1 (Pfitzner et al., 2020)
(Figure 7). While Vps20 induced filament formation by oligomerization of Snf7 leads to spiral
structures with buckle properties regarding growth and elasticity, no tubular protrusions could
be observed (Chiaruttini et al., 2015). Buckling transition from a flat spiral to a cylindrical
structure is promoted by a secondary filament or second layer of recruited Vps2-Vps24 to
rigidify the polymer and form a helical tube (Mierzwa et al., 2017, Moser von Filseck et al.,
2020). The second layer reduces spiral-induced stress in the flat structure by twisting the
filaments, further promoted by Vps24 to Did2 exchange forming conical spirals (Harker-
Kirschneck et al., 2019). For the third layer, Vps2 exchanges to Ist1 to form the Did2-Ist1
fission complex able to reduce membrane tube constricted to 4.8 nm which is in the range
required for membrane fission like in the dynamin induced fission of CCV by a super-
constricted complex of 3.7 nm (Sundborger et al., 2014). Dynamic ESCRT-III subunit assembly
and disassembly requires Vps4 ATPase activity and is ATP-driven since subunit-turnover was
found to be Vps4/ATP induced (Pfitzner et al., 2020). ESCRT-III filament depolymerization
by Vps4/ATP occurs in the order Vps2-Vps24 to Snf7, Vps2-Did2 and finally removing Did2-
Ist, forming a unidirectional stepwise pathway in vitro (McCullough and Sundquist, 2020).
Figure 7: Membrane fission by ESCRT-III exchange, adapted from (McCullough and Sundquist, 2020).
Schematic stepwise filament formation by Snf7, nucleated by the ESCRT-0 to Vps20 cascade. The dynamic
exchange of ESCRT-III subunits Snf7, Vps2-Vps24, and Did2-Ist1 for progressive membrane invagination and
fission. The endosomal membrane is shaded in grey, and the lighter grey shading represents the endosomal lumen,
while the cytoplasm is depicted in yellow.

26
1.3.5 Vps4 The AAA (ATPase associated with a variety of cellular activities) ATPase Vps4 mediates
ESCRT-III re-assembly and recycling by being the thermodynamic force of the late ESCRT
machinery (Babst et al., 1998). The enzyme submits the dynamic exchange of ESCRT-III
subunits in and out of the filaments by hydrolyzing ATP for harnessing energy (Monroe and
Hill, 2016). The structural form of Vps4 resembles a hexameric ring capable of unfolding
individual ESCRT-III subunits by guiding these through the central pore in an ATP-dependent
manner (Monroe et al., 2017, Yang et al., 2015). Interaction of Vps4 is mediated by the N-
terminal microtubule interacting and trafficking motif (MIT) domain that interacts with the C-
terminal MIM domains of ESCRT-III proteins (Stuchell-Brereton et al., 2007). Coordinated
interaction with the MIT domain of Vps4 within the stepwise assembly and disassembly of
ESCRT-III filaments biogenesis is crucial for ILV formation (Adell et al., 2014). After the N-
terminal domain, the core ATPase mediates the hexamerization and ATP hydrolysis while the
C-terminal β-domain of Vps4 binds the ATPase activator LIP5 (Vta1) (Han et al., 2017).
LIP5/Vta1 functions as a co-factor of Vps4 by stabilizing the hexameric ring structure of Vps4
by bridging adjacent ESCRT-III subunits and thus further promoting ESCRT-III lattice
association (Xiao et al., 2008). Recruitment of Vps4 is promoted by contact between the Vps4-
MIT domain with the Vps2 MIM1 domain, thus leading to Vps4 oligomerization to an active
ATPase (Azmi et al., 2008). After the Vps4/ATP induced stepwise depolymerization cascade
of individual layers at the fission locus, each ESCRT-III subunit converts to the inactive,
autoinhibited state, and Vps4 resets to the mobile, monomeric state (Su et al., 2017).
1.4 ESCRT functions
The principal biochemical function of ESCRTs is to induce membrane bending and
constrictions to narrow down membrane necks for scission events (Hurley and Hanson, 2010).
Elucidating profound functions of the ESCRT machinery led to the incorporation of the ESCRT
family into the endosomal system, hence the primary involvement of the ESCRT machinery in
ILV formation during MVB biogenesis (Wideman et al., 2014). Therefore, the ESCRT system
could be directly linked to moderate endosomal functions for selectively sorting ubiquitinated
cargo proteins in vesicles for vacuolar targeting and degradation (Katzmann et al., 2001).
Besides the pivotal role in MVB biogenesis, consequent studies revealed a variety of non-
endosomal functions mediated by the ESCRT machinery, broadening the role of ESCRTs in
cellular processes (Figure 8). Hence, “ESCRTs are everywhere” (Hurley, 2015).

27
Figure 8: Summary of ESCRT-III mediated cellular processes, adapted from (McCullough et al., 2018).
Schematical illustration of known ESCRT-III mediated functions in membrane remodeling, ESCRT spiral
filaments depicted as green helices. ESCRT dependent cellular functions are labeled in bold, cellular organelles in
regular font, and compartments specific adapter proteins in red.
1.4.1 Cytokinesis An example of a fundamental cellular process involving the deformation of membranes to form
tubular structures is cytokinesis. Cytokinesis describes the progress of cell division in which a
daughter cell emerges connected by an intracellular bridge with a midbody ring at the center
(Guizetti et al., 2011). Cytokinesis progression factors recruited to the midbody arms alongside
the midbody ring govern final abscission, whereas failure in abscission function promotes
diseases like tumorigenesis and chromosomal instability (Lens and Medema, 2019). One of the
most ancient function of ESCRTs was to catalyze membrane cleavage in cell division found in
archaea involving ESCRT-III and Vps4 homologs (Samson et al., 2008).
The centrosomal protein CEP55 of 55 kDa functions as the compartment-specific targeting
factor accumulated at the midbody to recruit ESCRT-I TSG101 (VPS23) and associated protein
ALIX to the midbody via a GPPx3Y motif (Lee et al., 2008). Both proteins nucleate for
ESCRT-III assembly at the midbody ring in which ALIX bridges to CHMP4B (Snf7 in yeast)
via the Bro1 domain and TSG101 engages ESCRT-II to recruit CHMP4B-CHMP6 (Vps20 in
yeast) (Goliand et al., 2014, Tang et al., 2016). All MVB biogenesis essential ESCRT-III
subunits are also present in cytokinesis, bound to the membrane via the microtubule interacting

28
and trafficking domain containing 1 (MITD1) protein, to induce filament polymerization
(Hadders et al., 2012, Lee et al., 2012). These cell-cortex-associated helical filaments on both
sides of the midbody ring are continuously remodeled by VPS4 (Schoneberg et al., 2018). VPS4
recruits CHMP1B, which then engages the AAA-ATPase spastin to induce microtubule
severing, leading to the physical separation of the daughter cells and thus concluding cell
abscission (Yang et al., 2008).
1.4.2 Virus budding Successful viral infection involves associating the virus to the PM of the host cell, cellular
uptake, and uncoating the viral genome to initiate viral gene expression (Votteler and
Sundquist, 2013). Various membrane compartments are hijacked to mediate viral maturation
inside the host cell, including the associated ESCRT machinery (Scourfield and Martin-
Serrano, 2017). Entering the host cell by fusion with the cells PM or taken up by receptor-
mediated endocytosis without damaging the integrity of the host cell membrane ensures
translocation of the viral genome into the cytoplasm (Tuthill et al., 2006). Gaining access to the
cytoplasm and associating with the ER is crucial for viruses exploited to the endosomal system
not to be recycled back to the PM, while ESCRT subunits like TSG101 are considered to be
necessary for correct endosomal trafficking of viral particles (Kumar et al., 2018, Lozach et al.,
2011). Each virus family can take different cellular membranes and thus separate compartments
hostage to generate new viral replication origins for a new viral life cycle. The ESCRT
machinery is further involved in forming compartments for viral replication at the nucleus-ER
region, where the proviral DNA is replicated and egress into the cytosol (Tabata et al., 2016).
Pathogenic viruses like Ebola, hepatitis C and the human immunodeficiency virus-1 (HIV-1)
preferable take control of the host’s ESCRT machinery to release infectious material from the
infected cell by budding at the PM to remove matured enveloped viruses (Miller and Krijnse-
Locker, 2008). In the case of HIV-1 viral budding, the UEV domain of TSG101 interacts with
a P(T/S)AP motif sitting in the p6 region of ubiquitinated viral Gag protein HIV-1, thus directly
binding to ESCRT-I (Garrus et al., 2001). Gag contains a second p6 motif YPX(n)L for binding
ALIX via the V domain, required for ALIX-dependent viral budding via CHMP4B nucleation
(Strack et al., 2003). Membrane cleavage during viral budding is mediated by the ESCRT-III
and Vps4 machinery recruited to the budding site prior to virion release (Baumgartel et al.,
2011). The ESCRT-III subunits CHMP2 and CHMP4 extrude helical tubes from the PM,
whereas CHMP2 and CHMP1 mediate VPS4 recruitment to catalyze membrane scission and
enveloped virus release (Carlson and Hurley, 2012).

29
1.4.3 The nuclear envelope (NE) The nuclear envelope resembles a specialized double membrane around the nucleus for
separating the genome from the cytoplasm, connected via nuclear core complexes (NPCs)
regulating passage in and out of the nucleus (Robijns et al., 2018). The ESCRT-III machinery
coordinates the ordered sealing of the nuclear envelope, which breaks down during mitosis to
facilitate chromosome capture by the mitotic spindle. Assembly and association of CHMP2A,
CHMP3B, CHMP4B, and VPS4 are required to mediate the re-sealing process (Olmos et al.,
2015). NPC quality surveillance and NE sealing by ESCRT-III involve a distinct recruiting
pathway, not mediated by the canonical ESCRT bridging factors. Recruitment of ESCRT-III
subunits was linked directly to the nucleus-specific targeting factor CHMP7 (Chm7 in yeast)
(Vietri et al., 2015). Chm7 contains an N-terminal ESCRT-II-like domain characterized by the
WH domain similar to EAP20 and a C-terminal ESCRT-III-like domain similar to CHMP6
(Vps20 in yeast) (Bauer et al., 2015). At the nuclear envelope, Chm7 works as an assembly
factor with the nuclear envelope LEM domain 2 (LEMD2) protein (Heh1 in yeast) to maintain
NPC assembly (Webster et al., 2016). Interaction between CHMP7 and LEMD2 ensures
nuclear envelope integrity and inhibits unwanted polymerization of ESCRT-III at the NE (Gu
et al., 2017). However, executing membrane fission to seal the nuclear envelope after spastin-
induced microtubule severing requires the regulated assembly of ESCRT-III and VPS4
distributed and coordinated by additional regulator factors (Ventimiglia et al., 2018).
1.4.4 Autophagy Autophagy is the process of degrading, not endocytosed, intracellular material by the lysosome
mediated by the autophagosome, a double-membrane structure formed by the ER, PM, or
mitochondria (Takahashi et al., 2018). Microautophagy describes the degradation of
intracellular debris by the lysosome, whereas macroautophagy is utilized by the cell as a defense
mechanism against intracellular pathogens or degrading damaged organelles (Sahu et al., 2011).
In macroautophagy, cytosolic portions are engulfed and fused with the lysosome to adapt to
starvation and remove toxic protein aggregates (Nakatogawa et al., 2009). Coordinated
interaction between the MVB pathway and autophagy-mediated by ESCRTs ensures survival
during starvation by recycling amino acids from selective degradation of proteins (Muller et
al., 2015). Autophagosome biogenesis involves ESCRT-III and VPS4, which mediate double-
membrane coating and sealing and govern the autophagosome with the lysosome (Zhen et al.,
2020). Atg17, which controls autophagy initiation, recruits ESCRT-III subunits and VPS4 to
the nascent autophagosome to catalyze autophagosome closure (Zhou et al., 2019).

30
1.4.5 Exosomes & Microvesicles Exosomal compartments are small extracellular vesicles derived from ILVs containing
proteins, DNA, and RNA to grant intercellular communication (Thery, 2011). Intracellular
traffic of protein leads to degradation in the lysosome/vacuole, recycling to the cytoplasmic
protein pool, or secreted release in exosomes centrally routed by ILV biogenesis (Raiborg and
Stenmark, 2009). The interaction between ALIX initiates the formation of exosomes via the V
domain and the dimeric adaptor protein syntenin-1. Syntenin-triggered clustering of the
proteoglycan syndecan bridges the ESCRT machinery engagement to the syndecan-syntenin-
Alix complex for exosome biogenesis (Baietti et al., 2012).
ESCRT-III induced deforming of the PM also shapes extracellular vesicles named
microvesicles that play a role in intercellular signaling and removal of damaged PM (Matusek
et al., 2014). The driving force of microvesicle formation is the arrestin domain-containing
protein 1 (ARRDC1), which requires TSG101 and VPS4 ATPase to induce microvesicle release
(Nabhan et al., 2012).
1.4.6 Other functions The continuously extending field of ESCRT functions includes neuronal pruning in which
unnecessary neuronal branches are selectively removed by ESCRT-I, ESCRT-III, and VPS4
(Loncle et al., 2015). Further implications are found in linking ESCRT indirectly to dendritic
arborization neuron pruning mediated by RAB5 in Drosophila (Zhang et al., 2014). Other
studies discovered rapid recruitment of CHMP4B due to plasma membrane lesions while
closing the wounded membrane also included CHMP1A, CHMP2A, CHMP2B, CHMP3, and
VPS4B (Jimenez et al., 2014, Scheffer et al., 2014). ALIX induces ESCRT-III association to
the PM recruited to the PM lesion site by binding to TSG101 in a Ca2+ dependent manner (Sun
et al., 2015).
Lysosomes, essential cellular compartments, are harboring an acidic, proton-rich environment
suitable for acidic hydrolysis to degrade proteins, receptors, macromolecules, and pathogens
but hazardous for the cell in the event of lysosomal membrane rupture (Papadopoulos and
Meyer, 2017). The recruitment of TSG101 and ALIX is crucial for ESCRT-III induced
membrane repair at the damaged lysosomal locus (Radulovic et al., 2018). The sheer endless
pantheon of ESCRT functions further involves endosomal fission events, cilia formation,
endosomal membrane repair, peroxisome biogenesis, neurodegenerative diseases, and cancer
(Allison et al., 2013, Jung et al., 2020, Li et al., 1998, Mast et al., 2018, Skibinski et al., 2005,
Skowyra et al., 2018).

31
1.5 Aim of this thesis
This thesis aimed to investigate new endosomal functions of ESCRT-III subunits, mainly
focusing on Mos10 (Vps60). The recently extended mechanism of ESCRT-III assembly by
dynamic exchange of ESCRT-III subunits mediated by Vps4 led to the incorporation of the
former ESCRT-III associated proteins Did2 and Ist1 into the ESCRT-III core complex family.
Chm7 was identified to perform on the nuclear membrane exerting specialized functions in
nuclear membrane repair and nuclear envelope reformation (Olmos et al., 2016). Still,
endosomal or non-endosomal functions of Vps60/CHMP5 are waiting to be elucidated since
the protein still “remains poorly characterized” (Remec Pavlin and Hurley, 2020). Vps60 was
found to be not essential for Vps2 recruitment to the endosome but was suggested to be required
for MVB sorting since vps60Δ shows a sorting defect (Kranz et al., 2001, Losko et al., 2001).
A putative link might be the stimulation of Vps4 activity in later stages of ESCRT-III
polymerization by interacting with the MIT motifs of Vta1, acting as an adaptor to facilitate
ESCRT-III subunits Vps20 and Mos10 to Vta1 interaction (Shiflett et al., 2004, Yang et al.,
2012, Yeo et al., 2003).
I, therefore, searched for new interacting partners of Mos10 to link the ESCRT-III subunit to a
specific compartment or pathway for elucidating the unknown potential of the protein. Also,
functionality within the ESCRT-III complex was investigated to extend the established
complex to additional endosomal functions.

32
2 MATERIAL AND METHODS
2.1 Strains and media
2.1.1 Bacteria strains
Table 2: Escherichia coli (E. coli) strains.
Strain Genotype Reference
BL21(DE3) F– ompT gal dcm lon hsdSB(rB–mB
–) λ(DE3 [lacI lacUV5-T7p07 ind1 sam7 nin5]) [malB+]K-12(λS)
(Wood, 1966)
DH5αF’ F’(Φ 80 (ΔlacZ) M15) Δ(lacZYA-argF) U169 recA1 endA1 hsdR17 rk-mk+supE44 thi-1 gyrA relA1
Gibco BRL, Gaithersburg MD, USA (Woodcock et al., 1989)
XL1-Blue F’::Tn10 proA+B+ laclq Δ(lacZ)M15/recA1 end1 gyrA96 (Nalr) thi hsdR17 (rk-mk+) supE44 relA1 lac
(Bullock, 1987)
RKB2311 BL21(DE3) + pRK1854 R. Kölling, Hohenheim
2.1.2 E. coli growth conditions E. coli cells were grown in LB-media (lysogeny broth) consisting of 1 % (w/v) tryptone, 0.5 %
yeast extract, and 0.5 % NaCl at 37 °C and shaking at 100 rpm. Growth plates contained an
additional 2 % agar. For selective pressure, 100 µg/ml ampicillin (or kanamycin) was added to
the autoclaved media to ensure the growth of cells that harbor and maintain the plasmids for
protein overexpression containing the ampicillin (or kanamycin) resistance gene.
2.1.3 Yeast strains
Table 3: Saccharomyces cerevisiae (S. cerevisiae) strains.
Strain Alias Genotype Reference
RKY827 JD53 MATα ura3-52 his3-∆200 leu2-3, 112 trp1-∆63 lys2-801 ssd1-d2
J. Dohmen., Köln
RKY1452 RKY1558 Mos10-13myc::kan R. Kölling, Hohenheim
RKY1558 (Wildtype)
JD52 MATa ura3-52 his3-∆200 leu2-3, 112 trp1-∆63 lys2-801 ssd1-d2
J. Dohmen., Köln
RKY1832 RKY1558 Mos10-ProteinA::kan R. Kölling, Hohenheim
RKY1882 ZLY2-1A MATa ura3 his3 leu2 trp1 lys2 ypt6-2::URA3
(Luo and Gallwitz, 2003)
RKY1920 RKY1558 ∆vps21::LEU2 A. Pawelec, Düsseldorf
RKY1922 RKY1558 ∆bro1::kan A. Pawelec, Düsseldorf
RKY2100 RKY1558 ∆rim20::kan R. Kölling, Hohenheim
RKY2788 RKY1558 ∆did2 (Brune et al., 2019)

33
Strain Alias Genotype Reference
RKY2789 RKY1558 ∆ist1 (Brune et al., 2019)
RKY2790 RKY1558 ∆snf7 (Brune et al., 2019)
RKY2830 RKY1558 ∆vps24 (Brune et al., 2019)
RKY2841 RKY1558 ∆vps2 (Brune et al., 2019)
RKY2844 RKY1558 ∆chm7 ∆did2 ∆ist1 ∆mos10 ∆snf7 ∆vps2 ∆vps20 ∆vps24
(Brune et al., 2019)
RKY2889 RKY1558 MOS10-6His::His3 R. Kölling, Hohenheim
RKY2892 RKY1558 ∆mos10 (Brune et al., 2019)
RKY2893 RKY1558 ∆vps20 (Brune et al., 2019)
RKY2998 RKY1558 ∆arg4 L. Mücke, Hohenheim
RKY2999 RKY2889 ∆arg4 L. Mücke, Hohenheim
RKY3136 RKY1558 IST2-sfGFP::kan R. Kölling, Hohenheim
RKY3139 RKY1558 TCB1-sfGFP::kan R. Kölling, Hohenheim
Table 4: Constructed S. cerevisiae strains according to (Longtine et al., 1998).
Strain Alias Genotype Template Primer
RKY2923 RKY1558 DCP2-sfGFP::kan pRK1693 3199+3200
RKY2924 RKY1558 NMD2-sfGFP::kan pRK1693 3203+3204
RKY2925 RKY1558 PUB1-sfGFP::kan pRK1693 3191+3192
RKY2926 RKY2844 NMD2-sfGFP::kan pRK1693 3203+3204
RKY2935 RKY2844 DCP2-sfGFP::kan pRK1693 3199+3200
RKY3110 RKY2844 PUB1-sfGFP::kan pRK1693 3191+3192
RKY3111 RKY2892 DCP2-sfGFP::kan pRK1693 3199+3200
RKY3112 RKY2892 NMD2-sfGFP::kan pRK1693 3203+3204
RKY3113 RKY2892 PUB1-sfGFP::kan pRK1693 3191+3192
RKY3114 RKY2889 ALD5-13myc::kan pFA6a-13myc-kanMX6 3504+3505
RKY3115 RKY2889 EFT1-13myc::kan pFA6a-13myc-kanMX6 3508+3509
RKY3116 RKY2889 GET3-13myc::kan pFA6a-13myc-kanMX6 3451+3452
RKY3117 RKY2889 PRE6-13myc::kan pFA6a-13myc-kanMX6 3512+3513
RKY3118 RKY2889 SSC1-13myc::kan pFA6a-13myc-kanMX6 3516+3517
RKY3119 RKY2889 VPS68-13myc::kan pFA6a-13myc-kanMX6 3520+3521
RKY3152 RKY1558 EXO84-GFP::kan pFA6a-GFP-kanMX6 3641+3642
RKY3153 RKY1558 LEU1-GFP::kan pFA6a-GFP-kanMX6 3645+3646
RKY3154 RKY1558 OAC1-GFP::kan pFA6a-GFP-kanMX6 3649+3650
RKY3155 RKY1558 TPS1-GFP::kan pFA6a-GFP-kanMX6 3653+3654
RKY3156 RKY1558 DNF2-GFP::kan pFA6a-GFP-kanMX6 3657+3658
RKY3157 RKY1558 YGR130c-GFP::kan pFA6a-GFP-kanMX6 3661+3662
RKY3158 RKY1558 YCK2-GFP::kan pFA6a-GFP-kanMX6 3665+3666
RKY3159 RKY1558 PAN1-GFP::kan pFA6a-GFP-kanMX6 3669+3670

34
Strain Alias Genotype Template Primer
RKY3160 RKY1558 TOM71-GFP::kan pFA6a-GFP-kanMX6 3673+3674
RKY3161 RKY1558 COG8-GFP::kan pFA6a-GFP-kanMX6 3677+3678
RKY3162 RKY1558 MSS1-GFP::kan pFA6a-GFP-kanMX6 3681+3682
RKY3163 RKY1558 PTR2-GFP::kan pFA6a-GFP-kanMX6 3685+3686
RKY3164 RKY1558 MNN5-GFP::kan pFA6a-GFP-kanMX6 3689+3690
RKY3165 RKY1558 ALD5-GFP::kan pFA6a-GFP-kanMX6 3504+3505
RKY3166 RKY1558 PRE6-GFP::kan pFA6a-GFP-kanMX6 3512+3513
RKY3167 RKY1558 VPS68-GFP::kan pFA6a-GFP-kanMX6 3520+3521
RKY3168 RKY1558 EXO84-sfGFP::kan pRK1693 3641+3642
RKY3169 RKY1558 LEU1-sfGFP::kan pRK1693 3645+3646
RKY3170 RKY1558 OAC1-sfGFP::kan pRK1693 3649+3650
RKY3171 RKY1558 TPS1-sfGFP::kan pRK1693 3653+3654
RKY3172 RKY1558 DNF2-sfGFP::kan pRK1693 3657+3658
RKY3173 RKY1558 YGR130c-sfGFP::kan pRK1693 3661+3662
RKY3174 RKY1558 YCK2-sfGFP::kan pRK1693 3665+3666
RKY3175 RKY1558 PAN1-sfGFP::kan pRK1693 3669+3670
RKY3176 RKY1558 TOM71-sfGFP::kan pRK1693 3673+3674
RKY3177 RKY1558 COG8-sfGFP::kan pRK1693 3677+3678
RKY3178 RKY1558 MSS1-sfGFP::kan pRK1693 3681+3682
RKY3179 RKY1558 PTR2-sfGFP::kan pRK1693 3685+3686
RKY3180 RKY1558 MNN5-sfGFP::kan pRK1693 3689+3690
RKY3181 RKY1558 ALD5-sfGFP::kan pRK1693 3504+3505
RKY3182 RKY1558 PRE6-sfGFP::kan pRK1693 3512+3513
RKY3183 RKY1558 VPS68-sfGFP::kan pRK1693 3520+3521
RKY3184 RKY1558 EXO84-13myc::kan pFA6a-13myc-kanMX6 3641+3642
RKY3185 RKY1558 LEU1-13myc::kan pFA6a-13myc-kanMX6 3645+3646
RKY3186 RKY1558 OAC1-13myc::kan pFA6a-13myc-kanMX6 3649+3650
RKY3187 RKY1558 TPS1-13myc::kan pFA6a-13myc-kanMX6 3653+3654
RKY3188 RKY1558 DNF2-13myc::kan pFA6a-13myc-kanMX6 3657+3658
RKY3189 RKY1558 YGR130c-13myc::kan pFA6a-13myc-kanMX6 3661+3662
RKY3190 RKY1558 YCK2-13myc::kan pFA6a-13myc-kanMX6 3665+3666
RKY3191 RKY1558 PAN1-13myc::kan pFA6a-13myc-kanMX6 3669+3670
RKY3192 RKY1558 TOM71-13myc::kan pFA6a-13myc-kanMX6 3673+3674
RKY3193 RKY1558 COG8-13myc::kan pFA6a-13myc-kanMX6 3677+3678
RKY3194 RKY1558 MSS1-13myc::kan pFA6a-13myc-kanMX6 3681+3682
RKY3195 RKY1558 PTR2-13myc::kan pFA6a-13myc-kanMX6 3685+3686
RKY3196 RKY1558 MNN5-13myc::kan pFA6a-13myc-kanMX6 3689+3690
RKY3197 RKY1558 ALD5-13myc::kan pFA6a-13myc-kanMX6 3504+3505
RKY3198 RKY1558 PRE6-13myc::kan pFA6a-13myc-kanMX6 3512+3513

35
Strain Alias Genotype Template Primer
RKY3199 RKY1558 VPS68-13myc::kan pFA6a-13myc-kanMX6 3520+3521
RKY3200 RKY2802 MOS10-6His::kan pRK1760 323+324
RKY3201 RKY2788 MOS10-6His::kan pRK1760 323+324
RKY3202 RKY2789 MOS10-6His::kan pRK1760 323+324
RKY3203 RKY2790 MOS10-6His::kan pRK1760 323+324
RKY3204 RKY2841 MOS10-6His::kan pRK1760 323+324
RKY3205 RKY2893 MOS10-6His::kan pRK1760 323+324
RKY3206 RKY2830 MOS10-6His::kan pRK1760 323+324
RKY3209 RKY1558 MOS10-3HA::kan pFA6a-3HA-kanMX6 323+324
RKY3210 RKY2998 MOS10-sfGFP::kan pRK1693 323+324
RKY3211 RKY2998 DID2-sfGFP::kan pRK1693 1175+574
RKY3212 RKY2998 VPS2-sfGFP::kan pRK1693 2714+582
RKY3213 RKY1558 CHM7-sfGFP::kan pRK1693 1439+1284
RKY3214 RKY1558 DID2-sfGFP::kan pRK1693 1175+574
RKY3215 RKY1558 IST1-sfGFP::kan pRK1693 2719+2720
RKY3216 RKY1558 MOS10-sfGFP::kan pRK1693 323+324
RKY3217 RKY1558 SNF7-sfGFP::kan pRK1693 332+333
RKY3218 RKY1558 VPS2-sfGFP::kan pRK1693 2714+582
RKY3219 RKY1558 VPS20-sfGFP::kan pRK1693 415+440
RKY3220 RKY1558 VPS24-sfGFP::kan pRK1693 1910+1911
RKY3221 RKY1558 MOS10-sfGFP::His3 pRK1694 323+324
RKY3222 RKY1558 ∆vps68::kan pFA6a-kanMX6 3767+3768
RKY3223 RKY2844 ∆vps68::kan pFA6a-kanMX6 3767+3768
RKY3224 RKY3216 ∆vps68::His3 pFA6a-His3MX6 3767+3768
RKY3225 RKY3216 VPS68-13myc::His3 pFA6a-13myc-His3MX6 3520+3521
RKY3226 RKY3221 VPS68-mCherry::kan pRK1100 3520+3521
RKY3227 RKY3222 CHM7-sfGFP::His3 pRK1694 1439+1284
RKY3228 RKY1558 ∆chm7::kan pFA6a-kanMX6 1283+1284
to RKY1558 ∆chm7::kan pFA6a-kanMX6 1283+1284
RKY3233 RKY1558 ∆chm7::kan pFA6a-kanMX6 1283+1284
RKY3251 RKY1558 SNF7p-GFP-DID2::kan pRK1699 3839+3840
RKY3252 RKY827 ∆vps68::His3 pFA6a-His3MX6 3767+3768
RKY3253 RKY1882 ∆vps68::His3 pFA6a-His3MX6 3767+3768
RKY3254 RKY3139 ∆vps68::His3 pFA6a-His3MX6 3767+3768
RKY3255 RKY3136 ∆vps68::His3 pFA6a-His3MX6 3767+3768
RKY3256 RKY2100 ∆vps68::His3 pFA6a-His3MX6 3767+3768
RKY3257 RKY3222 IST1-sfGFP::His3 pRK1694 2719+2720
RKY3258 RKY3207 ∆vps68::His3 pFA6a-His3MX6 3767+3768
RKY3259 RKY1558 ∆vps55::kan pFA6a-kanMX6 3771+3773

36
Strain Alias Genotype Template Primer
RKY3260 RKY3222 ∆vps55::His3 pFA6a-His3MX6 3771+3773
RKY3261 RKY3224 ∆vps55::TRP1 pFA6a-TRP1 3771+3773
RKY3262 RKY1558 MOS10-mCherry::His3 pRK1099 323+324
RKY3263 RKY1558 SNF7p-GFP-VPS68::kan pRK1699 3790+3791
RKY3264 RKY3263 MOS10-mCherry::His3 pRK1099 323+324
RKY3265 RKY1558 SNF7p-GFP-VPS55::kan pRK1699 3786+3787
Table 5: Constructed S. cerevisiae strains using various techniques.
Strain Alias Construct Template
RKY3034 RKY2892 CRISPR/cas9, ARG4 deletion (Δarg4): fragment A P#628+3354, fragment B P#627+3355 repair fragment: P#3356+3359
YCpLac33 YCpLac33 RKY2998
RKY3207 RKY1558 pRK327 cut with BamHI/EcoRV for ∆vps27::kan pRK327
RKY3208 RKY3207 A) VPS27-ts23 fragment: P#3627+3628 B) His3 fragment: P#3629+3630 for vps27-ts23::His3
pRCP20 pFA6a-His3MX6
2.1.4 Yeast growth conditions Yeast strains were cultivated in YPD media consisting of 1 % (w/v) yeast extract, 2 % peptone,
and 2 % glucose, which was autoclaved separately and added afterwards, at 30 °C and shaking
at 100 rpm. Growth plates contained an additional 2 % agar. As a test for petiteness (loss of
mitochondrial DNA), cells were tested on media containing non-fermentable carbon sources
like 2 % glycerol/ethanol instead of glucose (Lipinski et al., 2010).
For selective growth conditions, yeast strains with an integrated kanamycin resistance cassette
were grown in YPD medium with 200 µg/ml of G418 (geneticin), added to the autoclaved
media after letting it cool down to below 50 °C. A single drop-out media was used for yeast
strains containing cassettes to overcome histidine or tryptophan auxotrophy. The media consists
of 0.67 % yeast nitrogen base (YNB) without amino acids, 2 % glucose, and either 770 mg/l of
-His drop-out or 740 mg/l of -Trp drop-out media from Formedium (product composition see
Table S 1). Alternatively, yeast strains were grown in 0.67 % YNB, and each essential amino
acid was added individually, which showed more insufficient growth than the single drop-out
media. If not further indicated, all yeast strains were incubated at 30 °C, whereas “ts” strains
(temperature-sensitive) were incubated at temperatures below 25 °C to ensure optimal growth.
New media and a new flask were used for temperature shifts, which were both previously
correctly tempered to ensure the desired temperature upkeep.

37
2.2 Plasmids
Table 6: Plasmid register.
Plasmid Reference Description
pACT2 BD Clontech GAL4-AD vector for yeast two-hybrid-system
pET-30a Novagen Vector for n-terminal His tagging
pFA6a-13myc-His3MX6 (Longtine et al., 1998) Template for c-terminal protein tagging with 13myc under S. pombe HIS5+ selection marker control
pFA6a-13myc-kanMX6 (Longtine et al., 1998) Template for c-terminal protein tagging with 13myc under KanMX4 selection marker control
pFA6a-3HA-His3MX6 (Longtine et al., 1998) Template for c-terminal protein tagging with 3HA under S. pombe HIS5+ selection marker control
pFA6a-GFPS65T-kanMX6 (Longtine et al., 1998) Template for c-terminal protein tagging with GFP under KanMX4selection marker control
pFA6a-His3MX6 (Longtine et al., 1998) Template for gene deletion under S. pombe HIS5+ selection marker control
pFA6a-kanMX6 (Longtine et al., 1998) Template for gene deletion under KanMX4 selection marker control
pFA6a-Trp1 (Longtine et al., 1998) Template for gene deletion under Trp selection marker control
pRCP20 (Piper et al., 1995) VPS27 ts-23 integration plasmid
pRK327 S. Losko, Hohenheim Template for vps27 gene deletion under KanMX4 selection marker control
pRK329 R. Kölling, Hohenheim GAL4-DB vector for yeast two-hybrid-system
pRK1099 R. Kölling, Hohenheim pFA6a-3mcherry-His3MX6; Template for c-terminal protein tagging with mcherry under S. pombe HIS5+ selection marker control
pRK1100 R. Kölling, Hohenheim pFA6a-mcherry-kanMX6; Template for c-terminal protein tagging with mcherry under KanMX4 selection marker control
pRK1266 (Bauer et al., 2015) 2µ Chm7-mCherry URA3
pRK1405 T. Brune, Hohenheim 2µ-Vector for HXT7p-yEGFP-CPS1 fusion expression with TRP1-selection marker
pRK1651 (Bauer et al., 2015) 2µ Did2-mCherry URA3
pRK1652 (Bauer et al., 2015) 2µ Ist1-mCherry URA3
pRK1653 (Bauer et al., 2015) 2µ Mos10-mCherry URA3
pRK1654 (Bauer et al., 2015) 2µ Snf7-mCherry URA3
pRK1655 (Bauer et al., 2015) 2µ Vps2-mCherry URA3
pRK1656 (Bauer et al., 2015) 2µ Vps20-mCherry URA3
pRK1657 (Bauer et al., 2015) 2µ Vps24-mCherry URA3
pRK1693 T. Brune, Hohenheim pFA6a-sfGFP-kanMX6; Template for c-terminal tagging with sfGFP under KanMX4 selection marker control

38
Plasmid Reference Description
pRK1694 T. Brune, Hohenheim pFA6a-sfGFP-His3MX6; Template for c-terminal protein tagging with sfGFP under S. pombe HIS5+ selection marker control
pRK1699 R. Kölling, Hohenheim pFA6a-kanMX6-SNF7p-GFP; Template for n-terminal protein tagging with GFP under KanMX4 selection marker control
pRK1760 R. Kölling, Hohenheim pFA6a-6His-kanMX6; Template for c-terminal protein tagging with 6His under KanMX4 selection marker control
pRK1785 S. Becker, Hohenheim 2µ-Vector for Ste6-sfGFP fusion expression with TRP1-selection marker
pRK1854 R. Kölling, Hohenheim 6His-Mos10 KanMX4 expression vector
pYM51 (Janke et al., 2004)) Template for c-terminal tagging with eqFP611 under KanMX4 selection marker control
YEplac112 (Gietz and Sugino, 1988) 2µ-Vector with TRP1-selection marker
YEplac195 (Gietz and Sugino, 1988) 2µ-Vector with URA3-selection marker
2.3 Designed oligonucleotides
Table 7: Synthesized oligonucleotides register.
Oligo Sequence (5’→3’) Description
#323 TTAGATACTGAAGACAAAAATAAAGCTTTAGAAAGCGCTCAGcggatccccgggttaattaa
Primer F2 MOS10 for c-terminal tagging
#324 AGAAAAATTCTGAATATGCAACTTTGTGTGCTTTTTGTTTgaattcgagctcgtttaaac
Primer R1 MOS10 for c-terminal tagging
#332 TGAAAAAGCATTAAGAGAACTACAAGCAGAAATGGGGCTTcggatccccgggttaattaa
Primer F2 SNF7 for c-terminal tagging
#333 ACCTTTTTTTTTTCTTTCATCTAAACCGCATAGAACACGTgaattcgagctcgtttaaac
Primer R1 SNF7 for c-terminal tagging
#415 CATTCCCTTTATTTTTAATTTTGAAGCTACATACAGACATgaattcgagctcgtttaaac
Primer R1 VPS20 for c-terminal tagging
#440 GGAGAGATCAGACACTAAGGAACCTTTAGCATTACTATCCcggatccccgggttaattaa
Primer F2 VPS20 for c-terminal tagging
#574 AACGTAATGATGAACTAAAAATGCATGACCTGTTAGCATGgaattcgagctcgtttaaac
Primer R1 DID2 for c-terminal tagging
#582 TATAGTATAGACCTATTATTCATTAAATATACTCAGAGCGgaattcgagctcgtttaaac
Primer R1 VPS2 for c-terminal tagging
#627 AACGACCGAGCGCAGCGAGT YCpLac33 upstream the polylinker pUC
#628 GGAGAAAATACCGCATCAGG YCpLac33 downstream the polylinker pUC
#1175 GAAGACAAACTTGCACAAAGACTAAGAGCATTGAGGGGCcggatccccgggttaattaa
Primer F2 DID2 for c-terminal tagging
#1283 CACCACCAAAGCCAGCCAAATAGTATCTCACTGTATCTGAcggatccccgggttaattaa
Primer F1 CHM7 deletion

39
Oligo Sequence (5’→3’) Description
#1284 TATTTATACATATATATTTATTTATTAGTCACTCAGTTCGgaattcgagctcgtttaaac
Primer R1 CHM7 deletion
#1439 TAATGAGATAAGAAAAATCATGATGGAAGAACAACCACGTcggatccccgggttaattaa�
Primer F2 CHM7 for c-terminal tagging
#1910 GGTAAATGAAATGCGTGAAAGGCTGAGAGCTTTGCAAAACCGGATCCCCGGGTTAATTAA
Primer F2 VPS24 for c-terminal tagging
#1911 ACTTATTTATTTATTTTCTTTGTACAGTCACAGTAACACTgaattcgagctcgtttaaac
Primer R1 VPS24 for c-terminal tagging
#2714 TGACTTGCAAGCTCGGTTGAACACTTTGAAGAAGCAGACTcggatccccgggttaattaa
Primer F2 VPS2 for c-terminal tagging
#2719 AGATGAGTTGAAGAAACGGTTTGACGCTTTACGCAGAAAAcggatccccgggttaattaa
Primer F2 IST1 for c-terminal tagging
#2720 AAATATGTGGTTAATTAACCATACATATAAATTATTATCTgaattcgagctcgtttaaac
Primer R1 IST1 for c-terminal tagging
#3191 TGAGCAACAACAGCAACAGCAGCAACAGCAGCAACAACAAcggatccccgggttaattaa
Primer F2 PUB1 for c-terminal tagging
#3192 ATTCTTTCTTTTTGTTTCATTCCACTTTTCTTCATAATATgaattcgagctcgtttaaac
Primer R1 PUB1 for c-terminal tagging
#3193 GGTAATATTCCGCACT Primer T1 PUB1 for c-terminal tagging
#3194 AGCCTTCAGAAAATACGTT Primer T2 PUB1 for c-terminal tagging
#3199 TTCAGGGTCTAATGAATTATTAAGCATTTTGCATAGGAAGcggatccccgggttaattaa
Primer F2 DCP2 for c-terminal tagging
#3200 CATTTACAGTGTGTCTATAAAACGTATAACACTTATTCTTgaattcgagctcgtttaaac
Primer R1 DCP2 for c-terminal tagging
#3201 ACGTCAATGAAACGCAAC Primer T1 DCP2 for c-terminal tagging
#3202 CCAGTAATAGCCTCGATG Primer T2 DCP2 for c-terminal tagging
#3203 AAACAAGATTAAAAAGATTGTTTTAAAACGTTCTTTCGACcggatccccgggttaattaa
Primer F2 NMD2 for c-terminal tagging
#3204 ATATAGTAAAAATTTAAAGAACTATATTCGCAAAAGAATCgaattcgagctcgtttaaac
Primer R1 NMD2 for c-terminal tagging
#3354 TTTGTAAATGTGTGTAGCCTaaagtcccattcgccac
sgRNA ARG4 fragment A rev
#3355 AGGCTACACACATTTACAAAgttttagagctagaaatagcaag
sgRNA ARG4 fragment B fw
#3356 CAAAGAAAATACGGTACTTGC ARG4 repair fragment A fw
#3357 CATAACGTCGCCATCTGGTTTGCCTTAGTCTTGTTAT
ARG4 repair fragment A rev
#3358 CAGATGGCGACGTTATG ARG4 repair fragment B fw
#3359 TTTGTTGATGTACCAAGGCTA ARG4 repair fragment B rev
#3400 AGAATCATCTTGCTCGG VPS27 sequencing primer pos. 1847
#3401 GTGGAGTTTTCTGCCAA VPS27 sequencing primer pos. 2586
#3402 ATAGAAATGAACGGCAAG VPS27 sequencing primer pos. 3230
#3451 TACTGATGGCAAAGTCATTTATGAGTTAGAAGATAAGGAAcggatccccgggttaattaa
Primer F2 GET3 for c-terminal tagging

40
Oligo Sequence (5’→3’) Description
#3452 TTATATGTCGTATGTATCTATTTATGGTATTCAGGGGCTTgaattcgagctcgtttaaac
Primer R1 GET3 for c-terminal tagging
#3453 TTCCTACGATATGGACGTT Primer T1 GET3 for c-terminal tagging
#3454 TGGGCTTATTACTTCGTT Primer T2 GET3 for c-terminal tagging
#3455 GTCTTTCAAAAAGGAGCAAGAACAACAAACTGAGCAAGCTcggatccccgggttaattaa
Primer F2 PAB1 for c-terminal tagging
#3456 TAAGTTTGTTGAGTAGGGAAGTAGGTGATTACATAGAGCAgaattcgagctcgtttaaac
Primer R1 PAB1 for c-terminal tagging
#3457 CCAAGAAATGCCAACGA Primer T1 PAB1 for c-terminal tagging
#3458 GCCGTTAATAATGAGACCT Primer T2 PAB1 for c-terminal tagging
#3504 AACAAAATCTGTCAGAATTGCCATTGACAAGCCAATTCGTcggatccccgggttaattaa
Primer F2 ALD5 for c-terminal tagging
#3505 ACATACCTTCAATGAGCAGTCAACTCGGGCCTGAGTTACTgaattcgagctcgtttaaac
Primer R1 ALD5 for c-terminal tagging
#3506 GTCAAGCCAACAGTGTTTGC Primer T1 ALD5 for c-terminal tagging
#3507 CTCTGGCACTTGTATCTACC Primer T2 ALD5 for c-terminal tagging
#3508 GGAAGAAGTTCCAGGCTGGCAAGAATATTACGACAAATTGcggatccccgggttaattaa
Primer F2 EFT1 for c-terminal tagging
#3509 GGTTTGCTCTTACAGAACCACCTTTTCTCATTTAGACTTCgaattcgagctcgtttaaac
Primer R1 EFT1 for c-terminal tagging
#3510 GTTGGCTGATCCAAAGATCC Primer T1 EFT1 for c-terminal tagging
#3511 GTAATACTACCTCAGGACCG Primer T2 EFT1 for c-terminal tagging
#3512 AGAGCAGCAAGAGCAGGACAAAAAGAAAAAATCTAACCATcggatccccgggttaattaa
Primer F2 PRE6 for c-terminal tagging
#3513 TATTTTATATAGGTTTTATGCCCAATATATATCGCCGTTTgaattcgagctcgtttaaac
Primer R1 PRE6 for c-terminal tagging
#3514 ATATACTCTTCGTGGTCCGC Primer T1 PRE6 for c-terminal tagging
#3515 ATGGGCATATAGGCGTATGG Primer T2 PRE6 for c-terminal tagging
#3516 ACAACAACGGCAACAATGCCGAATCTGGTGAAACTAAGCAcggatccccgggttaattaa
Primer F2 SSC1 for c-terminal tagging
#3517 TAACATTGTGGTAGTAATTTATTAACAGGAATTTGCTTTTgaattcgagctcgtttaaac
Primer R1 SSC1 for c-terminal tagging
#3518 GAAGGTAAGGTTGACAAGGC Primer T1 SSC1 for c-terminal tagging
#3519 TTCCATCATAACCGTCTGGG Primer F2 SSC1 for c-terminal tagging
#3520 CCAAAATGTTGAAGATGAATATTCATATTCTTTGACGCTCcggatccccgggttaattaa
Primer F2 VPS68 for c-terminal tagging
#3521 GATCGCCTTAATTGGCCTCGAAAATATTGGTCAACTTAACgaattcgagctcgtttaaac
Primer R1 VPS68 for c-terminal tagging
#3522 TTATCGTCAGATGGTGGTGC Primer T1 VPS68 for c-terminal tagging
#3523 AGGTGTTGACGTATGATGCC Primer T2 VPS68 for c-terminal tagging
#3627 TAATATGCACGGAGCCTACC pRCP20 VPS27 ts upstream prom. region
#3628 CGAGGCAAGCTAAACAGATCTGTATAAGTTGCGTAACAAGC
pRCP20 VPS27 ts downstream term. region
#3629 GATCTGTTTAGCTTGCCTCG pFA6a-His3MX6 upstream prom. Region

41
Oligo Sequence (5’→3’) Description
#3630 ATGAATATTCACCTTAAAAACTAGTTTAATGACAGAAATATCGTTTAAACTGGATGGCGG
pFA6a-His3MX6 downstream term. Region
#3641 ATTGGACGAGTTTATCAAAAAGAACAGTGATAAAATTCGCcggatccccgggttaattaa
Primer F2 EXO84 for c-terminal tagging
#3642 TCATATATATTGAAGTGAGGTTTATTTTCTGTGATCTTGTgaattcgagctcgtttaaac
Primer R1 EXO84 for c-terminal tagging
#3645 AGCTGTTACAACTACTTTCGATAAAGTCCACCAGGATTGGcggatccccgggttaattaa
Primer F2 LEU1 for c-terminal tagging
#3646 CATGTTATTGACGCCAGGTTTGGACGTTGTTTTTCACTGTgaattcgagctcgtttaaac
Primer R1 LEU1 for c-terminal tagging
#3649 ACTAGTTTATTCGATAGAGTCGAGAGTTTTAGGCCATAATcggatccccgggttaattaa
Primer F2 OAC1 for c-terminal tagging
#3650 CAATGAATGAAACTTCAAACCTCGGAGTTTGTTATGGGAAgaattcgagctcgtttaaac
Primer R1 OAC1 for c-terminal tagging
#3651 TGTTGCCGTCGTTATGAACC Primer T1 OAC1 for c-terminal tagging
#3652 TTGTGGCCATTTGGTACTGG Primer T2 OAC1 for c-terminal tagging
#3653 TACATCATCAAGCTCAACAAGCTCCTCTGCCACCAAAAACcggatccccgggttaattaa
Primer F2 TPS1 for c-terminal tagging
#3654 GGACCAGGAATAGACGATCGTCTCATTTGCATCGGGTTCAgaattcgagctcgtttaaac
Primer R1 TPS1 for c-terminal tagging
#3655 ATCCTGAGTGAGTTCACAGG Primer T1 TPS1 for c-terminal tagging
#3656 AAAGAAGACGTAAGGGCTCC Primer T2 TPS1 for c-terminal tagging
#3657 TCATGCAGAGACGCTGCTCAGCCAGCGCAGCAGGGACCGTcggatccccgggttaattaa
Primer F2 DNF2 for c-terminal tagging
#3658 TTGGTATACATAGTACAAAGGAAGAAAAAAATTGTAATCAgaattcgagctcgtttaaac
Primer R1 DNF2 for c-terminal tagging
#3659 AGAGAAATGTGGTTACGCGG Primer T1 DNF2 for c-terminal tagging
#3660 ATATTACGTCTCCGGCTTCG Primer T2 DNF2 for c-terminal tagging
#3661 CTTGTATGAATATCATACTGAGGAAGACGTCATGTATGCCcggatccccgggttaattaa
Primer F2 YGR130c for c-terminal tagging
#3662 GGTGGGATATTCCTTGAACAAAAGTGGAATATTATTTTTTgaattcgagctcgtttaaac
Primer R1 YGR130c for c-terminal tagging
#3663 AAAGACTCGAAGATGAGCGC Primer T1 YGR130c for c-terminal tagging
#3664 AGAGAGTCCATCTTACTCGG Primer T2 YGR130c for c-terminal tagging
#3665 CAAATCATCGAAAGGTTTTTTCAGTAAGCTAGGATGCTGTcggatccccgggttaattaa
Primer F2 YCK2 for c-terminal tagging
#3666 TGGTGGGAATGATTACAAAAAACCTCCTCCGTTTTCTATTgaattcgagctcgtttaaac
Primer R1 YCK2 for c-terminal tagging
#3667 TCAAGCACAAGCCAAAGTGC Primer T1 YCK2 for c-terminal tagging
#3668 AGTACACAATAACGCCGACG Primer T2 YCK2 for c-terminal tagging
#3669 AATTCCACCTGCAGGTATTCCTCCACCCCCACCCCTTCCAcggatccccgggttaattaa
Primer F2 PAN1 for c-terminal tagging
#3670 ATTAGTATACATACGTATCTATAGAAAGCAAATTAAATCTgaattcgagctcgtttaaac
Primer R1 PAN1 for c-terminal tagging

42
Oligo Sequence (5’→3’) Description
#3671 GATGGCTTTCAAGAACCTCC Primer T1 PAN1 for c-terminal tagging
#3672 ATGAGGATCAACGGTCAACG Primer T2 PAN1 for c-terminal tagging
#3673 GGAGCTAACATTAGCTCGTTATAGGGCTAAAGGCATGCTTcggatccccgggttaattaa
Primer F2 TOM71 for c-terminal tagging
#3674 TAACTAAAAGTATATATTTGACCAATACCTGACATATCTTgaattcgagctcgtttaaac
Primer R1 TOM71 for c-terminal tagging
#3675 GCCTGTGAATTAGATCCACG Primer T1 TOM71 for c-terminal tagging
#3676 ACGCGTCAAGATTGGTTTGC Primer T2 TOM71 for c-terminal tagging
#3677 TGACAAGAGAGCAGAACTGGCCTCTAAATATATATACTCCcggatccccgggttaattaa
Primer F2 COG8 for c-terminal tagging
#3678 CGATCGTCATTTTGAAAATACATAGTGAGCCAATATTATAgaattcgagctcgtttaaac
Primer R1 COG8 for c-terminal tagging
#3679 CTGTTCATTCCGTCTTTGCG Primer T1 COG8 for c-terminal tagging
#3680 CTCCTCCTCATGAAATAGGG Primer T2 COG8 for c-terminal tagging
#3681 AATCTTAGATTCAGTGTTCAGCAAATTTTGTATAGGAAAAcggatccccgggttaattaa
Primer F2 MSS1 for c-terminal tagging
#3682 CAATTTTCTTTTATTTATATACACGATGATTGTAACTAGGgaattcgagctcgtttaaac
Primer R1 MSS1 for c-terminal tagging
#3683 AGACTCGGATCAAAGTACCC Primer T1 MSS1 for c-terminal tagging
#3684 AGTGGTGCCAACATTGATGC Primer T2 MSS1 for c-terminal tagging
#3685 ATTAGAACCAATGGAAAGTCTAAGATCCACCACCAAATATcggatccccgggttaattaa
Primer F2 PTR2 for c-terminal tagging
#3686 AAAAAAAAAAAAAAAAAAGACAGTAAGTTAATTAAACGCAgaattcgagctcgtttaaac
Primer R1 PTR2 for c-terminal tagging
#3687 TTTACAAGGCTGGTCCATGG Primer T1 PTR2 for c-terminal tagging
#3688 ATACAGTGAGCCTGAAGAGG Primer T2 PTR2 for c-terminal tagging
#3689 TCTGGAGAGCACACACAAAGAAGCTATGGGGGAGAAAAACcggatccccgggttaattaa
Primer F2 MNN5 for c-terminal tagging
#3690 ATGGCGAGTTATTATTAAATTATTATAGTTAATCACTTCAgaattcgagctcgtttaaac
Primer R1 MNN5 for c-terminal tagging
#3691 CGCAGCAGAAAGTTAAAGCC Primer T1 MNN5 for c-terminal tagging
#3692 TTAAACCGTTCACCAAGCGC Primer T2 MNN5 for c-terminal tagging
#3730 GATCAGTGGACAATCCTACG Primer T1 EXO84 for c-terminal tagging
#3731 AGCCATAGCTTCTTTGTCCC Primer T2 EXO84 for c-terminal tagging
#3732 TGGTTCTTCCAGAGAACACG Primer T1 LEU1 for c-terminal tagging
#3733 CCTGCATGCATTAACAAGGG Primer T2 LEU1 for c-terminal tagging
#3767 TTATCCCCAACTACAAGATCAATTAGAAAATCACATCATCcggatccccgggttaattaa
Primer F1 VPS68 deletion
#3768 GATCGCCTTAATTGGCCTCGAAAATATTGGTCAACTTAACgaattcgagctcgtttaaac
Primer R1 VPS68 deletion
#3769 GAACTGCGATTCTCTTCTGG Primer T1 VPS68 deletion
#3770 GCCATCTCTGGATTAGTTGC Primer T2 VPS68 deletion
#3771 TTTCAAAAAAGATTTCAACGAAGATGATTCCCTTTTTGGTcggatccccgggttaattaa
Primer F2 VPS55 for c-terminal tagging

43
Oligo Sequence (5’→3’) Description
#3772 GTTGGCTTAGTCTGTTGAGGGGATGAGTAATTGTTATATAgaattcgagctcgtttaaac
Primer R1 VPS55 for c-terminal tagging
#3773 AAAAGGCAAAGAATCTTAATACATAAAATCCCAGACGGTTcggatccccgggttaattaa
Primer R1 VPS55 deletion
#3774 CTGTTTCCTCGCATTAAGCG Primer T1 VPS55 c-terminal tagging/deletion
#3775 CACAGAATGGTTGTACGACC Primer T2 VPS55 c-terminal tagging/deletion
#3786 AAAAGGCAAAGAATCTTAATACATAAAATCCCAGACGGTTgaattcgagctcgtttaaac
Primer F4 VPS55 for n-terminal tagging
#3787 AAATAATCTTTGTCAATGGTGACACTTTGAATTCCATCATtttgtatagttcatccatgc
Primer R5 VPS55 for n-terminal tagging
#3788 TTAGATGGGCTTTCACTC Primer T1 VPS55 for n-terminal tagging
#3789 TATGATAAGACCACCGAT Primer T2 VPS55 for n-terminal tagging
#3790 TTATCCCCAACTACAAGATCAATTAGAAAATCACATCATCgaattcgagctcgtttaaac
Primer F4 VPS68 for n-terminal tagging
#3791 AGGGGAAGCGAAATAAGCTAACATGATCATCTGCCTCCATtttgtatagttcatccatgc
Primer R5 VPS68 for n-terminal tagging
#3792 TTTCATAAAGAAGGCAAG Primer T1 VPS68 for n-terminal tagging
#3793 CCATAAAACAACGCAAC Primer T2 VPS8 for n-terminal tagging
#3794 ACACCAGTGCTACTAATGCG Primer T1 CHM7 for c-terminal tagging
#3795 GGTGGTGATTCAATGACTCC Primer T2 CHM7 for c-terminal tagging
#3796 CTGTTGAAGTTGGCATCACG Primer T1 DID2 for c-terminal tagging
#3797 GATGAGCATTGGATGACTCC Primer T2 DID2 for c-terminal tagging
#3798 GGAACAGCTTGTCAAAGAGC Primer T1 IST1 for c-terminal tagging
#3799 GCCGAGAATAATAGAGCAGC Primer T2 IST1 for c-terminal tagging
#3800 TGCCATGAAGGCTCAATACG Primer T1 MOS10 for c-terminal tagging
#3801 TATCTCTTAGCTCCTGCTCC Primer T2 MOS10 for c-terminal tagging
#3802 GGAGATGAAATAAGCGACGC Primer T1 SNF7 for c-terminal tagging
#3803 CATTAGTGGTGCTCAAAGGG Primer T2 SNF7 for c-terminal tagging
#3804 TTTGATGGGTCAACGACAGG Primer T1 VPS2 for c-terminal tagging
#3805 TACAAGAAAGCTAGGGAGGG Primer T2 VPS2 for c-terminal tagging
#3806 GAAGCTTAGTCGGAACAAGC Primer T1 VPS20 for c-terminal tagging
#3807 AGGAGAAATTCACCTCGAGG Primer T2 VPS20 for c-terminal tagging
#3808 ATCAAATGGCTGACAGTGCG Primer T1 VPS24 for c-terminal tagging
#3809 TCAGATCATGGATCCTGAGC Primer T2 VPS24 for c-terminal tagging
#3810 gatcATGGAGGCAGATGATCATGTTAGCTTATTTCGCTTCCCCTTCAAGATTCCCACCTTTCGTGGTATAAGAAAAGGTGGGtag
Y2H Vps68 1-26 fw new
#3811 tcgactaCCCACCTTTTCTTATACCACGAAAGGTGGGAATCTTGAAGGGGAAGCGAAATAAGCTAACATGATCATCTGCCTCCAT
Y2H Vps68 1-26 rev new
#3812 gatcTCTAGATATTCCAATGCATCAGATGTTCATGTTACGtag
Y2H Vps68 48-59 fw new

44
Oligo Sequence (5’→3’) Description
#3813 tcgactaCGTAACATGAACATCTGATGCATTGGAATATCTAGA
Y2H Vps68 48-59 rev new
#3814 gatcAATTCTATTGAAAAGAATAGATTATTGCAGGGAGCTTTATCGTCAGATGGTGGTGCCTTCGGTAGTGGTGTAGGCGATTTAGATTCAAGCATGGCATGGCAAGCTCGAACCtag
Y2H Vps68 77-113 fw new
#3815 tcgactaGGTTCGAGCTTGCCATGCCATGCTTGAATCTAAATCGCCTACACCACTACCGAAGGCACCACCATCTGACGATAAAGCTCCCTGCAATAATCTATTCTTTTCAATAGAATT
Y2H Vps68 77-113 rev new
#3816 gatcAAATTTTTAGTCAAGGATTACAATACCTATCCAACTTTGGGGATGGGAtag
Y2H Vps68 136-151 fw new
#3817 tcgactaTCCCATCCCCAAAGTTGGATAGGTATTGTAATCCTTGACTAAAAATTT
Y2H Vps68 136-151 rev new
#3818 gatcCAAAATGTTGAAGATGAATATTCATATTCTTTGACGCTCtag
Y2H Vps68 172-184 fw new
#3819 tcgactaGAGCGTCAAAGAATATGAATATTCATCTTCAACATTTTG
Y2H Vps68 172-184 rev new
#3839 CTACTTTGAAAGTATAGGAAGTCAGACATCGCACTGAGAAgaattcgagctcgtttaaac
Primer F4 DID2 for n-terminal tagging
#3840 AAAGAGTGTTTTCCAAACCTGCTGCAGAATTACGTGACATtttgtatagttcatccatgc
Primer R5 DID2 for n-terminal tagging
#3841 CACTGCCATTTATCTGGT Primer T1 DID2 for n-terminal tagging
#3842 CATGCCATTTTCGTCAGC Primer T2 DID2 for n-terminal tagging
#3866 AGGGGAAGCGAAATAAGCTAACATGATCATCTGCCTCCATtttgtacaattcgtccattcct
Primer R5 VPS68 for n-terminal sfGFP tagging
#3867 AAAGAGTGTTTTCCAAACCTGCTGCAGAATTACGTGACATtttgtacaattcgtccattcct
Primer R5 DID2 for n-terminal sfGFP tagging
#3893 AGATTGGTTGAAACACAGTTATAAACTCTTCAAGGCAATTgaattcgagctcgtttaaac
Primer F4 MOS10 for n-terminal sfGFP tagging
#3894 CATGGCTCTTTTTGTTCCCATATCCGAAAATCCTGTTCATtttgtacaattcgtccattcct
Primer R5 MOS10 for n-terminal sfGFP tagging
#3895 ACTAAGTGGACTAAGTCCCG Primer T1 MOS10 for n-terminal tagging
#3896 ACTAAGTGGACTAAGTCCCG Primer T2 MOS10 for n-terminal tagging
2.4 Materials
2.4.1 Chemicals and solutions
Table 8: Chemicals and solutions register.
Description Supplier
Acrylamide Rotiphorese® Gel 30 (37.5:1), Lot 248272238 Carl Roth (Karlsruhe, Germany)
Ammonium peroxydisulphate (APS), Lot 393201798 Carl Roth (Karlsruhe, Germany)

45
Description Supplier
BactoTM Agar Becton, Dickinson, and Company (Sparks, USA)
Benzamidine hydrochloride hydrate 97 %, Lot 20H7704 Sigma Aldrich (San José, USA)
Bromphenol blue Merck (Darmstadt, Germany)
1-Butanol (C4H10O) Carl Roth (Karlsruhe, Germany)
Dimethylsulfoxide (DMSO), Lot 266245732 Carl Roth (Karlsruhe, Germany)
Dithiobis (succinimidyl propionate) (DSP), Lot SC239197 Thermo Scientific (Waltham, USA)
1,4-Dithiothreitol (DTT) ≥ 99 %, Lot 277260643 Carl Roth (Karlsruhe, Germany)
DNaseA, RNase free Lot. 00771398 Thermo Scientific (Waltham, USA)
dNTP Mix (10mM) Thermo Scientific (Waltham, USA)
Ethanol ≥ 99.5 %, Lot 277260243 Carl Roth (Karlsruhe, Germany)
Ethylenediaminetetraacetic acid (EDTA) (C10H16N2O8) Carl Roth (Karlsruhe, Germany)
D(+)-Glucose, Lot 288273364 Carl Roth (Karlsruhe, Germany)
Glycerol ROTIPURAN® ≥ 99.5 %, Lot 5132075 Carl Roth (Karlsruhe, Germany)
Glycine PUFFERAN ≥ 99.9 %, Lot 514223084 Carl Roth (Karlsruhe, Germany)
Immersion oil x899.4 Carl Roth (Karlsruhe, Germany)
Protino Ni-NTA Agarose, Lot 1807/001 Macherey-Nagel (Düren, Germany)
Nickel (Meister et al.)sulphate ⋅ 6H2O T111.1 Carl Roth (Karlsruhe, Germany)
Nonfat dried milk powder, Lot R8528 AppliChem (Darmstadt, Germany)
OneTaq® DNA Polymerase New England Biolabs (Massachusetts, USA)
Optiprep Density Gradient Medium, Lot. 01556 Axis Shield (Dundee, Scotland)
BactoTM Peptone, Lot 8023900 Becton, Dickinson, and Company (Sparks, USA)
1,10-Phenantroline monohydrate, Lot 88H1313 Sigma Aldrich (San José, USA)
Phenylmethanesulfonylfluoride (PMSF) ≥ 98.5 %, Lot 010M1972
Sigma Aldrich (San José, USA)
Ponceau S, Lot 083K3643 Sigma Aldrich (San José, USA)
Color Prestained Protein Standard, Broad Range (11–245 kDa)
New England Biolabs (Massachusetts, USA)
Protein A SepharoseTM CL-4B, Lot 10043746/ 10254134 GE Healthcare (Chicago, USA)
Q5® High-Fidelity 2X Master Mix New England Biolabs (Massachusetts, USA)
RNaseA, DNase free, Lot. 00781705 Thermo Scientific (Waltham, USA)
SILAC L-Arg, Lot. 201604102 Silantes GmbH (München, Germany)
SILAC L-Lys, Lot. 211604102 Silantes GmbH (München, Germany)
Silver nitrate, Lot. 6207.1 Carl Roth (Karlsruhe, Germany)
Sodium chloride, Lot 307261327 Carl Roth (Karlsruhe, Germany)
Sodium dihydrogen phosphate dihydrate (NaH2PO4 ⋅ 2H2O), Lot 419645
Merck (Darmstadt, Germany)
Sodium dodecyl sulfate (SDS) ≥ 99.5 %, Lot 195228353 Carl Roth (Karlsruhe, Germany)
Tetramethylethylenediamin (TEMED), Lot 068267753 Carl Roth (Karlsruhe, Germany)
Trichloroacetic acid (TCA) ≥ 99 %, Lot 19786920 Carl Roth (Karlsruhe, Germany)
TRIS base PUFFERAN® ≥ 99.9 %, Lot 464221491 Carl Roth (Karlsruhe, Germany)

46
Description Supplier
Triton X-100 (t-Octylphenoxy polyethoxyethanol), Lot 10K0192
Sigma-Aldrich (San José, USA)
Tween®20, Lot 407263603 Carl Roth (Karlsruhe, Germany)
Western blot substrate Signal FireTM ECL Reagent, Lot 12 Cell signaling technology Inc. (Danvers, USA)
WesternBrightTM ECL HRP substrate (Peroxide, Lot 180124-56, ECL, Lot 180124-57)
Advansta Inc. (San José, USA)
Western Blotting Substrate Lumi-Light, Lot 32701200 Roche Diagnostics GmbH (Mannheim, Germany)
BactoTM Yeast Extract, Lot 2101361 Becton, Dickinson, and Company (Sparks, USA)
2.4.2 Facilities and consumables
Table 9: Facility register.
Description Supplier
AEKTA Start GE Healthcare (Chicago, USA)
Analytical scale: MC1 Analytic AC 210 S Sartorius AG (Göttingen, Germany)
AXIO Imager M1 Carl Zeiss AG (Oberkochen, Germany)
Benchmark PlateFuge Mini Centrifuge Benchmark Scientific (NJ, USA)
Branson 450 Digital Sonifier w/ Probe Marshall Scientific (Hampton, USA)
Cassette Cooler GE Healthcare (Chicago, USA)
Cell density rotor 40 Thermo Scientific (Waltham, USA)
Centrifuge AvantiTM J-30.50 Ti + rotor JA-10 (500 ml bottles)
Beckman Coulter Inc. (Brea, USA)
Centrifuge MEGA STAR 1.6R (falcon tubes) VWR (Radnor, USA)
Centrifuge Tabletop 5424 (micro reaction tubes) Eppendorf AG (Hamburg, Germany)
Density Meter DMA 4100M Anton Paar (Graz, Austria)
FastPrep®-24 cell disrupter MP Biomedicals (Santa Ana, USA)
Freezer - 20°C Liebherr (Biberach/Riß, Germany)
Freezer Ultra-low temperature C340 Premium (-70 °C) New Brunswick Scientific (Edison, USA)
Freezer Ultra-low temperature H86G-400.1 (-70 °C) EWALD (Bad Nenndorf, Germany)
French Press Cellular Press American Instrument Company (USA)
Glass plate SE6102, 18x16 cm GE Healthcare (Chicago, USA)
Glass plate SE6102D, 18x16 cm GE Healthcare (Chicago, USA)
Heating Block, Thermo shaker TS 100 A. Hartenstein (Wuerzbrug, Germany)
Heraeus Function line Thermo Scientific (Waltham, USA)
Hoshizaki Ice Machines Ice machine (Vienna, Austria)
Imaging system (Ponceau S): GelStick Intas Science Imaging Instruments (Göttingen, Germany)
Imaging system (Western blot): LAS-3000 mini Fujifilm (Tokyo, Japan)
Magnetic stirrer FB 15045 Thermo Scientific (Waltham, USA)
MaxQ™ 6000 Thermo Scientific (Waltham, USA)

47
Description Supplier
Microliter syringe 0-100 µl, 710 RN SYR (SDS-PAGE loading)
Hamilton Bonaduz AG (Bonaduz, Switzerland)
MINI hybridization unit, model OV1/OV2 Biometra (Göttingen, Germany)
Model EP-1 Econo Pump Bio-Rad (Hercules, USA)
Peristaltic Pumps, Single-Channel, P-1 VWR (Radnor, USA)
pH meter: HI 221 Calibration check Microprocessor Hanna Instruments (Woonsocket, USA)
Pipets: PIPETMAN Classic™ 2-20 µl, 20-200 µl, 100-1000 µl
Gilson Inc. (Middleton, USA)
Power supply model 1000/500 (for SDS-PAGE) Bio-Rad (Hercules, USA)
Power supply PS3002 (for SDS-PAGE) GibcoBRL, Life technologies (Carlsbad, USA)
Power supply Voltcraft VLP-1602 PRO (for Western blot)
CEI Conrad International (New Territories, Hong Kong)
Scale 474-42 Kern & Sohn (Balingen, Germany)
SE 400 vertical unit for SDS-PAGE GE Healthcare (Chicago, USA)
Shaker Unimax 1010 (Western blot incubation) Heidolph Instruments (Schwabach, Germany)
Thermo-Shaker TS-100 (95 °C) A. Hartenstein (Würzburg, Germany)
Spectrophotometer genesis 10 S UV-Vis Thermo Scientific (Waltham, USA)
Thermostat MA, 50 °C + Water bath Julabo GmbH (Seelbach, Germany)
Tube rocker M48720-33 Thermo Scientific (Waltham, USA)
Ultracentrifuge M120 SE + S45A-0292 Tube Rotor & S525T-0117 Swing Rotor
Sorvall® /Thermo scientific (Waltham, USA)
Unichromat 19307 UniEquip (Freital Germany)
UV lamp VL-6.MC Biotech (Madrid, Spain)
UV visualizer Intas Science Imaging Instruments GmbH (Göttingen, Germany)
Variomag Mono Magnetic stirrerV VWR (Radnor, USA)
Vibrax VXR basic IKA (Staufen, Germany)
Vortex-Genie 2 Scientific Industries (Bohemia, USA)
WB system Amersham GE Healthcare (Chicago, USA)
30 °C shaker Infors AG (Bottmingen, Switzerland)
Table 10: Consumables register.
Description Supplier
AmershamTM ProtranTM 0.45 µm Nitrocellulose Blotting membranes
GE Healthcare (Chicago, USA)
Centrifugation bottle assembly (500 ml PC bottle, stopper, cap)
Beckman Coulter® Life Sciences (Brea, USA)
Centrifuge tubes, 15 ml Greiner Bio-One (Kremsmünster, Austria)
Centrifuge tubes, 50 ml Greiner Bio-One (Kremsmünster, Austria) / neoLab Migge GmbH (Heidelberg, Germany)
Glass beads; SiLibeads type S 0.40-0.60 mm Sigmund Lindner GmbH (Warmensteinach, Germany)

48
Description Supplier
Glass pipets 1,2,5,10,20 ml Hirschmann® Laborgeräte GmbH & Co. KG (Eberstadt, Germany)
Glassware: Erlenmeyer flasks (300 ml, 500 ml), Fernbach flasks (1800 ml), Test tubes thick-/thin-walled (100x16mm, 160x16mm)
Duran® Group (Wertheim, Germany)
Microreaction tubes 1.5 / 2 ml SARSTEDT (Nümbrecht, Germany)
Parafilm® M Sigma Aldrich (San José, USA)
Pipet tips; 0-200 µl / 100-1000 µl SARSTEDT (Nümbrecht, Germany)
Protein A Sepharose™ GE Healthcare (Uppsala, Sweden)
Rotilabo® single-use cells, PS Semi-micro, 1.6 ml Carl Roth (Karlsruhe, Germany)
Specialty Tips/Gel Loading Pipet Tips Fisherbrand 1-200 µl
Thermo Fisher Scientific (Waltham, USA)
Sorval® PA Thinwall tube (5 ml) Kendro Laboratory products Thermo Scientific (Ashville, USA)
Test tubes heavy-walled (100 x 16 mm Ø) Duran Group (Mainz, Germany)
Test tubes thin-walled (100 x 15/16 mm Ø) Duran Group (Mainz, Germany)
Test tubes with straight rim Duran Group (Mainz, Germany)
Tuberculin, Omnifix® F syringe (1 ml) B. Braun AG (Melsungen, Germany)
Whatman® cellulose chromatography papers, grade 3MM
GE Healthcare (Chicago, USA)
2.4.3 Software
Table 11: Software register.
Software Supplier
Adobe® Photoshop® Elements 15 Adobe Systems (San José, USA)
Amplify4 1.0 https://engels.genetics.wisc.edu/amplify/
Gel Analyzer 2010a gelanalyzer.com
ImageJ 1.52a imagej.net
LAS-3000 Pro Fujifilm (Tokyo, Japan)
Microsoft Office 2019 University Hohenheim
NEB Tm calculator https://tmcalculator.neb.com/#!/main
Serial Cloner2.6.1 https://serial-cloner.de.softonic.com/
SnapGeneViewer 5.2.3 https://www.snapgene.com/
Tapforms5 https://www.tapforms.com/
Unicorn 1.1/1.2 GE Healthcare (Chicago, USA)
XnView MP 0.97.1 https://www.xnview.com/
ZEN Pro 2.3 SP1 Carl Zeiss (Oberkochen, Deutschland)

49
2.5 Molecular biological methods
2.5.1 PCR (Polymerase chain reaction) Standard PCR with Q5 polymerase was performed to amplify DNA sequences from plasmid
sources following the manufactures guide (Table 12). An annealing temperature of 60 °C was
being determined for all primers used for the amplification of DNA sequences according to the
Longtine et al. method referring to the NEB Tm calculator (Longtine et al., 1998).
Table 12: PCR protocol for Q5 polymerase.
Cycle step Temperature [°C] Time [s] Cycles
Initial denaturation 98 30 x1
Denaturation 98 5
�x35 Annealing 60 10
Elongation 72 20/kb
Final Elongation 72 120 x1
Hold 16 ∞
2.5.2 Colony Test PCR Template DNA was isolated from yeast cells by diluting a colony from a freshly streaked out
plate into 40 µl of distilled water and placing the tube into a block heater for 5 min at 95 °C.
Prior usage, the tube was vortexed, and 1 µl solution was taken for colony PCR. Colony PCR
was performed using the OneTaq 2x MasterMix following the manufactures guide (Table 13).
Table 13: PCR protocol for OneTaq.
Cycle step Temperature [°C] Time [s] Cycles
Initial denaturation 95 120 x1
Denaturation 95 15
�x35 Annealing 55 30
Elongation 68 60/kb
Final Elongation 68 600 x1
Hold 16 ∞
2.5.3 Agarose gel electrophoresis For a 1 % agarose gel 2 g agarose were dissolved in 200 ml boiling distilled water and 2 ml 50x
TAE were added to create a 0.5x TAE (20 mM Tris [pH 8], 10 mM NaOAc, 1 mM EDTA)

50
agarose solution. Ethidium bromide to a final concentration of 0.5 µg/ml was added to the
solution, letting it cool down until solidifying in a tray used for agarose gel electrophoresis.
DNA samples were stained with 10 % (v/v) marker solution (0.2 % bromophenol blue in 75 %
glycerol). Agarose gel was running for 1 h at 200 V in 0.5x TAE/0.5 µg/ml EtBr running buffer
with 0.5 µg λ-DNA cut with EcoRI/HindIII as a standard ladder.
2.5.4 Isolation of DNA fragments DNA bands were identified and cut out from the agarose gel using a UV lamp, and the Qiagen
gel extraction Kit applied further purification following the manufactures guide.
2.5.5 Calculating DNA concentration After running an agarose gel, the results were recorded using gel documentation. DNA
concentration was calculated by comparing the signal intensity of the separated DNA fragments
to the signal intensity of the standard λ-DNA marker.
2.5.6 Enzymatic Digestion Restriction digestion was performed by mixing 1 Unit of restriction enzyme with 1 µg of DNA
and incubating the mixture for 2 - 3 h or overnight according to the manufactures suggested
temperature.
2.5.7 SDS PAGE Proteins were separated under denaturing conditions using the Sodium Dodecyl Sulfate-
Polyacrylamide Gel Electrophoresis (SDS-PAGE). For the separating gel, 15 - 16 ml of a 7.5 %
or 10 % solution were pipetted between the two glass plates in the scaffold (Table 14).
Table 14: Pipetting scheme for the SDS PAGE separating gel.
Separation gel 7.5 % 10 % Vol.
1 Gel 2 Gels 1 Gel 2 Gels
dH2O 10 20 8.3 16.6 ml
1.5 M Tris, pH 8.8 5 10 5 10 ml
Bis-/Acrylamide 30 % 5 10 6.7 13.4 ml
10 % SDS 200 400 200 400 µl
TEMED 40 80 40 80 µl
10 % APS 50 100 50 100 µl

51
The freshly poured gel was overlayed by 500 µl ethanol, and polymerization occurred for
30 min at room temperature. After incubation, the alcohol layer was removed and air dried
while the stacking gel solution was prepared (Table 15).
Table 15: Pipetting scheme for the SDS PAGE stacking gel.
Stacking gel 5 % Vol.
1 Gel 2 Gels
dH2O 7 14 ml
1 M Tris, pH 6.8 1.25 2.5 ml
Bis-/Acrylamide 30 % 1.7 3.4 ml
10 % SDS 100 200 µl
TEMED 20 40 µl
10 % APS 25 50 µl
The gel scaffold was filled with approximately 6 ml of stacking gel solution, and a comb was
inserted to create the gel pockets. Usually, polymerization of the stacking gel was carried out
over a more extended period than 30 min to ensure stable, polymerized pockets for sample
loading. After loading the protein solutions and the Color Pre-stained Protein Standard (Broad
Range 11–245 kDa) (Table S 1) into the pockets, either 240 V for 3 h or 50 V overnight at 35
mA per gel were applied until the blue loading front ran into the running buffer (25 mM Tris,
192 mM glycine, 0.1 % SDS).
2.5.8 Coomassie staining After removing the SDS PAGE gel from glass plates, the gel was covered with Coomassie
staining solution (0.1 % Coomassie R250, 10 % acetic acid, 40 % methanol) and put into a
microwave for up to 1 min until almost boiling. The gel was then incubated for 10 - 15 min on
a shaker at room temperature. Afterwards, the Coomassie stain was discarded and recycled
while the gel was cleaned off of the stain in distilled water until no further staining of water
was visible. An excess of de-stain solution (20 % methanol, 10 % acetic acid) with some tissue
paper was carefully placed in the container to the gel and microwaved again until boiling. The
gel was repeatedly incubated with new tissue paper until the gel was fully de-stained.
2.5.9 Silver staining for mass spectrometry For silver staining, clean glass bowls, fresh double distilled water, freshly prepared solutions,
and powder-free gloves were used to ensure gel samples applicable for mass spectrometry.

52
After removing SDS PAGE gel from glass plates, the gel was fixed for 1 h at room temperature
in 100 ml 30 % ethanol and 10 % acetic acid solution while shaking mildly. The gel was washed
four times for 10 min in double-distilled water. Afterwards, the gel was incubated in 100 ml
0.8 M Na-thiosulfate for 1 min, washed twice in double-distilled water for again 1 min, and
then stained in 100 ml 12 mM silver nitrate for 30 min while the bowl is being covered with
aluminum foil. The stained gel is briefly washed in double-distilled water and then transferred
to a fresh glass bowl with 100 ml developer solution (2 % glucose, 100 mM boric acid,150 mM
NaOH) for up to 30 min. It is crucial to regularly check staining intensity to ensure sufficient
but not exceeding protein bands staining. Staining was then stopped in 100 ml 330 mM tris-
base and 2 % acetic acid solution for 30 min while gently shaking. The silver-stained gel was
washed with double distilled water before being applied for mass spectrometry analysis.
2.5.10 Western Blot analysis Western blot analysis was carried out onto a nitrocellulose membrane by transferring the
separated proteins from the SDS PAGE from the gel matrix to the membrane. Two Whatman
cellulose chromatography papers were placed on the frame for tight stacking, and the gel was
carefully transferred from between the glass plates onto the upper paper. The nitrocellulose
membrane was applied to the gel, and the stack was topped with two additional pieces of
Whatman paper before removing bubbles and closing the frame. The frame was placed in the
blot tank containing western blot buffer (192 mM glycine, 25 mM Tris, 20 % methanol), and
blotting was done overnight at 30 V or for 3 h at 60 V, allowing the proteins to migrate from
the gel onto the membrane. After blotting, the membrane was removed from the frame and
washed in dH2O to remove the blotting buffer. Successful transfer of proteins was checked by
applying 50 ml of Ponceau S solution (0.2 % Ponceau S, 3 % trichloroacetic acid [TCA]) over
the membrane and incubating for 1 min at room temperature. After removing the Ponceau S
solution, the membrane was washed with deionized water to remove unspecific staining and
reveal stained proteins. The stained blot was documented at the gel imaging system and then
fully de-stained with tap water for about 30 min. Prior blot development, unspecific binding
sites were blocked in the membrane by blocking solution (1x PBS pH 7.4 [150 mM NaCl,
10 mM NaH2PO4], 0.05 % Tween 20, 1 % non-fat-dried milk) for 30 min at room temperature
on the rocker. Per gel 4 ml primary antibody solution in blocking buffer was applied (antibody
dilution see Table 16) and incubated for 90 min at room temperature on the rocker. Afterwards,
the membrane was washed three times for 5 min in 50 ml PBS/Tween 20 (1x PBS pH 7.4,
0.05 % Tween 20) washing solution. The primary antibody was detected by incubating the

53
membrane with the appropriate secondary antibody in a 1:5000 dilution in 50 ml washing
solution for 60 min at room temperature on the rocker. All used secondary antibodies are
coupled with a horse reddish peroxidase that can react with luminol. Luminol in its di-anionic
state reacts with O2 and emits light detected by a camera. The incubated membrane was then
washed two more times in washing buffer. A 1:1 mixture of 3 ml from each luminol solution
was added to the membrane and incubated for 1 min. Luminescence pictures were taken with
the LAS-3000 mini.
Table 16: Antibody list.
Primary-antibody epitope Antigen [kDA] Dilution Secondary antibody
α-Alp 64 1:500 α-Mouse
α-Chm7 (K109 H2) 52.8 1:250 α-Rabbit
α-c-myc (9E10) 18.6 1:1000 α-Mouse
α-Did2 (K120 H2) 23.1 1:500 α-Rabbit
α-Dpm1 30 1:500 α-Mouse
α-haemagglutinin (HA) 3.5 1:500 α-Mouse
α-Ilv2 (K15) 75 1:1000 α-Rabbit
α-Ist1 (K117 H2) 37.5 1:500 α-Rabbit
α-Mos10 (K12 H2) 25.8 1:1000 α-Rabbit
α-Pep12 33 1:1000 α-Rabbit
α-Pma1 99 1:1000 α-Rabbit
α-sfGFP 27 1:2000 α-Rabbit
α-Snf7 (K43 H2) 27 1:2000 α-Rabbit
α-Ste6 145 1:200 α-Rabbit
α-Vps2 (K83 H2) 26.3 1:1000 α-Rabbit
α-Vps20 (K123 H2) 25.6 1:200 α-Rabbit
α-Vps24 (K76 H2) 26.2 1.1000 α-Rabbit
2.6 Microbiological methods
2.6.1 S. cerevisiae genomic DNA extraction (for Western Blot) A yeast colony was picked from a freshly streaked out plate and inoculated in 3 ml YPD,
incubating overnight at 30 °C and 100 rpm. The stationary cells are diluted in 20 ml fresh YPD
and grown for about 2 h. After measuring the OD600, about 4 OD cells were harvested at

54
3000 rpm for 2 min at room temperature in a Duran tube. The cells were washed in 5 ml NaN3,
and the pellet was resuspended in 100 µl lysis buffer (50 mM HEPES pH 7.5, 0.3 M Sorbitol,
10 mM NaN3 + 1:100 E-Mix [0.017 g PMSF/ml + 10 µl PB Mix/ml] and 1:1000 P-Mix). After
adding glass beads to create a slurry solution, the mixture was vortexed for 5 min in the vibrax
at 4 °C. To the lysate, 150 µl of 2x SDS sample buffer with 100 mM DTT was added, and the
Duran tube was placed in a water bath for 15 min at 50 °C. The liquid was taken off the glass
beads and stored at -20 °C for further use.
2.6.2 Yeast transformation Yeast transformation was performed according to Gietz et al. using the lithium acetate method
(Gietz and Schiestl, 2007). 3 ml YPD were inoculated with a single yeast colony from a freshly
streaked out plate and grown overnight at 30 °C and 100 rpm on a shaker. The yeast culture
was diluted in 50 ml fresh YPD and grew an additional 4 h to reach exponential growth (OD600
around 1). Since the transformation mixture contained 50 µl ssDNA, the appropriate number of
cells to be harvested was calculated. It was estimated that the UV/Vis spectrometer measures
an OD600 to cell ratio of
𝑂𝑂𝑂𝑂600 𝑜𝑜𝑜𝑜 1 ≈ 3 ∗ 107 𝑐𝑐𝑐𝑐𝑐𝑐𝑐𝑐𝑐𝑐/𝑚𝑚𝑐𝑐
and that the optimal DNA to cell ratio for a transformation mixture would be
𝑐𝑐𝑐𝑐𝑂𝑂𝑠𝑠𝑠𝑠 𝑜𝑜𝑜𝑜 37.5 µ𝑐𝑐 𝑜𝑜𝑜𝑜𝑓𝑓 1 ∗ 108 𝑐𝑐𝑐𝑐𝑐𝑐𝑐𝑐𝑐𝑐
≡ 50 µ𝑐𝑐 𝑜𝑜𝑜𝑜𝑓𝑓 1.33 ∗ 108 𝑐𝑐𝑐𝑐𝑐𝑐𝑐𝑐𝑐𝑐.
Combining the two equations leads to the following term that was used for all transformations
1.33 ∗ 108 𝑐𝑐𝑐𝑐𝑐𝑐𝑐𝑐𝑐𝑐
𝑂𝑂𝑂𝑂600 (𝑚𝑚𝑐𝑐𝑚𝑚𝑐𝑐𝑚𝑚𝑓𝑓𝑐𝑐𝑚𝑚) ∗ 3 ∗ 107 𝑐𝑐𝑐𝑐𝑐𝑐𝑐𝑐𝑐𝑐𝑚𝑚𝑐𝑐
= 𝑉𝑉𝑜𝑜𝑐𝑐𝑚𝑚𝑚𝑚𝑐𝑐 [𝑚𝑚𝑐𝑐].
The appropriate volume of yeast cell culture was harvested at 3000 g for 2 min at room
temperature and washed once with 5 ml dH2O. In the meantime, a 1 ml aliquot of ssDNA in
TE-buffer (10 mM Tris-Cl [pH 8], 1 mM EDTA) was boiled for 5 min at 95 °C and chilled on
ice water. A transformation mix stock solution was prepared for each yeast transformation (plus
one additional sample) (Table 17).

55
Table 17: Transformation mixture.
Compound Volume [µl]
PEG 4000 (50 % (w/v)) 240
LiAc 1.0 M 36
Single stranded carrier DNA (2.0 mg/ml) 50
Total volume 336
Plasmid or PCR amplificated DNA 1 - 2 or 45
The transformation mixture was added to the yeast cell pellet, and the plasmid or PCR mixture
was added and vortexed until no further cell debris or pellets were visible. The entire solution
was incubated for 40 min at 42 °C in a shaker at 100 rpm. After incubation, the cells were
harvested at 3000 g for 2 min at room temperature. The pellet was resuspended in 200 µl sterile
water and distributed on a YPD plate so that half of the plate was covered with the entire
solution and the other half contained a smeared outcrop. After incubation overnight at 30 °C,
the plate was replicated on a replica plate containing either G418 as a kanamycin marker or
single drop-out media for -His or -Try auxotrophy and incubated for 3 - 4 days at 30 °C.
2.6.3 E. coli transformation 75 µl of competent BL21(DE3) E. coli cells were thawed on ice before 1 - 2 µl plasmid DNA
was added and subsequently incubated on ice for 45 min. Cells were then heat shocked at 42
°C for 45 s in a pre-heated water bath and chilled on ice again. Adding 500 µl LB-Medium to
the solution and incubating the cells for 90 min at 37 °C while shaking in an incubator ensures
antibiotic resistance development. 200 µl solution were pipetted on antibiotic-containing LB
agar plates and incubated overnight at 37 °C.
2.7 Antibody Purification
2.7.1 Protein expression in E. coli One colony of E. coli cells containing a plasmid for protein overexpression was incubated in
10 ml LB/Kan (10 µl of 30 mg/ml stock solution) or LB/Amp (20 µl stock solution) in a 100 ml
Erlenmeyer flask overnight at 37 °C, shaking at 100 rpm. The saturated overnight culture was
diluted 1:50 in 1-liter auto-induction media/kan (1 ml stock solution) or media/amp (2 ml stock
solution) according to Studier (Studier, 2014) (Table 18).

56
Table 18: Autoinduction medium according to Studier.
Autoclave: / 1 l
Phosphate buffer (pH 7.2) 7.5 g Na2HPO4 · 2 H2O 3 g KH2PO4
Tryptone 20 g
Yeast Extract 5 g
NaCl 5 g
50 % w/v glucose 1 ml (0.05 %)
Filter sterilize
60 % v/v glycerol 10 ml (0.5 %)
10 % w/v lactose 20 ml (0.2 %) or 2 g powder
The culture was incubated at 37 °C and 100 rpm until an OD600 of 0.6 - 0.8 was reached. 1 ml
sample was taken out, which served as a non-induced control (NC). The temperature was set to
25 °C allowing the culture to cool down slowly, and after reaching the set temperature, another
1 ml sample was taken as an induced control (IC) while the rest of the culture was incubating
overnight. The cell culture was harvested at 4000 g in 370 ml Beckmann tubes in a JA10 rotor
for 10 min. The cell pellets were combined in a 50 ml Falkontube and either immediately used
or stored at -80 °C.
2.7.2 Lysing E. coli cells The pre-cooled piston, cylinder, and valves were prepared for French press lysis following the
manufactures guide. The frozen cell pellet in 50 ml Falkontube was thawed on ice for about
15 min and weighted. The pellet was then resuspended in 10 ml/1 g wet weight of lysis buffer
(20 mM NaH2PO4, 1 M NaCl + 1:100 E-Mix, 1:1000 P-Mix, 1:1000 RNase A, 1:1000 DNase I,
5.8 mM MgCl2) up to 40 ml before applying it to French press. Cells were lysed by pushing the
solution with the help of the piston through the cylinder with a constant pressure of 900 psi into
a new Falkontube on ice. The needle valve and knob were constantly adjusted to remain lysate
flow at around 900 psi pressure. The cell solution was treated by French press until visibly less
turbid, while lysing success was also checked under a light microscope. As a control, 50 µl cell
lysate (CL) was taken out and stored for SDS PAGE. The cell lysate solution was centrifuged
at 10.000 g and 4 °C for 20 - 30 min in Beckmann tubes (max 40 ml) using the JA 30.50Ti
rotor. The supernatant was carefully transferred into a new tubed and chilled on ice while a
50 µl sample was taken out that served as a cell supernatant (CS) control.

57
2.7.3 Protein purification from E. coli cells The amount of Qiagen Ni2+-NTA resin (or similar product) needed for protein purification
depends on the amount of protein in the culture, whereas less resin is typically better in terms
of purity. According to the manual of most Ni2+-NTA resin, the binding capacity should be in
the 50 mg/ml range. His tagged proteins were purified using a 50 % slurry Ni-NTA agarose
bead solution stored in ethanol equilibrated in lysis buffer, freshly prior use. For 1 l cell culture,
4 ml 50 % slurry solution was used corresponding to 2 ml bead resin for binding up to 100 mg
His tagged proteins. Protein binding was accomplished by combining the Ni2+-NTA resin slurry
to the lysate in a tube and incubating the mixture for 1 h at 4 °C while gently shaking on a
rocker. As an alternative, the Ni2+-NTA agarose solution was filled into a syringe, and the lysate
solution was force pumped through the resin to ensure binding overnight at 4 °C. Afterwards,
the resin was centrifuged for 5 min at 700 g to pellet the bead. The supernatant was retained
and served as a flowthrough sample (FT). The Ni2+-NTA resin was washed three times with
wash buffer (lysis buffer + 20 mM imidazole), and each washing step flowthrough was also
collected (W1-W3). Protein was eluted with elution buffer (lysis buffer + 250 mM imidazole)
for a total of four times each time with one column volume of the applied resin (E1-E4). All
samples were checked on an SDS PAGE to verify protein purification and assess each elution
step’s purity.
2.7.4 Protein Dialysis Dialysis membranes (SpectraPor1 = MWCO 8 kDa) were cut in 10 cm long (1 ml: 7 cm) pieces
for purified protein dialysis. The membranes were first soaked for 30 min in dH2O before
clamps were attached to form membrane tubes. Samples were loaded into dialysis membrane
tubes and placed into dialysis buffer (100 mM MOPS, 300 mM NaCl) 100x sample volume (1 l
for 10 ml). The entire bucket was stirred at low speed in the cold room for three times 1 h and
then overnight, exchanging the dialysis buffer during each step. After dialysis, the protein was
retained for assaying binding, and a sample was stored that served as a dialysis control (Dia).
2.7.5 Affigel purification Depending on the application, affigel-10 or affigel-15 were used to bind the antigen. Affigel-
10 is best for binding proteins near or below their isoelectric point, while affigel-15 is better for
binding proteins near or above their isoelectric point. For coupling at or close to neutral pH,
affigel-10 is better for proteins with a pI of 6.5 to 11.0, while affigel-15 is better for proteins
with a pI less than 6.5. According to the affigel resin manufactures guide, the binding capacity

58
should be in the 30 mg/ml range, for which mostly 1 - 2 ml 50 % slurry solution of affigel was
used. The resin was washed with two column volumes of ice-cold dH2O and once with the
specific buffer used for protein binding that should be equal to the used dialysis buffer (0.1 M
MOPS pH 7.4 + 300 mM NaCl). It is crucial that the entire preparation process does not exceed
20 min before protein coupling and that the gel bed was kept wet at all times. Purified and
dialyzed proteins were mixed with prepared affigel and incubated while agitating on a rocker
for 4 h at 4 °C. For affigel blocking, 0.1 ml 1 M ethanolamine HCl (pH 8) per ml gel was used
and allowed to block for 1 h at 4 °C. The gel was transferred to a new column and washed with
dH2O or coupling buffer until the gel was free of reactants (detected by OD280, Bradford Assay).
2.7.6 Antibody purification The affigel coupled protein resin was washed with three column volume elution buffer (3.5 M
MgCl2 in 1x PBS pH 7.4) and subsequently washed with three column volumes of 1x PBS
pH 7.4. The gel was then blocked with one column volume of 1 mg/ml BSA in 1x PBS pH 7.4
solution for 30 min at room temperature. Crude antibody serum was allowed to thaw on ice and
was applied to the gel as a 50 ml antibody solution as a 1:10 solution of 5 ml cleared antibodies
in 45 ml 1x PBS pH 7.4. A peristaltic pump was used for binding antibodies to the affigel
associated proteins in the cold room. With a set speed of 1 ml/min, the entire antibody solution
was pumped about 2 - 3 times through the column over the gel to ensure sufficient binding.
Afterwards, the gel was washed with 10 column volumes of BSA/PBS solution, and the bound
antibodies were eluted with 4 - 5 column volumes of elution buffer. Each one-column volume
of eluant was collected individually and immediately dialyzed in 100x volume of 1x PBS pH
7.4 at 4 °C in dialysis membranes. The gel was washed with 10 column volumes of 1x PBS pH
7.4 and stored at 4 °C soaked in 10 mM sodium acetate in 1x PBS pH 7.4.
2.8 Cell fractionation
2.8.1 Sucrose Gradient For a sucrose density gradient, 50 OD600 cells of an exponential cell culture were harvested in
Falkontubes for 5 min at 4000 g by centrifugation and washed in 5 ml NaN3 utilizing Duran
tubes. The pellet was resuspended in 200 µl SPBS10 buffer consisting of 1x PBS pH 7.4 and
10 % w/w sucrose (see Table 19) with the additional proteinase inhibitors (1:100 E-Mix; 1:1000
P-Mix). The cells were then lysed in a vibrax at 4 °C for 5 min at full speed via glass beads.
Additional 400 µl SPBS10 were added, and approximately 500 µl lysate was transferred to an

59
Eppendorf tube. The lysate was centrifuged for 10 min at 4 °C at 2500 rpm to remove cell
debris. For better comparison to other experiments, sucrose gradients were performed using 1x
PBS pH 7.4 as a standard buffer solution by adding different sucrose amounts (Table 19).
Table 19: Table of used sucrose solutions.
Solution [% mas] Density [kg/m3] [g] Total/200 ml [g] Sucrose/200 ml
SPBS10 10 1.0381 207.6 20.8
SPBS20 20 1.0810 216 43.2
SPBS36 36 1.1562 230.8 83.1
SPBS53 53 1.244 248.8 131.8
The % mas corresponds to the equation: % 𝑚𝑚𝑚𝑚𝑐𝑐 = 270 ∗ % (𝑤𝑤𝑤𝑤𝑣𝑣𝑣𝑣𝑣𝑣)
270 + % (𝑤𝑤𝑤𝑤𝑣𝑣𝑣𝑣𝑣𝑣)
To ensure identical buffer conditions, the appropriate amount of sucrose was weighted and
dissolved in dH2O and filled up with 20x PBS pH 6.3 buffer solution. The solutions were filter
sterilized through a 0.45 µm filter and stored at 4 °C. Before using 1 mM of DTT was added to
all solutions. Sucrose gradient was performed in an ultra-centrifuge that required special
centrifugation tubes with a volume of 5 ml. Carefully 1.7 ml of each SPBS solution beginning
with SPBS53, then SPBS36 and SPBS20 were added to ensure a layer-like filling of the tube.
The tube was sealed by Parafilm and stored horizontally for approximately 3 h at 4 °C to
cultivate a continuous gradient. After preparing the cell lysate and ensuring a constant gradient,
400 µl of the gradient was carefully removed and replaced with 400 µl of lysate solutions in the
upright centrifugation tube. The ultracentrifuge was loaded with four balanced centrifugation
tubes in a swinging rotor, running for 16 h at 4 °C at 100,000 g (37,000 rpm on “avg.” setting
for the Rotor number 28 at slowest acceleration and deceleration). After centrifugation, 18
fractions of 280 µl each were carefully pipetted from top to bottom of the gradient. Each
fraction was mixed with 280µl of 2x SDS sample buffer with 100 mM DTT and heated for
5 min at 95 °C.
2.8.2 Flotation For a flotation experiment, 20 OD600 cells of an exponential cell culture were harvested in
Falkontubes for 5 min at 4000 g by centrifugation and washed in 5 ml NaN3 utilizing Duran
tubes. The pellet was resuspended in 200 µl 1x PBS pH 7.4 buffer with the additional proteinase
inhibitors (1:100 E-Mix; 1:1000 P-Mix). The cells were then lysed in a vibrax at 4 °C for 5 min

60
at full speed via glass beads. Additional 200 µl 1x PBS pH 7.4 were added, and approximately
300 µl lysate was transferred to an Eppendorf tube. The lysate was centrifuged for 5 min at 4 °C
and 2500 rpm to remove cell debris. 175 µl of cleared lysate supernatant was transferred to
350 µl of a 60 % OptiPrepTM solution for a final OptiPrepTM concentration of 40 %. Carefully
a second layer of 840 µl 30 % OptiPrepTM solution (420 µl 60 % OptiPrepTM + 420 µl 1xPBS
pH 7.4) was placed on top of the first layer. The second layer was coated with 140 µl 1xPBS
pH 7.4, and the entire gradient was applied to ultra-centrifugation for 2 h at 4 °C, spinning at
100,000 g (Discovery M120SE Micro-Ultracentrifuge; Rotor: S45A = 45,000 rpm, set to
slowest acceleration and deceleration). After centrifugation, six fractions of 250 µl each were
carefully removed from the gradient from top to bottom, mixed with 2x SDS sample buffer
with 100 mM DTT, and boiled for 5 min at 95 °C.
2.8.3 Differential centrifugation For differential centrifugation, 20 OD600 cells of an exponential cell culture were harvested in
Falkontubes for 5 min at 4000 g by centrifugation and washed in 5 ml NaN3 utilizing Duran
tubes. The pellet was resuspended in 200 µl 1x PBS pH 7.4 buffer with the additional proteinase
inhibitors (1:100 E-Mix; 1:1000 P-Mix). The cells were then lysed in a vibrax at 4 °C for 5 min
at full speed via glass beads. Additional 600 µl 1x PBS pH 7.4 were added, and approximately
700 µl lysate was transferred to an Eppendorf tube. The lysate was either directly applied for
differential centrifugation or was incubated with different additives to study various
perturbation effects. Afterwards, the lysate was centrifuged for 15 min at 4°C and 13,000 rpm.
The pellet was retained, and the supernatant was transferred to a new tube and applied to
ultracentrifugation at 100,000 g for 1 h at 4 °C. After centrifugation, the new pellet and
supernatant were put on ice, and all three samples (pellet from 13,000 rpm spin (P13) and
supernatant and pellet from 100,000 g spin (S100 & P100) were brought to the same volume.
After intense mixing to ensure sufficient pellet resuspension in 1x PBS pH 7.4 buffer before 2x
sample buffer with 100 mM DTT was applied, and the solution was boiled for 5 min at 95 °C.
2.9 Protein purification from yeast cells
2.9.1 Co-Immunoprecipitation For Co-Immunoprecipitation (Co-IP) experiments, 50 OD600 cells of an exponential cell culture
were harvested in Falkontubes for 5 min at 4000 g by centrifugation and washed in 5 ml 1x
PBS pH 7.4 utilizing Duran tubes. The pellet was resuspended in 200 µl PBS pH 7.4 containing

61
1:1000 E-Mix, further named PBS+, and lysed in a vibrax at 4 °C for 5 min at full speed via
glass beads. Additional 600 µl PBS+ were added, and approximately 700 µl lysate solution was
transferred to an Eppendorf tube. DSP (dithiobis[succinimidylpropionate]) was used for protein
crosslinking. The reagent contains a homo-bifunctional N-hydroxysuccimide ester (NHS ester)
crosslinker that reacts with primary amines with an additional eight-carbon spacer arm
cleavable by reducing agents, thus enabling a non-permanent crosslinking. Because of the
lipophilic nature, DSP was dissolved in DMSO (Dimethyl sulfoxide) (10 mg/200 µl for
125 mM), and 1:50 dilution was applied to the lysate for a final crosslinker concentration of
2.5 mM. The solution was incubated for 1 h at 4 °C on a rocker. The crosslinking reaction was
stopped by quenching with 100 mM Tris-HCl (1 M, pH 8.0 stock solution) since it contains a
primary amine, and membranes were dissolved by 1 % Triton X-100 (20 % stock solution). The
reaction was incubated for 15 min at 4 °C on a rocker and then centrifuged for 10 min at
2500 rpm in the cold room. The supernatant was carried over to a new tube, and a small amount
of approximately 50 µl was taken as an input control, and immediately 50 µl of 2x SDS sample
buffer with 100 mM DTT was added and heat-treated for 5 min at 95 °C. The supernatant was
incubated with 10 µl antibody solution for 1 h at 4 °C on a rocker. Afterwards, 80 µl of a 50 %
slurry protein A solution in 1x PBS pH 7.4 was added and again incubated for 1 h at 4 °C on a
rocker to allow protein A antibody binding. The solution was repeatedly washed with 1 ml pre-
chilled PBS+ with slow centrifugation of 100 g for 30 s at room temperature. After three
washing steps, the protein A beads were pelleted at full speed for 30 s and resuspended in 100 µl
PBS+ and 100 µl 2x SDS sample buffer without DTT after removing the supernatant. The beads
were boiled for 5 min at 95 °C, and the supernatant was afterwards transferred to a fresh tube.
DTT to 50 mM final concentration was added, and the solution was again heat-treated for 5 min
at 95 °C. Sequential boiling led to more negligible amounts of cleaved-off antibodies while
high yields of crosslinked co-immunoprecipitated proteins were maintained.
2.9.2 Crosslinking experiment For Crosslinking experiments, 40 OD600 cells of an exponential cell culture were harvested in
Falkontubes for 5 min at 4000 g centrifugation and washed in 5 ml 1x PBS pH 7.4 or dH2O
utilizing Duran tubes. The pellet was resuspended in 200 µl PBS containing 1:1000 E-Mix,
further named PBS+, and lysed in a vibrax at 4 °C for 5 min at full speed via glass beads.
Additional 600 µl PBS+ were added, and approximately 700 µl lysate solution was transferred
to an Eppendorf tube. For protein crosslinking, DSS (disuccinimidyl suberate) was used. The
reagent contains a homo-bifunctional N-hydroxysuccimide ester (NHS ester) crosslinker that

62
reacts with primary amines for permanent protein crosslinking. Because of its lipophilic nature,
DSS was dissolved in DMSO (7.4 mg/100 µl for 200 mM), and 1:50 dilution was applied to
the lysate for a final crosslinker concentration of 4 mM. The solution was incubated for 1 h at
4 °C on a rocker. The crosslinking reaction was stopped by quenching with 100 mM Tris-HCl
(1 M, pH 8.0 stock) since it contains a primary amine, and membranes were dissolved by 1 %
Triton X-100 (20 % stock). The reaction was incubated for 15 min at 4 °C on a rocker and then
centrifuged for 10 min at 12,000 g at 4 °C. The supernatant was carried over to a new tube, and
a small amount of approximately 50 µl was taken as an input control, and immediately 50 µl of
2x SDS sample buffer with 100 mM DTT was added and heat-treated for 5 min at 95 °C. To
700 µl supernatant 26.2 µl 5 M NaCl (+ 175 mM) and 2.2 µl 5 M imidazole (+ 15 mM) was
added for buffer conditions of NaCl ≥ 300 mM and imidazole 10 – 20 mM. The supernatant
was then incubated with 25 µl of a 50 % slurry solution of Ni2+-NTA agarose beads equilibrated
in the same buffer for 1 h at 4 °C on a rocker. After incubation, the mixture was centrifuged for
1 min at 2500 rpm in the cold room, and 50 µl supernatant was saved for SDS PAGE analysis
of unbound protein. The solution was repeatedly washed with 1 ml pre-chilled PBS+ with slow
centrifugation of 100 g for 30 s. at room temperature. After three washing steps, the beads were
pelleted at full speed for 30 s. and resuspended in 50 µl buffer and 50 µl SDS buffer with
100 mM DTT after removing the supernatant. The beads were boiled for 5 min at 95 °C and
stored or applied for SDS PAGE analysis.
2.9.3 AEKTA purification For AEKTA purification 1-liter YPD was inoculated with a 3 ml yeast overnight culture and
was incubated at 30 °C and 100 rpm in a Fernbach flask. After cells reached exponential growth
(OD600 ≤ 1), the cell culture was harvested at 4000 g in three 350 ml Beckmann tubes for 10 min
at 4 °C. After centrifugation, the tubes were weighted to determine the pellet’s wet weight. The
pellet was then resuspended in 1x PBS pH 7.4 buffer, transferred to a 50 ml Falkontube and
pelleted again for 10 min at 4000 g and 4 °C. Centrifuge acceleration was set to 9 and
deceleration to 5 to inhibit turbulences inside the tube and get a sharper separation between the
pellet and the supernatant. The pellet was mixed with binding buffer 1x PBS pH 7.4 + 1:100 E-
Mix in a 1:1 ratio, and about half the volume was filled with acid-washed glass beads. Yeast
cells were then lysed in a Fast Prep24 at 4 °C for two times 1 min with 4 m/s speed and a 5 min
pause in between shaking to let the suspension cool down. A sample of 50 µl was taken and
mixed with 50 µl 2x sample buffer with 100 mM DTT for SDS PAGE analysis. The lysate was
incubated with 4 mM DSS crosslinker (200 mM = 7.4 mg/100 µl DMSO, 1:50 dilution) in a

63
Falkontube for 1 h at 4°C on a rocker. The crosslinking reaction was stopped by quenching with
100 mM Tris-HCl (1 M, pH 8.0) since it contains a primary amine, and membranes were
dissolved by 1 % Triton X-100 (20 %). The reaction was incubated for 15 min at 4 °C on a
rocker and then centrifuged for 15 min at 15,000 g and 4 °C in a 50 ml Beckmann tube. The
supernatant was carried over to a new tube, and 5 M NaCl (+ 175 mM) and 5 M imidazole
(+ 15 mM) were added for buffer conditions of NaCl ≥ 300 mM and imidazole 10–20 mM. The
pH was checked and adjusted to 7.4 if necessary, and afterwards, the solution was filtered
through a 0.45 µm filter. A small amount of approximately 50 µl was taken as an input control,
and immediately 50 µl of 2x SDS sample buffer with 100 mM DTT was added and heat-treated
for 5 min at 95 °C. The sample was then applied to the AEKTA start, and purification of
crosslinked proteins was achieved by pumping the solution over a 1 ml HisTrap™ Fast Flow
column. The application of lysed cells was monitored by measuring the UV of the flowthrough
over time. After applying the lysate, the column was washed with 20 column volumes or more
with a mixture of binding and elution buffer that contained 500 mM imidazole. Typically, the
elution buffer concentration was set to 10 %, corresponding to an imidazole concentration of
50 mM. Elution of proteins bound to the column was achieved by running a gradient of elution
buffer until 100 % buffer that equals 500 mM imidazole was reached, and the eluent was
collected in Eppendorf tubes.
2.10 Cycloheximide chase
100 ml YPD were inoculated with a yeast overnight culture and grown overnight at 30 °C and
gently shaking at100 rpm. For the cycloheximide chase, an exponential cell culture of OD600
between 0.6 – 0.8 was used. Before the experiment, a new cycloheximide stock solution was
prepared by diluting cycloheximide in DMSO to a final concentration of 50 mg/ml. 400 µl of
the new stock solution was pipetted to 100 ml culture for a working concentration of 200 µg/ml
cycloheximide and to initiate the cycloheximide chase. Cells were harvested at 0, 20, 40, 60,
80, and 100 min after cycloheximide treatment. In each cycle, a 5 OD600 culture was harvested
for 5 min at 4700 rpm, with acceleration and deceleration set to 9, at room temperature. The
cells were washed once in 5 ml 10 mM NaN3 and pelleted again at 3200 rpm for 2 min at room
temperature. The pellet was resuspended in 100 µl lysis buffer (50 mM HEPES pH 7,5, 0.3 M
Sorbitol, 10 mM NaN3, and 1:100 E-Mix) and lysed with glass beads for 5 min at max speed in
a vibrax. After lysing the cells, 300 µl lysis buffer with inhibitor was added to the beads, and

64
about 300 µl solution was transferred to a new tube. 2x SDS sample buffer with 100 mM DTT
was added and boiled for 5 min at 95 °C.
2.11 Fluorescence microscopy
A single yeast colony was diluted in 5 ml dH2O, and 50 or 100 µl of that solution was inoculated
to 5 ml SDcas (1 % casamino acids, 0.67 % yeast nitrogen base w/o amino acids + 50 µg/ml
Tryptophane & + 50 µg/ml Uracil) medium and incubated overnight at 30 °C and 100 rpm.
Glass slides were coated with 15 µl 0.5 mg/ml concanavalin A and allowed to dry for 20 min.
For fluorescence microscopy, an exponential cell culture of OD600 between 0.6 – 0.8 was used.
1 ml of the cell culture was transferred to a Duran tube and incubated for 1 min with 1 mg/ml
4,6-Diamidino-2-Phenylindol (DAPI). About 15 µl cell solution was pipetted to the concanavalin
A covered glass slide, covered with a glass lid, and allowed to settle before observing under the
microscope. One drop of immersion oil was applied to the glass cover before fluorescence
microscopy.
2.12 SILAC Experiments
For SILAC (stable isotope labeling with amino acids in cell culture) experiments, two cultures
were grown in separated flasks containing “heavy” and “light” minimal media. In general,
minimal media was prepared by weighing 6.7 g YNB and 50 mg of Ura, Trp, Ade, and His, and
60 mg Lys and 120 mg Leu for a 1 l culture. Cultures using conventional L-lysine and L-arginine
powder are referred to as the “light” culture, whereas for the “heavy” culture, the isotope
[13C6/15N2] L-lysine hydrochloride and [13C6/15N2] L-arginine hydrochloride was used (MW shift
from 182.7 g/mol to 190.7 g/mol for L-lysine and 210.7 g/mol to 220.7 g/mol for L-arginine).
For SILAC experiments, 1 l light and heavy medium was inoculated with a 3 ml or 50 ml yeast
overnight culture and incubated at 30 °C and 100 rpm in a Fernbach flask. After cells reached
exponential growth (OD600 ≤ 1), the cell culture was harvested in three 350 ml Beckmann tubes
for 10 min at 4000 g and 4 °C. After centrifugation, the pellets were then resuspended in 1x
PBS pH 7.4 buffer, transferred to a 50 ml Falkontube and pelleted again for 10 min at 4000 g
and 4 °C. The pellets were mixed with binding buffer 1x PBS pH 7.4 + 1:100 E-Mix and
combined before lysed in a Fast Prep24 with glass beads at 4 °C for two times 1 min with 4 m/s
speed and a 5 min pause in between shaking to let the suspension cool down. The mixed cell
lysate was either applied for co-immunoprecipitation or IMAC using AEKTA or batch method.

65
3 RESULTS
3.1 Finding interacting partners of ESCRT-III subunit Mos10
The Class E Vps protein Mos10 is seen as an associated ESCRT-III subunit whose pivotal role
in ESCRT-III complex formation, deformation, or overall functionality needs additional
insights to be adequately characterized. The idea here was to improve the protein’s purpose
inside or outside the established standard model by broadening Mos10’s interplay spectrum
with yet unknown interacting partners. The three distinctive methods used to find these Mos10
linked proteins were IMAC purification of histidine-tagged Mos10 (RKY2889), native Mos10
(RKY1558) purification by purified α-Mos10 antibodies, and immunoprecipitation of
superfolder GFP-tagged Mos10 (RKY3210) using α-GFP antibodies. Homologous
recombination was used for the tagged variants of Mos10 to add a purification-specific tag to
the c-terminal side of the protein. It is worth noticing that these mutants do not necessarily share
WT-like behavior visible by a different phenotype observed in succeeding experiments but also
become evident by a shift in the WB pattern of the crosslinking partners. Those patterns were
seen as protein-specific interacting patterns by fixing WT or tagged Mos10 to connecting
proteins by a crosslinker and should not change by the method applied. Crosslinkers like DSP
or DSS are chemical agents used to stabilize weak or transient protein to protein interactions in
a multimeric complex or pathway, allowing the purification and identification of interacting
partners. Once two or more proteins come in close proximity by interacting with each other,
the NHS esters located at both sites of a spacer arm of the crosslinker react with primary amines
of the involved proteins, thus linking them together and allowing for stabile purification.
Purified and crosslinked proteins were then separated by SDS PAGE and either visualized by
Coomassie or silver staining or transferred to a nitrocellulose membrane and displayed by a
target-specific antibody. With the help of mass spectrometry, enriched proteins associated with
pull-downed Mos10 were identified. Identifying multiple candidates between the used methods
allowed for comparing the quality of the purification process.
To further improve the identification of crosslinked proteins compared to background proteins
regularly being purified along with the affinity tagged ones, cells were labeled by SILAC.
Stable isotope labeling by amino acids in cell culture labels proteins by non-radioactive isotopes
inducing a mass shift, detectable by mass spectrometry. With the SILAC approach, the heavy
or non-heavy isotopes being pulled down should directly reflect the abundance of the protein,
indicating the detection quality of an actual or artificial crosslink.

66
3.1.1 IMAC purification of His-tagged Mos10 One of the first experiments performed to visualize Mos10 specific interacting partners was
purifying histidine-tagged Mos10 in a batch experiment using Ni2+-NTA beads. The principle
of IMAC (immobilized metal affinity chromatography) purification is the affinity of histidine
to bind the immobilized nickel ions on the beads and allow selective purification of proteins
tagged with histidine. If the tagged proteins are being crosslinked with other proteins, this
should result in a unique crosslink pattern for the purified protein. To visualize Mos10-6His
purification and crosslinking pattern building, Figure 9 provides a step-by-step sample pull-
down experiment result by Western Blot analysis by immunoblotting with α-Mos10 antibodies.
Figure 9: Identification of Mos10 interacting partners by a characteristic WB pattern.
IMAC purification of 6His tagged- (RKY2889) and WT-Mos10 (RKY1558) in a batch experiment utilizing Ni2+-
NTA His-tag affinity beads. The characteristic crosslinking pattern of Mos10-6His by α-Mos10 antibodies is
highlighted and compared to the WT Mos10 pattern in the black rectangle of lanes 10 & 18. M: NEB Color Pre-
stained Protein Standard (11 - 245 kDa); Lane 1: WT extract; Lane 2: Δ8 extract; Lane 3 & 11: Lysate debris;
Lane 4 & 12: Lysate SN; Lane 5 & 13: 500 g pellet; Lane 6 & 14: 500 g SN; Lane7 & 15: Unbound IMAC SN;
Lane 8 & 16: 1st washing step; Lane 9 & 17: 2nd washing step; Lane 10 & 17: IMAC purified protein solution.
Arrows: Black: WT-Mos10; Grey: Mos10-6His; White: Crosslinks.
As a control for proper antibody functionality and detection of the protein of interest, Lane 1
and 2 contain a WT (RKY1558) and a Δ8 (RKY2844) strain sample, which detect WT Mos10
M 1 2 3 4 5 6 7 8 9 10 11 12 13 14 15 16 17 18
22
25
32
46
58
80
100
135190kDa
RKY1558RKY2889
M 10 18

67
right below the 32 kDa mark by α-Mos10 antibodies, highlighted by a black arrow, that is not
present in the deletion strain. The lanes 3 to 10 and 11 to 18 contain samples (OD = 0.2) of the
purification process of RKY2889 with Mos10-6His and RKY1558 with WT Mos10. The cell
cultures were lysed, the supernatant incubated with Triton X-100 and crosslinker before being
quenched to stop the crosslinking process and centrifuged to remove larger cell debris, seen in
lanes 3 – 6 and 11 to 14, respectively. The supernatant was subsequently incubated with the
IMAC coated beads and twice washed before any protein’s affinity attached to the ion beads
were cleaved off by boiling (lanes 7 – 10 and 15 – 18).
Within the experiment, enrichment of a band at around 34 kDa becomes visible in the RKY2889
lanes that peak out in lane 10, which contains all proteins affinity bound to the Ni2+ beads,
including purified Mos10-6His. Between 100 kDa and 70 kDa, additional bands become more
abundant along the purification process of Mos10-6His that represent the crosslinks co-purified
by being covalently attached to Mos10 by DSS detectable by the α-Mos10 antibody also
peaking in lane 10. Compared to the bands visible in lane 10, the WT strain shows no sign of
purification of WT Mos10 in lane 18. By comparing the WT Mos10 bands in lanes 14 and 15,
the amount of Mos10 incubated with the beads after the centrifugation is equal to the amount
found in the fraction of unbound IMAC supernatant. Further, no enrichment of crosslinker
being pulled downed was observable, as highlighted by comparison in the black rectangle
enclosing the 100 to 70 kDa area of lanes 10 and 18. The experiment ensures for target-specific
enrichment of Mos10-6His and any crosslinked protein to be purified by the IMAC purification.
3.1.2 AEKTA purification of His-tagged Mos10 Although suitable for purifying minor cell culture sizes up to 50 OD, the batch method relies
on the ability of the Ni-NTA beads to come in contact with the histidine-tagged proteins to be
attached while being incubated on a rocker. In larger scales with 1000 OD or more, a column
filled with Ni-NTA beads was used, and the lysed and processed cell culture was forced through
the column either by a peristaltic pump or an AEKTA system. The advantage of an AEKTA
purification system is the ability to monitor each step in the purification process of the desired
protein to ensure high yield and a better signal-to-noise ratio since the elution of the affinity-
captured protein can be tightly timed. An example of an isocratic AEKTA purification of
Mos10-6His (RKY2889) can be seen in Figure 10. The diagram serves as a purification protocol
in which the UV detector placed behind the column visualizes the amount of protein passing
the column. Visible by the blue line’s overall peak amplitude between 5 and 35 ml, most of the
protein from the cell lysate flows through the Ni-NTA column without binding to the beads.

68
Figure 10: AEKTA purification of Mos10-6His from S. cerevisiae culture with Ni-NTA column.

69
After applying approximately 35 ml cell lysate, the UV intensity in mAU decreases, indicating
that the entire sample has passed the system and the column. In the next phase, 20 % buffer B
is applied to the system containing 500 mM imidazole for an effective concentration of 100 mM
imidazole indicated by the purple line. The imidazole molecules compete with low-affinity
impurities on the column and are used to wash the column from background proteins, monitored
by an increase in UV intensity, forming a peak at around 39 ml. Afterwards two elution steps
are used to elute the affinity attached proteins from the column with an imidazole concentration
of 250 mM (50 % buffer B) and 500 mM (100 % buffer B) sufficient to cleave any associated
protein from the Ni-NTA beads. At any given point during the purification experiment, samples
are collected following the AEKTA fraction nomenclature marked as red lines at the
corresponding ml position on the x-axis. Successful affinity purification was verified by WB
analysis with α-Mos10 antibodies and Coomassie staining of the SDS PAGE seen in Figure 11.
Figure 11: Isocratic AEKTA purification of Mos10-6His using a Ni-NTA column.
IMAC purification of 6His tagged-Mos10 (RKY2889) with the AEKTA system utilizing a Ni2+-NTA column.
Visualization of the Mos10 characteristic crosslink WB pattern by α-Mos10 antibodies and Coomassie staining of
AEKTA specific samples. Samples were concentrated using an AMICON filter with a 10 kDa cut-off. M: NEB
Color Pre-stained Protein Standard (11 - 245 kDa); Lane 1: WT extract; Lane 2: Δ8 extract; Lane 3: Lysate debris;
Lane 4: Sample loaded on AEKTA; Lane 5: Flowthrough; Lane 6: T2 (wash fraction with 20 % Buffer B); Lane
7: T4 fraction (50 % Buffer B); Lane 8: T6 fraction (100 % Buffer B); Lane 9: concentrated T4 fraction; Lane
10: concentrated T6 fraction Lane 11: T2; Lane 12: T4; Lane 13: T6; Lane 14 & 16: empty; Lane 15:
concentrated T4; Lane 17: concentrated T6. Arrows: Black: WT-Mos10; Grey: Mos10-6His.
M 1 2 3 4 5 6 7 8 9 10 M 11 12 13 14 15 16 17
32
46
58
80100
135190kDa
25
22
32
46
58
80100
135190
kDa
245
25
22

70
The results of the WB analysis reveal that most of the Mos10-6His protein detected at the
34 kDa marked with a grey arrow gets lost along the purification process as the band tends to
fade from lanes 3 to 5. An estimation of the protein quantity from the signal intensites of the
protein bands shows that merely half the amount of Mos10-6His harvested from lysed cell
culture is applied to the AEKTA system. 50 % again get lost in the flowthrough and an
additional 20 % in the T2 wash fraction with 20 % (100 mM) buffer B. Although purification
of Mos10-6His seemed pretty inefficient and needs further adjustment in upcoming
experiments, the detection of Mos10-6His crosslinked proteins was successful and followed the
same pattern as previously described in the batch experiment. Furthermore, the crosslinking
pattern between 100 and 70 kDa becomes prominent in the T4 and T6 fraction with higher
imidazole (250 mM and 500 mM) concentrations highlighted with the black rectangle in lanes
7 and 8. Since the experiment initially sought to identify and purify Mos10-6His interacting
partners, the method applied seems suitable for purifying Mos10-6His and crosslinks in
separate fractions due to the distinct behavior towards imidazole.
AMICON filters with a cut-off of 10 kDa were used to reduce sample volume and concentrate
sample proteins, so that higher protein quantities can be loaded onto the gel for subsequent MS
analysis. In lanes 9 and 10, samples of the AMICON concentrated T4 and T6 AEKTA fractions
were loaded on the WB to verify successful sample concentration compared to lanes 7 and 8.
One-fifth of the volume was loaded onto the gel, whereas the total sample volume was reduced
from 3 ml after AEKTA elution to 150 µl after AMICON concentration resulting in a theoretical
band intensity increase ratio of 4:1. ImageJ calculation reveals a protein band intensity ratio of
2:1 for the concentrated crosslink samples, implying that approximately 50 % of the crosslinks
are gone by being stuck onto or precipitated on the filter during the concentration process.
Coomassie staining was used to visualize overall protein abundance and to identify the WB-
specific crosslinking pattern of Mos10-6His interacting partners. Most of the proteins are being
washed off the column in the T2 washing step seen in lane 11, which leaves almost no visible
bands in the T4 and T6 fractions in lanes 12 and 13, considered to contain the crosslinks if
compared with the WB. In contrast, lanes 15 and 17 contain the concentrated T4 and T6
fractions, showing vast overall protein abundance. The known crosslinking pattern remains
hidden behind background bands and thus is not visible on the Coomassie-stained gel. Due to
the loading calculations applied earlier, the band at 34 kDa, although migrating at the proper
distance for Mos10-6His, is most definitely a background band since most of the Mos10-6His
amount is held back in preceding fractions, leaving Mo10-6His levels below the detection limit.

71
For MS analysis, a gradient-based elution method was chosen to improve Mos10-6His
purification and ensure tighter separation of more abundant proteins from the crosslinked
proteins. The experiment follows the same workflow as the isocratic purification attempt except
that the imidazole concentration in the T2 washing step was reduced from 20 to 10 % buffer B,
corresponding to an imidazole concentration of 50 mM. For the gradient elution, the starting
concentration of 50 mM was constantly increased until the final concentration of 500 mM
imidazole at 100 % buffer B was reached. During the gradient elution, 30 samples à 500 µl
from fraction T4 to T33 were collected, and each fraction’s starting and end imidazole
concentration can be seen in Table S 2.
The AEKTA diagram in Figure S 2 protocols the purification process, in which a broad peak
of the blue line again indicates the start and endpoint of cell culture application by monitoring
the protein content unbound to the Ni-NTA column. In contrast, the blue peak UV signal in the
washing step decreased in height compared to the one seen in Figure 10 due to the reduced
imidazole concentration of 50 mM instead of 100 mM. Lastly, the purple gradient concentration
indicator shows a steep rising path following the continuous increase in buffer B than the step-
wise rise within the isocratic purification attempt.
All samples collected during the gradient purification process were applied to WB analysis
(Figure 12) and checked by Coomassie staining of the SDS PAGE gel (Figure 13).
Figure 12: WB results of a gradient AEKTA purification of Mos10-6His using a Ni-NTA column.
IMAC purification of 6His tagged-Mos10 (RKY2889) with the AEKTA system utilizing a Ni2+-NTA column.
Visualization of the Mos10 characteristic crosslink WB pattern by α-Mos10 antibodies. M: NEB Color Pre-stained
Protein Standard (11 - 245 kDa); Lane 1: WT extract; Lane 2: Δ8 extract; Lane 3: Lysate debris; Lane 4: Sample
loaded on AEKTA; Lane 5: Flowthrough; Lane 6: T2 (wash fraction with 10 % Buffer B); Lane 7-36: AEKTA
samples T4-T33 (10 % to 100 % Buffer B gradient). Arrows: Black: WT-Mos10; Grey: Mos10-6His. Lanes 4 –
6: OD = 0.2 and lanes 7 – 39: OD = 1.
32
46
58
80100
135190
kDa245
25
22
M 1 2 3 4 5 6 7 8 9 10 11 12 13 14 15 16 17 18 19 20 21 22 23 24 25 26 27 28 29 30 31 32 33 34 35 36 37
T12 T21 T22 T23

72
Figure 13: Gradient AEKTA purification of Mos10-6His using a Ni-NTA column Coomassie staining.
IMAC purification of 6His tagged-Mos10 (RKY2889) with the AEKTA system utilizing a Ni2+-NTA column.
Visualization of the purification process using Coomassie staining of SDS PAGE gel. M: NEB Color Pre-stained
Protein Standard (11 - 245 kDa); Lane 1-30: T4-T33.
After the two known control lanes, the blots reveal a comparable band color intensity at 34 kDa
corresponding to Mos10-6His in lanes 3 and 4, indicating that most tagged Mos10 harvested
from the cell lysate was applied to the AEKTA system. Due to the reduction in buffer B
concentration in the wash fraction, less Mos10-6His was eluted prematurely from the column.
Mos10-6His elution starts at lane 11 with an imidazole concentration of 110 to 125 mM and is
eluted until lane 19 (230 – 245 mM imidazole), peaking at lane 15 representing fraction T12
(170 – 185 mM imidazole). From lane 20 to 36 on the second blot, two faint bands at the height
around 32 kDa can be seen, which could also be Mos10-6His becoming visible due to a longer
exposure time of the blot. From lanes 20 to 28 highlighted in the black rectangle, the familiar
crosslinking pattern of Mos10-6His becomes visible. The WB results indicate that an imidazole
concentration of 100 mM is sufficient to elute Mos10-6His, but imidazole concentrations of
250 mM and higher are necessary to elute crosslinked Mos10-6His. The results are in line with
the imidazole concentrations used in the isocratic elution of Mos10-6His, in which crosslinks
were present in the 250 mM and 500 mM imidazole fractions.
The SDS PAGE gel staining in Figure 13 implies that Mos10-6His containing fractions elute
with most proteins bound to the Nickel column. Since the elution doesn’t appear random, a plot
against a Gaussian distribution was calculated by summing all band color intensities in each
lane and putting the highest intensity sum to 100 %. The graph can be seen in Figure 14, in
which the calculated blue curve, according to the Coomassie staining, overly fits a perfect
Gaussian standard distribution (R = 0.9850), indicating a statistically normal distributed elution.
32
46
58
80100
135190
kDa245
25
22
M 1 2 3 4 5 6 7 8 9 10 11 12 13 14 15 16 17 18 19 M 20 21 22 23 24 25 26 27 28 29 30
T12 T21 T22 T23

73
Figure 14: Lane intensity distribution of Coomassie-stained SDS PAGE.
The blue curve highlights the band intensity distribution in each lane from 1 to 19 in Figure 13, and the black line
describes a perfect Gaussian standard distribution. The curve’s fit is R = 0.9850.
To select possible candidates for MS analysis, a fraction with high overall protein abundance
and a fraction with solely crosslinks containing fractions were chosen. The WB fraction T12
shows an intense Mos10-6His band compared to the neighboring lanes and includes many other
proteins according to the SDS PAGE. For the crosslinking sample, fractions T21 to T23 were
chosen for having a comparable strong WB crosslinking pattern and fewer background proteins
present, as seen in the Coomassie staining. Lanes with crosslinked proteins were concentrated
with an AMICON filter, and all selected lanes were subsequently applied to SDS PAGE.
Figure 15: AEKTA purified samples for MS analysis.
Samples initially sent to MS analysis after AMICON filter
concentration of AEKTA purified Mos10-6His. Lane 2 represents a
sample in which no crosslink pattern was visible, whereas Lane 4
contains the samples which did show a crosslinking pattern on WB.
Only the area enclosed in the black rectangles was used for MS
analysis. M: NEB Color Pre-stained Protein Standard (11 –
245 kDa); Lane 1: empty; Lane 2: T21 - T23 (sample with
crosslinking pattern); Lane 3: empty; Lane 4: T12 (neg. control).
0
10
20
30
40
50
60
70
80
90
100
1 2 3 4 5 6 7 8 9 10 11 12 13 14 15 16 17 18 19
Inte
nsity
[%]
Lane
32
46
58
80100
135190
kDa245
25
22
M 1 2 3 4

74
The SDS PAGE in Figure 15 displays the gel sent to MS analysis to determine the proteins
purified by the AEKTA gradient purification. Lane 2 contains the combined fractions T21 to
T23 concentrated by AMICON filter, and lane 4 contains the control sample of fraction T12.
The area outlined with the black rectangle was cut out and digested with trypsin before being
analyzed by MS. According to the WB, the area of approximately 40 kDa and above was chosen
since all crosslinks migrate slower in the gel than unlinked Mos10-6His at 34 kDa.
Although a Mos10-6His specific crosslinking pattern could be detected, the experiment proved
insufficient in detecting specific interaction partners of Mos10-6His. Large numbers of proteins
were identified in both fractions and although several proteins were exclusively present in one
or the other fraction, no definite crosslinking partners could be established due to the
overcrowded protein population.
Although gradient elution of Mos10-6His was able to separate the Mos10-6His crosslinks from
the bulk of Mos10-6His and most other background proteins, it was still not pure enough for
MS analysis. Therefore, the SILAC technique was introduced to solve the background problem.
3.1.3 AEKTA purification of His-tagged Mos10 with SILAC The SILAC technique was introduced to achieve selective detection of crosslinks belonging to
Mos10-6His in mass spectrometry. The method requires two cell cultures growing in different
growth media containing either standard or stable, heavy amino acid isotopes for protein
synthesis. The “heavy” medium was supplemented with arginine and lysine amino acids labeled
with carbon-13 instead of carbon-12 atoms, introducing a mass shift in the resulting proteins,
detectable by a mass spectrometer.
For the new purification approach, the yeast strain RKY2999 was designed, containing a c-
terminal tagged Mos10-6His like the strain RKY 2889 used before but introduces an additional
arginine auxotrophy (Δarg) for essential amino acid intake. The growth medium was switched
from a complete medium (YPD) to a synthetic, minimal medium (YNB), supplemented with
essential amino acids.
In the following experiment, the WT cell culture (RKY1558) was grown in YNB medium
supplemented with a standard amino acid cocktail, whereas the Mos10-6His containing strain
(RKY2999) grew in supplemented YNB with the isotopic (“heavy”) forms of arginine and
lysine. In former Mos10-6His purification experiments, a single yeast cell culture was used,
and output fractions were compared with each other. Since two different cultures were needed
for the new approach, a novel crosslinking attempt was tested to ensure equal conditions for
each culture. Usually, cells are being lysed first and incubated afterwards with the crosslinker,

75
which would likely result in an uneven outcome for each cell culture treated. The two cultures
used for a single SILAC experiment were grown separately but combined after reaching
exponential growth and treated equally to ensure homogenous lysing and crosslinking. But,
crosslinking with mixed cell extracts may again lead to ambiguous results, since uncomplexed
heavy Mos10-6His could again interact with unlabeled proteins and vice versa, leading to a
promiscuous crosslinking. To avoid such effects, cultures were incubated with a crosslinker
before being lysed and mixed. The standard crosslinking protocol and the new conditions were
tested with the yeast strain RKY2999, YNB growth media, and crosslinking, monitored in
Figure 16.
Figure 16: Validating crosslinker induced WB pattern of 6His tagged Mos10 with Arg auxotrophy in YNB.
IMAC purification of 6His tagged- (RKY2999, Δarg) and WT-Mos10 (RKY1558) in a batch experiment utilizing
Ni2+-NTA His-tag affinity beads. Cell cultures were grown in either YPD or YNB media. WB results by α-Mos10
antibodies incubation. M: NEB Color Pre-stained Protein Standard (11 - 245 kDa); Lane 1: WT extract; Lane 2:
Δ8 extract; Lane 3: RKY2999 extract; Lane 4, 5 & 6: RKY1558 in YPD w/o crosslinker, added crosslinker after
lysing the cells, and before lysing the cells; Lane 7, 8 & 9: RKY2999 in YPD w/o crosslinker, added crosslinker
after lysing the cells, and before lysing the cells; Lane10: empty lane; Lane 11, 12 & 13: RKY2999 in YNB w/o
crosslinker, added crosslinker after lysing the cells, and before lysing the cells; Lane 14, 15 & 16: RKY1558 in
YPD w/o crosslinker, added crosslinker after lysing the cells, and before lysing the cells. Arrows: Black: WT-
Mos10; Grey: Mos10-6His; White: Crosslinks. An OD = 1 was loaded.
M 1 2 3 4 5 6 7 8 9 10 11 12 13 14 15 16
1558 2999
22
25
32
46
58
80100
135190
kDa245
YPD 2999 1558YNB

76
The WB results in Figure 16 summarize the new conditions for SILAC purification. Lanes 1 to
3 contain the control samples in which native Mos10 is marked with a black arrow and Mos10-
6His from the RKY2999 is marked with a grey arrow, migrating the same distance as seen
before by the RKY2889 strain. Batch Ni-NTA purification of Mos10-6His in RKY2999 shows
the same crosslinking pattern known from former experiments when incubated in YPD seen in
lane 8 and indicated by the white arrows. Comparing lane 8 with lane 9, this crosslinking pattern
does not change whether the crosslinker was applied initially to the cell culture before being
lysed or after lysing the cells, proving that the hydrophobic crosslinker DSS is capable of
passing by the cell membrane and crosslink proteins inside intact cells. It is also worth noticing
that the crosslinks gained after lysing the cells seem not artificial but instead follow the same
pattern as within viable cells. Comparing lanes 8 and 9 with lanes 12 and 13, the crosslinking
pattern does not change, excluding growth media effects on crosslinking. None of the
crosslinking patterns is visible in the WT RKY1558 strain regardless of growth medium or
chronological order of crosslinker incubation.
AEKTA purification of crosslinked Mos10-6His was performed in YNB media using a SILAC
based heavy RKY2999 culture and light RKY1558 cell culture. Cultures were grown until
exponential phase, incubated with DSS crosslinker, and applied to AEKTA like mentioned
before. The protocol of the gradient elution is monitored in Figure S 3, and for each fraction, a
sample was collected for WB analysis incubated with α-Mos10 antibodies seen in Figure 17.
Figure 17: WB results of the Mos10-6His AEKTA purification using a Ni-NTA column with SILAC.
IMAC purification of 6His tagged-Mos10 (RKY2999) with the AEKTA system utilizing a Ni2+-NTA column.
Visualization of the Mos10 characteristic crosslink WB pattern by α-Mos10 antibodies. M: NEB Color Pre-stained
Protein Standard (11 - 245 kDa); Lane 1: WT extract; Lane 2: Δ8 extract; Lane 3: RKY2999 extract; Lane 4:
Lysate debris Lane 5: Sample loaded on AEKTA; Lane 6: Flowthrough; Lane 7: T2 (wash fraction with 10 %
Buffer B); Lane 8-37: AEKTA samples T4-T33 (OD = 1). Arrows: Black: WT-Mos10; Grey: Mos10-6His.
32
46
58
80
100
135190kDa
25
22
17
M 1 2 3 4 5 6 7 8 9 10 11 12 13 14 15 16 17 18 19 20 21 22 23 24 25 26 27 28 29 30 31 32 33 34 35 36 37
T16 T17 T18

77
The WB results in Figure 17 illustrate the success of the gradient-based purification of Mos10-
6His and associated crosslinks. In lane 5, two bands at around the 32 kDa marker standard are
visible, representing native (black arrow) and tagged (grey arrow) Mos10 if compared to the
control samples in lanes 1 to 3. In lane 6, the amount of native Mos10 in the flowthrough
fraction equals the entire untagged Mos10 loaded onto the AEKTA from lane 5. In contrast,
Mos10-6His was completely bound to the Ni-NTA beads and eluted in fractions T8 to T15 (110
– 230 mM imidazole), corresponding to lanes 12 to 19, peaking in fractions T11 and T12. The
crosslinks of Mos10-6His eluted at fractions T16 to T18, highlighted by the black rectangle in
lanes 21 to 23.
For MS analysis, lanes 21 to 23 were chosen since only these lanes contain crosslinking partner
bands and have a relatively low abundance of background bands according to the Coomassie
staining of the SDS PAGE seen in Figure S 3. The fractions were combined and concentrated
by an AMICON filter before being directly sent to MS.
3.1.4 Improved batch purification by sedimentation and SILAC Simultaneously with introducing the SILAC technique for gradient purification by the AEKTA
system, an enhanced, SILAC based approach of batch purification has proven to be sufficient
for detecting Mos10-6His interacting partners. Experience from preceding experiments has
shown that recovery of Mos10-6His depends on centrifugation conditions. To make use of these
findings, differential centrifugation was used to separate protein fractions based on their
sedimentation rate. After cell lysis, the lysate was centrifuged at 500 g to remove cell debris.
Then, after incubating the cell lysate with a DSS crosslinker, an additional purification step was
added. Differential centrifugation was used to separate the cell content into a P13 fraction,
containing the pellet gained after centrifugation at 13.000 g, a P100, and an S100 fraction by
harvesting the pellet and supernatant after a 100.000 g spin, respectively. Each pellet fraction
was adjusted to the same volume of the supernatant to ensure that equal portions of the total
cell extract were loaded on the WB.
To test if the Mos10 crosslinks are membrane associated, the cell extracts were also treated
with the detergent Triton X-100, which solubilizes membranes. If the crosslinks are membrane
associated, they should be shifted to the soluble fractions by TX-100 treatment.
Pre-testing purification of crosslinked proteins in a batch experiment was done using WT
(RKY1558), and the Mos10-6His strain (RKY2999) by differential centrifugation with and
without Triton X-100 to gain P13, P100, and S100 fractions seen in Figure 18.

78
Figure 18: Crosslinking pattern sub-
division by differential centrifugation.
Centrifugation experiment to separate the
majority of proteins from the putative Mos10
crosslinking partner. Lane 1: WT extract;
Lane 2: Δ8 extract; Lane 3: RKY2999
extract; Lane 4: Lysate with Triton X-100;
Lane 5: Lysate w/o Triton X-100; Lane 6:
P13 with Triton X-100; Lane 7: P13 w/o
Triton X-100; Lane 8: S100 with Triton X-
100; Lane 9: S100 w/o Triton X-100;
Lane 10: P100 with Triton X-100; Lane 11:
P100 w/o Triton X-100. Arrows: Black:
Mos10; Grey: Mos10-6His; White:
Crosslinks. Loaded: OD = 0.2.
Figure 18 shows the WB results of Mos10-6His crosslinker purification by differential
centrifugation. The control lanes 1 to 3 highlight the migration distances of native and tagged
Mos10 marked by a black and a grey arrow. Lanes 4 and 5 represent purification fractions of
lysed and crosslinked cell content before being applied to differential centrifugation in which
no difference in Triton X-100 treatment is visible. After spinning the samples at 13.000 g and
100.000 g, a different behavior towards sedimentation based on Triton X-100 induced effects
became evident. Mos10-6His crosslinks highlighted by white arrows can be seen in lane 7
associated with the P13 fraction that was not treated with Triton X-100. In comparison, adding
the detergent pushes the crosslinks into fraction P100. Of note, most proteins accumulate in
fraction S100, containing most of Mos10-6His compared to fractions P13 and P100, regardless
of Triton X-100 treatment. Whether crosslinked proteins are also present in lanes 8 and 9 cannot
be answered, because the characteristic crosslinking pattern is masked by the high protein
background in fraction S100. The crosslinking pattern, although clearly visible in P13 without
Triton X-100 and in P100 treated with Triton X-100, appeared very faint compared to previous
results.
To improve the specificity and yield of IMAC purification, the standard Ni2+-NTA column was
replaced by a Co2+-NTA column, since cobalt has a lower affinity towards histidine than nickel.
The idea was to reduce background bands and merely bind Mos10-6His to the column by the
long and exposed histidine tail. In theory, the exchange of ions coordinated on the NTA beads
should lead to a better signal-to-noise ratio regarding purifying and visualizing crosslinks on
M 1 2 3 4 5 6 7 8 9 10 1122
25
32
46
58
80100
135190
kDa245
+TX-TX
P13 S100 P100
+TX -TX +TX -TX +TX -TX

79
the WB blot. Since no Co2+-NTA columns were available for testing, self-packed Ni2+-NTA
columns were used and stripped by incubating the beads with a buffer solution containing
EDTA that complexes the divalent ions and washes them off the column. The NTA beads were
recharged with CoCl2 and packed to gain a functional Co2+-NTA column, whose purification
capability was tested (Figure S 4). Since stripping and recharging of the beads was successful,
Mos10-6His was crosslinked and purified over a Ni2+-NTA column and a Co2+-NTA column
to compare their purification efficiency.
Figure 19: Mos10-6His purification with Ni2+- and Co2+-NTA column with P13 separation.
A differential centrifugation experiment was carried out to separate and highlight crosslinking partners into S13
and P13 fractions and compare a Ni2+-NTA column with a recharged Co2+-NTA column. Lane 1: WT extract;
Lane 2: Δ8 extract; Lane 3: RKY2999 extract; Lane 4: WT S13 on Ni2+-NTA; Lane 5: WT P13 on Ni2+-NTA;
Lane 6: WT S13 on Co2+-NTA; Lane 7: WT P13 on Co2+-NTA; Lane 8: Mos10-6His S13 on Ni2+-NTA; Lane 9:
Mos10-6His P13 on Ni2+-NTA; Lane 10: Mos10-6His S13 on Co2+-NTA; Lane 11: Mos10-6His P13 on Co2+-
NTA Arrows: Black: Mos10; Grey: Mos10-6His; White: Crosslinks. Loaded: OD = 0.2.
The WB results in Figure 19 clearly illustrate the advantages of Co2+-NTA over the beforehand
used Ni2+-NTA column. Compared to lane 8, where the Mos10-6His specific crosslinking
pattern is barely visible, lane 10 shows much clearer western blot signals of the crosslinks and
22
25
32
46
58
80100135190kDa
M 1 2 3 4 5 6 7 8 9 10 11
S13 S13 S13 S13P13 P13 P13 P13
Ni2+ Co2+ Ni2+ Co2+
WT Mos10-6His

80
also more than twice the amount of Mos10-6His was purified (band around 34 kDa). An
additional band above 100 kDa complements the established crosslinking pattern, which is also
visible in lane 6 and presumably corresponds to a Co2+-NTA specific background band. Overall,
the pre-treatment of the cell lysate with Triton X-100 and differential centrifugation seems
suitable for Mos10-6His purification and fractionation.
For MS analysis, a SILAC based purification experiment of Mos10-6His (RKY2999) and
RKY2998 (WT Δarg) was completed with the conditions worked out and applied on WB for
further analysis (Figure S 5). Crosslinking patterns showing fractions were then used for MS
analysis by being loaded and visualized on a Coomassie-stained SDS PAGE (Figure 20).
A
B
Figure 20: SILAC samples for MS analysis from batch Mos10-6His purification.
Coomassie-stained SDS PAGE gels containing samples sent to MS analysis. Mos10-6His batch purification with
differential centrifugation was carried out with arginine auxotroph strains RKY2999 and RKY2998. SILAC
technique was applied to both strains to visualize “light” and “heavy” media-induced protein enrichment in MS.
Samples analyzed by MS are highlighted by the black rectangles and labeled with numbers for later identification.
(A) The SDS PAGE gel shows the results of batch purification of proteins from a “light” (L) WT strain (RKY2998)
and a “heavy” (H) Mos10-6His strain (RKY299). (B) The SDS PAGE gel shows the results of batch purification
of proteins from a “heavy” (H) WT strain (RKY2998) and a “light” (L) Mos10-6His strain (RKY299). M: NEB
Color Pre-stained Protein Standard (11 - 245 kDa); Lane 1: RKY2998 extract; Lane 2: Δ8 extract; Lane 3:
RKY2999 extract; Lane 4: S13 of WT(L) and Mos10-6His(H); Lane 5: P13 of WT(L) and Mos10-6His(H);
Lane 6: S13 of WT(L) and WT(H); Lane 7: empty; Lane 8: Mos10-6His purified from E. coli; Lane 9: S13 of
WT(H) and Mos10-6His(L); Lane 10: P13 of WT(H) and Mos10-6His(L). Arrow: Grey: Mos10-6His.
M 1 2 3 4 5 6 7 M 8
22
25
32
46
58
80100135190
kDa245
2
1
2225
32
46
58
80100
135190
kDa245
M 9 10
3
4 6
5

81
Figure 20 shows the two SDS PAGE gels with the samples loaded for MS analysis. In gel A
lane 4, the S13 sample eluted from the beads by boiling was loaded containing the WT strain
RKY2998 grown in standard amino acid supplemented YNB and the Mos10-6His containing
strain RKY2999, grown in YNB supplemented with heavy isotopes. Compared with the pellet
fraction P13 in lane 5, an intensively stained band at around 50 kDa becomes visible (area 1).
A second intriguing but fuzzy band at approximately 34 kDa seen in lane 4 (area 2) is migrating
the same distance as Mos10-6His purified from an E. coli culture in lane 8. The two bands are
also present in lane 6 containing the WT(H)-WT(L) fraction and should contain background
proteins. Nevertheless, both band areas were marked for MS analysis to be further elucidated.
Gel B lane 9 shows an overall comparable banding pattern to lane 4, indicating that switching
isotopes does not lead to a visible difference on an SDS PAGE gel. The isotope exchange was
also analyzed by WB, where no change in the crosslinking pattern was observable. The band at
around 34 kDa seemed more prominent in gel B and was again analyzed to clarify if purified
Mos10-6His can be seen on the Coomassie gel (areas 3 and 5). Lanes 9 and 10 show no visible
bands at around the 70 to 100 kDa, where the crosslink bands are expected. To check the
presence and the identity of the crosslinks, areas 4 and 6 were cut out and sent to MS, where
area 6 in lane 10 serves as an additional control sample. Candidates from the MS results are
summarized inTable S 5.
3.1.5 Purification of untagged Mos10 So far, a 6His tagged variant of Mos10 was used to find potential binding partners. C-terminal
tagging of Mos10 compromises its function, thus it cannot be excluded that the crosslinking
pattern observed is artificial. For this reason, it was of interest to see, whether the same
crosslinking pattern could be obtained with native, untagged Mos10. To this end, Mos10 was
immunoprecipitated from cell extracts with polyclonal anti-Mos10 antibodies.
Initially, α-Mos10 antibodies needed to be purified, since previous experiments had shown a
large number of crossreacting bands on western blots with the crude antiserum. To produce a
significant amount of Mos10 for affinity purification, an E. coli strain containing a plasmid for
Mos10-6His expression induced by IPTG or galactose was used. Heterologous expression of
Mos10-6His in E. coli was carried out by an autoinduction medium and samples were checked
on an SDS PAGE by Coomassie staining (Figure 21).

82
Figure 21: Autoinduction media used for Mos10-6His heterologous expression in E. coli.
For each step in the purification process, a sample was taken and applied on SDS PAGE. Band intensities were
compared to a BSA standard ranging from 2 µg to 20 µg loaded on the gel. M: NEB Color Pre-stained Protein
Standard (11 - 245 kDa); Purification fractions: Lane 1: CL = cell lysate; Lane 2: CS = cell supernatant; Lane 3:
Ft = Flowthrough; Lane 4 & 5: W1/W2 = washing step 1 and 2; Lane 6: E = elution; Lane 7 & 8: empty;
Lane 9-13: BSA standard from 20 µg to 2 µg.
E. coli cells were grown in autoinduction media at 25 °C to exclude the formation of inclusion
bodies. The bacteria used glucose as the primary carbon source during growth, but switched to
lactose after the glucose had vanished. Cleaving lactose molecules to glucose and galactose
monomers activates the lac operon and starts gene expression of Mos10-6His inside the cell.
After 24 h, the cells were harvested and lysed (CL) before being centrifuged to remove cell
debris (CS). The supernatant was applied to a Ni-NTA column to allow the Mos10-6His
proteins to bind and background proteins to flow through the column (WT). After washing the
column twice with buffer (W1-2), proteins were eluted with 250 mM imidazole (E). According
to the BSA standard, the cell culture contained 74 mg of Mos10-6His migrating to 34 kDa
marked by a black arrow, of which 6 mg were eluted from the column. Although auto-induced
heterologous expression of Mos10-6his seemed successful, only about 8 % of the input protein
was purified during standard purification. Having dealt with this complication within previous
purifications of Mos10-6His from yeast strains RKY2889 and RKY2999, the situation seems
more severe when larger amounts of the protein are applied to the column. Various conditions
were tested to improve Mos10-6His binding capacity and elution from the column to address
this issue. Standard 1x PBS buffer was supplemented with Tween20 (T20), sodium chloride
22
25
32
46
58
80100135190
kDa245
M 1 2 3 4 5 6 7 8 9 10 11 12 13
M CL CS FT W1 W2 E 20 10 8 4 2
BSA
Mos10-6His
BSA in µg

83
(NaCl), glycerol (Gly), and β-mercaptoethanol (BME) to test improvements of Mos10-6His
binding. The precise composition of each buffer subset is listed in Table S 3.
Table 20: Testing Buffer conditions according to Affi-Gel 15 manufactures guidelines.
Coupling Buffer
Affi-Gel 15 Coupling Efficiency (%)
0.1 M MOPS, pH7.4 75 %
0.1 M MOPS, pH7.4 + 0.3 M NaCl 44 %
The purified Mos10-6His protein was coupled to an Affi-Gel 15 affinity matrix. This matrix
was chosen, because it has a higher coupling efficiency with acidic proteins like Mos10, which
has an isoelectric point of 4.2. The coupling efficiency was calculated by comparing the protein
amounts present before and after coupling. As Table 20 shows, the achieved coupling
efficiencies are very close to the effciencies specified by the manufacturer. Considering 44 %
coupling efficiency, a maximal amount of 10 mg Mos10-6His can be bound to 1 ml of Aff-Gel
15 matrix.
The Mos10-6His coupled Affi-Gel 15 was then incubated with 5 ml of crude α-Mos10 antibody
serum. After incubation, the bound antibodies were eluted from the beads and dialyzed for
further use. The purity of the antibody was tested by immunoprecipitation. The different
antibody preparations were added to a yeast cell extract and the immunoprecipitated proteins
were then examined by western blotting (Figure 23).
Figure 22: Testing antibody sera against native Mos10 extract.
Various fractions were collected and tested during antibody purification
against a WT (RKY1558) extract to compare immunoprecipitation
efficiency and purity. Proteins bound to the beads were applied on WB
to visualize the antibody purification effect. A complete analysis of
antibody purification can be seen in the WB in
. M: NEB Color Pre-stained Protein Standard (11 - 245 kDa); Antibody
fractions: Lane 1: Crude antibody serum; Lane 2: Antibody
flowthrough (unbound antibodies to Affi-Gel 15; Lane 3: Eluted
antibodies before dialyzing; Lane 4: Dialyzed antibodies. Arrow:
Yellow: Antibody; Black: Mos10. 22
25
32
46
58
80100135190kDa M 1 2 3 4

84
As seen from the WB result incubated with crude α-Mos10 antibody serum, the process of
antibody purification successfully reduced background bands from lanes 1 to 4. Lane 4,
containing the dialyzed antibodies, shows only the Mos10 band at 30 kDa and a faint band at
34 kDa. Migrating at around 50 kDa, the antibody band marked by a yellow arrow also faints
from lanes 1 to 4, indicating that most of the antibodies in the crude serum were washed off. It
is worth noticing that the Mos10 color band intensity is reduced by about 50 % by comparing
lane 1 to lane 4 due to a loss of antibodies also detecting the protein.
To test whether the purified α-Mos10 antibody is suitable for specifically detecting Mos10
crosslinks, Mos10 was immunoprecipitated from cell extracts of the wildtype strain RKY1558
and the ∆mos10 strain RKY2892 treated with the non-cleavable crosslinker DSS (Figure 24).
Figure 23: Crosslinking pattern of native Mos10 by α-
Mos10 immunoprecipitation.
Yeast strains RKY1558 and RKY2892 were grown until
the exponential phase, and an input sample was taken
after cell lysing. Regular crosslinking was carried out to
visualize the native Mos10 crosslinking pattern with
Δmos10 as a control sample. M: NEB Color Pre-stained
Protein Standard (11 - 245 kDa); Antibody fractions:
Lane 1: RKY1558 input; Lane 2: RKY2892 input;
Lane 3: crosslinked RKY1558; Lane 4: crosslinked
RKY2892. Arrows: Black: Mos10; White: crosslinks.
OD = 0.2 loaded.
The WB result illustrates the detection of Mos10 in lane 1 at approximately 30 kDa marked by
a black arrow, since the band is lacking in lane 2 containing the MOS10 deleted strain. Both
lanes have an additional background band at 34 kDa and roughly 50 kDa. Additional bands at
58 kDa and above were detected after immunoprecipitation of proteins from the wildtype strain.
With the immunoprecipitate from the MOS10 deletion strain, a number of faint background
bands were observed, but the pronounced bands seen with the wildtype extract in lane 3 were
missing. Therefore, it can be concluded that the bands seen in lane 3 correspond to specific
Mos10 crosslink bands. The banding pattern with native Mos10 resembles the banding pattern
observed with Mos10-6His.
25
32
46
58
80
100
135190kDa M 1 2 3 4

85
Visualization of the crosslinking pattern on an SDS PAGE gel by Coomassie and silver staining
was attempted, seen in Figure S 7. A fuzzy band can be seen in the WT lanes at 30 kDa in both
gels, not visible in the Mos10 deletion strain. Due to the small amount of crosslinked proteins
present in the samples, no bands were directly associated with one of the crosslink bands. For
MS analysis Mos10 was immunoprecipitated from crosslinked cell extracts prepared from a 1-
liter culture of the wildtype RKY1558. The gels used and the area cut out can be seen in
Figure S 8.
3.1.6 The first set of potential Mos10 interacting partners In the first set of experiments, Mos10-6His was purified from crosslinked cell extracts with Ni-
NTA beads. With the SILAC technique, potential Mos10-6His interaction partners could be
distinguished from unspecific background proteins. Various experiments were performed, in
which the proteins from the Mos10-6His strain were either labeled with heavy (H) or light (L)
isotopes, while the corresponding control strain, expressing only untagged Mos10, was labeled
with the opposite isotopes. For each protein detected by MS the ratio of heavy to light isotopes
(H/L or L/H, depending on the experiment) was determined. Only those proteins were
considered as potential interaction partners that were at least 2-fold enriched for the isotopes
used to label Mos10-6His. From these experiments several candidates, whose molecular weight
lies in the range of the observed Mos10-6His crosslink bands, were selected (Table 21).
Table 21: Selected crosslinking partners of Mos10.
Gene Symbol MW
Ald5 56,692
Eft1 93,279
Get3 39,337
Pab1 64,335
Pre6 28,439
Ssc1 63,248
Vps68 20,101
The sizes of the unknown crosslinked proteins were calculated from the migration distance on
SDS PAGE gels compared to a molecular weight marker (Figure S 9). The results of the
molecular weight determination are summarized in Table S 4.
To verify the interactions, the potential interaction partners were C-terminally tagged with a
13myc affinity tag at their chromosomal loci in the Mos10-His strain RKY2889. Co-

86
immunoprecipitation (Co-IP) experiments were performed with cell extracts treated with the
cleavable crosslinker DSP. The crosslinked proteins can be reversibly detached from the bait
protein by DTT treatment to break the disulfide bond present in DSP.
Figure 24: Purification of potential Mos10-6His interacting partners by α-13myc immunoprecipitation.
Results of the α-13myc IP is shown in triplets for each protein investigated: IN = input sample; -AB = no antibody
control, and +AB = the antibody purified sample. M: NEB Color Pre-stained Protein Standard (11 – 245 kDa).
Loaded: IN: OD = 0.2. +/-AB: OD = 1.
The WB results of α-13myc immunoprecipitation of the six candidates Ald5, Eft1, Get3, Pre6,
Ssc1, and Vps68 tagged with 13myc are summarized in Figure 24 (Pab1 tagging appears to be
lethal, this strain could not be obtained). Although individual protein tagging was confirmed by
PCR analysis, validating the implementation of the cassette into the yeast strains genome, the
sizes of the detected proteins on the western blots, did not always correspond to the predicted
sizes. For each protein MW listed in Table 21, an additional 20 kDa must be added due to the
13myc tag. One reason for the observed discrepancy could be a variable number of myc coding
sequences appended to the respective protein coding genes. The variability appears to arise
from slippage of the polymerase during PCR amplification of the repetitive myc sequences of
the insertion cassette. Ald5, for instance, is 56 kDa large, and the WB reveals a band in lane 1
at the approximately 56 kDa location, indicating that maybe just a single myc-tag is attached to
the protein. Pre6 in lane 10, mainly runs at 35 kDa comparable to the native protein of size
28 kDa, and the expected full-size variant is just indicated by a faint band at 50 kDa. In this
case, the smaller size of the main band could be the result of proteolysis. It is worth noting that
despite the wrong protein size, both proteins were immunoprecipitated with α-myc (lanes 3 and
12) indicated by a band not visible in the fraction lacking antibody. Also, Get3 (lanes 7 and 9)
32
46
58
80100135190kDa
M 1 2 3 4 5 6 7 8 9 10 11 12 13 14 15 16 17 18
IN -AB +ABIN -AB +ABIN -AB +ABIN -AB +ABIN -AB +ABIN -AB +AB
Ald5 Eft1 Get3 Pre6 Ssc1 Vps68

87
and Vps68 (lanes 16 and 18) could be successfully immunoprecipitated. In both cases, the most
intensively staining band is in the expected range of the tagged protein variant. Eft1 (lane 4)
shows a main band around 135 kDa (close to the expected 113 kDa) and many additional
degradation bands. Ssc1-myc migrates at 110 kDa, larger than the expected size of 83 kDa.
Additionally, all input lanes contain an additional background band at around 130 kDa, which
is partially co-purified along with the presumably correct sized band seen in the individual +AB
fraction.
Figure 25: Identification of co-immunoprecipitated Mos10-6His by potential interacting partners.
Results of the α-Mos10 incubated blot showing Mos10-6His Co-IP by the six proteins affinity purified. IN = input
sample; -AB = no antibody control, and +AB = the antibody purified sample. M: NEB Color Pre-stained Protein
Standard (11 - 245 kDa). Arrow: Grey: Mos10-6His. Loaded: IN: OD = 0.2. +/-AB: OD = 5.
The immunoprecipitates were now examined for co-immunoprecipitation of Mos10-6His by
western blotting with anti-Mos10 antibodies (Figure 25). All input samples show a prominent
band at 34 kDa marked by a grey arrow indicating equal amounts of Mos10-6His harvested
from cell culture. A successful Co-IP is indicated by a Mos10-6His band in the +AB lane. Only
in case of Vps68 (lane 18), co-immunoprecipitation of Mos10-6His could be observed. For the
other five proteins no co-IP was detected. From this it can be concluded that Vps68 is a true
interaction partner of Mos10.
It should be noted that the established crosslinking pattern of Mos10-6His does not change by
introducing a 13myc tag to the six selected proteins, which changes the mobility of the proteins
(Figure 26). Thus, none of the examined proteins is part of the observed Mos10-6His
25
32
46
58
80100135190kDa IN -AB +ABIN -AB +ABIN -AB +ABIN -AB +ABIN -AB +ABIN -AB +AB
Ald5 Eft1 Get3 Pre6 Ssc1 Vps68
M 1 2 3 4 5 6 7 8 9 10 11 12 13 14 15 16 17 18

88
crosslinking pattern. Also, expression of Mos10-6His is not affected by the expression of the
myc-tagged proteins variants.
Figure 26: Crosslinking pattern of crosslinked Mos10-6His and 13myc tagged interacting partners.
Mos10-6His and Mos10-6His + 13myc tagged putative interacting partner strains were incubated with crosslinker
DSS and IMAC purified to identify changes in the crosslinking pattern of Mos10-6His. WB was incubated with
α-Mos10 antibodies. M: NEB Color Pre-stained Protein Standard (11 - 245 kDa); Lanes 1 - 7: IN samples of
Mos10-6His +Ald5, Eft1, Get3, Pre6, Ssc1, or Vps68 (OD = 0.2); Lanes 8 - 14 IMAC purified samples of Mos10-
6His +Ald5, Eft1, Get3, Pre6, Ssc1, or Vps68 (OD = 1). Arrows: Grey: Mos10-6His; White: Crosslinks.
3.1.7 Tagged Mos10 purification via IP The next method used for detecting interacting partners of Mos10 was the purification of tagged
Mos10 variants via immunoprecipitation. Commercial antibodies were used, targeting a distinct
tag attached to the Mos10 C-terminus. In a tag evaluation experiment, Mos10 was C-terminally
tagged with -3HA (RKY3209), -sfGFP (RKY3216), -Protein A (RKY1823) and -13myc
(RKY1452), respectively and compared to the familiar -6His (RKY2889) tag. Cells were grown
to exponential phase, lysed, and crosslinked with DSS before each tagged variant’s affinity
purification was carried out. For the -3HA, -sfGFP, and -13myc tag, the crosslinked protein
was affinity purified by immunoprecipitation using tag-specific antibodies (α-3HA, α-GFP, and
α-13myc). For the purification of 6His tagged protein, a Ni-NTA column was used utilizing
IMAC. For the purification of protein A tagged Mos10, IgG beads were used to pull out the
target protein with crosslinks. All purifications were also applied to a WT control (RKY1558),
and the results are summarized in Figure 27.
32
46
58
80100135190kDa
M 1 2 3 4 5 6 7 8 9 10 11 12 13 14
Input IMAC + Crosslinks

89
A
B
Figure 27: Evaluating Mos10 affinity tags for immunoprecipitation compared to IMAC.
(A) Purification of crosslinked Mos10 by various affinity tags, visualized on a WB with α-Mos10 antibodies. Each
Mos10 construct is marked with an arrow in the input lanes 1-5, and the associated crosslinks are blotted in lanes
6-10. M: NEB Color Pre-stained Protein Standard (11 - 245 kDa); Antibody fractions: Lane 1: IN RKY2889;
Lane 2: IN RKY3209; Lane 3: IN RKY3216; Lane 4: IN RKY1823. Lane 5: IN RKY1452; Lane 6: crosslinked
RKY2889; Lane 7: crosslinked RKY3209; Lane 8: crosslinked RKY3216; Lane 9: crosslinked RKY1823;
Lane 10: crosslinked RKY1452. Arrows: Grey: Mos10-6His; Blue: Mos10-3HA; Green: Mos10-sfGFP;
Orange: Mos10-Protein A; Red: Mos10-13myc. OD = 0.2 loaded. (B) Purification of native Mos10 by various
affinity tag-specific techniques for background bands detection visualized on a WB with α-Mos10 antibodies.
Lanes 1-5: IN RKY1558; Lanes 6-10: crosslinked RKY1558. Arrow: Black: Mos10.
On the WB A in Figure 27, the input samples of each purification technique are blotted, and a
colored arrow highlights each Mos10 tag variant. All tagged variants were expressed, Mos10-
3HA had the lowest expression level, all other variants were expressed to equal levels. In lanes
6 to 10, the immunoprecipitated proteins are shown. Lane 6 represents the familiar crosslink
pattern between 70 and 100 kDa, obtained by purifying Mos10-6His with Ni-NTA. Only the
Mos10-sfGFP tagged version had a comparable crosslinking pattern (lane 8) in terms of the
proteins sizes and band intensity. For the Mos10-3HA, Mos10-Protein A, and Mos10-13myc,
no clear crosslinking pattern could be seen. In a later experiment, in which the effect of cell
density on crosslinking efficiency was examined, the Mos10-13myc variant did show a
crosslinking pattern (Figure S 10).
In comparison, WB B shows the results for the RKY1558 strain when the same purification
techniques are applied to native Mos10. Lanes 1 – 5 contain the input samples in which a Mos10
band at 30 kDa and some background bands are visible, not differing between lanes. The
immunoprecipitated crosslinked samples in lanes 6 to 10 contain no bands similar to the
22
25
32
46
58
80100
135190
kDa245
M 1 2 3 4 5 M 6 7 8 9 10 M 1 2 3 4 5 M 6 7 8 9 10
22
25
32
46
58
80
100
135190
kDa245

90
crosslinking pattern seen in WB A. In lanes 7, 8, and 10, an intensively stained band at
approximately 50 kDa is visible and belongs to the antibody used since only those lanes
contained IP purified samples.
For a new IP purification experiment, the Mos10-sfGFP variant was chosen for showing a
comparable crosslinking pattern to the one obtained by Mos10-6His. Another advantage of
Mos10-sfGFP is the ability to visualize the tagged protein by fluorescence microscopy
described later. Mos10-sfGFP IP by α-GFP antibodies was done utilizing the SILAC technique
by growing strain RKY2998 in a “light” medium, and RKY3216 in “heavy” YNB
supplemented medium. Cell cultures were grown until the exponential phase, harvested, and
lysed before being crosslinked with DSS. Due to limitations in the availability of antibody, the
cell extracts were incubated with 100 µl α-GFP, which is less than optimal as judged from the
batch experiment, but should still be sufficient for immunoprecipitating tagged Mos10 in
detectable amounts for MS analysis. The largest part of the immunoprecipitate was run on an
SDS PAGE gel, which was silver stained. A small part was analyzed by western blotting (Figure
28).
Figure 28: Purification of Mos10-sfGFP by α-GFP
antibodies on WB and silver-stained gel for MS.
Summary of the Mos10-sfGFP purification process on
WB incubated by α-Mos10 antibodies. The input
fraction (IN) and the unbound (UB) fraction of
proteins not bound to the protein A beads are loaded.
Fraction E contains the proteins boiled of the beads.
M: NEB Color Pre-stained Protein Standard (11 - 245
kDa). Arrows: Black: Mos10; Green: Mos10-sfGFP,
and White: Crosslinks. For MS analysis, the area of
58 kDa and upwards of the silver-stained gel was used,
indicated by the black rectangle.
The results of the immunoprecipitation purification of Mos10-sfGFP in Figure 28 reveal that
almost equal amounts of native and tagged Mos10 were harvested from the cell cultures
indicated by the black and green arrows. The unbound sample loaded shows that most Mos10
was not bound to the column and is therefore absent in the elution fraction. In comparison,
Mos10-sfGFP was not fully recovered by the protein A beads and a substantial fraction got lost
22
25
32
46
58
80100135190
kDa245
17
M IN UB E M MS Sample

91
in the flowthrough. Nevertheless, a significant amount of Mos10-sfGFP was purified by the α-
GFP antibodies indicated by the intense band in the elution lane. The eluted crosslinking pattern
of Mos10-sfGFP is highlighted by white arrows in the elution lane and was tried to be identified
on the silver-stained SDS PAGE. Although distinct bands can be seen in the silver-stained gel,
the indicated pattern on the WB is hard to discern on the silver-stained gel, which is why for
MS analysis, the entire area between 245 and 58 kDa was sent for analysis. Mos10 interacting
candidates from the MS analysis with a H/L ratio larger than 2 are listed in Table 22. The results
from all purifications are summarized in Table S 5.
3.1.8 The second set of potential Mos10 interacting partners The second set of candidates investigated for being associated with Mos10 contains the proteins
listed in Table 22, extended by Ald5, Pre6, and Vps68 from the IP experiment in Table 21 for
further testing.
Table 22: Extended set of Mos10 crosslinking partners.
Gene Symbol MW CRAPome
Exo84 85,537 1 / 17
Leu1 85,793 1 / 17
Oac1 35,153 / 17
Tps1 56,147 / 17
Dnf2 182,62 1 / 17
Ygr130c 92,697 / 17
Yck2 62,078 1/ 17
Pan1 160,27 1/ 17
Tom71 71,855 / 17
Cog8 69,828 1/ 17
Mss1 58,351 / 17
Ptr2 68,043 / 17
Mnn5 67,204 1/ 17
Ald5 56,692 1/ 17
Pre6 28,439 2/ 17
Vps68 20,101 / 17
Besides having the criteria of being strongly enriched in one of the SILAC fractions, a
CRAPome comparison sorted out more candidates. The Contaminant Repository for Affinity
Purification (CRAPome) is an extensive proteomics database describing nonspecifically
enriched proteins in various purification experiments supported by the repository of negative

92
control purifications (Mellacheruvu et al., 2013). The individual protein score is set between
0/17 for proteins not found by MS to be unspecifically co-purified and up to 17/17 for proteins
always found by MS regardless of the purification method applied. Putative Mos10 interacting
candidates were chosen based on their MW, SILAC enrichment, and low CRAPome score of 0
or 1, besides Pre6 from previous experiments with a CRAPome score of 2/17. Candidates with
a high CRAPome score were not considered to be putative crosslink partners, The chosen
candidates were 13myc tagged in the WT strain RKY1558 and purified by immunoprecipitation
with α-myc antibodies (Figure 29)
Figure 29: Purification of potential Mos10 interacting partners by α-13myc immunoprecipitation.
Results of the α-13myc blot showing α-13myc IP in doublets for each protein: IN = input samples; IP = the purified
samples. M: NEB Color Pre-stained Protein Standard (11 – 245 kDa). Loaded: IN: OD = 0.2; IP: OD = 1.
32
46
58
80100135190
kDa245
M 1 2 3 4 5 6 7 8 9 10 11 12 13 14 15 16
IN IP IN IP IN IP IN IP IN IP IN IP IN IP IN IP
Exo84 Leu1 Oac1 Tps1 Dnf2 Ygr130c Yck2 Pan1A
32
46
58
80100135190kDa
M 1 2 3 4 5 6 7 8 9 10 11 12 13 14 15 16
Tom71
IN IP IN IP IN IP IN IP IN IP IN IP IN IP IN IP
Cog8 Mss1 Ptr2 Mnn5 Ald5 Pre6 Vps68B

93
Although each mutant had a correctly inserted transformation cassette confirmed by PCR, not
all 13myc tagged proteins were expressed. A negative result was obtained for Dnf2, Yck2,
Pan1, Pre6, and Vps68 (which worked before). Most likely, the integrated tag sequences were
not in-frame with the tagged genes. These constructs must be reexamined in further
experiments. In contrast, each expressed tagged variant of the other proteins showed a band in
the input lanes and was also purified via immunoprecipitation seen in the IP lanes.
Immunoprecipitation seemed sufficient to check for crosslinked Mos10 co-purified with the
primary IP. But, unfortunately, no Mos10 co-IP could be detected with any to the constructs.
Figure 30: Identification of co-immunoprecipitated Mos10 by potential interacting partners. Results of the α-Mos10 blot showing α-13myc Co-IP. IN = input sample; Co-IP = purified sample. M: NEB Color
Pre-stained Protein Standard (11 - 245 kDa). Arrow: Black: Mos10. Loaded: IN: OD = 0.2; Co-IP: OD = 5.
32
46
58
80100135190kDa
M 1 2 3 4 5 6 7 8 9 10 11 12 13 14 15 16 17 18
IN Co-IP IN Co-IP IN Co-IP IN Co-IP IN Co-IP IN Co-IP IN Co-IP IN Co-IP IN Co-IP
Exo84 Leu1 Oac1 Tps1 Dnf2 Ygr130c Yck2 Pan1 Tom71A
32
46
58
80100135190kDa
M 1 2 3 4 5 6 7 8 9 10 11 12 13 14 15 16
IN Co-IP IN Co-IP IN Co-IP IN Co-IP IN Co-IP IN Co-IP IN Co-IP IN Co-IP
Cog8 Mss1 Ptr2 Mnn5 Ald5 Pre6 Vps68 WTB

94
The same experiment was also performed with different tags. The sixteen candidates were
tagged with GFP and sfGFP in the WT RKY1558 strain for immunoprecipitation with α-GFP
antibody, offering the advantage that the proteins can be additionally investigated by
fluorescence microscopy due to the green fluorescence tag. The results with the GFP tag are
summarized in Figure S 11and the results with the sfGFP tag in Figure S 12.
Summarizing the IP and Co-IP experiment results, the most promising candidate for an
interacting partner of Mos10 happens to be Vps68. With the Mos10-6His tagged variant, a clear
signal could be detected in the Co-IP WB of Vps68-13myc, and at least a very faint signal was
detectable in the Co-IP Blot of Vps68-sfGFP for native Mos10.
3.1.9 ESCRT-III interacting partners of Mos10 Besides investigating the new putative interacting partners of Mos10 listed in Table 21 and
Table 22, MS analysis revealed a close interaction of Mos10 with the ESCRT-III subunits Did2,
Snf7, Vps2, and Vps24. This supports the view that Mos10 is a bona fide member of the
ESCRT-III complex. It is tempting to speculate that ESCRT-III subunits could be part of the
observed crosslinking pattern of Mos10-6His. Therefore, it was tested whether deletion of
individual ESCRT-III proteins alters the crosslinking pattern. For this purpose, the strain
RKY2889 with the Mos10-6His affinity tag was mutated by inserting Δchm7 (RKY3228),
Δdid2 (RKY2788), Δist1 (RKY2789), Δsnf7 (RKY2790), Δvps2 (RKY2841), Δvps20
(RKY2893), and Δvp24 (RKY2830) gene deletions. Former experiments revealed partial cross
interactions of crude ESCRT-III antibody sera, thus identifying more than just the target
ESCRT-III protein. For this reason, Mos10-6His purification was carried out by Ni-NTA
affinity purification rather than IP, preventing antibody-related cross purification and allowing
a better comparison to the experiment shown in Figure 26. For comparison, a WT strain
(RKY1558) and the standard IMAC strain RKY2889 with Mos10-6His were used (Figure 31).
Each vps single deletion strain, the WT strain RKY1558, and the Mos10-6His strain RKY2889
were incubated with DSS crosslinker and subjected to Ni-NTA affinity purification. Each
purification sample was then blotted and incubated with any of the eight ESCRT-III members
specific crude antibody sera (Figure S 13 to Figure S 21). To compare the Mos10-6His crosslink
patterns in the different deletion strains, the α-Mos10 blots were assembled into one picture and
aligned with respect to the Mos10-6His band (Figure 31). In lane 2, the RKY2889 Mos10-6His
strain is loaded, showing the familiar crosslinking pattern between 100 kDa and 70 kDa, not
present in the control lane with WT Mos10, indicated by a black arrow. It can be seen that the
crosslinking pattern is not altered by introducing a Δchm7, Δdid2, and Δist1 deletion, thus none

95
of the deleted proteins is part of the visible crosslinks. With the deletion of the other four
ESCRT-III members, an altered of Mos10-6His pattern was observed. This clearly shows that
the Mos10-6His crosslinking pattern is dependent on a functional ESCRT-III complex. Since
the common pattern of Mos10-6His crosslinks is lost in this second class of ESCRT-III mutants,
the contribution of these proteins to the crosslink pattern cannot be assessed.
Figure 31: Comparison of Mos10-6His specific IMAC WB patterns of ESCRT-III single deletions.
Summary of the Mos10-6His Ni-NTA purification results of the strains RKY1558 (Woodcock et al.), RKY2889
(Mos10-6His), Δchm7 (RKY3228), Δdid2 (RKY2788), Δist1 (RKY2789), Δsnf7 (RKY2790), Δvps2 (RKY2841),
Δvps20 (RKY2893), and Δvp24 (RKY2830). The Mos10 lanes of Figure S 13 - Figure S 21 incubated with α-
Mos10 are shown and height adjusted to the Mos10-6His migrated band. M: NEB Color Pre-stained Protein
Standard (11 - 245 kDa). Arrows: Black: Mos10; Grey: Mos10-6His. Loaded: OD = 1.
3.2 Influence of VPS68 deletion on ESCRT-III The identification of Vps68 as a Mos10 interacting protein led to the assumption that Vps68
could have a direct effect on ESCRT-III complex formation or function. To address this idea, a
series of experiments attempted to elucidate changes in ESCRT-III complex composition and
cellular distribution upon VPS68 deletion.
3.2.1 IP and Co-IP in WT Biochemical analysis of ESCRT-III composition under native conditions was previously
carried out, revealing overall consistent findings with the current model of ESCRT-III (Heinzle
32
46
58
80100135190
kDa245
M 1 2 3 4 5 6 7 8 9

96
et al., 2019). Here, immunoprecipitation analysis using antibodies against seven ESCRT-III
subunits (excluding Chm7 due to poor IP) as individual baits were used to pull out the
associated ESCRT-III proteins to reveal ESCRT-III complex composition. IP and Co-IP
experiments were done in duplicates using DSP as a cleavable crosslinker and the WT strain
RKY1558 as the unperturbed control.
The intensities of the input and co-IP signals (Figure S 22) were quantified with ImageJ. The
co-IP intensities were normalized to the primary IP intensities achieved with the bait antibody
(e.g. if anti-Did2 antibodies precipitate 20 % of the total Did2 protein, then the co-IP
efficiencies were multiplied by a factor of five). Then the intensities were converted into
molecules per cell, according to the molecule numbers determined in a previous study (Heinzle
et al, 2019,Table S 8). Thus, we know how many molecules of ESCRT-III subunits in a cell are
engaged in ESCRT-III complex formation (Table S 6, Figure S 23). Because, the absolute
numbers of ESCRT-III proteins precipitated varies between the different antibodies (e.g. due
to different accessibility of the epitopes), the molar fraction of each ESCRT-III protein engaged
in complex formation was calculated (e.g. molecules of Did2 in the complex divided by the
total number of ESCRT-III molecules in a complex). This normalization leads to very
consistent results among the different bait antibodies (Figure 32).
Figure 32: Molar fraction of ESCRT-III proteins in ESCRT-III complexes in the WT strain RKY1558.
Graphical representation of the co-immunoprecipitation of each ESCRT-III subunit by the seven ESCRT-III IPs.
The percentage value of each Co-IP protein represents the fraction the protein has in ratio to the entire complex.
0
6
2
13
17
1
10
51
03
1518
1
12
44
10
0
2017
0
9
52
9
3
0
19
1
15
50
10
4
20
0 1
15
44
42
28
13
0
9
51
9
4
17 17
10
0
10
20
30
40
50
60
Did2 Ist1 Mos10 Snf7 Vps2 Vps20 Vps24
Com
plex
por
tion/
cell
[%]
Co-IP
Did2 Ist1 Mos10 Snf7 Vps2 Vps20 Vps24

97
Did2 turned out to be the most abundant protein in the complex. Roughly half of ESCRT-III
consists of Did2, Snf7, Vps2 and Vps24 are present in about equimolar amounts (with slightly
less Vps24) and make up most of the rest of the complex. The other proteins, like Vps20, Ist1
and Mos10 are present in minor amounts. A simplified version of the diagram is presented in
Figure 33. Here the average of all co-IP efficiencies (expressed as molar fraction of protein in
a complex) over all bait antibodies is shown.
Figure 33: Simplified ESCRT-III complex composition based on the co-IP in WT strain RKY1558.
Co-immunoprecipitated proteins in reference to the ESCRT-III complex portion in percentage.
3.2.2 IP and Co-IP in the Δvps68 strain RKY3222 To investigate the influence of Vps68 on ESCRT-III composition, the WT strain RKY1558 was
modified to carry a Vps68 deletion mutation (Δvps68 in RKY3222). IP and co-IP experiments
were performed like with RKY1558 by measuring the intensities of the WB signals (Figure S
24), conversion into molecule numbers (Table S 7) and summarizing the results in Figure S 25.
Again, the molar fraction of a given ESCRT-III protein in the complex was calculated as
described for Figure 32. Changes of the molar fraction of a given ESCRT-III protein compared
to wildtype are represented in Figure 34. The simplified version with the average over all bait
antibodies is presented in Figure 35.
45
73
17 16
1
11
0
5
10
15
20
25
30
35
40
45
50
Did2 Ist1 Mos10 Snf7 Vps2 Vps20 Vps24
Com
plex
por
tion/
Cell
[%]
Co-IP

98
Figure 34: Difference between the co-immunoprecipitated values of strains RKY1558 and RKY3222.
Each value of complex portion in percentage gained by the IP from WT strain RKY1558 was set regarding the
values acquired by the IP experiments of RKY3222 strain carrying the Vps68 deletion. Results are gathered and
grouped according to the ESCRT-III protein being co-immunoprecipitated. Values are percentage points.
Figure 35: Co-IP values of strain Δvps68 RKY3222 in comparison to the WT strain RKY1558.
As seen in Figure 33, values of each individual (co-)IP experiment were averaged and adjusted to 100 % before
being plotted. For each co-immunoprecipitated ESCRT-III subunit, the difference between the complex portion in
the deletion strain and the WT strain was highlighted by arrows. Red arrows indicate a decrease in complex
portions compared to the WT strain, whereas green arrows indicate increased protein precipitation.
-2
3
-11
-1
8
32
-13
-4
14
1 1
-7
-2-1
7
3
-7
-1 -2
10
1
-8
-4
-1
4
6
3
-7
-3-2
8
5
-15
-10
-5
0
5
10
15Co
mpl
ex p
ortio
n/Ce
ll [%
]
Did2 Ist1 Mos10 Snf7 Vps2 Vps20 Vps24
Did2 Ist1 Mos10
Snf7 Vps2 Vps20 Vps24
Co-IP
37
52
24
19
1
12
-17%
-29%
-43%
+40%
+19 %
+15 %
0
10
20
30
40
50
Did2 Ist1 Mos10 Snf7 Vps2 Vps20 Vps24
Com
plex
por
tion/
Cell
[%]
Co-IP

99
As seen in Figure 34 and Figure 35, there is an effect on ESCRT-III complex composition due
to the introduction of a Vps68 deletion. Basically, what we see is that the number of core
ESCRT-III proteins Snf7, Vps2 and Vps24 is increased in the VPS68 deletion strain compared
to wildtype, while the number of ESCRT-III associated proteins Did2, Ist1 and Mos10
(implicated in disassembly of ESCRT-III) is decreased. Snf7 polymer assembly is being
increased by 40 % with increased values for Snf7 associated proteins Vps2 and Vps24 of 19 %
and 15 %, respectively. Mos10 seems most influenced by the deletion of Vps68 for being
reduced by 43 %, followed by Ist1 with 29 % and Did2 with 17 % less precipitated due to a
lack of Vps68. This result is in line with the notion that the transition from an active ESCRT-
III complex to a disassembly complex is delayed in the VPS68 deletion strain.
3.2.3 Effect of VPS68 deletion on the intracellular ESCRT-III protein
distribution Fluorescence microscopy was used to observe proteins under a microscope to detect changes
in the intracellular distribution of ESCRT-III subunits upon Vps68 deletion. Therefore, every
ESCRT-III protein was C-terminally tagged with sfGFP in the WT and Δvps68 background.
Each of the eight WT and eight Δvps68 strains was examined by fluorescence microscopy. For
each strain, a representative cell is depicted in Figure 36.
WT Δvps68
DIC sfGFP sfGFP DIC
Chm7
Did2
Ist1

100
WT Δvps68
DIC sfGFP sfGFP DIC
Mos10
Snf7
Vps2
Vps20
Vps24
Figure 36: Intracellular distribution of ESCRT-III proteins by fluorescence microscopy.
Every ESCRT-III subunit was C-terminally tagged with sfGFP in the WT RKY 1558 background and the Δvps68
RKY3222 background. A representative cell was chosen to visualize the typical distribution of each protein.
The fluorescence staining directly reflects the protein distribution inside the cell. A uniformly
distributed signal indicates a cytosolic distribution of the protein, like seen with Chm7 and
Vps20. Did2, Ist1, and Vps24 were present in distinct dot-like structures, which presumably
correspond to endosomes. Another phenotype seen with Vps2 and Snf7 is the assembly into
small cortical dots, which could be associated with the plasma membrane, with one or more
additional, presumably endosomal dots inside the cell. The intracellular distribution of these
proteins was not significantly affected by the VPS68 deletion. A clear difference, however, was

101
noted for the Mos10 protein. In the wildtype strain, Mos10 shows a classical "class E"
distribution with staining around the vacuole and a patchy structure at the vacuolar membrane.
However, the fluorescence signal drastically changed when Vps68 was lacking, leading to
dotlike staining distributed inside the cell and primarily located close to the cell’s plasma
membrane. Besides minor changes within the different strains, the phenotypical alteration of
Mos10 staining seems most severe. Since the fluorescence signal directly reflects protein
distribution, Mos10 localization shifts from the class E compartment to the PM.
Vps68 interacts biochemically with Mos10. To see, whether this result can be reproduced by
fluorescence microscopy, double mutant strains were created carrying sfGFP and mCherry
tagged variants for the simultaneous detection of both proteins. A typical cell showing the
overall staining of the mutant strains RKY3221 (Mos10-sfGFP) and RKY3226 (RKY3221 +
Vps68-mCherry) can be seen in Figure 37.
Figure 37: Vps68-mCherry induced localization shift of Mos10-sfGFP.
Images of fluorescence microscopy with sfGFP tagged Mos10 strain RKY3221 (top panels) and Mos10-sfGFP &
Vps68-mCherry strain RKY3226 (bottom panels) carrying two different fluorescent tags.
As presented above (Figure 37), the sfGFP tagged variant of Mos10 led to a typical class E
staining (upper row of Figure 37). Introduction of Vps68-mCherry into this strain changed the
localization of Mos10-sfGFP to a distribution reminiscent to the VPS68 deletion. From this, it
can be concluded that Vps68-mCherry is largely non-functional. Some of the structures,
especially those close to the vacuole, stained for both proteins. Thus, Vps68-mCherry and
Mos10-sfGFP colocalize in these structures. The cortical Mos10-sfGFP dots, however, do not
seem to be stained for Vps68-mCherry. To exclude a tag-induced phenotype and to get a better
fluorescence signal for Vps68, three new strains were constructed, which express Vps68-sfGFP
Mos10-sfGFP
Mos10-sfGFP +Vps68-mCherry
mCherry sfGFP Merge DIC

102
(RKY3183), Mos10-mCherry (RKY3262) and both proteins with the respective tags
(RKY3264). As seen in Figure 38, switching the tags did not change the localization of the two
tagged proteins. What can be seen in this figure is that the localization of both tagged proteins
is altered by tagging of the respective partner protein. Vps68-sfGFP alone displays a class E
staining pattern. This staining is dispersed when Mos10 is simultaneously tagged with mCherry.
Figure 38: Reverse Vps68 and Mos10 tagging to visualize protein distribution.
Images of fluorescence microscopy with sfGFP tagged Vps68, Mos10-mCherry, and the Vps68-sfGFP &
Mos10mCherry double staining.
3.3 Cell-fractionation To complement the fluorescence experiments, the influence of Vps68 on the intracellular
localization of ESCRT-III proteins was examined by cell-fractionation, with a focus on Mos10.
The advantage of this approach is that it can be performed with native, untagged proteins.
3.3.1 Differential centrifugation experiments Cellular components in a cell extract can be separated by their sedimentation velocity during
centrifugation. To this end, cell extracts were first centrifuged at 500 g to remove cell debris,
followed by a 13.000 g spin to sediment larger or heavier particles (P13). The S13 supernatant
is then subjected to a centrifugation at 100.000 g to obtain a P100 pellet, containing smaller
Vps68-sfGFP
Vps68-sfGFP +Mos10-mCherry
Mos10-mCherry
sfGFP mCherry Merge DIC
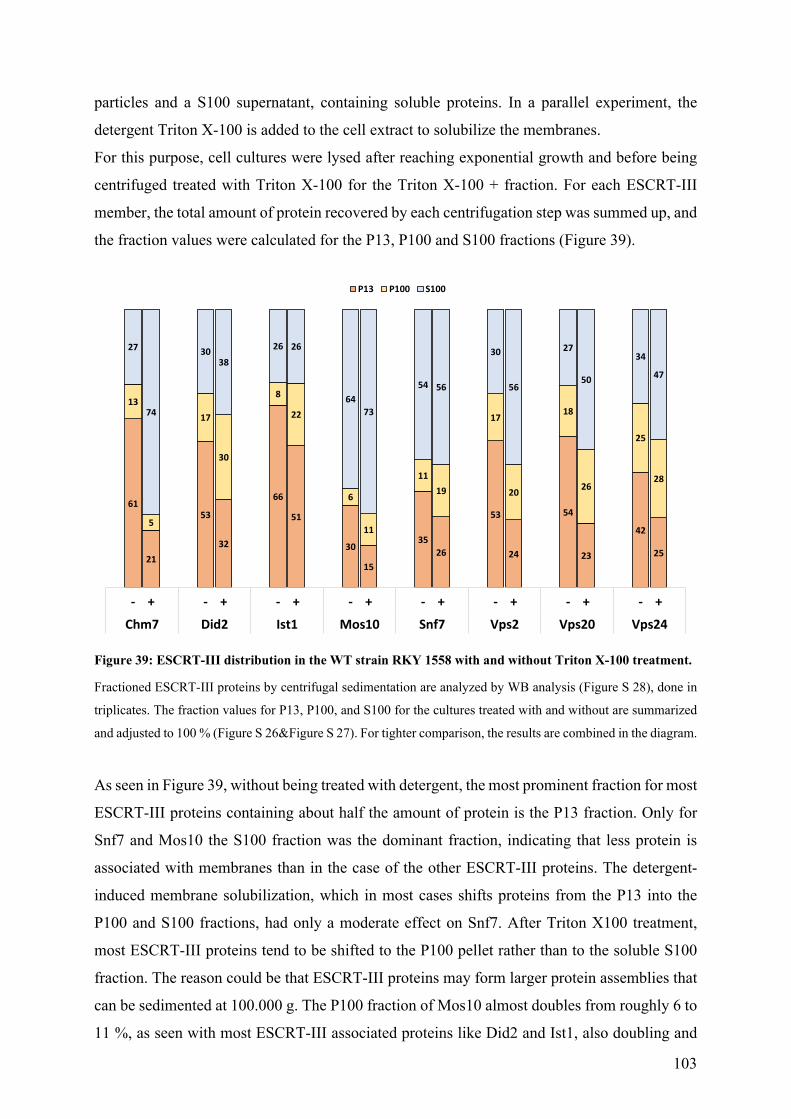
103
particles and a S100 supernatant, containing soluble proteins. In a parallel experiment, the
detergent Triton X-100 is added to the cell extract to solubilize the membranes.
For this purpose, cell cultures were lysed after reaching exponential growth and before being
centrifuged treated with Triton X-100 for the Triton X-100 + fraction. For each ESCRT-III
member, the total amount of protein recovered by each centrifugation step was summed up, and
the fraction values were calculated for the P13, P100 and S100 fractions (Figure 39).
Figure 39: ESCRT-III distribution in the WT strain RKY 1558 with and without Triton X-100 treatment.
Fractioned ESCRT-III proteins by centrifugal sedimentation are analyzed by WB analysis (Figure S 28), done in
triplicates. The fraction values for P13, P100, and S100 for the cultures treated with and without are summarized
and adjusted to 100 % (Figure S 26&Figure S 27). For tighter comparison, the results are combined in the diagram.
As seen in Figure 39, without being treated with detergent, the most prominent fraction for most
ESCRT-III proteins containing about half the amount of protein is the P13 fraction. Only for
Snf7 and Mos10 the S100 fraction was the dominant fraction, indicating that less protein is
associated with membranes than in the case of the other ESCRT-III proteins. The detergent-
induced membrane solubilization, which in most cases shifts proteins from the P13 into the
P100 and S100 fractions, had only a moderate effect on Snf7. After Triton X100 treatment,
most ESCRT-III proteins tend to be shifted to the P100 pellet rather than to the soluble S100
fraction. The reason could be that ESCRT-III proteins may form larger protein assemblies that
can be sedimented at 100.000 g. The P100 fraction of Mos10 almost doubles from roughly 6 to
11 %, as seen with most ESCRT-III associated proteins like Did2 and Ist1, also doubling and
61
21
53
32
66
51
30
15
3526
53
24
54
23
42
25
13
5
17
30
8
22
6
11
1119
17
20
18
26
25
28
27
74
3038
26 26
6473
54 56
30
56
27
50
34
47
- + - + - + - + - + - + - + - +
Chm7 Did2 Ist1 Mos10 Snf7 Vps2 Vps20 Vps24
P13 P100 S100

104
nearly tripling in P100 fraction sedimentation. After Triton X-100 treatment, all ESCRT-III
core proteins show an almost identical distribution of 25 % P13, 25 % P100, and 50 % S100.
To elucidate Vps68 induced alterations in the distribution of all ESCRT-III subunits, the
experiment was also conducted in the Vps68 deletion strain RKY3222 (Figure 40).
Figure 40: Sedimentation comparison between WT strain RKY1558 and Vps68 deletion strain RKY3222.
Comparison of the WB results gained from the differential centrifugation experiment results seen in Figure S 28
& Figure S 33. The fraction values for P13, P100, and S100 for the cell extracts without Triton X-100 treatment
are summarized and adjusted to 100 % (Figure S 26 & Figure S 30). For better comparison, the results are
combined in one diagram.
Similar to the co-immunoprecipitation experiment, two classes of ESCRT-III proteins can be
distinguished. The core ESCRT-III proteins Snf7, Vps2 and Vps24 showed basically the same
distribution in the VPS68 deletion strain as in the wildtype. No significant changes were
observed. In the case of the ESCRT-III associated proteins Chm7, Did2 and Mos10 a reduction
in the P13 fraction could be seen in the VPS68 deletion strain compared to wildtype. Only Ist1
showed a different behavior here by not being altered in ∆vps68. A comparison of the Triton
X-100 treated samples showed no significant differences between ∆vps68 and wildtype
(Figure S 32).
61
4253
36
66 64
3022
35 35
53 48 5441 42 40
13
16
17
22
8 7
610
11 15
1719
18
21 25 22
2742
3043
26 29
64 6754 50
30 33 2738 34 37
WTΔ WTΔ WTΔ WTΔ WTΔ WTΔ WTΔ WTΔ
Chm7 Did2 Ist1 Mos10 Snf7 Vps2 Vps20 Vps24
P13 P100 S100

105
3.3.2 Flotation An alternative fractionation experiment was chosen since the fractionation of proteins based on
their sedimentation cannot differentiate between membrane associated protein and protein in
larger aggregates. A series of flotation experiments was performed to directly determine the
membrane associated fraction, since in the flotation experiment membranes float to the top of
the gradient, where they are collected.
Figure 41: Flotation comparison between WT strain RKY1558 and Vps68 deletion strain RKY3222.
A flotation experiment was carried out with both strains collecting six fractions from the gradient. After evaluating
each fraction by WB analysis and ImageJ, quantification values were summed up and grouped into fractions 1-3
and 4-6 containing either the first three (membrane) fractions or the last three (cytosolic) fractions.
For a better overview, the topmost three fractions containing the membrane-associated proteins
and the last three fractions at the bottom of the tube containing cytosolic proteins were
combined (the percentage of the total protein is given). Figure 41 sums up the flotation results
from Figure S 34 & Figure S 35 obtained from the WB results in Figure S 38 & Figure S 40.
For most ESCRT-III proteins, 30-50 % of the protein proved to be membrane associated, only
for Mos10 hardly any protein could be detected in the membrane fraction. The determined
values for the float fraction roughly correspond to the P13 fraction seen in the differential
centrifugation experiment. Deletion of VPS68 had no significant effect on membrane
association of the proteins.
3728 33 34
5545
12 1024 29
38 38
58 63
3037
6372 67 66
4555
88 9076 71
62 62
42 37
7063
WT Δ WT Δ WT Δ WT Δ WT Δ WT Δ WT Δ WT Δ
Chm7 Did2 Ist1 Mos10 Snf7 Vps2 Vps20 Vps24
P 1-3 P 4-6

106
Snf7 has a crucial role in the formation of the ESCRT-III complex. Loss of Snf7 should be
reflected in a reduced membrane association of the other ESCRT-III components. To test this
prediction a flotation experiment was performed with a SNF7 deletion strain (RKY2790). As
summarized in Figure 42, membrane association of all ESCRT-III proteins, except Mos10, was
reduced in ∆snf7 compared to wildtype. Interestingly, a basal level of membrane association
was maintained in the deletion strain. This could point to a Snf7-independent function of the
other ESCRT-III proteins, or it could be an indication of unspecific membrane binding. At this
point, it cannot be distinguished between these two possibilities. The lack of effect on Mos10
membrane association could indicate that the observed membrane binding of 11-12 % is
unspecific.
Figure 42: Flotation comparison between the WT strain RKY1558 and the Δsnf7 strain RKY2790.
The diagram sums up the flotation results from Figure S 34 & Figure S 36 obtained from the WB results in Figure
S 38 & Figure S 39.
3.3.3 Sucrose Gradients For a more detailed overview of ESCRT-III distribution, yeast strains were fractioned by a
sucrose density gradient giving 18 fractions going from cytosolic through different membrane-
bound states. The fractionation of the WT strain RKY1558 is depicted in Figure 43.
37 39 33
9
55
39
12 1124
3824
58
3830
22
63 61 67
91
45
61
88 8976
6276
42
6270
78
WT Δ WT Δ WT Δ WT Δ WT Δ WT Δ WT Δ WT Δ
Chm7 Did2 Ist1 Mos10 Snf7 Vps2 Vps20 Vps24
P 1-3 P 4-6

107
Figure 43: ESCRT-III distribution fractionation by sucrose density gradient separation.
Sucrose density fractionation into 18 fractions based on the sedimentation rate of all ESCRT-III proteins.
Each ESCRT-III protein is presented on an intensity scale depending on the abundance in each
fraction calculated by the band intensities of the WB in Figure S 44. The highest value was set
to 100 %. All proteins have their maximum in the fractions 1-4, representing the cytosolic
0
20
40
60
80
100
0
20
40
60
80
100
0
20
40
60
80
100
0
20
40
60
80
100
0
20
40
60
80
100
0
20
40
60
80
100
0
20
40
60
80
100
0
20
40
60
80
100
1 2 3 4 5 6 7 8 9 10 11 12 13 14 15 16 17 18
Inte
nsity
[%]
Inte
nsity
[%]
Fractions
Chm7
Did2
Ist1
Mos10
Snf7
Vps2
Vps20
Vps24

108
fractions. ESCRT-III proteins Did2, Mos10, and Snf7 start with 100 % in fraction 1 before
continuously decreasing in succeeding fractions. Ist1, Vps2, and Vp24 reach their maximum
fraction abundance in fraction 2 before continually dropping in later fractions. Slight shifts are
only detectable with Vps20 peaking in fraction 3 and Chm7 getting the highest value in fraction
4. It is further worth noticing that most proteins after reaching a small plateau phase have a
slight local maximum at fraction 13. The fraction 13 contribution is most visible with Did2,
Ist1, Vps2, and Vps20. Lastly, an increase in intensity can be measured in the last fraction (18)
since the fraction showed the highest variance in sample size and density collects everything
sedimented throughout the entire tube.
To compare the WT results with the Δvps68 strain, the sucrose gradient was also performed in
the altered strain background seen in Figure S 42. Like in previous experiments, the differences
between each strain are minor, resulting in the highest sedimentation in the first four sucrose
gradient fractions. The gradients of Vps2 and Vps20 seem shifted to slightly denser fractions,
by which it should be highlighted that the overall presence of these proteins often led to
variations in analyzing the WB (Figure S 46). What remains evident is the local peak observed
in fraction 13, which is still present in the Vps68 lacking strain and seems slightly increased for
proteins like Did2, Ist1, and Vps2. The only difference regarding Mos10 (and Snf7) localization
is the maximum peak shift from fraction 1 to fraction 2, not hinting at any altered distribution
or association inside the cell’s organization.
Although the different experiments are designed to visualize native protein distribution, the
effect observed by fluorescence microscopy of an altered localization of Mos10 was done with
the sfGFP tagged variant. To address the impact of the tag, the sucrose density gradient was
repeated using the tagged Mos10 variant in the WT and the Vps68 depleted strain. Different
marker proteins were additionally applied to assign protein distribution to specific cell
organelles. The marker protein alkaline phosphatase (Alp1) was chosen for the vacuolar
compartment targeting the vacuole like the established ESCRT-III localization (Klionsky and
Emr, 1989). Further, the ER marker dolichol phosphate mannose synthase (Dpm1), the
acetolactate synthase Ilv2 for mitochondria, and the protein Pep12 for marking the late
endosome were applied to sucrose gradient fractionation (Bassham et al., 1995, Falco et al.,
1985, Orlean, 1990).

109
Figure 44: Gradient of tagged Mos10 in WT and Δvps68 background in comparison with marker proteins.
Gradient separation of protein and marker fractions based on the sedimentation rate. Marker proteins Alp1, Dpm1,
Ilv2, and Pep12, were chosen to mark subcellular organelles and compare those compartment distributions with
the tagged variant of Mos10 in WT and Vps68 depletion strain.
As seen in Figure 44, each of the marker proteins shows a unique distribution on the sucrose
gradient. The peak for Alp1 was collected in fraction 10, whereas Dpm1 peaks in fractions 11
and 12. Pep12 has a peak in fraction 7, and Ilv2 shows two peaks in fraction 7 and 11.
The distribution of Mos10-sfGFP was clearly different form the distribution of the native
protein. While native Mos10 was exclusively found in the soluble fraction (Figure 43), Mos10-
0
20
40
60
80
100
0
20
40
60
80
100
0
20
40
60
80
100
0
20
40
60
80
100
0
20
40
60
80
100
0
20
40
60
80
100
1 2 3 4 5 6 7 8 9 10 11 12 13 14 15 16 17 18In
tens
ity [%
]
Inte
nsity
[%]
Fractions
Alp1
Dpm1
Ilv2
Pep12
Mos10-sfGFP
Mos10-sfGFP ΔVps68

110
sfGFP now formed a broad peak in the middle of the gradient centered around fraction 9. The
distribution of Mos10-sfGFP in the ∆vps68 background looked somehow similar.
The profile of Mos10-sfGFP appears quite different compared to the marker proteins, and the
peak values also do not fit to any other protein. The closest match is with the Alp1 profile
marking the vacuole in line the class E localization of Mos10-sfGFP in the fluorescence images.
In the ∆vps68 background the Mos10-sfGFP profile is shifted more towards the left with a peak
in fraction 8 and thus resembles more the Pep12 profile.
3.4 Perturbations in endocytic cargo degradation and transport As a vacuolar protein sorting (vps) function, Vps68 has been implicated in protein transport to
the vacuole. To confirm this role of Vps68 in the transport of endocytic cargo proteins to the
vacuole, the turnover of the ABC transporter Ste6 was examined by a cycloheximide chase
experiment. Ste6 is transported to the vacuole for degradation and has short half-life (Kölling
and Hollenberg, 1994). Cycloheximide (CHX) blocks protein synthesis, so the fate of pre-
existing Ste6 protein can be followed over time after CHX addition. After applying CHX, a
sample was taken every 20 min for 80 mins, and the degradation was monitored by WB
analysis.
WT Δvps68
Set 1
0
10
20
30
40
50
60
70
80
90
100
0 10 20 30 40 50 60 70 80
Inte
nsity
[%]
Time [min]
0
10
20
30
40
50
60
70
80
90
100
0 10 20 30 40 50 60 70 80
Inte
nsity
[%]
Time [min]
t20t0 t40 t60 t80M t0 t20 t40 t60 t80M

111
WT Δvps68
Set 2
Figure 45: Cycloheximide chases of Ste6 in WT strain RKY1558 and Δvps68 strain RKY3222.
Degradation of native Ste6 was monitored by WB analysis from 0 min, thus portraying the absolute amount of
protein present in the cell, up to 80 min after cycloheximide treatment and inhibition of protein biosynthesis. The
experiment was done twice to highlight variation in the experimental outcome.
Two sets of experiments were performed with the wildtype and the ∆vps68 strain, summarized
in Figure 45, which includes the WB pictures directly visualizing degradation of Ste6. In the
wildtype Ste6 is quickly degraded with a half-life of about 24 min (Table 23). In the ∆vps68
strain Ste6 is clearly stabilized with a half-life of about 165 min. This shows that Vps68 is
involved in transport of Ste6 to the vacuole.
Table 23: Half-life of CPS in WT and Vps68 depleted strain.
Experiment WT [min] R2 Δvps68 [min] R2
1 21 0.9793 231 0.9311
2 27 0.969 99 0.970
Average 24 165
0
10
20
30
40
50
60
70
80
90
100
0 10 20 30 40 50 60 70 80
Inte
nsity
[%]
Time [min]
0
10
20
30
40
50
60
70
80
90
100
0 10 20 30 40 50 60 70 80
Inte
nsity
[%]
Time [min]
t0 t20 t40 t60 t80M t0 t20 t40 t60 t80M

112
Figure 46: Classifying Vps68 deletion by established Class D & E protein null mutations.
The strain was compared to known class D and class E phenotypes of the single deletion strains of Vps21
(RKY1920) and Bro1 (RKY1922) to classify Δvps68 Ste6-sfGFP phenotype. Classical class E is depicted as a
ring around the vacuole with a dot on one side and class D as an accumulation of fluorescence signal on the tip of
the daughter cell.
To see at which step in the endocytic pathway Vps68 acts, the localization of Ste6-sfGFP
(pRK1785) was examined by fluorescence microscopy. The phenotype of the ∆vps68 mutant
was compared with other vps-mutants with an established sorting phenotype (Figure 46). In the
WT strain, a uniformly stained vacuole indicates that Ste6-GFP is transported into the lumen
of the vacuole.
The Rab GTPase Vps21 is a class D protein that is required for fusion of endocytic vesicles
with the endosome. Previously, it was shown that Ste6-GFP exhibits enhanced recycling to the
cell surface in a ∆vps21 mutant (Krsmanovic et al., 2005). As can be seen in Figure 46, Ste6-
GFP stains the bud surface and localizes to small vesicles concentrated in the bud. The class E
phenotype is exemplified by the ∆bro1 mutation, where Ste6-GFP stains the vacuolar
membrane and a patchy structure at the vacuole. The ∆vps68 mutant showed neither a class D
DICSte6-sfGFP
WT
Δbro1(Class E)
Δvps21(Class D)
Δvps68

113
nor a class E phenotype. The Ste6-GFP staining resembled wildtype with a somewhat enhanced
staining of endosomal dots. This indicates that the ESCRT-III function is not blocked in a
∆vps68 mutant (otherwise a class E compartment should have been formed).
As seen in Figure 47, sorting CPS-sfGFP (pRK1405) into the vacuole interior in the WT strain
leads to a uniformly staining of the vacuole’s internal space. When Vps68 becomes absent, the
transport inside the cell seems disturbed, highlighted by the fluorescence signal appearing to be
a class E phenotype-like ring with two dots attached to it like seen with Mos10- & Vps68-
sfGFP tagging. Multi copy CPS expression seems to cause this phenotype which needs to be
further addressed by chromosomal integration of the CPS-sfGFP cassette.
Figure 47: Perturbation of CPS cargo sorting by Vps68 deletion.
Fluorescence microscopy was used to monitor CPS cargo distribution in a WT and Δvps68 strain by attaching
sfGFP to the cargo, thus visualizing Vps68 deletion-induced perturbations in proper cargo degradation. A distinct
vacuolar and class E staining becomes visible.
3.5 Synchronized ESCRT-III assembly
When a cell extract is prepared for biochemical analysis, it contains a mixture of different
functional states of ESCRT-III. To dissect the changes of ESCRT-III during a functional cycle,
it would be useful, if the ESCRT-III cycles in the cell culture could be synchronized. It was
explored, whether this goal could be reached by making use of a temperature sensitive vps27
mutant. Vps27 is part of ESCRT-0, which is involved in cargo recruitment and represents the
entry point of the ESCRT cascade. A shift to non-permissive temperature (37°C) should block
WT
Δvps68
DICCPS-sfGFP

114
the ESCRT cascade at this early step. After release to permissive temperature (23°C), the
ESCRT cascade should resume, hopefully in a synchronized way. A yeast strain was
constructed that contains the vps27-ts mutation in the genome. When this strain is incubated at
higher temperatures, the protein’s function is inhibited, leading to a disturbed ESCRT
machinery resulting in a class E phenotype for the Ste6-GFP cargo protein as observed by
fluorescence microscopy. Figure 48 shows how the Ste6-GFP signal changes over time after
the shift to non-permissive temperature (37°C).
Figure 48: Heat-induced alteration of ESCRT-III assembly and disassembly by a Vps27 variant.
Timewise visualization of class E phenotype development induced by heating the samples to 37 °C before cooling
back to 23 °C. Class E phenotype formation is pictured by fluorescence Ste6-GFP distribution.
Initially, the Vps27ts strain RKY3208 was incubated at 23 °C to ensure WT-like growth and
behavior as visible by a typical vacuole lumen staining of Ste6-GFP. The cells were then shifted
to 37°C and examined after 30 min for changes in the fluorescence signal. As can be seen in
the second column, the vacuole is still uniformly stained, but a dot becomes attached to the
vacuoles. The class E phenotype with staining of the vacuolar membrane became clearer after
incubating for 150 min. After ON incubation, all cells in the culture showed a typical class E
phenotype resulting from the ESCRT machinery disruption by Vps27 inhibition. Then the
culture was incubated again at 23 °C to ensure Vps27 functionality and reverse the repression
of the ESCRT function. As seen in the fifth column, after incubating the culture for 150 min at
23 °C, the class E phenotype remains visible, and even after incubating for about six hours, the
class E phenotype persisted. Thus, the class E structures appear to be dead-end structures that
will not resolve after release of the vps27-ts block. For this reason, this system does not seem
to be suitable to observe the changes in ESCRT-III composition during the ESCRT-III
functional cycle.
DIC
Ste6-sfGFP
30 min, 37 °C23 °C 150 min, 37 °C ON, 37 °C 150 min, 23°C 300 min, 23°C

115
3.6 Linking ESCRT-III to non-endosomal functions
The initial idea was to link the ESCRT-III subunit Mos10 (and later also Did2) to non-
endosomal functions, since in the classical ESCRT-III complex assembly the protein function
still needed to be elucidated. Experiments were carried out based on literature research and
unpublished data from our lab to search for the protein’s purpose outside the established
complex.
3.6.1 Potential association of ESCRT-III with nucleic acids Upon sucrose density gradient fractionation of ESCRT-III proteins, a massive accumulation of
certain ESCRT-III proteins (Did2, Ist1, Vps2 and Vps24) in the middle of the gradients was
observed (Heinzle et al., 2019). Since no Snf7 was detected within these fractions, it appeared
unlikely that these structures represent normal endosomal ESCRT-III complexes engaged in
ILV formation at MVBs. A number of findings point to a nuclear role of ESCRT-III proteins.
For instance, for yeast and mammalian cells, it has been shown that ESCRT-III complexes can
assemble at the inner nuclear membrane in a Chm7/CHMP7 dependent manner. Further
association of ESCRT-III protection against genomic instability by micronuclei formation and
additional work on the LEMD2 and ESCRT-III connection to suppress nuclear deformation
and DNA damage led to the idea of an ESCRT-III-DNA connection (Vietri et al., 2020, von
Appen et al., 2020, Willan et al., 2019).
To test whether an ESCRT-III-DNA/RNA association is responsible for the formation of the
observed peaks on our sucrose gradients, cell extracts were treated with DNaseI or RNaseA
before sucrose density gradient fractionation. Mg2+ was added to the buffer, because nucleases
in general require Mg2+ as a cofactor. The cell extracts were incubated with the enzymes for 30
min at 37°C before centrifugation. Unfortunately, a direct effect of the enzyme treatment on
ESCRT-III complex formation or location could not be verified, since the enzyme treatment
caused precipitation of proteins. An example blot developed with anti-Did2 antibodies can be
seen in Figure S 41. When the blots were stained with the dye Ponceau S, barely any protein
bands were visible. Instead, a strong band in the range of 17 kDa was observed, which probably
corresponds to the added RNaseA enzyme.
Although the initial idea was abandoned, a remarkable effect was noted. The incubation of the
cell extracts at 37°C before centrifugation led to a massive accumulation of Did2 in the heavy
fractions of the gradient. The effect was even detectable without addition of enzymes or other
additives (Figure 49).

116
Figure 49: ESCRT-III distribution on sucrose density gradients after pre-incubation.
Sucrose density fractionation into 18 fractions based on the sedimentation rate of all ESCRT-III proteins after
incubation for 30 min at 37 °C in SPBS10 buffer.
The profiles in Figure 49 can be directly compared to the profiles in Figure 44, where no pre-
incubation of cell extracts was performed. Did2 showed a pronounced peak around fraction 13
after pre-incubation. Similar, but smaller effects could also be observed for Ist1, Vps20 and
0
20
40
60
80
100
0
20
40
60
80
100
0
20
40
60
80
100
0
20
40
60
80
100
0
20
40
60
80
100
0
20
40
60
80
100
0
20
40
60
80
100
0
20
40
60
80
100
1 2 3 4 5 6 7 8 9 10 11 12 13 14 15 16 17 18
Inte
nsity
[%]
Inte
nsity
[%]
Fractions
Chm7 Incubated
Did2 Incubated
Ist1 Incubated
Mos10 Incubated
Snf7 Incubated
Vps2 Incubated
Vps20 Incubated
Vps24 Incubated

117
Vps24. This effect does not depend on Vps68, since the profiles were unchanged in the VPS68
deletion strain RKY3222 (Figure S 43). A flotation experiment was carried out and compared
with the sucrose gradient data to exclude an experimental artifact (Figure 50).
Figure 50: Flotation experiment with WT strain RKY1558 with and without incubation.
Comparison of the flotation experiments by analyzing the WB results with ImageJ and calculating the protein
distribution into the P1-3 or 4-6 fraction groups.
Comparing the results of the untreated cell extracts with the heat-treated cell extracts revealed
changes in the distribution of the ESCRT-III members Chm7 and Did2. These proteins showed
a marked increase of the floating membrane fraction (P1-3), which at least for Did2 correlates
nicely with the results gained by the sucrose gradients. For Did2, the membrane associated
fraction increased by a factor of two (33 % to 69 %). On the other hand, proteins that do not
seem to be affected by the heat treatment on the sucrose gradients also do not show an altered
distribution in the flotation experiment as seen for Mos10, which remains the least membrane-
associated protein of the entire ESCRT-III family. The Dpm1 maker protein was also examined
in the flotation experiment to control for a general effect of heat treatment on the membrane
proteins. Dpm1 was only slightly increased in the membrane fraction (+ 3 %) upon pre-
incubation at 37°C. The strong effect on Did2 therefore seems to be specific.
Further, it was tested how GFP tagging affects the distribution of Did2 on sucrose gradients.
Therefore, the distribution of native Did2, with and without pre-incubation, and the distribution
37
56
33
6955 52
12 1224 29
38 42
5867
3036
88 91
63
44
67
3145 48
88 8876 71
62 58
4233
7064
12 9
30°C
37°C
30°C
37°C
30°C
37°C
30°C
37°C
30°C
37°C
30°C
37°C
30°C
37°C
30°C
37°C
30°C
37°C
Chm7 Did2 Ist1 Mos10 Snf7 Vps2 Vps20 Vps24 Dpm1
P 1-3 P 4-6

118
of N- or C-terminally tagged Did2 was analyzed. For comparison, the distribution of the marker
proteins Alp1, Dpm1, Ilv2 and Pep12 was determined (Figure 51).
Figure 51: Sucrose gradients of N-& C-terminally tagged Did2 in comparison with marker proteins.
Gradient separation of protein and marker fractions based on the sedimentation rate. Marker proteins Alp1, Dpm1,
Ilv2, and Pep12, were chosen to mark subcellular organelles and compare those compartment distributions with
the distribution of Did2, incubated Did2, GFP-Did2, and Did2-sfGFP.
The results show that C-terminally tagged Did2-sfGFP had an altered distribution compared to
native Did2, with a pronounced peak around fraction 13. Apparently, Did2 function or behavior
is compromised by C-terminal tagging. Interestingly, the profile for Did2-sfGFP looked very
similar to the profile for native Did2 after pre-incubation at 37°C. Thus, pre-incubation seems
to exert the same effect on the protein as C-terminal tagging. One explanation could be that
both treatments convert Did2 from a closed into an open conformation, thus leading to an
activation of the protein. Activation could result into filament formation and enhanced
membrane association of the protein. N-terminal tagging of Did2 did not have this effect.
Apparently, sfGFP-Did2 is more wildtype-like. The Did2 peak around fraction 13 does not
coincide with any of the markers tested.
020406080
100
020406080
100
020406080
100
020406080
100
020406080100
020406080100
020406080100
020406080100
1 2 3 4 5 6 7 8 9 10 11 12 13 14 15 16 17 18
Inte
nsity
[%]
Inte
nsity
[%]
Fractions
Alp1
Dpm1
Ilv2
Pep12
Did2
GFP-Did2
Did2 incubated
Did2-sfGFP

119
The tag position also affected Did2 staining pattern under fluorescence microscope (Figure 52).
In both cases dot-like structures, presumably endosomes, were observed, but in case of the C-
terminally tagged protein the dots were more numerous and brighter than in the case of the N-
terminally tagged protein. This is in line with the sucrose gradient results, which show that more
C-terminally tagged protein is at the membrane compared to the N-terminally tagged protein.
Figure 52: C- & N-terminal tagging of Did2 by GFP/sfGFP.
Monitoring protein distribution by n-terminal tagged GFP-Did2 and c-terminal tagged Did2-sfGFP under a
fluorescence microscope with equal set exposure times.
3.6.2 P-bodies and stress markers Due to experiments done in our lab, 2-hybrid interactions between Mos10 and the ER/Golgi
associated proteins Ltc2 and Emp47 were detected. This could point to a function of Mos10 at
the ER. Functions for ESCRT-III proteins at the ER have been described. For instance, it could
be shown that RNA viruses, heterologously expressed in yeast, mature in ER invaginations and
that the maturation is ESCRT-III dependent. Such viruses normally do not exist in yeast, thus
there must be a natural process that is hijacked by the viruses. A potential process could be P-
body formation, which has been shown to occur at the ER membrane.
Therefore, it was examined whether different P-body and stress markers are associated with
Mos10 or the ESCRT-III machinery (Kilchert et al., 2010). P-body markers were tagged with
sfGFP and their distribution was visualized by fluorescence microscopy in the WT (RKY1558),
Δmos10 (RKY2892), and Δ8 (RKY2844) strains under native conditions and after incubating
at 37 °C for 30 min or treatment with 0.5 % (w/v) NaN3, which are P-body inducing conditions.
Did2-sfGFP
GFP-Did2
sfGFP/GFP DIC

120
Figure 53: Heat and sodium azide-induced stress granule formation visualized by Pub1-sfGFP.
WT (RKY1558), Δmos10 (RKY2892), and Δ8 (RKY2844) strains were grown in YPD media as the control
sample. Additionally, cell cultures were either incubated at 37 °C for 30 min or treated with the addition of 0.5 %
(w/v) NaN3 to induce a stress response and thus the formation of compartments identified by Pub1-sfGFP.
For Pub1-sfGFP, the fluorescence signal appears uniformly distributed inside the cell regardless
of the strain background or condition used (Figure 53). The only difference noted was an
increase in signal intensity upon incubation at 37°C. In all cases, the vacuolar space can be
identified due to a lack of fluorescence signal. In contrast to reports in the literature, no P-bodies
were formed under these conditions. Lack of P-body formation could be a property of our strain
background used. Thus, conclusion about the contribution of Mos10 or ESCRT-III to P-body
formation cannot be made by this experiment.
Figure 54: Heat and sodium azide-induced replication stress visualized by Dcp2-sfGFP.
WT (RKY1558), Δmos10 (RKY2892), and Δ8 (RKY2844) strains were grown in YPD media as the control
sample. Additionally, cell cultures were either incubated at 37 °C for 30 min or treated with the addition of 0.5 %
(w/v) NaN3 to induce a stress response and thus the formation of compartments identified by Dcp2-sfGFP.
Δ8
Δmos10
WT
Control 37 °C NaN3
DIC sfGFP DIC sfGFP DIC sfGFP
Δ8
Δmos10
WT
Control 37 °C NaN3
DIC sfGFP DIC sfGFP DIC sfGFP

121
With the second marker Dcp2-sfGFP, which forms stress-related dots in the cell, distinct dots
became visible under native conditions in the WT and the Δmos10 strain, but not in the Δ8
strain, which shows more uniformly distributed staining inside the cell. When stressing the cells
with heat or azide, all strains show dots distributed in the cell, which do not appear to be
associated with a specific compartment. Also, the Δ8 strain now shows dots with no
distinguishable difference to the other strains. Since WT and Δmos10 strain are similar, a
specific Mos10 related function in replication stress response by Dcp2 was excluded.
The last marker tested was Nmd2 involved in the nonsense-mediated mRNA stress response
(Figure 55). The cells show similar fluorescence signals under native and heat-treated
conditions with a uniformly distributed staining of the cell. When introducing NaN3 to the cell,
dots are formed, which seem primarily associated with the PM. Unfortunately, again all strains
behaved the same, thus no specific effect of MOS10 or ESCRT-III deletion could be
demonstrated. In conclusion, none of the marker proteins tested showed an ESCRT-III
dependence on P-body or stress granule formation.
Figure 55: Heat and sodium azide-induced mRNA stress visualized by Nmd2-sfGFP.
WT (RKY1558), Δmos10 (RKY2892), and Δ8 (RKY2844) strains were grown in YPD media as the control
sample. Additionally, cell cultures were either incubated at 37 °C for 30 min or treated with the addition of 0.5 %
(w/v) NaN3 to induce a stress response and thus the formation of compartments identified by Nmd2-sfGFP.
Δ8
Δmos10
WT
Control 37 °C NaN3
DIC sfGFP DIC sfGFP DIC sfGFP

122
4 DISCUSSION
4.1 The Mos10 crosslinking pattern The most consistent result through all different purification experiments done in this thesis is
the crosslinking pattern identified by WB analysis of α-Mos10 antibody incubated blots. Since
the first batch crosslinking experiment with Mos10-6His, the crosslinking pattern was
consistent throughout all experiments showing five bands between 100 kDa and 80 kDa, the
lowest two mostly appearing as one fuzzy band but distinguishable by ImageJ analysis. IMAC
purification using a peristaltic pump or an AEKTA system, an exchange from Nickel to Cobalt
ions, or the introduction of a stepwise or gradient elution compared to the batch experiment did
not change the pattern.
An interesting side effect introduced by the gradient elution of crosslinked Mos10-6His
coordinated on IMAC columns was the delayed elution of the crosslinked proteins with respect
to the non-crosslinked protein. In the classical batch experiment, the entire protein content
associated with the Ni-NTA beads is released by heating with SDS, and the resulting
supernatant is observed by WB analysis. The elution procedure within the AEKTA system is
based on the competing interaction of the poly his tag with the imidazole molecules, which
release proteins at higher imidazole concentrations. The effect of imidazole-induced release
was reproducible for Mos10-6His with concentrations of 100 mM and more within the standard
elution of most content present in the column as shown in Figure 12 and Figure 13, thus
following a standard distributed elution profile (Figure 14). However, unlike non-crosslinked
Mos10-6His, the proteins from the crosslinking pattern eluted much later at imidazole
concentrations of 250 mM and above. There is no magical or unifying imidazole concentration
for which all his-tagged proteins tend to elute, since the elution also depends on the accessibility
of the his-tag and the oligomeric state of the protein. The accessibility of one Mos10-6His could
be altered within a complex formed by crosslinking the protein to many interacting partners.
The scenario would most likely lead to a reduced association of the complex to the column due
to a weakened binding of the tag, but this was not observed. In contrast, many Mos10-6His
tagged proteins could be gathered in a heteromeric protein complex, creating an aggregated
protein cluster with multiple Ni-NTA interactions that is harder to release from the column.
Instead of being bound to the column by one poly-his tag from a single his tagged protein, the
tag of many proteins could lead to a cooperative, tighter binding, thus arresting the complex
inside the column. It is worth noting that due to the fact that all crosslinked proteins elute

123
together, it can be assumed that all crosslinks visible on the WB blot are organized in a single
complex.
However, the nature of the crosslinking induced agglomerate or complex remains to be
elucidated, since none of the proteins in the crosslinking pattern could be identified in this
thesis. The idea was to enrich Mos10-6His and the specific crosslinks in considerable amounts
until they become visible on an SDS PAGE gel by either Coomassie or silver staining. In theory,
harvesting 1000 OD cells would result in roughly 4 µg Mos10-6His, assuming an average of
3000 molecules per cell (Heinzle et al., 2019). According to the results gained by
overexpressing Mos10-6His in E. coli, an estimated binding of 25 % would reduce the, in
theory, optimal Mos10 harvest to 1 µg. Even if distributed over multiple fractions, a Mos10-
6His band and a crosslinking pattern should be detectable on a stained SDS PAGE gel. A visible
crosslinking pattern on a Coomassie stained SDS PAGE gel, similar to the one seen on α-Mos10
incubated blots would allow cutting out the exact bands to be analyzed by MS. Due to the high
abundance of background proteins still associated with the Ni-NTA column after washing, no
distinct band could be linked to the pattern from the WB. Despite the reduction of the total
number of proteins co-eluted, even the gradient elution led to no visible banding pattern on a
stained SDS PAGE gel, as seen, for example, in Figure 13. The appearance of distinct bands
was only achievable by the precipitation experiment using sfGFP tagged Mos10 to pull down
interacting partners. In the silver-stained gel in Figure 28, distinct bands became visible, which
could be related to the proteins seen on WB. The benefit of silver staining is the increased
sensitivity up to 100-fold compared to the Coomassie staining detection limit of roughly 100
ng, allowing the identification of proteins in low nanogram quantities (Mitra et al., 1994,
Switzer et al., 1979). However, the multitude of protein bands in the area of interest made it
impossible to pinpoint the right crosslink bands.
After identification of the first set of potential interacting partners of Mos10, the candidates
were tagged with 13myc to check, if one of the bands of the crosslinking pattern had a reduced
mobility on the SDS gel. As described earlier and illustrated in Figure 26, the bands in the
Mos10-6His crosslinking pattern were not altered by tagging of any of the candidate proteins.
Also the second set of potential interaction partners led to the same result, in part due to the
lack of expression of some of the tagged proteins, an effect that needs to be explored further,
before dismissing these proteins as Mos10 crosslinking partners.
The most obvious candidates for the crosslinking pattern would be other ESCRT-III subunits,
since ESCRT-III proteins were consistently purified as Mos10 interactors. This was tested with
deletion strains, where single ESCRT-III genes were deleted in the Mos10-6His background.

124
Deletion of CHM7, DID2 and IST1 had no effect on the crosslinking pattern, thus these proteins
can be excluded as crosslinking partners. Loss of the core ESCRT-III units Snf7, Vps2, Vps20,
and Vps24 completely wiped out the pattern, thus a contribution of individual ESCRT-III
proteins cannot be assessed. At least this result shows that the Mos10 crosslinking pattern is
ESCRT-III dependent, i.e. it does not form when ESCRT-III is not formed.
4.2 Choosing a proper tag This thesis sought to evaluate new Mos10 interacting partners outside the established ESCRT-
III complex. As mentioned before, the primary function of Mos10 remains to be elucidated
(Remec Pavlin and Hurley, 2020). Different tags were evaluated for their suitability for the
purification of Mos10 and its associated proteins. The initially used Mos10 fusion tag was a
poly his tag with six consecutive histidine residues attached to the C-terminus of the protein.
Due to its small size and lack of charge within the pH range needed for purification, the poly
his tag presumably preserves the integrity of the protein’s morphology and function (Carson et
al., 2007, Waugh, 2005). A drawback of the 6His tag is high background upon purification of
yeast proteins. Yeasts naturally code for many proteins with poly-his sequences (>15) and many
other yeast proteins stick to the Ni-NTA column. Trying to find a suitable candidate out of
thousands of proteins recognized by MS analysis seems like the search for the needle in the
haystack.
The introduction of the SILAC technique improved the situation substantially. With this
technique, the ESCRT-III proteins Vps2, Did2, Vps24 and Snf7 were consistently identified as
Mos10 interaction partners. The most highly enriched protein (with the highest H/L ratio) was
Vps2. The other ESCRT-III proteins Did2, Vps24 and Snf7 had a lower enrichment factor. This
indicates that Vps2 could be a direct binding partner of Mos10, while the other ESCRT-III
proteins are maybe indirectly bound to Mos10 via Vps2. Of note, other Mos10 binding proteins
reported in the literature, like Vta1 and Vps4, could not be identified in this thesis. In addition
to the ESCRT-III proteins a number of other potential Mos10 interacting proteins were
identified, which need to be explored further.
The sfGFP tag appeared to be a good alternative to the 6His tag. The results of the MS analysis
showed the highest specificity and yield compared to the other methods like IMAC purification.
Although exchanging the tag was suitable for detecting additional potential candidates
associated with Mos10, there was a noticeable change in the crosslinking pattern of Mos10
when introducing the sfGFP tag. The chosen tag should not only allow for the efficient
purification of interacting proteins, but it should also preserve the function of the tagged

125
proteins. The comparison of the crosslinking patterns of native Mos10 and Mos10-6His shows
that the patterns are largely identical. This indicates that Mos10-6His behaves more or less like
wildtype. The reason for the slightly altered pattern with Mos10-sfGFP could be that by putting
the relatively large sfGFP tag at the C-terminus of Mos10, Mos10 could be converted from a
closed to an open conformation, which leads to an activation of the protein. This is supported
by the sucrose density gradient fractionation of wildtype and tagged Mos10. While there was
hardly any Mos10 detectable in the membrane fractions, a large peak was obtained for Mos10-
sfGFP in the middle of the gradient.
4.3 Choosing suitable Mos10 interaction candidates As mentioned before, the limited number of candidates tested by co-IP experiments were based
on the pre-selection of identified proteins by MS analysis. Candidates were chosen by either
their protein size fitting the crosslink pattern, the number of unique peptides detected by MS,
or a low CRAPome score. The latter implies that a high score in the CRAPome database results
from a protein usually co-purified with other candidates by the applied purification method.
However, it should be mentioned that due to the application of the SILAC technique, it is
difficult to explain why these potential background proteins are being enriched in only one of
the isotopic fractions (heavy or light). A possible explanation could be statistical fluctuations
in the detection of peptides during mass spectrometry (significance of detection) and the
assignment of the peptides to the corresponding proteins (significance of protein identification).
Statistical test would be necessary to resolve these issues. At least three independent replicates
of the experiments would be necessary for a statistical analysis. This was, however, not feasible
within the scope of this thesis. Thus, it is likely that a certain fraction of the obtained candidates
is not real.
Out of the over 80 already pre-selected candidates in Table S 5, many possible candidates were
not considered due to the additional criteria mentioned. Sorting out these proteins was necessary
to reduce the number of candidates tested in this thesis, but should be considered for further
putative Mos10 association when more information becomes available. Since the field of
ESCRT involving processes is constantly expanding, mitochondrial proteins like COX4,
TIM10, or OAC1 identified by MS, but not connected to ESCRT-III function yet, may be
interesting candidates for further study.
Taken together, the only candidate so far, for which an interaction with Mos10 is firmly
established is Vps68. An interaction between Mos10 and Vps68 seems highly likely due to the
two sets of different co-precipitation experiments applied, resulting in a bi-directional pull-

126
down of the proteins from either side regardless of the tag. Also, repeatedly peptides of Vps68
could be identified in one of the isotopic fractions by MS analysis, hardening the anticipated
Mos10 to Vps68 interaction.
4.4 Influence of VPS68 deletion Focusing on the newly found association of Mos10 to Vps68, a set of experiments was
performed to examine the influence of Vps68 on ESCRT-III complex formation and function.
VPS68 was initially identified in a genome-wide screen with single deletion strains looking for
a CPY sorting phenotype (Bonangelino et al., 2002). Further, genome-wide screening of GFP-
tagged proteins led to the localization of Vps68-GFP to the vacuole membrane, further linking
Vps68 to endocytic trafficking (Huh et al., 2003). In another study, a global identification
screening of endosomal transport factors identified an uncharacterized protein complex of
Vps55 and Vps68 believed to act with or downstream of ESCRT in endosomal traffic (Schluter
et al., 2008). However, in all screens performed so far, no direct interaction between Vps68 and
a particular ESCRT-III subunit was reported. This offers a good starting point to study the
protein redistribution and cargo sorting defects by Vps68 depletion.
The sorting of the endocytic cargo protein Ste6 was examined. Under normal conditions, this
protein is constitutively endocytosed from the plasma membrane and transported to the vacuole
for degradation. Decreased cargo degradation was quantified by a cycloheximide chase with
native Ste6 revealing a seven-fold increased half-life of the protein in the VPS68 deletion
compared to WT (Figure 45 & Table 23). Further, the intracellular distribution was studied by
fluorescence microscopy. In a wildtype strain, Ste6-GFP staining is seen in the vacuolar lumen
and occasionally in some endosomal dots. The Ste6-GFP localization was examined in a VPS68
deletion strain and compared with mutants of the endocytic pathway, whose defects had been
characterized. It turned out that ∆vps68 neither showed a class D phenotype, as in ∆vps21, nor
a class E phenotype, as in ∆snf7. The staining resembles the wildtype staining with a more
pronounced staining of endosomal dots. Since the VPS68 deletion does not show the same
phenotype as an ESCRT-III deletion, it is unlikely that Vps68 is directly required for the
function of ESCRT-III. It rather seems that it acts after ILV formation by ESCRT-III. The
results are in line with Ste3-GFP fluorescence images revealing a similar phenotype (Schluter
et al., 2008). Both cargoes (Ste3 & Ste6) demonstrate a decreased but still present occupation
inside the vacuolar lumen in a Δvps68 strain underlying the assumption of functional MVB
sorting, but inhibited cargo delivery from the late endosome to the vacuole.

127
Assuming a perturbation downstream of the ESCRT-III complex by a functional MVB sorting
but disturbed cargo delivery from the late endosome, changes of the ESCRT-III composition
were investigated. After all, the initial identification of Vps68 was made by associating the
protein to the ESCRT-III subunit Mos10, assuming a functional connection between the
proteins. A divergent behavior towards Vps68 depletion was observed between the ESCRT-III
core subunits compared to the so-called ESCRT-III associated members. In cells lacking
Vps68, the concentration of the core components Snf7, Vps2 and Vps24 was higher in the
ESCRT-III complex compared to wildtype, while the concentration of ESCRT-III associated
proteins Did2, Ist1 and Mos10 was lower. Following the current model of a step-wise assembly
of the ESCRT-III complex, the data suggest that in the ∆vps68 mutant ESCRT-III is arrested at
a certain state of the ESCRT-III functional cycle with an increased number of the core subunits
and lower number of associated subunits. The results are in line with previous findings that
cells lacking Mos10 and Vta1 accumulate ESCRT-III at the endosome (Nickerson et al., 2010),
which is assumed to be the result of reduced disassembly of ESCRT-III by Vps4. However, in
this thesis, a Vps68 induced alteration in Vps4 function on ESCRT-III disassembly could not
be examined.
The Mos10-sfGFP staining changes dramatically when Vps68 is missing. It is no longer
associated with the vacuole, but is dispersed into smaller vesicles, which tend to be enriched at
the cell cortex. Tagged variants of Vps68, like Vps68-sfGFP or Vps68-mCherry, cause a partial
relocation of Mos10 not as severe as the VPS68 knockout. This indicates that the tagged variants
are only partially functional. Mos10-sfGFP is not a functional protein, but it appears to preserve
part of its functions, like the ability to bind to ESCRT-III complexes. Previous work has
suggested that Mos10 is not required for ILV formation, but acts at a later stage, probably at
the disassembly step. Thus, it is reasonable to assume that ESCRT-III disassembly is blocked
in the Mos10-sfGFP strain. This could explain why we see Mos10-sfGFP at the vacuolar
membrane, because in this scenario disassembly resistant ESCRT-III complexes would pile up
at the vacuolar membrane. At the same time, we would have to assume that disassembly of
ESCRT-III is a prerequisite for fusion of MVBs with the vacuolar membrane, i.e. the presence
of ESCRT-III complexes blocks fusion. Now in the VPS68 deletion, Mos10-sfGFP does not
accumulate at the vacuolar membrane. This could mean that Vps68 is required for the transition
of a post-ILV ESCRT-III complex to a disassembly-competent complex or that it is required
for tethering MVBs to the vacuolar membrane.
Besides the redistribution seen by fluorescence microscopy, an altered fractionation of Mos10
or, in general, ESCRT-III subunits by VPS68 deletion could not be observed. Slight changes in

128
the cytosolic and membrane-associated fractions are likely caused by variations during the
experiment rather than by the loss of Vps68. Amongst all ESCRT-III members, Mos10
remained mostly cytosolic, as shown by flotation and sucrose gradient fractionation. The reason
for this could be that Mos10 associates only transiently with ESCRT-III followed by rapid
disassembly of the complex. The situation is different though for Mos10-sfGFP, which seems
to be blocked in disassembly. This variant accumulates to substantial levels at membranes as
exemplified by the sucrose gradients.
The Mos10 localization to cortical structures in ∆vps68 strain background was further
investigated. For instance, by dual tagging with a number of cortical marker proteins, like the
ER-PM contact site markers Ist2 and Tcb1, no co-localization with Mos10 with these structures
could be detected (Figure S 49). Further, in preliminary experiments the contribution of Vps55
to Vps68 function was explored. Vps55 is supposed to form a complex with Vps68. The double
mutant Δvps68 Δvps55 showed the same Mos10-sfGFP staining as the single Δvps68 mutant
(Figure S 50) supporting the view that both proteins are in one complex.
4.5 Non-endosomal functions In addition to the multitude of different processes already established to be influenced by
ESCRT-III, new non-endosomal functions were tried to be discovered. As mentioned in 4.3,
putative interacting partners of Mos10 were identified by MS analysis after crosslinking and
purification of the tagged proteins, leading to the assumption of still unknown functions to be
uncovered. For instance, the trafficking of fatty acids from lipid droplets to mitochondria was
recently found to be influenced by ESCRT-III (Wang et al., 2021).
The involvement of ESCRT-III in the response of yeast to stress conditions was explored
further. For instance, the stress-induced formation of stress granules or P-bodies was
investigated, but no connection to ESCRT-III could be established. By considering more stress
conditions, an effect may well be visible. After all, the lab conditions do not reflect the
environmental circumstances yeast strains have to withstand outside the established standard
habitat, facing oxidative stress, exposure to xenobiotics, arsenates, heavy metal ions, besides
tolerating ethanol concentrations up to 20 % (v/v) (Casey and Ingledew, 1986, Aung-Htut et
al., 2012, Thorsen et al., 2009).
The behavior of Did2 upon sucrose density fractionation also points to a non-endosomal
function of at least this ESCRT-III protein. Did2 accumulates markedly at membranes upon
incubation of the cell extracts at 37°C before sucrose gradient fractionation. The relocation was
further confirmed by the flotation experiment reducing the cytosolic fraction of Did2 by 50 %

129
towards the membrane-bound fraction. The reason for this effect is unclear, but it could be
related to osmotic stress. It has been reported that ESCRT-III associates with the plasma
membrane and also with endosomes under hyperosmotic conditions, i.e. when membrane
tension is reduced. Since high sucrose concentrations are employed in sucrose density gradient
fractionation, this may well lead to loss of water from endosomes, which would reduce
membrane tension in these organelles. This is an exciting topic that should explored further.

130
5 LITERATURE
Adell MA, Vogel GF, Pakdel M, Muller M, Lindner H, Hess MW, Teis D (2014) Coordinated
binding of Vps4 to ESCRT-III drives membrane neck constriction during MVB vesicle
formation. J Cell Biol 205: 33-49 doi: 10.1083/jcb.201310114
Alam SL, Sun J, Payne M, Welch BD, Blake BK, Davis DR, Meyer HH, Emr SD, Sundquist
WI (2004) Ubiquitin interactions of NZF zinc fingers. EMBO J 23: 1411-1421 doi:
10.1038/sj.emboj.7600114
Allison R, Lumb JH, Fassier C, Connell JW, Ten Martin D, Seaman MN, Hazan J, Reid E
(2013) An ESCRT-spastin interaction promotes fission of recycling tubules from the
endosome. J Cell Biol 202: 527-543 doi: 10.1083/jcb.201211045
Ambrose CT (2006) The Osler slide, a demonstration of phagocytosis from 1876 Reports of
phagocytosis before Metchnikoff's 1880 paper. Cell Immunol 240: 1-4 doi:
10.1016/j.cellimm.2006.05.008
Aung-Htut MT, Ayer A, Breitenbach M, Dawes IW (2012) Oxidative stresses and ageing.
Subcell Biochem 57: 13-54 doi: 10.1007/978-94-007-2561-4_2
Azmi IF, Davies BA, Xiao J, Babst M, Xu Z, Katzmann DJ (2008) ESCRT-III family members
stimulate Vps4 ATPase activity directly or via Vta1. Dev Cell 14: 50-61 doi:
10.1016/j.devcel.2007.10.021
Babst M, Katzmann DJ, Estepa-Sabal EJ, Meerloo T, Emr SD (2002a) Escrt-III: an endosome-
associated heterooligomeric protein complex required for mvb sorting. Dev Cell 3: 271-
282 doi: 10.1016/s1534-5807(02)00220-4
Babst M, Katzmann DJ, Snyder WB, Wendland B, Emr SD (2002b) Endosome-associated
complex, ESCRT-II, recruits transport machinery for protein sorting at the
multivesicular body. Dev Cell 3: 283-289 doi: 10.1016/s1534-5807(02)00219-8
Babst M, Wendland B, Estepa EJ, Emr SD (1998) The Vps4p AAA ATPase regulates
membrane association of a Vps protein complex required for normal endosome
function. EMBO J 17: 2982-2993 doi: 10.1093/emboj/17.11.2982
Baietti MF, Zhang Z, Mortier E, Melchior A, Degeest G, Geeraerts A, Ivarsson Y, Depoortere
F, Coomans C, Vermeiren E, Zimmermann P, David G (2012) Syndecan-syntenin-
ALIX regulates the biogenesis of exosomes. Nat Cell Biol 14: 677-685 doi:
10.1038/ncb2502

131
Bajorek M, Schubert HL, McCullough J, Langelier C, Eckert DM, Stubblefield WM, Uter NT,
Myszka DG, Hill CP, Sundquist WI (2009) Structural basis for ESCRT-III protein
autoinhibition. Nat Struct Mol Biol 16: 754-762 doi: 10.1038/nsmb.1621
Bassham DC, Gal S, da Silva Conceicao A, Raikhel NV (1995) An Arabidopsis syntaxin
homologue isolated by functional complementation of a yeast pep12 mutant. Proc Natl
Acad Sci U S A 92: 7262-7266 doi: 10.1073/pnas.92.16.7262
Bauer I, Brune T, Preiss R, Kolling R (2015) Evidence for a Nonendosomal Function of the
Saccharomyces cerevisiae ESCRT-III-Like Protein Chm7. Genetics 201: 1439-1452
doi: 10.1534/genetics.115.178939
Baum DA, Baum B (2014) An inside-out origin for the eukaryotic cell. BMC Biol 12: 76 doi:
10.1186/s12915-014-0076-2
Baumgartel V, Ivanchenko S, Dupont A, Sergeev M, Wiseman PW, Krausslich HG, Brauchle
C, Muller B, Lamb DC (2011) Live-cell visualization of dynamics of HIV budding site
interactions with an ESCRT component. Nat Cell Biol 13: 469-474 doi:
10.1038/ncb2215
Bertin A, de Franceschi N, de la Mora E, Maity S, Alqabandi M, Miguet N, di Cicco A, Roos
WH, Mangenot S, Weissenhorn W, Bassereau P (2020) Human ESCRT-III polymers
assemble on positively curved membranes and induce helical membrane tube formation.
Nat Commun 11: 2663 doi: 10.1038/s41467-020-16368-5
Bonangelino CJ, Chavez EM, Bonifacino JS (2002) Genomic screen for vacuolar protein
sorting genes in Saccharomyces cerevisiae. Mol Biol Cell 13: 2486-2501 doi:
10.1091/mbc.02-01-0005
Brune T, Kunze-Schumacher H, Kolling R (2019) Interactions in the ESCRT-III network of
the yeast Saccharomyces cerevisiae. Curr Genet 65: 607-619 doi: 10.1007/s00294-018-
0915-8
Bryant NJ, Stevens TH (1998) Vacuole biogenesis in Saccharomyces cerevisiae: protein
transport pathways to the yeast vacuole. Microbiol Mol Biol Rev 62: 230-247 doi:
Buchkovich NJ, Henne WM, Tang S, Emr SD (2013) Essential N-terminal insertion motif
anchors the ESCRT-III filament during MVB vesicle formation. Dev Cell 27: 201-214
doi: 10.1016/j.devcel.2013.09.009
Bullock W (1987) XL1-Blue: a high efficiency plasmid transforming recA Escherichia coli
strain with beta-galactosidase selection. Bio Tecchniques 5: 376-379 doi:

132
Cai H, Reinisch K, Ferro-Novick S (2007) Coats, tethers, Rabs, and SNAREs work together to
mediate the intracellular destination of a transport vesicle. Dev Cell 12: 671-682 doi:
10.1016/j.devcel.2007.04.005
Carlson LA, Hurley JH (2012) In vitro reconstitution of the ordered assembly of the endosomal
sorting complex required for transport at membrane-bound HIV-1 Gag clusters. Proc
Natl Acad Sci U S A 109: 16928-16933 doi: 10.1073/pnas.1211759109
Carlton JG, Martin-Serrano J (2007) Parallels between cytokinesis and retroviral budding: a
role for the ESCRT machinery. Science 316: 1908-1912 doi: 10.1126/science.1143422
Carson M, Johnson DH, McDonald H, Brouillette C, Delucas LJ (2007) His-tag impact on
structure. Acta Crystallogr D Biol Crystallogr 63: 295-301 doi:
10.1107/S0907444906052024
Casey GP, Ingledew WM (1986) Ethanol tolerance in yeasts. Crit Rev Microbiol 13: 219-280
doi: 10.3109/10408418609108739
Chiaruttini N, Redondo-Morata L, Colom A, Humbert F, Lenz M, Scheuring S, Roux A (2015)
Relaxation of Loaded ESCRT-III Spiral Springs Drives Membrane Deformation. Cell
163: 866-879 doi: 10.1016/j.cell.2015.10.017
Chu T, Sun J, Saksena S, Emr SD (2006) New component of ESCRT-I regulates endosomal
sorting complex assembly. J Cell Biol 175: 815-823 doi: 10.1083/jcb.200608053
Conibear E (2010) Converging views of endocytosis in yeast and mammals. Curr Opin Cell
Biol 22: 513-518 doi: 10.1016/j.ceb.2010.05.009
Curtiss M, Jones C, Babst M (2007) Efficient cargo sorting by ESCRT-I and the subsequent
release of ESCRT-I from multivesicular bodies requires the subunit Mvb12. Mol Biol
Cell 18: 636-645 doi: 10.1091/mbc.e06-07-0588
Day KJ, Casler JC, Glick BS (2018) Budding Yeast Has a Minimal Endomembrane System.
Dev Cell 44: 56-72 e54 doi: 10.1016/j.devcel.2017.12.014
De Duve C (1963) The lysosome. Sci Am 208: 64-72 doi: 10.1038/scientificamerican0563-64
Delic M, Valli M, Graf AB, Pfeffer M, Mattanovich D, Gasser B (2013) The secretory pathway:
exploring yeast diversity. FEMS Microbiol Rev 37: 872-914 doi: 10.1111/1574-
6976.12020
Doherty GJ, McMahon HT (2009) Mechanisms of endocytosis. Annu Rev Biochem 78: 857-
902 doi: 10.1146/annurev.biochem.78.081307.110540
Falco SC, Dumas KS, Livak KJ (1985) Nucleotide sequence of the yeast ILV2 gene which
encodes acetolactate synthase. Nucleic Acids Res 13: 4011-4027 doi:
10.1093/nar/13.11.4011

133
Felder S, Miller K, Moehren G, Ullrich A, Schlessinger J, Hopkins CR (1990) Kinase activity
controls the sorting of the epidermal growth factor receptor within the multivesicular
body. Cell 61: 623-634 doi: 10.1016/0092-8674(90)90474-s
Finlay BJ, Clarke KJ (1999) Ubiquitous dispersal of microbial species. Nature 400: 828-828
doi: 10.1038/23616
Garrus JE, von Schwedler UK, Pornillos OW, Morham SG, Zavitz KH, Wang HE, Wettstein
DA, Stray KM, Cote M, Rich RL, Myszka DG, Sundquist WI (2001) Tsg101 and the
vacuolar protein sorting pathway are essential for HIV-1 budding. Cell 107: 55-65 doi:
10.1016/s0092-8674(01)00506-2
Gietz RD, Schiestl RH (2007) High-efficiency yeast transformation using the LiAc/SS carrier
DNA/PEG method. Nat Protoc 2: 31-34 doi: 10.1038/nprot.2007.13
Gietz RD, Sugino A (1988) New yeast-Escherichia coli shuttle vectors constructed with in vitro
mutagenized yeast genes lacking six-base pair restriction sites. Gene 74: 527-534 doi:
10.1016/0378-1119(88)90185-0
Gill DJ, Teo H, Sun J, Perisic O, Veprintsev DB, Vallis Y, Emr SD, Williams RL (2007)
Structural studies of phosphoinositide 3-kinase-dependent traffic to multivesicular
bodies. Biochem Soc Symp: 47-57 doi: 10.1042/BSS0740047
Goldstein JL, Anderson RG, Brown MS (1979) Coated pits, coated vesicles, and receptor-
mediated endocytosis. Nature 279: 679-685 doi: 10.1038/279679a0
Goliand I, Nachmias D, Gershony O, Elia N (2014) Inhibition of ESCRT-II-CHMP6
interactions impedes cytokinetic abscission and leads to cell death. Mol Biol Cell 25:
3740-3748 doi: 10.1091/mbc.E14-08-1317
Grissom JH, Segarra VA, Chi RJ (2020) New Perspectives on SNARE Function in the Yeast
Minimal Endomembrane System. Genes (Basel) 1110.3390/genes11080899
Gu M, LaJoie D, Chen OS, von Appen A, Ladinsky MS, Redd MJ, Nikolova L, Bjorkman PJ,
Sundquist WI, Ullman KS, Frost A (2017) LEM2 recruits CHMP7 for ESCRT-
mediated nuclear envelope closure in fission yeast and human cells. Proc Natl Acad Sci
U S A 114: E2166-E2175 doi: 10.1073/pnas.1613916114
Guizetti J, Schermelleh L, Mantler J, Maar S, Poser I, Leonhardt H, Muller-Reichert T, Gerlich
DW (2011) Cortical constriction during abscission involves helices of ESCRT-III-
dependent filaments. Science 331: 1616-1620 doi: 10.1126/science.1201847
Hadders MA, Agromayor M, Obita T, Perisic O, Caballe A, Kloc M, Lamers MH, Williams
RL, Martin-Serrano J (2012) ESCRT-III binding protein MITD1 is involved in

134
cytokinesis and has an unanticipated PLD fold that binds membranes. Proc Natl Acad
Sci U S A 109: 17424-17429 doi: 10.1073/pnas.1206839109
Haglund K, Dikic I (2012) The role of ubiquitylation in receptor endocytosis and endosomal
sorting. J Cell Sci 125: 265-275 doi: 10.1242/jcs.091280
Han H, Monroe N, Sundquist WI, Shen PS, Hill CP (2017) The AAA ATPase Vps4 binds
ESCRT-III substrates through a repeating array of dipeptide-binding pockets. Elife
610.7554/eLife.31324
Hanson PI, Roth R, Lin Y, Heuser JE (2008) Plasma membrane deformation by circular arrays
of ESCRT-III protein filaments. J Cell Biol 180: 389-402 doi: 10.1083/jcb.200707031
Harker-Kirschneck L, Baum B, Saric AE (2019) Changes in ESCRT-III filament geometry
drive membrane remodelling and fission in silico. BMC Biol 17: 82 doi:
10.1186/s12915-019-0700-2
Heinzle C, Mucke L, Brune T, Kolling R (2019) Comprehensive analysis of yeast ESCRT-III
composition in single ESCRT-III deletion mutants. Biochem J 476: 2031-2046 doi:
10.1042/BCJ20190141
Henne WM, Buchkovich NJ, Zhao Y, Emr SD (2012) The endosomal sorting complex ESCRT-
II mediates the assembly and architecture of ESCRT-III helices. Cell 151: 356-371 doi:
10.1016/j.cell.2012.08.039
Hesketh GG, Wartosch L, Davis LJ, Bright NA, Luzio JP (2018) The Lysosome and
Intracellular Signalling. Prog Mol Subcell Biol 57: 151-180 doi: 10.1007/978-3-319-
96704-2_6
Hierro A, Sun J, Rusnak AS, Kim J, Prag G, Emr SD, Hurley JH (2004) Structure of the
ESCRT-II endosomal trafficking complex. Nature 431: 221-225 doi:
10.1038/nature02914
Hoeller D, Volarevic S, Dikic I (2005) Compartmentalization of growth factor receptor
signalling. Curr Opin Cell Biol 17: 107-111 doi: 10.1016/j.ceb.2005.01.001
Horii M, Shibata H, Kobayashi R, Katoh K, Yorikawa C, Yasuda J, Maki M (2006) CHMP7,
a novel ESCRT-III-related protein, associates with CHMP4b and functions in the
endosomal sorting pathway. Biochem J 400: 23-32 doi: 10.1042/BJ20060897
Huh WK, Falvo JV, Gerke LC, Carroll AS, Howson RW, Weissman JS, O'Shea EK (2003)
Global analysis of protein localization in budding yeast. Nature 425: 686-691 doi:
10.1038/nature02026
Huotari J, Helenius A (2011) Endosome maturation. EMBO J 30: 3481-3500 doi:
10.1038/emboj.2011.286

135
Hurley JH (2010) The ESCRT complexes. Crit Rev Biochem Mol Biol 45: 463-487 doi:
10.3109/10409238.2010.502516
Hurley JH (2015) ESCRTs are everywhere. EMBO J 34: 2398-2407 doi:
10.15252/embj.201592484
Hurley JH, Hanson PI (2010) Membrane budding and scission by the ESCRT machinery: it's
all in the neck. Nat Rev Mol Cell Biol 11: 556-566 doi: 10.1038/nrm2937
Im YJ, Hurley JH (2008) Integrated structural model and membrane targeting mechanism of
the human ESCRT-II complex. Dev Cell 14: 902-913 doi:
10.1016/j.devcel.2008.04.004
Im YJ, Wollert T, Boura E, Hurley JH (2009) Structure and function of the ESCRT-II-III
interface in multivesicular body biogenesis. Dev Cell 17: 234-243 doi:
10.1016/j.devcel.2009.07.008
Janke C, Magiera MM, Rathfelder N, Taxis C, Reber S, Maekawa H, Moreno-Borchart A,
Doenges G, Schwob E, Schiebel E, Knop M (2004) A versatile toolbox for PCR-based
tagging of yeast genes: new fluorescent proteins, more markers and promoter
substitution cassettes. Yeast 21: 947-962 doi: 10.1002/yea.1142
Jimenez AJ, Maiuri P, Lafaurie-Janvore J, Divoux S, Piel M, Perez F (2014) ESCRT machinery
is required for plasma membrane repair. Science 343: 1247136 doi:
10.1126/science.1247136
Jung E, Choi TI, Lee JE, Kim CH, Kim J (2020) ESCRT subunit CHMP4B localizes to primary
cilia and is required for the structural integrity of the ciliary membrane. FASEB J 34:
1331-1344 doi: 10.1096/fj.201901778R
Kato M, Miyazawa K, Kitamura N (2000) A deubiquitinating enzyme UBPY interacts with the
Src homology 3 domain of Hrs-binding protein via a novel binding motif
PX(V/I)(D/N)RXXKP. J Biol Chem 275: 37481-37487 doi: 10.1074/jbc.M007251200
Katzmann DJ, Babst M, Emr SD (2001) Ubiquitin-dependent sorting into the multivesicular
body pathway requires the function of a conserved endosomal protein sorting complex,
ESCRT-I. Cell 106: 145-155 doi: 10.1016/s0092-8674(01)00434-2
Katzmann DJ, Odorizzi G, Emr SD (2002) Receptor downregulation and multivesicular-body
sorting. Nat Rev Mol Cell Biol 3: 893-905 doi: 10.1038/nrm973
Katzmann DJ, Stefan CJ, Babst M, Emr SD (2003) Vps27 recruits ESCRT machinery to
endosomes during MVB sorting. J Cell Biol 162: 413-423 doi: 10.1083/jcb.200302136
Kieffer C, Skalicky JJ, Morita E, De Domenico I, Ward DM, Kaplan J, Sundquist WI (2008)
Two distinct modes of ESCRT-III recognition are required for VPS4 functions in
136
lysosomal protein targeting and HIV-1 budding. Dev Cell 15: 62-73 doi:
10.1016/j.devcel.2008.05.014
Kilchert C, Weidner J, Prescianotto-Baschong C, Spang A (2010) Defects in the secretory
pathway and high Ca2+ induce multiple P-bodies. Mol Biol Cell 21: 2624-2638 doi:
10.1091/mbc.E10-02-0099
Kirchhausen T, Owen D, Harrison SC (2014) Molecular structure, function, and dynamics of
clathrin-mediated membrane traffic. Cold Spring Harb Perspect Biol 6: a016725 doi:
10.1101/cshperspect.a016725
Klionsky DJ, Emr SD (1989) Membrane protein sorting: biosynthesis, transport and processing
of yeast vacuolar alkaline phosphatase. EMBO J 8: 2241-2250 doi:
Kolling R, Hollenberg CP (1994) The ABC-transporter Ste6 accumulates in the plasma
membrane in a ubiquitinated form in endocytosis mutants. EMBO J 13: 3261-3271 doi:
Kostelansky MS, Schluter C, Tam YY, Lee S, Ghirlando R, Beach B, Conibear E, Hurley JH
(2007) Molecular architecture and functional model of the complete yeast ESCRT-I
heterotetramer. Cell 129: 485-498 doi: 10.1016/j.cell.2007.03.016
Kranz A, Kinner A, Kolling R (2001) A family of small coiled-coil-forming proteins
functioning at the late endosome in yeast. Mol Biol Cell 12: 711-723 doi:
10.1091/mbc.12.3.711
Krsmanovic T, Pawelec A, Sydor T, Kolling R (2005) Control of Ste6 recycling by
ubiquitination in the early endocytic pathway in yeast. Mol Biol Cell 16: 2809-2821
doi: 10.1091/mbc.e04-10-0941
Kumar B, Roy A, Veettil MV, Chandran B (2018) Insight into the Roles of E3 Ubiquitin Ligase
c-Cbl, ESCRT Machinery, and Host Cell Signaling in Kaposi's Sarcoma-Associated
Herpesvirus Entry and Trafficking. J Virol 9210.1128/JVI.01376-17
Lata S, Schoehn G, Solomons J, Pires R, Gottlinger HG, Weissenhorn W (2009) Structure and
function of ESCRT-III. Biochem Soc Trans 37: 156-160 doi: 10.1042/BST0370156
Lee HH, Elia N, Ghirlando R, Lippincott-Schwartz J, Hurley JH (2008) Midbody targeting of
the ESCRT machinery by a noncanonical coiled coil in CEP55. Science 322: 576-580
doi: 10.1126/science.1162042
Lee S, Chang J, Renvoise B, Tipirneni A, Yang S, Blackstone C (2012) MITD1 is recruited to
midbodies by ESCRT-III and participates in cytokinesis. Mol Biol Cell 23: 4347-4361
doi: 10.1091/mbc.E12-04-0292
Lemmon SK, Traub LM (2000) Sorting in the endosomal system in yeast and animal cells. Curr
Opin Cell Biol 12: 457-466 doi: 10.1016/s0955-0674(00)00117-4

137
Lens SMA, Medema RH (2019) Cytokinesis defects and cancer. Nat Rev Cancer 19: 32-45 doi:
10.1038/s41568-018-0084-6
Leung KF, Dacks JB, Field MC (2008) Evolution of the multivesicular body ESCRT
machinery; retention across the eukaryotic lineage. Traffic 9: 1698-1716 doi:
10.1111/j.1600-0854.2008.00797.x
Li L, Francke U, Cohen SN (1998) Retraction. The TSG101 tumor susceptibility gene is located
in chromosome 11 band p15 and is mutated in human breast cancer. Cell 93: following
660 doi: 10.1016/s0092-8674(00)89342-3
Lindas AC, Karlsson EA, Lindgren MT, Ettema TJ, Bernander R (2008) A unique cell division
machinery in the Archaea. Proc Natl Acad Sci U S A 105: 18942-18946 doi:
10.1073/pnas.0809467105
Lipinski KA, Kaniak-Golik A, Golik P (2010) Maintenance and expression of the S. cerevisiae
mitochondrial genome--from genetics to evolution and systems biology. Biochim
Biophys Acta 1797: 1086-1098 doi: 10.1016/j.bbabio.2009.12.019
Loncle N, Agromayor M, Martin-Serrano J, Williams DW (2015) An ESCRT module is
required for neuron pruning. Sci Rep 5: 8461 doi: 10.1038/srep08461
Longtine MS, McKenzie A, 3rd, Demarini DJ, Shah NG, Wach A, Brachat A, Philippsen P,
Pringle JR (1998) Additional modules for versatile and economical PCR-based gene
deletion and modification in Saccharomyces cerevisiae. Yeast 14: 953-961 doi:
10.1002/(SICI)1097-0061(199807)14:10<953::AID-YEA293>3.0.CO;2-U
Losko S, Kopp F, Kranz A, Kolling R (2001) Uptake of the ATP-binding cassette (ABC)
transporter Ste6 into the yeast vacuole is blocked in the doa4 Mutant. Mol Biol Cell 12:
1047-1059 doi: 10.1091/mbc.12.4.1047
Lozach PY, Huotari J, Helenius A (2011) Late-penetrating viruses. Curr Opin Virol 1: 35-43
doi: 10.1016/j.coviro.2011.05.004
Lu R, Drubin DG, Sun Y (2016) Clathrin-mediated endocytosis in budding yeast at a glance. J
Cell Sci 129: 1531-1536 doi: 10.1242/jcs.182303
Luo Z, Gallwitz D (2003) Biochemical and genetic evidence for the involvement of yeast Ypt6-
GTPase in protein retrieval to different Golgi compartments. J Biol Chem 278: 791-799
doi: 10.1074/jbc.M209120200
Luzio JP, Pryor PR, Bright NA (2007) Lysosomes: fusion and function. Nat Rev Mol Cell Biol
8: 622-632 doi: 10.1038/nrm2217

138
Mast FD, Herricks T, Strehler KM, Miller LR, Saleem RA, Rachubinski RA, Aitchison JD
(2018) ESCRT-III is required for scissioning new peroxisomes from the endoplasmic
reticulum. J Cell Biol 217: 2087-2102 doi: 10.1083/jcb.201706044
Matusek T, Wendler F, Poles S, Pizette S, D'Angelo G, Furthauer M, Therond PP (2014) The
ESCRT machinery regulates the secretion and long-range activity of Hedgehog. Nature
516: 99-103 doi: 10.1038/nature13847
Maxfield FR, McGraw TE (2004) Endocytic recycling. Nat Rev Mol Cell Biol 5: 121-132 doi:
10.1038/nrm1315
McCullough J, Clippinger AK, Talledge N, Skowyra ML, Saunders MG, Naismith TV, Colf
LA, Afonine P, Arthur C, Sundquist WI, Hanson PI, Frost A (2015) Structure and
membrane remodeling activity of ESCRT-III helical polymers. Science 350: 1548-1551
doi: 10.1126/science.aad8305
McCullough J, Frost A, Sundquist WI (2018) Structures, Functions, and Dynamics of ESCRT-
III/Vps4 Membrane Remodeling and Fission Complexes. Annu Rev Cell Dev Biol 34:
85-109 doi: 10.1146/annurev-cellbio-100616-060600
McCullough J, Sundquist WI (2020) Membrane Remodeling: ESCRT-III Filaments as
Molecular Garrotes. Curr Biol 30: R1425-R1428 doi: 10.1016/j.cub.2020.09.086
McMillan BJ, Tibbe C, Jeon H, Drabek AA, Klein T, Blacklow SC (2016) Electrostatic
Interactions between Elongated Monomers Drive Filamentation of Drosophila Shrub, a
Metazoan ESCRT-III Protein. Cell Rep 16: 1211-1217 doi:
10.1016/j.celrep.2016.06.093
Mechnikov I (1908) On the present state of the question of immunity in infectious diseases.
The Nobel Prize in Physiology or Medicine: 1901-1921 doi:
Meister M, Banfer S, Gartner U, Koskimies J, Amaddii M, Jacob R, Tikkanen R (2017)
Regulation of cargo transfer between ESCRT-0 and ESCRT-I complexes by flotillin-1
during endosomal sorting of ubiquitinated cargo. Oncogenesis 6: e344 doi:
10.1038/oncsis.2017.47
Mellacheruvu D, Wright Z, Couzens AL, Lambert JP, St-Denis NA, Li T, Miteva YV, Hauri S,
Sardiu ME, Low TY, Halim VA, Bagshaw RD, Hubner NC, Al-Hakim A, Bouchard A,
Faubert D, Fermin D, Dunham WH, Goudreault M, Lin ZY, Badillo BG, Pawson T,
Durocher D, Coulombe B, Aebersold R, Superti-Furga G, Colinge J, Heck AJ, Choi H,
Gstaiger M, Mohammed S, Cristea IM, Bennett KL, Washburn MP, Raught B, Ewing
RM, Gingras AC, Nesvizhskii AI (2013) The CRAPome: a contaminant repository for

139
affinity purification-mass spectrometry data. Nat Methods 10: 730-736 doi:
10.1038/nmeth.2557
Mierzwa BE, Chiaruttini N, Redondo-Morata L, von Filseck JM, Konig J, Larios J, Poser I,
Muller-Reichert T, Scheuring S, Roux A, Gerlich DW (2017) Dynamic subunit turnover
in ESCRT-III assemblies is regulated by Vps4 to mediate membrane remodelling during
cytokinesis. Nat Cell Biol 19: 787-798 doi: 10.1038/ncb3559
Miller S, Krijnse-Locker J (2008) Modification of intracellular membrane structures for virus
replication. Nat Rev Microbiol 6: 363-374 doi: 10.1038/nrmicro1890
Mitra P, Pal AK, Basu D, Hati RN (1994) A staining procedure using Coomassie brilliant blue
G-250 in phosphoric acid for detection of protein bands with high resolution in
polyacrylamide gel and nitrocellulose membrane. Anal Biochem 223: 327-329 doi:
10.1006/abio.1994.1594
Monroe N, Han H, Shen PS, Sundquist WI, Hill CP (2017) Structural basis of protein
translocation by the Vps4-Vta1 AAA ATPase. Elife 610.7554/eLife.24487
Monroe N, Hill CP (2016) Meiotic Clade AAA ATPases: Protein Polymer Disassembly
Machines. J Mol Biol 428: 1897-1911 doi: 10.1016/j.jmb.2015.11.004
Morita E, Sandrin V, McCullough J, Katsuyama A, Baci Hamilton I, Sundquist WI (2011)
ESCRT-III protein requirements for HIV-1 budding. Cell Host Microbe 9: 235-242 doi:
10.1016/j.chom.2011.02.004
Moser von Filseck J, Barberi L, Talledge N, Johnson IE, Frost A, Lenz M, Roux A (2020)
Anisotropic ESCRT-III architecture governs helical membrane tube formation. Nat
Commun 11: 1516 doi: 10.1038/s41467-020-15327-4
Mosesso N, Nagel MK, Isono E (2019) Ubiquitin recognition in endocytic trafficking - with or
without ESCRT-0. J Cell Sci 13210.1242/jcs.232868
Muller M, Schmidt O, Angelova M, Faserl K, Weys S, Kremser L, Pfaffenwimmer T, Dalik T,
Kraft C, Trajanoski Z, Lindner H, Teis D (2015) The coordinated action of the MVB
pathway and autophagy ensures cell survival during starvation. Elife 4: e07736 doi:
10.7554/eLife.07736
Murphy RF (1991) Maturation models for endosome and lysosome biogenesis. Trends Cell
Biol 1: 77-82 doi: 10.1016/0962-8924(91)90022-2
Nabhan JF, Hu R, Oh RS, Cohen SN, Lu Q (2012) Formation and release of arrestin domain-
containing protein 1-mediated microvesicles (ARMMs) at plasma membrane by
recruitment of TSG101 protein. Proc Natl Acad Sci U S A 109: 4146-4151 doi:
10.1073/pnas.1200448109

140
Nakatogawa H, Suzuki K, Kamada Y, Ohsumi Y (2009) Dynamics and diversity in autophagy
mechanisms: lessons from yeast. Nat Rev Mol Cell Biol 10: 458-467 doi:
10.1038/nrm2708
Nguyen HC, Talledge N, McCullough J, Sharma A, Moss FR, 3rd, Iwasa JH, Vershinin MD,
Sundquist WI, Frost A (2020) Membrane constriction and thinning by sequential
ESCRT-III polymerization. Nat Struct Mol Biol 27: 392-399 doi: 10.1038/s41594-020-
0404-x
Nickerson DP, West M, Henry R, Odorizzi G (2010) Regulators of Vps4 ATPase activity at
endosomes differentially influence the size and rate of formation of intralumenal
vesicles. Mol Biol Cell 21: 1023-1032 doi: 10.1091/mbc.E09-09-0776
Obita T, Saksena S, Ghazi-Tabatabai S, Gill DJ, Perisic O, Emr SD, Williams RL (2007)
Structural basis for selective recognition of ESCRT-III by the AAA ATPase Vps4.
Nature 449: 735-739 doi: 10.1038/nature06171
Oestreich AJ, Davies BA, Payne JA, Katzmann DJ (2007) Mvb12 is a novel member of
ESCRT-I involved in cargo selection by the multivesicular body pathway. Mol Biol
Cell 18: 646-657 doi: 10.1091/mbc.e06-07-0601
Olmos Y, Hodgson L, Mantell J, Verkade P, Carlton JG (2015) ESCRT-III controls nuclear
envelope reformation. Nature 522: 236-239 doi: 10.1038/nature14503
Olmos Y, Perdrix-Rosell A, Carlton JG (2016) Membrane Binding by CHMP7 Coordinates
ESCRT-III-Dependent Nuclear Envelope Reformation. Curr Biol 26: 2635-2641 doi:
10.1016/j.cub.2016.07.039
Orlean P (1990) Dolichol phosphate mannose synthase is required in vivo for glycosyl
phosphatidylinositol membrane anchoring, O mannosylation, and N glycosylation of
protein in Saccharomyces cerevisiae. Mol Cell Biol 10: 5796-5805 doi:
10.1128/mcb.10.11.5796-5805.1990
Palade GE (1955) A small particulate component of the cytoplasm. J Biophys Biochem Cytol
1: 59-68 doi: 10.1083/jcb.1.1.59
Papadopoulos C, Meyer H (2017) Detection and Clearance of Damaged Lysosomes by the
Endo-Lysosomal Damage Response and Lysophagy. Curr Biol 27: R1330-R1341 doi:
10.1016/j.cub.2017.11.012
Pfitzner AK, Mercier V, Jiang X, Moser von Filseck J, Baum B, Saric A, Roux A (2020) An
ESCRT-III Polymerization Sequence Drives Membrane Deformation and Fission. Cell
182: 1140-1155 e1118 doi: 10.1016/j.cell.2020.07.021

141
Piper RC, Cooper AA, Yang H, Stevens TH (1995) VPS27 controls vacuolar and endocytic
traffic through a prevacuolar compartment in Saccharomyces cerevisiae. J Cell Biol
131: 603-617 doi: 10.1083/jcb.131.3.603
Piper RC, Katzmann DJ (2007) Biogenesis and function of multivesicular bodies. Annu Rev
Cell Dev Biol 23: 519-547 doi: 10.1146/annurev.cellbio.23.090506.123319
Piper RC, Lehner PJ (2011) Endosomal transport via ubiquitination. Trends Cell Biol 21: 647-
655 doi: 10.1016/j.tcb.2011.08.007
Prag G, Watson H, Kim YC, Beach BM, Ghirlando R, Hummer G, Bonifacino JS, Hurley JH
(2007) The Vps27/Hse1 complex is a GAT domain-based scaffold for ubiquitin-
dependent sorting. Dev Cell 12: 973-986 doi: 10.1016/j.devcel.2007.04.013
Radulovic M, Schink KO, Wenzel EM, Nahse V, Bongiovanni A, Lafont F, Stenmark H (2018)
ESCRT-mediated lysosome repair precedes lysophagy and promotes cell survival.
EMBO J 3710.15252/embj.201899753
Raiborg C, Bache KG, Mehlum A, Stenmark H (2001) Function of Hrs in endocytic trafficking
and signalling. Biochem Soc Trans 29: 472-475 doi: 10.1042/bst0290472
Raiborg C, Stenmark H (2009) The ESCRT machinery in endosomal sorting of ubiquitylated
membrane proteins. Nature 458: 445-452 doi: 10.1038/nature07961
Raiborg C, Wesche J, Malerod L, Stenmark H (2006) Flat clathrin coats on endosomes mediate
degradative protein sorting by scaffolding Hrs in dynamic microdomains. J Cell Sci
119: 2414-2424 doi: 10.1242/jcs.02978
Raymond CK, Howald-Stevenson I, Vater CA, Stevens TH (1992) Morphological
classification of the yeast vacuolar protein sorting mutants: evidence for a prevacuolar
compartment in class E vps mutants. Mol Biol Cell 3: 1389-1402 doi:
10.1091/mbc.3.12.1389
Remec Pavlin M, Hurley JH (2020) The ESCRTs - converging on mechanism. J Cell Sci
13310.1242/jcs.240333
Ren J, Kee Y, Huibregtse JM, Piper RC (2007) Hse1, a component of the yeast Hrs-STAM
ubiquitin-sorting complex, associates with ubiquitin peptidases and a ligase to control
sorting efficiency into multivesicular bodies. Mol Biol Cell 18: 324-335 doi:
10.1091/mbc.e06-06-0557
Ren X, Hurley JH (2010) VHS domains of ESCRT-0 cooperate in high-avidity binding to
polyubiquitinated cargo. EMBO J 29: 1045-1054 doi: 10.1038/emboj.2010.6

142
Ren X, Kloer DP, Kim YC, Ghirlando R, Saidi LF, Hummer G, Hurley JH (2009) Hybrid
structural model of the complete human ESCRT-0 complex. Structure 17: 406-416 doi:
10.1016/j.str.2009.01.012
Richter C, West M, Odorizzi G (2007) Dual mechanisms specify Doa4-mediated
deubiquitination at multivesicular bodies. EMBO J 26: 2454-2464 doi:
10.1038/sj.emboj.7601692
Rink J, Ghigo E, Kalaidzidis Y, Zerial M (2005) Rab conversion as a mechanism of progression
from early to late endosomes. Cell 122: 735-749 doi: 10.1016/j.cell.2005.06.043
Robijns J, Houthaeve G, Braeckmans K, De Vos WH (2018) Loss of Nuclear Envelope
Integrity in Aging and Disease. Int Rev Cell Mol Biol 336: 205-222 doi:
10.1016/bs.ircmb.2017.07.013
Robinson JS, Klionsky DJ, Banta LM, Emr SD (1988) Protein sorting in Saccharomyces
cerevisiae: isolation of mutants defective in the delivery and processing of multiple
vacuolar hydrolases. Mol Cell Biol 8: 4936-4948 doi: 10.1128/mcb.8.11.4936
Roth TF, Porter KR (1964) Yolk Protein Uptake in the Oocyte of the Mosquito Aedes Aegypti.
L. J Cell Biol 20: 313-332 doi: 10.1083/jcb.20.2.313
Rothman JH, Howald I, Stevens TH (1989) Characterization of genes required for protein
sorting and vacuolar function in the yeast Saccharomyces cerevisiae. EMBO J 8: 2057-
2065 doi:
Sahu R, Kaushik S, Clement CC, Cannizzo ES, Scharf B, Follenzi A, Potolicchio I, Nieves E,
Cuervo AM, Santambrogio L (2011) Microautophagy of cytosolic proteins by late
endosomes. Dev Cell 20: 131-139 doi: 10.1016/j.devcel.2010.12.003
Saksena S, Sun J, Chu T, Emr SD (2007) ESCRTing proteins in the endocytic pathway. Trends
Biochem Sci 32: 561-573 doi: 10.1016/j.tibs.2007.09.010
Saksena S, Wahlman J, Teis D, Johnson AE, Emr SD (2009) Functional reconstitution of
ESCRT-III assembly and disassembly. Cell 136: 97-109 doi:
10.1016/j.cell.2008.11.013
Samson RY, Obita T, Freund SM, Williams RL, Bell SD (2008) A role for the ESCRT system
in cell division in archaea. Science 322: 1710-1713 doi: 10.1126/science.1165322
Scheffer LL, Sreetama SC, Sharma N, Medikayala S, Brown KJ, Defour A, Jaiswal JK (2014)
Mechanism of Ca(2)(+)-triggered ESCRT assembly and regulation of cell membrane
repair. Nat Commun 5: 5646 doi: 10.1038/ncomms6646

143
Schluter C, Lam KK, Brumm J, Wu BW, Saunders M, Stevens TH, Bryan J, Conibear E (2008)
Global analysis of yeast endosomal transport identifies the vps55/68 sorting complex.
Mol Biol Cell 19: 1282-1294 doi: 10.1091/mbc.E07-07-0659
Schoneberg J, Lee IH, Iwasa JH, Hurley JH (2017) Reverse-topology membrane scission by
the ESCRT proteins. Nat Rev Mol Cell Biol 18: 5-17 doi: 10.1038/nrm.2016.121
Schoneberg J, Pavlin MR, Yan S, Righini M, Lee IH, Carlson LA, Bahrami AH, Goldman DH,
Ren X, Hummer G, Bustamante C, Hurley JH (2018) ATP-dependent force generation
and membrane scission by ESCRT-III and Vps4. Science 362: 1423-1428 doi:
10.1126/science.aat1839
Schopf JW, Kitajima K, Spicuzza MJ, Kudryavtsev AB, Valley JW (2018) SIMS analyses of
the oldest known assemblage of microfossils document their taxon-correlated carbon
isotope compositions. Proc Natl Acad Sci U S A 115: 53-58 doi:
10.1073/pnas.1718063115
Scott A, Gaspar J, Stuchell-Brereton MD, Alam SL, Skalicky JJ, Sundquist WI (2005) Structure
and ESCRT-III protein interactions of the MIT domain of human VPS4A. Proc Natl
Acad Sci U S A 102: 13813-13818 doi: 10.1073/pnas.0502165102
Scott CC, Vacca F, Gruenberg J (2014) Endosome maturation, transport and functions. Semin
Cell Dev Biol 31: 2-10 doi: 10.1016/j.semcdb.2014.03.034
Scourfield EJ, Martin-Serrano J (2017) Growing functions of the ESCRT machinery in cell
biology and viral replication. Biochem Soc Trans 45: 613-634 doi:
10.1042/BST20160479
Shestakova A, Hanono A, Drosner S, Curtiss M, Davies BA, Katzmann DJ, Babst M (2010)
Assembly of the AAA ATPase Vps4 on ESCRT-III. Mol Biol Cell 21: 1059-1071 doi:
10.1091/mbc.E09-07-0572
Shiflett SL, Ward DM, Huynh D, Vaughn MB, Simmons JC, Kaplan J (2004) Characterization
of Vta1p, a class E Vps protein in Saccharomyces cerevisiae. J Biol Chem 279: 10982-
10990 doi: 10.1074/jbc.M312669200
Shim S, Kimpler LA, Hanson PI (2007) Structure/function analysis of four core ESCRT-III
proteins reveals common regulatory role for extreme C-terminal domain. Traffic 8:
1068-1079 doi: 10.1111/j.1600-0854.2007.00584.x
Skibinski G, Parkinson NJ, Brown JM, Chakrabarti L, Lloyd SL, Hummerich H, Nielsen JE,
Hodges JR, Spillantini MG, Thusgaard T, Brandner S, Brun A, Rossor MN, Gade A,
Johannsen P, Sorensen SA, Gydesen S, Fisher EM, Collinge J (2005) Mutations in the

144
endosomal ESCRTIII-complex subunit CHMP2B in frontotemporal dementia. Nat
Genet 37: 806-808 doi: 10.1038/ng1609
Skjeldal FM, Haugen LH, Mateus D, Frei DM, Rodseth AV, Hu X, Bakke O (2021) De novo
formation of early endosomes during Rab5 to Rab7 transition. J Cell Sci
10.1242/jcs.254185
Skowyra ML, Schlesinger PH, Naismith TV, Hanson PI (2018) Triggered recruitment of
ESCRT machinery promotes endolysosomal repair. Science
36010.1126/science.aar5078
Slagsvold T, Aasland R, Hirano S, Bache KG, Raiborg C, Trambaiolo D, Wakatsuki S,
Stenmark H (2005) Eap45 in mammalian ESCRT-II binds ubiquitin via a
phosphoinositide-interacting GLUE domain. J Biol Chem 280: 19600-19606 doi:
10.1074/jbc.M501510200
Sollner T, Bennett MK, Whiteheart SW, Scheller RH, Rothman JE (1993) A protein assembly-
disassembly pathway in vitro that may correspond to sequential steps of synaptic vesicle
docking, activation, and fusion. Cell 75: 409-418 doi: 10.1016/0092-8674(93)90376-2
Spang A, Saw JH, Jorgensen SL, Zaremba-Niedzwiedzka K, Martijn J, Lind AE, van Eijk R,
Schleper C, Guy L, Ettema TJG (2015) Complex archaea that bridge the gap between
prokaryotes and eukaryotes. Nature 521: 173-179 doi: 10.1038/nature14447
Stahelin RV, Long F, Diraviyam K, Bruzik KS, Murray D, Cho W (2002) Phosphatidylinositol
3-phosphate induces the membrane penetration of the FYVE domains of Vps27p and
Hrs. J Biol Chem 277: 26379-26388 doi: 10.1074/jbc.M201106200
Stevens TH, Rothman JH, Payne GS, Schekman R (1986) Gene dosage-dependent secretion of
yeast vacuolar carboxypeptidase Y. J Cell Biol 102: 1551-1557 doi:
10.1083/jcb.102.5.1551
Strack B, Calistri A, Craig S, Popova E, Gottlinger HG (2003) AIP1/ALIX is a binding partner
for HIV-1 p6 and EIAV p9 functioning in virus budding. Cell 114: 689-699 doi:
10.1016/s0092-8674(03)00653-6
Stringer DK, Piper RC (2011) Terminating protein ubiquitination: Hasta la vista, ubiquitin. Cell
Cycle 10: 3067-3071 doi: 10.4161/cc.10.18.17191
Stuchell-Brereton MD, Skalicky JJ, Kieffer C, Karren MA, Ghaffarian S, Sundquist WI (2007)
ESCRT-III recognition by VPS4 ATPases. Nature 449: 740-744 doi:
10.1038/nature06172
Studier FW (2014) Stable expression clones and auto-induction for protein production in E.
coli. Methods Mol Biol 1091: 17-32 doi: 10.1007/978-1-62703-691-7_2

145
Su M, Guo EZ, Ding X, Li Y, Tarrasch JT, Brooks CL, 3rd, Xu Z, Skiniotis G (2017)
Mechanism of Vps4 hexamer function revealed by cryo-EM. Sci Adv 3: e1700325 doi:
10.1126/sciadv.1700325
Sun S, Zhou X, Corvera J, Gallick GE, Lin SH, Kuang J (2015) ALG-2 activates the MVB
sorting function of ALIX through relieving its intramolecular interaction. Cell Discov
1: 15018 doi: 10.1038/celldisc.2015.18
Sundborger AC, Fang S, Heymann JA, Ray P, Chappie JS, Hinshaw JE (2014) A dynamin
mutant defines a superconstricted prefission state. Cell Rep 8: 734-742 doi:
10.1016/j.celrep.2014.06.054
Swanson KA, Kang RS, Stamenova SD, Hicke L, Radhakrishnan I (2003) Solution structure of
Vps27 UIM-ubiquitin complex important for endosomal sorting and receptor
downregulation. EMBO J 22: 4597-4606 doi: 10.1093/emboj/cdg471
Switzer RC, 3rd, Merril CR, Shifrin S (1979) A highly sensitive silver stain for detecting
proteins and peptides in polyacrylamide gels. Anal Biochem 98: 231-237 doi:
10.1016/0003-2697(79)90732-2
Tabata K, Arimoto M, Arakawa M, Nara A, Saito K, Omori H, Arai A, Ishikawa T, Konishi E,
Suzuki R, Matsuura Y, Morita E (2016) Unique Requirement for ESCRT Factors in
Flavivirus Particle Formation on the Endoplasmic Reticulum. Cell Rep 16: 2339-2347
doi: 10.1016/j.celrep.2016.07.068
Takahashi Y, He H, Tang Z, Hattori T, Liu Y, Young MM, Serfass JM, Chen L, Gebru M, Chen
C, Wills CA, Atkinson JM, Chen H, Abraham T, Wang HG (2018) An autophagy assay
reveals the ESCRT-III component CHMP2A as a regulator of phagophore closure. Nat
Commun 9: 2855 doi: 10.1038/s41467-018-05254-w
Tang S, Buchkovich NJ, Henne WM, Banjade S, Kim YJ, Emr SD (2016) ESCRT-III activation
by parallel action of ESCRT-I/II and ESCRT-0/Bro1 during MVB biogenesis. Elife
510.7554/eLife.15507
Teis D, Saksena S, Emr SD (2008) Ordered assembly of the ESCRT-III complex on endosomes
is required to sequester cargo during MVB formation. Dev Cell 15: 578-589 doi:
10.1016/j.devcel.2008.08.013
Teis D, Saksena S, Emr SD (2009) SnapShot: the ESCRT machinery. Cell 137: 182-182 e181
doi: 10.1016/j.cell.2009.03.027
Teis D, Saksena S, Judson BL, Emr SD (2010) ESCRT-II coordinates the assembly of ESCRT-
III filaments for cargo sorting and multivesicular body vesicle formation. EMBO J 29:
871-883 doi: 10.1038/emboj.2009.408

146
Teo H, Perisic O, Gonzalez B, Williams RL (2004) ESCRT-II, an endosome-associated
complex required for protein sorting: crystal structure and interactions with ESCRT-III
and membranes. Dev Cell 7: 559-569 doi: 10.1016/j.devcel.2004.09.003
Thery C (2011) Exosomes: secreted vesicles and intercellular communications. F1000 Biol Rep
3: 15 doi: 10.3410/B3-15
Thorsen M, Perrone GG, Kristiansson E, Traini M, Ye T, Dawes IW, Nerman O, Tamas MJ
(2009) Genetic basis of arsenite and cadmium tolerance in Saccharomyces cerevisiae.
BMC Genomics 10: 105 doi: 10.1186/1471-2164-10-105
Toshima JY, Toshima J, Kaksonen M, Martin AC, King DS, Drubin DG (2006) Spatial
dynamics of receptor-mediated endocytic trafficking in budding yeast revealed by using
fluorescent alpha-factor derivatives. Proc Natl Acad Sci U S A 103: 5793-5798 doi:
10.1073/pnas.0601042103
Tuthill TJ, Bubeck D, Rowlands DJ, Hogle JM (2006) Characterization of early steps in the
poliovirus infection process: receptor-decorated liposomes induce conversion of the
virus to membrane-anchored entry-intermediate particles. J Virol 80: 172-180 doi:
10.1128/JVI.80.1.172-180.2006
Ventimiglia LN, Cuesta-Geijo MA, Martinelli N, Caballe A, Macheboeuf P, Miguet N,
Parnham IM, Olmos Y, Carlton JG, Weissenhorn W, Martin-Serrano J (2018) CC2D1B
Coordinates ESCRT-III Activity during the Mitotic Reformation of the Nuclear
Envelope. Dev Cell 47: 547-563 e546 doi: 10.1016/j.devcel.2018.11.012
Vietri M, Schink KO, Campsteijn C, Wegner CS, Schultz SW, Christ L, Thoresen SB, Brech
A, Raiborg C, Stenmark H (2015) Spastin and ESCRT-III coordinate mitotic spindle
disassembly and nuclear envelope sealing. Nature 522: 231-235 doi:
10.1038/nature14408
Vietri M, Schultz SW, Bellanger A, Jones CM, Petersen LI, Raiborg C, Skarpen E, Pedurupillay
CRJ, Kjos I, Kip E, Timmer R, Jain A, Collas P, Knorr RL, Grellscheid SN,
Kusumaatmaja H, Brech A, Micci F, Stenmark H, Campsteijn C (2020) Unrestrained
ESCRT-III drives micronuclear catastrophe and chromosome fragmentation. Nat Cell
Biol 22: 856-867 doi: 10.1038/s41556-020-0537-5
von Appen A, LaJoie D, Johnson IE, Trnka MJ, Pick SM, Burlingame AL, Ullman KS, Frost
A (2020) LEM2 phase separation promotes ESCRT-mediated nuclear envelope
reformation. Nature 582: 115-118 doi: 10.1038/s41586-020-2232-x
Votteler J, Sundquist WI (2013) Virus budding and the ESCRT pathway. Cell Host Microbe
14: 232-241 doi: 10.1016/j.chom.2013.08.012

147
Walther TC, Brickner JH, Aguilar PS, Bernales S, Pantoja C, Walter P (2006) Eisosomes mark
static sites of endocytosis. Nature 439: 998-1003 doi: 10.1038/nature04472
Wang J, Fang N, Xiong J, Du Y, Cao Y, Ji WK (2021) An ESCRT-dependent step in fatty acid
transfer from lipid droplets to mitochondria through VPS13D-TSG101 interactions. Nat
Commun 12: 1252 doi: 10.1038/s41467-021-21525-5
Wang T, Hong W (2006) RILP interacts with VPS22 and VPS36 of ESCRT-II and regulates
their membrane recruitment. Biochem Biophys Res Commun 350: 413-423 doi:
10.1016/j.bbrc.2006.09.064
Wang T, Li L, Hong W (2017) SNARE proteins in membrane trafficking. Traffic 18: 767-775
doi: 10.1111/tra.12524
Waugh DS (2005) Making the most of affinity tags. Trends Biotechnol 23: 316-320 doi:
10.1016/j.tibtech.2005.03.012
Webster BM, Thaller DJ, Jager J, Ochmann SE, Borah S, Lusk CP (2016) Chm7 and Heh1
collaborate to link nuclear pore complex quality control with nuclear envelope sealing.
EMBO J 35: 2447-2467 doi: 10.15252/embj.201694574
Weinberg J, Drubin DG (2012) Clathrin-mediated endocytosis in budding yeast. Trends Cell
Biol 22: 1-13 doi: 10.1016/j.tcb.2011.09.001
Wemmer M, Azmi I, West M, Davies B, Katzmann D, Odorizzi G (2011) Bro1 binding to Snf7
regulates ESCRT-III membrane scission activity in yeast. J Cell Biol 192: 295-306 doi:
10.1083/jcb.201007018
Wideman JG, Leung KF, Field MC, Dacks JB (2014) The cell biology of the endocytic system
from an evolutionary perspective. Cold Spring Harb Perspect Biol 6: a016998 doi:
10.1101/cshperspect.a016998
Willan J, Cleasby AJ, Flores-Rodriguez N, Stefani F, Rinaldo C, Pisciottani A, Grant E,
Woodman P, Bryant HE, Ciani B (2019) ESCRT-III is necessary for the integrity of the
nuclear envelope in micronuclei but is aberrant at ruptured micronuclear envelopes
generating damage. Oncogenesis 8: 29 doi: 10.1038/s41389-019-0136-0
Wood WB (1966) Host specificity of DNA produced by Escherichia coli: bacterial mutations
affecting the restriction and modification of DNA. J Mol Biol 16: 118-133 doi:
10.1016/s0022-2836(66)80267-x
Woodcock DM, Crowther PJ, Doherty J, Jefferson S, DeCruz E, Noyer-Weidner M, Smith SS,
Michael MZ, Graham MW (1989) Quantitative evaluation of Escherichia coli host
strains for tolerance to cytosine methylation in plasmid and phage recombinants.
Nucleic Acids Res 17: 3469-3478 doi: 10.1093/nar/17.9.3469

148
Xiao J, Xia H, Zhou J, Azmi IF, Davies BA, Katzmann DJ, Xu Z (2008) Structural basis of
Vta1 function in the multivesicular body sorting pathway. Dev Cell 14: 37-49 doi:
10.1016/j.devcel.2007.10.013
Yang B, Stjepanovic G, Shen Q, Martin A, Hurley JH (2015) Vps4 disassembles an ESCRT-
III filament by global unfolding and processive translocation. Nat Struct Mol Biol 22:
492-498 doi: 10.1038/nsmb.3015
Yang D, Rismanchi N, Renvoise B, Lippincott-Schwartz J, Blackstone C, Hurley JH (2008)
Structural basis for midbody targeting of spastin by the ESCRT-III protein CHMP1B.
Nat Struct Mol Biol 15: 1278-1286 doi: 10.1038/nsmb.1512
Yang Z, Vild C, Ju J, Zhang X, Liu J, Shen J, Zhao B, Lan W, Gong F, Liu M, Cao C, Xu Z
(2012) Structural basis of molecular recognition between ESCRT-III-like protein Vps60
and AAA-ATPase regulator Vta1 in the multivesicular body pathway. J Biol Chem 287:
43899-43908 doi: 10.1074/jbc.M112.390724
Yanguas F, Moscoso-Romero E, Valdivieso MH (2019) Ent3 and GGA adaptors facilitate
diverse anterograde and retrograde trafficking events to and from the prevacuolar
endosome. Sci Rep 9: 10747 doi: 10.1038/s41598-019-47035-5
Yeo SC, Xu L, Ren J, Boulton VJ, Wagle MD, Liu C, Ren G, Wong P, Zahn R, Sasajala P,
Yang H, Piper RC, Munn AL (2003) Vps20p and Vta1p interact with Vps4p and
function in multivesicular body sorting and endosomal transport in Saccharomyces
cerevisiae. J Cell Sci 116: 3957-3970 doi: 10.1242/jcs.00751
Yorikawa C, Shibata H, Waguri S, Hatta K, Horii M, Katoh K, Kobayashi T, Uchiyama Y,
Maki M (2005) Human CHMP6, a myristoylated ESCRT-III protein, interacts directly
with an ESCRT-II component EAP20 and regulates endosomal cargo sorting. Biochem
J 387: 17-26 doi: 10.1042/BJ20041227
Zhang H, Wang Y, Wong JJ, Lim KL, Liou YC, Wang H, Yu F (2014) Endocytic pathways
downregulate the L1-type cell adhesion molecule neuroglian to promote dendrite
pruning in Drosophila. Dev Cell 30: 463-478 doi: 10.1016/j.devcel.2014.06.014
Zhen Y, Spangenberg H, Munson MJ, Brech A, Schink KO, Tan KW, Sorensen V, Wenzel
EM, Radulovic M, Engedal N, Simonsen A, Raiborg C, Stenmark H (2020) ESCRT-
mediated phagophore sealing during mitophagy. Autophagy 16: 826-841 doi:
10.1080/15548627.2019.1639301
Zhou F, Wu Z, Zhao M, Segev N, Liang Y (2019) Autophagosome closure by ESCRT:
Vps21/RAB5-regulated ESCRT recruitment via an Atg17-Snf7 interaction. Autophagy
15: 1653-1654 doi: 10.1080/15548627.2019.1628547

149
6 SUPPLEMENTARY MATERIAL
Table S 1: CSM Single Drop-out media (-Trp left; -His right).
Compound mg/l Compound mg/l
Adenine 10 Adenine 10
L-Arginine 50 L-Arginine 50
L-Aspartic acid 80 L-Aspartic acid 80
L-Histidine HCl 20 L-Isoleucine 50
L-Isoleucine 50 L-Leucine 100
L-Leucine 100 L-Lysine HCl 50
L-Lysine HCl 50 L-Methionine 20
L-Methionine 20 L-Phenylalanine 50
L-Phenylalanine 50 L-Threonine 100
L-Threonine 100 L-Tryptophan 50
L-Tyrosine 50 L-Tyrosine 50
Uracil 20 Uracil 20
Valine 140 Valine 140
Total 740 Total 770
Figure S 1: Color Pre-stained Protein Standard, Broad Range (11–245 kDa).

150
Table S 2: Corresponding sample concentrations of the gradient purification.
Lane Sample Start [%] End [%] Start conc. [mM] End conc. [mM]
7 T4 10 13 50 65
8 T5 13 16 65 80
9 T6 16 19 80 95
10 T7 19 22 95 110
11 T8 22 25 110 125
12 T9 25 28 125 140
13 T10 28 31 140 155
14 T11 31 34 155 170
15 T12 34 37 170 185
16 T13 37 40 185 200
17 T14 40 43 200 215
18 T15 43 46 215 230
19 T16 46 49 230 245
20 T17 49 52 245 260
21 T18 52 55 260 275
22 T19 55 58 275 290
23 T20 58 61 290 305
24 T21 61 64 305 320
25 T22 64 67 320 335
26 T23 67 70 335 350
27 T24 70 73 350 365
28 T25 73 76 365 380
29 T26 76 79 380 395
30 T27 79 82 395 410
31 T28 82 85 410 425
32 T29 85 88 425 440
33 T30 88 91 440 455
34 T31 91 94 455 470
35 T32 94 97 470 485
36 T33 97 100 485 500

151
Figure S 2: Gradient AEKTA purification protocol of Mos10-6His from RKY2999 with Ni-NTA column.

152
Figure S 3: SDS PAGE of gradient Mos10-6His AEKTA purification using a Ni-NTA column and SILAC.
IMAC purification of 6His tagged-Mos10 (RKY2999) with the AEKTA system utilizing a Ni2+-NTA column.
Visualization of the purification process using Coomassie staining of the SDS PAGE gels. Area in the black
rectangle used for MS analysis. M: NEB Color Pre-stained Protein Standard (11 - 245 kDa); Lane 1: Lysis debris;
Lane 2: Sample loaded on AEKTA; Lane 3: Flowthrough; Lane 4: T2; Lane 5-34: T4-T33.
Figure S 4: Ni2+- vs. Co2+-NTA column assay for purifying crosslinked Mos10-6His.
A differential centrifugation experiment was done to separate and highlight crosslinking partners into S13 and P13
fractions. Beads were stripped with EDTA and recharged with Ni2+ (Ni2+-Re) or loaded with Co2+ ions. Lane 1:
WT extract; Lane 2: Δ8 extract; Lane 3: RKY2999 extract; Lane 4: S13 on Ni2+-NTA; Lane 5: P13 on Ni2+-
NTA; Lane 6: S13 on recharged Ni2+-NTA; Lane 7: P13 on recharged Ni2+-NTA; Lane 8: S13 on Co2+-NTA;
Lane 9: P13 on Co2+-NTA; Arrows: Black: Mos10; Grey: Mos10-6His; White: Crosslinks. Loaded: OD = 0.2.
M 1 2 3 4 5 6 7 8 9 10 11 12 13 14 15 16 17 18 19 M 20 21 22 23 24 25 26 27 28 29 30 31 32 33 34
32
46
58
80
100
135190
kDa
25
22
245
T16 T17 T18
22
25
32
46
58
80100135190kDa
M 1 2 3 4 5 6 7 8 9
Ni2+ Ni2+-Re Co2+
S13 S13 S13P13 P13 P13

153
Figure S 5: SILAC Experiment with mixed “light” and “heavy” RKY2998 and RKY2999 purification.
Mos10-6His batch purification with differential centrifugation was carried out with arginine auxotroph strains
RKY2999 and RKY2998. SILAC technique was applied to both strains to visualize “light” (L) and “heavy” (H)
media-induced protein enrichment differences. Additionally, a differential centrifugation experiment was carried
out to separate and highlight crosslinking partners into S13 and P13 fractions with a recharged Co2+-NTA column.
Additionally, the beads supernatant’s unbound (UB) content collected was applied to WB analysis to visualize the
bead’s binding capacity. An empty unbound fraction implies sufficient Co2+-NTA column volume to affinity
coordinate and purify the entire Mos10-6His content in the cell culture. M: NEB Color Pre-stained Protein
Standard (11 - 245 kDa); Lane 1: RKY2998 extract; Lane 2: Δ8 extract; Lane 3: RKY2999 extract; Lane 4: UB
S13 of RKY2998(L) and RKY2999(H); Lane 5: UB P13 of RKY2998(L) and RKY2999(H); Lane 6: beads S13
of RKY2998(L) and RKY2999(H); Lane 7: beads P13 of RKY2998(L) and RKY2999(H); Lane 8: UB S13 of
RKY2998(H) and RKY2999(L); Lane 9: UB P13 of RKY2998(H) and RKY2999(L); Lane 10: beads S13 of
RKY2998(H) and RKY2999(L); Lane 11: beads P13 of RKY2998(H) and RKY2999(L); Lane 12: UB S13 of
RKY2998(L) and RKY2998(H); Lane 13: UB P13 of RKY2998(L) and RKY2998(H); Lane 14: beads S13 of
RKY2998(L) and RKY2998(H); Lane 15: beads P13 of RKY2998(L) and RKY2998(H). Arrows: Black: Mos10;
Grey: Mos10-6His; White: Crosslinks. Loaded: OD = 0.2.
32
46
58
80
100
135190
kDa245
M 1 2 3 4 5 6 7 8 9 10 11 12 13 14 15

154
Table S 3: Mos-6His to Ni-NTA binding condition test.
NaCl [mM] Tween20 [%] Glycerol [%] Beta [mM]
300 0 0 0
300 0 0 5
300 0 10 0
300 0 10 5
300 0.1 0 0
300 0.1 0 5
300 0.1 10 0
300 0.1 10 5
1000 0 0 0
1000 0 0 5
1000 0 10 0
1000 0 10 5
1000 0.1 0 0
1000 0.1 0 5
1000 0.1 10 0
1000 0.1 10 5
22
25
32
46
58
80100135190kDa
M 1 2 3 4 5 6 7 8 9 10 11 12 M 3 6 9 12
IN UB B IN UB B IN UB B IN UB B
Crude AB AB FT AB Elution Dialysed AB

155
Figure S 6: Analyzing antibody sera efficiency against native Mos10 extract.
Various fractions were collected and tested during antibody purification against a WT (RKY1558) extract to
compare immunoprecipitation efficiency and purity. The sera tested are the crude antibody extract, antibodies not
purified by Affi-Gel 15 crosslinked Mos10-6His (AB FT), the eluted antibodies, and the dialyzed antibodies. For
each input (IN), 20 OD of an exponential WT (RKY1558) culture were harvested, lysed, and incubated with 5 µl
AB sera before being harvested by Protein A Sepharose beads (supernatant = UB for unbound), washed and boiled
(B for beads fraction). M: NEB Color Pre-stained Protein Standard (11 - 245 kDa); Lane 1: Crude AB IN; Lane 2:
Crude AB UB; Lane 3: Crude AB B; Lane 4: FT AB IN; Lane 5: FT AB UB; Lane 6: FT AB B; Lane 7: Eluted
AB IN; Lane 8: Eluted AB UB; Lane 9: Eluted AB B; Lane 10: dialyzed AB IN Lane 11: dialyzed AB UB;
Lane 12: dialyzed AB B. Arrows: Black: Mos10; Yellow: Antibody. Loaded: OD = 0.2.
Figure S 7: Comparison of WT and ΔMos10 purification on SDS PAGE with Coomassie and silver staining.
Crosslinked protein samples of Mos10 (RKY1558) and Δmos10 (RKY2892) strains were applied to SDS PAGE
and stained by Coomassie and silver staining. Additional content at 30 kDa can be seen in the Mos10 samples
indicating Mos10 protein bands. In the region of detected crosslinks from the WB at around 58 to 90 kDa, no
difference in band intensities can be seen on the Coomassie-stained gel. The silver staining appears over-stained
due to the higher sensitivity of the stain, which makes detecting single bands belonging to the crosslinks absurd.
M: NEB Color Pre-stained Protein Standard (11 - 245 kDa); Mos10 = RKY1558; Δmos10 = RKY2982.
22
25
32
46
58
80100
135190
kDa245
M Mos10 ∆Mos10 Mos10 ∆Mos10

156
Figure S 8: Samples for MS once stained with Coomassie
and once with silver staining.
RKY1558 yeast culture was grown until the exponential
phase before being crosslinked according to standard
protocol and immunoprecipitated with purified α-Mos10
antibodies. Samples were applied on SDS PAGE to be
stained by either Coomassie or silver staining. The black
rectangles highlight the areas to be analyzed by MS. M:
NEB Color Pre-stained Protein Standard (11 - 245 kDa);
MS: samples for mass spectrometry.
Figure S 9: Graphing electrophoresis results of WB bands.
The blue curve indicates the relative migration distance of marker bands in reference to the standard protein’s
logarithmic scaled molecular weight. The black dotted line represents a polynomic fit of the blue curve to calculate
unknown protein band weights by their migration distance. The polynomic equation was used to calculate the log
MW of the unknown protein bands: logMW = 1.0065*Rf2 – 1.992*Rf + 2.3521, whereas Rf is calculated by the
band migration distance X divided by the front distance. The curve’s fit is R = 0.9916.
2225
32
46
58
80100135190
kDa245
M MS M MS
1,25
1,50
1,75
2,00
2,25
2,50
0,0 0,1 0,2 0,3 0,4 0,5 0,6 0,7 0,8 0,9 1,0
log
MW
Rf

157
Table S 4: Calculation of the unknown protein bands sized of the established crosslinking pattern partner.
Label X
MW Standard
(kDa) Rf logMW MW CL
(kDa)
MW CL w/o Mos10-6His
(kDa)
Standard 1 8,0 245 0,01 2,39
Standard 2 44,8 190 0,04 2,28
Standard 3 100,2 135 0,10 2,13
Standard 4 179,5 100 0,18 2,00
Standard 5 244,8 80 0,24 1,90
Standard 6 355,5 58 0,35 1,76
Standard 7 500,2 46 0,49 1,66
Standard 8 671,8 32 0,66 1,51
Standard 9 861,2 25 0,84 1,40
Standard 10 955,8 22 0,93 1,34
Unknown 1 50,2 0,05 2,26 183 149
Unknown 2 192,2 0,19 2,01 93 59
Unknown 3 243,5 0,24 1,93 79 45
Unknown 4 256,8 0,25 1,92 76 42
Unknown 5 286,8 0,28 1,87 71 36
Unknown 6 298,2 0,29 1,86 69 34
Mos10-6His 638,2 0,62 1,50 34
Front 1023 WB protein bands were used from Figure 16, and migration distances were calculated by ImageJ.
Figure S 10: Crosslink pattern of Mos10-13myc
OD 1 and OD 4 cultures.
Two RKY1452 cultures with an OD = 1 and OD = 4
were grown in YPD and crosslinked according to
standard protocol. Samples were immuno-
precipitated with α-13myc antibodies and bound to
protein A beads before being boiled. Blots are either
incubated with α-Mos10 or α-13myc antibodies. M:
NEB Color Pre-stained Protein Standard (11 –
245 kDa); Lane 1: bead fraction of OD = 1 culture;
Lane 2: supernatant fraction of OD = 1 culture;
Lane 3: bead fraction of OD = 4 culture; Lane 4:
supernatant fraction of OD = 4 culture; Arrow: Red:
Mos10-13myc; White: Crosslinks.
25
32
46
58
80
100
135190
kDa245
M 1 2 3 4 M 1 2 3 4
α-Mos10 α-13myc
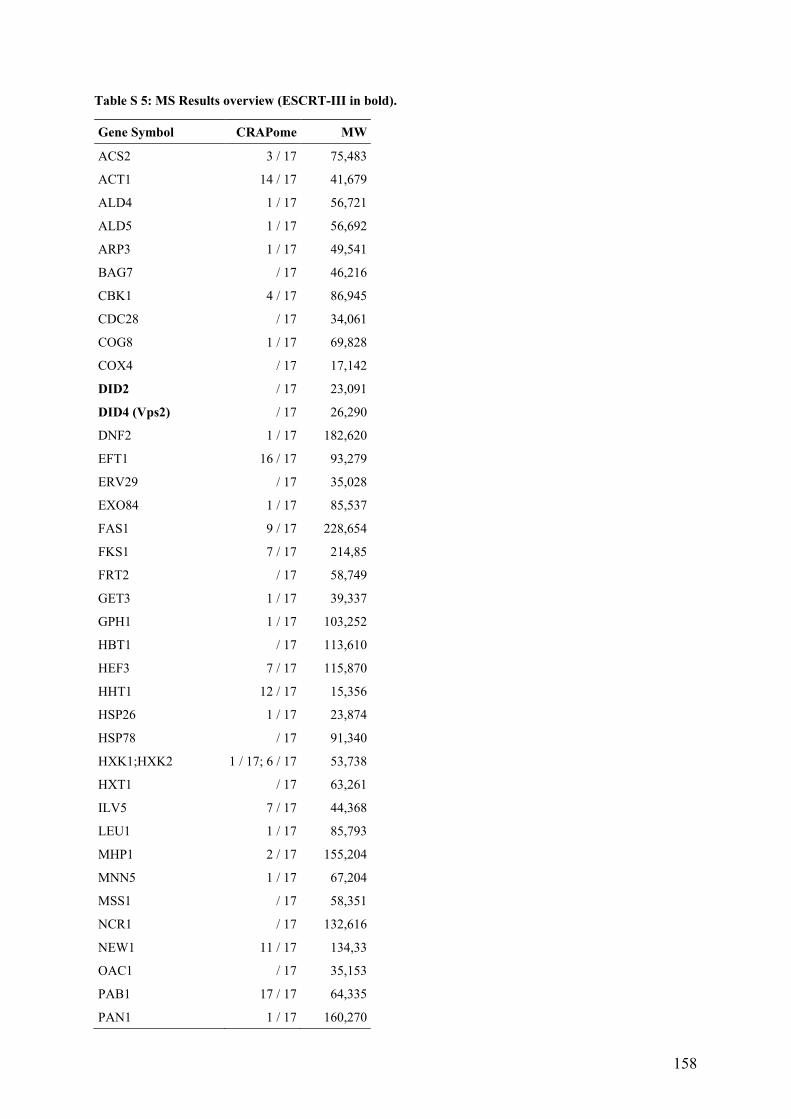
158
Table S 5: MS Results overview (ESCRT-III in bold).
Gene Symbol CRAPome MW
ACS2 3 / 17 75,483
ACT1 14 / 17 41,679
ALD4 1 / 17 56,721
ALD5 1 / 17 56,692
ARP3 1 / 17 49,541
BAG7 / 17 46,216
CBK1 4 / 17 86,945
CDC28 / 17 34,061
COG8 1 / 17 69,828
COX4 / 17 17,142
DID2 / 17 23,091
DID4 (Vps2) / 17 26,290
DNF2 1 / 17 182,620
EFT1 16 / 17 93,279
ERV29 / 17 35,028
EXO84 1 / 17 85,537
FAS1 9 / 17 228,654
FKS1 7 / 17 214,85
FRT2 / 17 58,749
GET3 1 / 17 39,337
GPH1 1 / 17 103,252
HBT1 / 17 113,610
HEF3 7 / 17 115,870
HHT1 12 / 17 15,356
HSP26 1 / 17 23,874
HSP78 / 17 91,340
HXK1;HXK2 1 / 17; 6 / 17 53,738
HXT1 / 17 63,261
ILV5 7 / 17 44,368
LEU1 1 / 17 85,793
MHP1 2 / 17 155,204
MNN5 1 / 17 67,204
MSS1 / 17 58,351
NCR1 / 17 132,616
NEW1 11 / 17 134,33
OAC1 / 17 35,153
PAB1 17 / 17 64,335
PAN1 1 / 17 160,270

159
Gene Symbol CRAPome MW
PDC1 15 / 17 61,486
PMA1;PMA2 17 / 17 99,618
PRE6 2 / 17 28,439
PTR2 / 17 68,043
RPL11B;RPL11A 17 / 17 19,762
RPL9B;RPL9A 17 / 17 21,657
RPS3 17 / 17 26,502
RTN2 / 17 44,358
RTS1 / 17 85,334
SAH1 5 / 17 49,115
SER33;SER3 / 17 51,181
SNF7 / 17 26,987
SSB1 17 / 17 66,601
SSC1 9 / 17 63,248
SSE2 5 / 17 77,620
STB6 / 17 88,835
TAF7 / 17 67,555
TDH1 12 / 17 35,750
TGS1 2 / 17 36,547
TIF35 6 / 17 30,500
TIM10 1 / 17 10,305
TOF1 / 17 141,104
TOM71 / 17 71,855
TPS1 / 17 56,147
TY1B-BL;TY1B-MR1 11 / 17 198,979
TY1B-MR1;TY1B-BL 11 / 17 198,900
VMA5 4 / 17 44,188
VPS24 / 17 26,242
VPS60 (Mos10) / 17 25,861
VPS68 / 17 20,101
YAT2 / 17 103,330
YCK1 / 17 61,726
YCK2 1 / 17 62,078
YGR130C / 17 92,697
YJR154W / 17 38,964
YKR075C / 17 36,113
YSP2 / 17 160,577
YTA12 1 / 17 93,275
ZPS1 1 / 17 27,567

160
IP A
IP B
Co-IP A
Co-IP B
Figure S 11: IP of potential Mos10 interacting partners with a GFP-tag and Co-IP of Mos10.
Results of the α-GFP (Co-)IP. IN = input samples; (Co-)IP = the (co-)immunoprecipitated samples. M: NEB
Color Pre-stained Protein Standard (11 – 245 kDa). Loaded: IN: OD = 0.2; IP: OD = 1; Co-IP: OD = 5.
32
46
58
80100135190kDa IN IP IN IP IN IP IN IP IN IP IN IP IN IP IN IP IN IP
M 1 2 3 4 5 6 7 8 9 10 11 12 13 14 15 16 17 18
Exo84 Leu1 Oac1 Tps1 Dnf2 Ygr130c Yck2 Pan1 Tom71
32
46
58
80100135190kDa IN IP IN IP IN IP IN IP IN IP IN IP IN IP IN IP
Cog8 Mss1 Ptr2 Mnn5 Ald5 Pre6 Vps68 WT
M 1 2 3 4 5 6 7 8 9 10 11 12 13 14 15 16
32
46
58
80100135190kDa
M 1 2 3 4 5 6 7 8 9 10 11 12 13 14 15 16 17 18
IN Co-IP IN Co-IP IN Co-IP IN Co-IP IN Co-IP IN Co-IP IN Co-IP IN Co-IP IN Co-IP
Exo84 Leu1 Oac1 Tps1 Dnf2 Ygr130c Yck2 Pan1 Tom71
32
46
58
80100135190kDa
M 1 2 3 4 5 6 7 8 9 10 11 12 13 14 15 16
IN Co-IP IN Co-IP IN Co-IP IN Co-IP IN Co-IP IN Co-IP IN Co-IP IN Co-IP
Cog8 Mss1 Ptr2 Mnn5 Ald5 Pre6 Vps68 WT

161
IP A
IP B
Co-IP A
Co-IP B
Figure S 12: IP of potential Mos10 interacting partners with a sfGFP-tag and Co-IP of Mos10.
Results of the α-sfGFP (Co-)IP. IN = input samples; (Co-)IP = the (co-)immunoprecipitated samples. M: NEB
Color Pre-stained Protein Standard (11 – 245 kDa). Loaded: IN: OD = 0.2; IP: OD = 1; Co-IP: OD = 5.
32
46
58
80100135190
kDa
245
M 1 2 3 4 5 6 7 8 9 10 11 12 13 14 15 16
IN IP IN IP IN IP IN IP IN IP IN IP IN IP IN IP
Exo84 Leu1 Oac1 Tps1 Dnf2 Ygr130c Yck2 Pan1
Tom71
IN IP IN IP IN IP IN IP IN IP IN IP IN IP IN IP
Cog8 Mss1 Ptr2 Mnn5 Ald5 Pre6 Vps68
M 1 2 3 4 5 6 7 8 9 10 11 12 13 14 15 16
32
46
58
80100135190
kDa245
M 1 2 3 4 5 6 7 8 9 10 11 12 13 14 15 1632
46
58
80100135190
kDa245
M 1 2 3 4 5 6 7 8 9 10 11 12 13 14 15 16
IN Co-IP IN Co-IP IN Co-IP IN Co-IP IN Co-IP IN Co-IP IN Co-IP IN Co-IP
Exo84 Leu1 Oac1 Tps1 Dnf2 Ygr130c Yck2 Pan1
32
46
58
80100135190
kDaTom71
M 1 2 3 4 5 6 7 8 9 10 11 12 13 14 15 16
IN Co-IP IN Co-IP IN Co-IP IN Co-IP IN Co-IP IN Co-IP IN Co-IP IN Co-IP
Cog8 Mss1 Ptr2 Mnn5 Ald5 Pre6 Vps68

162
Figure S 13: IMAC purification of WT (RKY1558) strain with RKY2889 (Mos10-6His) control sample.
Ni-NTA purified samples of DSS crosslinked RKY1558 and RKY2889, incubated with any ESCRT-III antibody.
M: NEB Color Pre-stained Protein Standard (11 – 245 kDa). Arrows: Black: Mos10; Grey: Mos10-6His. Loaded:
OD = 1
Figure S 14: IMAC purification of RKY2889 (Mos10-6His).
Ni-NTA purified samples of DSS crosslinked RKY2889, incubated with any ESCRT-III antibody. M: NEB Color
Pre-stained Protein Standard (11 – 245 kDa). Loaded: OD = 1.
WT
2225
32
46
58
80100135190
kDa245
M 1 2 3 4 5 6 7 8 9
α-Mos10Mos10-6His
Mos10-6His
22
25
32
46
58
80100135190
kDa245
M 1 2 3 4 5 6 7 8

163
Figure S 15: IMAC purification of RKY3228 (Mos10-6His +Δchm7).
Ni-NTA purified samples of DSS crosslinked RKY3228, incubated with any ESCRT-III antibody. M: NEB Color
Pre-stained Protein Standard (11 – 245 kDa). Loaded: OD = 1.
Figure S 16: IMAC purification of RKY2788 (Mos10-6His +Δdid2).
Ni-NTA purified samples of DSS crosslinked RKY2788, incubated with any ESCRT-III antibody. M: NEB Color
Pre-stained Protein Standard (11 – 245 kDa). Loaded: OD = 1.
22
25
32
46
58
80100135190
kDa245
M 1 2 3 4 5 6 7 8
+∆chm7
22
25
32
46
58
80100135190
kDa245
M 1 2 3 4 5 6 7 8
+∆did2

164
Figure S 17: IMAC purification of RKY2789 (Mos10-6His +Δist1).
Ni-NTA purified samples of DSS crosslinked RKY2789, incubated with any ESCRT-III antibody. M: NEB Color
Pre-stained Protein Standard (11 – 245 kDa). Loaded: OD = 1.
Figure S 18: IMAC purification of RKY2790 (Mos10-6His +Δsnf7).
Ni-NTA purified samples of DSS crosslinked RKY2790, incubated with any ESCRT-III antibody. M: NEB Color
Pre-stained Protein Standard (11 – 245 kDa). Loaded: OD = 1.
22
25
32
46
58
80100135190kDa
M 1 2 3 4 5 6 7 8
+∆ist1
22
25
32
46
58
80100135190kDa
M 1 2 3 4 5 6 7 8
+∆snf7

165
Figure S 19: IMAC purification of RKY2841 (Mos10-6His +Δvps2).
Ni-NTA purified samples of DSS crosslinked RKY2841, incubated with any ESCRT-III antibody. M: NEB Color
Pre-stained Protein Standard (11 – 245 kDa). Loaded: OD = 1.
Figure S 20: IMAC purification of RKY2893 (Mos10-6His +Δvps20).
Ni-NTA purified samples of DSS crosslinked RKY2893, incubated with any ESCRT-III antibody. M: NEB Color
Pre-stained Protein Standard (11 – 245 kDa). Loaded: OD = 1.
22
25
32
46
58
80100135190kDa
M 1 2 3 4 5 6 7 8
+∆vps2
2225
32
46
58
80100135190
kDa245
M 1 2 3 4 5 6 7 8
+∆vps20

166
Figure S 21: IMAC purification of RKY2830 (Mos10-6His +Δvps24).
Ni-NTA purified samples of DSS crosslinked RKY2830, incubated with any ESCRT-III antibody. M: NEB Color
Pre-stained Protein Standard (11 – 245 kDa). Loaded: OD = 1.
Figure S 22: IP and Co-IP of all ESCRTs in WT strain. RKY1558.
Shown are both sets (A and B), with the antibody used for incubating the blot is on the y-axis and the co-
immunoprecipitated proteins on the column’s header.
22
25
32
46
58
80100135190kDa
M 1 2 3 4 5 6 7 8
+∆vps24
M
M 1 2 3 4 5 6 7 8 9
α-Did2
α-Ist1
α-Mos10
α-Snf7
α-Vps2
α-Vps20
α-Vps24
M
M 1 2 3 4 5 6 7 8 9
BA

167
Table S 6: Co-IP Overview in WT strain.
The amount of each individual ESCRT-III subunit co-immunoprecipitated by the IP is measured in molecules per
cell according to the numbers by Heinzle et al.
1. Set 2. Set Average
0
338
118
717
993
37
654
0
200
400
600
800
1000
1200
Mol
ecul
es/C
ell
Co-IP
Did2 IP
0
331
133
609
813
16
411
0100200300400500600700800900
Mol
ecul
es/C
ell
Co-IP
Did2 IP
0
335
126
663
903
26
532
0
200
400
600
800
1000
1200
Mol
ecul
es/C
ell
Co-IP
Did2 IP
5700
0334
16722045
149
1468
0
1000
2000
3000
4000
5000
6000
Mol
ecul
es/C
ell
Co-IP
Ist IP4724
0344
14671662
33
913
0500
100015002000250030003500400045005000
Mol
ecul
es/C
ell
Co-IP
Ist IP
5212
0339
15701853
91
1190
0
1000
2000
3000
4000
5000
6000
Mol
ecul
es/C
ell
Co-IP
Ist IP
2936
630
0
13651265
41
692
0
500
1000
1500
2000
2500
3000
3500
Mol
ecul
es/C
ell
Co-IP
Mos10 IP
2078
474
0
928698
10288
0
500
1000
1500
2000
2500
Mol
ecul
es/C
ell
Co-IP
Mos10 IP
2507
552
0
1147982
26
490
0
500
1000
1500
2000
2500
3000
3500
Mol
ecul
es/C
ell
Co-IP
Mos10 IP

168
1. Set 2. Set Average
3262
630228
0
1271
53
1168
0
500
1000
1500
2000
2500
3000
3500
Mol
ecul
es/C
ell
Co-IP
Snf7 IP
2884
474178
0
979
12
632
0
500
1000
1500
2000
2500
3000
3500
Mol
ecul
es/C
ell
Co-IP
Snf7 IP
3073
552203
0
1125
32
900
0
500
1000
1500
2000
2500
3000
3500
Mol
ecul
es/C
ell
Co-IP
Snf7 IP
3514
689308
1475
0 124
1241
0500
1000150020002500300035004000
Mol
ecul
es/C
ell
Co-IP
Vps2 IP3770
755293
1407
0 22
957
0500
1000150020002500300035004000
Mol
ecul
es/C
ell
Co-IP
Vps2 IP3642
722300
1441
0 73
1099
0500
1000150020002500300035004000
Mol
ecul
es/C
ell
Co-IP
Vps2 IP
417
4924
300
181
0
175
050
100150200250300350400450
Mol
ecul
es/C
ell
Co-IP
Vps20 IP1899
173 93
1159
505
0
321
0200400600800
100012001400160018002000
Mol
ecul
es/C
ell
Co-IP
Vps20 IP
1158
111 58
729
343
0248
0
500
1000
1500
2000
2500
Mol
ecul
es/C
ell
Co-IP
Vps20 IP
3209
614272
12631137
1810
0
500
1000
1500
2000
2500
3000
3500
Mol
ecul
es/C
ell
Co-IP
Vps24 IP4691
771303
14131476
24 00
500100015002000250030003500400045005000
Mol
ecul
es/C
ell
Co-IP
Vps24 IP
3950
692287
13381307
103 00
500100015002000250030003500400045005000
Mol
ecul
es/C
ell
Co-IP
Vps24 IP

169
Figure S 23: Total amount of protein co-immunoprecipitated by ESCRT-III IP in WT strain RKY1558.
IP of seven ESCRT-III members and their associated ECRT-III co-IP values assembled to the co-IP protein and
graphed against the total molecules per cell.
Figure S 24: IP and Co-IP of all ESCRTs in VPS68 deletion strain RKY3222.
Shown are both sets (A and B), with the antibody used for incubating the blot is on the y-axis and the co-
immunoprecipitated proteins on the column’s header.
0
335126
663903
26
532
5212
0
339
15701853
91
1190
2507
552
0
1147982
26
490
3073
552
2030
1125
32
900
3642
722
300
1441
073
10991158
111 58
729
343
0248
3950
692
287
1338 1307
1030
0
1000
2000
3000
4000
5000
6000
Did2 Ist1 Mos10 Snf7 Vps2 Vps20 Vps24
Mol
ecul
es/c
ell
Co-IP
Did2 Ist1 Mos10 Snf7 Vps2 Vps20 Vps24
M
M 1 2 3 4 5 6 7 8 9
α-Did2
α-Ist1
α-Mos10
α-Snf7
α-Vps2
α-Vps20
α-Vps24
M
M 1 2 3 4 5 6 7 8 9
BA

170
Table S 7: Co-IP Overview in Δvps68 strain RKY3222.
The amount of each individual ESCRT-III subunit co-immunoprecipitated by the IP is measured in molecules per
cell according to the numbers by Heinzle et al.
1. Set 2. Set Average
0
535
92
914980
39
541
0
200
400
600
800
1000
1200
Mol
ecul
es/C
ell
Co-IP
Did2 IP
0
16170
649
870
22
555
0100200300400500600700800900
1000
Mol
ecul
es/C
ell
Co-IP
Did2 IP
0
348
81
781925
30
548
0
200
400
600
800
1000
1200
Mol
ecul
es/C
ell
Co-IP
Did2 IP
4119
0 179
2778
2048
70
1290
0500
10001500200025003000350040004500
Mol
ecul
es/C
ell
Co-IP
Ist IP
4340
0 236
22482367
52
1582
0500
100015002000250030003500400045005000
Mol
ecul
es/C
ell
Co-IP
Ist IP
4229
0 207
25132207
61
1436
0500
100015002000250030003500400045005000
Mol
ecul
es/C
ell
Co-IP
Ist IP
3428
747
0
4355
2060
63
1062
0500
100015002000250030003500400045005000
Mol
ecul
es/C
ell
Co-IP
Mos10 IP1680
1940
1332
1030
23
567
0200400600800
10001200140016001800
Mol
ecul
es/C
ell
Co-IP
Mos10 IP
2554
4710
2844
1545
43
814
0500
100015002000250030003500400045005000
Mol
ecul
es/C
ell
Co-IP
Mos10 IP

171
1. Set 2. Set Average
3085
747
162 0
1588
35
1172
0
500
1000
1500
2000
2500
3000
3500
Mol
ecul
es/C
ell
Co-IP
Snf7 IP2335
194 1410
1523
32
1091
0
500
1000
1500
2000
2500
Mol
ecul
es/C
ell
Co-IP
Snf7 IP
2710
471152 0
1556
34
1131
0
500
1000
1500
2000
2500
3000
3500
Mol
ecul
es/C
ell
Co-IP
Snf7 IP
3618
981
218
3091
0 51
1406
0500
1000150020002500300035004000
Mol
ecul
es/C
ell
Co-IP
Vps2 IP
2061
151 92
859
0 17
765
0
500
1000
1500
2000
2500
Mol
ecul
es/C
ell
Co-IP
Vps2 IP
2840
566155
1975
0 34
1086
-5000
50010001500200025003000350040004500
Mol
ecul
es/C
ell
Co-IP
Vps2 IP
3833
37 132
3646
2025
0
1468
0500
10001500200025003000350040004500
Mol
ecul
es/C
ell
Co-IP
Vps20 IP
1219
42 30
751603
0
346
0
200
400
600
800
1000
1200
1400
Mol
ecul
es/C
ell
Co-IP
Vps20 IP
2526
40 81
2198
1314
0
907
0500
10001500200025003000350040004500
Mol
ecul
es/C
ell
Co-IP
Vps20 IP
4485
873
204
3289
2286
56 00
500100015002000250030003500400045005000
Mol
ecul
es/C
ell
Co-IP
Vps24 IP3233
230 96
10431462
43 00
500
1000
1500
2000
2500
3000
3500
Mol
ecul
es/C
ell
Co-IP
Vps24 IP
3859
551150
21661874
49 00
500100015002000250030003500400045005000
Mol
ecul
es/C
ell
Co-IP
Vps24 IP

172
Figure S 25: Total amount of protein co-immunoprecipitated by ESCRT-III IP in Δvps68 strain RKY3222.
IP of seven ESCRT-III members and their associated ECRT-III co-IP values assembled to the co-IP protein and
graphed against the total molecules per cell.
Table S 8: ESCRT-III molecules per cell.
Protein Molecules/cell1 SD
Chm7 10300 ±2900
Did2 12700 ±3300
Ist1 5000 ±1600
Mos10 3000 ±1000
Snf7 8800 ±3700
Vps2 7700 ±2700
Vps20 1900 ±300
Vps24 6800 ±2400 1Average of four independent determinations, SD = standard deviation
*Values taken from Heinzle et al., 2019
0
348
81
781925
30
548
4229
0207
2513
2207
61
1436
2554
471
0
2844
1545
43
814
2710
471152
0
1556
34
1131
2840
566
155
1975
0 34
1086
2526
40 81
2198
1314
0
907
3859
551
150
2166
1874
49 00
500
1000
1500
2000
2500
3000
3500
4000
4500
Did2 Ist1 Mos10 Snf7 Vps2 Vps20 Vps24
Mol
ecul
es/c
ell
Co-IP
Did2 Ist1 Mos10 Snf7 Vps2 Vps20 Vps24

173
Figure S 26: Differential centrifugation experiment without Triton X-100 in the WT strain RKY 1558.
Sedimentation experiments without Triton X-100 treatment done in triplets and averaged to 100 % over the P13,
P100, and S100 fractions for each ESCRT-III protein with error bars.
Figure S 27: Differential centrifugation experiment with Triton X-100 in the WT strain RKY 1558.
Sedimentation experiments with Triton X-100 treatment done in triplets and averaged to 100 % over the P13,
P100, and S100 fractions for each ESCRT-III protein with error bars.
61
53
66
3035
53 54
42
1317
8 611
17 18
252730
26
64
54
3027
34
0
10
20
30
40
50
60
70
80
Chm7 Did2 Ist1 Mos10 Snf7 Vps2 Vps20 Vps24
Frac
tion
dist
ribut
ion
[%]
P13 P100 S100
21
32
51
15
26 24 23
42
5
30
22
11
19 2026 25
74
38
26
73
56 5650
34
0
10
20
30
40
50
60
70
80
90
Chm7 Did2 Ist1 Mos10 Snf7 Vps2 Vps20 Vps24
Frac
tion
dist
ribut
ion
[%]
P13 P100 S100

174
Figure S 28: Western Blots of differential centrifugation of WT strain RKY1558 in triplets.
Chm7 Did2
M IN P13 P100 S100 IN P13 P100 S100
-TX-100 +TX-100
M IN P13 P100 S100 IN P13 P100 S100
-TX-100 +TX-100
Ist1 Mos10
M IN P13 P100 S100 IN P13 P100 S100
-TX-100 +TX-100M IN P13 P100 S100 IN P13 P100 S100
-TX-100 +TX-100
Snf7
M IN P13 P100 S100 IN P13 P100 S100
-TX-100 +TX-100
Vps2
M IN P13 P100 S100 IN P13 P100 S100
-TX-100 +TX-100
Vps20
M IN P13 P100 S100 IN P13 P100 S100
-TX-100 +TX-100
Vps24
M IN P13 P100 S100 IN P13 P100 S100
-TX-100 +TX-100

175
Figure S 29: Protein distribution in the Δvps68 strain RKY 3221 with and without Triton X-100 treatment.
ESCRT-III protein distribution based on the sedimentation fractions P13, P100, and S100 summed to 100 % in
the Δvps68 strain RKY 3221 with (+) and without (-) Triton X-100 treatment.
Figure S 30: Differential centrifugation experiment without TX-100 in the Δvps68 strain RKY 3221.
Sedimentation experiments without Triton X-100 treatment averaged to 100 % over the P13, P100, and S100
fractions for each ESCRT-III protein.
42
10
3623
64
40
22 2435
26
48
2641
22
4024
16
10
2231
7
34
10 11
1519
19
23
21
16
22
26
42
80
43 46
29 26
67 6550 55
33
5138
62
3750
- + - + - + - + - + - + - + - +
Chm7 Did2 Ist1 Mos10 Snf7 Vps2 Vps20 Vps24
P13 P100 S100
4236
64
22
35
48
41 40
1622
710
1519 21 22
42 43
29
67
50
3338 37
0
10
20
30
40
50
60
70
80
Chm7 Did2 Ist1 Mos10 Snf7 Vps2 Vps20 Vps24
Frac
tion
dist
ribut
ion
[%]
P13 P100 S100

176
Figure S 31: Differential centrifugation experiment with TX-100 in the Δvps68 strain RKY 3221.
Sedimentation experiments with Triton X-100 treatment averaged to 100 % over the P13, P100, and S100 fractions
for each ESCRT-III protein.
Figure S 32: Sedimentation comparison between RKY1558 and RKY3222 with Triton X-100 treatment.
Comparison of the WB results gained from the differential centrifugation experiment results seen in Figure S 28
& Figure S 33. The fraction values for P13, P100, and S100 for the cultures treated with Triton X-100 are
summarized and adjusted to 100 % (Figure S 27 & Figure S 31). For tighter comparison, the results are combined
in the diagram.
10
23
40
24 26 2622 24
10
3134
11
1923
16
26
80
46
26
65
5551
62
50
0
10
20
30
40
50
60
70
80
90
Chm7 Did2 Ist1 Mos10 Snf7 Vps2 Vps20 Vps24
Frac
tion
dist
ribut
ion
[%]
P13 P100 S100
2110
3223
5140
1524 26 26 24 26 23 22 25 24
5
10
30
31
2234
11
1119 19 20 23 26
16
28 26
74 80
3846
26 26
7365
56 55 56 51 5062
47 50
WTΔ WTΔ WTΔ WTΔ WTΔ WTΔ WTΔ WTΔ
Chm7 Did2 Ist1 Mos10 Snf7 Vps2 Vps20 Vps24
P13 P100 S100

177
Figure S 33: Western Blots of differential centrifugation results from the Δvps68 strain RKY 3221.
Figure S 34: Summary of the flotation results from the WT strain RKY1558.
Flotation experiments done in triplets collecting six fractions and combining the first three fractions (1-3) and the
last three fractions (4-6) to distinguish between the membrane and cytosolic associated proteins. Dpm1 was chosen
as a marker for the membrane fractions. All fractions are summed up to 100 %.
M IN P13 P100 S100 IN P13 P100 S100
-TX-100 +TX-100
M IN P13 P100 S100 IN P13 P100 S100
-TX-100 +TX-100
Chm7
Did2
Ist1
Mos10
Snf7
Vps2
Vps20
Vps24
3733
55
12
24
38
58
30
88
6367
45
88
76
62
42
70
12
0
10
20
30
40
50
60
70
80
90
100
Chm7 Did2 Ist1 Mos10 Snf7 Vps2 Vps20 Vps24 Dpm1
Port
ion
[%]
1-3 4-6

178
Figure S 35: Summary of the flotation results from the Δvps68 strain RKY3222.
Flotation experiment collecting six fractions and combining the first three fractions (1-3) and the last three fractions
(4-6) to distinguish between the membrane and cytosolic associated proteins. Dpm1 was chosen as a marker for
the membrane fractions. All fractions are summed up to 100 %.
Figure S 36: Summary of the flotation results from the Δsnf7 strain RKY2790.
Flotation experiments done in triplets collecting six fractions and combining the first three fractions (1-3) and the
last three fractions (4-6) to distinguish between the membrane and cytosolic associated proteins. Dpm1 was chosen
as a marker for the membrane fractions. All fractions are summed up to 100 %.
28
34
45
10
29
38
63
37
87
72
66
55
90
71
62
37
63
13
0
10
20
30
40
50
60
70
80
90
100
Chm7 Did2 Ist1 Mos10 Snf7 Vps2 Vps20 Vps24 Dpm1
Port
ion
[%]
1-3 4-6
39
9
39
11
24
38
22
61
91
61
89
76
62
78
0
10
20
30
40
50
60
70
80
90
100
Chm7 Did2 Ist1 Mos10 Snf7 Vps2 Vps20 Vps24
Port
ion
[%]
1-3 4-6

179
Figure S 37: Summary of the flotation results from the WT strain RKY1558 after incubation.
Flotation experiment collecting six fractions and combining the first three fractions (1-3) and the last three fractions
(4-6) to distinguish between the membrane and cytosolic associated proteins. Dpm1 was chosen as a marker for
the membrane fractions. All fractions are summed up to 100 %.
56
69
52
12
29
42
67
36
91
44
31
48
88
71
58
33
64
9
0
10
20
30
40
50
60
70
80
90
100
Chm7 Did2 Ist1 Mos10 Snf7 Vps2 Vps20 Vps24 Dpm1
Port
ion
[%]
1-3 4-6

180
Figure S 38: WB results of the flotation experiments of WT strain RKY1558.
Figure S 39: WB results of the flotation experiments of Δsnf7 strain RKY2790.
1. Set 2. Set 3. Set
Did2
Ist1
Mos10
Snf7
Vps2
Vps20
Vps24
Chm7
1 2 3 4 5 6 1 2 3 4 5 6 1 2 3 4 5 6
P1-3 P1-3 P1-3P4-6 P4-6 P4-6
Did2
Ist1
Mos10
Vps2
Vps20
Vps24
Chm7
1 2 3 4 5 6 1 2 3 4 5 6 1 2 3 4 5 6
1. Set 2. Set 3. SetP1-3 P1-3 P1-3P4-6 P4-6 P4-6

181
Figure S 40: Flotation results regarding WT incubation, Dpm1 marker protein, and Vps68 deletion.
Figure S 41: Sucrose gradient incubated Did2 WB results of RNaseA treated cells.
ΔVps68 WTincubated
1 2 3 4 5 6 1 2 3 4 5 6
Did2
Ist1
Mos10
Snf7
Vps2
Vps20
Vps24
Chm7
P1-3 P1-3 P1-3P4-6 P4-6 P4-6
ΔSnf7
WT
ΔVps68
Dpm1
1 2 3 4 5 6
32
46
58
80100135190kDa
25
22
M 1 2 3 4 5 6 7 8 9 10 11 12 13 14 15 16 17 18
17

182
Figure S 42: ESCRT-III proteins sucrose profiles in the Vps68 deletion strain RKY3222.
Sucrose density fractionation into 18 fractions based on the sedimentation rate of all ESCRT-III proteins after in
SPBS10 buffer.
0
20
40
60
80
100
0
20
40
60
80
100
0
20
40
60
80
100
0
20
40
60
80
100
0
20
40
60
80
100
0
20
40
60
80
100
0
20
40
60
80
100
0
20
40
60
80
100
1 2 3 4 5 6 7 8 9 10 11 12 13 14 15 16 17 18
Inte
nsity
[%]
Inte
nsity
[%]
Fractions
Chm7
Did2
Ist1
Mos10
Snf7
Vps2
Vps20
Vps24

183
Figure S 43: ESCRT-III proteins sucrose profiles in the Vps68 deletion strain RKY3222 after incubation.
Sucrose density fractionation into 18 fractions based on the sedimentation rate of all ESCRT-III proteins after
incubation for 30 min at 37 °C in SPBS10 buffer.
0
20
40
60
80
100
0
20
40
60
80
100
0
20
40
60
80
100
0
20
40
60
80
100
0
20
40
60
80
100
0
20
40
60
80
100
0
20
40
60
80
100
0
20
40
60
80
100
1 2 3 4 5 6 7 8 9 10 11 12 13 14 15 16 17 18
Inte
nsity
[%]
Inte
nsity
[%]
Fractions
Chm7 Incubated
Did2 Incubated
Ist1 Incubated
Mos10 Incubated
Snf7 Incubated
Vps2 Incubated
Vps20 Incubated
Vps24 Incubated

184
Figure S 44: WB results of the sucrose gradient from the WT strain RKY1558.
Figure S 45: WB results of the sucrose gradient from the WT strain RKY1558 after incubation.
Chm7
Did2
Ist1
Mos10
Snf7
Vps2
Vps20
Vps24
1 2 3 4 5 6 7 8 9 10 11 12 13 14 15 16 17 18
Chm7
Did2
Ist1
Mos10
Snf7
Vps2
Vps20
Vps24
1 2 3 4 5 6 7 8 9 10 11 12 13 14 15 16 17 18

185
Figure S 46: WB results of the sucrose gradient from the Δvps68 strain RKY3222.
Figure S 47: WB results of the sucrose gradient from the Δvps68 strain RKY3222 after incubation.
Chm7
Did2
Ist1
Mos10
Snf7
Vps2
Vps20
Vps24
1 2 3 4 5 6 7 8 9 10 11 12 13 14 15 16 17 18
Chm7
Did2
Ist1
Mos10
Snf7
Vps2
Vps20
Vps24
1 2 3 4 5 6 7 8 9 10 11 12 13 14 15 16 17 18

186
Figure S 48: Sucrose profiles of marker and tagged proteins.
A: WB results of the Mos10-sfGFP tagging in the WT and Δvps68 background. B: WB results of n-terminal and
c-terminal tagged Did2 by sfGFP and GFP. C: WB results of the marker proteins Ilv2 (mitochondria), Alp1
(vacuole), Pep12 (late endosome), and Dpm1 (ER).
1 2 3 4 5 6 7 8 9 10 11 12 13 14 15 16 17 18
Mos10-sfGFP
Mos10-sfGFP ΔVps68
A
1 2 3 4 5 6 7 8 9 10 11 12 13 14 15 16 17 18BDid2-sfGFP
GFP-Did2
1 2 3 4 5 6 7 8 9 10 11 12 13 14 15 16 17 18CIlv2
Alp1
Pep12
Dpm1

187
Figure S 49: Evaluating Vps68 induced alterations in ER-PM tethering visualized by Ist2- & Tcb1-sfGFP.
The marker proteins Ist2 and Tcb1 are ER proteins involved in ER to PM tethering shown by the sfGFP tagged
variants of each protein in the WT strain RKY1558 and Δvps68 strain RKY3222 background.
Figure S 50: Alterations in Mos10-sfGFP distribution by Vps68 and Vps55 single and double deletions.
WT
Δvps68
WT
Δvps68
DAPI sfGFP Merge DIC
Ist2
Tcb1
Δvps68 +Mos10-sfGFP
Δvps68 +Δvps55 +
Mos10-sfGFP
DAPI sfGFP Merge DIC

188
SUMMARY The endosomal sorting complex required for transport (ESCRT) is a part of the heteromeric
complex machinery consisting of ESCRT-0, -I, -II, and -III ensuring functional protein traffic
of endocytic and biosynthetic cargo. Stepwise sorting of labeled cargo material inside the lumen
of the endosome by invagination and abscission of the endosomal membrane to form
intraluminal vesicles (ILV’s) is mediated by the ESCRT-III complex. The complex consists of
eight members of which Vps20, Snf7, Vps2, and Vps24 are considered ESCRT-III essential
subunits, and Chm7, Did2, Ist1, and Mos10/Vps60 are commonly labeled as complex
associated proteins. The correct interplay between the proteins ensures cargo sorting into the
MVB (multivesicular body) pathway and transport from the late endosome into the vacuolar
lumen for degradation. Besides the initial function of vacuolar protein sorting (vps), the
complex is involved in a multitude of cellular processes like cell abscission, virus budding,
autophagy, and remaining nuclear envelope integrity.
The step-wise assembly of the ESCRT-III complex is mediated after the cascade-like ESCRT-
0 to ESCRT-II complex formation at the membrane budding site, collecting cargo protein for
invagination into the endosomal lumen. ESCRT-III Vps20 is recruited to the membrane by the
ESCRT-II member Vps25, then nucleating Snf7 association and oligomerization. Additional
assembly of ESCRT-III members like Vps24 and Vps2 further drives membrane bending away
from the cytosol to the final abscission event, before being recycled back to cytosolic monomers
by Vps4. Although Mos10 has been implicated in the recycling step of the ESCRT-III units by
interacting with the Vps4/Vta1 complex, the protein’s function remains poorly characterized.
This thesis tried to find new insights in Mos10 functionality by finding yet uncharacterized
interacting partners, thus connecting the protein to new putative non-endosomal functions or
understanding its role in the established ESCRT-III complex. For this purpose, a series of
crosslinking experiments with tagged variants of Mos10 were performed. Purification was
achieved by IMAC (Immobilized Metal Ion Affinity Chromatography) after adding a poly-his
sequence to the protein and by immunoprecipitation of sfGFP tagged Mos10. Both methods
revealed a multitude of putative Mos10 interacting partners by MS analysis to be further
reduced by applying the SILAC (stable isotope labeling with amino acids in cell culture)
technique. After selecting possible Mos10 interacting partners, IP and Co-IP experiments of
tagged candidate variants were used to identify an interaction between the two proteins. An
interaction between Mos10-6His and Vps68-13myc besides native Mos10 and Vps68-fGFP
could be verified by purification of Vps68 and co-precipitating Mos10.

189
The influence of Vps68 on the assembly and composition of the ESCRT-III complex was
examined. After Vps68 depletion, an enrichment of the core subunits Snf7, Vps2, and Vps24
in the complex was detected with a reduced number of Did2, Ist1, and Mos10 molecules. Thus,
it appears that ESCRT-III disassembly is blocked in ∆vps68 mutant. The influence of VPS68
deletion on the intracellular localization of ESCRT-III proteins was examined by fluorescence
microscopy with sfGFP-tagged variants. While the localization of most ESCRT-III proteins
was not significantly altered, a marked relocalization was observed for Mos10. In wildtype,
Mos10-sfGFP was localized at the vacuolar membrane, while in ∆vps68 it was dispersed into
vesicular structures enriched at the cell cortex.
Further, the impact of VPS68 deletion on the sorting of the endocytic cargo protein Ste6 was
investigated. By cycloheximide chase experiments, it could be shown that Ste6 is strongly
stabilized in a ∆vps68 mutant. This indicates that the transport of the protein to the yeast vacuole
for degradation is blocked. The ∆vps68 block in endocytic trafficking was compared with other
mutants of the vps-pathway, whose site of action has been established. These experiments show
that the VPS68 deletion neither leads to a class D phenotype, as in ∆vps21, nor to a class E
phenotype, as in ∆snf7. The Ste6-GFP distribution in the ∆vps68 mutant rather resembles
wildtype with more pronounced accumulation of endosomal dots. The data taken together
suggest that Vps68 acts after the formation of the ESCRT-III complex and is required for cargo
delivery from the late endosome to the vacuolar lumen.

190
ZUSAMMENFASSUNG Der für den endosomalen Protein-Transport erforderliche ESCRT (endosomal sorting complex
required for transport)-III Komplex ist ein Teil der heteromeren Komplexmaschinerie, die aus
ESCRT-0, -I, -II und -III besteht und die Sortierung von endozytischem und biosynthetischem
Cargo in intraluminäre Vesikel (ILVs) bewerkstelligt. Der ESCRT-III Komplex besteht aus
acht Mitgliedern, von denen Vps20, Snf7, Vps2 und Vps24 als essentielle Untereinheiten des
ESCRT-III-Komplexes angesehen werden, während Chm7, Did2, Ist1 und Mos10/Vps60
gemeinhin als komplexassoziierte Proteine bezeichnet werden. Das korrekte Zusammenspiel
der Proteine gewährleistet die Sortierung des Cargos in den MVB (multivesicular body)-Weg
und den Transport aus dem späten Endosom in das vakuoläre Lumen zur Degradation. Neben
der ursprünglichen Funktion der vakuolären Proteinsortierung (vps) ist der Komplex an einer
Vielzahl von zellulären Prozessen wie Zellteilung, Virusknospung, Autophagozytose und
Aufrechterhaltung der Kernhüllenintegrität beteiligt.
Der schrittweise Aufbau des ESCRT-III-Komplexes erfolgt kaskadenartig beginnend mit
ESCRT-0- bis zu ESCRT-II an der Knospungsstelle der Membran und sammelt das Cargo-
Protein für die Einschleusung in das endosomale Lumen. Das ESCRT-III Protein Vps20 wird
durch die ESCRT-II-Untereinheit Vps25 an die Membran rekrutiert, wodurch die Assoziation
und Oligomerisierung von Snf7 ausgelöst wird. Weitere ESCRT-III-Mitglieder wie Vps24 und
Vps2 sorgen dafür, dass sich die Membran bis zur endgültigen Abtrennung der ILVs vom
Zytosol zum Lumen hin verbiegt. Sodann wird der Komplex durch Vps4 wieder aufgelöst.
Mos10 wird eine Funktion bei der Auflösung der ESCRT-III Komplexe über den Vps4/Vta1
Komplex zugesprochen, doch ist die Funktion des Proteins nach wie vor unzureichend geklärt.
In dieser Arbeit wurde durch Identifizierung bislang nicht charakterisierter Interaktionspartner
versucht, neue Einblicke in die Funktionalität von Mos10 zu gewinnen, um einerseits
Verbindungen zu neuen nicht-endosomalen Funktionen herzustellen oder auch, um andererseits
seine Rolle im etablierten ESCRT-III Komplex besser zu verstehen. Dazu wurden eine Reihe
von Quervernetzungsexperimenten mit markierten Varianten von Mos10 durchgeführt. Die
Reinigung erfolgte durch IMAC (Immobilisierte Metallionen-Affinitäts-Chromatographie)
nach Hinzufügen einer Poly-his-Sequenz zum Protein und durch Immunpräzipitation von
sfGFP-markiertem Mos10. Beide Methoden ergaben eine Vielzahl von möglichen
Interaktionspartnern von Mos10 durch MS-Analyse, die durch Anwendung der SILAC-
Technik (Stable Isotope Labeling with Amino Acids in Cell Culture) weiter reduziert werden
konnte. Nach der Auswahl möglicher Mos10-Interaktionspartner wurden IP- und Co-IP-
Experimente an markierten Kandidatenvarianten durchgeführt, um eine Interaktion zwischen

191
den beiden Proteinen zu identifizieren. Eine Interaktion zwischen Mos10-6His und Vps68-
13myc konnte neben nativem Mos10 und Vps68-fGFP durch Aufreinigung von Vps68 und Ko-
Präzipitation von Mos10 nachgewiesen werden.
Der Einfluss von Vps68 auf den Aufbau und die Zusammensetzung des ESCRT-III Komplexes
wurde untersucht. Es zeigte sich, dass in der VPS68 Deletionsmutante die Core-Untereinheiten
Snf7, Vps2 und Vps24 im Komplex angereichert waren, während die ESCRT-III assoziierten
Protein Did2, Ist1 und Mos10 abgereichert waren. Das deutet darauf hin, dass die Auflösung
des ESCRT-III Komplexes in der ∆vps68-Mutante blockiert ist. Der Einfluss der VPS68-
Deletion auf die intrazelluläre Lokalisierung der ESCRT-III-Proteine wurde durch
Fluoreszenzmikroskopie mit sfGFP-markierten Varianten untersucht. Während die
Lokalisation der meisten ESCRT-III-Proteine nicht signifikant verändert war, wurde für Mos10
eine deutliche Relokalisation beobachtet. Im Wildtyp war Mos10-sfGFP an der
Vakuolenmembran lokalisiert, während es in ∆vps68 in vesikulären Strukturen verteilt war, die
am Zellkortex angereichert waren.
Außerdem wurde untersucht, wie sich die Deletion von VPS68 auf die Sortierung des
endozytischen Cargo-Proteins Ste6 auswirkt. Durch Cycloheximid-Chase-Experimente konnte
gezeigt werden, dass Ste6 in einer ∆vps68-Mutante stark stabilisiert ist. Dies deutet darauf hin,
dass der Transport des Proteins in die Hefevakuole zum Abbau blockiert ist. Die ∆vps68-
Blockade des endozytischen Transports wurde mit anderen Mutanten des vps-Wegs verglichen,
deren Wirkort bereits bekannt ist. Diese Experimente zeigen, dass die Deletion von VPS68
weder zu einem Klasse-D-Phänotyp, wie bei ∆vps21, noch zu einem Klasse-E-Phänotyp, wie
bei ∆snf7, führt. Die Ste6-GFP-Verteilung in der ∆vps68-Mutante ähnelt eher dem Wildtyp mit
einer ausgeprägteren Akkumulation von endosomalen Punkten. Die Daten deuten darauf hin,
dass Vps68 nach der Bildung des ESCRT-III-Komplexes wirkt und dass es für den Transport
von Cargo-Proteinen aus dem späten Endosom in das Vakuolen-Lumen benötigt wird.

192
DANKSAGUNG
Zuallererst möchte ich Herrn Prof. Ralf Kölling danken, mir die Möglichkeit gegeben zu haben,
an seinem Lehrstuhl meine Doktorarbeit anfertigen zu können. Ralf, ich danke dir mich all die
Jahre mit meinen verrückten Ideen und Vorstellungen unterstützt zu haben. Du hattest stets ein
offenes Ohr für mich und ich konnte immer zu dir kommen.
Des Weiteren möchte ich Herrn Prof. Armin Huber danken für die Bereitschaft, die
Zweitprüfung meiner Arbeit zu übernehmen. Ich hoffe, die zahlreichen Proteinabkürzungen
waren nicht zu sehr verwirrend.
Ein spezieller Dank geht an Herrn Dr. Jens Pfannstiel und Frau Berit Würtz für die Messung
meiner Proben am Massenspektrometer und anschließenden Auswertung.
Bedanken möchte ich mich auch beim gesamten Lehrstuhl für Hefegenetik und
Gärungstechnologie: bei Oli, Thomas, Nam, Lara, Christian, Dani, Daniel, Luis, Herr Körner
und Frau Bühler; für die schöne Zeit im Labor und angenehme Arbeitsatmosphäre. Ein
besonderer Dank gilt meinen ehemaligen Mitstreitern Sven und Luana. Mit euch hatte ich eine
wundervolle Zeit im Labor, in Hohenheim, in Stuttgart, in Heidelberg und in Bologna. Mit euch
war es überall schön und die Jahre mit euch schätze ich sehr.
Ein weiter besonderer Dank gilt Julia. Auch wenn die Pandemie am Anfang 2020 die Welt und
auch die Uni Hohenheim ziemlich im Griff hatte, haben wir uns unsere kleine Insel an der Uni
geschaffen. Unsere zahlreichen Kochsessions mit guten Gesprächen und guter Laune haben
einen immer motiviert weiter zu machen und dafür danke ich dir sehr.
Ich möchte mich auch bei Micha und Sarah bedanken, die sich die Mühe gemacht haben meine
Arbeit zu lesen und korrigieren zu wollen. Ich weiß, es war nicht einfach aber vielen Dank für
die konstruktive Kritik und Verbesserungen.
An dieser Stelle möchte ich meiner Familie und Freunden danken, die mich während der
gesamten Zeit der Arbeit unterstütz und das ein oder andere Mal mitgelitten haben.

193
APPENDIX
Eidesstattliche Versicherung gemäß §7 Absatz 7 der Promotionsordnung der
Universität Hohenheim zum Dr. rer. nat.
Bei der eingereichten Dissertation zum Thema „Influence of the newly identified Mos10
interaction partner Vps68 on ESCRT-III function“ handelt es sich um meine eigenständig
erbrachte Leistung. Ich habe nur die angegebenen Quellen und Hilfsmittel benutzt und mich
keiner unzulässigen Hilfe Dritter bedient. Insbesondere habe ich wörtlich oder sinngemäß aus
anderen Werken übernommene Inhalte als solche kenntlich gemacht. Ich habe nicht die Hilfe
einer kommerziellen Promotionsvermittlung oder -beratung in Anspruch genommen. Die
Bedeutung der eidesstattlichen Versicherung und der strafrechtlichen Folgen einer unrichtigen
oder unvollständigen eidesstattlichen Versicherung sind mir bekannt.
Die Richtigkeit der vorstehenden Erklärung bestätige ich: Ich versichere an Eides Statt, dass ich
nach bestem Wissen die reine Wahrheit erklärt und nichts verschwiegen habe.
Ort und Datum Unterschrift

194
CURRICULUM VITAE
Personal Data: Name Sören Alsleben
Date of Birth 27.03.1988
Place of Birth Mülheim an der Ruhr
Citizenship German
Education/Experience:
01/2017-
11/2021
University of Hohenheim in Stuttgart
• PhD Student
10/2015-
12/2016
Leibniz Institute for Natural Product Research and Infection Biology
– Hans Knöll Institute in Jena
• Research Associate
10/2011-
09/2015
Technical University of Dortmund
• Master in Chemical Biology
• Master Thesis at the chair of bio- and chemical engineering
04/2013-
10/2013
Harvard Medical School in Boston, MA, USA
• Research Associate
• DAAD scholar holder
04/2012-
09/2012
Max-Planck-Institute of molecular physiology in Dortmund
• Research Assistant
10/2008-
09/2011
Technical University of Dortmund
• Bachelor in Chemical Biology
• Bachelor Thesis at the MPI in Dortmund
1998-
2007
Karl-Ziegler-Gymnasium in Mülheim an der Ruhr
• General Qualification for university entrance (Abitur)
Personal: Languages German (native), English (excellent)
Hobbies Logic puzzle, fitness, games