Effects of the baroclinic adjustment on the tropopause in the NCEP NCAR reanalysis
JOURNAL OF GEOPHYSICAL RESEARCH, VOL. 105, NO. Dll, PAGES 14,873-14,890, JUNE 16, 2000
Impact of an improved longwave radiation model, RRTM, on the energy budget and thermodynamic properties of the NCAR community climate model, CCM3
Michael J. Iacono, Eli J. Mlawer, and Shepard A. Clough Atmospheric and Environmental Research, Inc., Cambridge, Massachusetts
Jean-Jacques Morcrette European Center for Medium Range Weather Forecasts, Reading, England
Abstract. The effect of introducing a new longwave radiation parameterization, RRTM, on the energy budget and thermodynamic properties of the National Center for Atmospheric Research (NCAR) community climate model (CCM3) is described. RRTM is a rapid and accurate, correlated k, radiative transfer model that has been developed for the Atmospheric Radiation Measurement (ARM) program to address the ARM objective of improving radiation models in GCMs. Among the important features of RRTM are its connection to radiation measurements through comparison to the extensively validated line-by-line radiative transfer model (LBLRTM) and its use of an improved and validated water vapor continuum model. Comparisons between RRTM and the CCM3 longwave (LW) parameterization have been performed for single atmospheric profiles using the CCM3 column radiation model and for two 5-year simulations using the full CCM3 climate model. RRTM produces a significant enhancement of LW absorption largely due to its more physical and spectrally extensive water vapor continuum model relative to the current CCM3 water continuum treatment. This reduces the clear sky, outgoing longwave radiation over the tropics by 6-9 W m -2. Downward LW surface fluxes are increased by 8-15 W m -2 at high latitudes and other dry regions. These changes considerably improve known flux biases in CCM3 and other GCMs. At low and midlatitudes, RRTM enhances LW radiative cooling in the upper troposphere by 0.2-0.4 K d-• and reduces cooling in the • lower troposphere by 0.2-0.5 K d- . The enhancement of downward surface flux contributes to increasing lower tropospheric and surface temperatures by 1-4 K, especially at high latitudes, which partly compensates documented, CCM3 cold temperature biases in these regions. Experiments were performed with the weather prediction model of the European Center for Medium Range Weather Forecasts (ECMWF), which show that RRTM also impacts temperature on timescales relevant to forecasting applications. RRTM is competitive with the CCM3 LW model in computational expense at 30 layers and with the ECMWF LW model at 60 layers, and it would be relatively faster at higher vertical resolution.
1. Introduction
A primary objective of the Atmospheric Radiation Measure- ment (ARM) program is to develop and test improved radia- tion codes for general circulation models (GCMs) used for climate research and prediction. A recent product of this effort is the radiative transfer model RRTM [Mlawer et al., 1997]. Developed for both the longwave and the shortwave, RRTM utilizes the correlated-k method for radiative transfer [e.g., Goody et al., 1989; Lacis and Oinas, 1991]. This approach provides a significant reduction in computational expense over the highly accurate line-by-line radiative transfer model (LBL- RTM) [Clough et al., 1992 (hereinafter referred to as CIM); Clough and Iacono, 1995] on which RRTM is based. By ob- taining the absorption coefficients required for RRTM from the data-validated LBLRTM, a direct link is established be-
Copyright 2000 by the American Geophysical Union.
Paper number 2000JD900091. 0148-0227/00/2000JD900091509.00
tween ARM radiation measurements and a radiation model
that is sufficiently fast to operate within a GCM. This study incorporates the longwave version of RRTM into the NCAR CCM3 climate model to establish the feasibility of its use within a GCM and to determine its impact on the simulated climate system. Additional experiments have been performed in collaboration with the European Center for Medium-Range Weather Forecasts (ECMWF) in which the impact of RRTM on short-term weather forecasts is examined [Morcrette et al., 1998].
Several recent programs have compared GCM longwave (LW) radiation models and have shown them to produce sub- stantial disagreement. The Intercomparison of Radiation Codes in Climate Models (ICRCCM) examined over 30 radi- ation models for a variety of atmospheric profiles and discov- ered a significant range of 30-70 W m -2 among the models in clear and cloudy sky LW fluxes [Ellingson et al., 1991]. Over 30 GCMs contributed to phase 1 of the Atmospheric Model In- tercomparison Project (AMIP) in which 10-year simulations
14,873
14,874 IACONO ET AL.: VALIDATED LONGWAVE RADIATION GCM IMPACTS
were performed using prescribed, monthly varying, sea surface temperatures [Gates, 1992]. Ten models from this group have been shown to produce clear-sky outgoing longwave fluxes that vary by 15 W m -2 over a wide range of ocean temperatures [Duvel et al., 1997]. An analysis of LW and shortwave cloud radiative forcing from these simulations shows intermodel vari- ations of 20-60 W m -2 [Cess et al., 1997]. For comparison, more accurate line-by-line models agree to within 1 W m -2 and thus provide an effective foundation on which to build the next generation of GCM longwave models. This is the moti- vation for the development of RRTM and its application to GCM simulations.
Observational programs are continually improving our abil- ity to diagnose some of the GCM longwave model deficiencies. Satellite measurements from the Earth Radiation Budget Ex- periment (ERBE) [Barkstrom et al., 1989] are widely used for comparison to top of the atmosphere (TOA) fluxes from GCMs. For example, the AMIP model comparisons of Duvel et al. [1997] showed that many of the LW models tested overes- timate the clear-sky outgoing LW radiation (OLR) by as much as 10 W m -2 relative to ERBE. A recent comparison between CCM3 and ERBE showed this GCM to overestimate OLR by as much as 5-10 W m -2 in some tropical regions [Kiehl et al., 1998b]. However, while the spectrally averaged ERBE data provide valuable observations of the global TOA energy bal- ance, they do not provide important information on the parti- tioning of the outgoing energy across the LW spectrum caused by the various atmospheric physical processes. Thus they can- not be used to evaluate fully a LW model's ability to correctly represent these processes. Future satellite-based instruments (e.g., AIRS, IASI) will provide this capability with spectral radiation measurements from space. This information is cur- rently available for selected infrared and microwave channels from the High Resolution Infrared Radiation Sounder (HIRS) and Microwave Sounding Unit (MSU) measurements. New studies are using these data to validate GCM LW radiation models as part of the second phase of AMIP (G. Stephens and J. Bates, personal communication, 1999).
Spectral radiance measurements at the surface such as those from the ARM cloud and radiation test bed (CART) sites [Stokes and Schwartz, 1994] or the Surface Heat Budget of the Arctic Ocean (SHEBA) Ice Station [Moritz and Perovich, 1996] are playing an important role in highlighting current radiation model deficiencies. In particular, LBLRTM radiances have been extensively validated against observations from the ARM CART sites and from Antarctica [Walden et al., 1998]. In ad- dition, SHEBA data have made key contributions to the on- going validation of the water vapor continuum model of Clough et al. [1989 (hereinafter referred to as CKD)] for low water atmospheres [Tobin et al., 1999]. Additional measure- ments of downward longwave radiation at the surface, espe- cially over polar areas, have shown that many GCM radiation models greatly underestimate this quantity [Garratt et al., 1998; Pinto et al., 1997].
One of the most important remaining differences among line-by-line models and the broadband LW radiation models used in GCMs is the treatment of the water vapor continuum absorption. A number of GCM radiation codes still use the continuum formulation of Roberts et al. [1976 (hereinafter re- ferred to as RSB)]. This model only includes the effect of the self-broadened water continuum (due to collisions between water molecules) in the 800-1200 cm -• window region where its radiative impact is largest. Integrated over this window
region, the self-continuum treatment in CKD produces a sim- ilar result to RSB, though there are important spectral differ- ences. CIM demonstrated the importance of the foreign- broadened water continuum absorption (due to water-N2 and water-O2 collisions) in the 200-600 cm -• spectral region (which is absent from RSB), especially in the upper tropo- sphere. The validity of the CKD foreign continuum has also been established in the 1600 cm -• spectral region [Tobin et al., 1996]. The CKD continuum model is an integral component of both LBLRTM and RRTM and continues to be validated
against surface spectral radiance measurements. The impor- tant differences between the CKD and the RSB water vapor continuua, which significantly contribute to the LW model differences presented in this study, are discussed in more detail in CIM. In addition to the present work, other studies have demonstrated the importance of including the CKD water continuum absorption in climate models [e.g., Schwarzkopfand Ramaswamy, 1999].
In section 2, RRTM and the CCM3 longwave model are described in greater detail, and the modifications made to RRTM to prepare it for implementation into the GCM are discussed. Single-column comparisons of the radiation models are presented in section 3 for two clear-sky profiles and several cloudy-sky cases. The 5-year CCM3 climate simulations using both LW models are described in section 4. Both the initial
radiative forcing effect of introducing RRTM into CCM3 and its impact on the energy budget and thermodynamic properties of the climate model are presented. Section 5 contains a sum- mary of the application of RRTM into the ECMWF weather prediction model to demonstrate the use and effect of RRTM on short-term GCM simulations. The paper concludes with a discussion of the work presented.
2. Model Descriptions 2.1. RRTM
Since line-by-line radiative transfer models are inappropri- ate for use in GCMs due to their lengthy execution time, a radiation code that effectively reproduces the fluxes and cool- ing rates of a line-by-line model, RRTM [Mlawer et al., 1997], has been developed for the ARM program. Although RRTM uses the correlated-k method for radiative transfer, the line-
by-line approach played a significant role in its development through the utilization of the comprehensive LBLRTM model [CIM; Clough and Iacono, 1995]. LBLRTM is used both to compute the absorption coefficients used to generate the k distributions needed by RRTM and to evaluate the RRTM calculations of fluxes and cooling rates. It is of critical impor- tance in this context that LBLRTM continues to be extensively validated against high-resolution, spectral measurements from aircraft and the surface (CIM). Its overall accuracy is within 2 W m -2 of observations, which also reflects current limitations in the accurate specification of atmospheric state (S. A. Clough et al., manuscript in preparation, 2000). This provides an eval- uation of the rapid model that is traceable through the compar- ison of LBLRTM with observation.
The standard version of RRTM was created as a stand-alone
LW radiation model and uses 16 spectral bands that were carefully selected to highlight important molecular absorption features. The essence of the k-distribution technique involves reordering the LBLRTM-generated absorption coefficients as a function of wavenumber, k(v), into ascending order for each spectral band. From this a smoothly increasing representation
IACONO ET AL.: VALIDATED LONGWAVE RADIATION GCM IMPACTS 14,875
of absorption coefficient is produced as a function of cumula- tive probability, k(#), for each layer, which can be integrated with a relatively small set of points. RRTM uses 16 subinter- vals, or # points, in each spectral band to calculate radiance from the k (9) functions. This produces a total of 256 radiative transfer operations across the LW spectral region (0-3000 cm-•). Gaseous absorption is included for H20 , CO2, 03, CH4, N20, 02, N2, CFC-11, CFC-12, CFC-22, and CCL 4. In addition, the water vapor continuum is treated following the approach of Clough et al. [1989] which incorporates both self- broadening (collisions between water molecules) and foreign broadening (collisions of water with N 2 and 02 molecules) across the full LW spectrum. Surface-based spectral radiance observations are regularly used to validate and to update this water vapor continuum [e.g., Tobin et al., 1999]. Of critical importance is the proper partitioning of the local line contri- bution and the continuum contribution to the k distributions
such that their combination provides the correct result. RRTM also has the capability of including spectral surface emissivity and reflectance in each band. Finally, several options are avail- able for LW cloud liquid water and ice absorption in RRTM [Mlawer and Clough, 1997], including the broadband effective emissivity method used in the NCAR CCM (see section 2.2) and multispectral approaches following the work of Ebert and Curry [1992] and Hu and Stamnes [1993].
The k-distribution technique, the consequent errors intro- duced by this approximate treatment of radiative transfer, and comparisons between RRTM and LBLRTM calculations are all discussed in greater detail by Mlawer et al. [1997]. RRTM is able to reproduce, for a wide range of atmospheric conditions, LBLRTM net flux within 1 W m 2 at any altitude, cooling rate in the troposphere and lower stratosphere within 0.07 K d • and upper stratosphcric cooling rate within 0.75 K d-•. RRT• provides a substantial reduction in computational expense rel- ative to LBLRTM that results from reducing the radiative transfer operations from f-10 •' to 256, since the detailed spec- tral information is not required. A benefit of the k-distribution technique over many GCM LW radiation models is its near linear scaling of computational expense with the number of model layers. Some LW models, such as that in CCM3, scale as the square of the number of layers and would prove prohibi- tively expensive at high vertical resolution. Finally, a shortwave version of RRTM has also been developed, though it has not been incorporated into this study. The longwave, stand-alone version of RRTM is available from the AER Web site at
www.aer.com.
2.2. NCAR Community Climate Model
For our analyses we used the NCAR CCM3 general circu- lation model version CCM3.6.6 [Kiehl et al., 1996, 1998]. This model was selected because it is in wide use by the community, has successfully simulated climate parameters, has a modular format that facilitates modification, and is adaptable to several computer platforms. The standard CCM3 format includes 18 vertical layers and a T42 horizontal resolution (-2.8 x 2.8ø), which has not been changed for this study. The CCM3 long- wave parameterization (hereinafter CCM3_LW) utilizes a broadband, nonisothermal absorptivity formulation with six overlapping spectral intervals for H20, CO2, and 03. Also included are the effects of the H20 continuum of Roberts et al. [1976], absorption from the trace gases CH4, N20 , CFC-11, and CFC-12, and the radiative properties of the two minor CO2 bands at 9.4 and 10.4/•m. The original RSB water vapor
continuum includes only the self-continuum absorption and is limited to the 8-12/•m window region. CCM3_LW uses the RSB self-continuum and scales the resulting absorption coef- ficients to represent the foreign continuum in this spectral region. Nevertheless, an important remaining difference be- tween the CKD and the RSB water vapor continuua is the effect of foreign broadening absorption in the energetically important 200-600 cm -• spectral region, which significantly contributes to the results of this study. CCM3_LW includes a broadband emissivity formulation for absorption by liquid and ice clouds. The shortwave radiation model in CCM3, which parameterizes absorption and scattering with a •5-Eddington scheme, has been used without modification. In CCM3 the standard interval at which the longwave absorptivities and emissivities are computed from the current atmospheric state is 12 hours. They are reused every model hour to calculate longwave fluxes and cooling rates from updated temperatures and cloud amounts. For the present analysis the absorptivities and emissivities are updated every three hours to more com- pletely represent the diurnal cycle.
2.3. RRTM CCM3 Implementation
A number of modifications have been made to RRTM to
enhance its computational efficiency for its application to gen- eral circulation models. Since many of the spectral bands con- tain minimal absorption or very little energy, fewer than 16 9 points can be used to determine the flux adequately in these bands. A significant decrease in computational expense has been attained by reducing the number of 9 points to 140 from the standard RRTM total of 256. Each band was treated indi-
vidually to determine the minimum number of 9 points needed to retain the desired level of accuracy. The revised number of subintervals varies from 14 or 16 •7 points in the four important water vapor and carbon dioxide bands from 250 to 820 cm • to as few as 2 9 points in the three high wavenumber bands from 2250 to 3000 cm-•. The effect on overall accuracy is less than 0.5 W m-: for net flux and 0.1 K d-• for cooling rate, while the computational expense is reduced by about 40%. Further ef- ficiency improvements were achieved by simplifying specific elements of the RRTM algorithm. For example, an exponen- tial is required to compute transmittance from optical depth in the standard RRTM. For the GCM version of RRTM (here- inafter referred to as RRTMG) this expense has been trans- ferred from the radiative transfer section of the model to an
initialization routine where a 5000-point transmittance look-up table is computed. This provided an additional 10% reduction in cost with negligible effect on accuracy. The flux integration in RRTMG is accomplished with a diffusivity angle for consis- tency with CCM3_LW. While faster than the more precise three-angle integration in the standard RRTM, this single- angle approach introduces an error of the order of 1 W m-: in clouds. To provide further timing reduction on vectorizing computers, RRTMG has been receded to enhance its vector- izability. Finally, the standard RRTM uses a Pade approxima- tion to represent the Planck function variation with optical depth in a layer similar to the method of CIM. RRTMG incorporates an accuracy improvement by applying a look-up table for this Planck function transition that is based on the
"linear in r" approximation (CIM). Additional modifications provide enhancements relative to
CCM3 LW. First, RRTMG functions over a full additional layer relative to the CCM layering. This layer extends from the CCM model top pressure at 2.9 mbar to the top of the atmo-
14,876 IACONO ET AL.' VALIDATED LONGWAVE RADIATION GCM IMPACTS
Fin 8.) BNDin
Agas
Fout Anld ,. BNDout
Fin b) , , BNDin ,
cid
BNDout
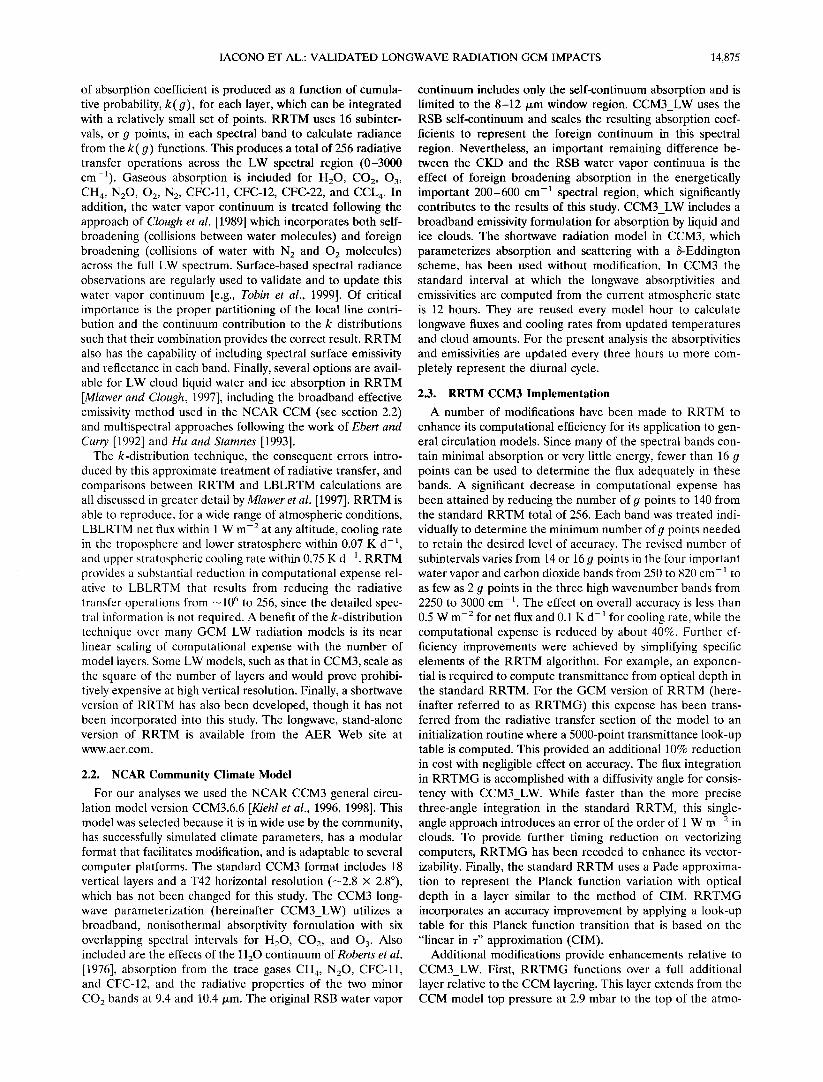
Fout Figure 1. Diagram of the cloud and gaseous overlap absorp- tion within a layer as formulated in the (a) CCM3 longwave radiation model and (b) RRTMG longwave model.
sphere to provide values for both the downward flux at 2.9 mbar and the outgoing longwave radiation. Mixing ratios in this extra layer are identical to those in the CCM top layer except the ozone mixing ratio, which is reduced by a factor of 0.6. The temperature of the extra layer is fixed to be 18 K higher than the CCM top model layer. Both changes are based on the U.S. standard atmosphere at this level. For consistency with CCM3_LW, surface emissivity is handled identically to its application in the CCM3 land surface model (i.e., it is generally one with a few non-one values in specific areas). Aerosol ab- sorption effects in the longwave have not been included.
Cloud radiative effects are modeled within RRTM to repro- duce their contribution to the cooling rate profiles as closely as possible to their effects in CCM3_LW. Our rationale is to examine the feedback effects due to the more accurate clear-
sky radiative transfer without significant changes in the cloud treatment. However, the treatment of longwave cloud absorp- tion has been revised to provide a more physically appropriate solution than that used in CCM3_LW. This improvement uti- lizes the ability of the RRTM k-distribution approach to treat uniformly the combined gaseous and cloud absorption within a layer. At present, CCM3_LW uses the "effective emissivity" method for cloud absorption [Kiehl et al., 1996] in which an effective cloud fraction is defined as the product of the cloud emissivity and the computed cloud fraction Ac,
A; = ec•0A•. (1)
The cloud emissivity is given as
/3cld 1 e-D•<absCWP = - , (2)
where D is the constant diffusivity factor of 1.66, <abs is the combined liquid and ice phase LW cloud absorption coeffi- cient, and CWP is the cloud water path.
A consequence of the CCM3_LW formulation for upward and downward flux within a cloudy layer given by Kiehl et al. [1996] is that the gaseous and cloud absorption in a layer are treated sequentially. That is, the absorption and emission by gas within a cloud are treated as occurring prior to absorption
and emission by the cloud itself. In effect, the cloud is present only as a thin band at the outgoing boundary of the layer and the radiance emitted by the cloud is not attenuated by the gas in that layer. For a contiguous group of multilayer clouds the source radiance due to a cloud in a layer is not attenuated by gas absorption in any layer within this group of clouds. This radiance is, however, attenuated by cloud absorption in these layers. Also, because the cloud is treated as a thin band along the outgoing layer boundary its emitrance is derived from the Planck function at the layer boundary. For a cloud that is assumed to fill a layer, a more physically appropriate choice for calculating the cloud emitrance is to use a Planck function, Bgas+cld, with an effective radiative temperature dependent on the combined gas and cloud optical depth. Figure 1 illustrates these issues for downwelling flux through a layer with a cloud fraction of 1. In Figure l a the flux exiting the bottom of the layer as computed in CCM3_LW can be expressed as
Fout = F•nTgasTcl d 4- BgasAgasTcld 4- BcldAcl d (3)
where the first right-hand term is the flux entering the top of the layer, Fin, attenuated by the gaseous transmittance Tgas and the cloud transmittance rcl d. The second term represents the cloud attenuation of the radiation emitted by gas in the layer, where Bgas is the effective Planck function for the emit- ting gas and A gas ( = i -- Tgas ) is the gaseous absorptivity. Note that in the third term, the cloud emission in the layer, which is the product of the effective Planck function for the cloud, B and cloud absorptivity, Acta (=%•a = 1 - Toga) is not attenu- ated by gas in the layer. Also, note that B c•a is computed at the lower boundary temperature.
The LW cloud absorption in RRTM provides a more phys- ical solution by making use of the k-distribution capability of effectively combining gaseous and cloud absorption within a layer. As in CCM3_LW, cloud emissivity is assumed to be completely gray, following (2). For the example described above, the comparable expression for downward flux exiting a cloudy layer as calculated by RRTM is illustrated in Figure lb and is given by
Four-- FinTgasTcld 4- Bgas+cldAgas+cld. (4)
The attenuation of the flux entering the top of the layer is treated identically as in (3). However, in this formulation the combined gas and cloud radiation from the layer, B gas+dO, is attenuated in the layer by both gas and cloud, where A gas+c•d = i -- TgasTc• d. The impact of this change is most pronounced for clouds that extend continuously through many layers and has a magnitude of as much as several W m -2. This is illustrated for a few single-column, cloudy-sky cases in section 3.
An important consideration in the calculation of LW radia- tion through multiple cloudy layers is the vertical relationship, or cloud overlap, among the cloud fractions in each layer. Many GCMs apply random cloud overlap in which clouds in adjacent layers are assumed to be unrelated. The CCM3_LW model and RRTMG were developed using a random cloud overlap assumption, and this is used in the CCM and ECMWF simulations described in sections 4 and 5. However, several recent studies [Jakob and Klein, 1999; Liang and Wang, 1997] have demonstrated the importance of the cloud overlap treat- ment to GCM simulations. Also, many of the GCMs contrib- uting to AMIP use a mixed cloud overlap method in place of the simpler random method [Phillips, 1994]. For this reason a maximum/random cloud overlap approach has been developed for RRTMG to more realistically represent the vertical rela-
IACONO ET AL.' VALIDATED LONGWAVE RADIATION GCM IMPACTS 14,877
tionship of multilevel clouds for situations in which they over- lap uniformly (e.g., deep convection), while maintaining a ran- dom overlap computation for nonadjacent cloud layers. The effect of this improved cloud overlap approach on the appli- cation of RRTMG to GCMs is currently being examined.
In terms of computational expense, RRTMG is competitive with the CCM3 LW model on vectorizing computers and is substantially faster on scalar machines. On a vectorizing plat- form, RRTMG is approximately 4 times faster than CCM3_LW for a costly full radiation time step (done every 12 model hours) for 30 layers and is 5 times slower for a less costly radiative transfer time step (done every intervening model hour). For a full model day, RRTMG runs about 7-8% slower than CCM3_LW on a vectorizing system (such as CRAY) and about 40-50% faster on a scalar system (such as SGI) at 30 layers. At higher vertical resolution, RRTMG would gain sig- nificant advantage over CCM3_LW due to the linear relation between expense and the number of layers produced by the k-distribution technique. For GCMs that complete a full radi- ation calculation more than twice per day and have a similar expense to CCM3_LW, RRTMG would be even more com- petitive. Although it would be possible to improve the compu- tational time by decreasing the number of g points further, the resulting loss in accuracy would not be acceptable from our perspective.
2.4. RRTM ECMWF Implementation
A version of RRTMG has also been prepared for use in the ECMWF weather forecast model that is substantially similar to the version tested in the NCAR climate model. Additional
modifications for ECMWF include implementing the capabil- ity for spectral surface emissivity and reflectance and spectral cloud absorption properties [Moreterre et al., 1998]. The surface emissivity has been implemented using a window (8-12 /•m) and a nonwindow value, though the capability exists in RRTM to use a separate emissivity in each of the 16 spectral bands. Also for each spectral interval, ice cloud optical properties are based on Ebert and Curry [1992] and water cloud optical prop- erties are derived from Fouquart [1987]. Finally, this version of RRTM incorporates aerosol absorption by specifying appro- priate radiative characteristics for four different aerosol types for each spectral band. Results from this model are shown in section 5.
3. Column Radiation Model Comparisons Single-column comparisons between RRTMG and
CCM3_LW were accomplished with the NCAR Column Ra- diation Model (CRM). This provides a straightforward context in which to establish the flux and cooling rate differences between the two radiation models. The CRM is a stand-alone
LW and SW radiation package that is identical to the radiation models used in CCM3. It has been modified to run with either
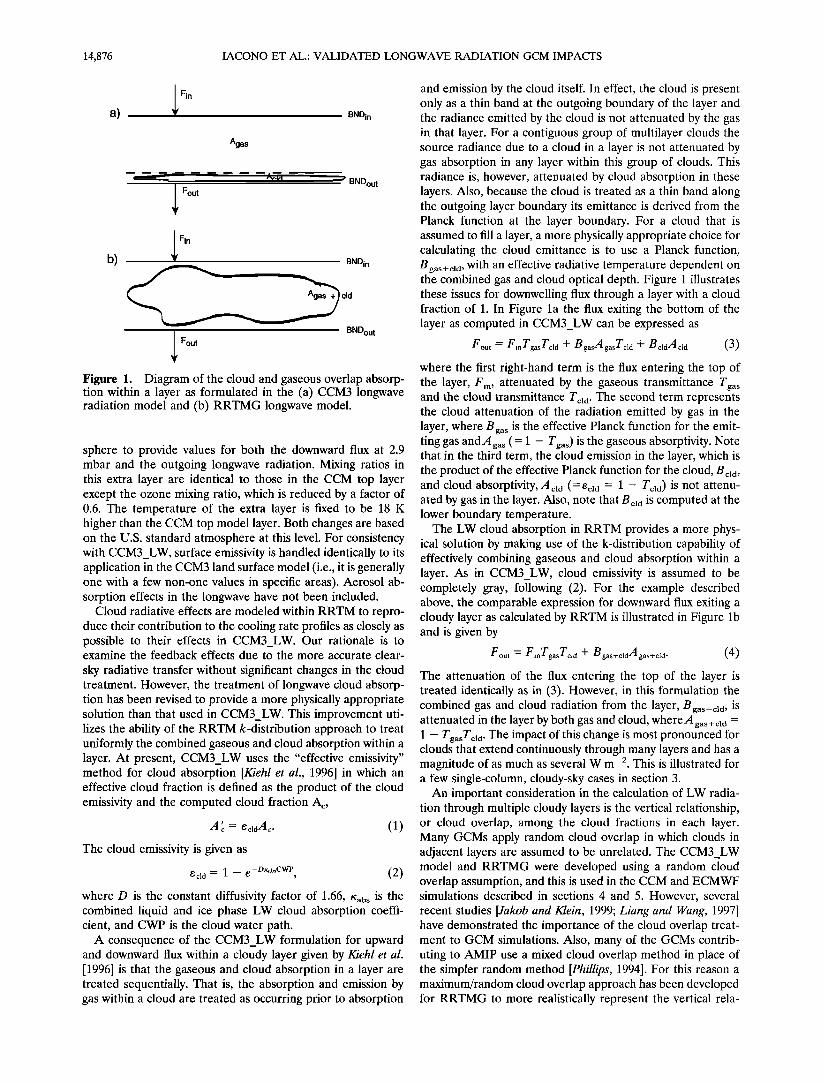
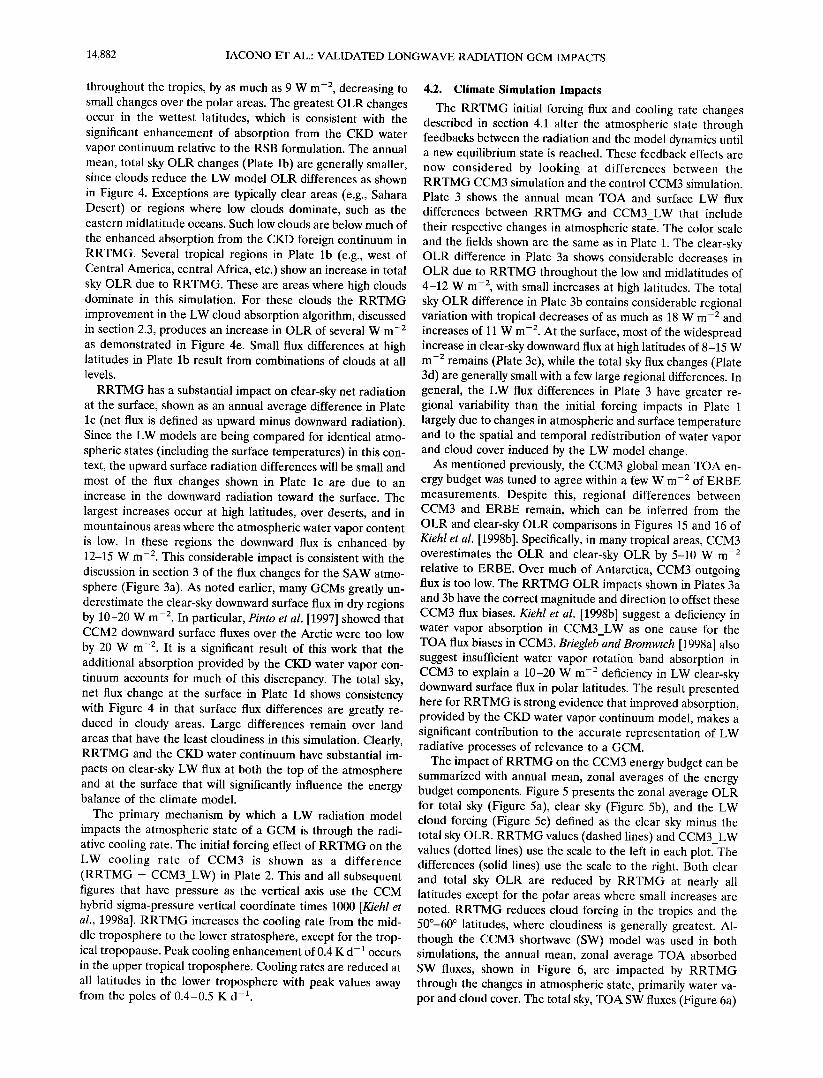
CCM3_LW or RRTMG. For these comparisons, standard midlatitude summer (MLS) and subarctic winter (SAW) atmo- spheric profiles were prepared for the same 18 layers used in CCM3. Figure 2a shows the upward, downward, and net fluxes for the clear-sky MLS atmosphere as computed by the CCM3 LW model on the left. The flux differences between
RRTMG and CCM3_LW are shown to the right. For this atmosphere the upward LW flux is reduced by as much as 9 W m -2 from the middle troposphere to the top of the atmo- sphere. The downward flux is increased throughout the tropo-
a 0
200
'• 400
tu 600
800
1000
0
CCM3 Mid-latitude Summer Longwave Fluxes
" ......... ' ' ' ' i .... 'u• ' ' ' DOWN
\ \ \ \ ';'t NET \\
\\\\ '!,. .... ? ........... ,',
100 200 300 400
FLUX (W m '2)
RRTMG-CCM3 .... i .... I ....... i .... i ....
500 -30-20-10 0 10 20 30
FLUX DIFF. (W m '2)
CCM3 Mid-latitude Summer Longwave Cooling Rate b o
2OO ß
400
6øø f
800 f 10001 ....
0 1 2 3 4
COOLING RATE (K d '•)
RRTMG-CCM3 o
2oo
5 -1.0-0.5 0.0 0.5 1.0
CR DIFF. (K d '1)
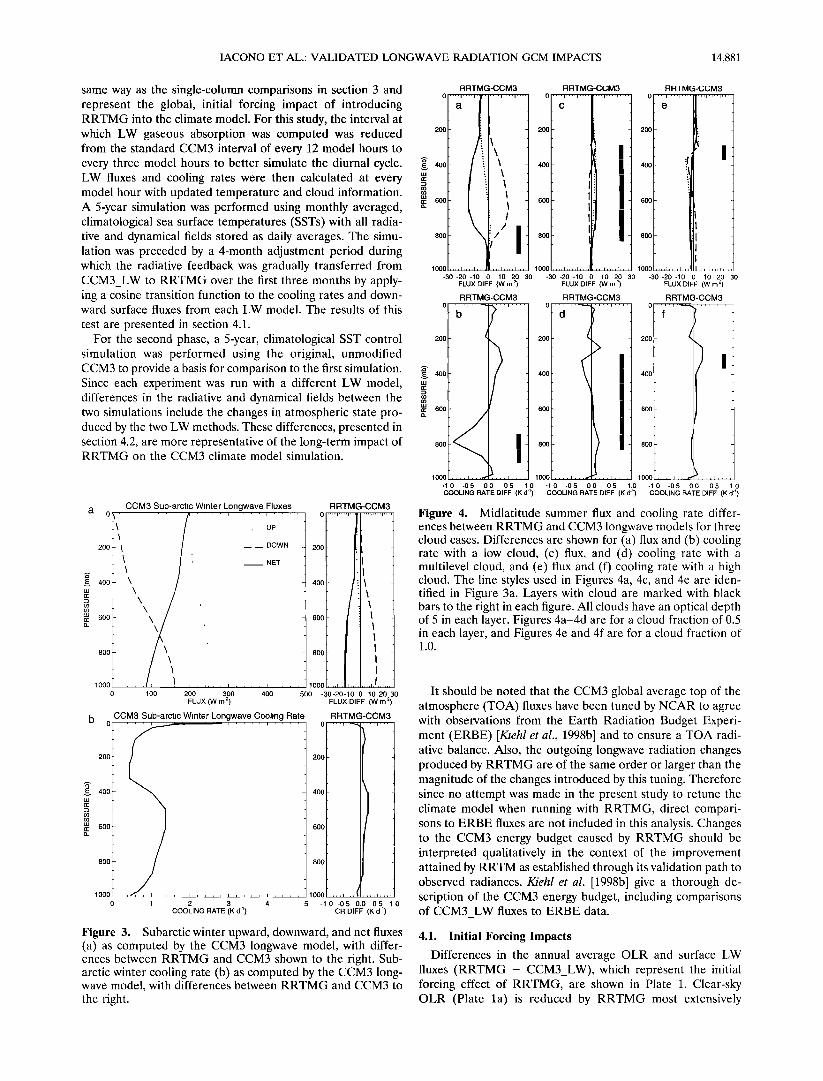
Figure 2. Midlatitude summer upward, downward, and net fluxes (a) as computed by the CCM3 longwave model, with differences between RRTMG and CCM3 shown to the right. Midlatitude summer cooling rate (b) as computed by the CCM3 longwave model, with differences between RRTMG and CCM3 to the right.
sphere by as much as 16 W m -2 at 650 mbar and by a more modest 4 W m -2 at the surface.
Although the change in the LW algorithm causes some of this difference, most of this dramatic alteration in LW flux is due to the enhanced absorption of the CKD water vapor con- tinuum model in RRTMG relative to the RSB continuum in
CCM3_LW. The principal role of the foreign continuum in this context is to increase absorption between the molecular lines, to decrease the pressure regime over which the transition from atmospheric opacity to transparency occurs, and thus to in- crease the flux divergence and cooling rate. Closer to the surface the greater atmospheric opacity in the spectral region in which foreign broadening is significant, diminishes the im- pact of the continuum differences between CKD and RSB, and the flux divergence is reduced. Since cooling rate (Figure 2b) is determined from the divergence of the net flux across a layer, the net flux changes produced by RRTMG significantly modify the MLS clear-sky LW cooling rate as seen to the right in Figure 2b. Cooling rate is enhanced in the upper troposphere by as much as 0.4 K d-• and is also slightly enhanced in the lower stratosphere. Because of the decrease in flux divergence in the lower atmosphere, the cooling rate is reduced here by as much as 0.5 K d-•. Evidence for the role of the water contin-
uum in these cooling rate changes can be seen in Figure 19 of CIM. This plot presented cooling rates for the MLS atmo- sphere for two line-by-line calculations that used the CKD and
14,878 IACONO ET AL.: VALIDATED LONGWAVE RADIATION GCM IMPACTS
Z Z o 03 03 03 co 0 0 0 0 0 0 0 0 •-
IACONO ET AL.: VALIDATED LONGWAVE RADIATION GCM IMPACTS 14,879
ILl
ILl
2OO
4OO
RRTMG - CCM3 LW Cooling Rate Difference (Initial Forcing) .
1000 •.• •-,, •'-• ', •. • ' , •-••, • ,•, • ,---0
80N 60N 40N 20N 0 20S 40S 60S 80S MIN:-2.44 MAX: 0.40
-0.8 -0.6 ø0.4 -0.2 0 0.2 0.4 0.6 0.8
K d '•
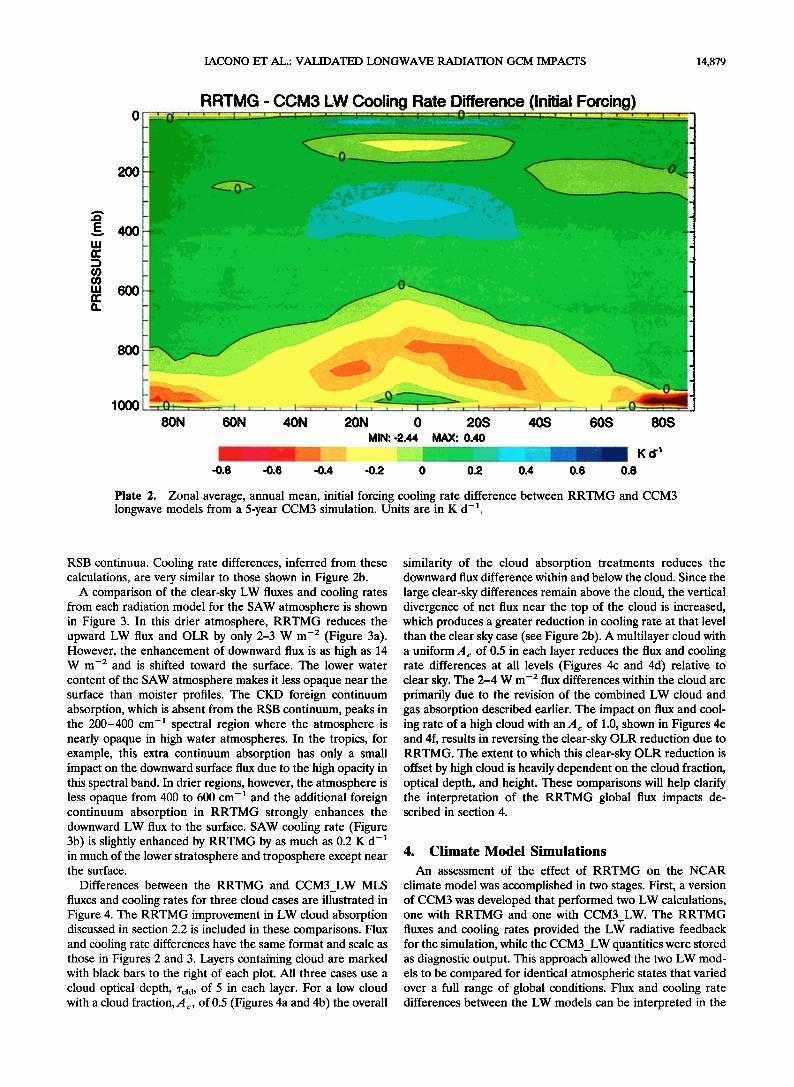
Plate 2. Zonal average, annual mean, initial forcing cooling rate difference between RRTMG and CCM3 longwave models from a 5-year CCM3 simulation. Units are in K d -•.
RSB continuua. Cooling rate differences, inferred from these calculations, are very similar to those shown in Figure 2b.
A comparison of the clear-sky LW fluxes and cooling rates from each radiation model for the SAW atmosphere is shown in Figure 3. In this drier atmosphere, RRTMG reduces the upward LW flux and OLR by only 2-3 W m -2 (Figure 3a). However, the enhancement of downward flux is as high as 14 W m -2 and is shifted toward the surface. The lower water
content of the SAW atmosphere makes it less opaque near the surface than moister profiles. The CKD foreign continuum absorption, which is absent from the RSB continuum, peaks in the 200-400 cm -• spectral region where the atmosphere is nearly opaque in high water atmospheres. In the tropics, for example, this extra continuum absorption has only a small impact on the downward surface flux due to the high opacity in this spectral band. In drier regions, however, the atmosphere is less opaque from 400 to 600 cm -• and the additional foreign continuum absorption in RRTMG strongly enhances the downward LW flux to the surface. SAW cooling rate (Figure 3b) is slightly enhanced by RRTMG by as much as 0.2 K d -• in much of the lower stratosphere and troposphere except near the surface.
Differences between the RRTMG and CCM3 LW MLS
fluxes and cooling rates for three cloud cases are illustrated in Figure 4. The RRTMG improvement in LW cloud absorption discussed in section 2.2 is included in these comparisons. Flux and cooling rate differences have the same format and scale as those in Figures 2 and 3. Layers containing cloud are marked with black bars to the right of each plot. All three cases use a cloud optical depth, %•d, of 5 in each layer. For a low cloud with a cloud fraction, A c, of 0.5 (Figures 4a and 4b) the overall
similarity of the cloud absorption treatments reduces the downward flux difference within and below the cloud. Since the
large clear-sky differences remain above the cloud, the vertical divergence of net flux near the top of the cloud is increased, which produces a greater reduction in cooling rate at that level than the clear sky case (see Figure 2b). A multilayer cloud with a uniform A c of 0.5 in each layer reduces the flux and cooling rate differences at all levels (Figures 4c and 4d) relative to clear sky. The 2-4 W m -2 flux differences within the cloud are primarily due to the revision of the combined LW cloud and gas absorption described earlier. The impact on flux and cool- ing rate of a high cloud with an A• of 1.0, shown in Figures 4e and 4f, results in reversing the clear-sky OLR reduction due to RRTMG. The extent to which this clear-sky OLR reduction is offset by high cloud is heavily dependent on the cloud fraction, optical depth, and height. These comparisons will help clarify the interpretation of the RRTMG global flux impacts de- scribed in section 4.
4. Climate Model Simulations
An assessment of the effect of RRTMG on the NCAR
climate model was accomplished in two stages. First, a version of CCM3 was developed that performed two LW calculations, one with RRTMG and one with CCM3 LW. The RRTMG
fluxes and cooling rates provided the LW radiative feedback for the simulation, while the CCM3_LW quantities were stored as diagnostic output. This approach allowed the two LW mod- els to be compared for identical atmospheric states that varied over a full range of global conditions. Flux and cooling rate differences between the LW models can be interpreted in the
14,880 IACONO ET AL.' VALIDATED LONGWAVE RADIATION GCM IMPACTS
I-- o !
i,.-I
ID I
Z Z Z Z M o o c:> o
tlJ
u,J
i
Z Z Z Z 0 0 0 0
0 a:: x.
LU
'r E •5
Z Z Z Z ø o 03 (/> 03 03 00 0 •'
IACONO ET AL.: VALIDATED LONGWAVE RADIATION GCM IMPACTS 14,881
same way as the single-column comparisons in section 3 and represent the global, initial forcing impact of introducing RRTMG into the climate model. For this study, the interval at which LW gaseous absorption was computed was reduced from the standard CCM3 interval of every 12 model hours to every three model hours to better simulate the diurnal cycle. LW fluxes and cooling rates were then calculated at every model hour with updated temperature and cloud information. A 5-year simulation was performed using monthly averaged, climatological sea surface temperatures (SSTs) with all radia- tive and dynamical fields stored as daily averages. The simu- lation was preceded by a 4-month adjustment period during which the radiative feedback was gradually transferred from CCM3_LW to RRTMG over the first three months by apply- ing a cosine transition function to the cooling rates and down- ward surface fluxes from each LW model. The results of this
test are presented in section 4.1. For the second phase, a 5-year, climatological SST control
simulation was performed using the original, unmodified CCM3 to provide a basis for comparison to the first simulation. Since each experiment was run with a different LW model, differences in the radiative and dynamical fields between the two simulations include the changes in atmospheric state pro- duced by the two LW methods. These differences, presented in section 4.2, are more representative of the long-term impact of RRTMG on the CCM3 climate model simulation.
o
2OO
400
600
800
1000
CCM3 Sub-arctic Winter Longwave Fluxes
-\ /i ...... up
_ \ /:: ___ DOWN \ / • NET
\
\\
RRTMG-CCM3 o
2o0
400[/i, t 6OO
80O
0 100 200 300 400
FLUX (W m 2)
CCM3 Sub-arctic Winter Longwave Cooling Rate o b
20O 200
•.• 400 400
m 600 600
800 [ 800 1000 / ..... I .... I .... I , , , 1000
500 -30-20-10 0 10 20 30
FLUX DIFF. (W rn 2)
RRTMG-CCM3
0 1 2 3 4 5 -1.0 -0.5 0.0 0.5 1.0
COOLING RATE (K d '1) CR DIFF. (K d '•)
Figure 3. Subarctic winter upward, downward, and net fluxes (a) as computed by the CCM3 longwave model, with differ- ences between RRTMG and CCM3 shown to the right. Sub- arctic winter cooling rate (b) as computed by the CCM3 long- wave model, with differences between RRTMG and CCM3 to the right.
FIRIMG-CCM3 o
2oo
.
10001 ,,t ,,,•,,,, ,, ,l•l,,,,• .... I .... I
-30 -20 -10 0 (•/ 30 FLUX DIFF. RRTMG-CCM3
o ...... 200 • 20
400 40
60
eoo
,oo< 1000 • • .... • .... 1000/,
RRTMG-CCM3 RRTMG-CCM3
II t 400 I
-30-20-10 0 10 20 30 -30-20-10 0 • 20 30 FLUX DIFF. (W m 2) FLUX DIFF ( m 2)
RRTMG-CCM3 RRTMG-CCM3
'f'
200 •
I
I I 800
,, ,_L, • ,,, 1000 •, ,,, •. -1.0 -0 5 0.0 0.5 1.0 -1.0 -0.5 0.0 0 5 1.0 -1.0 -0.5 0 0 0 5 1 0
COOLING RATE DIFF. (K d '1) COOLING RATE DIFF. (K d 'j) COOLING RATE DIFF. (K d '*)
Figure 4. Midlatitude summer flux and cooling rate differ- ences between RRTMG and CCM3 longwave models for three cloud cases. Differences are shown for (a) flux and (b) cooling rate with a low cloud, (c) flux, and (d) cooling rate with a multilevel cloud, and (e) flux and (f) cooling rate with a high cloud. The line styles used in Figures 4a, 4c, and 4e are iden- tified in Figure 3a. Layers with cloud are marked with black bars to the right in each figure. All clouds have an optical depth of 5 in each layer. Figures 4a-4d are for a cloud fraction of 0.5 in each layer, and Figures 4e and 4f are for a cloud fraction of 1.0.
It should be noted that the CCM3 global average top of thc atmosphere (TOA) fluxes have been tuned by NCAR to agree with observations from the Earth Radiation Budget Experi- ment (ERBE) [Kiehl et al., 1998b] and to ensure a TOA radi- ative balance. Also, the outgoing longwave radiation changes produced by RRTMG are of the same order or larger than the magnitude of the changes introduced by this tuning. Therefore since no attempt was made in the present study to retune the climate model when running with RRTMG, direct compari- sons to ERBE fluxes are not included in this analysis. Changes to the CCM3 energy budget caused by RRTMG should be interpreted qualitatively in the context of the improvement attained by RRTM as established through its validation path to observed radiances. Kiehl et al. [1998b] give a thorough de- scription of the CCM3 energy budget, including comparisons of CCM3 LW fluxes to ERBE data.
4.1. Initial Forcing Impacts
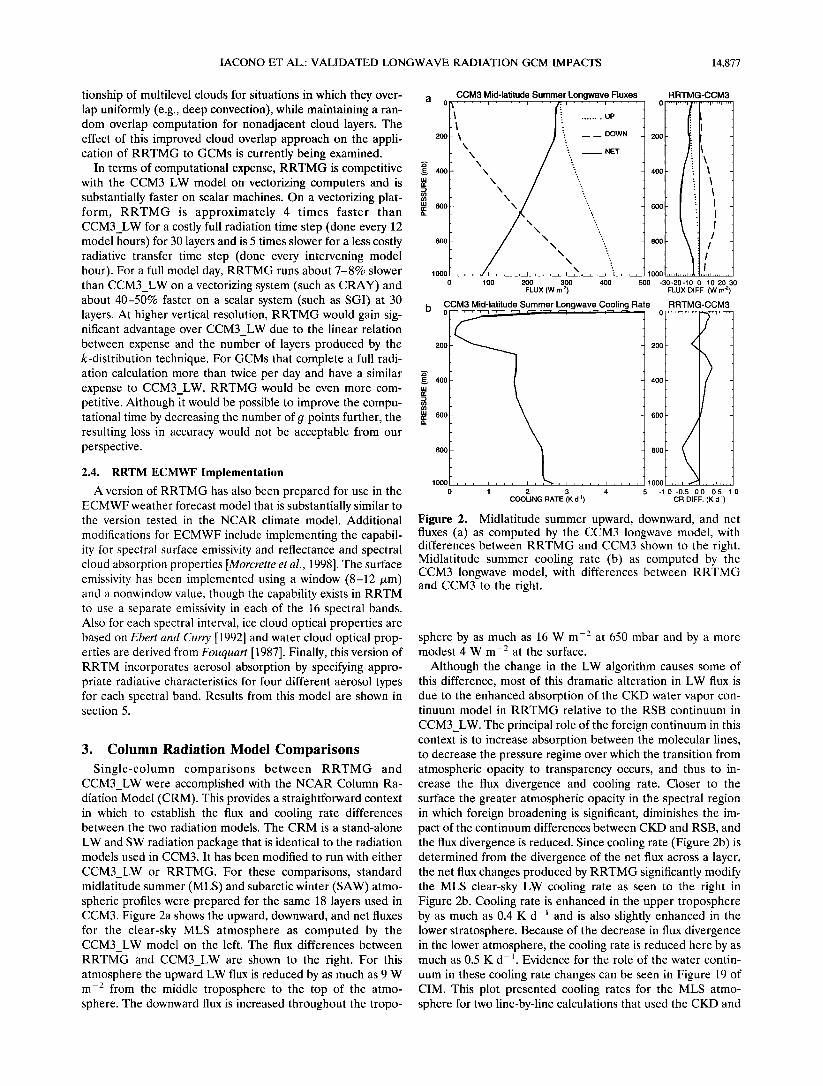
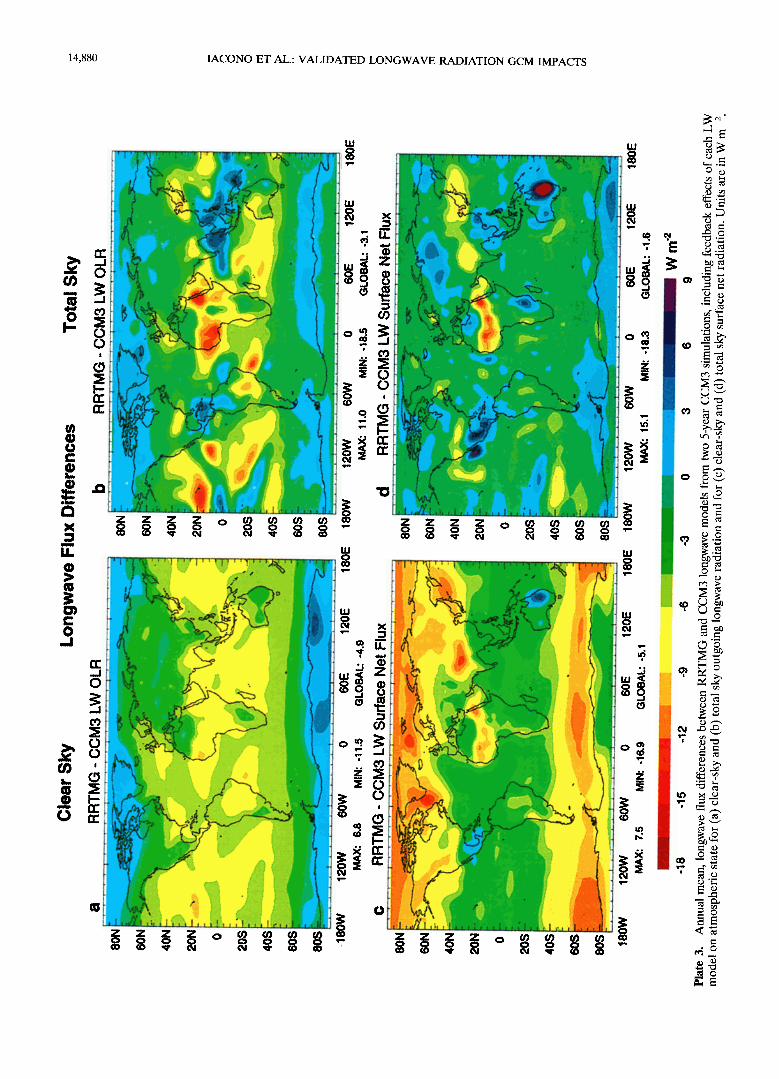
Differences in the annual average OLR and surface LW fluxes (RRTMG - CCM3_LW), which represent the initial forcing effect of RRTMG, are shown in Plate 1. Clear-sky OLR (Plate la) is reduced by RRTMG most extensively
14,882 IACONO ET AL.: VALIDATED LONGWAVE RADIATION GCM IMPACTS
throughout the tropics, by as much as 9 W m -2, decreasing to small changes over the polar areas. The greatest OLR changes occur in the wettest latitudes, which is consistent with the significant enhancement of absorption from the CKD water vapor continuum relative to the RSB formulation. The annual mean, total sky OLR changes (Plate lb) are generally smaller, since clouds reduce the LW model OLR differences as shown
in Figure 4. Exceptions are typically clear areas (e.g., Sahara Desert) or regions where low clouds dominate, such as the eastern midlatitude oceans. Such low clouds are below much of
the enhanced absorption from the CKD foreign continuum in RRTMG. Several tropical regions in Plate lb (e.g., west of Central America, central Africa, etc.) show an increase in total sky OLR due to RRTMG. These are areas where high clouds dominate in this simulation. For these clouds the RRTMG
improvement in the -LW cloud absorption algorithm, discussed in section 2.3, produces an increase in OLR of several W m -2 as demonstrated in Figure 4e. Small flux differences at high latitudes in Plate lb result from combinations of clouds at all levels.
RRTMG has a substantial impact on clear-sky net radiation at the surface, shown as an annual average difference in Plate lc (net flux is defined as upward minus downward radiation). Since the LW models are being compared for identical atmo- spheric states (including the surface temperatures) in this con- text, the upward surface radiation differences will be small and most of the flux changes shown in Plate l c are due to an increase in the downward radiation toward the surface. The
largest increases occur at high latitudes, over deserts, and in mountainous areas where the atmospheric water vapor content is low. In these regions the downward flux is enhanced by 12-15 W m -2. This considerable impact is consistent with the discussion in section 3 of the flux changes for the SAW atmo- sphere (Figure 3a). As noted earlier, many GCMs greatly un- derestimate the clear-sky downward surface flux in dry regions by 10-20 W m -2. In particular, Pinto et at. [1997] showed that CCM2 downward surface fluxes over the Arctic were too low by 20 W m -2. It is a significant result of this work that the additional absorption provided by the CKD water vapor con- tinuum accounts for much of this discrepancy. The total sky, net flux change at the surface in Plate l d shows consistency with Figure 4 in that surface flux differences are greatly re- duced in cloudy areas. Large differences remain over land areas that have the least cloudiness in this simulation. Clearly, RRTMG and the CKD water continuum have substantial im-
pacts on clear-sky LW flux at both the top of the atmosphere and at the surface that will significantly influence the energy balance of the climate model.
The primary mechanism by which a -LW radiation model impacts the atmospheric state of a GCM is through the radi- ative cooling rate. The initial forcing effect of RRTMG on the LW cooling rate of CCM3 is shown as a difference (RRTMG - CCM3_-LW) in Plate 2. This and all subsequent figures that have pressure as the vertical axis use the CCM hybrid sigma-pressure vertical coordinate times 1000 [Kieht et at., 1998a]. RRTMG increases the cooling rate from the mid- dle troposphere to the lower stratosphere, except for the trop- ical tropopause. Peak cooling enhancement of 0.4 K d- • occurs in the upper tropical troposphere. Cooling rates are reduced at all latitudes in the lower troposphere with peak values away from the poles of 0.4-0.5 K d- •
4.2. Climate Simulation Impacts
The RRTMG initial forcing flux and cooling rate changes described in section 4.1 alter the atmospheric state through feedbacks between the radiation and the model dynamics until a new equilibrium state is reached. These feedback effects are now considered by looking at differences between the RRTMG CCM3 simulation and the control CCM3 simulation. Plate 3 shows the annual mean TOA and surface LW flux differences between RRTMG and CCM3 LW that include their respective changes in atmospheric state. The color scale and the fields shown are the same as in Plate 1. The clear-sky OLR difference in Plate 3a shows considerable decreases in OLR due to RRTMG throughout the low and midlatitudes of 4-12 W m -2, with small increases at high latitudes. The total sky OLR difference in Plate 3b contains considerable regional variation with tropical decreases of as much as 18 W m -2 and increases of 11 W m -2. At the surface, most of the widespread increase in clear-sky downward flux at high latitudes of 8-15 W m -2 remains (Plate 3c), while the total sky flux changes (Plate 3d) are generally small with a few large regional differences. In general, the -LW flux differences in Plate 3 have greater re- gional variability than the initial forcing impacts in Plate 1 largely due to changes in atmospheric and surface temperature and to the spatial and temporal redistribution of water vapor and cloud cover induced by the LW model change.
As mentioned previously, the CCM3 global mean TOA en- ergy budget was tuned to agree within a few W m -2 of ERBE measurements. Despite this, regional differences between CCM3 and ERBE remain, which can be inferred from the OLR and clear-sky OLR comparisons in Figures 15 and 16 of Kiehl et al. [1998b]. Specifically, in many tropical areas, CCM3 overestimates the OLR and clear-sky OLR by 5-10 W m -2 relative to ERBE. Over much of Antarctica, CCM3 outgoing flux is too low. The RRTMG OLR impacts shown in Plates 3a and 3b have the correct magnitude and direction to offset these CCM3 flux biases. Kiehl et al. [1998b] suggest a deficiency in water vapor absorption in CCM3 LW as one cause for the TOA flux biases in CCM3. Briegleb and Bromwich [1998a] also suggest insufficient water vapor rotation band absorption in CCM3 to explain a 10-20 W m -2 deficiency in-LW clear-sky downward surface flux in polar latitudes. The result presented here for RRTMG is strong evidence that improved absorption, provided by the CKD water vapor continuum model, makes a significant contribution to the accurate representation of LW radiative processes of relevance to a GCM.
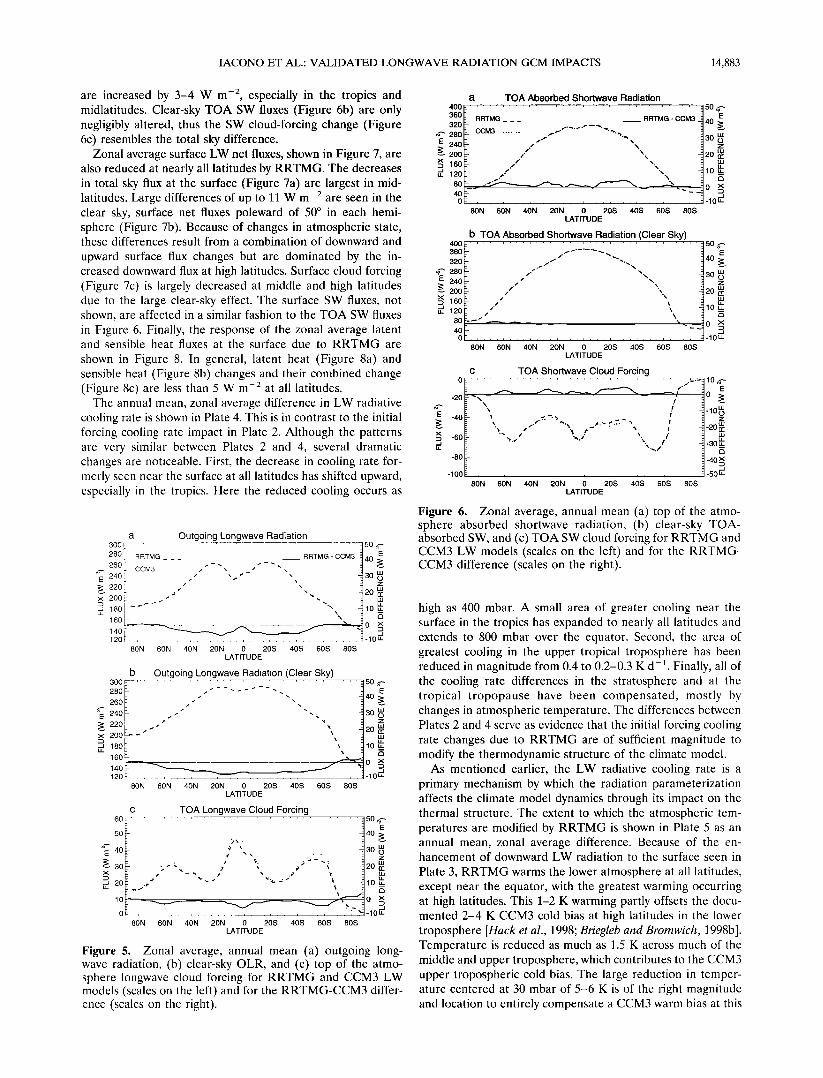
The impact of RRTMG on the CCM3 energy budget can be summarized with annual mean, zonal averages of the energy budget components. Figure 5 presents the zonal average OLR for total sky (Figure 5a), clear sky (Figure 5b), and the LW cloud forcing (Figure 5c) defined as the clear sky minus the total sky OLR. RRTMG values (dashed lines) and CCM3_LW values (dotted lines) use the scale to the left in each plot. The differences (solid lines) use the scale to the right. Both clear and total sky OLR are reduced by RRTMG at nearly all latitudes except for the polar areas where small increases are noted. RRTMG reduces cloud forcing in the tropics and the 50o-60 ø latitudes, where cloudiness is generally grehtest. Al- though the CCM3 shortwave (SW) model was used in both simulations, the annual mean, zonal average TOA absorbed SW fluxes, shown in Figure 6, are impacted by RRTMG through the changes in atmospheric state, primarily water va- por and cloud cover. The total sky, TOA SW fluxes (Figure 6a)
IACONO ET AL.' VALIDATED LONGWAVE RADIATION GCM IMPACTS 14,883
are increased by 3-4 W m -2, especially in the tropics and midlatitudes. Clear-sky TOA SW fluxes (Figure 6b) are only negligibly altered, thus the SW cloud-forcing change (Figure 6c) resembles the total sky difference.
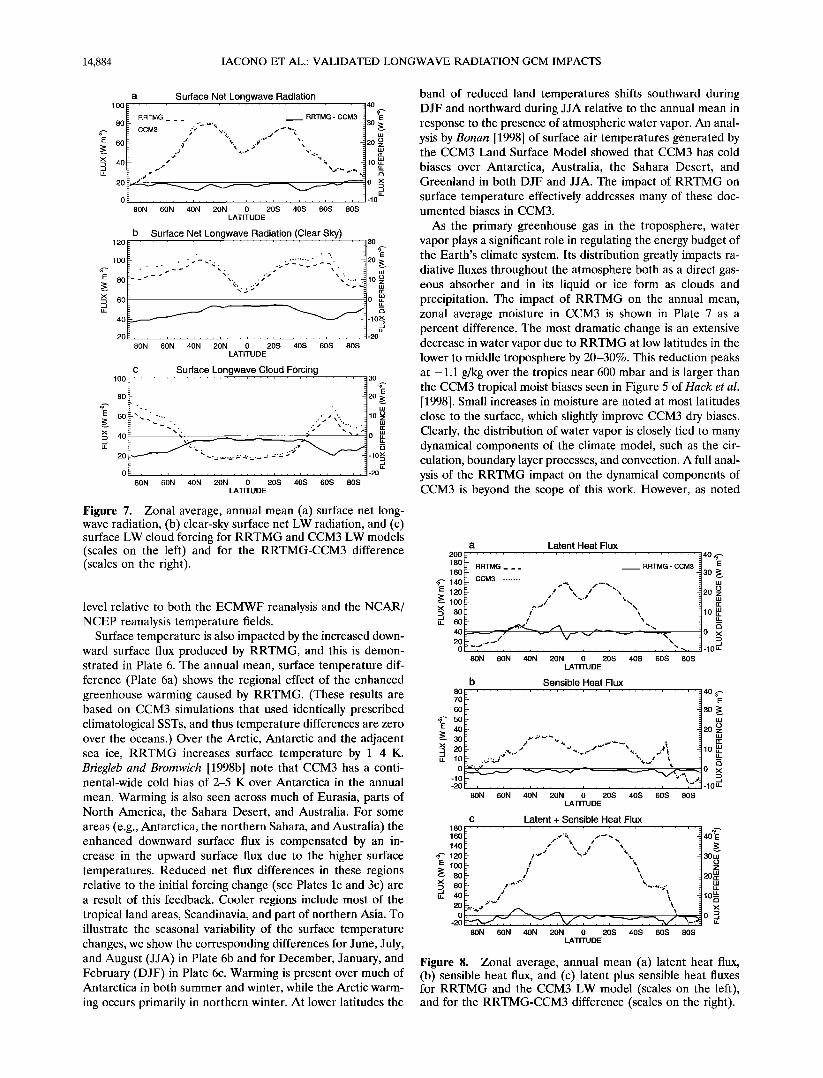
Zonal average surface LW net fluxes, shown in Figure 7, are also reduced at nearly all latitudes by RRTMG. The decreases in total sky flux at the surface (Figure 7a) are largest in mid- latitudes. Large differences of up to 11 W m -2 are seen in the clear sky, surface net fluxes poleward of 50 ø in each hemi- sphere (Figure 7b). Because of changes in atmospheric state, these differences result from a combination of downward and
upward surface flux changes but are dominated by the in- creased downward flux at high latitudes. Surface cloud forcing (Figure 7c) is largely decreased at middle and high latitudes due to the large clear-sky effect. The surface SW fluxes, not shown. are affected in a similar fashion to the TOA SW fluxes
in Figure 6. Finally, the response of the zonal average latent and sensible heat fluxes at the surface due to RRTMG are
shown in Figure 8. In general, latent heat (Figure 8a) and sensible heat (Figure 8b) changes and their combined change (Figure 8c) are less than 5 W m -2 at all latitudes.
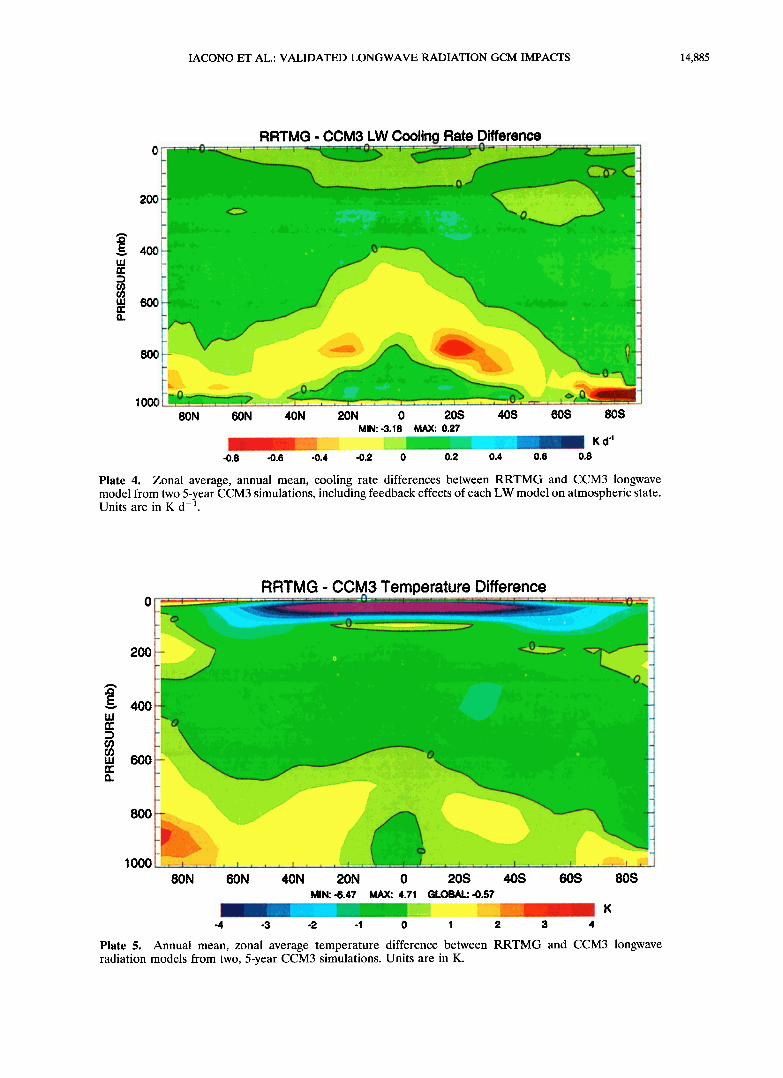
The annual mean, zonal average difference in LW radiative cooling rate is shown in Plate 4. This is in contrast to the initial forcing cooling rate impact in Plate 2. Although the patterns arc very similar between Plates 2 and 4, several dramatic changes are noticeablc. First, the decrease in cooling rate for- merly seen near thc surface at all latitudes has shifted upward, especially in the tropics. Here the reduced cooling occurs as
a Outgoing Longwave Radiation 300 [:
280 i RRTMG RRTMG - CCM3 260 t CCM3
/
2201 / / x.•. 200 i!
160 -
140 i 120
80N 60N 40N 20N 0 20S 40S 60S 80S LATITUDE
50 •-. E
40 • 30 O
z
20 m
lO,, u-
o x
b Outgoing Longwave Radiation (Clear Sky) 300 •- ...... ' .}-:?:V : ..... so •- 280 ..,, ß 40 • 260 ,;'? ":4. v
240 ...... "<.. 30 • 220 [• .• • d'• <'•. Z k •20 m 200 •- • • • •
180L \ • 10 m
140 D 120 F_ ..................... -10 •
80N 60N 40N 20N 60S 80S 0 20s 40s LATITUDE
c TOA Longwave Cloud Forcing
..p... ) •'.
• 40 .:, , •... ..*"-"•'-.
0,• -10• 80N 60N 40N 20N 0 20S 40S 60S 80S
LATITUDE
50 •
40 • 30 O z
20 m
Figure 5. Zonal average, annual mean (a) outgoing long- wave radiation, (b) clear-sky OLR, and (c) top of the atmo- sphere longwave cloud forcing for RRTMG and CCM3 LW models (scales on the lcft) and for the RRTMG-CCM3 differ- ence (scales on the right).
400 360
320
½ 280
E 240 •- 200 x • 160 ,, 120
80
40 0
400 360
320
d-'- 280
E 240 •- 200 D x 160 J LL 120
80
40 0__
a TOA Absorbed Shortwave Radiation
- RRTMG _ _ _ RRTMG - CCM3
CCM3 ....... ,,. ,--' "",.,,,. •, - .• .,," .\ - o!
ß
_ / \ / ø,%
/.
. . , .- "' .,/------,,, ., ß
ß
80N 60N 40N 20N 0 20S 40S 60S 80S LATITUDE
b TOA Absorbed Shortwave Radiation (Clear Sky)
80N 60N 40N 20N 0 20S 40S 60S 80S LATITUDE
½ TOA Shortwave Cloud Forcing
50 • E
40 • 30 O
z
20 m
10,,
0 X
5O •
40 • 3O LU 0
z
2O m
lOLL
0 X
dO,, -J
0 .=.-- 10 •.•-
.-. -20• 'x\.\ / _•.10rm___ ) •E -40• • ..... .'7 ..... [ •[ Z •: • • /.,-' ',-.,, ,,..-: .<.7....• ! •-20• '"" F '• ." ', r'• ' • • q
:D "' " "- 1' - -30 mm
-80 -40 x J
-1 O0 .......... -50 LL
80N 60N 40N 20N 0 20S 40S 60S 80S LATITUDE
Figure 6. Zonal average, annual mean (a) top of the atmo- sphere absorbed shortwave radiation, (b) clcar-sky TOA- absorbed SW, and (c) TOA SW cloud forcing for RRTMG and CCM3 LW modcls (scales on the lcft) and for the RRTMG- CCM3 difference (scales on the right).
high as 400 mbar. A small area of greater cooling near the surface in the tropics has expanded to nearly all latitudcs and extends to 800 mbar over the equator. Second, thc area of greatest cooling in the upper tropical troposphere has been reduced in magnitude from 0.4 to 0.2-0.3 K d •. Finally, all of the cooling rate differences in the stratosphere and at the tropical tropopause have been compensated, mostly by changes in atmospheric temperature. The differences bctwccn Plates 2 and 4 serve as evidence that the ir/itial forcing cooling rate changes due to RRTMG are of sufficient magnitude to modify the thermodynamic structure of the climate model.
As mentioned earlier, the LW radiative cooling rate is a primary mechanism by which the radiation parameterization affects the climate model dynamics through its impact on the thermal structure. The extent to which the atmospheric tem- peratures are modified by RRTMG is shown in Plate 5 as an annual mean, zonal average difference. Because of the en- hancement of downward LW radiation to the surface seen in
Plate 3, RRTMG warms the lower atmosphere at all latitudes, except near the equator, with the greatest warming occurring at high latitudes. This 1-2 K warming partly offsets the docu- mented 2-4 K CCM3 cold bias at high latitudes in the lower troposphere [Hack et al., 1998; Briegleb and Bromwich, 1998b]. Temperature is reduced as much as 1.5 K across much of the middle and upper troposphere, which contributes to the CCM3 upper tropospheric cold bias. The large reduction in temper- ature centered at 30 mbar of 5-6 K is of the right magnitude and location to entirely compensate a CCM3 warm bias at this
14,884 IACONO ET AL.: VALIDATED LONGWAVE RADIATION GCM IMPACTS
E
lOO
8o
12o
lOO
80
60 40
20
a Surface Net Longwave Radiation
RRTMG • RRTMG - CCM3
CCM3 ........ '> <... /.,, ..) •, .½-• v.
ß '• k .-> .-2 •.,•
.•..
•,. ',,. .• = ..•.•..,- •.a ..•.
80N 60N 40N 20N 0 20S '40S '6;S '80S LATITUDE
b Surface Net Longwave Radiation (Clear Sky)
40
30
20 øz
1Ou_
o•
-10
30
20 • 10 ø z
o•
-20
80N 60N 40N 20N 0 20S 40S 60S 80S LATITUDE
c Surface Longwave Cloud Forcing 1 oo 3o
80 20 •
E 60 •" •" - •' .... ...;" '' ....... rr •. ..";" x'.. 10 z 0 X '•" 9 • 40 v. . _0 ,,uJ u_ +... .:' :
20 ' -lO•
o -2o
80N 60N 40N 20N 0 20S 40S 60S 80S LATITUDE
Figure 7. Zonal average, annual mean (a) surface net long- wave radiation, (b) clear-sky surface net LW radiation, and (c) surface LW cloud forcing for RRTMG and CCM3 LW models (scales on the left) and for the RRTMG-CCM3 difference (scales on the right).
level relative to both the ECMWF reanalysis and the NCAR/ NCEP reanalysis temperature fields.
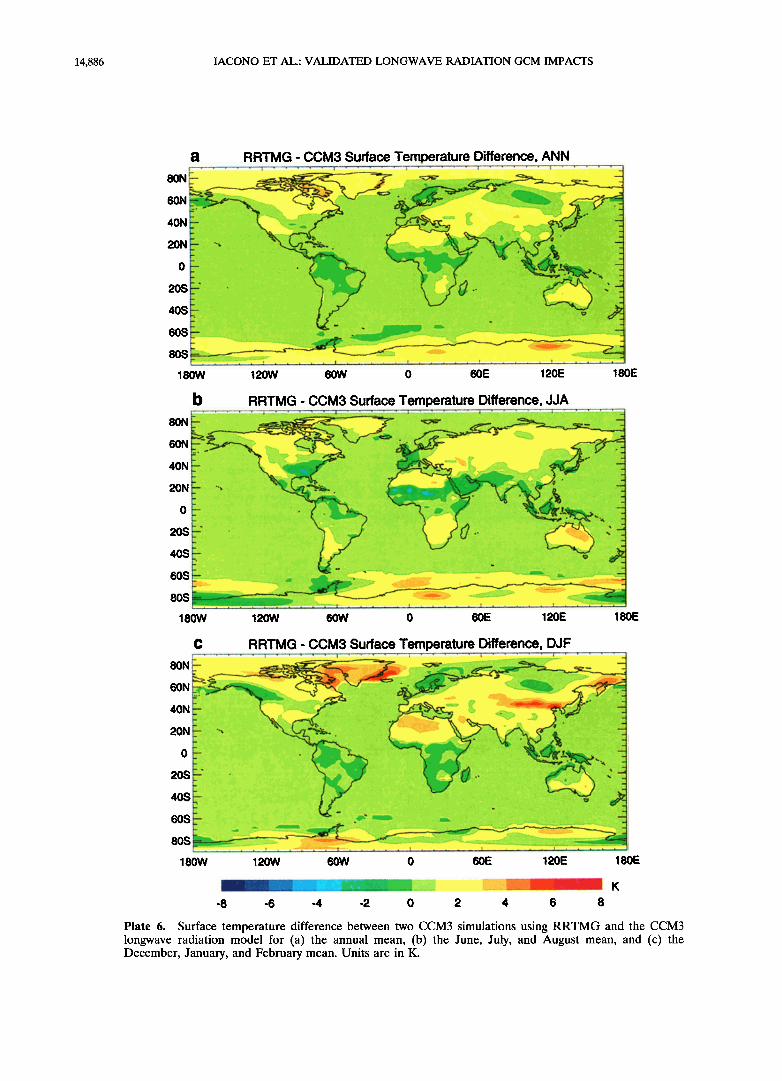
Surface temperature is also impacted by the increased down- ward surface flux produced by RRTMG, and this is demon- strated in Plate 6. The annual mean, surface temperature dif- ference (Plate 6a) shows the regional effect of the enhanced greenhouse warming caused by RRTMG. (These results are based on CCM3 simulations that used identically prescribed climatological SSTs, and thus temperature differences are zero over the oceans.) Over the Arctic, Antarctic and the adjacent sea ice, RRTMG increases surface temperature by 1-4 K. Briegleb and Bromwich [1998b] note that CCM3 has a conti- nental-wide cold bias of 2-5 K over Antarctica in the annual
mean. Warming is also seen across much of Eurasia, parts of North America, the Sahara Desert, and Australia. For some areas (e.g., Antarctica, the northern Sahara, and Australia) the enhanced downward surface flux is compensated by an in- crease in the upward surface flux due to the higher surface temperatures. Reduced net flux differences in these regions relative to the initial forcing change (see Plates lc and 3c) are a result of this feedback. Cooler regions include most of the tropical land areas, Scandinavia, and part of northern Asia. To illustrate the seasonal variability of the surface temperature changes, we show the corresponding differences for June, July, and August (JJA) in Plate 6b and for December, January, and February (DJF) in Plate 6c. Warming is present over much of Antarctica in both summer and winter, while the Arctic warm- ing occurs primarily in northern winter. At lower latitudes the
band of reduced land temperatures shifts southward during DJF and northward during JJA relative to the annual mean in response to the presence of atmospheric water vapor. An anal- ysis by Bonan [1998] of surface air temperatures generated by the CCM3 Land Surface Model showed that CCM3 has cold
biases over Antarctica, Australia, the Sahara Desert, and Greenland in both DJF and JJA. The impact of RRTMG on surface temperature effectively addresses many of these doc- umented biases in CCM3.
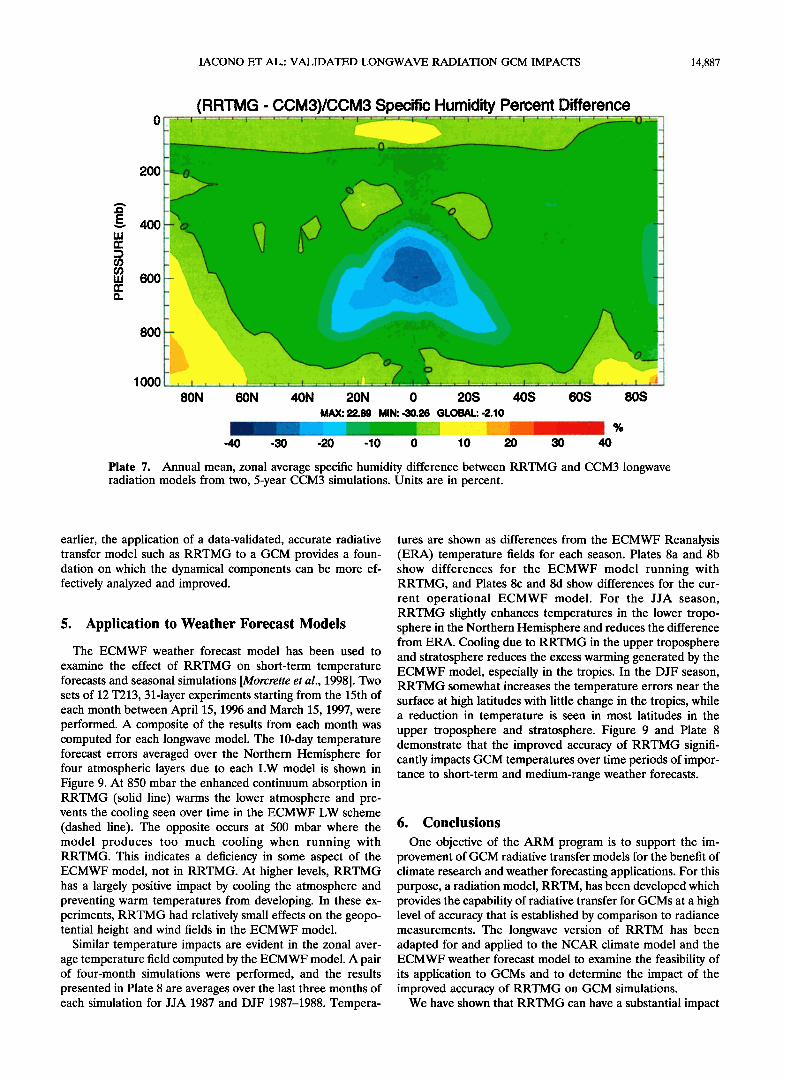
As the primary greenhouse gas in the troposphere, water vapor plays a significant role in regulating the energy budget of the Earth's climate system. Its distribution greatly impacts ra- diative fluxes throughout the atmosphere both as a direct gas- eous absorber and in its liquid or ice form as clouds and precipitation. The impact of RRTMG on the annual mean, zonal average moisture in CCM3 is shown in Plate 7 as a percent difference. The most dramatic change is an extensive decrease in water vapor due to RRTMG at low latitudes in the lower to middle troposphere by 20-30%. This reduction peaks at -1.1 g/kg over the tropics near 600 mbar and is larger than the CCM3 tropical moist biases seen in Figure 5 of Hack et al. [1998]. Small increases in moisture are noted at most latitudes close to the surface, which slightly improve CCM3 dry biases. Clearly, the distribution of water vapor is closely tied to many dynamical components of the climate model, such as the cir- culation, boundary layer processes, and convection. A full anal- ysis of the RRTMG impact on the dynamical components of CCM3 is beyond the scope of this work. However, as noted
2OO 18O
160
½ 140
• 120 ----- 100
x• 80 ,,-½ 60
40
20 0
8O 70
60
½ 5O
½: 40 -• 30 X D 2O u_ 10
0
-10 -20
a Latent Heat Flux
- RRTMG _ _ _ RRTMG - CCM3 E _ 30 •
CCM3 ....... '-' _ .•..• •-.• i.u
•" \ / '•' 20 Z
_
_=• •- ' ' -:0 x - / x. _-- D
.........................
80N 60N 40N 20N 0 20S 40S 60S 80S LATITUDE
b Sensible Heat Flux
-2_ : ..x,..,- "---"'
__= ...>..•.• %.,.,
, 80N 60N 40N 20N 0 20S 40S 60S 80S
LATITUDE
C 180 - 160 - _
140 _
½ 120 _
• 100_ -.-- 80 _
x• 60 _
u_ 40
2o
o -20
40 • E
30 • o
20 z
lO Lu
o x
Latent + Sensible Heat Flux
/ k. // "% J h. .[
! ..• ,,.., ',.•. ! \
! \
1.,.•...c.'
•. •'* .... \
80N 60N 40N 20N 0 20S 40S 60S 80S LATITUDE
40 E
30w O Z
2o•
log x
o D
Figure 8. Zonal average, annual mean (a) latent heat flux, (b) sensible heat flux, and (c) latent plus sensible heat fluxes for RRTMG and the CCM3 LW model (scales on the left), and for the RRTMG-CCM3 difference (scales on the right).
IACONO ET AL.: VALIDATED LONGWAVE RADIATION GCM IMPACTS 14,885
RRTMG- CCM3 LW Cooling Rate Difference
200
400
600
1000
80N 60N 40N 20N 0 20S 40S MIN:-3.18 MAX: 0.27
.0.• .0.• .{;.4 -0.• • '0 0.• 0.4 0.•
60S 80S
K d 4 0.8
Plate 4. Zonal average, annual mean, cooling rate differences between RRTMG and CCM3 longwave model from two 5-year CCM3 simulations, including feedback effects of each LW model on atmospheric state Units are in K d-l
200 •
4OO
RRTMG - CCM3 Temperature Difference
600 ', • ' 800 .. .- ., , J
80N 60N 40N 20N 0 20S 40S 60S 80S MiN:-6.47 MAX: 4.71 GLOBAL:o0.5?
• ' K
-4 -3 -2 -1 0 1 ;• 3 4
Plate 5. Annual mean, zonal average temperature difference between RRTMG and CCM3 longwave radiation models from two, 5-year CCM3 simulations. Units are in K.
14,886 IACONO ET AL.: VALIDATED LONGWAVE RADIATION GCM IMPACTS
a RRTMG -CCM3 Surface Temperature Difference, ANN
80N F-' "'--'"---,-•-•• • • • • •"-- --
f_ • r'"'•.,, '? -""-"• %•----, • _.,2'" :
20S --- ' • •'• '• • 8os '-• •-••'
r- , ! , I, ! ! ß
18( IW 120W 60W 0 60E 120E 18!
b RRTMG - CCM3 Surface Temperature Difference, JJA •ON• _•• -•-•. •--- .._- •' •._ --
60N ..•." • -. •'.c • - •
o • • --. -
60S L • 80S • --'---'---• • • •
180W 120W 60W 0 60E 120E 180E
80N
60N
40N
20N
0
20S
40S
60S
80S
180W
C RRTMG - CCM3 Surface Temperature Difference, DJF - ..... _"•:.z•.:":' ...... ':.•.''"'."': '•.•''"'..: .... :
120W 60W 0 60E 120E 180E
K
-8 -6 -4 -2 0 2 4 6 8
Plate 6. Surface temperature difference between two CCM3 simulations using RRTMG and the CCM3 longwave radiation model for (a) the annual mean, (b) the June, July, and August mean, and (c) the December, January, and February mean. Units are in K.
IACONO ET AL.: VALIDATED LONGWAVE RADIATION GCM IMPACTS 14,887
200
4OO
6O0
8OO
lOOO
(RRTMG - CCM3)/CCM3 Specific Humidity Percent Difference
-40
80N 60N 40N 20N 0 20S 40S 60S 80S MAX:22,89 MIN:-30.26 GLOBAL:-2,10
-30 -20 -10 0 10 20 30 40
Plate 7. Annual mean, zonal average specific humidity difference between RRTMG and CCM3 longwave radiation models from two, 5-year CCM3 simulations. Units are in percent.
earlier, the application of a data-validated, accurate radiative transfer model such as RRTMG to a GCM provides a foun- dation on which the dynamical components can be more ef- fectively analyzed and improved.
5. Application to Weather Forecast Models
The ECMWF weather forecast model has been used to
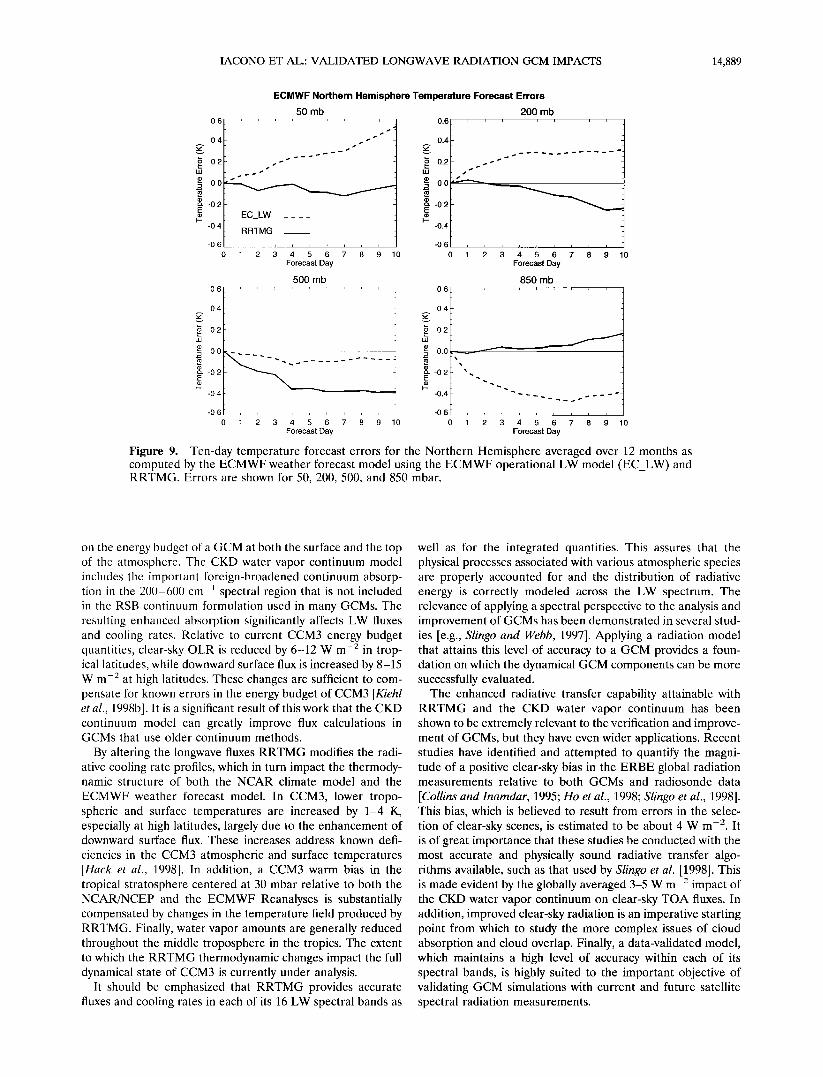
examine the effect of RRTMG on short-term temperature forecasts and seasonal simulations [Morcrette et al., 1998]. Two sets of 12 T213, 31-layer experiments starting from the 15th of each month between April 15, 1996 and March 15, 1997, were performed. A composite of the results from each month was computed for each longwave model. The 10-day temperature forecast errors averaged over the Northern Hemisphere for four atmospheric layers due to each LW model is shown in Figure 9. At 850 mbar the enhanced continuum absorption in RRTMG (solid line) warms the lower atmosphere and pre- vents the cooling seen over time in the ECMWF LW scheme (dashed line). The opposite occurs at 500 mbar where the model produces too much cooling when running with RRTMG. This indicates a deficiency in some aspect of the ECMWF model, not in RRTMG. At higher levels, RRTMG has a largely positive impact by cooling the atmosphere and preventing warm temperatures from developing. In these ex- periments, RRTMG had relatively small effects on the geopo- tential height and wind fields in the ECMWF model.
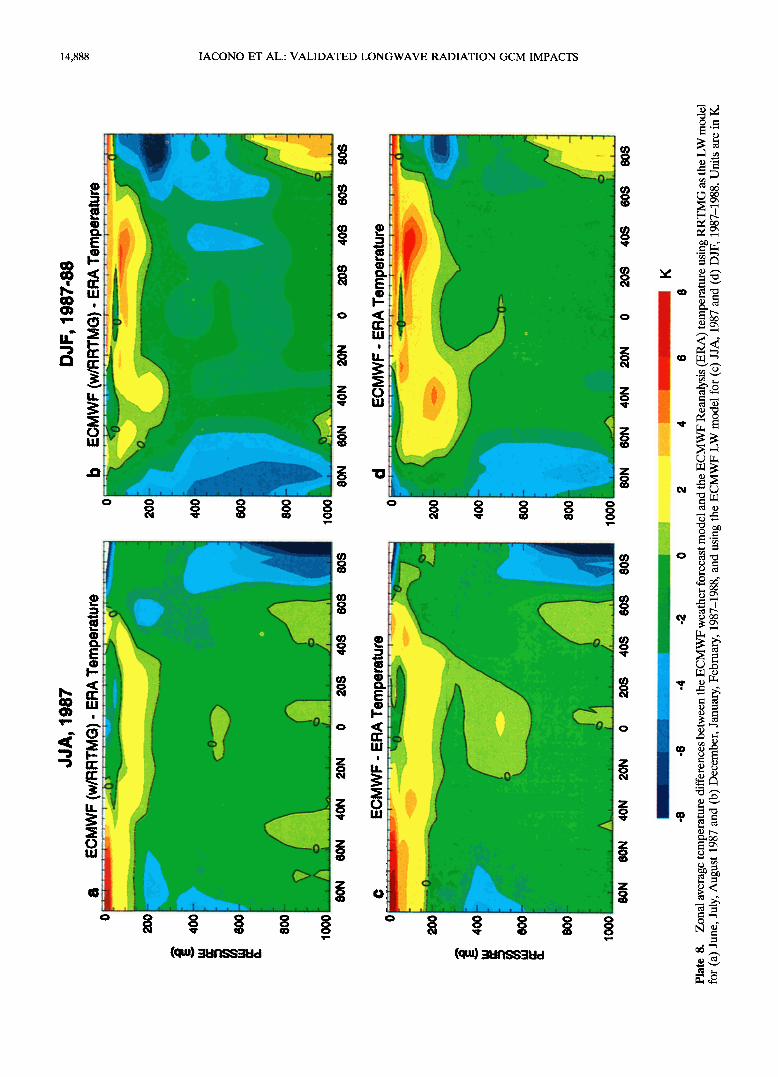
Similar temperature impacts are evident in the zonal aver- age temperature field computed by the ECMWF model. A pair of four-month simulations were performed, and the results presented in Plate 8 are averages over the last three months of each simulation for JJA 1987 and DJF 1987-1988. Tempera-
tures are shown as differences from the ECMWF Reanalysis (ERA) temperature fields for each season. Plates 8a and 8b show differences for the ECMWF model running with RRTMG, and Plates 8c and 8d show differences for the cur- rent operational ECMWF model. For the JJA season, RRTMG slightly enhances temperatures in the lower tropo- sphere in the Northern Hemisphere and reduces the difference from ERA. Cooling due to RRTMG in the upper troposphere and stratosphere reduces the excess warming generated by the ECMWF model, especially in the tropics. In the DJF season, RRTMG somewhat increases the temperature errors near the surface at high latitudes with little change in the tropics, while a reduction in temperature is seen in most latitudes in the upper troposphere and stratosphere. Figure 9 and Plate 8 demonstrate that the improved accuracy of RRTMG signifi- cantly impacts GCM temperatures over time periods of impor- tance to short-term and medium-range weather forecasts.
6. Conclusions
One objective of the ARM program is to support the im- provement of GCM radiative transfer models for the benefit of climate research and weather forecasting applications. For this purpose, a radiation model, RRTM, has been developed which provides the capability of radiative transfer for GCMs at a high level of accuracy that is established by comparison to radiance measurements. The longwave version of RRTM has been adapted for and applied to the NCAR climate model and the ECMWF weather forecast model to examine the feasibility of its application to GCMs and to determine the impact of the improved accuracy of RRTMG on GCM simulations.
We have shown that RRTMG can have a substantial impact
14,888 IACONO ET AL.: VALIDATED LONGWAVE RADIATION GCM IMPACTS
I I
LUI I I I
t
0 0 0 0 0
z
z
z
o
z o
z
z o
z
0 0 0 0 0 0 0 0
(qtu) 3•n•-•3ud
o o
1 I l 1 1 1 I I
Ol t
z
z
z
z
z
0 0 0 0 0 0 0 0
(qtu) 3Ufl•31:ld
z
IACONO ET AL.' VALIDATED LONGWAVE RADIATION GCM IMPACTS 14,889
0.6
0.4
,o o.2
o.o
-0.2
-0.4
ECMWF Northern Hemisphere Temperature Forecast Errors
50 mb 200 mb
EC_LW
RRTMG
0 1 2 3-- 4 5 6 7 8 9 0 Forecast Day
ø6 f
,o 0.2
• 0.0
• -02' I E
-04
-0.6
500 mb
0 1 2 3 4 5 6 7 8 9 10
Forecast Day
0.6
0.4
,o 0.2
o.o
-0.2
-0.4
-0.6
0 1 2
0.6
,o 0.2
• 0.0 •
•- -0.2 x.... -0.4
-0.6
0 1
3 4 5 6 7 8 9 10
Forecast Day
850 mb
2 3 4 5 6 7 8 9 0
Forecast Day
Figure 9. Ten-day temperature forecast errors for the Northern Hemisphere averaged over 12 months as computed by the ECMWF weather forecast model using the ECMWF operational LW model (EC_LW) and RRTMG. Errors are shown for 50, 200, 500, and 850 mbar.
on the energy budget of a GCM at both the surface and the top of the atmosphere. The CKD water vapor continuum model includes the important foreign-broadened continuum absorp- tion in the 200-600 cm i spectral region that is not included in the RSB continuum formulation used in many GCMs. The resulting enhanced absorption significantly affects LW fluxes and cooling rates. Relative to current CCM3 energy budget quantities, clear-sky OLR is reduced by 6-12 W m -2 in trop- ical latitudes, while downward surface flux is increased by 8-15 W m -2 at high latitudes. These changes are sufficient to com- pensate for known errors in the energy budget of CCM3 [Kiehl et al., 1998b]. It is a significant result of this work that the CKD continuum model can greatly improve flux calculations in GCMs that use older continuum methods.
By altering the longwave fluxes RRTMG modifies the radi- ative cooling rate profiles, which in turn impact the thermody- namic structure of both the NCAR climate model and the
ECMWF weather forecast model. In CCM3, lower tropo- spheric and surface temperatures are increased by 1-4 K, especially at high latitudes, largely due to the enhancement of downward surface flux. These increases address known defi-
ciencies in the CCM3 atmospheric and surface temperatures [Hack e! al., 1998]. In addition, a CCM3 warm bias in the tropical stratosphere centered at 30 mbar relative to both the NCAR/NCEP and the ECMWF Reanalyses is substantially compensated by changes in the temperature field produced by RRTMG. Finally, water vapor amounts are generally reduced throughout the middle troposphere in the tropics. The extent to which the RRTMG thermodynamic changes impact the full dynamical state of CCM3 is currently under analysis.
It should be emphasized that RRTMG provides accurate fluxes and cooling rates in each of its 16 LW spectral bands as
well as for the integrated quantities. This assures that the physical processes associated with various atmospheric species are properly accounted for and the distribution of radiative energy is correctly modeled across the LW spectrum. The relevance of applying a spectral perspective to the analysis and improvement of GCMs has been demonstrated in several stud- ies [e.g., Slingo and Webb, 1997]. Applying a radiation model that attains this level of accuracy to a GCM provides a foun- dation on which the dynamical GCM components can be more successfully evaluated.
The enhanced radiative transfer capability attainable with RRTMG and the CKD water vapor continuum has been shown to be extremely relevant to the verification and improve- ment of GCMs, but they have even wider applications. Recent studies have identified and attempted to quantify the magni- tude of a positive clear-sky bias in the ERBE global radiation measurements relative to both GCMs and radiosonde data
[Collins and Inamdar, 1995; Hoet al., 1998; Slingo et al., 1998]. This bias, which is believed to result from errors in the selec- tion of clear-sky scenes, is estimated to be about 4 W m -2. It is of great importance that these studies be conducted with the most accurate and physically sound radiative transfer algo- rithms available, such as that used by Slingo et al. [1998]. This is made evident by the globally averaged 3-5 W m -2 impact of the CKD water vapor continuum on clear-sky TOA fluxes. In addition, improved clear-sky radiation is an imperative starting point from which to study the more complex issues of cloud absorption and cloud overlap. Finally, a data-validated model, which maintains a high level of accuracy within each of its spectral bands, is highly suited to the important objective of validating GCM simulations with current and future satellite spectral radiation measurements.
14,890 IACONO ET AL.: VALIDATED LONGWAVE RADIATION GCM IMPACTS
Acknowledgments. The authors would like to thank J. Kiehl and J. Hack of NCAR for their assistance and for many helpful discussions during the course of this project. We also thank the reviewers for comments and suggestions that improved the paper. This work was supported by the Department of Energy under grant DE-FG02- 93ER61549 and by the National Science Foundation under grant ATM-9812184.
References
Barkstrom, B., E. Harrison, G. Smith, R. Green, J. Kibler, R. Cess, and the ERBE Science Team, Earth Radiation Budget Experiment (ERBE) archival and April 1985 results, Bull. Am. Meteorol. Soc., 70, 1254-1262, 1989.
Bonan, G. B., The land surface climatology of the NCAR Land Surface Model coupled to the NCAR Community Climate Model, J. Clim., 11, 1307-1326, 1998.
Briegleb, B. P., Delta-Eddington approximation for solar radiation in the NCAR Community Climate Model, J. Geophys. Res., 97, 7603- 7612, 1992.
Briegleb, B. P., and D. H. Bromwich, Polar radiation budgets of the NCAR CCM3, J. Clim., 11, 1246-1269, 1998a.
Briegleb, B. P., and D. H. Bromwich, Polar climate simulation of the NCAR CCM3, J. Clim., 11, 1270-1286, 1998b.
Cess, R. D., et al., Comparison of the seasonal change in cloud- radiative forcing from atmospheric general circulation models and satellite observations, J. Geophys. Res., 102, 16,593-16,603, 1997.
Clough, S. A., and M. J. Iacono, Line-by-line calculation of atmo- spheric fluxes and cooling rates, 2, Application to carbon dioxide, ozone, methane, nitrous oxide, and the halocarbons, J. Geophys. Res., 100, 16,519-16,535, 1995.
Clough, S. A., F. X. Kneizys, and R. W. Davies, Line shape and the water vapor continuum, Atmos. Res., 23, 229-241, 1989.
Clough, S. A., M. J. Iacono, and J.-L. Moncet, Line-by-line calculations of atmospheric fluxes and cooling rates: Application to water vapor, J. Geophys. Res., 97, 15,761-15,785, 1992.
Collins, W. D., and A. K. Inamdar, Validation of clear sky fluxes for tropical oceans from the Earth Radiation Budget Experiment, J. Clim., 8, 569-578, 1995.
Duvel, J.P., S. Bony, and H. LeTreut, Clear-sky greenhouse effect sensitivity to sea surface temperature changes: An evaluation of AMIP simulations, Clim. Dyn., 13, 259-273, 1997.
Ebert, E. E., and J. A. Curry, A parameterization of ice cloud optical properties for climate models, J. Geophys. Res., 97, 3831-3836, 1992.
Ellingson, R. G., J. Ellis, and S. Fels, The intercomparison of radiation codes used in climate models: Longwave results, J. Geophys. Res., 96, 8929-8953, 1991.
Fouquart, Y., Radiative transfer in climate models, in NA TOAdvanced Study Institute on Physically-Based Modeling and Simulation of Cli- mate and Climate Changes, edited by M. E. Schlesinger, pp. 223-284, Kluwer Acad., Norwell, Mass., 1987.
Fouquart, Y., B. Bonnel, and V. Ramaswamy, Intercomparing short- wave radiation codes for climate studies, J. Geophys. Res., 96, 8955- 8968, 1991.
Garratt, J. R., A. J. Prata, L. D. Rotstayn, B. J. McAvaney, and S. Cusack, The surface radiation budget over oceans and continents, J. Clim., 11, 1951-1968, 1998.
Gates, W. L., AMIP: The Atmospheric Model Intercomparison Project, Bull. Am. Meteorol. Soc., 73, 1962-1970, 1992.
Goody, R. M., R. West, L. Chen, and D. Crisp, The correlated k- distribution method for radiation calculation in non-homogeneous atmospheres, J. Quant. Spectrosc. Radiat. Transfer, 42, 539-550, 1989.
Hack, J. J., J. T. Kiehl, and J. W. Hurrell, The hydrologic and ther- modynamic characteristics of the NCAR CCM3, J. Clim., 11, 1179- 1206, 1998.
Ho, C.-H., M.-D. Chou, M. Suarez, K.-M. Lau, and M. Yan, Compar- ison of model-calculated and ERBE-retrieved clear sky outgoing longwave radiation, J. Geophys. Res., 103, 11,529-11,536, 1998.
Hu, Y. X., and K. Stamnes, An accurate parameterization of the radiative properties of water clouds suitable for use in climate mod- els, J. Clim., 6, 728-742, 1993.
Jakob, C., and S. A. Klein, The role of vertically varying cloud fraction in the parameterization of microphysical processes in the ECMWF model, Q. J. R. Meteorol. Soc., 125, 941-965, 1999.
Kiehl, J. T., J. J. Hack, G. B. Bonan, B. A. Boville, B. P. Briegleb, D. L. Williamson, and P. J. Rasch, Description of the NCAR Community Climate Model (CCM3), NCAR Tech. Note, NCAR/TN-420+STR, 152 pp., Natl. Cent. for Atmos. Res., Boulder, Colo., 1996.
Kiehl, J. T., J. J. Hack, G. B. Bonan, B. A. Boville, D. L. Williamson, and P. J. Rasch, The National Center for Atmospheric Research Community Climate Model: CCM3, J. Clim., 11, 1131-1149, 1998a.
Kiehl, J. T., J. J. Hack, and J. W. Hurrell, The energy budget of the NCAR Community Climate Model: CCM3, J. Clim., 11, 1151-1178, 1998b.
Lacis, A. A., and V. Oinas, A description of the correlated k- distribution method for modeling nongray gaseous absorption, ther- mal emission, and multiple scattering in vertically inhomogeneous atmospheres, J. Geophys. Res., 96, 9027-9074, 1991.
Liang, X.-Z., and W.-C. Wang, Cloud overlap effects on general cir- culation model climate simulations, J. Geophys. Res., 102, 11,039- 11,047, 1997.
Mlawer, E. J., and S. A. Clough, Shortwave and longwave enhance- ments in the rapid radiative transfer model, paper presented at the 7th Atmospheric Radiation Measurement (ARM) Science Team Meeting, U.S. Dep. of Energy, San Antonio, Texas, March 3, 1997.
Mlawer, E. J., S. J. Taubman, P. D. Brown, M. J. Iacono, and S. A. Clough, Radiative transfer for inhomogeneous atmospheres: RRTM, a validated correlated-k model for the longwave, J. Geophys. Res., 102, 16,663-16,682, 1997.
Morcrette, J.-J., S. A. Clough, E. J. Mlawer, and M. J. Iacono, Impact of a validated radiation scheme, RRTM, on the ECMWF model climate and 10-day forecasts, ECMWF Tech. Memo. 252, 47 pp., Eur. Cent. for Medium-Range Weather Forecasts, Reading, England, 1998.
Moritz, R. E., and D. H. Perovich (Eds.), Surface heat budget of the Arctic Ocean science plan, ARCSS/OAH Rep. 5, 64 pp., Univ. of Wash., Seattle, 1996.
Phillips, T. J., A summary documentation of the AMIP models, PC- MDI Rep. 18, UCRL-ID-116384, Lawrence Livermore Natl. Lab., Livermore, Calif., 1994.
Pinto, J. O., J. A. Curry, and C. W. Fairall, Radiative characteristics of the Arctic atmosphere during spring as inferred from ground-based measurements, J. Geophys. Res., 102, 6941-6952, 1997.
Roberts, R. E., J. E. A. Selby, and L. M. Biberman, Infrared contin- uum absorption by atmospheric water vapor in the 8-12 tzm win- dow, Appl. Opt., 15, 2085-2090, 1976.
Schwarzkopf, M.D., and V. Ramaswamy, Radiative effects of CH4, N20 , halocarbons and the foreign-broadened H20 continuum: A GCM experiment, J. Geophys. Res., 104, 9467-9488, 1999.
Slingo, A., and M. J. Webb, The spectral signature of global warming, Q. J. R. Meteorol. Soc., 123, 293-307, 1997.
Slingo, A., J. A. Pamment, and M. J. Webb, A 15-year simulation of the clear sky greenhouse effect using the ECMWF Reanalysis: Fluxes and comparisons with ERBE, J. Clim., 11,690-708, 1998.
Stokes, G. E., and S. E. Schwartz, The Atmospheric Radiation Mea- surement (ARM) Program: Programmatic background and design of the cloud and radiation testbed, Bull. Am. Meteorol. Soc., 75, 1201-1221, 1994.
Tobin, D.C., L. L. Strow, W. J. Lafferty, and W. B. Olson, Experi- mental investigation of the self and N2-broadened continuum within the •'2 band of water vapor, Appl. Opt., 35, 4724-4734, 1996.
Tobin, D.C., et al., Downwelling spectral radiance observations at the SHEBA ice station: Water vapor continuum measurements from 17 to 26 tzm, J. Geophys. Res., 104, 2081-2092, 1999.
Walden, V. P., S. G. Warren, and F. J. Murcray, Measurement of the downwelling longwave radiation spectrum over the Antarctic Pla- teau and comparison with a line-by-line radiative transfer model for clear skies, J. Geophys. Res., 103, 3825-3846, 1998.
M. J. Iacono, E. J. Mlawer, and S. A. Clough, Atmospheric and Environmental Research, 840 Memorial Drive, Cambridge, MA 02139-3771. ([email protected])
J.-J. Morcrette, European Center for Medium-Range Weather Forecasts, Shinfield Park, Reading, UK, RG2 9AX.
(Received September 3, 1999; revised January 18, 2000; accepted February 4, 2000.)
Copyright © 2022 FDOKUMEN