Efficient Annotation of Semantic Segmentation Datasets for ...
Water Resour Manage (2011) 25:1075–1086DOI 10.1007/s11269-010-9657-1
An Application of GPCC and NCEP/NCAR Datasetsfor Drought Variability Analysis in Iran
Tayeb Raziei · Isabella Bordi · Luis Santos Pereira
Received: 14 November 2009 / Accepted: 19 April 2010 /Published online: 8 May 2010© Springer Science+Business Media B.V. 2010
Abstract The lack of reliable and updated precipitation datasets is the most im-portant limitation that hinders establishing a drought monitoring and early warningsystem in Iran. To overcome this obstacle, we have evaluated the applicability ofGPCC and NCEP/NCAR precipitation datasets for drought analysis in Iran. Forthis purpose, drought variability across the country has been analyzed through thestandardized precipitation index (SPI) on 12-month time scale based on the commonperiod 1951–2005. For each dataset, by applying the principal component analysis(PCA) to the SPI field and Varimax rotation, the studied area has been regionalizedinto a few distinctive sub-regions characterized by independent climatic variability.Results have been checked against observations at 32 rain gauge stations havingreliable data for the study period. Both GPCC and NCEP/NCAR datasets identifythe same sub-regions of drought variability and they are in good agreement withobservations. However, the NCEP rotated principal component scores associatedwith the sub-regions show different time variability with respect to the behaviourscaptured by GPCC, on one hand, and observations, on the other hand. It seemsthat, in central Iran such differences concern mainly the period before the seventies.Thus, the results suggest that GPCC dataset is a useful tool for drought monitoringin Iran and it can be used to complement the information provided by rain gauge
T. RazieiSoil Conservation and Watershed Management Research Institute, Tehran, Irane-mail: [email protected]
I. Bordi (B)Department of Physics, Sapienza University of Rome, Rome, Italye-mail: [email protected]
L. S. PereiraInstitute of Agronomy, Technical University of Lisbon, Lisbon, Portugale-mail: [email protected]

1076 T. Raziei et al.
observations. The NCEP/NCAR reanalysis dataset shows a better agreement withobservations for the period 1970–2005 than for 1951–2005, and its discrepancies in theregional time variability of drought with respect to GPCC and observations shouldbe taken into account when periods before the seventies are considered.
Keywords Drought variability · Principal component analysis · Reanalysis data ·Standardized precipitation index
1 Introduction
We usually tend to focus on drought when it is occurring and to react when crisesstrike. Recent experiences and developments on drought knowledge are encouragingsocieties to shift from the traditional crisis-based management to a risk managementapproach (Wilhite et al. 2000). The difficulty in adopting the latter approach is mainlydue to the lack of reliable and updated data that are unable to fulfil the differentcomponents of drought risk analysis (Hayes et al. 2004). Drought monitoring is thefirst step of drought risk assessment and it may be an easy or difficult task dependingon the availability of climatological records.
While some developed countries, such as USA and Australia, enjoy drought mon-itoring and early warning systems, the lack of updated and reliable meteorologicaldata is still the major limitation in establishing such useful tools in many developingcountries like Iran. For drought monitoring and in assessing dry/wet periods in anygiven area, it is highly desirable to have at hand a dataset that: (1) is easy to access,(2) uniformly covers the area of interest, (3) has a time-duration sufficiently long tobe trustworthy in a statistical sense and (4) is optimal in the sense that it is capableof consistently capturing dry and wet events. Usually, the available records fulfilone or more of these requirements, but not all of them. In Iran, the organizationsresponsible for collecting meteorological data delay 3 to 5 years in publishing theupdated data. So, the lack of updated data is one of the most important obstaclesfor drought monitoring. Moreover, many stations’ records in Iran have substantialgaps, leading to many low quality and in-homogeneity problems. The shortness ofclimatological records represents a limitation since the stations with the longestrecords are very limited and sparsely distributed across the country. Also, the highspatial and temporal variability of precipitation over Iran, the frequent dry periodsand the increasing water demands for an ever growing population, as well as forindustry and economic development, including irrigation, aggravate water scarcityand make difficult a rationale water management (Raziei et al. 2009). Thus, itis highly desirable to have an updated dataset for Iran that allows capturing thehistorical drought occurrences and their spatial variability. For this purpose, twokinds of data are nowadays available: the gridded data based on observations andthe reanalysis data based on assimilation schemes.
The Global Precipitation Climatology Centre (GPCC) has produced and releasedseveral products, among them the Full Data Reanalysis Product Version 4 consistingof global land surface monthly precipitation at different spatial resolutions (Rudolfand Schneider 2005; Schneider et al. 2008). The analysis is based on all stations, near

GPCC and NCEP/NCAR Datasets for Drought Variability Analysis 1077
real-time and non real-time, and covers the period 1901–2007. These data satisfy thecriteria described above and, therefore, may be used to assess dry/wet periods overthe globe for approximately the last hundred years. Dinku et al. (2008) have recentlyevaluated the performance of the GPCC Full Data Reanalysis Product Version 3,covering the period 1951–2004, using a gauge network over complex topography inAfrica. However, for what concerns the new Version 4 of GPCC Full Data Product,due to its recent update in September 2008, no studies are yet documented inthe international literature, motivating our attempt to use this dataset for droughtmonitoring in Iran.
The reanalysis products represent another source of data. In the latest decade orso, two of such reanalyses became easily available: one produced by the NationalCenters for Environmental Prediction/National Center for Atmospheric Research(NCEP/NCAR; Kalnay et al. 1996) and the other one by the European Centrefor Medium-Range Weather Forecasts (ECMWF) ERA-40 (Uppala et al. 2005).Precipitation, which is the main variable for drought assessment, is not a primaryvariable of reanalysis products, i.e. precipitation observations are not assimilatedinto the model, thus precipitation fields generated by the reanalysis system areshort-range model forecast accumulations. Some authors (e.g., Bordi et al. 2006)have attempted to evaluate the performance of these reanalysis data in capturingdry/wet periods around the globe. Since, differently from ERA-40 product thatcovers the period 1957–2002, the NCEP dataset is continually updated every monthfrom 1948, in the present study we use the latter for our purpose that is to evaluate theapplicability of GPCC and NCEP/NCAR precipitation datasets for drought analysisin Iran. The suitability of these datasets for drought variability analysis has beenchecked against observations at 32 rain gauges that have the longest and most reliabledata records.
Dry and wet conditions have been assessed applying the Standardized Precipi-tation Index (SPI) as defined by McKee et al. (1993). The index is widely usedin drought monitoring centres and in several drought studies (Lloyd-Hughes andSaunders 2002; Bonaccorso et al. 2003; Tsakiris and Vangelis 2004; Bordi and Sutera2004; Paulo and Pereira 2007, 2008). The SPI, based only on precipitation, is in facta useful tool for capturing the climate variability associated with water shortageor surplus in different areas, and has several advantages (Keyantash and Dracup2002). Recently, Raziei et al. (2008), in providing an analysis of the relationshipbetween precipitation regimes’ regionalization in western Iran and regional droughtvariability, suggested that the Precipitation Index, due to its shortcomings, was nota proper index for drought analysis, while the SPI appeared to be more suitable.Thus, in the present study the SPI has been considered and the Principal ComponentAnalysis (PCA) with Varimax rotation has been applied to the SPI field for analyzingthe space and time variability of drought across Iran. Former application by Razieiet al. (2009) of PCA to the SPI field for assessing drought variability in Iran proved tobe appropriate. In that study the analysis was limited to western Iran for the period1966–2000 and only NCEP/NCAR and rain gauge observations have been consid-ered. In the present study the analysis is extended to the whole Iran for the longerperiod 1951–2005 and the performance of both GPCC and NCEP/NCAR datasets inassessing drought variability within the country is checked against observations at 32rain gauge stations.

1078 T. Raziei et al.
2 Data and Methods
Data used for the analysis are monthly precipitation from GPCC Full Data ProductVersion 4, from NCEP/NCAR reanalysis dataset, and from 32 synoptic stationshaving the longest historical data records.
The Full Data Product Version 4, updated in September 2008, is a gauge-basedgridded monthly precipitation dataset for the global land surface, available in spatialresolutions of 0.5◦ × 0.5◦, 1.0◦ × 1.0◦ and 2.5◦ × 2.5◦ geographical longitude bylatitude. The dataset covers the period 1901–2007 and is based on both non real-timeand real-time stations (Schneider et al. 2008). The data global coverage per monthvaries from less than 10,000 to more than 45,000 stations along the time section, andthe spatial distribution of Iranian stations is quite uniformly with the exception ofcentral Iran. Several quality controls have been applied before gridding (Beck et al.2005). In the present study, we have considered the spatial resolution 2.5◦ × 2.5◦longitude by latitude and only the grid points over Iran.
The NCEP/NCAR monthly precipitation rates cover the period from January1948 to present. Precipitation data are available on a regular grid 1.9◦ × 1.9◦ inlongitude and latitude and have been derived from the primary meteorological fieldsof the NCEP medium range forecasting spectral model based on the assimilation ofa set of observations (Kalnay et al. 1996). In the present study, we have consideredonly the grid points over Iran.
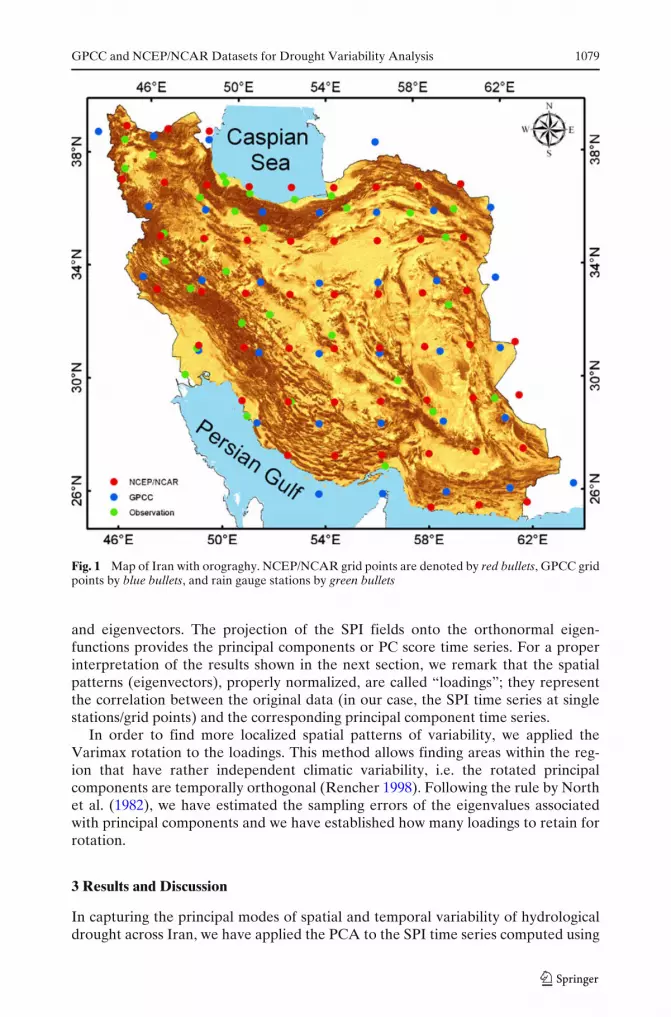
To evaluate the applicability and performance of GPCC and NCEP/NCARdata sets for drought monitoring in Iran, monthly precipitation time series from32 historical Iranian synoptic rain gauge stations have been considered. Monthlyprecipitation data have been provided by the Iranian Meteorological Organizationand have been considered in the GPCC analysis system. Most of the time records forthese stations vary from 1951 to 2005, which is the latest release of meteorologicaldata in Iran. However, a few stations (4) have available data only from 1953. Inthese cases, missing values for the years 1951 and 1952 have been estimated fromthe nearest GPCC grid points applying the regression technique (this was supportedby the high correlation found between observed precipitation and that from GPCCgrid points). The time series considered have a few missing values and are the mostreliable precipitation data available for meteorological and climatological analyses inIran. Missing values have been estimated using MOVE4 technique (Maintenance ofVariance Extension, Vogel and Stedinger 1985). The location of rain gauge stationsand grid points associated with GPCC and NCEP/NCAR datasets are shown inFig. 1.
In assessing hydrological drought conditions over Iran, the SPI on 12-monthtime scale has been computed for GPCC, NCEP/NCAR and observation datasetsfor the common period 1951–2005. The SPI is based on the precipitation fieldalone and its computation for any location is based on the long-term precipitationrecord accumulated over the selected time scale. The long-term record is fitted toa probability distribution, usually a Gamma distribution, which is then transformedthrough an equal-probability transformation into a normal distribution. The index isa useful tool for monitoring the different kinds of drought and comparing climaticconditions of areas governed by different hydrological regimes.
To capture the patterns of drought co-variability at different stations/grid points,the PCA (Rencher 1998) was applied to the SPI time series. The method consists ofcomputing the covariance matrix of the SPI field with the corresponding eigenvalues
GPCC and NCEP/NCAR Datasets for Drought Variability Analysis 1079
Fig. 1 Map of Iran with orograghy. NCEP/NCAR grid points are denoted by red bullets, GPCC gridpoints by blue bullets, and rain gauge stations by green bullets
and eigenvectors. The projection of the SPI fields onto the orthonormal eigen-functions provides the principal components or PC score time series. For a properinterpretation of the results shown in the next section, we remark that the spatialpatterns (eigenvectors), properly normalized, are called “loadings”; they representthe correlation between the original data (in our case, the SPI time series at singlestations/grid points) and the corresponding principal component time series.
In order to find more localized spatial patterns of variability, we applied theVarimax rotation to the loadings. This method allows finding areas within the reg-ion that have rather independent climatic variability, i.e. the rotated principalcomponents are temporally orthogonal (Rencher 1998). Following the rule by Northet al. (1982), we have estimated the sampling errors of the eigenvalues associatedwith principal components and we have established how many loadings to retain forrotation.
3 Results and Discussion
In capturing the principal modes of spatial and temporal variability of hydrologicaldrought across Iran, we have applied the PCA to the SPI time series computed using

1080 T. Raziei et al.
GPCC, NCEP/NCAR and rain gauge data. Based on the screen plot and the North’srule of thumb (North et al. 1982), we have selected for each data set the first fourloadings for Varimax rotation. The cumulative percentages of the total varianceexplained by the selected PCs for GPCC, NCEP/NCAR and observations are 72.2%,77.5% and 58.5%, respectively. In Fig. 2 the rotated loadings (R-Loadings) for the
Fig. 2 Rotated loadings of SPI field obtained for: a–d GPCC, e–h NCEP/NCAR and i–l observationdatasets

GPCC and NCEP/NCAR Datasets for Drought Variability Analysis 1081
three datasets are displayed and the percentages of the total variance explained byeach PC are listed in Table 1.
Figure 2a–d refer to the spatial patterns obtained for GPCC dataset. The firstrotated loading is characterized by high positive values in south-eastern Iran, whileR-Loading 2 has high values on grid points located in central-western area. R-Loading 3 shows positive values greater than 0.6 in north-western Iran, and R-Loading 4 identifies an area in the north of the country, close to the Caspian sea, as adistinctive sub-region with positive values. As shown in Fig. 2e–l, the NCEP/NCARdataset and the observations identify similar spatial patterns of variability. Resultsfor the three sources of data are therefore coherent. Note that, in all cases, thefourth rotated loadings explain small percentages of the total variance (about 8–9%), suggesting that the robustness of the northern sub-region should be checkedusing longer time records. Moreover, in the case of the observations, R-Loading 4reaches relative high values (0.4–0.6) only in a limited area close to the CaspianSea, indicating that the time variability of the SPI is not well captured by thecorresponding rotated PC score. Thus, this feature should be analyzed further usinga denser rain gauge network.
In Fig. 3 the time series of the rotated PC scores (RPCs) for GPCC andNCEP/NCAR are displayed and compared with the ones obtained using observa-tions. The correlation coefficients between the RPC time series for the three datasetsare listed in Table 2, and those associated with the same sub-region are denotedin italic. From Fig. 3a–d and Table 2 it can be noted that the GPCC RPC scores,associated with the rotated loadings shown in Fig. 2a–d, are in good agreement withthe counterparts obtained for observations. All the RPC time series are characterizedby multi-year variability and there are not noticeable (statistically significant) long-term linear trends for the time section here considered. For what concerns the NCEPRPCs (Fig. 3e–h), it seems that the rotated scores associated to the south-easternand north-western sub-regions (Fig. 3e and g, respectively) are in a satisfactoryagreement with the counterparts RPCs obtained for observations (see Table 2), whilenoticeable differences are found for the rotated scores associated with the other twosub-regions (Fig. 3f, h). In particular, both NCEP and observations capture a lineartrend (here not shown) towards negative values (dry periods) in the RPC scoresassociated with the north-western region (Fig. 3g): the fitting linear trend for NCEPaccounts for about 27% of variability, while that for observations 18%. Also, for thecentral sub-region (Fig. 3f) a linear trend is detectable, which is towards negativevalues for NCEP, accounting for about 33% of the RPC score variability, while it istowards positive values for observations and explains about 11% of variability.
Table 1 Percentages of the explained variances of un-rotated and Varimax rotated PCs for GPCC,NCEP/NCAR and observations
PC GPCC NCEP OBS.
Un-rotated Varimax rotated Un-rotated Varimax rotated Un-rotated Varimax rotated(%) (%) (%) (%) (%) (%)
PC1 45.4 25.5 45.3 28.1 31.6 20.4PC2 13.3 23.8 16.8 26.1 11.6 16.6PC3 8.4 15.1 8.5 14.5 8.6 12.4PC4 5.0 7.7 7.0 8.9 6.7 9.2Total 72.2 72.2 77.5 77.5 58.5 58.5

1082 T. Raziei et al.
Fig. 3 Standardized RPC score time series for GPCC and NCEP/NCAR datasets (red lines), andobservations (black lines)
Thus, GPCC, NCEP/NCAR and rain gauge datasets are in good agreement inidentifying the four sub-regions as the principal spatial modes of drought variability.However, these regions have different and independent time variability that is notunivocally represented by the three datasets.
As noted before, NCEP RPCs associated with north-western and south-easternregions show satisfactory correlations with the counterpart RPCs of both GPCC andobservations (correlation coefficients greater than 0.5), while very low correlations

GPCC and NCEP/NCAR Datasets for Drought Variability Analysis 1083
Table 2 Correlation coefficients between the RPCs for GPCC, NCEP/NCAR and observations
GPCC OBS.RPC RPC1 RPC2 RPC3 RPC4 RPC1 RPC2 RPC3 RPC4
OBS. RPC1 0.15 0.89 −0.09 0.17 1 0 0 0RPC2 −0.10 0.18 0.79 −0.10 0 1 0 0RPC3 0.85 0.01 0.12 −0.12 0 0 1 0RPC4 0.07 −0.14 0.38 0.66 0 0 0 1
NCEP RPC1 0.28 0.22 0.14 −0.27 0.08 0.14 0.43 −0.21RPC2 0.72 0.27 −0.08 0.27 0.43 −0.09 0.49 0.20RPC3 −0.03 −0.25 0.54 0.15 −0.36 0.54 −0.03 0.19RPC4 0.07 0.01 0.34 0.25 0.06 0.27 0.20 0.30
Correlation coefficients between RPCs associated with the same sub-regions are in italics
are found for the other two sub-regions, i.e. northern and central-western regions. Tobetter understand these discrepancies, let us focus on northern and central-westernregions.
For the northern region, differences between NCEP and observation RPCs(Fig. 3h) are noticeable in all the time record, suggesting an overall disagreementbetween the SPI time series in the area. For the central-western region (Fig. 3f),instead, the main differences between the two rotated scores seem to be particularlyevident for the period 1951–1970. This is supported by the correlation maps (Fig. 4)between the SPI time series computed using NCEP/NCAR and observations forthe time sections 1951–2005 and 1970–2005. The correlation coefficients have beencomputed after gridding the SPI data on the common grid 1o× 1o in latitude andlongitude. Considering the period 1951–2005 (Fig. 4a), high correlations characterizethe north-western and south-eastern regions of Iran, while very low correlationsare found in central-western and northern regions. When the period 1970–2005 isconsidered (Fig. 4b), and the SPI is re-computed using this calibration period, thecorrelation map suggests an overall agreement among the two datasets. However,low correlation values remain and are limited to north-eastern (close to the Caspiansea) and central-eastern sectors.
Fig. 4 Correlation map between the SPI computed using NCEP/NCAR data and observations forthe time sections: a 1951–2005 and b 1970–2005

1084 T. Raziei et al.
In view of these results, we have repeated our analysis for the period 1970–2005.Results for the two datasets (NCEP and observations, here not shown) suggestthat the first two loadings can be retained for Varimax rotation. Two sub-regionsare identified: northern (including Caspian sea region) and central-southern withindependent climatic variability. The RPCs obtained from the two datasets show sim-ilar time behaviours, suggesting a very good agreement between NCEP/NCAR andobservations (correlation coefficients of about 0.8). This means that the emergenceof the other two distinct sub-regions, i.e. central-western and northern, are stronglyrelated to the SPI time variability in the period 1951–1970.
Moreover, for the GPCC dataset, considering the shorter period 1970–2005, thefirst four loadings can be retained for Varimax rotation. As a consequence, four sub-regions result from the analysis as obtained for the longer period 1951–2005. TheRPCs associated with the northern and southern regions are in good agreement withthose obtained for NCEP and observations. However, further analysis is needed tobetter understand both the disagreement between NCEP and observations in centralregions and the stability of the four sub-regions as a function of the record length.
4 Conclusions
In the present paper, the application of GPCC and NCEP/NCAR datasets fordrought variability analysis in Iran has been investigated against observations at32 historical rain gauge stations. The common period 1951–2005 has been consid-ered for the study, which was based on the PCA of the SPI on 12-month timescale. The aim was to identify the sub-regions within the country characterized byindependent drought variability. Results suggest that GPCC, NCEP/NCAR andobservations identify four sub-regions: south-eastern, central-western, north-westernand northern (close to the Caspian Sea) regions. However, while both GPCCand observations agree in identifying the time variability of the SPI in the foursub-regions, the NCEP/NCAR shows different time behaviour. The discrepanciesbetween the NCEP RPC time series and those for GPCC and observations areparticularly noticeable for the northern and central-western areas, and for the period1951–1970. Since more observations were added into the reanalysis assimilationscheme along the years, it is expected that the errors in NCEP reanalysis are greaterfor the first decades than for recent years, especially in regions situated in the leeside of mountains like central Iran. Moreover, since reanalysis precipitation data arenumerical model forecasts, and no precipitation observations are assimilated into thereanalysis system while GPCC is based on rain gauge station data (including the 32Iranian stations here considered), it is not surprising that reanalysis does not compareas well with observations as GPCC product. It should be noted that our findingsare consistent with the results shown in Janowiak et al. (1998), where the authorsprovide a comparison over the period 1988–1995 between NCEP/NCAR reanalysisprecipitation data and rain gauge-satellite combined precipitation estimates of theGlobal Precipitation Climatology Project (GPCP). It was found in fact that whilelarge-scale features compared well between the two datasets, substantial differenceswere found on regional scales. However, at this stage of the analysis the originof these differences (probably related to orographic effects not well captured byreanalysis model, and/or to the coarse spatial resolution of observations in centralIran) remains not clear and needs further investigations.

GPCC and NCEP/NCAR Datasets for Drought Variability Analysis 1085
Concluding, the study suggests that GPCC dataset is a useful tool for droughtanalysis in Iran and can be used to complement the information provided by raingauge observations. The NCEP/NCAR reanalysis dataset shows a better agreementwith observations for the shorter period 1970–2005 than for the whole period 1951–2005, and its discrepancies with GPCC and observations in central Iran should betaken into account when periods before the seventies are considered. Further workshould be done to investigate the stability of the four sub-regions with respect tothe record length and the time scale used for the SPI computation (Vicente-Serrano2006). Finally, it should be interesting to investigate the space and time variabilityof hydrological drought captured by the three datasets applying different droughtindices as the reconnaissance drought index (Tsakiris et al. 2006), the streamflowdrought index (Nalbantis and Tsakiris 2009) or the Palmer Drought Severity Index.
Acknowledgements NCEP/NCAR data were obtained from the NOAA/CDC web sitehttp://www.cdc.noaa,gov, while GPCC data were freely provided by the Deutscher Wetterdienstthrough their web site http://www.dwd.de. Rain gauge data were provided by the Iranian Meteo-rological Organization through their web site http://www.irimet.net/irimo/synopH/index1es.htm. Wethank Prof. Alfonso Sutera for his useful suggestions and two anonymous reviewers for their fruitfulcomments that helped improving the presentation of the paper.
References
Beck C, Grieser J, Rudolf B (2005) A new monthly precipitation climatology for the global landareas for the period 1951 to 2000. DWD, Klimastatusbericht KSB 2004, ISSN 1437-7691 (print),ISSN 1616-5063 (Internet), ISBN 3-88148-402-7, pp 181–190
Bonaccorso B, Bordi I, Cancelliere A, Rossi G, Sutera A (2003) Spatial variability of drought: ananalysis of the SPI in Sicily. Water Resour Manag 17:273–296
Bordi I, Sutera A (2004) Drought variability and its climatic implications. Glob Planet Change40:115–127
Bordi I, Fraedrich K, Petitta M, Sutera A (2006) Large-scale assessment of drought variability basedon NCEP/NCAR and ERA-40 re-analyses. Water Resour Manag 20:899–915
Dinku T, Connor SJ, Ceccato P, Ropelewski CF (2008) Comparison of global gridded precipitationproducts over a mountainous region of Africa. Int J Climatol 28:1627–1638
Hayes MJ, Wilhelmi OV, Knutson CL (2004) Reducing drought risk: bridging theory and practice.Natural Hazard Rev 5:106–113
Janowiak JE, Gruber A, Kondragunta CR, Livezey RE, Huffman GJ (1998) A comparison of theNCEP–NCAR reanalysis precipitation and the GPCP rain gauge–satellite combined dataset withobservational error considerations. J Climate 11:2960–2979
Kalnay E et al (1996) The NCEP/NCAR 40-year reanalysis project. Bull Amer Meteor Soc 77:437–471
Keyantash J, Dracup JA (2002) The quantification of drought: an evaluation of drought indices. BullAmer Meteor Soc 83:1167–1180
Lloyd-Hughes B, Saunders MA (2002) A drought climatology for Europe. Int J Climatol 22:1571–1592
McKee TB, Doesken NJ, Kleist J (1993) The relationship of drought frequency and duration to timescales. In: Proc. of the 8th conference on applied climatology, 17–22 January, Anaheim, CA,American Meteorological Society, Boston, MA, pp 179–184
Nalbantis I, Tsakiris G (2009) Assessment of hydrological drought revised. Water Resour Manag23:881–897
North GR, Bell TL, Cahalan RF (1982) Sampling errors in the estimation of empirical orthogonalfunctions. Mon Weather Rev 110:699–706
Paulo AA, Pereira LS (2007) Prediction of SPI drought class transitions using Markov chains. WaterResour Manag 21:1813–1827
Paulo AA, Pereira LS (2008) Stochastic prediction of drought class transitions. Water Resour Manag22:1277–1296

1086 T. Raziei et al.
Raziei T, Bordi I, Pereira LS (2008) A precipitation-based regionalization for Western Iran andregional drought variability. Hydrol Earth Syst Sci 12:1309–1321
Raziei T, Saghafian B, Paulo AA, Pereira LS, Bordi I (2009) Spatial and temporal variability ofdrought in western Iran. Water Resour Manag 23:439–455
Rencher AC (1998) Multivariate statistical inference and applications. John Wiley & Sons, IncRudolf B, Schneider U (2005) Calculation of gridded precipitation data for the global land-surface
using in-situ gauge observations. In: Proceedings of the 2nd workshop of the internationalprecipitation working group IPWG, Monterey October 2004, EUMETSAT, ISBN 92-9110-070-6, ISSN 1727-432X, pp 231–247
Schneider U, Fuchs T, Meyer-Christoffer A, Rudolf B (2008) Global precipitation analysis productsof the GPCC. Global Precipitation Climatology Centre (GPCC), DWD, Internet Publication(http://www.dwd.de), pp 1–12
Tsakiris G, Vangelis H (2004) Towards a drought watch system based on spatial SPI. Water ResourManag 18:1–12
Tsakiris G, Pangalou D, Vangelis H (2006) Regional drought assessment based on the reconnais-sance drought index (RDI). Water Resour Manag 21:821–833
Uppala S et al (2005) The ERA-40 re-analysis. Q J R Meteorol Soc 131:2961–3012Vicente-Serrano SM (2006) Differences in spatial patterns of drought on different time scales: an
analysis of the Iberian Peninsula. Water Resour Manag 20:37–60Vogel RM, Stedinger JR (1985) Minimum variance streamflow record augmentation procedures.
Water Resour Res 21:715–723Wilhite DA, Hayes MJ, Knutson C, Smith KH (2000) Planning for drought: moving from crisis to
risk management. J Am Water Resour Assoc 36:697–710
Copyright © 2022 FDOKUMEN