KARTIEK KANDURI: Integration of genome-wide datasets to ...
54
TURUN YLIOPISTON JULKAISUJA – ANNALES UNIVERSITATIS TURKUENSIS SARJA - SER. D OSA - TOM. 1490 | MEDICA - ODONTOLOGICA | TURKU 2020 INTEGRATION OF GENOME - WIDE DATASETS TO UNDERSTAND REGULATION OF HUMAN T - HELPER CELL DIFFERENTIATION Kartiek Kanduri
-
Upload
khangminh22 -
Category
Documents
-
view
1 -
download
0
Transcript of KARTIEK KANDURI: Integration of genome-wide datasets to ...

Kartiek KanduriD
1490A
NN
ALES U
NIV
ERSITATIS TURK
UEN
SIS
ISBN 978-951-29-8070-3 (PRINT)ISBN 978-951-29-8071-0 (PDF)
ISSN 0355-9483 (Print)ISSN 2343-3213 (Online)
Pain
osal
ama
Oy,
Turk
u, F
inla
nd 2
020
TURUN YLIOPISTON JULKAISUJA – ANNALES UNIVERSITATIS TURKUENSIS
SARJA - SER. D OSA - TOM. 1490 | MEDICA - ODONTOLOGICA | TURKU 2020
INTEGRATION OF GENOME-WIDE DATASETS
TO UNDERSTAND REGULATION OF
HUMAN T-HELPER CELL DIFFERENTIATION
Kartiek Kanduri


TURUN YLIOPISTON JULKAISUJA – ANNALES UNIVERSITATIS TURKUENSIS SARJA – SER. D OSA – TOM. 1490 | MEDICA – ODONTOLOGICA | TURKU 2020
Kartiek Kanduri
INTEGRATION OF GENOME-WIDE DATASETS TO UNDERSTAND REGULATION OF HUMAN T-HELPER CELL
DIFFERENTIATION

University of Turku
Faculty of Medicine Department of Medical Microbiology and Immunology Turku Doctoral Programme of Molecular Medicine Turku Bioscience Centre, University of Turku and Åbo Akademi University
Supervised by
Academy Professor Riitta Lahesmaa M.D., Ph.D. Turku Bioscience Centre University of Turku and Åbo Akademi University Turku, Finland
Associate Professor Harri Lähdesmäki DSc. Department of Computer Science Aalto University School of Science Espoo, Finland
Reviewed by
Docent Merja Heinäniemi Institute of Biomedicine School of Medicine University of Easter Finland Kuopio, Finland
Dr. Gosia Trynka Wellcome Sanger Institute Hinxton, Cambridgeshire, United Kingdom
Opponent
Professor Garry Wong Faculty of Health Sciences University of Macau Macau, China
The originality of this publication has been checked in accordance with the University of Turku quality assurance system using the Turnitin OriginalityCheck service. ISBN 978-951-29-8070-3 (PRINT) ISBN 978-951-29-8071-0 (PDF) ISSN 0355-9483 (Print) ISSN 2343-3213 (Online) Painosalama Oy, Turku, Finland 2020

3
To my family

4
UNIVERSITY OF TURKU Faculty of Medicine Department of Medical Microbiology and Immunology KARTIEK KANDURI: Integration of genome-wide datasets to understand regulation of human T-helper cell differentiation Doctoral Dissertation, 112 pp. Turku Doctoral Programme of Molecular Medicine January 2020
ABSTRACT
T-helper cells are an important part of the immune system and adaptive immunity. Over the course of the immune response, under the influence of various cytokines, T-helper cells differentiate into various subsets each of which have a specific function. Despite the generation of large amounts of data by recent high-throughput studies, the picture of human T-helper cell differentiation is far from complete. The goal of this thesis is to identify and characterize molecular elements potentially involved in T-helper cell differentiation and immune response through generating valuable datasets on immune cells using microarrays and high-throughput sequencing and using a range of bioinformatics methods to analyse the data. To achieve this goal, in the first study, human Th1 and Th2 cell subsets were profiled using transcriptomics and the resulting mRNA and long non-coding (lnc) RNA data was integrated with epigenomics data to understand the relationship between the two during early T-helper cell differentiation. The results revealed several new transcripts differentially regulated by Th1 and Th2 cells during their early specification providing candidates for further studies. In the second study, lncRNAs in autoimmune disease loci were characterized in granulocytes, monocytes, natural killer cells, B cells, memory T cells, naïve CD4+ T cells, and naïve CD8+ T cells. Differentially expressing lncRNAs were found to be enriched in those loci compared to the reference genome. The third study combined proteomics and transcriptomics data and revealed insights into T cell activation and signaling. Finally, the fourth study demonstrated the role of STAT3 in regulating other factors in Th17 differentiation. Moreover, STAT3 was found to bind to genomic loci with genetic variation previously associated with autoimmune diseases. The results of this thesis identify several factors important for immune cell subsets and characterize their role particularly in T-helper cell differentiation. The datasets generated as part of this thesis provide a valuable resource for the community.
KEYWORDS: T-helper cell, transcriptomics, bioinformatics, data analytics, lncRNA

5
TURUN YLIOPISTO Lääketieteellinen tiedekunta Lääketieteellinen mikrobiologia ja immunologia KARTIEK KANDURI: Integration of genome-wide datasets to understand regulation of human T-helper cell differentiation Väitöskirja, 112 s. Molekyylilääketieteen tohtoriohjelma toukokuu 2020
TIIVISTELMÄ
T-auttajasolut ovat keskeisiä immuunijärjestelmän ja hankitun immuniteetin toiminnalle. Immuunivasteen aikana T-auttajasolut erilaistuvat eri sytokiinien vaikutuksesta erilaisiksi alatyypeksi, joista kullakin on erityinen tehtävä ja toiminta. Vaikka tuoreet tutkimukset ovat tuottaneet “high-throughput”-menetelmin suuria datamääriä, kokonaiskuva T-auttajasolujen erilaistumisesta on vielä muotoutumatta. Tämän väitöskirjan tavoitteena on identifioida ja karakterisoida T-solujen erilaistumiselle ja immuunivasteelle tärkeitä uusia molekyläärisiä tekijöitä tuottamalla immuunijärjestelmän soluista arvokasta dataa ja analysoimalla aineistoja bioinformatiikan menetelmin. Tavoitteen saavuttamiseksi ihmisen Th1- ja Th2-solujen epigenomiikkatulokset integroitiin transkriptomiikkatuloksiin (mRNA ja ei-koodaava RNA, lncRNA), joka valaisi näiden välisiä suhteita solujen varhaisen erilaistumisen aikana. Tutkimuksessa löydettiin jatkotutkimuksiin runsaasti uusia kandidaatteja, joita säädellään Th1- ja Th2-solujen aikaisen erilaistumisen aikana eri tavoin. Toisessa työssä ei-koodaavien RNA:iden ilmeneminen immuunijärjestelmän eri solutyypeissä mitattiin. Näiden immuunisolujen lncRNA:iden osoitettiin rikastuneen autoimmuunisairauksiin yhdistettyihin genomin osiin enemmän kuin muihin genomin osiin. Kolmas työ yhdisti proteomiikka- ja transkriptomiikka-tuloksia avaten uusia näköaloja T-solujen aktivaatioon ja signalointiin. Neljännessä työssä osoitimme STAT3:n merkityksen muiden Th17-solujen erilaistumiselle tärkeiden tekijöiden säätelijänä. Lisäksi STAT3:n osoitettiin sitoutuvan genomissa sellaisiin paikkoihin, joissa on aikaisemmin osoitettu autoimmuunitauteihin assosioituvaa geneettistä vaihtelua. Tämän väitöskirjan tulokset identifioivat uusia immuunisoluille tärkeitä tekijöitä ja valottavat niiden merkitystä erityisesti T-solujen erilaistumiselle. Tuotetut ainestot tarjoavat arvokkaan resurssin tiedeyhteisölle.
AVAINSANAT: T-auttajasolu, transcriptomiikka, bioinformatiiikka, data-analyysi, lncRNA

6
Table of Contents
Abbreviations .................................................................................. 8
List of Original Publications ......................................................... 10
1 Introduction ........................................................................... 11
2 Review of the Literature ....................................................... 12 2.1 High-throughput methods and data analysis .......................... 12
2.1.1 DNA microarrays ......................................................... 12 2.1.1.1 Gene expression microarrays ....................... 13 2.1.1.2 SNP arrays ................................................... 14 2.1.1.3 ChIP- chip ..................................................... 14
2.1.2 High-throughput sequencing ....................................... 14 2.1.3 Data analysis for high-throughput studies .................... 15
2.1.3.1 Data analysis for microarrays ....................... 16 2.1.3.2 Data analysis for high-throughput
sequencing ................................................... 18 2.2 Genomics of T-helper cell differentiation ................................ 20
2.2.1 Immune system and T-helper subsets ......................... 20 2.2.2 High-throughput studies of T-helper subsets ............... 23
3 Aims ....................................................................................... 25
4 Materials and Methods ......................................................... 26 4.1 Ethics statement .................................................................... 26 4.2 CD4+ T-cell isolation and culturing (Study I, II, IV) ................. 26 4.3 PBMC isolation and immune cell subset sorting (Study II) ...... 27 4.4 RNA isolation and transcriptional profiling (Study I, II, III,
IV) .......................................................................................... 27 4.5 Analysis of microarray data (Study I, II, III, IV) ........................ 27 4.6 Analysis of high-throughput sequencing data (Study I) ........... 28 4.7 Analysis of high-throughput sequencing data (Study II) .......... 29 4.8 Lineage-specific genes/lncRNAs and their neighboring
enhancer and promoter marks ............................................... 29 4.9 Functional characterization of lncRNAs .................................. 30
5 Results and discussion ........................................................ 31 5.1 Identification and characterization of Th1- and Th2- specific
mRNA and lncRNAs ............................................................... 31

7
5.2 Characterization of lncRNAs located in auto-immune disease loci ............................................................................ 33
5.3 Transcriptome-wide changes of Lat-deficiency during CD4+ T cell activation ............................................................ 33
5.4 STAT3-regulated transcriptome during early Th17 cell differentiation .......................................................................... 34
6 Summary ................................................................................ 35
Acknowledgements ....................................................................... 36
References ..................................................................................... 38
Original Publications ..................................................................... 53

8
Abbreviations
AID auto-immune disease CeD coeliac disease ChIP chromatin immunoprecipitation CLI command line interface DE differentially expressed DNA deoxyribonucleic acid DNA-Seq DNA sequencing GUI graphical user interface HTS high throughput sequencing IBD inflammatory bowel disease IFNG interferon gamma IL2 interleukin 2 IL4 interleukin 4 iTreg inducible T regulatory cells JIA juvenile idiopathic arthritis LAMP Linux Apache MySQL PHP Lat Linker for activation of T-cells lincRNA long intergenic non-coding RNA lncRNA long non-coding RNA mRNA messenger RNA MySQL My structured query language NGS Next generation sequencing PacBio Pacific Biosciences PBC primary biliary cirrhosis PHP personal home page / hypertext preprocessor PS psoriasis PsCh primary sclerosing cholangitis RA rheumatoid arthritis RNA ribonucleic acid RNA-Seq RNA sequencing SNP single nucleotide polymorphism

9
SOLiD sequencing by oligonucleotide ligation and detection Th T helper cell WES whole exome sequencing WGS whole genome sequencing

10
List of Original Publications
This dissertation is based on the following original publications, which are referred to in the text by their Roman numerals:
I Kartiek Kanduri, Subhash Tripathi, Antti Larjo, Henrik Mannerström, Ubaid Ullah, Riikka Lund, R David Hawkins, Bing Ren, Harri Lähdesmäki*, and Riitta Lahesmaa*. 2015. “Identification of Global Regulators of T-Helper Cell Lineage Specification.” Genome Medicine 7 (1): 122. doi:10.1186/s13073-015-0237-0. (*Equal contribution)
II Barbara Hrdlickova, Vinod Kumar, Kartiek Kanduri, Daria V Zhernakova, Subhash Tripathi, Juha Karjalainen, Riikka J Lund, Yang Li, Ubaid Ullah, Rutger Modderman, Wayel Abdulahad, Harri Lähdesmäki, Lude Franke, Riitta Lahesmaa, Cisca Wijmenga and Sebo Withoff. 2014. “Expression Profiles of Long Non-Coding RNAs Located in Autoimmune Disease-Associated Regions Reveal Immune Cell-Type Specificity.” Genome Medicine 6 (10): 88. doi:10.1186/s13073-014-0088-0
III Romain Roncagalli, Simon Hauri, Fréderic Fiore, Yinming Liang, Zhi Chen, Amandine Sansoni, Kartiek Kanduri, Rachel Joly, Aurélie Malzac, Harri Lähdesmäki, Riitta Lahesmaa, Sho Yamasaki, Takashi Saito, Marie Malissen, Ruedi Aebersold, Matthias Gstaiger and Bernard Malissen. 2014. Quantitative proteomics analysis of signalosome dynamics in primary T cells identifies the surface receptor CD6 as a Lat adaptor-independent TCR signaling hub. Nature Immunology 2014 Apr;15(4):384-392. http://doi.org/10.1038/ni.2843
IV Subhash K. Tripathi, Zhi Chen, Antti Larjo, Kartiek Kanduri, Kari Nousiainen, Tarmo Äijo, Isis Ricaño-Ponce, Barbara Hrdlickova, Soile Tuomela, Essi Laajala, Verna Salo, Vinod Kumar, Cisca Wijmenga, Harri Lähdesmäki and Riitta Lahesmaa. (2017). Genome-wide Analysis of STAT3-Mediated Transcription during Early Human Th17 Cell Differentiation. Cell Reports, 19(9), 1888–1901. http://doi.org/10.1016/j.celrep.2017.05.013
The original publications have been reproduced with the permission of the copyright holders.

11
1 Introduction
The immune system plays a critical role in the survival of human beings. We are constantly exposed to and attacked by pathogens and the immune system mounts the defense of the body against such pathogens. The immune response is a complex process involving many cell types. Innate immunity, which we get by birth mounts a generic response to invading pathogens. While adaptive immune system retains a memory of previous pathogens by producing memory T cells and mounts an efficient defense when we are exposed to the same pathogen more than once. CD4+ T helper cells, which we study in the works presented here, are part of the adaptive immune system. Upon recognizing an antigen presented by a cell, a naïve T cell is activated and differentiate into various cytokine producing T helper subsets or memory T cells. CD4+ T helper cells enlist other cells of the immune system for antibody production and cleaning up pathogenic antigens. Any anomaly in this response by T-helper cells can lead to allergy or autoimmune disease states. There is evidence of involvement of Th1 and Th9 subsets in allergy, Th1 subsets in type 1 diabetes, Th1 and Th17 subsets in rheumatoid arthritis and inflammatory bowel disease. Over the course of the immune response, CD4+ T cells differentiate into various subsets. Understanding CD4+ T cell differentiation process is key to understanding the immune response and in turn useful in improving treatment regimen for allergy or autoimmune diseases.
Aided in part by the Human Genome Project, there have been huge developments over the last two decades in genome-wide high-throughput approaches. These methods enable us to measure the molecular basis of biological processes in a cell. DNA microarrays and more recently high-throughput sequencing have been the key drivers of novel information generation at an unprecedented rate. The thesis presented here summarizes the utilization of computational and statistical principles in the field of Immuno-genomics. Several methodologies for retrieval, pre-processing, and analysis of genomic data to better understand and gain new insights into CD4+ T helper cell differentiation are demonstrated.

12
2 Review of the Literature
2.1 High-throughput methods and data analysis Most of the living cells organize genetic information in the form of DNA. DNA is transcribed into RNA, which in turn is used for translation into proteins (Crick 1970). System-wide study of DNA is called genomics whereas system-wide study of RNA is referred to as transcriptomics (Nielsen and Oliver 2005). Transcriptomics usually involves measuring and analyzing the expression of various transcripts in the cell. In the earlier days, gene expression microarrays were a popular choice but more recently high-throughput sequencing has become a favorite among investigators.
Release of the first draft of the human genome (Lander et al. 2001; Venter et al. 2001) eased the development of high-throughput discovery methods and increased our ability to examine and understand the human cell on a genome-wide scale. Advances in the high-throughput genomic discovery methods also led to the production of unprecedented amounts of data (Marx 2013). Efforts to make sense of this large quantities of data has in a way transformed hypothesis-driven paradigm of genome biology into a data-driven one (Mattmann 2013). But there are many challenges in piecing together all the new information produced from these data-driven inquiries such as the ability to handle data from various sources and norms to be adopted to reduce complexity of information created. Data-driven approaches, which are an important part of this thesis, are increasingly organized under the umbrella term bioinformatics (Hogeweg 2011), while integration of data from various parts of a system to get a holistic view are better explained by the principles of systems biology (Kitano 2002).
2.1.1 DNA microarrays DNA microarrays became an essential tool to obtain novel information in molecular biology during early 2000s. Although the principle of complementary sequences binding to each other is same, there are mainly three types of microarrays based on differences in the technology. They are in-situ synthesized arrays, bead arrays and spotted arrays (Bumgarner 2013).

Review of the Literature
13
In-situ arrays involved the synthesis of DNA sequences on a solid substrate (Fodor et al. 1991; Pease, Solas, and Sullivan 1994; Lockhart et al. 1996; Wodicka et al. 1997). Arrays based on this technology were developed and popularized by Affymetrix Inc. In bead arrays, different DNA sequences were synthesized on small beads which in turn are deposited on arrays (Ferguson, Steemers, and Walt 2000; Steemers, Ferguson, and Walt 2000; Epstein et al. 2003). Microarrays sold by Illumina Inc. are based on this technology. Spotted arrays have glass substrates spotted with pins dipped in a DNA solution (DeRisi et al. 1996). Spotted arrays are used by researches to produce custom in-house arrays specific to the research question.
There are also many kinds of microarrays including gene expression microarrays, arrays for comparative genomic hybridization, chromatin immunoprecipitation on chip arrays, SNP arrays, exon arrays, fusion gene arrays and tiling arrays (Pollack et al. 1999; Hacia et al. 1999; Hoheisel 2006; Trevino, Falciani, and Barrera-Saldaña 2007). Gene expression microarrays, SNP arrays are reviewed in the following sections.
2.1.1.1 Gene expression microarrays
Gene expression microarrays are the most popular of DNA microarrays to the extent that they have become synonymous with microarrays. Gene expression microarrays are used for the quantification of RNA levels in the cell. The generic workflow of a gene expression microarray can be seen in Figure 1. Gene expression microarrays have probes or probesets that target the entire gene or at least the 3’ end of the gene. Therefore, having prior information about the sequence of the genes is necessary. In majority of the cases, there are multiple probes or probesets for the same gene. Exon arrays are a variation of gene expression arrays in the sense that there are probes for exons of various transcripts. This helps in the discovery and quantification of alternatively spliced transcripts.
Figure 1. Workflow of a gene expression microarray experiment. RNA is isolated from our
cells of interest. It is then purified, amplified, and converted to cDNA (reverse transcription) or cRNA and then loaded onto the array. Probes on the array are then hybridized and signal intensities of the features are obtained after scanning.

Kartiek Kanduri
14
2.1.1.2 SNP arrays
Detection of single nucleotide polymorphisms (SNPs) and measuring the generic variability in the sample set can be carried out by SNP arrays. SNPs are variations in the genome at a single nucleotide position (Feuk, Carson, and Scherer 2006). SNP arrays developed by Affymetrix (D. G. Wang et al. 1998) and Illumina (Fan et al. 2003; Gunderson et al. 2006) can reproducibly detect around 10000 to two million SNPs in a single chip. Affymetrix arrays use allele discrimination, where oligonucleotides of various alleles act as probes for genomic DNA while Illumina arrays involve hybridization of barcoded-oligonucleotides that are extended to specific allele.
2.1.1.3 ChIP- chip
In ChIP-chip technology microarrays in conjunction with chromatin immunoprecipitation (Solomon, Larsen, and Varshavsky 1988; Horak and Snyder 2002) are used to discover the binding sites of transcription factors of interest involved in regulation of gene expression (Iyer et al. 2001). Transcription factors bound to the DNA are pulled down together using an antibody and the DNA is purified from the protein complexes and quantified using microarrays. Probes on microarrays used for this technique usually target regions that are evenly spread out across the genome to get an optimal coverage of the entire genome.
2.1.2 High-throughput sequencing Sequencing of DNA was first developed by Sanger and Nicklen (Sanger and Nicklen 1977) and hence often referred to as the Sanger sequencing. It was a very slow and costly process even after automation and operation of several sequencers in parallel. Hence many improvements were proposed to develop next-generation sequencing techniques (Schloss 2008). Latest second and third generation high-throughput sequencing techniques were often though incorrectly referred to as next-generation sequencing even after almost a decade after they became available for use. Some of the popular platforms of high-throughput sequencing are pyrosequencing by Roche-454 (Margulies et al. 2005), SOLiD sequencing by Applied Biosystems (Valouev, Ichikawa, et al. 2008), single molecule sequencing by Helicos Biosciences (Pushkarev, Neff, and Quake 2009), PacBio by Pacific Biosciences (Eid et al. 2009; Schadt, Turner, and Kasarskis 2010), semiconductor sequencing by Ion torrent / Life technologies (Metzker 2009; L. Liu et al. 2012), reversible terminator sequencing by Illumina/Solexa (Bentley et al. 2008) and nanopore sequencing by Oxford Nanopore (Clarke et al. 2009).

Review of the Literature
15
High-throughput sequencing also has many use cases like that of microarrays. Whole genome sequencing (WGS) involves sequencing the whole genome. It can be used in studying genetic variation (1000 Genomes Project Consortium et al. 2010) and understanding its relationship to underlying cause of complex diseases (Saunders et al. 2012; Kilpinen and Barrett 2013). A common modification of WGS is exome sequencing (WES), where only the exonic regions are selectively sequenced under the assumption that these regions are thought to contain major disease causing genetic variation (Hodges et al. 2007). RNA-Seq involves sequencing of mRNA or total RNA. It can be used for quantification of both coding and non-coding transcripts, discovery alternate isoforms and study of splicing patterns (Z. Wang, Gerstein, and Snyder 2009). ChIP-Seq involves sequencing of DNA fragments pulled down with an antibody that targets a protein. It can be used to study e.g. protein-DNA interactions and mapping of epigenetic marks (P. J. Park 2009; Farnham 2009).
2.1.3 Data analysis for high-throughput studies Since the advent of high-throughput studies, the amount of data produced from genomic experiments has skyrocketed at an unprecedented rate. Obtaining useful and actionable knowledge from such vast amounts of data is a challenging task and an active area of research. Many software packages, both open and proprietary source have been developed to facilitate these analysis tasks. Some of the examples are Bioconductor (Huber et al. 2015) in R statistical language (R Core Team 2016), MatArray (Venet 2003) and Gene ARMADA (Chatziioannou, Moulos, and Kolisis 2009) in MATLAB (MATLAB 2017) and Chipster (Kallio et al. 2011). Bioconductor / R has become the preferred choice of many researchers as it is free to use, open-source and has a vibrant community that engages with everyone. In order to help researchers who do not know how to write code, many other GUI tools like Chipster and Microarray Я US (Dai et al. 2012) have been built over Bioconductor.
Data analysis of high-throughput data can be divided into three major steps: pre-processing, statistical modeling, and downstream analysis. Pre-processing mainly involves quality control checks and normalization of data. Statistical modelling involves fitting the data to a model to assess the distribution and testing hypothesis. Downstream analysis involves mining of the significant results to obtain actionable insights.

Kartiek Kanduri
16
2.1.3.1 Data analysis for microarrays
A common workflow for microarray data analysis is shown in Figure 2. Signal intensity values are obtained by scanning the microarrays. Most of the microarrays have control probesets to aid in estimation of the background and successive correction from any technical errors introduced due to the calibration of scanning instruments. Based on the microarray platform, this background correction step is either done by the scanning software or up to the user to do it together with normalization. File formats also differ between the platforms. Most platforms use tab-delimited text file but Affymetrix prefers the binary CEL files. CEL files or tab-delimited text files can be loaded into most software environments like R or MATLAB using inbuilt functions or a variety of packages available on the platform.
In the context of this thesis, wide variety of packages available in R statistical environment are discussed here. For example, Affy (Gautier et al. 2004), Oligo (Carvalho and Irizarry 2010) and aroma.Affymetrix (Bengtsson et al. 2008; Bengtsson, Wirapati, and Speed 2009) packages provide functions to read binary CEL files of Affymetrix microarrays whereas Lumi (Du, Kibbe, and Lin 2008) and beadarray (Dunning et al. 2007) packages provide functions to read Illumina microarray data. Agilp (Chain et al. 2010) can be used for Agilent microarray data and oligo package for data from other platforms like Nimblegen. For the samples to be comparable, we must remove the non-biological variation from microarray data. This can be achieved by performing normalization on the samples. Affymetrix arrays have an additional step of summarizing the data due to presence of multiple probes in a probeset per gene. Some of the popular methods of normalization for Affymetrix arrays are MAS5 (Hubbell, Liu, and Mei 2002), RMA (Irizarry, Hobbs, et al. 2003; Irizarry, Bolstad, et al. 2003) and GCRMA (Wu et al. 2004). As the name suggests, Robust multi-array average (RMA) and GeneChip robust multi-array average (GCRMA) use information from multiple arrays while Microarray suite 5 (MAS5) uses information from single array only. MAS5 calculates an average of perfect match (PM) probe intensities after subtracting mismatch probe (MM) signal, while RMA and GCRMA do not use MM probe signal as they are observed to perform worse at lower signal intensities. For Illumina and Agilent arrays, variance stabilization normalization (Huber et al. 2002; B. P. Durbin et al. 2002) is popular. In variance stabilization normalization, a transformation parameter is estimated by modeling the dependence between variance and mean across all probes. The popular R packages mentioned above support most of these normalization methods. Visualizing data distributions before and after normalization using boxplots and density plots is a good idea to spot outliers. Sample relationships should also be looked at using either correlation analysis or hierarchical clustering or by dimensionality reductions techniques such a principal component analysis. Outliers, detected if any, should be excluded from analysis.

Review of the Literature
17
Figure 2. Workflow of data analysis from a microarray experiment.
Limma (Ritchie, Phipson, Wu, et al. 2015), RankProd (Hong et al. 2006), samr (Tusher, Tibshirani, and Chu 2001; Tibshirani et al. 2011), siggenes (Schwender 2012) are some of the popular packages for statistical modeling in R environment. Limma involves fitting a linear model for each gene in the array while using empirical Bayes approach to try and shrink sample variance which allows it to work even when there is data only from a few arrays. RankProd works by identifying genes that are consistently found at the top or bottom in several fold-change ranked gene lists.
After obtaining significant features, some of the popular downstream analysis steps are Gene set enrichment analysis (GSEA) (Subramanian et al. 2005), GO enrichment analysis, Pathway enrichment analysis and SNP enrichment analysis. Gene set enrichment analysis algorithm involves testing if a specific set of genes (such as a from a pathway) are either concentrated at the top and bottom of a ranked gene list or

Kartiek Kanduri
18
randomly distributed. The other enrichment analysis techniques mentioned above usually look if traits of a category like a specific pathway or SNPs belonging to a specific disease are either over or under represented in the gene list of interest. These can be performed using popular tools like DAVID (Huang, Sherman, and Lempicki 2009) and Genetrail (Backes et al. 2007). In R environment, these can be done using packages like GSEABase (Morgan, Falcon, and Gentleman 2017), topGO (Alexa, Rahnenführer, and Lengauer 2006) and fgsea (Sergushichev 2016).
2.1.3.2 Data analysis for high-throughput sequencing
A common workflow for high-throughput sequencing data is shown in Figure 3. Preprocessing of HTS data start with examining FASTQ files. FASTQ files contain the reads and the corresponding base call quality value. Popular quality control software tools are FastQC (Simon Andrews 2016), PRINSEQ (Schmieder and Edwards 2011) or RSeQC (L. Wang, Wang, and Li 2012). FastQC helps in generating a quality control HTML report to evaluate issues with either the sequencer or the library. In addition to providing basic sequencing depth statistics, FastQC has several modules that asses the quality per base, quality per sequence, GC content per sequence, duplication rate and presence of adapters. PRINSEQ and RSeQC also have equivalent functionality. In addition, PRINSEQ can filter and trim reads besides evaluating the quality of the sequencing library while RSeQC specifically deals with RNA-Seq libraries by providing information about read distributions. Depending on the quality of the data it might be necessary to trim adapters or bad quality sequence reads using tools like Cutadapt (Martin 2011) and Trimmomatic (Bolger, Lohse, and Usadel 2014). In case of ChIP-Seq data, library complexity indicating the number of unique reads and strand cross-correlation indicating degree of clustering of immunoprecipitated fragments should be determined to gauge the quality of enrichment (Landt et al. 2012; Bailey et al. 2013). Duplicate reads, if present in a ChIP-Seq dataset should also be removed.
The reads are then aligned to a reference genome. Some of the popular aligners for genomics reads are bowtie (Langmead and Salzberg 2012) and bwa (H. Li and Durbin 2009). Tophat (Trapnell, Pachter, and Salzberg 2009; Kim et al. 2013) and STAR (Dobin, Davis, Schlesinger, Drenkow, Zaleski, Jha, Batut, Chaisson, and Gingeras 2013b) are splicing junction aware aligners that can be used for aligning transcriptomic reads. Many of these aligners are based on Burrows-Wheeler technique. Kallisto (Bray et al. 2016) and Sailfish (Patro, Mount, and Kingsford 2014) are among the new generation of quantifiers of transcriptomic data based on the principles of pseudo-alignment. Pseudo-alignment involves listing of all k-mers from the reads and later matching them to the reads thereby reducing the time required to get quantified data from sequence reads. Alignment of transcriptomic

Review of the Literature
19
Figure 3. Workflow of data analysis of a high-throughput sequencing experiment.
data with traditional aligners still require the use of programs HTSeq (Anders, Pyl, and Huber 2015) or easyRNASeq (Delhomme et al. 2012) that enable quantification of mapped reads. Instead of mapping to a reference, performing a de-novo assembly using programs like Trinity (Grabherr et al. 2011) can also lead to discovery of novel transcripts (Gibbons et al. 2009).
Quantified gene counts are then normalized to remove any non-biological variation. Some of the common approaches are RPKM (Mortazavi et al. 2008), TPM (Pachter 2011) and TMM (M. D. Robinson and Oshlack 2010) although recent studies (Dillies et al. 2012) have shown that reads per kilo base per million (RPKM) is a bad measure when comparing expression between two different sample sets. As the name stands, reads per kilo base per million (RPKM) involves normalizing reads first based on the gene length and then by a per million scaling factor. While calculating TPM, gene counts are first normalized using the per million scaling factor and later by the gene length. In TMM method, a trimmed mean of expression values is calculated after discarding a proportion of lower and higher values. Statistical

Kartiek Kanduri
20
testing on these normalized read counts can be performed using packages such as edgeR (M. D. Robinson, McCarthy, and Smyth 2010), DESeq (Anders and Huber 2010), baySeq (Hardcastle and Kelly 2010), DEXSeq (Anders, Reyes, and Huber 2012), and DSGSeq (W. Wang et al. 2013). All the methods mentioned above use a negative binomial distribution to model the count data. edgeR and DESeq uses an exact test like that of Fisher’s exact test for differential expression.
Analysis of ChIP-Seq reads involves peak calling using tools like PeakFinder (Johnson et al. 2007), FindPeaks (Fejes et al. 2008), QuEST (Valouev, Johnson, et al. 2008), MACS (Y. Zhang et al. 2008), CisGenome (Ji et al. 2008) or PeakSeq (Rozowsky et al. 2009). Most of the methods mentioned here use the bimodal enrichment of tags on the Watson and Crick strand to identify potential peaks. QuEST identifies the local maxima regions after combining the tag densities from forward and reverse strands and then compares these with the input sample to get an FDR value for each peak call. FindPeaks outputs a Monte Carlo simulation-based FDR value of observing a peak of certain height. MACS empirically models the shift size of ChIP-seq tags. It then uses the shift size to move tags and like many of the first proposed tools, finds enriched sites by using a Poisson distribution model while more recent methods including CisGenome use a negative binomial model to find enriched sites. Motif discovery from identified peaks can be done using ChIPMunk (Kulakovskiy et al. 2010), MEME-ChIP (Machanick and Bailey 2011), RSAT (Thomas-Chollier et al. 2012), homer (Heinz et al. 2010) or deepbind (Alipanahi et al. 2015). Motif discovery algorithms use a position weight matrix to scan a given set of sequences for specific binding sites. Motif enrichment analysis often included in the motif discovery suits like MEME-ChIP and homer involves calculating statistical enrichment of motifs discovered in a prior step or from a public database.
2.2 Genomics of T-helper cell differentiation
2.2.1 Immune system and T-helper subsets Immune system plays an important role in human body by defending it from external pathogens. Innate immunity, which we get by default at birth protects us by responding in a generic manner to all pathogens. Adaptive immunity, which we acquire over the course of our life protects us against specific pathogens by remembering the antigens. T-helper subsets are the essential part of the adaptive immune system. Over the course of the immune response, they secrete cytokines and differentiate into various subsets. Each of these subsets has specific functions and they are classified based on the cytokines that they secrete which in turn are regulated by master transcription factors.

Review of the Literature
21
For close to two and half decades, it was thought that there are only two subsets of T-helper cells, Th1 and Th2 (Tada et al. 1978). Th1 cells are known to be involved in immune response against intracellular pathogens while producing IFN-γ and IL12 (Hsieh et al. 1993; Szabo et al. 2000). Th2 cells are involved in immune response against extracellular pathogens while producing IL4 (Swain et al. 1990). Several studies have, however, shown that there are many additional subsets. Th17 cells (H. Park et al. 2005; Harrington et al. 2005) that secrete IL17 are known to be responsive against both intracellular and extracellular pathogens. Th9 cells (Dardalhon et al. 2008; Veldhoen et al. 2008) that secrete IL9 and Th22 (Duhen et al. 2009; Trifari et al. 2009) cells that produce IL22 are inadequately characterized. Regulatory T (Treg) cells (Cobbold et al. 2004; Curotto de Lafaille et al. 2004) that produce IL10 and TGF-β are known to regulate the immune response by suppressing effector cell functions. Tfh (Breitfeld et al. 2000; Nurieva et al. 2008) cells, which promote B cell proliferation secrete IL21. Various Th cell subsets and the cytokines they produce can be seen in Figure 4.
Balance of immune reaction involving these T-helper subsets is paramount to the health of the individual. A muted level of response may lead to not mounting appropriate defense to a pathogen which can be seen in disease state like AIDS (Shaw et al. 1984; Banda et al. 1992; Alimonti, Ball, and Fowke 2003; Gallo 2006) when T-helper subsets are depleted. An over-reactive immune system may lead to allergy or auto-immune disease states like type-1 diabetes or coeliac disease (Sollid 2002; Kagnoff 2007; Redondo, Fain, and Eisenbarth 2001; Devendra, Liu, and Eisenbarth 2004).
T-helper subsets are also found to be associated with many disease states. Examples of the diseases where T-helper subsets are known to be involved are: in type-1 diabetes Th1 cells are known to be involved in the destruction of insulin producing β-cells (B. O. Wang, André, and Gonzalez 1997; Pakala et al. 1999), in rheumatoid arthritis and inflammatory bowel disease both Th1 and Th17 cells are involved in the inflammation of joints (Leung et al. 2000; Bush et al. 2002; Nakae et al. 2003; Yamada et al. 2008; Nistala et al. 2010; van Hamburg et al. 2011; L. Zhang et al. 2012) and intestine (Davidson et al. 1996; Parronchi et al. 1997; Yen et al. 2006) respectively. Th17 cells have been reported to be involved in the destruction of myelin producing cells in experimental autoimmune encephalomyelitis (Hofstetter et al. 2005; Langrish et al. 2005; Komiyama et al. 2006). TfH cells have been implicated in the inflammation of various organs in systemic lupus erythematosus (Simpson et al. 2010) and in the anti-thyroid immune response in autoimmune thyroid disease (Zhu et al. 2012). Th1 and Th9 subsets play a role in chronic allergy (Durham et al. 1992; Yssel et al. 1992; Ebner et al. 1993; Shimbara et al. 2000; Erpenbeck et al. 2003; Soroosh and Doherty 2009) whereas Th2 cells predominate in asthma (D. S. Robinson et al. 1992). Th22 cells instead have been associated with psoriasis (Lo et al. 2010) and ankylosing

Kartiek Kanduri
22
spondylitis (L. Zhang et al. 2012). Therefore, understanding the molecular mechanisms of T-helper differentiation provides the basis for developing therapeutic approaches for a number of different diseases.
Transcription factors play an important role in the differentiation of T helper cells by regulation several downstream elements and often referred to as master regulators due to the muting of differentiation signals of specific subsets in their absence. TBX21 is a master regulator of Th1 cells (Szabo et al. 2000), while GATA3 is a master regulator of Th2 cells (Zheng and Flavell 1997). RORƔT is a master regulator of Th17 cells (Ivanov et al. 2006) and FOXP3 is a master regulator of Treg cells (Hori, Nomura, and Sakaguchi 2003). Transcription factors bind to DNA and thereby change the state of chromatin to facilitate transcription (van Bakel 2011). Chromatin has also been found to be regulated by factors in the non-coding region of genome (Mondal et al. 2010).
Figure 3. T helper subsets along with the cytokines they produce and the cytokines that aid in
their speciation.

Review of the Literature
23
2.2.2 High-throughput studies of T-helper subsets Majority of studies that describe T-helper cell differentiation have been performed using mouse models, which were extremely helpful in understanding T-helper cell differentiation. But due to evolutionary changes, there might be mechanisms that cannot be easily translated to human. So, there is need for studying T-helper cell differentiation in humans. A list of selected human T-helper cell high-throughput studies can be seen in Table 1. Many early high-throughput studies focused on identifying markers unique to Th1/ Th2 subsets (Rogge et al. 2000; Hamalainen et al. 2001; Lund, Aittokallio, Nevalainen, and Lahesmaa 2003a; Nikula et al. 2005; Chtanova et al. 2005; Lund et al. 2007; Hawkins et al. 2013). More recent studies also aimed at elucidating markers of Th17 and iTreg cells (Birzele et al. 2011; Tuomela et al. 2016; Ubaid Ullah et al. 2018). While it was possible to study a few lncRNA transcripts on microarrays, with the advent of high-throughput sequencing, some studies also aimed at identifying long non-coding RNAs involved in T-helper cell differentiation (Spurlock et al. 2015; Kanduri et al. 2015; Tuomela et al. 2016).
Table 1. Selected high-throughput studies that help in understanding human T-helper cell differentiation.
SUBSETS GEO/SRA ID STUDY PLATFORM
TH1, TH2 Rogge et al. 2000 Microarray
TH1, TH2 Hamalainen et al. 2001 Microarray
TH1, TH2 Lund, Aittokallio, Nevalainen, and Lahesmaa 2003b
Microarray
TH1, TH2 Chtanova et al. 2005 Microarray
ACTIVATED AND NON-ACTIVATED CD4+ T CELLS
Stentz and Kitabchi 2004 Microarray
TH1, TH2 Nikula et al. 2005 Microarray
TH1, TH2 GSE2770 Lund et al. 2007 Microarray
CD4+ T CELLS GSE7571 M. Wang, Windgassen, and Papoutsakis 2008b
Microarray
CD4+ T CELLS GSE7571 M. Wang, Windgassen, and Papoutsakis 2008a
Microarray
TH2 GSE18017 Elo et al. 2010 Microarray
CD4+ T CELLS SRP006674 Birzele et al. 2011 High- Throughput

Kartiek Kanduri
24
SUBSETS GEO/SRA ID STUDY PLATFORM sequencing
TH17 GSE35103 Tuomela et al. 2012 Microarray
TH1, TH2 GSE32959 Äijö et al. 2012 Microarray
TH1, TH2, TH17 GSE33946 Rusca et al. 2012 Microarray
TH1, TH2 SRA082670 Hawkins et al. 2013 High- throughput sequencing
TH1, TH2, TH17 GSE43005 H. Zhang et al. 2013 Microarray
TFH, CD4+ T CELLS
GSE58597 Weinstein et al. 2014 High- throughput sequencing
TH2 GSE53646 Seumois et al. 2014 Microarray
TH1, TH2, TH17 GSE54627 Touzot et al. 2014 High- throughput sequencing
TH1, TH2, TH17, TREG
GSE60680 Gustafsson et al. 2015 High- throughput sequencing
TH1, TH2 GSE71646 Kanduri et al. 2015 Microarray and High- throughput sequencing
TH1, TH2, TH17 GSE66261 Spurlock et al. 2015 High- throughput sequencing
TH1, TH2 GSE62486 Hertweck et al. 2016 High- throughput sequencing
TH1, TH17 GSE77299 GSE78897
Koues et al. 2016 High- throughput sequencing
Th17 GSE52260 Tuomela et al. 2016 High- throughput sequencing
TREG GSE90570 GSE99889
Hawkins et al. 2013; Ubaid Ullah et al. 2018
High- throughput sequencing

25
3 Aims
The overall objective of this Ph.D. study was to use computational and statistical methods to better understand the T-helper cell differentiation processes and the role in the human immune response under various auto-immune disease states. The projects in the study utilized data from different genomic platforms to obtain insights and better understand T-helper cell differentiation.
The specific aims of this study were:
I. Study the mRNA and lncRNA transcript expression changes during early human T-helper cell differentiation.
II. Characterize mRNA and lncRNA transcripts in nine auto-immune disease (AID) loci.
III. Study the transcriptome-wide changes of Lat- deficiency between resting and activated CD4+ T cells.
IV. Study the STAT3-regulated transcriptome during early Th17-cell differentiation.

26
4 Materials and Methods
4.1 Ethics statement Collection of umbilical cord blood from healthy neonates (I, II, IV) was approved by the Ethics Committee of the Hospital district of Southwest Finland in line with the 1975 Declaration of Helsinki. Collection of blood sample from a healthy donor (II) was approved by the Medical Ethical Board of University Medical Center Groningen. Informed consent was obtained from each donor.
4.2 CD4+ T-cell isolation and culturing (Study I, II, IV)
CD4+ T cells were isolated from human umbilical cord blood of healthy neonates and were purified using positive selection (Dynal CD4 positive Isolation Kit, Invitrogen, Carlsbad, CA, USA). Purified CD4+ T cells were pooled from several individuals and were cultured in Yssel’s medium (Iscove’s modified Dulbecco’s medium supplemented with Yssel medium concentrate plus penicillin/streptomycin) supplemented with 1 % human AB serum (Red Cross Finland Blood Service). Cells were activated with plate- bound anti-CD3 (2.5 μg/ml) and soluble anti-CD28 (500 ng/ml; both were from Immunotech, Marseille, France). At the same time, Th1 polarization was initiated with 2.5 ng/ml IL12 and Th2 neutralizing antibody anti- IL4 (1 μg/ml); Th2 polarization was initiated using 10 ng/ml IL4 plus Th1 neutralizing antibody anti- interferon γ (1 μg/ml) (all antibodies from R&D Systems, Minneapolis, MN, USA); or Th0 state was promoted when cells were cultured with only neutralizing antibodies (anti-interferon γ and anti-IL4) and without polarizing cytokines (Th0 cells). IL2 (40 U/ml, R&D Systems) was added on the second day of culture. The polarization was verified by checking the expression of polarization marker genes for Th1 and Th2 subsets.
Materials and Methods
27
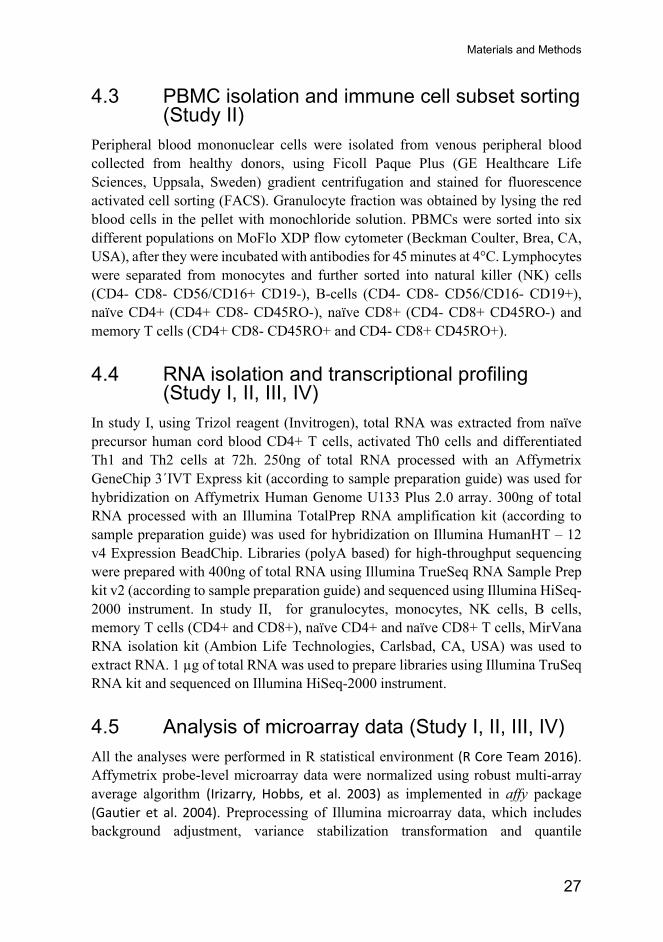
4.3 PBMC isolation and immune cell subset sorting (Study II)
Peripheral blood mononuclear cells were isolated from venous peripheral blood collected from healthy donors, using Ficoll Paque Plus (GE Healthcare Life Sciences, Uppsala, Sweden) gradient centrifugation and stained for fluorescence activated cell sorting (FACS). Granulocyte fraction was obtained by lysing the red blood cells in the pellet with monochloride solution. PBMCs were sorted into six different populations on MoFlo XDP flow cytometer (Beckman Coulter, Brea, CA, USA), after they were incubated with antibodies for 45 minutes at 4°C. Lymphocytes were separated from monocytes and further sorted into natural killer (NK) cells (CD4- CD8- CD56/CD16+ CD19-), B-cells (CD4- CD8- CD56/CD16- CD19+), naïve CD4+ (CD4+ CD8- CD45RO-), naïve CD8+ (CD4- CD8+ CD45RO-) and memory T cells (CD4+ CD8- CD45RO+ and CD4- CD8+ CD45RO+).
4.4 RNA isolation and transcriptional profiling (Study I, II, III, IV)
In study I, using Trizol reagent (Invitrogen), total RNA was extracted from naïve precursor human cord blood CD4+ T cells, activated Th0 cells and differentiated Th1 and Th2 cells at 72h. 250ng of total RNA processed with an Affymetrix GeneChip 3´IVT Express kit (according to sample preparation guide) was used for hybridization on Affymetrix Human Genome U133 Plus 2.0 array. 300ng of total RNA processed with an Illumina TotalPrep RNA amplification kit (according to sample preparation guide) was used for hybridization on Illumina HumanHT – 12 v4 Expression BeadChip. Libraries (polyA based) for high-throughput sequencing were prepared with 400ng of total RNA using Illumina TrueSeq RNA Sample Prep kit v2 (according to sample preparation guide) and sequenced using Illumina HiSeq-2000 instrument. In study II, for granulocytes, monocytes, NK cells, B cells, memory T cells (CD4+ and CD8+), naïve CD4+ and naïve CD8+ T cells, MirVana RNA isolation kit (Ambion Life Technologies, Carlsbad, CA, USA) was used to extract RNA. 1 µg of total RNA was used to prepare libraries using Illumina TruSeq RNA kit and sequenced on Illumina HiSeq-2000 instrument.
4.5 Analysis of microarray data (Study I, II, III, IV) All the analyses were performed in R statistical environment (R Core Team 2016). Affymetrix probe-level microarray data were normalized using robust multi-array average algorithm (Irizarry, Hobbs, et al. 2003) as implemented in affy package (Gautier et al. 2004). Preprocessing of Illumina microarray data, which includes background adjustment, variance stabilization transformation and quantile
Kartiek Kanduri
28
normalization was performed using methods implemented in lumi package (Du, Kibbe, and Lin 2008). Duplicated and un-annotated probes were removed using genefilter package (Gentleman et al. 2016). Probeset with the highest inter-quartile range was retained in case of duplicates. Present and absent calls for Affymetrix microarray probesets were generated by fitting the chip-wide log2-transformed expression to a two-component Gaussian mixture distribution, using the standard expectation-maximization algorithm in mixtools package (Benaglia et al. 2009). A probeset was defined to be present (study I) if the data point had a higher likelihood for the Gaussian component with the higher mean value in all replicates of the sample subtype (Lee et al. 2010). Present and absent calls for Illumina microarray probesets were obtained using detection p-value. A probeset was defined to be present if the detection p value was < 0.01 in all replicates of the sample subtype. Differential expression analysis was done using moderated, unpaired t-test as implemented in limma (Smyth 2004; Ritchie, Phipson, Di Wu, et al. 2015). Genes were considered to be differentially expressed if Benjamini-Hochberg (Benjamini and Hochberg 1995) adjusted p-value < 0.05 and log2 fold-change < -1 or > 1.
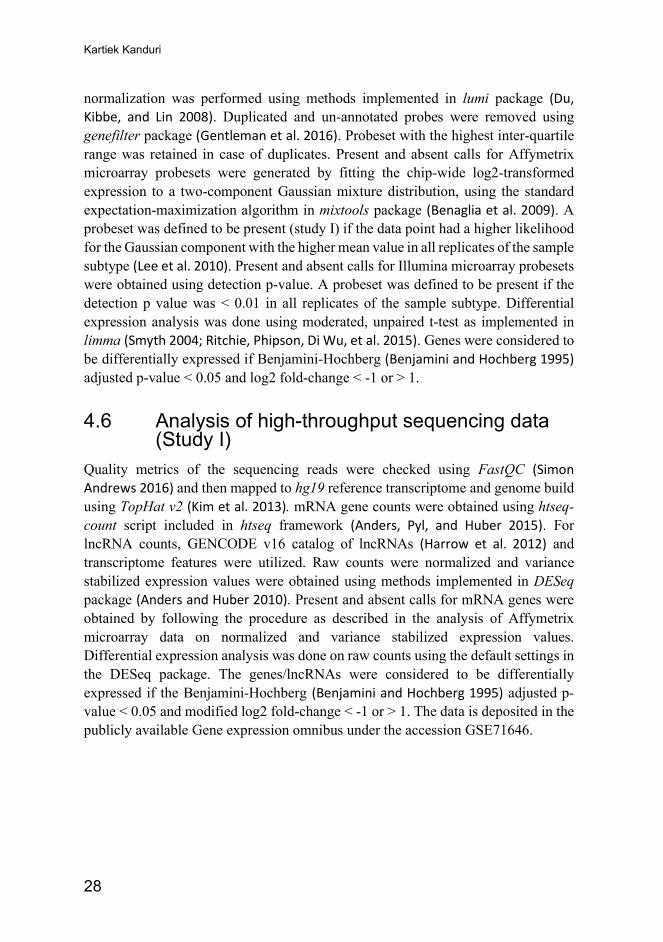
4.6 Analysis of high-throughput sequencing data (Study I)
Quality metrics of the sequencing reads were checked using FastQC (Simon Andrews 2016) and then mapped to hg19 reference transcriptome and genome build using TopHat v2 (Kim et al. 2013). mRNA gene counts were obtained using htseq-count script included in htseq framework (Anders, Pyl, and Huber 2015). For lncRNA counts, GENCODE v16 catalog of lncRNAs (Harrow et al. 2012) and transcriptome features were utilized. Raw counts were normalized and variance stabilized expression values were obtained using methods implemented in DESeq package (Anders and Huber 2010). Present and absent calls for mRNA genes were obtained by following the procedure as described in the analysis of Affymetrix microarray data on normalized and variance stabilized expression values. Differential expression analysis was done on raw counts using the default settings in the DESeq package. The genes/lncRNAs were considered to be differentially expressed if the Benjamini-Hochberg (Benjamini and Hochberg 1995) adjusted p-value < 0.05 and modified log2 fold-change < -1 or > 1. The data is deposited in the publicly available Gene expression omnibus under the accession GSE71646.

Materials and Methods
29
4.7 Analysis of high-throughput sequencing data (Study II)
Reads were mapped to NCBI v37 reference genome using STAR (Dobin, Davis, Schlesinger, Drenkow, Zaleski, Jha, Batut, Chaisson, and Gingeras 2013a) and feature counts were obtained against GENCODE v14 (Harrow et al. 2012) using IntersectBed tool from BEDTools suite (Quinlan and Hall 2010) and normalized using RPKM measure (Mortazavi et al. 2008). Based on the publicly available Immunochip data, we chose eight auto-immune diseases and defined the loci associated with each of the manifested phenotypes. The selected AIDs are autoimmune thyroid disease, celiac disease (CeD), inflammatory bowel disease (IBD), juvenile idiopathic arthritis (JIA), primary biliary cirrhosis (PBC), psoriasis (PS), primary sclerosing cholangitis (PsCh) and rheumatoid arthritis (RA). Fisher’s exact test was used to determine the differential expression between disease-specific loci and reference genome while multiple testing correction of the resulting p-values was performed using Bonferroni method (Dunn 1959; Dunn 1961). The data is deposited in the publicly available Gene Expression Omnibus under the accession number GSE62408.
4.8 Lineage-specific genes/lncRNAs and their neighboring enhancer and promoter marks
A confident list of differentially expressed mRNA genes was prepared by selecting all the genes that were differentially expressed in Thp versus Th0, Th1 and Th2 subsets from the three platforms and checking that they are differentially expressed with the same directionality of fold-change in at least two platforms. Above comparisons from only high-throughput sequencing were used for novel genes or lncRNAs. We defined a feature to be Th1- or Th2- specific if it was uniquely differentially expressed in only Thp versus Th1 or Thp versus Th2 comparisons respectively, but not differentially expressed in Thp versus Th0. H3K4me1 (enhancer) and H3K4me3 (promoter) marks found in Th1 and Th2 cells from a previously published study (Hawkins et al. 2013) were overlaid on lineage-specific genes and lncRNAs obtained in this study. An enhancer was defined to be in the vicinity of a lineage-specific feature if it is within 125kb on either side of the transcription start site of the feature. A promoter was defined to be in the vicinity of a lineage-specific feature if it is within 2.5kb on either side of the transcription start site of the feature. P-values were computed using a randomly generated null distribution, where we randomly picked the same number of features as that of a lineage-specific set from anywhere else in the genome and quantified the number of enhancer and promoter marks around them.

Kartiek Kanduri
30
4.9 Functional characterization of lncRNAs A co-expression network of lncRNAs and protein coding genes was constructed to predict GO terms for lncRNAs. A lncRNA was defined to be co-expressed with a protein coding gene when the absolute Pearson’s correlation coefficient between their expression was greater than 0.9. A topology based GO enrichment test as implemented in topGO (Alexa, Rahnenführer, and Lengauer 2006) package was performed on each group of protein-coding genes that were co-expressed with a lncRNA. Specifically, we used Fisher’s exact test and then attributed the enriched GO terms with p-value < 0.01 to that specific lncRNA. Disease associated SNPs with p-value < 1e-05 obtained from NCBI’s SGAP Plus database were used for SNP association analysis. A feature was defined to be in the vicinity when it was within ±100kb of a SNP. Enrichment analysis of traits was performed using hypergeometric distribution.

31
5 Results and discussion
5.1 Identification and characterization of Th1- and Th2- specific mRNA and lncRNAs
To identify Th1 and Th2 specific genes (study I), we employed transcriptional profiling of Thp, Th0, Th1 and Th2 subsets at 72h using three profiling platforms, namely, Affymetrix arrays, Illumina arrays and Illumina Sequencing. A mRNA was defined to be Th1-specific if it was uniquely differentially expressed only in Th1 vs. Thp comparison and not in Th2 vs. Thp or Th1 vs. Th0 comparisons. Equivalent approach was used to determine Th2-specific genes. Two lists of lineage-specific mRNA, one a confident list using data from multiple profiling platforms and another a novel list using data only from next-generation sequencing platform were generated. Confident list of genes had 249 Th1-specifying and 491 Th2-specifying genes. Novel list of genes had 189 Th1-specifying and 272 Th2-specifying genes. We validated the lineage-specificity of these genes using lineage-specific enhancers and promoters. We hypothesized that the density of lineage-specific enhancers and promoters would be more around lineage-specific mRNAs than anywhere else in the genome. Five hundred and eight Th1 enhancers and 183 Th1 active promoters were found around Th1-specific genes and 731 Th2 enhancers and 328 Th2 active promoters were found around Th2-specific genes. Randomization tests to compare the density of enhancers and promoters around lineage-specific mRNAs to random genomic loci showed that enhancers and promoters are indeed more preferentially located around lineage-specific mRNAs than anywhere else in the genome (Enhancers: Th1 p value = 0.0038, Th2 p value = 0.0196; Promoters: Th1 p value = 0.0003, Th2 p value < 10-4). Immune-mediated disease SNPs of asthma (p value = 0.0259) and Hodgkin disease (p value = 0.0119) were enriched in Th2-specific genes (distance cutoff ±100kb) while SNPs of endometriosis (p value = 0.0016), ovarian neoplasms (p value = 0.0087), narcolepsy (p value = 0.0311), Moyamoya disease (p value = 0.0256), Osteoarthritis (p value = 0.0256), type 2 diabetes mellitus (p value = 0.0481) were enriched in Th1- and Th2- specific genes among all available disease SNPs in NCBI’s SGAP plus database.
Lineage-specific lncRNA identification involved employment of transcriptomic data of Thp, Th0, Th1 and Th2 subsets at 72h using High-throughput sequencing. A

Kartiek Kanduri
32
lncRNA was defined to be Th1-specific if it was uniquely differentially expressed only in Th1 vs. Thp comparison and not in Th2 vs. Thp or Th1 vs. Th0 comparisons. Equivalent strategy was used in the identification of Th2-specific lncRNA. We identified 136 Th1-specific lncRNAs and 181 Th2-specific lncRNAs. The expression of lncRNAs was found to be lower than protein coding genes but specifically the expression of lineage-specific lncRNAs was found to be higher than other non-lineage-specific lncRNAs. We determined that there were 24 Th1-specific lncRNAs around Th1- specific mRNAs and 47 Th2-specific lncRNAs around Th2- specific mRNAs. There is a broad positive trend in the expression pattern between lineage-specific lncRNAs and the nearby lineage-specific mRNA. We followed the same strategy of using the density of enhancers and promoters around lineage-specific mRNAs to validate the lineage-specificity of these lncRNAs. There were 392 Th1 enhancers and 53 Th1 promoters around Th1-specific lncRNAs and 372 Th2 enhancers and 61 Th2 promoters around Th2-specific lncRNAs. Randomization tests revealed again that lineage-specific enhancers and promoters were preferentially located around lineage-specific lncRNAs (Enhancers: Th1 p value < 10-4, Th2 p value = 0.0018; Promoters: Th1 p value < 10-4, Th2 p value < 10-4). Many immune as well as non-immune mediated disease associated SNPs were found to be enriched in the vicinity of lineage-specific lncRNAs. We also tried to functionally characterize the lineage-specific lncRNAs by predicting their Gene Ontology terms using a co-expression network of protein coding mRNA and lncRNAs. A lncRNA was attributed with GO terms that were found to be enriched among the lncRNA’s co-expressed mRNAs. This catalog of GO terms (study I) is a valuable resource for understanding the role of lncRNAs, as many of their functions are still unknown.
Although many previous studies aimed at elucidating genes involved in T-helper differentiation process, several of them employed microarray technology. Microarrays were limited by pre-selection bias and probe-design (t Hoen et al. 2008). This study aims at overcoming those limitations by employing high-throughput sequencing techniques while also generating data to benchmark the employed platforms. This also helped in generating a dataset corroborated by multiple platforms. Our platform comparison results were also in concordance with previous studies (Konopka et al. 2012; Beyer et al. 2012). While some previous studies (Ranzani et al. 2015; Hu et al. 2013) aimed at identifying lncRNAs in completely differentiated T-helper subsets, to our knowledge this study was among the first that generated global profiles of lncRNAs in early stages of Th1 and Th2 differentiation.

Results and discussion
33
5.2 Characterization of lncRNAs located in auto-immune disease loci
Based on the publicly available Immunochip data, we chose eight auto-immune diseases and defined the loci associated with each of the manifested phenotypes. The selected AIDs are autoimmune thyroid disease, celiac disease (CeD), inflammatory bowel disease (IBD), juvenile idiopathic arthritis (JIA), primary biliary cirrhosis (PBC), psoriasis (PS), primary sclerosing cholangitis (PsCh) and rheumatoid arthritis (RA). Due to availability of only two SNPs after cut-off (p ≤ 5 x 10⁻⁸), autoimmune thyroid disease was eliminated from further analysis. For inflammatory bowel disease loci were subdivided into Crohn’s disease (CD) and ulcerative colitis (UC) and IBD shared based on the phenotype. This resulted in a total of nine phenotypes and 284 loci, of which 119 were shared among more than two AID and henceforth called as AID shared loci. These 284 loci were found to contain 240 lncRNAs and 626 protein coding genes. The lncRNA to protein coding genes ratio in AID loci is around 1:3 (1:2 in case of UC) and the profile of protein coding genes shared among different AID is similar to that of lncRNAs shared. To characterize the lncRNAs in the AID loci, we chose RNA-sequencing data from seven circulating cell subsets and four cell types during CD4+ T-cell differentiation. We observed that around 15% of all lncRNAs were expressed in the 11 cell types but when considering only lncRNAs in AID loci that number increases to 32%. We also found out that, on average the number of lncRNA expressed in circulating fully differentiated cell types was lower than in CD4+ T cells undergoing differentiation. Differentially expressed lncRNAs were found to be enriched in disease loci compared to all Gencode lncRNAs in three circulating cell types for four diseases. NK cells for IBD, JIA, PBC and PS; memory and CD8+ T cells for JIA, PBC, PS and RA. In T-helper cell subsets, differentially expressed lncRNA were found to be enriched in IBD Shared, JIA, PBC, PS and RA. Previous studies have suggested that highly expressed lncRNAs can be functionally active in cell types (Derrien et al. 2012). The results presented in this study suggest the cell type specific nature of lncRNAs for AID loci.
5.3 Transcriptome-wide changes of Lat-deficiency during CD4+ T cell activation
Lat stands for Linker for Activation of T cells and is a transmembrane adaptor that plays a key role in TCR signaling pathway by acting as a docking site for many effectors of the pathway. A transgene mouse model was used to generate Lat deficient CD4+ T cells. Total RNA from Lat-producing and Lat-deficient CD4+ T cells before and after activation with anti-CD3 and anti-CD28 was used for transcriptional profiling. Differential expression analysis revealed that upon activation in Lat-producing cells, 2926 genes were found to be differentially

Kartiek Kanduri
34
expressed. But in case of Lat-deficient CD4+ T cells, only 35 genes were found to be differentially expressed. This results show that Lat is an important element in the TCR signaling pathway by way of inducing transcription of various genes.
5.4 STAT3-regulated transcriptome during early Th17 cell differentiation
During Th17 differentiation, STAT3 is an upstream regulator of Th17 master regulator RORƔt and several Th17 signature cytokines such as Il17A and IL17F (Chen and O'Shea 2008). In order to study the role of STAT3 during early human Th17 cell differentiation, we employed transcriptional profiling to identify differentially expressed genes by comparing scramble non-targeting siRNA Th17 cells to Th0 cells at 2h, 12h, 24h and 72h. The number of differentially expressed genes are 2194 (2h), 1524 (12h), 1169 (24h) and 1446 (72h). We also identified STAT3-regulated genes by comparing siSTAT3 Th17 cells with scramble treated Th17 cells. We found 246 (2h), 179 (12h), 223 (24h), 774 (72h) genes that are regulated downstream by STAT3. To find the STAT3 regulated genes that are potentially participating in Th17 cell differentiation, STAT3-regulated genes were overlaid with genes regulated in response to Th17 differentiation. We found out that at two hours only 6.1% of STAT3-regualted genes were also differentially expressed in Th17 cells but that number increased with time and at 72h almost 32% of STAT3-regulated genes were also differentially expressed in Th17 cells. Using STAT3 ChIP-Seq data, we identified genes which have STAT3 binding site at their TSS. By integrating this information with STAT3 regulated Th17 genes, we found out that even though the number of STAT3 regulated Th17 genes at 72h is greater, only few of them were found to have a direct STAT3 binding sites at their TSS (±10kb), suggesting the role STAT3 in employing other regulatory elements. This mechanism increases the ability of STAT3 to influence the expression of many more genes as differentiation progresses. STAT3’s role as a key regulator of Th17 differentiaion has only been previously reported in murine T cells (Ciofani et al. 2012) (Durant et al. 2010). Results presented here improve the understanding of STAT3 during human Th17 cell differentiation. Results presented here show that more than half of STAT3 binding sites are in intergenic and intron regions and it would be interesting to find out the interplay between STAT3 and epigenetic elements during Th17 cell differentiation since proteins like STATs are suggested to favor lineage specific enhancer elements in previous studies (Hawkins et al. 2013, Vahedi et al. 2012)

35
6 Summary
This thesis leveraged high-throughput measurement data on a genome level and state-of-the-art analytical methods to gain insights into T-helper differentiation process. By using data generated from humans this work complements the previous knowledge obtained from various mouse model studies as well as previous human studies.
We identified mRNAs and lncRNAs potentially involved in Th1 and Th2 subset differentiation. Integration and analysis of datasets from RNA-Seq and ChIP-Seq showed that lineage-specific epigenetic marks are preferentially located around lineage-specific mRNA or lncRNA. The datasets produced are also a valuable resource to the community for future undertakings.
We characterized lncRNAs in AID loci by integrating genomic variation and gene expression data. We found out that lncRNA in AID loci are enriched in immune cell types more than expected by random sampling of genomic locations. We also predicted pathways that AID-loci lncRNAs might be associated with, using co-expression analysis.
We show the importance of Lat for transcriptional programming during CD4+ T helper cell activation. We also present the possibility of STAT3 in employing various other regulatory elements to bring gene expression changes during early Th17 cell differentiation.
With the increasing availability of automation in many aspects of life, the amount of data generated from biological experiments will increase manifold. Development and utilization of methods for analysis and storage of such data is going to be a challenge that is worth considering.

36
Acknowledgements
This work was carried out at the Turku Bioscience Centre, University of Turku and Åbo Akademi University, and School of Science, Aalto University under the supervision of Academy Professor Riitta Lahesmaa and Associate Professor Harri Lähdesmäki. I would like to thank them for giving me the opportunity to carry out this work, for their constant encouragement and support. I would also like to thank members of my supervisory committee Professor Cisca Wijmenga and Professor Kanury Rao for their guidance. I sincerely thank Docent Merja Heinäniemi and Dr. Gosia Trynka for reviewing this thesis and providing constructive feedback.
I would like to thank all the co-authors of the studies presented as part of this work, namely Dr. Subhash Tripathi, Dr. Antti Larjo, Henrik Mannerström, Dr. Ubaid Ullah, Dr. Riikka Lund, Professor R David Hawkins, Professor Bing Ren, Dr. Barbara Hrdlickova, Dr. Vinod Kumar, Daria V Zhernakova, Dr. Juha Karjalainen, Dr. Yang Li, Rutger Modderman, Wayel Abdulahad, Professor Lude Franke, Professor Cisca Wijmenga, Professor Sebo Withoff, Dr. Romain Roncagalli, Dr. Simon Hauri, Fréderic Fiore, Dr. Yinming Liang, Dr. Zhi Chen, Amandine Sansoni, Rachel Joly, Aurélie Malzac, Professor Sho Yamasaki, Professor Takashi Saito, Professor Marie Malissen, Professor Ruedi Aebersold, Professor Matthias Gstaiger, Professor Bernard Malissen, Dr. Kari Nousiainen, Dr. Tarmo Äijo, Dr. Isis Ricaño-Ponce, Dr. Soile Tuomela, Essi Laajala and Verna Salo.
I would like to warmly acknowledge all the past and current members of the ATLAS and CSB groups, Syed Bilal Ahmad Andrabi, Anni Antikainen, Kanchan Bala, Santosh Bhosale, Tanja Buchacher, Jane Zhi Chen, Lu Cheng, Obaiah Dirasantha, Sanna Edelman, Maheswara Reddy Emani, Marjo Hakkarainen, Viivi Halla-Aho, Markus Heinonen, Mirkka Heinonen, Sarita Heinonen, Karoliina Hirvonen, Saara Hämälistö, Jukka Intosalmi, Jussi Jalonen, Emmi Jokinen, Päivi Junni, Henna Kallionpää, Moin Khan, Ida Koho, Lingjia Kong, Minna Kyläniemi, Juhani Kähärä, Essi Laajala, Anne Lahdenperä, Antti Larjo, Kirsti Laurila, Niina Lietzén, Riikka Lund, Tapio Lönnberg, Henrik Mannerström, Maia Malonzo, Robert Moulder, Kari Nousiainen, Elisa Närvä, Lotta Oikari, Maria Osmala, Elina Pietilä , Nelly Rahkonen, Omid Rasool, Sini Rautio, Jussi Salmi, Verna Salo, Alexey Sarapulov, Ankitha Shetty, Juhi Somani, Aki Stubb, Subhash Tripathi, Soile
Acknowledgements
37
Tuomela, Ubaid Ullah, Tommi Vatanen,, Tarmo Äijö, Viveka Öling and all the master thesis and summer students who passed through these groups over the years. It has been my immense pleasure to work with you all.
I owe deep gratitude to my friends Sandeep, Suresh, Dasaratha Ramaiah, Bhanukiran, Sumanth, Praneeth, Ramakrishna, Faiyaz, Kiran, Ajitha, Vineetha, Madhu Sundaram, Emanuele, Suman, Chinmay, Elie, Steffen, Sreenivas, Pavithra, Harikanth, Kamesh, Pasi, Bineeth, Naresh, Meharji, Swaroop, Karthik, Swapna, Venkat, Sruthi, Pradeep, Narendra, Ville, Jari and Thomas. I am also extremely thankful for my extended family Varadacharyulu, Jayanthi and Anil. I am extremely fortunate to have a brother like Chakri, many thanks to him and Snigdha. I am deeply indebted to my parents Savithri and Narasimham for their unconditional love and support. And biggest thanks of all goes to my wife Deepti and son Ajay for everything.
This work was funded by the Turku Doctoral Programme in Molecular Medicine (TuDMM), European Commission Seventh Framework grant EC-FP7-SYBILLA-201106, the Academy of Finland (Centre of Excellence in Molecular Systems Immunology and Physiology Research, 2012–2017, grant 250114) and the Sigrid Jusélius Foundation. Finally, personnel of The Finnish Microarray and Sequencing Center (FMSC) at Turku Bioscience Center for excellent technical assistance and the computational resources provided by the Aalto Science-IT project are acknowledged for their contribution to this work.
January, 2020 Kartiek Kanduri

38
References
1000 Genomes Project Consortium, Gonçalo R Abecasis, David Altshuler, Adam Auton, Lisa D Brooks, Richard M Durbin, Richard A Gibbs, Matt E Hurles, and Gil A McVean. 2010. “A Map of Human Genome Variation From Population-Scale Sequencing..” Nature 467 (7319): 1061–73. doi:10.1038/nature09534.
Alexa, Adrian, Jörg Rahnenführer, and Thomas Lengauer. 2006. “Improved Scoring of Functional Groups From Gene Expression Data by Decorrelating GO Graph Structure..” Bioinformatics (Oxford, England) 22 (13): 1600–1607. doi:10.1093/bioinformatics/btl140.
Alimonti, Judie B, T Blake Ball, and Keith R Fowke. 2003. “Mechanisms of CD4+ T Lymphocyte Cell Death in Human Immunodeficiency Virus Infection and AIDS.” Journal of General Virology 84 (7). Microbiology Society: 1649–61. doi:10.1099/vir.0.19110-0.
Alipanahi, B, A Delong, M T Weirauch, and B J Frey. 2015. “Predicting the Sequence Specificities of DNA- and RNA-Binding Proteins by Deep Learning : Nature Biotechnology : Nature Research.” Nature Biotechnology.
Anders, Simon, Alejandro Reyes, and Wolfgang Huber. 2012. “Detecting Differential Usage of Exons From RNA-Seq Data.” Genome Research 22 (10). Cold Spring Harbor Lab: 2008–17. doi:10.1101/gr.133744.111.
Anders, Simon, and Wolfgang Huber. 2010. “Differential Expression Analysis for Sequence Count Data.” Genome Biology 11 (10). BioMed Central Ltd: R106. doi:10.1186/gb-2010-11-10-r106.
Anders, Simon, Paul Theodor Pyl, and Wolfgang Huber. 2015. “HTSeq--a Python Framework to Work with High-Throughput Sequencing Data..” Bioinformatics (Oxford, England) 31 (2): 166–69. doi:10.1093/bioinformatics/btu638.
Äijö, Tarmo, Sanna M Edelman, Tapio Lönnberg, Antti Larjo, Henna Kallionpää, Soile Tuomela, Emilia Engström, Riitta Lahesmaa, and Harri Lähdesmäki. 2012. “An Integrative Computational Systems Biology Approach Identifies Differentially Regulated Dynamic Transcriptome Signatures Which Drive the Initiation of Human T Helper Cell Differentiation..” BMC Genomics 13: 572. doi:10.1186/1471-2164-13-572.
Backes, Christina, Andreas Keller, Jan Kuentzer, Benny Kneissl, Nicole Comtesse, Yasser A Elnakady, Rolf Müller, Eckart Meese, and Hans-Peter Lenhof. 2007. “GeneTrail--Advanced Gene Set Enrichment Analysis..” Nucleic Acids Research 35 (Web Server issue): W186–92. doi:10.1093/nar/gkm323.
Bailey, Timothy, Pawel Krajewski, Istvan Ladunga, Celine Lefebvre, Qunhua Li, Tao Liu, Pedro Madrigal, Cenny Taslim, and Jie Zhang. 2013. “Practical Guidelines for the Comprehensive Analysis of ChIP-Seq Data.” Edited by Fran Lewitter. PLoS Computational Biology 9 (11): e1003326. doi:10.1371/journal.pcbi.1003326.s007.
Banda, N K, J Bernier, D K Kurahara, R Kurrle, N Haigwood, R P Sekaly, and T H Finkel. 1992. “Crosslinking CD4 by Human Immunodeficiency Virus Gp120 Primes T Cells for Activation-Induced Apoptosis..” Journal of Experimental Medicine 176 (4). Rockefeller University Press: 1099–1106. doi:10.1084/jem.176.4.1099.
Benaglia, Tatiana, Didier Chauveau, David Hunter, and Derek Young. 2009. “Mixtools: an R Package for Analyzing Finite Mixture Models.” Journal of Statistical Software 32 (6): 1–29.

Acknowledgements
39
Bengtsson, H, R Irizarry, B Carvalho, and T P Speed. 2008. “Estimation and Assessment of Raw Copy Numbers at the Single Locus Level | Bioinformatics | Oxford Academic.” Bioinformatics (Oxford, England).
Bengtsson, Henrik, Pratyaksha Wirapati, and Terence P Speed. 2009. “A Single-Array Preprocessing Method for Estimating Full-Resolution Raw Copy Numbers From All Affymetrix Genotyping Arrays Including GenomeWideSNP 5 & 6.” Bioinformatics (Oxford, England) 25 (17). Oxford University Press: 2149–56. doi:10.1093/bioinformatics/btp371.
Benjamini, Yoav, and Yosef Hochberg. 1995. “Controlling the False Discovery Rate: a Practical and Powerful Approach to Multiple Testing.” Journal of the Royal Statistical Society. Series B. Methodological 57 (1): 289–300.
Bentley, David R, Shankar Balasubramanian, Harold P Swerdlow, Geoffrey P Smith, John Milton, Clive G Brown, Kevin P Hall, et al. 2008. “Accurate Whole Human Genome Sequencing Using Reversible Terminator Chemistry..” Nature 456 (7218): 53–59. doi:10.1038/nature07517.
Beyer, Marc, Michael R Mallmann, Jia Xue, Andrea Staratschek-Jox, Daniela Vorholt, Wolfgang Krebs, Daniel Sommer, et al. 2012. “High-Resolution Transcriptome of Human Macrophages.” Edited by Andreas Zirlik. PloS One 7 (9): e45466. doi:10.1371/journal.pone.0045466.t001.
Birzele, F, T Fauti, H Stahl, M C Lenter, E Simon, D Knebel, A Weith, T Hildebrandt, and D Mennerich. 2011. “Next-Generation Insights Into Regulatory T Cells: Expression Profiling and FoxP3 Occupancy in Human.” Nucleic Acids Research 39 (18): 7946–60. doi:10.1093/nar/ gkr444.
Bolger, Anthony M, Marc Lohse, and Bjoern Usadel. 2014. “Trimmomatic: a Flexible Trimmer for Illumina Sequence Data.” Bioinformatics (Oxford, England) 30 (15). Oxford University Press: 2114–20. doi:10.1093/bioinformatics/btu170.
Bray, Nicolas L, Harold Pimentel, Páll Melsted, and Lior Pachter. 2016. “Near-Optimal Probabilistic RNA-Seq Quantification..” Nature Biotechnology 34 (5): 525–27. doi:10.1038/nbt.3519.
Breitfeld, D, L Ohl, E Kremmer, J Ellwart, F Sallusto, M Lipp, and R Förster. 2000. “Follicular B Helper T Cells Express CXC Chemokine Receptor 5, Localize to B Cell Follicles, and Support Immunoglobulin Production..” Journal of Experimental Medicine 192 (11): 1545–52.
Bumgarner, Roger. 2013. “Overview of DNA Microarrays: Types, Applications, and Their Future..” Current Protocols in Molecular Biology Chapter 22 (January). Hoboken, NJ, USA: John Wiley & Sons, Inc.: Unit22.1.–22.1.11. doi:10.1002/0471142727.mb2201s101.
Bush, Katherine A, Katherine M Farmer, Judith S Walker, and Bruce W Kirkham. 2002. “Reduction of Joint Inflammation and Bone Erosion in Rat Adjuvant Arthritis by Treatment with Interleukin‐17 Receptor IgG1 Fc Fusion Protein.” Arthritis & Rheumatology 46 (3). John Wiley & Sons, Inc.: 802–5. doi:10.1002/art.10173.
Carvalho, Benilton S, and Rafael A Irizarry. 2010. “A Framework for Oligonucleotide Microarray Preprocessing.” Bioinformatics (Oxford, England) 26 (19): 2363–67. doi:10.1093/bioinformatics/ btq431.
Chain, Benjamin, Helen Bowen, John Hammond, Wilfried Posch, Jane Rasaiyaah, Jhen Tsang, and Mahdad Noursadeghi. 2010. “Error, Reproducibility and Sensitivity: a Pipeline for Data Processing of Agilent Oligonucleotide Expression Arrays.” BMC Bioinformatics 11 (1). BioMed Central: 344. doi:10.1186/1471-2105-11-344.
Chatziioannou, Aristotelis, Panagiotis Moulos, and Fragiskos N Kolisis. 2009. “Gene ARMADA: an Integrated Multi-Analysis Platform for Microarray Data Implemented in MATLAB..” BMC Bioinformatics 10 (October): 354. doi:10.1186/1471-2105-10-354.
Chen, Zhi, and John J O'Shea. 2008. “Th17 Cells: a New Fate for Differentiating Helper T Cells..” Immunologic Research 41 (2). Humana Press Inc: 87–102. doi:10.1007/s12026-007-8014-9.
Chtanova, Tatyana, Rebecca Newton, Sue M Liu, Lilach Weininger, Timothy R Young, Diego G Silva, Francesco Bertoni, et al. 2005. “Identification of T Cell-Restricted Genes, and Signatures for Different T Cell Responses, Using a Comprehensive Collection of Microarray Datasets..” Journal of Immunology (Baltimore, Md. : 1950) 175 (12): 7837–47.

Kartiek Kanduri
40
Ciofani, Maria, Aviv Madar, Carolina Galan, MacLean Sellars, Kieran Mace, Florencia Pauli, Ashish Agarwal, et al. 2012. “A Validated Regulatory Network for Th17 Cell Specification.” Cell 151 (2). Cell Press: 289–303. doi:10.1016/j.cell.2012.09.016.
Clarke, James, Hai-Chen Wu, Lakmal Jayasinghe, Alpesh Patel, Stuart Reid, and Hagan Bayley. 2009. “Continuous Base Identification for Single-Molecule Nanopore DNA Sequencing.” Nature Nanotechnology 4 (4). Nature Publishing Group: nnano.2009.12–nnano.2009.270. doi:10.1038/ nnano.2009.12.
Cobbold, Stephen P, Raquel Castejon, Elizabeth Adams, Diana Zelenika, Luis Graca, Susan Humm, and Herman Waldmann. 2004. “Induction of foxP3+ Regulatory T Cells in the Periphery of T Cell Receptor Transgenic Mice Tolerized to Transplants..” Journal of Immunology (Baltimore, Md. : 1950) 172 (10): 6003–10.
Crick, Francis. 1970. “Central Dogma of Molecular Biology.” Nature 227 (5258). Nature Publishing Group: 561–63. doi:10.1038/227561a0.
Curotto de Lafaille, Maria A, Andreia C Lino, Nino Kutchukhidze, and Juan J Lafaille. 2004. “CD25- T Cells Generate CD25+Foxp3+ Regulatory T Cells by Peripheral Expansion..” Journal of Immunology (Baltimore, Md. : 1950) 173 (12): 7259–68.
Dai, Yilin, Ling Guo, Meng Li, and Yi-Bu Chen. 2012. “Microarray Я US: a User-Friendly Graphical Interface to Bioconductor Tools That Enables Accurate Microarray Data Analysis and Expedites Comprehensive Functional Analysis of Microarray Results..” BMC Research Notes 5 (June): 282. doi:10.1186/1756-0500-5-282.
Dardalhon, Valérie, Amit Awasthi, Hyoung Kwon, George Galileos, Wenda Gao, Raymond A Sobel, Meike Mitsdoerffer, et al. 2008. “IL-4 Inhibits TGF-|[Beta]|-Induced Foxp3+ T Cells and, Together with TGF-|[Beta]|, Generates IL-9+ IL-10+ Foxp3|[Minus]| Effector T Cells.” Nature Immunology 9 (12). Nature Publishing Group: 1347–55. doi:10.1038/ni.1677.
Davidson, N J, M W Leach, M M Fort, L Thompson-Snipes, R Kühn, W Müller, D J Berg, and D M Rennick. 1996. “T Helper Cell 1-Type CD4+ T Cells, but Not B Cells, Mediate Colitis in Interleukin 10-Deficient Mice..” Journal of Experimental Medicine 184 (1). Rockefeller University Press: 241–51. doi:10.1084/jem.184.1.241.
Delhomme, Nicolas, Ismaël Padioleau, Eileen E Furlong, and Lars M Steinmetz. 2012. “easyRNASeq: a Bioconductor Package for Processing RNA-Seq Data..” Bioinformatics (Oxford, England) 28 (19): 2532–33. doi:10.1093/bioinformatics/bts477.
DeRisi, J, L Penland, P O Brown, M L Bittner, P S Meltzer, M Ray, Y Chen, Y A Su, and J M Trent. 1996. “Use of a cDNA Microarray to Analyse Gene Expression Patterns in Human Cancer..” Nature Genetics 14 (4): 457–60. doi:10.1038/ng1296-457.
Derrien, Thomas, Rory Johnson, Giovanni Bussotti, Andrea Tanzer, Sarah Djebali, Hagen Tilgner, Gregory Guernec, et al. 2012. “The GENCODE V7 Catalog of Human Long Noncoding RNAs: Analysis of Their Gene Structure, Evolution, and Expression..” Genome Research 22 (9): 1775–89. doi:10.1101/gr.132159.111.
Devendra, Devasenan, Edwin Liu, and George S Eisenbarth. 2004. “Type 1 Diabetes: Recent Developments.” Bmj 328 (7442). British Medical Journal Publishing Group: 750–54. doi:10.1136/bmj.328.7442.750.
Dillies, M A, A Rau, J Aubert, C Hennequet-Antier, M Jeanmougin, N Servant, C Keime, et al. 2012. “A Comprehensive Evaluation of Normalization Methods for Illumina High-Throughput RNA Sequencing Data Analysis.” Briefings in Bioinformatics, September. doi:10.1093/bib/bbs046.
Dobin, Alexander, Carrie A Davis, Felix Schlesinger, Jorg Drenkow, Chris Zaleski, Sonali Jha, Philippe Batut, Mark Chaisson, and Thomas R Gingeras. 2013a. “STAR: Ultrafast Universal RNA-Seq Aligner..” Bioinformatics (Oxford, England) 29 (1): 15–21. doi:10.1093/bioinformatics/bts635.
Dobin, Alexander, Carrie A Davis, Felix Schlesinger, Jorg Drenkow, Chris Zaleski, Sonali Jha, Philippe Batut, Mark Chaisson, and Thomas R Gingeras. 2013b. “STAR: Ultrafast Universal RNA-Seq Aligner.” Bioinformatics (Oxford, England) 29 (1). Oxford University Press: 15–21. doi:10.1093/bioinformatics/bts635.

Acknowledgements
41
Du, Pan, Warren A Kibbe, and Simon M Lin. 2008. “Lumi: a Pipeline for Processing Illumina Microarray..” Bioinformatics (Oxford, England) 24 (13): 1547–48. doi:10.1093/bioinformatics/ btn224.
Duhen, Thomas, Rebekka Geiger, David Jarrossay, Antonio Lanzavecchia, and Federica Sallusto. 2009. “Production of Interleukin 22 but Not Interleukin 17 by a Subset of Human Skin-Homing Memory T Cells..” Nature Immunology 10 (8): 857–63. doi:10.1038/ni.1767.
Dunn, O J. 1959. “Estimation of the Medians for Dependent Variables on JSTOR.” The Annals of Mathematical Statistics.
Dunn, Olive Jean. 1961. “Multiple Comparisons Among Means.” Journal of the American Statistical Association 56 (293). Taylor & Francis: 52–64. doi:10.1080/01621459.1961.10482090.
Dunning, Mark J, Mike L Smith, Matthew E Ritchie, and Simon Tavaré. 2007. “Beadarray: R Classes and Methods for Illumina Bead-Based Data.” Bioinformatics (Oxford, England) 23 (16). Oxford University Press: 2183–84. doi:10.1093/bioinformatics/btm311.
Durant, Lydia, Wendy T Watford, Haydeé L Ramos, Arian Laurence, Golnaz Vahedi, Lai Wei, Hayato Takahashi, et al. 2010. “Diverse Targets of the Transcription Factor STAT3 Contribute to T Cell Pathogenicity and Homeostasis.” Immunity 32 (5). Cell Press: 605–15. doi:10.1016/ j.immuni.2010.05.003.
Durbin, B P, J S Hardin, D M Hawkins, and D M Rocke. 2002. “A Variance-Stabilizing Transformation for Gene-Expression Microarray Data.” Bioinformatics (Oxford, England) 18 (suppl_1). Oxford University Press: S105–10. doi:10.1093/bioinformatics/18.suppl_1.S105.
Durham, S R, S Ying, V A Varney, M R Jacobson, R M Sudderick, I S Mackay, A B Kay, and Q A Hamid. 1992. “Cytokine Messenger RNA Expression for IL-3, IL-4, IL-5, and Granulocyte/Macrophage-Colony-Stimulating Factor in the Nasal Mucosa After Local Allergen Provocation: Relationship to Tissue Eosinophilia..” Journal of Immunology (Baltimore, Md. : 1950) 148 (8). American Association of Immunologists: 2390–94.
Ebner, C, Z Szépfalusi, F Ferreira, A Jilek, R Valenta, P Parronchi, E Maggi, S Romagnani, O Scheiner, and D Kraft. 1993. “Identification of Multiple T Cell Epitopes on Bet v I, the Major Birch Pollen Allergen, Using Specific T Cell Clones and Overlapping Peptides..” Journal of Immunology (Baltimore, Md. : 1950) 150 (3). American Association of Immunologists: 1047–54.
Eid, John, Adrian Fehr, Jeremy Gray, Khai Luong, John Lyle, Geoff Otto, Paul Peluso, et al. 2009. “Real-Time DNA Sequencing From Single Polymerase Molecules..” Science 323 (5910): 133–38. doi:10.1126/science.1162986.
Elo, Laura L, Henna Järvenpää, Soile Tuomela, Sunil Raghav, Helena Ahlfors, Kirsti Laurila, Bhawna Gupta, et al. 2010. “Genome-Wide Profiling of Interleukin-4 and STAT6 Transcription Factor Regulation of Human Th2 Cell Programming.” Immunity 32 (6). Elsevier Ltd: 852–62. doi:10.1016/j.immuni.2010.06.011.
Epstein, Jason R, Amy P K Leung, Kyong Hoon Lee, and David R Walt. 2003. “High-Density, Microsphere-Based Fiber Optic DNA Microarrays..” Biosensors & Bioelectronics 18 (5-6): 541–46.
Erpenbeck, Veit J, Jens M Hohlfeld, Brunhild Volkmann, Andreas Hagenberg, Henning Geldmacher, Armin Braun, and Norbert Krug. 2003. “Segmental Allergen Challenge in Patients with Atopic Asthma Leads to Increased IL-9 Expression in Bronchoalveolar Lavage Fluid Lymphocytes.” Journal of Allergy and Clinical Immunology 111 (6): 1319–27. doi:10.1067/mai.2003.1485.
Fan, J B, A Oliphant, R Shen, B G Kermani, F Garcia, K L Gunderson, M Hansen, et al. 2003. “Highly Parallel SNP Genotyping..” Cold Spring Harbor Symposia on Quantitative Biology 68: 69–78.
Farnham, Peggy J. 2009. “Insights From Genomic Profiling of Transcription Factors..” Nature Reviews. Genetics 10 (9): 605–16. doi:10.1038/nrg2636.
Fejes, Anthony P, Gordon Robertson, Mikhail Bilenky, Richard Varhol, Matthew Bainbridge, and Steven J M Jones. 2008. “FindPeaks 3.1: a Tool for Identifying Areas of Enrichment From Massively Parallel Short-Read Sequencing Technology.” Bioinformatics (Oxford, England) 24 (15). Oxford University Press: 1729–30. doi:10.1093/bioinformatics/btn305.

Kartiek Kanduri
42
Ferguson, J A, F J Steemers, and D R Walt. 2000. “High-Density Fiber-Optic DNA Random Microsphere Array..” Analytical Chemistry 72 (22): 5618–24.
Feuk, Lars, Andrew R Carson, and Stephen W Scherer. 2006. “Structural Variation in the Human Genome..” Nature Reviews. Genetics 7 (2): 85–97. doi:10.1038/nrg1767.
Fodor, S P, J L Read, M C Pirrung, L Stryer, A T Lu, and D Solas. 1991. “Light-Directed, Spatially Addressable Parallel Chemical Synthesis.” Science 251 (4995). American Association for the Advancement of Science: 767–73. doi:10.1126/science.1990438.
Gallo, Robert C. 2006. “A Reflection on HIV/AIDS Research After 25 Years.” Retrovirology 3 (1). BioMed Central: 72. doi:10.1186/1742-4690-3-72.
Gautier, Laurent, Leslie Cope, Benjamin M Bolstad, and Rafael A Irizarry. 2004. “Affy---Analysis of Affymetrix GeneChip Data at the Probe Level.” Bioinformatics (Oxford, England) 20 (3). Oxford, UK: Oxford University Press: 307–15. doi:10.1093/bioinformatics/btg405.
Gentleman, R, V Carey, W Huber, and F Hahne. 2016. “Genefilter: Genefilter: Methods for Filtering Genes From High-Throughput Experiments.”
Gibbons, John G, Eric M Janson, Chris Todd Hittinger, Mark Johnston, Patrick Abbot, and Antonis Rokas. 2009. “Benchmarking Next-Generation Transcriptome Sequencing for Functional and Evolutionary Genomics..” Molecular Biology and Evolution 26 (12): 2731–44. doi:10.1093/ molbev/msp188.
Grabherr, Manfred G, Brian J Haas, Moran Yassour, Joshua Z Levin, Dawn A Thompson, Ido Amit, Xian Adiconis, et al. 2011. “Full-Length Transcriptome Assembly From RNA-Seq Data Without a Reference Genome..” Nature Biotechnology 29 (7): 644–52. doi:10.1038/nbt.1883.
Gunderson, Kevin L, Frank J Steemers, Hongi Ren, Pauline Ng, Lixin Zhou, Chan Tsan, Weihua Chang, et al. 2006. “Whole-Genome Genotyping..” Methods in Enzymology 410: 359–76. doi:10.1016/S0076-6879(06)10017-8.
Gustafsson, Mika, Danuta R Gawel, Lars Alfredsson, Sergio Baranzini, Janne Björkander, Robert Blomgran, Sandra Hellberg, et al. 2015. “A Validated Gene Regulatory Network and GWAS Identifies Early Regulators of T Cell-Associated Diseases..” Science Translational Medicine 7 (313): 313ra178. doi:10.1126/scitranslmed.aad2722.
Hacia, J G, J B Fan, O Ryder, L Jin, and K Edgemon. 1999. “Determination of Ancestral Alleles for Human Single-Nucleotide Polymorphisms Using High-Density Oligonucleotide Arrays.” Nature.
Hamalainen, Heli, Hua Zhou, William Chou, Hideki Hashizume, Renu Heller, and Riitta Lahesmaa. 2001. “Distinct Gene Expression Profiles of Human Type 1 and Type 2 T Helper Cells.” Genome Biology 2 (7). BioMed Central: research0022.1. doi:10.1186/gb-2001-2-7-research0022.
Hardcastle, Thomas J, and Krystyna A Kelly. 2010. “baySeq: Empirical Bayesian Methods for Identifying Differential Expression in Sequence Count Data.” BMC Bioinformatics 11 (1). BioMed Central: 422. doi:10.1186/1471-2105-11-422.
Harrington, Laurie E, Robin D Hatton, Paul R Mangan, Henrietta Turner, Theresa L Murphy, Kenneth M Murphy, and Casey T Weaver. 2005. “Interleukin 17|[Ndash]|Producing CD4+ Effector T Cells Develop via a Lineage Distinct From the T Helper Type 1 and 2 Lineages.” Nature Immunology 6 (11). Nature Publishing Group: 1123–32. doi:10.1038/ni1254.
Harrow, Jennifer, Adam Frankish, Jose M Gonzalez, Electra Tapanari, Mark Diekhans, Felix Kokocinski, Bronwen L Aken, et al. 2012. “GENCODE: the Reference Human Genome Annotation for the ENCODE Project..” Genome Research 22 (9): 1760–74. doi:10.1101/gr.135350.111.
Hawkins, R David, Antti Larjo, Subhash K Tripathi, Ulrich Wagner, Ying Luu, Tapio Lönnberg, Sunil K Raghav, et al. 2013. “Global Chromatin State Analysis Reveals Lineage-Specific Enhancers During the Initiation of Human T Helper 1 and T Helper 2 Cell Polarization..” Immunity 38 (6): 1271–84. doi:10.1016/j.immuni.2013.05.011.
Heinz, Sven, Christopher Benner, Nathanael Spann, Eric Bertolino, Yin C Lin, Peter Laslo, Jason X Cheng, Cornelis Murre, Harinder Singh, and Christopher K Glass. 2010. “Simple Combinations of Lineage-Determining Transcription Factors Prime Cis-Regulatory Elements Required for

Acknowledgements
43
Macrophage and B Cell Identities..” Molecular Cell 38 (4): 576–89. doi:10.1016/ j.molcel.2010.05.004.
Hertweck, Arnulf, Catherine M Evans, Malihe Eskandarpour, Jonathan C H Lau, Kristine Oleinika, Ian Jackson, Audrey Kelly, et al. 2016. “T-Bet Activates Th1 Genes Through Mediator and the Super Elongation Complex..” Cell Reports 15 (12): 2756–70. doi:10.1016/j.celrep.2016.05.054.
Hodges, Emily, Zhenyu Xuan, Vivekanand Balija, Melissa Kramer, Michael N Molla, Steven W Smith, Christina M Middle, et al. 2007. “Genome-Wide in Situ Exon Capture for Selective Resequencing..” Nature Publishing Group 39 (12): 1522–27. doi:10.1038/ng.2007.42.
Hogeweg, Paulien. 2011. “The Roots of Bioinformatics in Theoretical Biology.” PLoS Computational Biology 7 (3). Public Library of Science: e1002021. doi:10.1371/journal.pcbi.1002021.
Hoheisel, Jörg D. 2006. “Microarray Technology: Beyond Transcript Profiling and Genotype Analysis.” Nature Reviews. Genetics 7 (3): 200–210. doi:10.1038/nrg1809.
Hong, Fangxin, Rainer Breitling, Connor W McEntee, Ben S Wittner, Jennifer L Nemhauser, and Joanne Chory. 2006. “RankProd: a Bioconductor Package for Detecting Differentially Expressed Genes in Meta-Analysis..” Bioinformatics (Oxford, England) 22 (22): 2825–27. doi:10.1093/ bioinformatics/btl476.
Horak, Christine E, and Michael Snyder. 2002. “ChIP-Chip: a Genomic Approach for Identifying Transcription Factor Binding Sites..” Methods in Enzymology 350: 469–83.
Hori, Shohei, Takashi Nomura, and Shimon Sakaguchi. 2003. “Control of Regulatory T Cell Development by the Transcription Factor Foxp3..” Science 299 (5609). American Association for the Advancement of Science: 1057–61. doi:10.1126/science.1079490.
Hsieh, C S, S E Macatonia, C S Tripp, S F Wolf, A O'Garra, and K M Murphy. 1993. “Development of TH1 CD4+ T Cells Through IL-12 Produced by Listeria-Induced Macrophages..” Science 260 (5107): 547–49.
Hu, Gangqing, Qingsong Tang, Suveena Sharma, Fang Yu, Thelma M Escobar, Stefan A Muljo, Jinfang Zhu, and Keji Zhao. 2013. “Expression and Regulation of Intergenic Long Noncoding RNAs During T Cell Development and Differentiation..” Nature Immunology 14 (11): 1190–98. doi:10.1038/ni.2712.
Huang, Da Wei, Brad T Sherman, and Richard A Lempicki. 2009. “Systematic and Integrative Analysis of Large Gene Lists Using DAVID Bioinformatics Resources..” Nature Protocols 4 (1): 44–57. doi:10.1038/nprot.2008.211.
Hubbell, Earl, Wei-Min Liu, and Rui Mei. 2002. “Robust Estimators for Expression Analysis.” Bioinformatics (Oxford, England) 18 (12). Oxford University Press: 1585–92. doi:10.1093/ bioinformatics/18.12.1585.
Huber, Wolfgang, Anja von Heydebreck, Holger Sültmann, Annemarie Poustka, and Martin Vingron. 2002. “Variance Stabilization Applied to Microarray Data Calibration and to the Quantification of Differential Expression.” Bioinformatics (Oxford, England) 18 (suppl_1). Oxford University Press: S96–S104. doi:10.1093/bioinformatics/18.suppl_1.S96.
Huber, Wolfgang, Vincent J Carey, Robert Gentleman, Simon Anders, Marc Carlson, Benilton S Carvalho, Hector Corrada Bravo, et al. 2015. “Orchestrating High-Throughput Genomic Analysis with Bioconductor..” Nature Methods 12 (2): 115–21. doi:10.1038/nmeth.3252.
Irizarry, Rafael A, Benjamin M Bolstad, Francois Collin, Leslie M Cope, Bridget Hobbs, and Terence P Speed. 2003. “Summaries of Affymetrix GeneChip Probe Level Data.” Nucleic Acids Research 31 (4). Oxford University Press: e15–e15. doi:10.1093/nar/gng015.
Irizarry, Rafael A, Bridget Hobbs, Francois Collin, Yasmin D Beazer-Barclay, Kristen J Antonellis, Uwe Scherf, and Terence P Speed. 2003. “Exploration, Normalization, and Summaries of High Density Oligonucleotide Array Probe Level Data..” Biostatistics (Oxford, England) 4 (2): 249–64. doi:10.1093/biostatistics/4.2.249.
Ivanov, Ivaylo I, Brent S McKenzie, Liang Zhou, Carlos E Tadokoro, Alice Lepelley, Juan J Lafaille, Daniel J Cua, and Dan R Littman. 2006. “The Orphan Nuclear Receptor RORgammat Directs the

Kartiek Kanduri
44
Differentiation Program of Proinflammatory IL-17+ T Helper Cells..” Cell 126 (6): 1121–33. doi:10.1016/j.cell.2006.07.035.
Iyer, V R, C E Horak, C S Scafe, D Botstein, M Snyder, and P O Brown. 2001. “Genomic Binding Sites of the Yeast Cell-Cycle Transcription Factors SBF and MBF..” Nature 409 (6819): 533–38. doi:10.1038/35054095.
Ji, Hongkai, Hui Jiang, Wenxiu Ma, David S Johnson, Richard M Myers, and Wing H Wong. 2008. “An Integrated Software System for Analyzing ChIP-Chip and ChIP-Seq Data.” Nature Biotechnology 26 (11). Nature Publishing Group: 1293–1300. doi:10.1038/nbt.1505.
Johnson, David S, Ali Mortazavi, Richard M Myers, and Barbara Wold. 2007. “Genome-Wide Mapping of in Vivo Protein-DNA Interactions.” Science 316 (5830). American Association for the Advancement of Science: 1497–1502. doi:10.1126/science.1141319.
Kagnoff, Martin F. 2007. “Celiac Disease: Pathogenesis of a Model Immunogenetic Disease..” The Journal of Clinical Investigation 117 (1): 41–49. doi:10.1172/JCI30253.
Kallio, M Aleksi, Jarno T Tuimala, Taavi Hupponen, Petri Klemelä, Massimiliano Gentile, Ilari Scheinin, Mikko Koski, Janne Käki, and Eija I Korpelainen. 2011. “Chipster: User-Friendly Analysis Software for Microarray and Other High-Throughput Data..” BMC Genomics 12 (October): 507. doi:10.1186/1471-2164-12-507.
Kanduri, Kartiek, Subhash Tripathi, Antti Larjo, Henrik Mannerström, Ubaid Ullah, Riikka Lund, R David Hawkins, Bing Ren, Harri Lähdesmäki, and Riitta Lahesmaa. 2015. “Identification of Global Regulators of T-Helper Cell Lineage Specification..” Genome Medicine 7 (1): 122. doi:10.1186/s13073-015-0237-0.
Kilpinen, Helena, and Jeffrey C Barrett. 2013. “How Next-Generation Sequencing Is Transforming Complex Disease Genetics..” Trends in Genetics : TIG 29 (1): 23–30. doi:10.1016/ j.tig.2012.10.001.
Kim, Daehwan, Geo Pertea, Cole Trapnell, Harold Pimentel, Ryan Kelley, and Steven L Salzberg. 2013. “TopHat2: Accurate Alignment of Transcriptomes in the Presence of Insertions, Deletions and Gene Fusions..” Genome Biology 14 (4): R36. doi:10.1186/gb-2013-14-4-r36.
Kitano, Hiroaki. 2002. “Systems Biology: a Brief Overview.” Science 295 (5560). American Association for the Advancement of Science: 1662–64. doi:10.1126/science.1069492.
Konopka, Genevieve, Tara Friedrich, Jeremy Davis-Turak, Kellen Winden, Michael C Oldham, Fuying Gao, Leslie Chen, et al. 2012. “Human-Specific Transcriptional Networks in the Brain..” Neuron 75 (4): 601–17. doi:10.1016/j.neuron.2012.05.034.
Koues, Olivia I, Patrick L Collins, Marina Cella, Michelle L Robinette, Sofia I Porter, Sarah C Pyfrom, Jacqueline E Payton, Marco Colonna, and Eugene M Oltz. 2016. “Distinct Gene Regulatory Pathways for Human Innate Versus Adaptive Lymphoid Cells..” Cell 165 (5): 1134–46. doi:10.1016/j.cell.2016.04.014.
Kulakovskiy, I V, V A Boeva, A V Favorov, and V J Makeev. 2010. “Deep and Wide Digging for Binding Motifs in ChIP-Seq Data.” Bioinformatics (Oxford, England) 26 (20). Oxford University Press: 2622–23. doi:10.1093/bioinformatics/btq488.
Lander, E S, L M Linton, B Birren, C Nusbaum, M C Zody, J Baldwin, K Devon, et al. 2001. “Initial Sequencing and Analysis of the Human Genome.” Nature, February. Macmillan Publishers Ltd. doi:10.1038/35057062.
Landt, S G, G K Marinov, A Kundaje, P Kheradpour, F Pauli, S Batzoglou, B E Bernstein, et al. 2012. “ChIP-Seq Guidelines and Practices of the ENCODE and modENCODE Consortia.” Genome Research 22 (9): 1813–31. doi:10.1101/gr.136184.111.
Langmead, Ben, and Steven L Salzberg. 2012. “Fast Gapped-Read Alignment with Bowtie 2..” Nature Methods 9 (4): 357–59. doi:10.1038/nmeth.1923.
Lee, H J, J E Suk, C Patrick, E J Bae, J H Cho, S Rho, D Hwang, E Masliah, and S J Lee. 2010. “Direct Transfer of -Synuclein From Neuron to Astroglia Causes Inflammatory Responses in Synucleinopathies.” Journal of Biological Chemistry 285 (12): 9262–72. doi:10.1074/ jbc.M109.081125.

Acknowledgements
45
Leung, Bernard P, Iain B McInnes, Ehsan Esfandiari, Xiao-Qing Wei, and Foo Y Liew. 2000. “Combined Effects of IL-12 and IL-18 on the Induction of Collagen-Induced Arthritis.” Journal of Immunology (Baltimore, Md. : 1950) 164 (12). American Association of Immunologists: 6495–6502. doi:10.4049/jimmunol.164.12.6495.
Li, Heng, and Richard Durbin. 2009. “Fast and Accurate Short Read Alignment with Burrows–Wheeler Transform.” Bioinformatics (Oxford, England) 25 (14). Oxford University Press: 1754–60. doi:10.1093/bioinformatics/btp324.
Liu, L, Y Li, S Li, N Hu, Y He, and R Pong. 2012. “Comparison of Next-Generation Sequencing Systems.” BioMed Research ….
Lo, Yuan-Hsin, Kan Torii, Chiyo Saito, Takuya Furuhashi, Akira Maeda, and Akimichi Morita. 2010. “Serum IL-22 Correlates with Psoriatic Severity and Serum IL-6 Correlates with Susceptibility to Phototherapy.” Journal of Dermatological Science 58 (3). Elsevier: 225–27. doi:10.1016/ j.jdermsci.2010.03.018.
Lockhart, D J, H Dong, M C Byrne, M T Follettie, M V Gallo, M S Chee, M Mittmann, et al. 1996. “Expression Monitoring by Hybridization to High-Density Oligonucleotide Arrays..” Nature Biotechnology 14 (13): 1675–80. doi:10.1038/nbt1296-1675.
Lund, Riikka J, Maritta Löytömäki, Tiina Naumanen, Craig Dixon, Zhi Chen, Helena Ahlfors, Soile Tuomela, et al. 2007. “Genome-Wide Identification of Novel Genes Involved in Early Th1 and Th2 Cell Differentiation..” Journal of Immunology (Baltimore, Md. : 1950) 178 (6): 3648–60.
Lund, Riikka, Tero Aittokallio, Olli Nevalainen, and Riitta Lahesmaa. 2003a. “Identification of Novel Genes Regulated by IL-12, IL-4, or TGF-Β During the Early Polarization of CD4+ Lymphocytes.” Journal of Immunology (Baltimore, Md. : 1950) 171 (10). American Association of Immunologists: 5328–36. doi:10.4049/jimmunol.171.10.5328.
Lund, Riikka, Tero Aittokallio, Olli Nevalainen, and Riitta Lahesmaa. 2003b. “Identification of Novel Genes Regulated by IL-12, IL-4, or TGF-Β During the Early Polarization of CD4+ Lymphocytes.” Journal of Immunology (Baltimore, Md. : 1950) 171 (10). American Association of Immunologists: 5328–36. doi:10.4049/jimmunol.171.10.5328.
Machanick, Philip, and Timothy L Bailey. 2011. “MEME-ChIP: Motif Analysis of Large DNA Datasets.” Bioinformatics (Oxford, England) 27 (12). Oxford University Press: 1696–97. doi:10.1093/bioinformatics/btr189.
Margulies, Marcel, Michael Egholm, William E Altman, Said Attiya, Joel S Bader, Lisa A Bemben, Jan Berka, et al. 2005. “Genome Sequencing in Microfabricated High-Density Picolitre Reactors..” Nature 437 (7057): 376–80. doi:10.1038/nature03959.
Martin, Marcel. 2011. “Cutadapt Removes Adapter Sequences From High-Throughput Sequencing Reads.” EMBnet.Journal 17 (1): pp.10–pp.12. doi:10.14806/ej.17.1.200.
Marx, Vivien. 2013. “Biology: the Big Challenges of Big Data.” Nature 498 (7453). Nature Research: 255–60. doi:10.1038/498255a.
MATLAB. 2017. Version 9.2.0 (R2017a). Natick, Massachusetts: The MathWorks Inc. Mattmann, Chris A. 2013. “Computing: a Vision for Data Science.” Nature 493 (7433). Nature
Research: 473–75. doi:10.1038/493473a. Metzker, Michael L. 2009. “Sequencing Technologies — the Next Generation.” Nature Reviews.
Genetics 11 (1): 31–46. doi:10.1038/nrg2626. Mondal, Tanmoy, Markus Rasmussen, Gaurav Kumar Pandey, Anders Isaksson, and Chandrasekhar
Kanduri. 2010. “Characterization of the RNA Content of Chromatin..” Genome Research 20 (7). Cold Spring Harbor Lab: 899–907. doi:10.1101/gr.103473.109.
Morgan, Martin, Seth Falcon, and Robert Gentleman. 2017. “GSEABase: Gene Set Enrichment Data Structures and Methods.”
Mortazavi, Ali, Brian A Williams, Kenneth McCue, Lorian Schaeffer, and Barbara Wold. 2008. “Mapping and Quantifying Mammalian Transcriptomes by RNA-Seq..” Nature Methods 5 (7): 621–28. doi:10.1038/nmeth.1226.

Kartiek Kanduri
46
Nakae, Susumu, Aya Nambu, Katsuko Sudo, and Yoichiro Iwakura. 2003. “Suppression of Immune Induction of Collagen-Induced Arthritis in IL-17-Deficient Mice.” Journal of Immunology (Baltimore, Md. : 1950) 171 (11). American Association of Immunologists: 6173–77. doi:10.4049/jimmunol.171.11.6173.
Nielsen, Jens, and Stephen Oliver. 2005. “The Next Wave in Metabolome Analysis.” Trends in Biotechnology 23 (11): 544–46. doi:10.1016/j.tibtech.2005.08.005.
Nikula, T, A West, M Katajamaa, T Lönnberg, R Sara, T Aittokallio, O S Nevalainen, and R Lahesmaa. 2005. “A Human ImmunoChip cDNA Microarray Provides a Comprehensive Tool to Study Immune Responses..” Journal of Immunological Methods 303 (1-2): 122–34. doi:10.1016/j.jim.2005.06.004.
Nistala, Kiran, Stuart Adams, Helen Cambrook, Simona Ursu, Biagio Olivito, Wilco de Jager, Jamie G Evans, Rolando Cimaz, Mona Bajaj-Elliott, and Lucy R Wedderburn. 2010. “Th17 Plasticity in Human Autoimmune Arthritis Is Driven by the Inflammatory Environment.” Proceedings of the National Academy of Sciences of the United States of America 107 (33). National Acad Sciences: 14751–56. doi:10.1073/pnas.1003852107.
Nurieva, R I, Y Chung, D Hwang, X O Yang, and H S Kang. 2008. “Generation of T Follicular Helper Cells Is Mediated by Interleukin-21 but Independent of T Helper 1, 2, or 17 Cell Lineages.” Immunity.
Pachter, Lior. 2011. “Models for Transcript Quantification From RNA-Seq.” arXiv.org. Pakala, Syamasundar V, Marylee Chivetta, Colleen B Kelly, and Jonathan D Katz. 1999. “In
Autoimmune Diabetes the Transition From Benign to Pernicious Insulitis Requires an Islet Cell Response to Tumor Necrosis Factor Α.” Journal of Experimental Medicine 189 (7). Rockefeller University Press: 1053–62. doi:10.1084/jem.189.7.1053.
Park, Heon, Zhaoxia Li, Xuexian O Yang, Seon Hee Chang, Roza Nurieva, Yi-Hong Wang, Ying Wang, et al. 2005. “A Distinct Lineage of CD4 T Cells Regulates Tissue Inflammation by Producing Interleukin 17..” Nature Immunology 6 (11). NIH Public Access: 1133–41. doi:10.1038/ni1261.
Park, Peter J. 2009. “ChIP-Seq: Advantages and Challenges of a Maturing Technology..” Nature Reviews. Genetics 10 (10): 669–80. doi:10.1038/nrg2641.
Parronchi, P, P Romagnani, F Annunziato, S Sampognaro, A Becchio, L Giannarini, E Maggi, C Pupilli, F Tonelli, and S Romagnani. 1997. “Type 1 T-Helper Cell Predominance and Interleukin-12 Expression in the Gut of Patients with Crohn's Disease..” The American Journal of Pathology 150 (3). American Society for Investigative Pathology: 823.
Patro, Rob, Stephen M Mount, and Carl Kingsford. 2014. “Sailfish Enables Alignment-Free Isoform Quantification From RNA-Seq Reads Using Lightweight Algorithms..” Nature Biotechnology 32 (5): 462–64. doi:10.1038/nbt.2862.
Pease, A C, D Solas, and E J Sullivan. 1994. “Light-Generated Oligonucleotide Arrays for Rapid DNA Sequence Analysis.” In.
Pollack, J R, C M Perou, A A Alizadeh, and M B Eisen. 1999. “Genome-Wide Analysis of DNA Copy-Number Changes Using cDNA Microarrays.” Nature.
Pushkarev, Dmitry, Norma F Neff, and Stephen R Quake. 2009. “Single-Molecule Sequencing of an Individual Human Genome..” Nature Biotechnology 27 (9): 847–50. doi:10.1038/nbt.1561.
Quinlan, Aaron R, and Ira M Hall. 2010. “BEDTools: a Flexible Suite of Utilities for Comparing Genomic Features.” Bioinformatics (Oxford, England) 26 (6): 841–42. doi:10.1093/ bioinformatics/btq033.
R Core Team. 2016. “R: a Language and Environment for Statistical Computing.” Vienna, Austria. Ranzani, Valeria, Grazisa Rossetti, Ilaria Panzeri, Alberto Arrigoni, Raoul J P Bonnal, Serena Curti,
Paola Gruarin, et al. 2015. “The Long Intergenic Noncoding RNA Landscape of Human Lymphocytes Highlights the Regulation of T Cell Differentiation by Linc-MAF-4..” Nature Immunology 16 (3): 318–25. doi:10.1038/ni.3093.

Acknowledgements
47
Redondo, M J, P R Fain, and G S Eisenbarth. 2001. “Genetics of Type 1A Diabetes..” Recent Progress in Hormone Research 56: 69–89. doi:10.1210/rp.56.1.69.
Ritchie, M E, B Phipson, D Wu, and Y Hu. 2015. “Limma Powers Differential Expression Analyses for RNA-Sequencing and Microarray Studies | Nucleic Acids Research | Oxford Academic.” Nucleic Acids ….
Ritchie, Matthew E, Belinda Phipson, Di Wu, Yifang Hu, Charity W Law, Wei Shi, and Gordon K Smyth. 2015. “Limma Powers Differential Expression Analyses for RNA-Sequencing and Microarray Studies.” Nucleic Acids Research 43 (7): e47.
Robinson, Douglas S, Qutayba Hamid, Sun Ying, Anne Tsicopoulos, Julia Barkans, Andrew M Bentley, Christopher Corrigan, Stephen R Durham, and A Barry Kay. 1992. “Predominant TH2-Like Bronchoalveolar T-Lymphocyte Population in Atopic Asthma.” Dx.Doi.org, January. Massachusetts Medical Society. doi:10.1056/NEJM199201303260504.
Robinson, M D, and A Oshlack. 2010. “A Scaling Normalization Method for Differential Expression Analysis of RNA-Seq Data | Genome Biology | Full Text.” Genome Biology.
Robinson, Mark D, Davis J McCarthy, and Gordon K Smyth. 2010. “edgeR: a Bioconductor Package for Differential Expression Analysis of Digital Gene Expression Data.” Bioinformatics (Oxford, England) 26 (1). Oxford University Press: 139–40. doi:10.1093/bioinformatics/btp616.
Rogge, L, E Bianchi, M Biffi, E Bono, S Y Chang, H Alexander, C Santini, et al. 2000. “Transcript Imaging of the Development of Human T Helper Cells Using Oligonucleotide Arrays..” Nature Genetics 25 (1): 96–101. doi:10.1038/75671.
Rozowsky, Joel, Ghia Euskirchen, Raymond K Auerbach, Zhengdong D Zhang, Theodore Gibson, Robert Bjornson, Nicholas Carriero, Michael Snyder, and Mark B Gerstein. 2009. “PeakSeq Enables Systematic Scoring of ChIP-Seq Experiments Relative to Controls.” Nature Biotechnology 27 (1). Nature Publishing Group: 66–75. doi:10.1038/nbt.1518.
Rusca, Nicole, Lorenzo Dehò, Sara Montagner, Christina E Zielinski, Antonio Sica, Federica Sallusto, and Silvia Monticelli. 2012. “MiR-146a and NF-κB1 Regulate Mast Cell Survival and T Lymphocyte Differentiation..” Molecular and Cellular Biology 32 (21): 4432–44. doi:10.1128/MCB.00824-12.
Sanger, F, and S Nicklen. 1977. “DNA Sequencing with Chain-Terminating Inhibitors.” In. Saunders, Carol Jean, Neil Andrew Miller, Sarah Elizabeth Soden, Darrell Lee Dinwiddie, Aaron Noll,
Noor Abu Alnadi, Nevene Andraws, et al. 2012. “Rapid Whole-Genome Sequencing for Genetic Disease Diagnosis in Neonatal Intensive Care Units..” Science Translational Medicine 4 (154): 154ra135. doi:10.1126/scitranslmed.3004041.
Schadt, Eric E, Steve Turner, and Andrew Kasarskis. 2010. “A Window Into Third-Generation Sequencing..” Human Molecular Genetics 19 (R2): R227–40. doi:10.1093/hmg/ddq416.
Schloss, Jeffery A. 2008. “How to Get Genomes at One Ten-Thousandth the Cost..” Nature Biotechnology 26 (10): 1113–15. doi:10.1038/nbt1008-1113.
Schmieder, Robert, and Robert Edwards. 2011. “Quality Control and Preprocessing of Metagenomic Datasets..” Bioinformatics (Oxford, England) 27 (6): 863–64. doi:10.1093/bioinformatics/btr026.
Schwender, Holger. 2012. “Siggenes: Multiple Testing Using SAM and Efron's Empirical Bayes Approaches.”
Sergushichev, Alexey. 2016. “An Algorithm for Fast Preranked Gene Set Enrichment Analysis Using Cumulative Statistic Calculation.” bioRxiv. Cold Spring Harbor Labs Journals. doi:10.1101/ 060012.
Seumois, Grégory, Lukas Chavez, Anna Gerasimova, Matthias Lienhard, Nada Omran, Lukas Kalinke, Maria Vedanayagam, et al. 2014. “Epigenomic Analysis of Primary Human T Cells Reveals Enhancers Associated with TH2 Memory Cell Differentiation and Asthma Susceptibility..” Nature Immunology 15 (8): 777–88. doi:10.1038/ni.2937.
Shaw, G M, B H Hahn, S K Arya, J E Groopman, R C Gallo, and F Wong-Staal. 1984. “Molecular Characterization of Human T-Cell Leukemia (Lymphotropic) Virus Type III in the Acquired Immune Deficiency Syndrome..” Science 226 (4679): 1165–71.

Kartiek Kanduri
48
Shimbara, Ayako, Pota Christodoulopoulos, Abdelilah Soussi-Gounni, Ronald Olivenstein, Yutaka Nakamura, Roy C Levitt, Nicholas C Nicolaides, et al. 2000. “IL-9 and Its Receptor in Allergic and Nonallergic Lung Disease: Increased Expression in Asthma.” Journal of Allergy and Clinical Immunology 105 (1): 108–15. doi:10.1016/S0091-6749(00)90185-4.
Simon Andrews. 2016. “FastQC: a Quality Control Tool for High Throughput Sequence Data.” Simpson, Nicholas, Paul A Gatenby, Anastasia Wilson, Shreya Malik, David A Fulcher, Stuart G
Tangye, Harinder Manku, et al. 2010. “Expansion of Circulating T Cells Resembling Follicular Helper T Cells Is a Fixed Phenotype That Identifies a Subset of Severe Systemic Lupus Erythematosus.” Arthritis & Rheumatology 62 (1). Wiley Subscription Services, Inc., A Wiley Company: 234–44. doi:10.1002/art.25032.
Smyth, Gordon K. 2004. “Linear Models and Empirical Bayes Methods for Assessing Differential Expression in Microarray Experiments..” Statistical Applications in Genetics and Molecular Biology 3: Article3. doi:10.2202/1544-6115.1027.
Sollid, Ludvig M. 2002. “Coeliac Disease: Dissecting a Complex Inflammatory Disorder..” Nature Reviews. Immunology 2 (9): 647–55. doi:10.1038/nri885.
Solomon, M J, P L Larsen, and A Varshavsky. 1988. “Mapping Protein-DNA Interactions in Vivo with Formaldehyde: Evidence That Histone H4 Is Retained on a Highly Transcribed Gene..” Cell 53 (6): 937–47.
Soroosh, Pejman, and Taylor A Doherty. 2009. “Th9 and Allergic Disease.” Immunology 127 (4). Blackwell Publishing Ltd: 450–58. doi:10.1111/j.1365-2567.2009.03114.x.
Spurlock, Charles F, John T Tossberg, Yan Guo, Sarah P Collier, Philip S Crooke, and Thomas M Aune. 2015. “Expression and Functions of Long Noncoding RNAs During Human T Helper Cell Differentiation..” Nature Communications 6 (April). NIH Public Access: 6932. doi:10.1038/ ncomms7932.
Steemers, F J, J A Ferguson, and D R Walt. 2000. “Screening Unlabeled DNA Targets with Randomly Ordered Fiber-Optic Gene Arrays..” Nature Biotechnology 18 (1): 91–94. doi:10.1038/72006.
Stentz, Frankie B, and Abbas E Kitabchi. 2004. “Transcriptome and Proteome Expression in Activated Human CD4 and CD8 T-Lymphocytes..” Biochemical and Biophysical Research Communications 324 (2): 692–96. doi:10.1016/j.bbrc.2004.09.113.
Subramanian, Aravind, Pablo Tamayo, Vamsi K Mootha, Sayan Mukherjee, Benjamin L Ebert, Michael A Gillette, Amanda Paulovich, et al. 2005. “Gene Set Enrichment Analysis: a Knowledge-Based Approach for Interpreting Genome-Wide Expression Profiles..” Proceedings of the National Academy of Sciences of the United States of America 102 (43): 15545–50. doi:10.1073/pnas.0506580102.
Swain, S L, A D Weinberg, M English, and G Huston. 1990. “IL-4 Directs the Development of Th2-Like Helper Effectors..” Journal of Immunology (Baltimore, Md. : 1950) 145 (11): 3796–3806.
Szabo, Susanne J, Sean T Kim, Gina L Costa, Xiankui Zhang, C Garrison Fathman, and Laurie H Glimcher. 2000. “A Novel Transcription Factor, T-Bet, Directs Th1 Lineage Commitment.” Cell 100 (6): 655–69. doi:10.1016/S0092-8674(00)80702-3.
t Hoen, P A C, Y Ariyurek, H H Thygesen, E Vreugdenhil, R H A M Vossen, R X de Menezes, J M Boer, G J B van Ommen, and J T den Dunnen. 2008. “Deep Sequencing-Based Expression Analysis Shows Major Advances in Robustness, Resolution and Inter-Lab Portability Over Five Microarray Platforms.” Nucleic Acids Research 36 (21): e141–41. doi:10.1093/nar/gkn705.
Tada, T, T Takemori, K Okumura, M Nonaka, and T Tokuhisa. 1978. “Two Distinct Types of Helper T Cells Involved in the Secondary Antibody Response: Independent and Synergistic Effects of Ia- and Ia+ Helper T Cells..” Journal of Experimental Medicine 147 (2). Rockefeller University Press: 446–58. doi:10.1084/jem.147.2.446.
Thomas-Chollier, Morgane, Carl Herrmann, Matthieu Defrance, Olivier Sand, Denis Thieffry, and Jacques van Helden. 2012. “RSAT Peak-Motifs: Motif Analysis in Full-Size ChIP-Seq Datasets.” Nucleic Acids Research 40 (4). Oxford University Press: e31–e31. doi:10.1093/nar/gkr1104.

Acknowledgements
49
Tibshirani, Rob, G Chu, Balasubramanian Narasimhan, and Jun Li. 2011. “Samr: Significance Analysis of Microarrays.”
Touzot, Maxime, Maximilien Grandclaudon, Antonio Cappuccio, Takeshi Satoh, Carolina Martinez-Cingolani, Nicolas Servant, Nicolas Manel, and Vassili Soumelis. 2014. “Combinatorial Flexibility of Cytokine Function During Human T Helper Cell Differentiation..” Nature Communications 5 (May): 3987. doi:10.1038/ncomms4987.
Trapnell, Cole, Lior Pachter, and Steven L Salzberg. 2009. “TopHat: Discovering Splice Junctions with RNA-Seq.” Bioinformatics (Oxford, England) 25 (9): 1105–11. doi:10.1093/bioinformatics/ btp120.
Trevino, Victor, Francesco Falciani, and Hugo A Barrera-Saldaña. 2007. “DNA Microarrays: a Powerful Genomic Tool for Biomedical and Clinical Research..” Molecular Medicine (Cambridge, Mass.) 13 (9-10): 527–41. doi:10.2119/2006-00107.Trevino.
Trifari, Sara, Charles D Kaplan, Elise H Tran, Natasha K Crellin, and Hergen Spits. 2009. “Identification of a Human Helper T Cell Population That Has Abundant Production of Interleukin 22 and Is Distinct From T(H)-17, T(H)1 and T(H)2 Cells..” Nature Immunology 10 (8): 864–71. doi:10.1038/ni.1770.
Tuomela, Soile, Sini Rautio, Helena Ahlfors, Viveka Öling, Verna Salo, Ubaid Ullah, Zhi Chen, et al. 2016. “Comparative Analysis of Human and Mouse Transcriptomes of Th17 Cell Priming..” Oncotarget 7 (12): 13416–28. doi:10.18632/oncotarget.7963.
Tuomela, Soile, Verna Salo, Subhash K Tripathi, Zhi Chen, Kirsti Laurila, Bhawna Gupta, Tarmo Äijö, et al. 2012. “Identification of Early Gene Expression Changes During Human Th17 Cell Differentiation..” Blood 119 (23): e151–60. doi:10.1182/blood-2012-01-407528.
Tusher, V G, R Tibshirani, and G Chu. 2001. “Significance Analysis of Microarrays Applied to the Ionizing Radiation Response.” In.
Ubaid Ullah, Syed Bilal Ahmad Andrabi, Subhash Kumar Tripathi, Obaiah Dirasantha, Kartiek Kanduri, Sini Rautio, Catharina C Gross, et al. 2018. “Transcriptional Repressor HIC1 Contributes to Suppressive Function of Human Induced Regulatory T Cells..” Cell Reports 22 (8): 2094–2106. doi:10.1016/j.celrep.2018.01.070.
Vahedi, Golnaz, Hayato Takahashi, Shingo Nakayamada, Hong-Wei Sun, Vittorio Sartorelli, Yuka Kanno, and John J O'Shea. 2012. “STATs Shape the Active Enhancer Landscape of T Cell Populations.” Cell 151 (5). Cell Press: 981–93. doi:10.1016/j.cell.2012.09.044.
Valouev, Anton, David S Johnson, Andreas Sundquist, Catherine Medina, Elizabeth Anton, Serafim Batzoglou, Richard M Myers, and Arend Sidow. 2008. “Genome-Wide Analysis of Transcription Factor Binding Sites Based on ChIP-Seq Data.” Nature Methods 5 (9). Nature Publishing Group: 829–34. doi:10.1038/nmeth.1246.
Valouev, Anton, Jeffrey Ichikawa, Thaisan Tonthat, Jeremy Stuart, Swati Ranade, Heather Peckham, Kathy Zeng, et al. 2008. “A High-Resolution, Nucleosome Position Map of C. Elegans Reveals a Lack of Universal Sequence-Dictated Positioning..” Genome Research 18 (7): 1051–63. doi:10.1101/gr.076463.108.
van Bakel, Harm. 2011. “Interactions of Transcription Factors with Chromatin..” Sub-Cellular Biochemistry 52 (3). Dordrecht: Springer Netherlands: 223–59. doi:10.1007/978-90-481-9069-0_11.
van Hamburg, J P, P S Asmawidjaja, N Davelaar, A M C Mus, E M Colin, J M W Hazes, R J E M Dolhain, and E Lubberts. 2011. “Th17 Cells, but Not Th1 Cells, From Patients with Early Rheumatoid Arthritis Are Potent Inducers of Matrix Metalloproteinases and Proinflammatory Cytokines Upon Synovial Fibroblast Interaction, Including Autocrine Interleukin‐17A Production.” Arthritis & Rheumatology 63 (1). Wiley Subscription Services, Inc., A Wiley Company: 73–83. doi:10.1002/art.30093.
Veldhoen, Marc, Catherine Uyttenhove, Jacques van Snick, Helena Helmby, Astrid Westendorf, Jan Buer, Bruno Martin, Christoph Wilhelm, and Brigitta Stockinger. 2008. “Transforming Growth Factor-|[Beta]| ‘Reprograms’ the Differentiation of T Helper 2 Cells and Promotes an Interleukin

Kartiek Kanduri
50
9|[Ndash]|Producing Subset.” Nature Immunology 9 (12). Nature Publishing Group: 1341–46. doi:10.1038/ni.1659.
Venet, David. 2003. “MatArray: a Matlab Toolbox for Microarray Data..” Bioinformatics (Oxford, England) 19 (5): 659–60.
Venter, J Craig, Mark D Adams, Eugene W Myers, Peter W Li, Richard J Mural, Granger G Sutton, Hamilton O Smith, et al. 2001. “The Sequence of the Human Genome.” Science 291 (5507). American Association for the Advancement of Science: 1304–51. doi:10.1126/science.1058040.
Wang, B O, I André, and A Gonzalez. 1997. “Interferon-Γ Impacts at Multiple Points During the Progression of Autoimmune Diabetes.” In.
Wang, D G, J B Fan, C J Siao, A Berno, P Young, R Sapolsky, G Ghandour, et al. 1998. “Large-Scale Identification, Mapping, and Genotyping of Single-Nucleotide Polymorphisms in the Human Genome..” Science 280 (5366): 1077–82.
Wang, Liguo, Shengqin Wang, and Wei Li. 2012. “RSeQC: Quality Control of RNA-Seq Experiments.” Bioinformatics (Oxford, England) 28 (16): 2184–85. doi:10.1093/bioinformatics/ bts356.
Wang, Min, Dirk Windgassen, and Eleftherios T Papoutsakis. 2008a. “Comparative Analysis of Transcriptional Profiling of CD3+, CD4+ and CD8+ T Cells Identifies Novel Immune Response Players in T-Cell Activation.” BMC Genomics 9 (1). BioMed Central: 225. doi:10.1186/1471-2164-9-225.
Wang, Min, Dirk Windgassen, and Eleftherios T Papoutsakis. 2008b. “A Global Transcriptional View of Apoptosis in Human T-Cell Activation..” BMC Medical Genomics 1 (October): 53. doi:10.1186/1755-8794-1-53.
Wang, Weichen, Zhiyi Qin, Zhixing Feng, Xi Wang, and Xuegong Zhang. 2013. “Identifying Differentially Spliced Genes From Two Groups of RNA-Seq Samples.” Gene 518 (1): 164–70. doi:10.1016/j.gene.2012.11.045.
Weinstein, Jason S, Kimberly Lezon-Geyda, Yelena Maksimova, Samuel Craft, Yaoping Zhang, Mack Su, Vincent P Schulz, Joseph Craft, and Patrick G Gallagher. 2014. “Global Transcriptome Analysis and Enhancer Landscape of Human Primary T Follicular Helper and T Effector Lymphocytes..” Blood 124 (25): 3719–29. doi:10.1182/blood-2014-06-582700.
Wodicka, L, H Dong, M Mittmann, M H Ho, and D J Lockhart. 1997. “Genome-Wide Expression Monitoring in Saccharomyces Cerevisiae..” Nature Biotechnology 15 (13): 1359–67. doi:10.1038/nbt1297-1359.
Wu, Zhijin, Rafael A Irizarry, Robert Gentleman, Francisco Martinez-Murillo, and Forrest Spencer. 2004. “A Model-Based Background Adjustment for Oligonucleotide Expression Arrays.” Journal of the American Statistical Association, December. Taylor & Francis. doi:10.1198/ 016214504000000683.
Yamada, H, Y Nakashima, K Okazaki, T Mawatari, J-I Fukushi, N Kaibara, A Hori, Y Iwamoto, and Y Yoshikai. 2008. “Th1 but Not Th17 Cells Predominate in the Joints of Patients with Rheumatoid Arthritis.” Annals of the Rheumatic Diseases 67 (9). BMJ Publishing Group Ltd: 1299–1304. doi:10.1136/ard.2007.080341.
Yen, David, Jeanne Cheung, Heleen Scheerens, Frédérique Poulet, Terrill McClanahan, Brent Mckenzie, Melanie A Kleinschek, et al. 2006. “IL-23 Is Essential for T Cell-Mediated Colitis and Promotes Inflammation via IL-17 and IL-6..” The Journal of Clinical Investigation 116 (5). American Society for Clinical Investigation: 1310–16. doi:10.1172/JCI21404.
Yssel, H, K E Johnson, P V Schneider, J Wideman, A Terr, R Kastelein, and J E De Vries. 1992. “T Cell Activation-Inducing Epitopes of the House Dust Mite Allergen Der P I. Proliferation and Lymphokine Production Patterns by Der P I-Specific CD4+ T Cell Clones..” Journal of Immunology (Baltimore, Md. : 1950) 148 (3). American Association of Immunologists: 738–45.
Zhang, Huan, Colm E Nestor, Shuli Zhao, Antonio Lentini, Barbara Bohle, Mikael Benson, and Hui Wang. 2013. “Profiling of Human CD4+ T-Cell Subsets Identifies the TH2-Specific Noncoding

Acknowledgements
51
RNA GATA3-AS1..” The Journal of Allergy and Clinical Immunology 132 (4): 1005–8. doi:10.1016/j.jaci.2013.05.033.
Zhang, Lei, Yong-gang Li, Yu-hua Li, Lei Qi, Xin-guang Liu, Cun-zhong Yuan, Nai-wen Hu, et al. 2012. “Increased Frequencies of Th22 Cells as Well as Th17 Cells in the Peripheral Blood of Patients with Ankylosing Spondylitis and Rheumatoid Arthritis.” PloS One 7 (4). Public Library of Science: e31000. doi:10.1371/journal.pone.0031000.
Zhang, Yong, Tao Liu, Clifford A Meyer, Jérôme Eeckhoute, David S Johnson, Bradley E Bernstein, Chad Nusbaum, et al. 2008. “Model-Based Analysis of ChIP-Seq (MACS)..” Genome Biology 9 (9): R137. doi:10.1186/gb-2008-9-9-r137.
Zheng, W, and R A Flavell. 1997. “The Transcription Factor GATA-3 Is Necessary and Sufficient for Th2 Cytokine Gene Expression in CD4 T Cells..” Cell 89 (4): 587–96.
Zhu, Chenlu, Jie Ma, Yingzhao Liu, Jia Tong, Jie Tian, Jianguo Chen, Xinyi Tang, Huaxi Xu, Liwei Lu, and Shengjun Wang. 2012. “Increased Frequency of Follicular Helper T Cells in Patients with Autoimmune Thyroid Disease.” The Journal of Clinical Endocrinology & Metabolism 97 (3). Oxford University Press: 943–50. doi:10.1210/jc.2011-2003.

Kartiek KanduriD
1490A
NN
ALES U
NIV
ERSITATIS TURK
UEN
SIS
ISBN 978-951-29-8070-3 (PRINT)ISBN 978-951-29-8071-0 (PDF)
ISSN 0355-9483 (Print)ISSN 2343-3213 (Online)
Pain
osal
ama
Oy,
Turk
u, F
inla
nd 2
020
TURUN YLIOPISTON JULKAISUJA – ANNALES UNIVERSITATIS TURKUENSIS
SARJA - SER. D OSA - TOM. 1490 | MEDICA - ODONTOLOGICA | TURKU 2020
INTEGRATION OF GENOME-WIDE DATASETS
TO UNDERSTAND REGULATION OF
HUMAN T-HELPER CELL DIFFERENTIATION
Kartiek Kanduri