Single-cell genome-wide bisulfite sequencing for assessing epigenetic heterogeneity

Ethnicity, Body Mass, and Genome-Wide Data
Jason D. Boardman1, Casey L. Blalock1, Robin P. Corley2, Michael C. Stallings2, BenjaminW. Domingue3, Matthew B. McQueen2, Thomas J. Crowley4, John K. Hewitt1, Ying Lu5, andSamuel H. Field6
1Institute of Behavioral Science and University of Colorado Population Center, University ofColorado, Boulder, Colorado2Institute for Behavioral Genetics and University of Colorado, Boulder, Colorado3School of Education, University of Colorado, Boulder, Colorado4Department of Psychiatry, University of Colorado, Boulder, Colorado5Department of Applied Statistics, New York University, New York, New York6FPG Child Development Institute, University of North Carolina, Chapel Hill, North Carolina
AbstractThis article combines social and genetic epidemiology to examine the influence of self-reportedethnicity on body mass index (BMI) among a sample of adolescents and young adults. We usegenetic information from more than 5,000 single nucleotide polymorphisms in combination withprincipal components analysis to characterize population ancestry of individuals in this study. Weshow that non-Hispanic white and Mexican-American respondents differ significantly with respectto BMI and differ on the first principal component from the genetic data. This first component ispositively associated with BMI and accounts for roughly 3% of the genetic variance in our sample.However, after controlling for this genetic measure, the observed ethnic differences in BMIremain large and statistically significant. This study demonstrates a parsimonious method to adjustfor genetic differences among individual respondents that may contribute to observed differencesin outcomes. In this case, adjusting for genetic background has no bearing on the influence of self-identified ethnicity.
The goal of health-disparities research is to identify the mechanisms that are responsible forpersistent differences in health status among members of different social groups (Banks,Marmot, Oldfield, and Smith 2006; Hayward, Crimmins, Miles, and Yang 2000). Withinthis body of work, there is a great deal of interest in racial/ethnic differences in obesity andoverweight. According to estimates from the 2007 to 2008 NHANES, among U.S., adults of32.8% of non-Hispanic whites, 44.1% of non-Hispanic blacks, and 39.3% of Mexican-Americans are either overweight or obese (Flegal, Carroll, Ogden, and Curtin 2010).Differences along racial and ethnic lines are also apparent among children and adolescents,
Copyright © Society for the Study of Social BiologyAddress correspondence to Jason D. Boardman, Institute of Behavioral Science, University of Colorado, 483 UCB, Boulder, CO80309-0483, USA. [email protected]'s Disclaimer: Full terms and conditions of use: http://www.tandfonline.com/page/terms-and-conditionsThis article may be used for research, teaching and private study purposes. Any substantial or systematic reproduction, re-distribution,re-selling, loan, sub-licensing, systematic supply or distribution in any form to anyone is expressly forbidden.The publisher does not give any warranty express or implied or make any representation that the contents will be complete or accurateor up to date. The accuracy of any instructions, formulae and drug doses should be independently verified with primary sources. Thepublisher shall not be liable for any loss, actions, claims, proceedings, demand or costs or damages whatsoever or howsoever causedarising directly or indirectly in connection with or arising out of the use of this material.
NIH Public AccessAuthor ManuscriptBiodemography Soc Biol. Author manuscript; available in PMC 2011 August 12.
Published in final edited form as:Biodemography Soc Biol. 2010 ; 56(2): 123–136. doi:10.1080/19485565.2010.524589.
NIH
-PA Author Manuscript
NIH
-PA Author Manuscript
NIH
-PA Author Manuscript

with 15.3% of non-Hispanic whites, 20% of non-Hispanic blacks, and 20.8% of Mexican-Americans being in the ninety-fifth percentile for BMI (Ogden et al. 2010). Given theassociation between obesity and other illnesses such as hypertension, heart disease, anddiabetes (Burke et al. 2008), racial and ethnic disparities in obesity bear importantimplications for the uneven distribution of disease among racial and ethnic groups.
Based on theoretical reasons and consistent empirical support (Williams 2003) the bulk ofhealth disparities research has emphasized social and environmental mechanisms.Socioeconomic differences at the level of the family (Shrewsbury and Wardle 2008), school(Richmond and Subramanian 2008), and neighborhood (Gordon-Larsen, Adair, and Popkin2003; Robert and Reither 2004, Boardman, Saint Onge, Rogers, and Denney 2005)consistently account for the bulk of the observed differences in BMI among white, black,and Latino adults and adolescents. Further, others have argued that small differencesbetween racial and ethnic groups of shared understandings regarding health body sizescondition perceptions of desirable weight which may influence group differences in theprevalence of obesity (Allan, Mayo, and Michel 1993).
Though social factors clearly condition obesity, there is also evidence that obesity andrelated comorbidities are influenced by genetic and physiological characteristics (Nelson etal. 2006; Jacobsen and Rowe 1998; Saunders et al. 2007). Numerous biometric (Nelson,Gordon-Larsen, North, and Adair 2006; Jacobsen and Rowe 1998) and molecular studies(Saunders et al. 2007) consistently demonstrate that genetic factors have a strong influenceon weight among adolescents and adults. Some of the strongest evidence for geneticinfluences on physical weight comes from studies comparing the correlation (.60 < r < . 74)of BMI among identical twins who are raised apart from one another (Price and Gottesman1991; Stunkard et al. 1986) Jacobson and Rowe (1998), using data from Add Health,estimate the heritability of BMI among male adolescents to be roughly .80 (A = .65, D = .16) with no shared environmental influences; in this study, roughly 80% of the variation inBMI was shown to be genetically oriented. Other BMI heritability estimates have rangedbetween 0.30 to more than 0.90, varying as a function of study design and age (Schousboe etal, 2003; Ordonana et al, 2007; Cornes, Zhu, and Martin 2007; Silventoinen et al, 2007;Franz et al, 2007; Haberstick et al. 2010).
Linkage studies (Yang, Kelly, and He 2007) and genome-wide association studies have builton these twin and sibling studies by identifying specific locations on the human genome thatare linked to BMI and waist circumference (Herbert et al. 2006; Fox et al. 2007; Frayling etal. 2007). To date, a single nucleotide polymorphism (SNP) in the FTO gene hasdemonstrated the most reliable associations with BMI; those homozygous for the A allele atrs9939609 on average weighed 3 pounds heavier than those with one or no copies of thisallele (Frayling et al.). This positive result has been replicated in a number of other studies(Dina et al. 2007; Cecil et al. 2008; Andreasen et al. 2008; Meyre et al. 2009).
Both the socio-structural and physiological/genetic approaches to understanding obesityoffer considerable insight into the etiology of the disease but, at the end of the day,researchers are often stuck with the scientific equivalent to the “nature-versus-nurture”debate (Hernandez, Blazer, and Institute of Medicine 2001). Though few contend that“nature” is unimportant, social scientists have been very reticent to incorporate geneticexplanations for complex health-related phenotypes into their conceptual and analyticmodels. However, this is beginning to change. Recently there has been an interest amongsocial scientists to include biological information in social surveys to improve ourunderstanding of the biological pathways underpinning health disparities (Crimmins andSeeman 2004).
Boardman et al. Page 2
Biodemography Soc Biol. Author manuscript; available in PMC 2011 August 12.
NIH
-PA Author Manuscript
NIH
-PA Author Manuscript
NIH
-PA Author Manuscript

Though the use of biomarkers has yielded insight into the relationship between socialcharacteristics and obesity (Goodman et al. 2005; Djuric et al. 2008), efforts to incorporategenetic information to shed light race/ethnic health differentials in obesity and overweighthave been limited. Many efforts are under way to genotype participants and includegenotypic data in many large social and demographic surveys. As psychosocial and geneticcharacteristics become available in the same surveys, researchers will have the opportunityto test the possibility that very small genetic differences between socially defined racial andethnic groups may contribute to observed racial and ethnic differences in BMI, overweight,or obesity. Though the data are becoming available, the next logical question will be howthese data can inform traditional statistical models.
In pursuit of this goal, we use a sample of non-Hispanic white and Mexican-Americanadolescents and young adults to apply a common data reduction technique, principalcomponents analysis, to genome-wide data to characterize ancestry or ethnic background.We then examine the independent influences of self-reported ethnicity and geneticallyinformed ancestry, the principal components, on BMI. Our study contributes to theoreticaland empirical work in this area but, equally important, we also provide examples of efficientmethods to incorporate large amounts of genetic data into social epidemiologic studies ofhealth and health behaviors.
Though the authors do not contend that these social categories are absolute biologicalrealities, there is often some overlap between genetic ancestry and self-identified race orethnicity, and research suggests that there is a small genetic basis to otherwise sociallydefined racial and ethnic groups. One line of research has been to use principal componentsanalysis from genome-wide data spanning nearly hundreds of thousands of SNPs tocharacterize differences among individuals along continuous axes of variation (Price et al.2006; Novembre et al. 2008; Reich, Price, and Patterson 2008). For example, Novembre etal. superimpose the first two principal components from 200,000 SNPs obtained from 1,387European adults on a map of Europe, and they show surprising accuracy of the orthogonalX-Y genetic components with the X-Y geographic coordinates. With information from thefirst two components, the researchers could accurately predict the physical location (e.g.,country of origin) of the respondent nearly 80% of the time. Similar results have also beenshown with African populations (Reich et al. 2008).
As social scientists have long stated, racial and ethnic groups capture a very smallproportion of the overall genetic variance in the population, and it is important to note thatalthough these principal components can accurately predict an individual’s self-reportedethnicity or location, the first two components account for a very small proportion of theoverall genetic variance. For example, in Novembre et al. (2008), these first componentsaccount for less than .5% of the total genetic variance in their sample. In multiracial studies,these first two components typically account for less than 5% of the genetic variance, whichis in line with most common understandings of racial and ethnic differences. To date, theprincipal-components approach has been utilized primarily as a means to adjust forpopulation stratification within the genetic research. The logic of genome-wide associationstudies (GWAS) is to measure the association between a particular SNP and an outcome,such as body weight. Population stratification poses a problem to GWAS in that spuriousassociations may be observed when minor allele frequencies differ among groups.
This same logic can (and should) be used by social demographers in their analysis of healthdisparities. Namely, it is a universally held assumption among social scientists that thatgenetic differences among racial and ethnic groups do not contribute to racial and ethnicdifferences in body weight but, to date, no existing study has examined this empirically. Asgenome wide data are becoming available, social scientists are able to answer this question
Boardman et al. Page 3
Biodemography Soc Biol. Author manuscript; available in PMC 2011 August 12.
NIH
-PA Author Manuscript
NIH
-PA Author Manuscript
NIH
-PA Author Manuscript

fairly easily. Principal-components analysis (PCA) performed on genome-wide data providea concise representation of population ancestry and, once derived, these components may beincluded in traditional quantitative models used to evaluate health disparities in general, anddifferences in BMI specifically. An additional benefit to the principal-components approachto measuring ancestry is that there is no assumption about the origins of the groupsrepresented in the sample and, as such, components are sample-dependent and cannot beapplied outside the study sample. We anticipate that a detailed accounting of ethnicbackground using the most current genetic epidemiologic methods will not alter theinfluence of self-identified ethnic status on BMI.
MethodsData
Data come from an adolescent/young adult high-risk sibling sample (i.e., probands ages 14–19 selected for high-risk and their siblings ages 14–25) recruited into a study investigatinggenetic and environmental influences contributing to risk for substance use disorders anddelinquency. High-risk probands were recruited from consecutive admissions (but seeinclusion/exclusion criteria later) to three residential and outpatient treatment facilities in theDenver metropolitan area operated by the Division of Substance Dependence of theDepartment of Psychiatry, University of Colorado School of Medicine. Most of theprobands were referred into treatment by juvenile justice or social service agencies; a smallproportion (approximately 1%) were parental referrals. Additional probands were recruitedinto the study via clinical evaluations conducted by the Division of Substance Dependencefor the Colorado Department of Corrections (i.e., probation evaluations).
A total of 695 respondents reported their height and weight. Among these, genotyping wasperformed using a number of chip platforms. To achieve consistency in genotyping, we usedonly those genotyped using the Affymetrix 10k chip (n = 349). Owing to the lack of racialand ethnic diversity within the sample, we decided to limit our sample to Mexican-Americans and non-Hispanic white respondents (n = 244). Further, owing to the householdsampling procedures, we selected only one child per family so as not to bias our principle-components analysis. There were 120 families (i.e., 120 individuals after randomly selectingone sibling). We dropped those with missing information on family income (n = 9), leavinga completed sample of 111 unrelated individuals. These break down into 88 non-Hispanicwhites and 23 Mexican Americans. We compared the BMI, age, gender, and poverty statusof the reduced sample to the larger sample of 695 respondents. The full and reduced samplesare virtually identical with respect to BMI and socio-demographics (age and gender), but wedid observe a slight difference in the proportion of poor respondents in our reduced sample(p = .15) and the full sample (p = .22). This difference is statistically significant (p < .01)and is due to the increasing proportion of non-Hispanic white respondents in the reducedsample (~80%) compared to the full sample (~50%).
Genomic DNA was isolated from buccal cells using a modification of published procedures(Freeman et al., 1997). Briefly, our method involved collecting buccal cells by rubbing thecheeks with cotton swabs followed by a rinse with mouthwash. The DNA was isolated bysolvent extraction, quantified with PicoGreen (Molecular Probes, Eugene, OR), and aworking stock of 20 ng/ul was prepared in TE buffer. The average yield of DNA was 409/5µg. Primer extension preamplification (PEP) was performed on 1 ml aliquots of the genomicDNA using a modification (Krauter et al. 2001) of the method of Zhang et al. (1992), whichresulted in an approximately 100-fold amplification of the DNA. The PEP procedure wasoriginally to be used only on those few samples that had poor yields. However, afterconfirming that allele calls for all markers were identical when comparing PEP DNA withDNA purified from cell lines in two CEPH individuals (Krauter et al.), PEP was routinely
Boardman et al. Page 4
Biodemography Soc Biol. Author manuscript; available in PMC 2011 August 12.
NIH
-PA Author Manuscript
NIH
-PA Author Manuscript
NIH
-PA Author Manuscript

used for all of the DNA samples. Of the 11,000+ markers, we limited our analysis to SNPswith a minor allele frequency of at least 1% and SNPs in which missingness did not exceed10% of the sample. In total, we use a sample of 5,490 SNPs. The RS numbers and MAF forthese SNPs are available upon request.
AnalysisWe use two measures obtained from genome-wide data to characterize each individual inour study. We first perform PCA on the 5,490 SNPs described earlier. We use an additivecoding method of genotype in which individuals receive a score of 0 if they are homozygousfor the minor allele, 1 if they are heterozygous, and 2 if they are homozygous for the majorallele. Because of the unusually large amount of information from genetic data sources, PCAprovides an effective and efficient method to distill multidimensional and complicated datainto continuous axes of variation, thereby reducing the dimensionality to the number ofobservations in the data. As shown elsewhere (Price et al. 2006; Novembre et al. 2008;Reich et al. 2008), these components provide important information regarding populationancestry that can be used in statistical analysis to purge the parameter estimates of geneticinfluences due to group and subgroup membership. We use the same approach as Price et al(2006) to compute the PCAs in our study. Let mij be a matrix of genotypes for SNP i andindividual j. Each individual’s genotype at that location is subtracted by the row mean tocreate a matrix with row sums equal to zero. As with Price et al. (2006), we then normalizeeach row by dividing each genotype by
where pi is the allele frequency at location i. This new matrix (X) is used to estimate a new111×111 covariance matrix ψ where ψjj' is the covariance of column j' and column of X.Axis of variation is distilled into eigenvectors with the largest eigenvalues. As such, ajkcaptures the genetic background of individual j for the kth axis of variation.
We will examine the top PCs and use any PC that significantly differs between white andMexican-American respondents. All analyses were performed using the prcomp routine in R(R Development Core Team, 2009). As one of the stated goals of this project was to increasethe use of genetic data by social demographers, the R syntax for these runs is available tointerested researchers upon request.
Components are dependent on the heterogeneity of the sample population and, as such, havelittle utility outside the relevant study. Although these components do not represent auniversal measure of ancestry, they are robust to very selective samples, such as the onecurrently used. Because these components are reflective of ancestry within the sample, webelieve the use of principal components to control for latent genetic influences on BMI to beunbiased by the use of a highly selective sample. Although the choice of sample mayjeopardize the generalizability of the findings to all adolescents, the use of this sampleshould not bias the components or the demonstration of their utility within regressionmodels.
We then estimate regression models with and without controls for population ancestry. Andsecond, we then calculate a summary measure of total genetic distance using a Mahalanobisdistance (Mahalnobis 1936) calculation. These measures are then used as controls in thelinear model predicting BMI. This measure reports departure from the sample mean of all ofthe SNPs: a person-specific difference in genetic space from a fictitious person who isaverage on all of the SNPs.
Boardman et al. Page 5
Biodemography Soc Biol. Author manuscript; available in PMC 2011 August 12.
NIH
-PA Author Manuscript
NIH
-PA Author Manuscript
NIH
-PA Author Manuscript

ResultsTable 1 presents the descriptive statistics for all variables used in the analysis. Non-Hispanicwhites in this study are significantly taller than the Mexican-American respondents (roughly2.6 inches, p < .001), and they are slightly lighter (~ 6 pounds, n.s.) These differences arealso evidenced in the significant difference in BMI among white ( ) and Mexican-American ( ) respondents. Mexican-American respondents are also nearly threetimes more likely than whites to report relatively low family income.
Importantly, we find large and significant ethnic differences in the first principal component(PC1) and the Mahalanobis distance (MD) based on the first 45 principal components. Thefull description of the race and BMI associations with the first 10 principal components isprovided in Table 2. This first component (PC1) accounts for 3% of the overall geneticvariance in the sample. Given that this is the only significant PC in these models, it is fair tocharacterize the between-group differences in genetic variance as accounting for no morethan 3% of the total variance, and 97% occurs within each self-identified group. The nexttwo columns of data present the association between each PC, BMI, and ethnicity. We showa positive and significant association between PC1 and BMI and, as shown in Table 1, astrong association between PC1 and self-reported ethnicity. These associations are presentedgraphically in Figure 1.
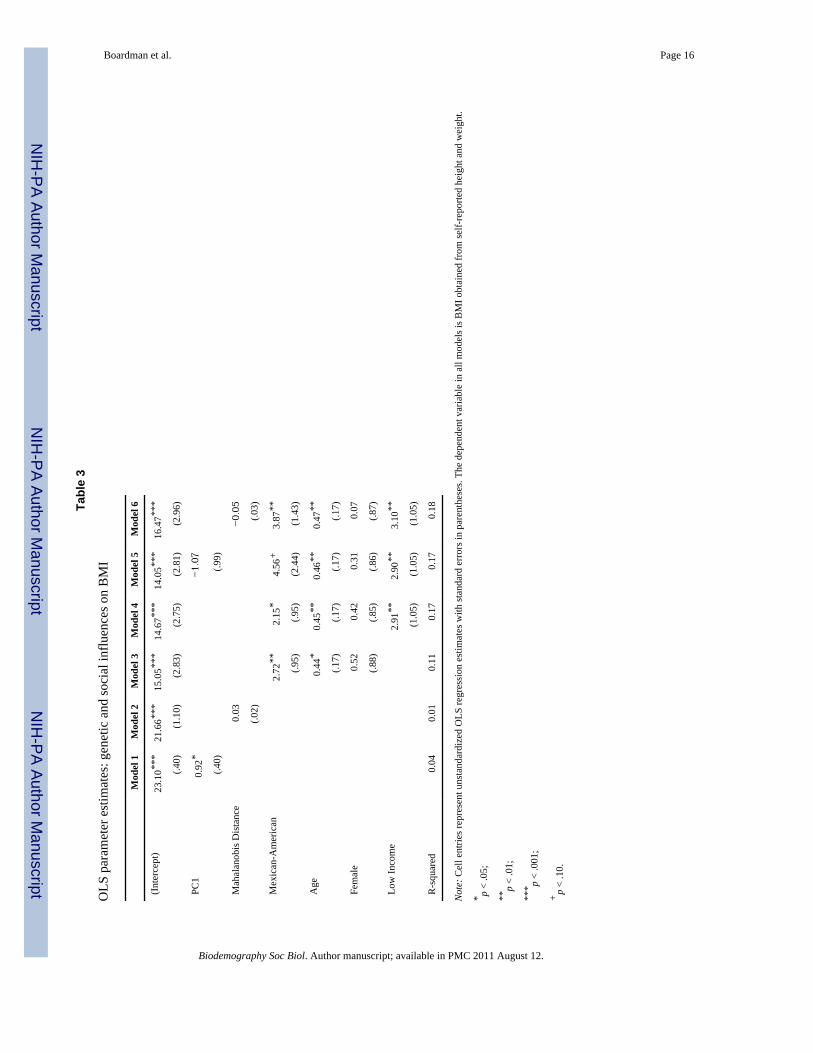
As is evident in Figure 1 and Table 2, PC1 (r = .22, p < .03) and BMI are positivelyassociated with each other. We do not show any association between the MD measure andBMI. It is also clear in Figure 1 and Table 1 that there are clear ethnic differences in bothPC1 and MD. As such, it is possible that PC1 may account for some of the observed ethnicdifferences in BMI. To examine this possibility, we present a series of multivariate modelsin Table 3. The first models present the unadjusted effects of the two genetic measures. PC1(b = .92, p < .05) is positively and significantly associated with BMI and accounts forroughly 4% of the variance in BMI. Model 3 presents the first social demographic model inwhich ethnicity (b = 2.72, p < .01) and age (b = .44, p < .05) are both associated with BMI.In total, these factors explain 11% of the variance in BMI. Model 4 enters a control forsocioeconomic status (income < $15k/year), and relatively low levels of income arepositively associated with BMI (b = 2.91, p < .01). These results also show that the influenceof income and ethnicity operate independent of each other; they both remain statisticallysignificant. Models 5 and 6 add genetic measures independently to the full model (Model 4).If genetic differences in ethnic groups accounted for the observed ethnic differences in BMI,these controls should eliminate the effect of ethnicity. In both cases, it is clear that thesecontrols do not account for the observed ethnic differences in BMI.
ConclusionBecause childhood and adolescent obesity is strongly linked to adult obesity (Whitaker,Wright, Pepe, Seidel, and Dietz 1997) and because obesity is linked to an increased risk ofchronic health problems including type-II diabetes and hypertension among relatively youngadults, understanding individual differences in current weight and weight gain is a criticalpublic health issue. This is of particular concern to health-disparities researchers because ofpersistent and large differences in BMI across racial and ethnic groups. The purpose of thisstudy is to introduce social demographers to a relatively simple method to incorporategenome-wide data into their studies with the explicit aim to eliminate potentiallyconfounding effects due to very small genetic differences across socially defined racial andethnic groups. We use the phenotype of BMI because of distributional characteristics andthe clear disparities that exist in this phenotype across racial and ethnic groups.
Boardman et al. Page 6
Biodemography Soc Biol. Author manuscript; available in PMC 2011 August 12.
NIH
-PA Author Manuscript
NIH
-PA Author Manuscript
NIH
-PA Author Manuscript

To illustrate this technique, we used a very small existing sample in which we have data onheight/weight, self-reported ethnicity, and genome-wide data. However, there are twoimportant limitations that should be considered when interpreting the results of this study.First, this is not a representative sample of adolescents and, as such, these findings shouldnot necessarily be generalized to the larger population. This convenience sample was notdesigned as a cohort or a case control-study, and far more elaborate research designs wouldbe needed to characterize population ancestry at a larger level. Selection in this study mayhave to do with drug use and body mass, which may further complicate the interpretation ofthe parameter estimates of this study. This is particularly problematic because the PCs areidentified from the sample and not the population. Ideally, these methods would be used ona random sample of the population. However, our methods adequately differentiate subtlegenetic differences among individuals in our sample of high-risk adolescents. Second, therelatively small sample size reduces our power to detect differences, and it increases our riskof a type II error. For example, this is evident in the sensitivity of the parameter estimate forPC1 in Model 5 of Table 3. The sign for this estimate switches signs after controlling forbackground characteristics. This is owing in large part to the strong correlation between PC1and Mexican-American identification; however, it is also likely that this instability is due tothe small sample sizes in this study. The same can be said for the variability seen in thecoefficient for ethnicity. These limitations should be considered when interpreting theresults of this study.
With these limitations in mind, our article nevertheless makes an important contribution tothis literature because it demonstrates that these ethnic differences in our sample areindependent of any small genetic differences that may exist between the groups. We alsodemonstrate relatively parsimonious statistical methods to incorporate large amounts ofgenetic information into social epidemiologic studies of BMI and obesity withoutcompromising the overall aims of this body of work. These genomic controls help to ruleout alternate explanations regarding the influence of racial and ethnic ancestry on thisimportant health outcome. These findings make an important comment on the social andgenetic epidemiology of obesity.
Thus far, genome-wide information on population ancestry has been used exclusively toadjust parameter estimates in genome-wide association studies for population stratification,and some efforts have been made to infer immigration patterns from molecular data(Novembre et al. 2008). To date, however, the information from genome-wide principalcomponents has not been fully incorporated into social scientific studies. We argue that thisrich information about individual differences has the prospect of sharpening socialepidemiologic analysis and bolstering the precision and consistency of parameter estimatesfor social structural variables.
In many ways, the inclusion of genome-wide data into existing social demographic studiesturns our typical study design problem on its head. That is, demographers usually have verylarge samples with a fairly limited number of items to characterize the sample (our rows faroutweigh our columns). However, with the addition of hundreds of thousands of columns,with the columns surpassing the rows by a factor 105, typical approaches to multivariableanalyses are not possible. We have far more parameters than observations, and efforts needto be made to reduce this information to valid measures that capture meaningful geneticvariation. To date, although there is much interest in this line of work (Finch, Vaupel, andKinsella 2001), social epidemiologic researchers still have very few methodological optionsto incorporate large amounts of genetic information from their respondents into standardquantitative models. One of the purposes of this study was to demonstrate the usefulness ofgenome-wide data for health-disparities researches and to provide several useful strategiesfor researchers involved in studies with genetic information from their respondents. For
Boardman et al. Page 7
Biodemography Soc Biol. Author manuscript; available in PMC 2011 August 12.
NIH
-PA Author Manuscript
NIH
-PA Author Manuscript
NIH
-PA Author Manuscript

purposes of illustrating the usefulness of genome-wide data for sociological purposes, wefocused on race/ethnic differences in obesity. We argue that a sociologically informed studyof race and ethnicity provides an important bridge that allows for genetic factors to beincluded within the health-disparities literature related to obesity. We use a relatively smalldata set and a limited number of SNPs (~6,000) to demonstrate the usefulness of thisapproach; however, this approach can be extended to a significantly larger number of SNPs(>1m) for the type of data that are currently available. We focus on racial/ethnic differencesin BMI, but this understanding can be applied to a number of different outcomes or socialgroupings.
With limited dissent (Shiao et al. 2008), the collective demographic and sociological voicehas been unequivocally opposed to scientific efforts to examine the possibility that geneticfactors may play some part in persistent health disparities, and there are many good reasonsfor this reticence (Duster 1990). Much of this skepticism is well founded, but somecriticisms have not been supported as we learn more about the human genome. The basiclogic of this line of inquiry relies on three hypotheses regarding genes, race, and bodyweight: (1) that genetic factors have considerable influence on an individual’s body weight,(2) that socially defined racial and ethnic groups differ from one another genetically, and (3)that genetic differences among racial and ethnic groups contribute to racial and ethnicdifferences in body weight. Each of these ideas has received a great deal of criticism fromthe social scientific community (Duster 2005, 2006). Though there is significant support ofthe genetic epidemiology of body weight, there is still a great deal of skepticism when itcomes to discussing the genetic origins of race and ethnicity. Our study demonstrates thatthe genetic differences across racial and ethnic groups are evident but quite small inmagnitude. Given this small contribution to overall genetic variation, it is no surprise thatgenes do not account for observed ethnic differences in BMI; however, this importantempirical question remained untested prior to this current study.
As stated throughout this article, these results bolster the position of social epidemiologistswho look to social context (e.g., friends, schools, workplace, residential areas) to account forimportant differences in the prevalence of obesity among racial and ethnic groups. Socialepidemiologists have focused on normative and institutional factors that may increase therisk of obesity for racial and ethnic minorities through lifestyles and access to a healthyenvironment (Faith and Kral 2006). This manifests through an emphasis on health behaviorsand conditions stemming from the probability that various minority groups are likely to beof lower socioeconomic status and cultural differences between racial and ethnic groups inregard to food preferences and beliefs about a healthy body weight.
Having a lower socioeconomic status is predictive of health behaviors and lifestyle choices,such as fast-food consumption, skipping breakfast, and physical inactivity (Faith and Kral2006; Gordon-Larsen, McMurray, and Popkin 2000; Certain and Kahn 2002), and thesebehaviors have been linked to increased BMI (Niemeier et al. 2006). As Popkin, Duffy, andGordon-Larsen (2005) show, these differences in behavior and BMI are strongly influencedby differential access to healthy foods and physical activity outlets. Similar work is shownby others (Estabrooks, Lee, and Gyurcsik 2003; Gordon-Larsen et al. 2000). For example,studies show that neighborhoods composed of racial and ethnic minorities have more thantwice the number of fast-food restaurants (Block, Scribner, and DeSalvo 2004; Ball.Timperio, and Crawford 2009). The proximity to fast-food restaurants is not balanced byeasy access to chain grocery stores (Chung and Myers 1999). Further, many have citedgovernment policies and market conditions that make high-calorie, low-nutrient foods, suchas sodas, candy, and fast food, cheaper than low-calorie, high-nutrient foods, such as fruitsand vegetables (Andrieu, Darmon, and Drewnowski 2006). Thus, many minorities living ina low socioeconomic environment adopt poor eating habits to cope with limited resources.
Boardman et al. Page 8
Biodemography Soc Biol. Author manuscript; available in PMC 2011 August 12.
NIH
-PA Author Manuscript
NIH
-PA Author Manuscript
NIH
-PA Author Manuscript

In addition to these institutional factors affecting health behavior, normative influences arealso believed to influence BMI because of the meaning(s) that people ascribe to body sizeand group differences regarding the perception of overweight (Flynn and Fitzgibbon 1998).Because socioeconomic and racial characteristics are linked with differences in BMI, defacto racial and class segregation (Massey and Denton 1993; Jargowsky 1997) structuresshared understandings of health body sizes and otherwise small differences in norms aboutbody among friends are further exacerbated (Boardman et al. 2005). The notion that culturalbeliefs about food and ideal bodies are embedded within groups provides one explanationfor why one’s own weight is predicted by his or her associates. For example, Chistiakis andFowler (2007) model the probability of weight gain as a function of friendship networks.They show that individuals’ risk of becoming obese increased 57% if they had a friend whobecame obese during the observed interval. Importantly, the social influences of one’s peerswere larger in magnitude than the corresponding risk associated with a person’s sibling(40% increase).
In sum, there is consistent evidence that social and demographic factors are stronglyassociated with physical weight because of access to health-related environments andenergy-balance behaviors and lifestyles. Excess caloric intake and increased sedentarylifestyles as a result of environmental and cultural contexts place persons of disadvantagedbackgrounds at a greater risk of obesity and overweight. Based on the results of this study, acritical examination of the built environment and cultural milieu of racial and ethnic groupswill yield far more insights into body size differences across socially defined groups ofpeople than a corresponding exploration of small (and apparently meaningless) geneticdifferences for this important phenotype.
AcknowledgmentsThis research was funded in part by grants from the Eunice Kennedy Shriver NICHD (K01HD50336) and NIDA(DA 11015 & DA012845).
ReferencesAllan JD, Mayo K, Michel Y. Body size values of white and black women. Res Nurs Health. 1993;
16:323–333. [PubMed: 8210470]Andreasen, Camilla H.; Stender-Petersen, Kirstine L.; Mogensen, Mette S.; Torekov, Signe S.;
Wegner, Lise; Andersen, Gitte; Nielsen, Arne L.; Albrechtsen, Anders; Borch-Johnsen, Knut;Rasmussen, Signe S., et al. Low physical activity accentuates the effect of the FTO Rs9939609polymorphism on body fat accumulation. Diabetes. 2008; 57:95–101. [PubMed: 17942823]
Andrieu E, Darmon N, Drewnowski A. Low-cost diets: more energy, fewer nutrients. Eur J Clin Nutr.2006; 60:434–436. [PubMed: 16306928]
Ball K, Timperio A, Crawford D. Neighbourhood socioeconomic inequalities in food access andaffordability. Health Place. 2009; 15:578–585. [PubMed: 19046654]
Banks, James; Marmot, Michael; Oldfield, Zoe; Smith, James P. Disease and disadvantage in theUnited States and in England. JAMA. 2006; 295:2037–2045. [PubMed: 16670412]
Block JP, Scribner RA, DeSalvo KB. Fast food, race/ethnicity, and income. A geographic analysis AmJ Prev Med. 2004; 27:211–217.
Boardman, Jason D.; Saint Onge, Jarron M.; Rogers, Richard G.; Denney, Justin T. Race differentialsin obesity: The impact of place. J Health Soc Behav. 2005; 46:229–243. [PubMed: 16259146]
Burke GL, Bertoni AG, Shea S, Tracy R, Watson KE, Blumenthal RS, Chung H, Carnethon MR. Theimpact of obesity on cardiovascular disease risk factors and subclinical vascular disease: The Multi-Ethnic Study of Atherosclerosis. Arch Intern Med. 2008; 168:928–935. [PubMed: 18474756]
Cecil, Joanne E.; Tavendale, Roger; Watt, Peter; Hetherington, Marion M.; Palmer, Colin NA. Anobesity-associated FTO gene variant and increased energy intake in children. N Engl J Med. 2008;359:2558–2566. [PubMed: 19073975]
Boardman et al. Page 9
Biodemography Soc Biol. Author manuscript; available in PMC 2011 August 12.
NIH
-PA Author Manuscript
NIH
-PA Author Manuscript
NIH
-PA Author Manuscript

Certain, Laura K.; Kahn, Robert S. Prevalence, correlates, and trajectory of television viewing amonginfants and toddlers. Pediatrics. 2002; 109(4):634–624. [PubMed: 11927708]
Christakis, Nicholas A.; Fowler, James H. The spread of obesity in a large social network over 32years. N Engl J Med. 2007; 357:370–379. [PubMed: 17652652]
Chung, Chanjin; Myers, Samuel L, Jr. Do the poor pay more for food? An analysis of grocery storeavailability and food price disparities. J Consumer Affairs. 1999; 33(2):276–296.
Cornes BK, Zhu G, Martin NG. Sex differences in genetic variation in weight: A longitudinal study ofbody mass index in adolescent twins. Behav Genet. 2007; 37:648–660. [PubMed: 17896175]
Crimmins, Eileen M.; Seeman, Teresa E. Integrating biology into the study of health disparities. PopulDev Rev. 2004; 30:89–107.
Dina C, Meyre D, Samson C, Tichet J, Marre M, Jouret B, Charles MA, Balkav B, Froguel P.Comment on “A common genetic variant is associated with adult and childhood obesity.”.Science. 2007; 315:187. [PubMed: 17218508]
Djuric, Zora; Bird, Chloe E.; Furumoto-Dawson, Alice; Rauscher, Garth H.; Ruffin, Mack T., IV;Stowe, Raymond P.; Tucker, Katherine L.; Masi, Christopher M. Open Biomark J. 2008; 1:7–19.[PubMed: 20305736]
Duster, Troy. Backdoor to eugenics. New York: Routledge; 1990.Duster, Troy. 2005 Presidential address—comparative perspectives and competing explanations:
taking on the newly configured reductionist challenge to sociology. Am Sociol Rev. 2006; 71(1):1.Duster, Troy. Medicine: Enhanced: Race and reification in science. Science. 2005; 307(5712):1050–
1051. [PubMed: 15718453]Estabrooks, Paul A.; Lee, Rebecca E.; Gyurcsik, Nancy C. Resources for physical activity
participation: Does availability and accessibility differ by neighborhood socioeconomic status?Ann Behav Med. 2003; 25(2):1532–4796.
Faith, Myles S.; Kral, Tanja VE. Institute of Medicine. Social environmental and genetic influences onobesity and obesity-promoting behaviors: Fostering research integration. In: Hernandez, Lyla M.;Blazer, Dan G., editors. Appendix C In Genes, behavior, and the social environment: Movingbeyond the nature/nurture debate. Washington, DC: National Academies Press; 2006. p. 236-280.
Finch, CE.; Vaupel, JW.; Kinsella, KG., editors. Cells and surveys: Should biological measures beincluded in social science research?. Washington, DC: National Academy Press; 2001.
Flegal, Katherine M.; Carroll, Margaret D.; Ogden, Cynthia L.; Curtin, Lester R. Prevalence and trendsin obesity among U.S. adults, 1999–2008. JAMA. 2010; 303(3):235–241. [PubMed: 20071471]
Flynn, Kristin J.; Fitzgibbon, Marian. Body images and obesity risk among black females: A review ofthe literature. Ann Behav Med. 1998; 20:13–24. [PubMed: 9755347]
Fox CS, Heard-Costa N, Cupples LA, Dupuis J, Vasan RS, Atwood LD. Genome-wide association tobody mass index and waist circumference: The Framingham Heart Study 100K project. BMC MedGenet. 2007; 8 Suppl:1. S18. [PubMed: 17227582]
Franz CE, Grand MD, Jacobson KC, Kremen WS, Eisen SA, Xian H, Romeis J, Thompson-BrennerH, Lyons MJ. Genetics of body mass index stability and risk for chronic disease: A 28-yearlongitudinal study. Twin Res Hum Genet. 2007; 10:537–545. [PubMed: 17708694]
Frayling TM, Timpson NJ, Weedon MN, Zeggini E, Freathy RM, Lindgren CM, Perry JR, Elliott KS,Lango H, Rayner NW, et al. A common variant in the FTO gene is associated with body massindex and predisposes to childhood and adult obesity. Science. 2007; 316:889–894. [PubMed:17434869]
Freeman, Bernard; Powell, John; Ball, David; Hill, Linzey; Craig, Ian W.; Plomin, Rorbert J. DNA bymail: An inexpensive and noninvasive method for collecting DNA samples from widely dispersedpopulations. Behav Genet. 1997; 27:251–257. [PubMed: 9210796]
Goodman, Elizabeth; McEwen, Bruce S.; Huang, Bin; Dolan, Lawrence M.; Adler, Nancy E. Socialinequalities in biomarkers of cardiovascular risk in adolescence. Psychosom Med. 2005; 67:9–15.[PubMed: 15673618]
Gordon-Larsen, Penny; Adair, Linda S.; Popkin, Barry M. The relationship of ethnicity,socioeconomic factors, and overweight in US adolescents. Obesity Res. 2003; 11:121–129.
Gordon-Larsen P, McMurray RG, Popkin BM. Determinants of adolescent physical activity andinactivity patterns. Pediatrics. 2000; 105:E83. [PubMed: 10835096]
Boardman et al. Page 10
Biodemography Soc Biol. Author manuscript; available in PMC 2011 August 12.
NIH
-PA Author Manuscript
NIH
-PA Author Manuscript
NIH
-PA Author Manuscript

Haberstick BC, Lessem JM, McQueen M, Boardman JD, Hopfer CJ, Smolen A, Hewitt JK. Stablegenes and changing environments: Body mass index across adolescence and young adulthood.Behav Genet. 2010; 40:495–504. [PubMed: 20087641]
Hayward, Mark D.; Crimmins, Eileen M.; Miles, Toni P.; Yang, Yu. The significance ofsocioeconomic status in explaining the racial gap in chronic health conditions. Am Sociol Rev.2000; 65:910–929.
Herbert A, Gerry NP, McQueen MB, Heid IM, Pfeufer A, Illig T, Wichmann HE, Meitinger T, HunterD, Hu FB, et al. A common genetic variant is associated with adult and childhood obesity.Science. 2006; 312:279–283. [PubMed: 16614226]
Hernandez, Lyla M.; Blazer, Dan G. Institute of Medicine. Genes, behavior, and the socialenvironment: Moving beyond the nature/nurture debate. National Academies Press; Washington,DC: 2006.
Jacobson, Kristen C.; Rowe, David C. Genetic and shared environmental influences on adolescentBMI: Interactions with race and sex. Behav Genet. 1998; 28(4):265–278. [PubMed: 9803019]
Jargowsky, PA. Poverty and place: Ghettos, barrios, and the American city. New York: Russell SageFoundation; 1997.
Krauter KS, Hutchinson J, Hewitt JK, Stallings MC, Smolen A, Crowley TJ. Large-scale markerscreening using minute quantities of DNA. Drug Alcohol Depend. 2001; 63 Suppl 1:S84.
Mahalanobis PC. On the generalised distance in statistics. Proc Natl Inst Sci India. 1936; 2(1):49–55.Massey, Douglas S.; Denton, Nancy A. American apartheid: Segregation and the making of the
underclass. Cambridge MA: Harvard University Press; 1993.Meyre D, Delplanque J, Chevre JC, Lecoeur C, Lobbens S, Gallina S, Durand E, Vatin V, Degraeve F,
Proenca C, et al. Genome-wide association study for early-onset and morbid adult obesityidentifies three new risk loci in European populations. Nat Genet. 2009; 41:157–159. [PubMed:19151714]
Nelson, Melissa C.; Gordon-Larsen, Penny; North, Kari E.; Adair, Linda S. Body mass index gain, fastfood, and physical activity: Effects of shared environments over time. Obesity Res. 2006; 14:701–709.
Niemeier, Heather M.; Raynor, Hollie A.; Lloyd-Richardson, Elizabeth E.; Rogers, Michelle L.; Wing,Rena R. Fast food consumption and breakfast skipping: Predictors of weight gain fromadolescence to adulthood in a nationally representative sample. J Adolesc Health. 2006; 39:842–849. [PubMed: 17116514]
Novembre, John; Johnson, Toby; Bryc, Katarzyna; Kutalik, Zoltan; Boyko, Adam R.; Auton, Adam;Indap, Amit; King, Karen S.; Bergmann, Sven; Nelson, Matthew R., et al. Genes mirror geographywithin Europe. Nature. 2008; 456:98–101. [PubMed: 18758442]
Ogden, Cynthia L.; Carroll, Margaret D.; Curtin, Lester R.; Lamb, Molly M.; Flegal, Katherine M.Prevalence of high body mass index in US children and adolescents, 2007–2008. JAMA. 2010;303(3):242–249. [PubMed: 20071470]
Ogden, Cynthia L.; Carroll, Margaret D.; Curtin, Lester R.; McDowell, Margaret A.; Tabak, CarolynJ.; Flegal, Katherine M. Prevalence of overweight and obesity in the United States, 1999–2004.JAMA. 2006; 295:1549–1555. [PubMed: 16595758]
Ordonana JR, Rebollo-Mesa I, Gonzalez-Javier R, Perez-Riquelme F, Martinez-Selva JM, WillemsenG, Boomsma DI. Heritability of body mass index: A comparison between the Netherlands andSpain. Twin Res Hum Genet. 2007; 10:749–756. [PubMed: 17903116]
Popkin, Barry M.; Duffey, Kiyah; Gordon-Larsen, Penny. Environmental influences on food choice,physical activity and energy balance. Physiol Behav. 2005; 86:603–613. [PubMed: 16246381]
Price AL, Patterson NJ, Plenge RM, Weinblatt ME, Shadick NA, Reich D. Principal componentsanalysis corrects for stratification in genome-wide association studies. Nat Genet. 2006; 38:904–909. [PubMed: 16862161]
Price RA, Gottesman II. Body fat in identical twins reared apart: Roles for genes and environment.Behav Genet. 1991; 21:1–7. [PubMed: 2018460]
R Development Core Team. R: A language and environment for statistical computing. Vienna: RFoundation for Statistical Computing; 2009. URL http://www.R-project.org
Boardman et al. Page 11
Biodemography Soc Biol. Author manuscript; available in PMC 2011 August 12.
NIH
-PA Author Manuscript
NIH
-PA Author Manuscript
NIH
-PA Author Manuscript

Reich, David; Price, Alkes L.; Patterson, Nick. Principal component analysis of genetic data. NatGenet. 2008; 40:491–492. [PubMed: 18443580]
Richmond, Tracy K.; Subramanian, SV. School level contextual factors are associated with the weightstatus of adolescent males and females. Obesity. 2008; 16:1324–1330. [PubMed: 18356836]
Robert SA, Reither EN. A multilevel analysis of race, community disadvantage, and body mass indexamong adults in the US. Soc Sci Med. 2004; 59:2421–2434. [PubMed: 15474198]
Rosenbaum P, Rubin D. The central role of the propensity score in observational studies for causaleffects. Biometrika. 1983; 70(1):41–55.
Saunders CL, Chiodini BD, Sham P, Lewis CM, Abkevich V, Adeyemo AA, de Andrade M, Arya R,Berenson GS, Blangero J, et al. Meta-analysis of genome-wide linkage studies in BMI and obesity.Obesity. 2007; 15(9):2263–2275. [PubMed: 17890495]
Schousboe K, Willemsen G, Kyvik KO, Mortensen J, Boomsma DI, Cornes BK, Davis CJ, Fagnani C,Hjelmborg J, Kaprio J, et al. Sex differences in heritability of BMI: A comparative study of resultsfrom twin studies in eight countries. Twin Res Hum Genet. 2003; 6:409–421.
Shrewsbury, Vanessa; Wardle, Jane. Socioeconomic status and adiposity in childhood: A systematicreview of cross-sectional studies 1990–2005. Obesity. 2008; 16:275–284. [PubMed: 18239633]
Shiao, Jiannbin Lee; Bode, Thomas; Beyer, Amber; Fox, with Alison; Selvig, Daniel; Tandingan,Justin. The genomic challenge to the social construction of race. Paper presented at the annualmeetings of the American Sociological Association; 2008.
Silventoinen K, Pietlainen KH, Tynelius P, Sorensen TIA, Kaprio J, Rasmussen F. Genetic andenvironmental factors in relative weight from birth to age 18: The Swedish Young Male TwinsStudy. Int J Obesity. 2007; 31:615–621.
Stunkard AJ, Sorensen TI, Hanis C, Teasdale TW, Chakraborty R, Schull WJ, Schulsinger F. Anadoption study of human obesity. N Engl J Med. 1986; 314:193–198. [PubMed: 3941707]
United States Department of Health and Human Services. Healthy people 2010. Washington, DC:Author; 2000.
Whitaker RC, Wright JA, Pepe MS, Seidel KD, Dietz WH. Predicting obesity in young adulthoodfrom childhood and parental obesity. N Engl J Med. 1997; 337:869–873. [PubMed: 9302300]
Williams, David R. The health of men: Structured inequalities and opportunities. Am J Public Health.2003; 93:724–731. [PubMed: 12721133]
Yang W, Kelly T, He J. Genetic epidemiology of obesity. Epidemiol Rev. 2007; 29:49–61. [PubMed:17566051]
Zhang L, Cui X, Schmitt K, Hubert R, Navidi W, Arnheim N. Whole genome amplification from asingle cell: Implications for genetic analysis. Proc Natl Acad Sci USA. 1992; 89:5847–5851.[PubMed: 1631067]
Boardman et al. Page 12
Biodemography Soc Biol. Author manuscript; available in PMC 2011 August 12.
NIH
-PA Author Manuscript
NIH
-PA Author Manuscript
NIH
-PA Author Manuscript

Figure 1.Genome-wide measures of population ancestry and risk of obesity compared to self-reportedethnicity.Note: Figures describe the association between the three genomic control measures and BMIby self-identified ethnicity (dark circles are non-Hispanic whites). The distribution for eachmeasure is shown for each group in the corresponding figures on the right. As shown inTable 3, the bivariate linear associations are estimated to be bPC1 = .92 (p < .05), bm.dist = .03 (n.s.).
Boardman et al. Page 13
Biodemography Soc Biol. Author manuscript; available in PMC 2011 August 12.
NIH
-PA Author Manuscript
NIH
-PA Author Manuscript
NIH
-PA Author Manuscript

NIH
-PA Author Manuscript
NIH
-PA Author Manuscript
NIH
-PA Author Manuscript
Boardman et al. Page 14
Table 1
Descriptive statistics for all variables used in the analysis
Variable Total White Mexican American Pr (w-m) = 0
Height (in) 67.50 68.05 65.39 0.001
Weight (lb) 150.09 148.81 155.00 0.414
BMI 23.10 22.51 25.35 0.004
Age 16.62 16.53 16.95 0.432
Female 27.93 30.68 17.39 0.209
Poor (yearly income < $15k) 15.31 11.36 30.43 0.023
Genetic measures
PC1 0.00 1.804 −0.472 0.000
Mahalanobis Distance 44.59 37.68 71.01 0.000
Sample size (n) 111 88 23 —
BMI = body mass index; PC1 = First principal component.
Note: See Methods for a detailed description of the sample and the measures described here. p-values describe the probability of a type-I errorregarding differences between white and Mexican-American respondents across the measured items.
Biodemography Soc Biol. Author manuscript; available in PMC 2011 August 12.

NIH
-PA Author Manuscript
NIH
-PA Author Manuscript
NIH
-PA Author Manuscript
Boardman et al. Page 15
Tabl
e 2
Prin
cipa
l com
pone
nts f
rom
gen
ome-
wid
e da
ta: a
ssoc
iatio
ns w
ith B
MI a
nd se
lf-re
porte
d et
hnic
ity
Var
ianc
e ex
plai
ned
PC-B
MI a
ssoc
iatio
nPC
-eth
nici
ty a
ssoc
iatio
n
Uni
que
Cum
ulat
ive
r (P
C,B
MI)
Pr (r
= 0
)Pr
(w-b
= 0
)
PC1
0.03
00.
030
0.21
60.
030
1.80
4−0.472
0.00
0
PC2
0.01
40.
044
−0.183
0.06
7−0.043
0.01
10.
768
PC3
0.01
30.
057
0.03
70.
710
0.13
0−0.034
0.36
4
PC4
0.01
30.
070
0.01
00.
923
0.02
7−0.007
0.84
3
PC5
0.01
20.
083
−0.021
0.83
8−0.044
0.01
10.
892
PC6
0.01
20.
095
0.11
60.
249
0.10
8−0.028
0.72
0
PC7
0.01
20.
106
−0.063
0.53
1−0.145
0.03
80.
607
PC8
0.01
20.
118
0.11
90.
237
0.09
6−0.025
0.71
8
PC9
0.01
10.
129
0.14
50.
148
−0.201
0.05
30.
482
PC10
0.01
10.
141
−0.015
0.88
1−0.032
0.00
80.
906
Not
e: P
rinci
pal c
ompo
nent
s wer
e es
timat
ed fr
om th
e 11
1 pe
ople
acr
oss 5
,490
sing
le n
ucle
otid
e po
lym
orph
ism
s. Se
e th
e M
etho
ds se
ctio
n fo
r a m
ore
deta
iled
desc
riptio
n of
thes
e te
chni
ques
.
Biodemography Soc Biol. Author manuscript; available in PMC 2011 August 12.
NIH
-PA Author Manuscript
NIH
-PA Author Manuscript
NIH
-PA Author Manuscript
Boardman et al. Page 16
Tabl
e 3
OLS
par
amet
er e
stim
ates
: gen
etic
and
soci
al in
fluen
ces o
n B
MI
Mod
el 1
Mod
el 2
Mod
el 3
Mod
el 4
Mod
el 5
Mod
el 6
(Int
erce
pt)
23.1
0***
21.6
6***
15.0
5***
14.6
7***
14.0
5***
16.4
7***
(.40)
(1.1
0)(2
.83)
(2.7
5)(2
.81)
(2.9
6)
PC1
0.92
*−1.07
(.40)
(.99)
Mah
alan
obis
Dis
tanc
e0.
03−0.05
(.02)
(.03)
Mex
ican
-Am
eric
an2.
72**
2.15
*4.
56+
3.87
**
(.95)
(.95)
(2.4
4)(1
.43)
Age
0.44
*0.
45**
0.46
**0.
47**
(.17)
(.17)
(.17)
(.17)
Fem
ale
0.52
0.42
0.31
0.07
(.88)
(.85)
(.86)
(.87)
Low
Inco
me
2.91
**2.
90**
3.10
**
(1.0
5)(1
.05)
(1.0
5)
R-s
quar
ed0.
040.
010.
110.
170.
170.
18
Not
e: C
ell e
ntrie
s rep
rese
nt u
nsta
ndar
dize
d O
LS re
gres
sion
est
imat
es w
ith st
anda
rd e
rror
s in
pare
nthe
ses.
The
depe
nden
t var
iabl
e in
all
mod
els i
s BM
I obt
aine
d fr
om se
lf-re
porte
d he
ight
and
wei
ght.
* p <
.05;
**p
< .0
1;
*** p
< .0
01;
+p
< .1
0.
Biodemography Soc Biol. Author manuscript; available in PMC 2011 August 12.
Copyright © 2022 FDOKUMEN