Single-cell genome-wide bisulfite sequencing for assessing epigenetic heterogeneity
19
© 2014 Nature America, Inc. All rights reserved. BRIEF COMMUNICATIONS NATURE METHODS | ADVANCE ONLINE PUBLICATION | sequences and a 3′ stretch of nine random nucleotides. This step is performed five times to maximize the number of tagged DNA strands and to generate multiple copies of each fragment. After cap- turing the tagged strands, a second adaptor is similarly integrated, and PCR amplification is performed with indexed primers. We performed scBS-seq on ovulated metaphase II oocytes (MIIs) and mouse embryonic stem cells (ESCs) cultured either in 2i medium or serum conditions. MIIs are an excellent model for technical assessment as they: (i) can be individually hand- picked to ensure that only one cell is processed; (ii) represent a highly homogeneous population, which allows discrimination between technical and biological variability; and (iii) present a distinct DNA methylome comprising large-scale hypermethylated and hypomethylated domains 8 . ESCs grown in serum conditions exist in a state of dynamic equilibrium characterized by transcrip- tional heterogeneity and stochastic switching of transcriptional states 9–12 , and emerging evidence from immunofluorescence and locus-specific studies suggests that 5mC heterogeneity exists in ESCs 13 . Recent studies have also demonstrated remarkable plas- ticity in the ESC methylome; genome-wide hypomethylation is induced by two kinase inhibitors (2i), which inhibit FGF signal- ing 13,14 . We used ESCs grown in serum (‘serum ESCs’) and ESCs grown in 2i medium (‘2i ESCs’) to determine whether scBS-seq can reveal DNA methylation heterogeneity in single cells. We sequenced 12 MII, 12 2i ESC, 20 serum ESC and 7 negative control scBS-seq libraries, and their bulk cell counterparts (pools of cells) on an Illumina HiSeq at relatively low sequencing depth (average 19.4 million 100-base-pair (bp) paired-end reads). On average, 3.9 million (M) reads (range, 1.5 M–14.3 M reads) were mapped, corresponding to an efficiency of 20.1% (Supplementary Fig. 1 and Supplementary Table 1); this low efficiency is mostly due to the presence of low-complexity sequences (Supplementary Fig. 2). We obtained methylation scores on an average of 3.7 million CpG dinucleotides (CpGs; range, 1.8 M–7.7 M) corre sponding to 17.7% of all CpGs (range, 8.5–36.2%; Fig. 1b). More CpGs can be obtained with deeper sequencing, as the limiting duplication plateau was not reached at this sequencing depth (Supplementary Fig. 3). To validate this, we sequenced two MII libraries close to saturation and with longer sequencing reads (150 bp), which resulted in 1.5-fold and 1.9-fold more CpGs captured (Supplementary Table 1). In addition, because of the broad size distribution of fragments in scBS-seq libraries (Supplementary Fig. 1b), longer reads led to 9% greater CpG coverage at saturat- ing sequencing depth and 16% greater coverage at low depth. Integrating this additional sequencing revealed that up to 10.1 M CpGs (48.4% of all CpGs) can be obtained by scBS-seq. Single-cell genome-wide bisulfite sequencing for assessing epigenetic heterogeneity Sébastien A Smallwood 1,6 , Heather J Lee 1,2,6 , Christof Angermueller 3 , Felix Krueger 4 , Heba Saadeh 1 , Julian Peat 1 , Simon R Andrews 4 , Oliver Stegle 3 , Wolf Reik 1,2,5,7 & Gavin Kelsey 1,5,7 We report a single-cell bisulfite sequencing (scBS-seq) method that can be used to accurately measure DNA methylation at up to 48.4% of CpG sites. Embryonic stem cells grown in serum or in 2i medium displayed epigenetic heterogeneity, with ‘2i-like’ cells present in serum culture. Integration of 2 individual mouse oocyte datasets largely recapitulated the whole DNA methylome, which makes scBS-seq a versatile tool to explore DNA methylation in rare cells and heterogeneous populations. DNA methylation at cytosine residues (5mC) is an epigenetic mark that has critical roles in the regulation and maintenance of cell type–specific transcriptional programs 1,2 . Our understanding of 5mC functionality has been revolutionized by the development of BS-seq, which offers single-cytosine resolution and absolute quantification of 5mC genome-wide. Recent advances have dem- onstrated the power of single-cell sequencing to deconvolve mixed cell populations 3–5 . Incorporating epigenetic information into this single-cell arsenal will transform our understanding of gene regulation and provide insights into epigenetic heterogeneity 6 . Here we report an accurate and reproducible method, scBS-seq, that allows assessment of 5mC heterogeneity in cell populations across the entire genome. In commonly used BS-seq protocols, sequencing adaptors are ligated to fragmented DNA before bisulfite conversion, which results in a loss of information owing to DNA degradation by the bisulfite treatment. To minimize DNA loss from single cells, we developed a modification of post-bisulfite adaptor tagging 7 . In scBS-seq, bisulfite treatment is performed first, which results in simultaneous DNA fragmentation and conversion of unmethylated cytosines to thymine (Fig. 1a). Then, synthesis of complementary strands is primed using oligonuleotides containing Illumina adaptor 1 Epigenetics Programme, Babraham Institute, Cambridge, UK. 2 Wellcome Trust Sanger Institute, Cambridge, UK. 3 European Molecular Biology Laboratory, European Bioinformatics Institute, Hinxton, Cambridge, UK. 4 Bioinformatics Group, Babraham Institute, Cambridge, UK. 5 Centre for Trophoblast Research, University of Cambridge, Cambridge, UK. 6 These authors contributed equally to this work. 7 These authors jointly directed this work. Correspondence should be addressed to W.R. ([email protected]) or G.K. ([email protected]). RECEIVED 28 APRIL; ACCEPTED 25 JUNE; PUBLISHED ONLINE 20 JULY 2014; DOI:10.1038/NMETH.3035
-
Upload
independent -
Category
Documents
-
view
1 -
download
0
Transcript of Single-cell genome-wide bisulfite sequencing for assessing epigenetic heterogeneity

©20
14 N
atu
re A
mer
ica,
Inc.
All
rig
hts
res
erve
d.
brief communications
nature methods | ADVANCE ONLINE PUBLICATION | �
sequences and a 3′ stretch of nine random nucleotides. This step is performed five times to maximize the number of tagged DNA strands and to generate multiple copies of each fragment. After cap-turing the tagged strands, a second adaptor is similarly integrated, and PCR amplification is performed with indexed primers.
We performed scBS-seq on ovulated metaphase II oocytes (MIIs) and mouse embryonic stem cells (ESCs) cultured either in 2i medium or serum conditions. MIIs are an excellent model for technical assessment as they: (i) can be individually hand-picked to ensure that only one cell is processed; (ii) represent a highly homogeneous population, which allows discrimination between technical and biological variability; and (iii) present a distinct DNA methylome comprising large-scale hypermethylated and hypomethylated domains8. ESCs grown in serum conditions exist in a state of dynamic equilibrium characterized by transcrip-tional heterogeneity and stochastic switching of transcriptional states9–12, and emerging evidence from immunofluorescence and locus-specific studies suggests that 5mC heterogeneity exists in ESCs13. Recent studies have also demonstrated remarkable plas-ticity in the ESC methylome; genome-wide hypomethylation is induced by two kinase inhibitors (2i), which inhibit FGF signal-ing13,14. We used ESCs grown in serum (‘serum ESCs’) and ESCs grown in 2i medium (‘2i ESCs’) to determine whether scBS-seq can reveal DNA methylation heterogeneity in single cells.
We sequenced 12 MII, 12 2i ESC, 20 serum ESC and 7 negative control scBS-seq libraries, and their bulk cell counterparts (pools of cells) on an Illumina HiSeq at relatively low sequencing depth (average 19.4 million 100-base-pair (bp) paired-end reads). On average, 3.9 million (M) reads (range, 1.5 M–14.3 M reads) were mapped, corresponding to an efficiency of 20.1% (Supplementary Fig. 1 and Supplementary Table 1); this low efficiency is mostly due to the presence of low-complexity sequences (Supplementary Fig. 2). We obtained methylation scores on an average of 3.7 million CpG dinucleotides (CpGs; range, 1.8 M–7.7 M) corre sponding to 17.7% of all CpGs (range, 8.5–36.2%; Fig. 1b). More CpGs can be obtained with deeper sequencing, as the limiting duplication plateau was not reached at this sequencing depth (Supplementary Fig. 3). To validate this, we sequenced two MII libraries close to saturation and with longer sequencing reads (150 bp), which resulted in 1.5-fold and 1.9-fold more CpGs captured (Supplementary Table 1). In addition, because of the broad size distribution of fragments in scBS-seq libraries (Supplementary Fig. 1b), longer reads led to 9% greater CpG coverage at saturat-ing sequencing depth and 16% greater coverage at low depth. Integrating this additional sequencing revealed that up to 10.1 M CpGs (48.4% of all CpGs) can be obtained by scBS-seq.
single-cell genome-wide bisulfite sequencing for assessing epigenetic heterogeneitySébastien A Smallwood1,6, Heather J Lee1,2,6, Christof Angermueller3, Felix Krueger4, Heba Saadeh1, Julian Peat1, Simon R Andrews4, Oliver Stegle3, Wolf Reik1,2,5,7 & Gavin Kelsey1,5,7
We report a single-cell bisulfite sequencing (scbs-seq) method that can be used to accurately measure dna methylation at up to 48.4% of cpG sites. embryonic stem cells grown in serum or in 2i medium displayed epigenetic heterogeneity, with ‘2i-like’ cells present in serum culture. integration of �2 individual mouse oocyte datasets largely recapitulated the whole dna methylome, which makes scbs-seq a versatile tool to explore dna methylation in rare cells and heterogeneous populations.
DNA methylation at cytosine residues (5mC) is an epigenetic mark that has critical roles in the regulation and maintenance of cell type–specific transcriptional programs1,2. Our understanding of 5mC functionality has been revolutionized by the development of BS-seq, which offers single-cytosine resolution and absolute quantification of 5mC genome-wide. Recent advances have dem-onstrated the power of single-cell sequencing to deconvolve mixed cell populations3–5. Incorporating epigenetic information into this single-cell arsenal will transform our understanding of gene regulation and provide insights into epigenetic heterogeneity6. Here we report an accurate and reproducible method, scBS-seq, that allows assessment of 5mC heterogeneity in cell populations across the entire genome.
In commonly used BS-seq protocols, sequencing adaptors are ligated to fragmented DNA before bisulfite conversion, which results in a loss of information owing to DNA degradation by the bisulfite treatment. To minimize DNA loss from single cells, we developed a modification of post-bisulfite adaptor tagging7. In scBS-seq, bisulfite treatment is performed first, which results in simultaneous DNA fragmentation and conversion of unmethylated cytosines to thymine (Fig. 1a). Then, synthesis of complementary strands is primed using oligonuleotides containing Illumina adaptor
1Epigenetics Programme, Babraham Institute, Cambridge, UK. 2Wellcome Trust Sanger Institute, Cambridge, UK. 3European Molecular Biology Laboratory, European Bioinformatics Institute, Hinxton, Cambridge, UK. 4Bioinformatics Group, Babraham Institute, Cambridge, UK. 5Centre for Trophoblast Research, University of Cambridge, Cambridge, UK. 6These authors contributed equally to this work. 7These authors jointly directed this work. Correspondence should be addressed to W.R. ([email protected]) or G.K. ([email protected]).Received 28 ApRil; Accepted 25 June; published online 20 July 2014; doi:10.1038/nmeth.3035
©20
14 N
atu
re A
mer
ica,
Inc.
All
rig
hts
res
erve
d.
2 | ADVANCE ONLINE PUBLICATION | nature methods
brief communications
Next, we investigated the reproducibility and accuracy of scBS-seq. Bisulfite conversion efficiency was ≥97.7%, as assessed by analysis of non-CpG methylation (or ≥98.5% by examining the unmethylated mitochondrial chromosome in ESCs; Fig. 1c and Supplementary Table 1). CpG sites in MIIs were overwhelmingly called methylated or unmethylated, which is consistent with a highly digitized output from single cells (Supplementary Fig. 4). As expected, global methylation of MIIs was highly homogeneous (33.1 ± 0.8%; ± s.d.) and 2i ESCs were hypomethylated compared to serum ESCs13. Yet both 2i ESCs and serum ESCs exhibited 5mC heterogeneity (serum, 63.9 ± 12.4%; 2i medium, 31.3 ± 12.6%; Fig. 1c). Global 5mC levels measured in individual MIIs were slightly lower than in the bulk sample (39.0%), but merging all MII datasets resulted in 38.8% global methylation.
To test the technical reproducibility of scBS-seq, we deter-mined the average pairwise concordance between individual CpGs across single oocyte libraries, which was 87.6% genome-wide (range, 85.3–88.9%) and 95.7% in unmethylated CpG islands (CGIs), a highly homogeneous genomic feature (Fig. 1d). CpG concordance in ESCs was lower (serum, 72.7%; 2i medium, 69.8%), which reflected the heterogeneity of these cells (Fig. 1d and Supplementary Fig. 5). At 2-kilobase (kb) resolution, we observed high correlation between individual MIIs (average R = 0.92), and between individual MIIs and bulk (average R = 0.95) (Fig. 1e). In addition, for each MII, we obtained methylation information on an average of 61.5% of all CGIs (range, 46.3–82.7%);
of 1,615 CGIs identified as methylated from bulk libraries and informative in individual MIIs, ≥92% were called methyl-ated by scBS-seq, with ≤0.3% incorrectly called unmethylated (Supplementary Fig. 6).
Mapped scBS-seq reads were distributed across the genome and provided information on all genomic contexts, including reg-ulatory regions (Supplementary Table 2); however, the enrich-ment in exons, promoters and CGIs observed in bulk libraries was exaggerated in scBS-seq libraries (Supplementary Fig. 7). Yet the fact that we obtained ~20% coverage of CpGs per cell means that the proportion of sites that can be compared across samples will depend on the nature of the analytic units (features, window size, etc.); conversely, in silico merging of individual datasets rapidly increased the number of CpGs with information (Supplementary Fig. 8). We could largely reproduce the entire 5mC landscape of oocytes using only 12 single cells (Fig. 1e,f and Supplementary Fig. 9). This capability is particularly ben-eficial for analyses of homogeneous cell populations and makes scBS-seq an important tool to investigate the 5mC landscape in very rare material.
To explore 5mC heterogeneity in ESCs, we used a 3-kb sliding window to estimate the methylation rate across each ESC genome as well as the mean methylation rate and variance across all ESCs (Fig. 2a). We clustered cells on the basis of methylation rates while penalizing estimation uncertainty owing to low read counts. We identified two distinct clusters that represented the
figure � | scBS-seq is an accurate and reproducible method for genome-wide methylation analysis. (a) scBS-seq library preparation consists of isolating and lysing single cells before bisulfite conversion (‘BS’); performing five rounds of random priming and extension using oligo 1 (which carries the first sequencing adaptor) and purifying synthesized fragments; and performing a second random priming and extension step using oligo 2 (which carries the second sequencing adaptor) before amplifying the resulting fragments. (b) Number of CpGs obtained by scBS-seq as a function of mapped sequences. (c) Global DNA methylation in a CpG (CG) and non-CpG (CHH/G) context for single cells (SCs), in silico–merged and bulk samples. (d) Pairwise analysis of CpG concordance genome-wide and in unmethylated CGIs. Boxplots represent the interquartile range, with the median; whiskers correspond to 1.5 times the interquartile range. (e) Matrix of pairwise Pearson correlations (2-kb windows) for MII bulk, individual MII and in silico–merged MII scBS-seq datasets. (f) CpG methylation percentage quantified over 2-kb windows for four single MII libraries and merged data from all 12 MIIs (MII merged), which closely resemble the landscape of the bulk MII sample. Inset, correlation between MII bulk and MII merged data.
a
e
5′
Step 1lysis and BS
Single-cellisolation
Lysis
5′5′5′
5′
5′
95 °C
3′
3′
3′
3′3′3′
3′
3′ 3′3′
3′
3′ 3′3′
3′5′
5′
5′
5′5′
5′5′
(N)9(N)9
5′
5′5′
5′5′
BSconversion
Exo I andcapture
PCR andindexing
×4
Step 2oligo 1 tagging
Step 3oligo 2 tagging
and PCR
d1.0
Whole genome CGIs
0.90.80.70.6
Con
cord
ance
(%
)
0.5
MIIsoocytes
MIIsoocytes
ESCs2i
ESCsserum
ESCs(all)
b
9
ESCs 2iESCs serumMII oocytes
8765
Num
ber
of C
pGs
(×10
6 )
% total C
pGs
43210
4035302520151050
Mapped sequences (×106)
02.
55.
07.
510
.012
.015
.0
c
80
60
40
20
0MIIs
oocytesESCs
2iESCsserum
% m
ethy
latio
n
SCs (CG)SCs (CHH/G)
Average SCsMerged SCsBulk
1.00
0.95
0.90
0.85
BulkMerged
Bul
kM
erge
d
MII #1MII #2
MII #3MII #4
MII #5MII #6
MII #7MII #8
MII #9MII #10
MII #11MII #12
MII
#1M
II #2
MII
#3M
II #4
MII
#5M
II #6
MII
#7M
II #8
MII
#9M
II #1
0M
II #1
1M
II #1
2f
MIIBulk
MIImerged
MII #1
MII #2
CpG
met
hyla
tion
(%)
MII
mer
ged
MII bulk
MII #3
MII #4
% methylation
0 25 50 75 100
100 R = 0.9890807060504030
1020
0
0 10 20 30 40 50 60 70 80 90 100
NCBI37 chr. 10:17700982–18281998 (581 Kbp)
10050
0
Genes
10050
0
10050
0
10050
0
10050
0
10050
0

©20
14 N
atu
re A
mer
ica,
Inc.
All
rig
hts
res
erve
d.
nature methods | ADVANCE ONLINE PUBLICATION | �
brief communications
majority of 2i ESCs and serum ESCs (Fig. 2b). Outlier cells from the serum condition clustered with 2i ESCs, which implies that serum cultures contain ‘2i-like’ ESCs and demonstrates the ability of scBS-seq to identify rare cell types in populations. To examine 5mC heterogeneity in ESCs in greater detail, we ranked sites by the estimated cell-to-cell variance and repeated the cluster analy-sis for the 300 most variable sites (Fig. 2c). The structure of the resulting clusters was grossly similar to that in the genome-wide analysis, and all 300 variable sites followed the global trend of being more highly methylated in serum than 2i ESCs with high similarity between sites (Figs. 1c and 2b,c, and Supplementary Figs. 10 and 11). This observation is consistent with the genome-wide hypomethylation observed in ESCs grown in 2i medium13 and indicates that a major determinant of ESC heterogeneity is global methylation.
scBS-seq also identified sites whose methylation varied more than the genome average, including sites with marked heterogene-ity even among cells from the same growth condition (e.g., clusters 5 and 6 in serum ESCs; Fig. 2c). Regions containing H3K4me1 and H3K27ac, marks associated with active enhancers, had the
greatest variance in 5mC, whereas CGIs and intracisternal A-particle repeats had lower variance than the genome average (Fig. 2d and Supplementary Fig. 12). These findings are consistent with observations that distal regulatory elements are differentially methylated between tissues and throughout development15–17.
While this manuscript was in preparation, a single-cell reduced-representation bisulfite sequencing (scRRBS) method was reported18, based on the single-tube RRBS strategy we had previously developed19. Although scRRBS and scBS-seq could be seen as complementary, our methodology currently provides information on ~5-fold more CpGs and ~1.5-fold more CGIs at equivalent sequencing depth (Supplementary Fig. 13). Future developments will undoubtedly allow information to be recovered from most genomic CpGs, the key being the ability to amplify DNA before bisulfite conversion. The capacity to capture the DNA methylome from individual cells will be critical for a full understanding of early embryonic development, cancer progres-sion and generation of induced pluripotent stem cells.
Our work demonstrates that large-scale single-cell epigenetic analysis is achievable, and demonstrates that scBS-seq is a powerful
% methylation
0 50 100
AllSerum ESC
Bulk serum
2i ESC
Bulk 2i
1 2 3 4 5 6 7Cluster
c
Distance
1061 531 0 Serum ESC
Bulk serum
2i ESC
Bulk 2i
b
Lower-bound variance
0 0.05 0.10 0.15 0.20
All
Exon
Intron
Intergenic
Promoter
CGI
p300
LMR
H3K4me1
H3K27ac
H3K27me3
IAP
d
Dppa3 Nanog Slc2a3mRNA
CGIH3K4me1H3K27ac
p300
0.50
0.25
0Var
ianc
eM
ethy
latio
n
1.0
0.5
0
All ESC Bulk serum Bulk 2i
122600000 122625000 122650000 122675000NCBIM37 Chr6:122576704–122696704 (120 kbp)
a
figure 2 | scBS-seq reveals DNA methylation heterogeneity in ESCs. (a) Estimated DNA methylation rates using a sliding window in an example region containing the Nanog locus with some annotated features. Each single ESC is represented by a different color (bottom), and dot size is the inverse of estimation error. Mean methylation rate estimates across cells (black line, bottom) and cell-to-cell variance (blue line, middle; 95% confidence interval in light blue) are shown. Methylation rates for ‘bulk serum’ (green line) and ‘bulk 2i’ (orange line) are superimposed (bottom). (b) Genome-wide cluster dendrogram and distance matrix for all ESCs and bulk samples based on estimated methylation rates. Distance refers to the weighted Euclidean norm between estimated rates. (c) Heatmap for methylation rates of the top 300 most variable sites among single-cell ESC samples. Cluster dendrograms for samples (left) and sites (top) are shown. The genome-wide average methylation rate is displayed in the left track (‘all’). The main clusters of variable sites are indicated at the bottom. (d) Variance of sites located in different genomic contexts. Boxes represent interquartile range with the median; whiskers correspond to 1.5 times the interquartile range. The shaded gray region indicates the interquartile range for all genome-wide sites.

©20
14 N
atu
re A
mer
ica,
Inc.
All
rig
hts
res
erve
d.
4 | ADVANCE ONLINE PUBLICATION | nature methods
brief communications
approach to accurately measure 5mC across genomes of single cells and to reveal 5mC heterogeneity in cell populations.
methodsMethods and any associated references are available in the online version of the paper.
Accession codes. Gene Expression Omnibus (GEO): GSE56879.
Note: Any Supplementary Information and Source Data files are available in the online version of the paper.
acknoWledGmentsWe thank K. Tabbada and the Welcome Trust Sanger Institute sequencing pipeline team for assistance with Illumina sequencing, R. Walker for assistance with flow cytometry, T. Hore (Babraham Institute, Cambridge, UK) for providing ESCs maintained in 2i medium and serum conditions, and T. Hore, J. Huang, I. Macaulay, S. Lorenz, M. Quail, T. Voet and H. Swerdlow for helpful discussions. This work was supported by the UK Biotechnology and Biological Sciences Research Council grant BB/J004499/1, UK Medical Research Council grant MR/K011332/1, Wellcome Trust award 095645/Z/11/Z and EU FP7 EpiGeneSys and BLUEPRINT.
author contributionsS.A.S. and H.J.L. designed the study, prepared scBS-seq libraries, analyzed data and wrote the manuscript. F.K., H.S. and S.R.A. performed sequence mapping and analyzed data. J.P. contributed to technical developments. C.A. and O.S.
analyzed data. O.S. provided advice on statistical analyses. W.R. and G.K. supervised the study and wrote the manuscript.
comPetinG financial interestsThe authors declare competing financial interests: details are available in the online version of the paper.
reprints and permissions information is available online at http://www.nature.com/reprints/index.html.
1. Jones, P.A. Nat. Rev. Genet. ��, 484–492 (2012).2. Smith, Z.D. & Meissner, A. Nat. Rev. Genet. �4, 204–220 (2013).3. Jaitin, D.A. et al. Science �4�, 776–779 (2014).4. Deng, Q. et al. Science �4�, 193–196 (2014).5. Macaulay, I.C. & Voet, T. PLoS Genet. �0, e1004126 (2014).6. Lee, H.J. et al. Cell Stem Cell �4, 710–719 (2014).7. Miura, F. et al. Nucleic Acids Res. 40, e136 (2012).8. Shirane, K. et al. PLoS Genet. 9, e1003439 (2013).9. Chambers, I. et al. Nature 450, 1230–1234 (2007).10. Islam, S. et al. Nat. Methods ��, 163–166 (2014).11. Hayashi, K. et al. Cell Stem Cell �, 391–401 (2008).12. Torres-Padilla, M.E. & Chambers, I. Development �4�, 2173–2181 (2014).13. Ficz, G. et al. Cell Stem Cell ��, 351–359 (2013).14. Habibi, E. et al. Cell Stem Cell ��, 360–369 (2013).15. Stadler, M.B. et al. Nature 480, 490–495 (2011).16. Ziller, M.J. et al. Nature 500, 477–481 (2013).17. Hon, G.C. et al. Nat. Genet. 45, 1198–1206 (2013).18. Guo, H. et al. Genome Res. 2�, 2126–2135 (2013).19. Smallwood, S.A. et al. Nat. Genet. 4�, 811–814 (2011).

©20
14 N
atu
re A
mer
ica,
Inc.
All
rig
hts
res
erve
d.
doi:10.1038/nmeth.3035 nature methods
online methodsSample collection. MII oocytes were collected from superovu-lated 4–5-week-old C57BL/6Babr mice, under a stereomicroscope, by mouth pipetting, and stored at −80 °C. Before scBS-seq, 2× oocyte lysis buffer (10 mM Tris-Cl pH 7.4 and 2% SDS) and 0.5 µl proteinase K were added (final volume 12 µl) followed by incubation at 37 °C for 1 h. E14 ESCs were cultured in serum plus LIF or 2i medium plus LIF conditions as described previously13. The 2i ESCs had been maintained in this medium for 24 d and matched serum ESCs were cultured in parallel. Single ESCs were collected by flow cytometry in 12 µl of ESC lysis buffer (10 mM Tris-Cl pH 7.4, 0.6% SDS and 0.5 µl proteinase K) using a BD Influx instrument in single cell 1 drop mode. ToPro-3 and Hoechst 33342 staining were used to select for live cells with low DNA con-tent (i.e., in G0 or G1 phase). ESCs were incubated at 37 °C for 1 h and stored at −20 °C until required for library preparation. Negative controls were either lysis buffer alone (‘empty’ tubes) or sorted BD Accudrop Beads, and were prepared and processed concomitantly with all single-cell samples.
Single-cell library preparation. Bisulfite conversion was per-formed on cell lysates using the Imprint DNA Modification Kit (Sigma) with the following modifications: all volumes were halved, and chemical denaturation was followed by incubation at 65 °C for 90 min, 95 °C for 3 min and 65 °C for 20 min. Purification was performed as described previously7, and DNA was eluted in 10 mM Tris-Cl (pH 8.5) and combined with 0.4 mM dNTPs, 0.4 µM oligo 1 ((Biotin)CTACACGACGCTCTTCCGATCTNNNNNNNNN) and 1× Blue Buffer (Sigma) (24 µl final) before incubation at 65 °C for 3 min followed by 4 °C pause. 50 U of Klenow exo– (Sigma) were added and the samples incubated at 4 °C for 5 min, +1 °C/15 s to 37 °C, 37 °C for 30 min. Samples were incubated at 95 °C for 1 min and transferred immediately to ice before addition of fresh oligo 1 (10 pmol), Klenow exo– (25 U), and dNTPs (1 nmol) in 2.5 µl total. The samples were incubated at 4 °C for 5 min, +1 °C/15 s to 37 °C, 37 °C for 30 min. This ran-dom priming and extension was repeated a further three times (five rounds in total). Samples were then incubated with 40 U exo-nuclease I (NEB) for 1 h at 37 °C before DNA was purified using 0.8× Agencourt Ampure XP beads (Beckman Coulter) according to the manufacturer’s guidelines. Samples were eluted in 10 mM Tris-Cl (pH 8.5) and incubated with washed M-280 Streptavidin Dynabeads (Life Technologies) for 20 min with rotation at room temperature. Beads were washed twice with 0.1 N NaOH, and twice with 10 mM Tris-Cl (pH 8.5) and resuspended in 48 µl of 0.4 mM dNTPs, 0.4 µM oligo 2 (TGCTGAACCGCTCTTCCGATCTNNNNNNNNN) and 1× Blue Buffer. Samples were incubated at 95 °C for 45 s and transferred immediately to ice before addi-tion of 100 U Klenow exo– (Sigma) and incubation at 4 °C for 5 min, +1 °C/15 s to 37 °C, 37 °C for 90 min. Beads were washed with 10 mM Tris-Cl (pH 8.5) and resuspended in 50 µl of 0.4 mM dNTPs, 0.4 µM PE1.0 forward primer (AATGATACGGCGACCACCGAGATCTACACTCTTTCCCTACACGACGCTCTTCCGA TCT), 0.4 µM indexed iPCRTag reverse primer20, 1 U KAPA HiFi HotStart DNA Polymerase (KAPA Biosystems) in 1× HiFi Fidelity Buffer. Libraries were then amplified by PCR as follows: 95 °C 2 min, 12–13 repeats of (94 °C 80 s, 65 °C 30 s, 72 °C 30 s), 72 °C 3 min and 4 °C hold. Amplified libraries were purified using 0.8× Agencourt Ampure XP beads, according to the manufacturer’s
guidelines, and were assessed for quality and quantity using High-Sensitivity DNA chips on the Agilent Bioanalyzer, and the KAPA Library Quantification Kit for Illumina (KAPA Biosystems). Pools of 12–14 single cell libraries were prepared for 100-bp paired-end sequencing on a HiSeq2500 in rapid-run mode (2 lanes/run).
Bulk sample library preparation. Samples from bulk cell popula-tions were prepared according to the protocol above, with some modifications. For the bulk oocyte sample, 120 MII oocytes were collected and lysed as described above. For ESC bulk cell samples, DNA was purified from cell pellets using the QIAamp micro kit (QIAGEN), according to the manufacturer’s instructions, and 50 ng of purified DNA was used in the library preparation. One round of first-strand synthesis was performed using 0.8 mM dNTPs and 4 µM oligo 1, and second-strand synthesis also used 0.8 mM dNTPs and 4 µM oligo 2. Bulk cell libraries were ampli-fied as above with 9–12 cycles of PCR.
Sequencing data processing and data analysis. Raw sequence reads were trimmed to remove the first 9 base pairs, adaptor contami-nation and poor-quality reads using Trim Galore! (v0.3.5, http://www.bioinformatics.babraham.ac.uk/projects/trim_galore/, parameters:–clip_r1 9–clip_r2 9–paired). Owing to the multi-ple rounds of random priming performed with oligo 1, scBS-seq libraries are nondirectional. Trimmed sequences were first mapped to the human genome (build GRCh37) using Bismark21 (v0.10.1; parameters:–pe,–bowtie2,–non_directional,–unmapped), resulting in 1.4% mapping efficiency (0.2–13.2% range). Remaining sequences were mapped to the mouse genome (build NCBI37) in single-end mode (Bismark parameters:–bowtie2– non_directional). Methylation calls were extracted after dupli-cate sequences had been excluded. For oocyte bulk analysis, our MII bulk data set was merged in silico with previously published data sets8 (DNA Data Bank of Japan, GenBank and European Molecular Biology Laboratory accession number DRA000570). Data visualization and analysis were performed using SeqMonk, custom R and Java scripts. For Figure 1c, C+G methylation was calculated as the average of methylation for each CpG position, and non-CpG methylation was extracted from the Bismark reports. Trend line in Figure 1b was calculated using polyno-mial regression. Percentage of concordance was calculated as the percentage of CpGs presenting the same methylation call at the same genomic position across two cells. For correlation analysis (Pearson’s), 2-kb windows were defined informative if at least 8 CpGs per window were sequenced. CGI annotation used is from CXXC affinity purification plus deep sequencing (CAP-seq) experiments22. Informative CGIs were defined if at least 10 CpGs per CGI were sequenced. Hyper-methylated and hypo-methylated CGIs were defined as ≥80% and ≤20% methyla-tion respectively. Annotation for comparison of genomic contexts (Fig. 2d, Supplementary Fig. 12, and Supplementary Table 2) were extracted from previously published datasets15,23.
Statistical analyses. Estimating sample-specific methylation rates. We estimated for each cell j at position i the methylation rate ri,j. To increase the coverage across cells, we employed a sliding-window approach, which is conceptually similar to approaches that have been used for bulk BS-Seq24,25. With window size w = 3,000 bp

©20
14 N
atu
re A
mer
ica,
Inc.
All
rig
hts
res
erve
d.
doi:10.1038/nmeth.3035nature methods
and step size 600 bp, we computed the sum of methylated (ci j,+ )
and unmethylated (ci j,− ) read counts in each window
s c s ci j i k j i jk ww
i k jk ww
, , ,//
,//+
++ −
= −+
+−
= −+= =∑ ∑2
22
2
To estimate methylation rates, we modeled the sum si j,+ of methyl-
ated counts as a binomial (Bin) random variable with methylation rate ri,j
s s s ri j i j i j i j, , , ,( , )+ + −+∼Bin
Assuming a beta (1, 1) prior on ri,j, leads to the maximum a poste-riori estimator for methylation rates for each window and cell
ˆ ,,
, ,
rs
s si j
i j
i j i j
=+
+ +
+
+ −1
2
We approximated the standard error of the rate estimator as follows:
ˆ [ˆ ]ˆ ( ˆ )
,, ,
, ,
a SE rr r
s si j
i j i j
i j i j
2 1=
−
++ −
Estimating mean methylation rates. We used the estimated sample-specific methylation rates ˆ ,ri j to estimate mean methylation rates and cell-to-cell variances. We modeled the mean methylation rate ri at position i across all cells as a Gaussian random variable with mean ri and variance vi
r N r vi i i∼ ( , )
To account for differences in the standard errors ̂ [ˆ ],a SE ri j , we weighted sample j and position i by ˆ [ˆ ], ,a = SEw ri j i j
−2, and used the weighted maximum likelihood estimator
ˆ ˆ ˆ,
, ,a rw
w rij i j
i j i jj
= ∑1
Σ
to estimate ri . The corresponding standard error is given by
ˆ [ ˆ],
a rwi
j i jSE 2 1=
Σ
The maximum likelihood estimator of the cell-to-cell methylation variance vi is
ˆ( )
(ˆ ˆ),
, ,, ,v
w
w ww r ri
j i j
j i j j i jj i j i j i=
Σ
Σ ΣΣ
2 22
−−
which is the unbiased weighted sample variance. The chi-squared confidence interval of the variance estimator with confidence level α is
ˆ[ˆ , ˆ ]ˆ
,ˆ
, ,
a v vn v n v
il
iu i i
ni
i i
ni
=
′ ′ −α2
α2χ χ
12 2
Here, χp ni,2 is the p quantile of the chi-squared distribution with
ni degrees of freedom, where ni is the sum of sample weights
nw
w wij i j
j i j j i j
22 2=
Σ
Σ Σ,
, ,( ) −
To determine highly variable methylated sites, we ranked these by the lower bound v̂i
l of the chi-squared confidence interval and defined the top k sites as the most variable sites. This approach is selecting sites with large estimates of cell to cell variance while penalizing for uncertainty of these estimates, which typically stems from low read counts.
Clustering. To cluster cells and sites, we considered a complete linkage clustering and employed the weighted Euclidean norm as distance measure for comparing sample j with sample ′j
ˆ ( , ) (ˆ ˆ ),, ,ad j j w r ri
j ji j i j
i
d′ = −′
′=∑ 2
1
We defined the weight wij j, ′ at position i as
w w wij j
i j i j,
, ,′
′∝
and normalized weights to sum up to the total number of positions d. This distance measure places most emphasis on sites that are well covered in both samples.
20. Quail, M.A. et al. Nat. Methods 9, 10–11 (2012).21. Krueger, F. & Andrews, S.R. Bioinformatics 27, 1571–1572 (2011).22. Illingworth, R.S. et al. PLoS Genet. 6, e1001134 (2010).23. Creyghton, M.P. et al. Proc. Natl. Acad. Sci. USA �07, 21931–21936
(2010).24. Li, Y. et al. PLoS Biol. 8, e1000533 (2010).25. Bock, C. et al. Mol. Cell 47, 633–647 (2012).

Supplementary Figure 1
Quality control of scBS-seq libraries.
(a) Mapping efficiency of scBS-Seq samples and negative controls. Boxplot representation of the mapping efficiencies (on sequences obtained after trimming and mapping against human genome) for each single cell and negative control (red crosses represent individual cell values). The overall higher mapping efficiency of oocytes versus ESCs can be explained by the amount of DNA in each cells (4n for MII oocytes and 2n for ESCs), resulting in a relatively lower contribution of spurious sequences in MIIs (see Supplementary Fig. 2). All negative controls had less than 3.5% mapping efficiency (the dashed line indicates 5% mapping efficiency). (b) Visualization of scBS-Seq library fragment size distribution on the Bioanalyser platform. The Bioanalyser trace of library MII#1 is shown as an example.
Nature Methods: doi:10.1038/nmeth.3035

Supplementary Figure 2
Contribution of spurious sequences to scBS-seq mapping efficiency.
(a) The relatively low mapping efficiency of scBS-Seq is associated with a significant fraction of sequences mapping at multiple genomic locations, which are therefore discarded. (b) Analysis of the G+C content of the raw sequences (i.e. prior to mapping) of scBS-Seq libraries revealed many with <3% G+C, absent from bulk samples. These correspond to poly-T stretches (poly-Ts) (i.e., (T)N with N>50). Poly-Ts are present in both actual samples and corresponding negative controls suggesting a contaminant as their main source of origin. (c,d) The amount of poly-Ts is higher in ESCs than oocytes, and the percentage of sequences with poly-Ts and sequences with multiple alignments are tightly correlated across samples. (e) This suggests that poly-Ts are the major cause for scBS-Seq low mapping efficiency. To test this, we trimmed, from the raw fasq file, sequences containing poly-Ts of at least 50bp in size and repeated the mapping. This resulted in a drastic reduction in the percentage of sequences with multiple alignments and an increase in the percentage of sequences with unique alignments. Poly-Ts are inherent to our current methodology, and while alternative protocols we developed do not generate these artifacts, they still yield significantly fewer measured CpGs.
Nature Methods: doi:10.1038/nmeth.3035

Supplementary Figure 3
Saturation level of scBS-seq libraries.
For each individual MII scBS-Seq library and one representative example of bulk BS-Seq (PBAT), the percentage of informative CpGs is plotted for 10% increments of mapped sequences. This demonstrates that in contrast to the bulk BS-Seq example (black line), MIIs scBS-Seq libraries (colored lines) have not reached the plateau of saturating sequencing depth, indicating that further sequencing would yield additional information. MII#2 Deep Seq and MII#5 Deep Seq correspond to the deeper sequencing of these libraries (see main text and Supplementary Table 1).
Nature Methods: doi:10.1038/nmeth.3035
Supplementary Figure 4
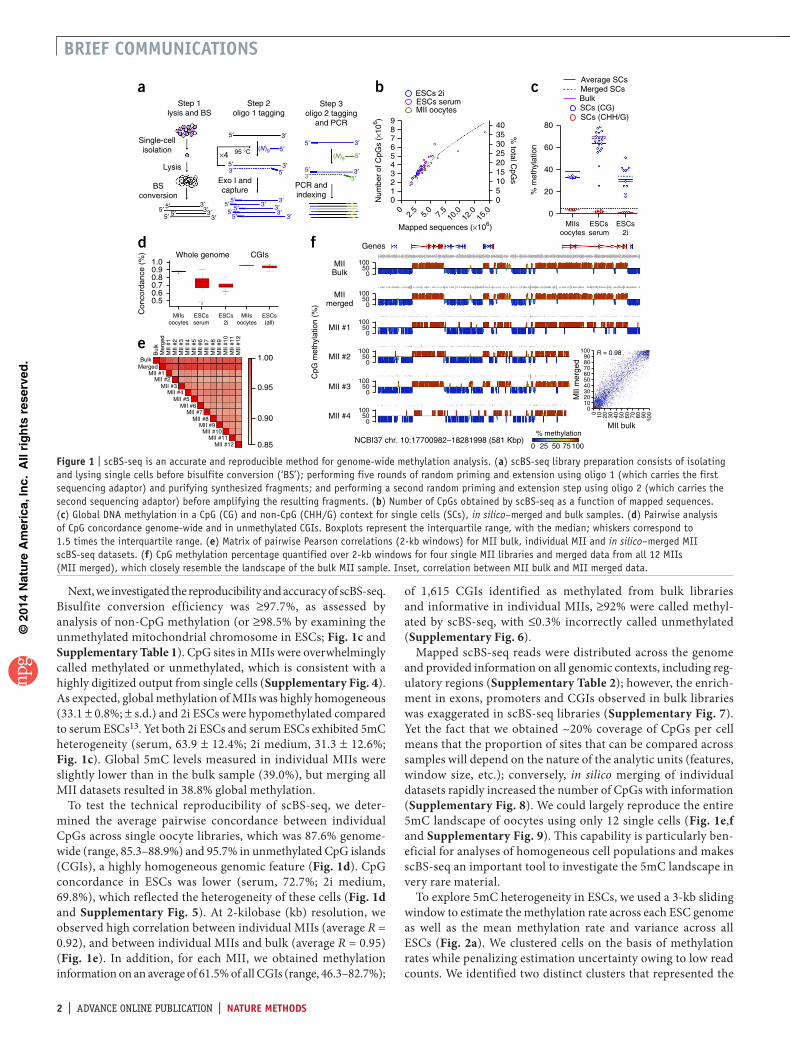
scBS-seq generates a digital output of DNA methylation.
(a) For each single MII BS-Seq library, and for the bulk MII sample, CpGs were grouped based on their read depth. The proportion of CpGs in each group with a methylation value of either 0% or 100% (digital output) was calculated for each sample. The boxplot represents the results from all 12 single MII libraries. The results from the bulk MII sample are superimposed as solid blue circles. As expected, the proportion of digital CpGs in the scBS-Seq libraries was very high (>90% for read depth 2-5 in all cells, dashed line). In contrast, the bulk sample had fewer digital CpGs (66% at read depth 5) due to cell-to-cell variability within the population. (b) Histograms of the distribution of CpG methylation values for MII bulk and MII single cells for CpGs with at least 2 reads.
Nature Methods: doi:10.1038/nmeth.3035

Supplementary Figure 5
CpG concordance obtained from MIIs and ESCs using scBS-seq.
(a) CpG concordance was calculated for each cell pair as the proportion of overlapping CpGs with identical methylation state. On average, 1.8M CpGs were measured for each pairwise analysis. Within each cell types, the order from bottom – up is the same than in Supplementary Table1 (For oocytes bottom sample is MII#1 and top sample is MII#12). (b) Pearson correlation matrix of MIIs, 2i ESCs and serum ESCs scBS-Seq was calculated using 2kb window methylation values.
Nature Methods: doi:10.1038/nmeth.3035

Supplementary Figure 6
scBS-seq accurately determines CpG island (CGI) methylation status in MII oocytes.
(a) Heatmap displaying in individual MII libraries the methylation level of CGIs identified as methylated (>80%) and unmethylated (<20%; random selection) in bulk. The number on top indicates the number of individual MIIs in which CGIs are commonly informative. The discrepancy between the number of methylated and unmethylated CGIs informative across single cells reflects the different CpG density between these 2 groups as previously described19. (b) Histogram displaying for MII bulk and individual MII libraries the percentage of total CGIs (23,020) found methylated, unmethylated, with an intermediate level of methylation, and the percentage of wrong calls (i.e., CGI methylated in bulk (>80%) and called unmethylated (<20%) in single cells, and vice versa). (c) Boxplot presenting the methylation level in each individual MII of CGIs found methylated in bulk (>80%). The percentage of these CGIs informative in each MII with a methylation level lower than 80% is shown below the plot. (d) Similar to (c) for unmethylated CGIs (<20%).
Nature Methods: doi:10.1038/nmeth.3035

Supplementary Figure 7
scBS-seq provides information on all genomic contexts.
(a) Snapshot displaying read distribution across 61Mbp of chromosome 19. Below the annotation tracks are displayed the mapped reads and the quantification (number of reads per 25kb window (log)). (b) The representation of different genomic contexts in single cell and bulk libraries is shown as fold enrichment over the expected value (dashed line). The boxplot represents the values for all single cell samples, and the bulk samples are superimposed as blue diamonds (MII), purple crosses (serum ESCs) and red plus signs (2i ESCs).
Nature Methods: doi:10.1038/nmeth.3035

Supplementary Figure 8
Union and intersect for scBS-seq libraries.
Number of CpGs (a) and CGIs (b) for the union and intersect of all possible combinations of the 12 individual MII scBS-Seq libraries. The union shows that pooling data from multiple scBS-Seq samples increases the number of measured sites. The intersect shows that the number of measured sites common to multiple scBS-Seq datasets decreases as the number of datasets increases. Dotted lines show the information obtained in standard BS-Seq experiments as well as the number of CpGs and CGIs in the mouse genome.
Nature Methods: doi:10.1038/nmeth.3035

.
Supplementary Figure 9
scBS-seq snapshot of the imprinted locus Plagl1.
The imprinted Plagl1 locus (top) and Plagl1 maternal DMR/CGI (bottom) is shown for all 12 individual MIIs, MIIs merged and MII bulk. Quantification is absolute level of methylation (%), at individual CpG resolution, as indicated on the scale on the left of each sample (0 is 0% methylation, 1 is 100% methylation).
Nature Methods: doi:10.1038/nmeth.3035
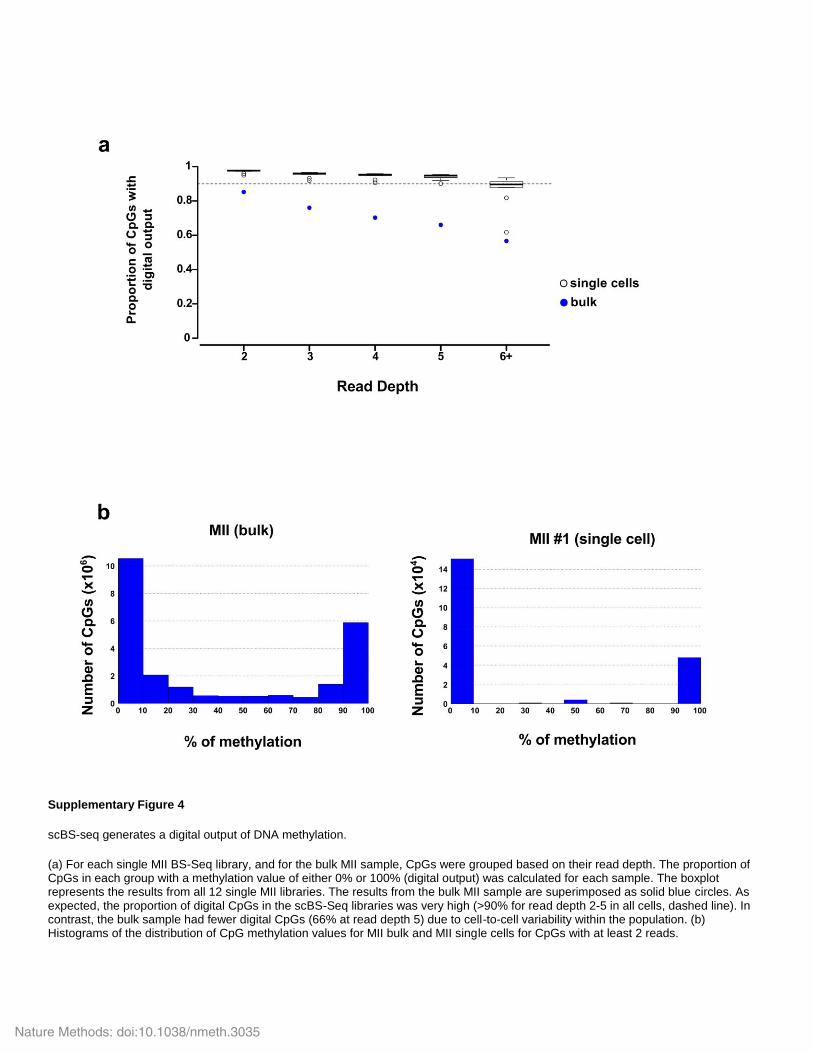
Supplementary Figure 10
Comparison of cluster analyses for ESCs.
Cluster dendrograms are shown for (a) genome-wide methylation estimates (equivalent to the dendrogram shown in Figure 2b) and (b) the top 300 most variable sites among single ESC samples (equivalent to the dendrogram shown in Figure 2c). The cell IDs are included for direct comparison between dendrograms. (c) The distance matrix for the 300 most variable sites is grossly similar to that for all sites (Figure 2b). Cells are presented in the order shown in (b).
Nature Methods: doi:10.1038/nmeth.3035
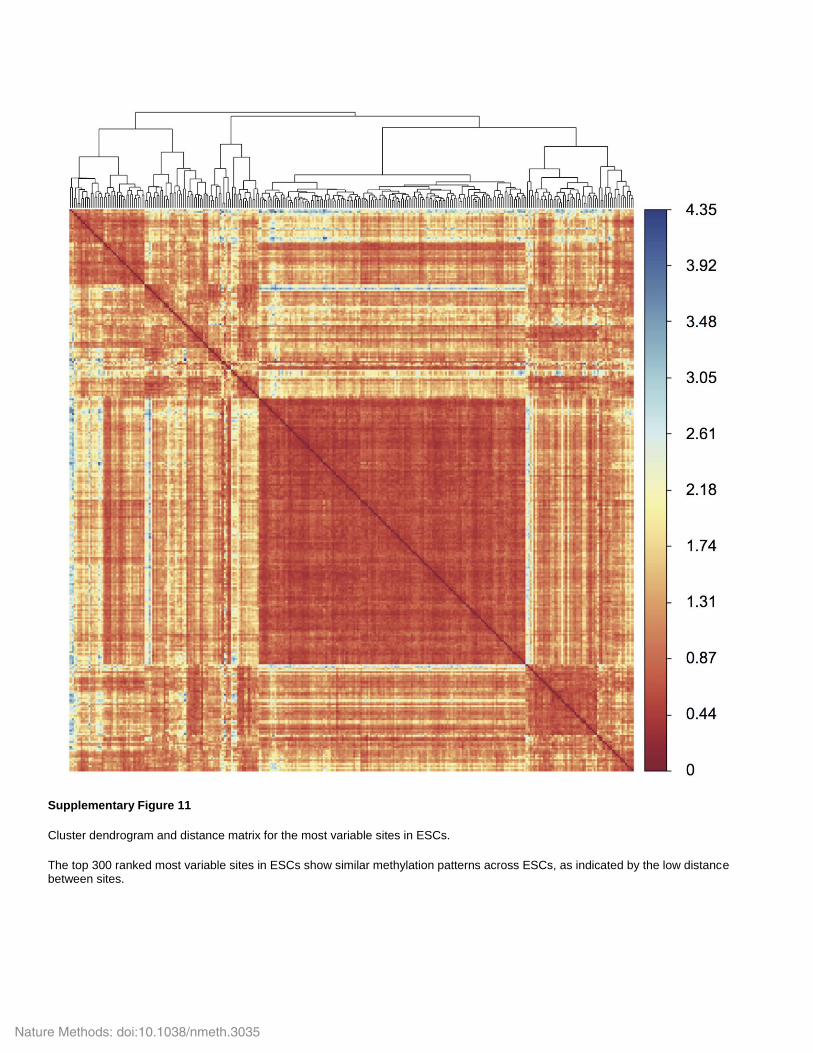
Supplementary Figure 11
Cluster dendrogram and distance matrix for the most variable sites in ESCs.
The top 300 ranked most variable sites in ESCs show similar methylation patterns across ESCs, as indicated by the low distance between sites.
Nature Methods: doi:10.1038/nmeth.3035
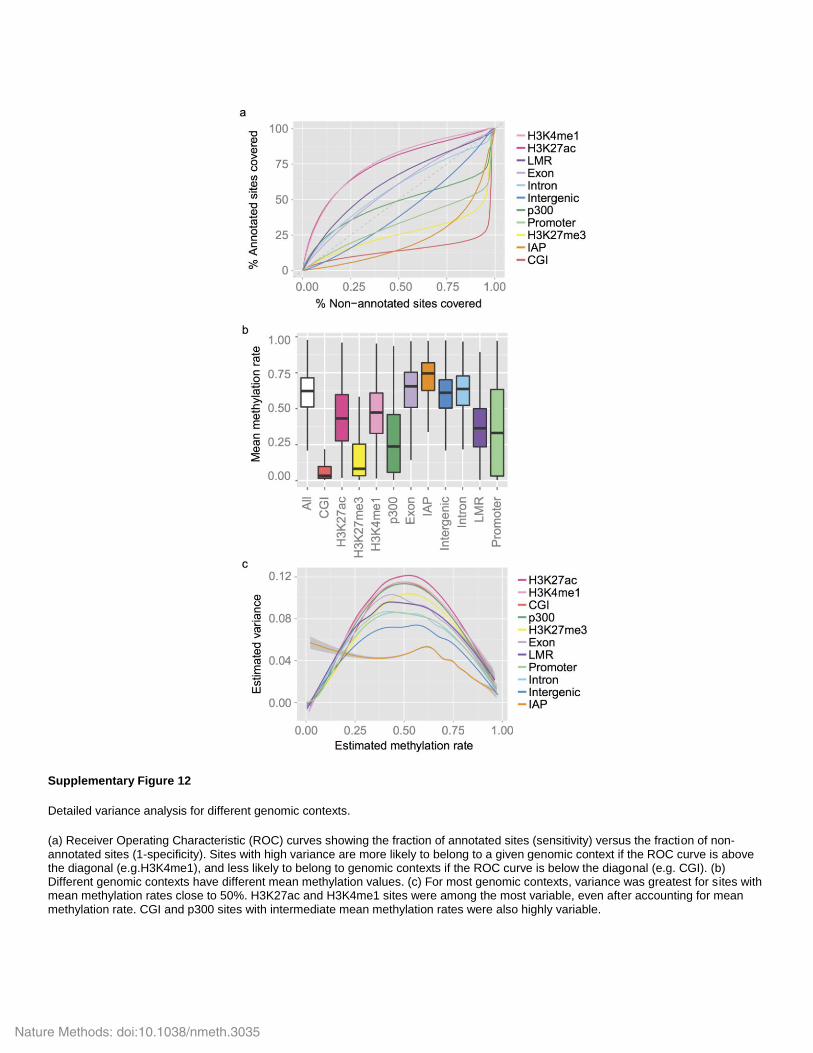
Supplementary Figure 12
Detailed variance analysis for different genomic contexts.
(a) Receiver Operating Characteristic (ROC) curves showing the fraction of annotated sites (sensitivity) versus the fraction of non-annotated sites (1-specificity). Sites with high variance are more likely to belong to a given genomic context if the ROC curve is above the diagonal (e.g.H3K4me1), and less likely to belong to genomic contexts if the ROC curve is below the diagonal (e.g. CGI). (b) Different genomic contexts have different mean methylation values. (c) For most genomic contexts, variance was greatest for sites with mean methylation rates close to 50%. H3K27ac and H3K4me1 sites were among the most variable, even after accounting for mean methylation rate. CGI and p300 sites with intermediate mean methylation rates were also highly variable.
Nature Methods: doi:10.1038/nmeth.3035
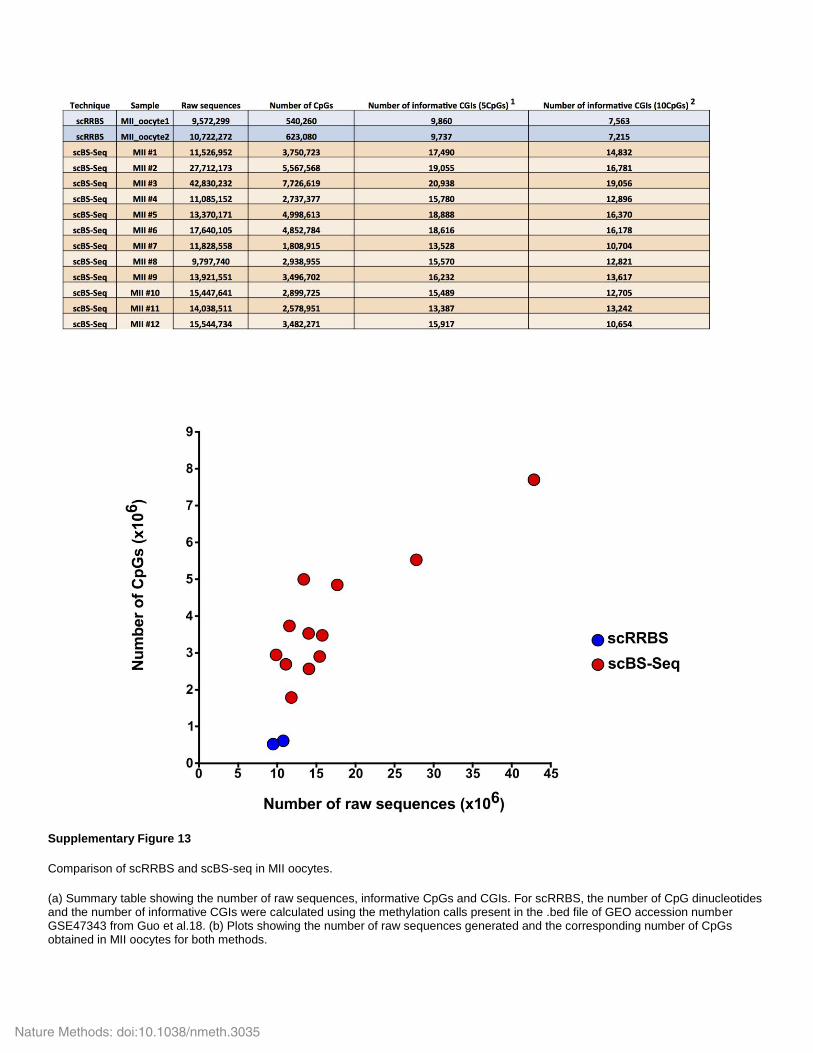
Supplementary Figure 13
Comparison of scRRBS and scBS-seq in MII oocytes.
(a) Summary table showing the number of raw sequences, informative CpGs and CGIs. For scRRBS, the number of CpG dinucleotides and the number of informative CGIs were calculated using the methylation calls present in the .bed file of GEO accession number GSE47343 from Guo et al.18. (b) Plots showing the number of raw sequences generated and the corresponding number of CpGs obtained in MII oocytes for both methods.
Nature Methods: doi:10.1038/nmeth.3035