Genome-wide analysis of mammalian promoter architecture and evolution
12
Genome-wide analysis of mammalian promoter architecture and evolution Piero Carninci 1,2,21 , Albin Sandelin 1,3,21 , Boris Lenhard 1,3,20,21 , Shintaro Katayama 1 , Kazuro Shimokawa 1 , Jasmina Ponjavic 1,20 , Colin A M Semple 1,4 , Martin S Taylor 1,5 , Pa ¨r G Engstro ¨m 3 , Martin C Frith 1,6 , Alistair R R Forrest 6 , Wynand B Alkema 3 , Sin Lam Tan 7 , Charles Plessy 2 , Rimantas Kodzius 1,2 , Timothy Ravasi 1,6,8 , Takeya Kasukawa 1,9 , Shiro Fukuda 1 , Mutsumi Kanamori-Katayama 1 , Yayoi Kitazume 1 , Hideya Kawaji 1,9 , Chikatoshi Kai 1 , Mari Nakamura 1 , Hideaki Konno 1 , Kenji Nakano 1,9 , Salim Mottagui-Tabar 3,20 , Peter Arner 10 , Alessandra Chesi 11 , Stefano Gustincich 11 , Francesca Persichetti 12 , Harukazu Suzuki 1 , Sean M Grimmond 6 , Christine A Wells 19 , Valerio Orlando 13 , Claes Wahlestedt 3,20 , Edison T Liu 14 , Matthias Harbers 15 , Jun Kawai 1,2 , Vladimir B Bajic 1,7,16 , David A Hume 1,6,21 & Yoshihide Hayashizaki 1,2,17,18 Mammalian promoters can be separated into two classes, conserved TATA box–enriched promoters, which initiate at a well- defined site, and more plastic, broad and evolvable CpG-rich promoters. We have sequenced tags corresponding to several hundred thousand transcription start sites (TSSs) in the mouse and human genomes, allowing precise analysis of the sequence architecture and evolution of distinct promoter classes. Different tissues and families of genes differentially use distinct types of promoters. Our tagging methods allow quantitative analysis of promoter usage in different tissues and show that differentially regulated alternative TSSs are a common feature in protein-coding genes and commonly generate alternative N termini. Among the TSSs, we identified new start sites associated with the majority of exons and with 3¢ UTRs. These data permit genome-scale identification of tissue-specific promoters and analysis of the cis-acting elements associated with them. With the completion of several mammalian genome sequences, the next challenge for mammalian genomics is to understand how transcription is controlled. Present algorithms aimed at TSS prediction have proven unsatisfactory 1 . Although many TSSs from mouse can be inferred from the 5¢ ends of full-length cDNAs and 5¢ ESTs 2,3 , the depth of coverage is limited. To increase the depth of coverage, we have carried out systematic 5¢-end analysis of the mouse and human transcriptome using the cap analysis of gene expression (CAGE) approach 4 . Here we redefine basic promoter features and analyze the diversity, evolutionary con- servation and dynamic regulation of mammalian promoters on a genome-wide scale. © 2007 Nature Publishing Group http://www.nature.com/naturegenetics Received 9 December 2005; accepted 27 March 2006; published online 28 April 2006; corrected online 5 May 2006; corrected after print 29 August 2007; doi:10.1038/ng1789 1 Genome Exploration Research Group, RIKEN Genomic Sciences Center (GSC), RIKEN Yokohama Institute, 1-7-22 Suehiro-cho, Tsurumi-ku, Yokohama, Kanagawa, 230-0045, Japan. 2 Genome Science Laboratory, Discovery Research Institute, RIKEN Wako Institute, 2-1 Hirosawa, Wako, Saitama, 351-0198, Japan. 3 Center for Genomics and Bioinformatics, Karolinska Institutet, Berzelius v. 35, S-171 77 Stockholm, Sweden. 4 UK Medical Research Council (MRC) Human Genetics Unit, Western General Hospital, Crewe Road, Edinburgh, EH4 2XU, UK. 5 University of Oxford, Roosevelt Drive, Oxford, OX3 7BN, UK. 6 Australian Research Council (ARC) Special Research Centre for Functional and Applied Genomics, Institute for Molecular Bioscience, The University of Queensland, Brisbane Qld, 4072, Australia. 7 Knowledge Extraction Laboratory, Institute for Infocomm Research, 21 Heng Mui Keng Terrace, 119613, Singapore. 8 Department of Bioengineering, University of California, San Diego, 9500 Gilman Drive, 0412 La Jolla, California 92093, USA. 9 Broadband Communication Service Business Unit, Network Service Solution Business Group, NTT Software Corporation, Teisan Kannai Bldg. 209, Yamashita-cho Naka-ku, Yokohama, Kanagawa, 231-8551, Japan. 10 Department of Medicine, Karolinska Institute, Huddinge University Hospital, S 141 86 Huddinge, Sweden. 11 The Giovanni Armenise–Harvard Foundation Laboratory, Sector of Neurobiology, International School for Advanced Studies-Scuola Internazionale Superiore Studi Avanzati (I.S.A.S.-S.I.S.S.A.), AREA Science Park, Padriciano 99, 34012 Trieste, Italy. 12 Sector of Neurobiology, I.S.A.S.-S.I.S.S.A., AREA Science Park, Padriciano 99, 34012 Trieste, Italy, 13 Dulbecco Telethon Institute, Institute of Genetics and Biophysics, Consiglio Nazionale delle Ricerche (IGB CNR), Epigenetics and Genome Reprogramming Laboratory, Pietro Castellino Street 111, Napoli, 80131, Italy. 14 Genome Institute of Singapore, 60 Biopolis Street #02-01, Singapore 138672, 15 Kabushiki Kaisha Dnaform, 1-3-35, Mita, Minato-ku, Tokyo, 108-0073, Japan. 16 South African National Bioinformatics Institute, University of the Western Cape, Private Bag X17, Bellville, South Africa. 17 Yokohama City University, 1-7-29 Suehiro-cho Tsurumi-ku Yokohama 230-0045 Japan. 18 Graduate School of Comprehensive Human Science, University of Tsukuba, 1-1-1 Tennodai, Tsukuba-shi Ibaraki-ken, 305-8577, Japan. 19 The Eskitis Institute for Cell and Molecular Therapies, Griffith University, Nathan Campus, Kessels Road, Queensland 4111, Australia. 20 Present addresses: Bergen Center for Computational Science, Unifob AS, University of Bergen, Thormøhlensgate 55, N-5008 Bergen, Norway (B.L.), Scripps Florida, Jupiter, Florida 33458, USA (C.W.), Department of Molecular Medicine, National Public Health Instititute, Department of Medical Genetics, University of Helsinki, Biomedicum, FIN-00251 Helsinki, Finland (S.M.-T.) and MRC Functional Genetics Unit, Department of Physiology, Anatomy and Genetics, University of Oxford, Oxford OX1 3QX, UK (J.P.). 21 These authors contributed equally to this work. Correspondence should be addressed to D.H. ([email protected]) or Y.H. ([email protected]). 626 VOLUME 38 [ NUMBER 6 [ JUNE 2006 NATURE GENETICS ARTICLES
Transcript of Genome-wide analysis of mammalian promoter architecture and evolution
Genome-wide analysis of mammalian promoterarchitecture and evolutionPiero Carninci1,2,21, Albin Sandelin1,3,21, Boris Lenhard1,3,20,21, Shintaro Katayama1, Kazuro Shimokawa1,Jasmina Ponjavic1,20, Colin A M Semple1,4, Martin S Taylor1,5, Par G Engstrom3, Martin C Frith1,6,Alistair R R Forrest6, Wynand B Alkema3, Sin Lam Tan7, Charles Plessy2, Rimantas Kodzius1,2,Timothy Ravasi1,6,8, Takeya Kasukawa1,9, Shiro Fukuda1, Mutsumi Kanamori-Katayama1,Yayoi Kitazume1, Hideya Kawaji1,9, Chikatoshi Kai1, Mari Nakamura1, Hideaki Konno1, Kenji Nakano1,9,Salim Mottagui-Tabar3,20, Peter Arner10, Alessandra Chesi11, Stefano Gustincich11, Francesca Persichetti12,Harukazu Suzuki1, Sean M Grimmond6, Christine A Wells19, Valerio Orlando13, Claes Wahlestedt3,20,Edison T Liu14, Matthias Harbers15, Jun Kawai1,2, Vladimir B Bajic1,7,16, David A Hume1,6,21 &Yoshihide Hayashizaki1,2,17,18
Mammalian promoters can be separated into two classes, conserved TATA box–enriched promoters, which initiate at a well-defined site, and more plastic, broad and evolvable CpG-rich promoters. We have sequenced tags corresponding to severalhundred thousand transcription start sites (TSSs) in the mouse and human genomes, allowing precise analysis of the sequencearchitecture and evolution of distinct promoter classes. Different tissues and families of genes differentially use distinct types ofpromoters. Our tagging methods allow quantitative analysis of promoter usage in different tissues and show that differentiallyregulated alternative TSSs are a common feature in protein-coding genes and commonly generate alternative N termini. Amongthe TSSs, we identified new start sites associated with the majority of exons and with 3¢ UTRs. These data permit genome-scaleidentification of tissue-specific promoters and analysis of the cis-acting elements associated with them.
With the completion of several mammalian genome sequences, thenext challenge for mammalian genomics is to understand howtranscription is controlled. Present algorithms aimed at TSS predictionhave proven unsatisfactory1. Although many TSSs from mouse can beinferred from the 5¢ ends of full-length cDNAs and 5¢ ESTs2,3, thedepth of coverage is limited.
To increase the depth of coverage, we have carried out systematic5¢-end analysis of the mouse and human transcriptome using the capanalysis of gene expression (CAGE) approach4. Here we redefinebasic promoter features and analyze the diversity, evolutionary con-servation and dynamic regulation of mammalian promoters on agenome-wide scale.
©20
07 N
atu
re P
ub
lish
ing
Gro
up
h
ttp
://w
ww
.nat
ure
.co
m/n
atu
reg
enet
ics
Received 9 December 2005; accepted 27 March 2006; published online 28 April 2006; corrected online 5 May 2006; corrected after print 29 August 2007;doi:10.1038/ng1789
1Genome Exploration Research Group, RIKEN Genomic Sciences Center (GSC), RIKEN Yokohama Institute, 1-7-22 Suehiro-cho, Tsurumi-ku, Yokohama, Kanagawa,230-0045, Japan. 2Genome Science Laboratory, Discovery Research Institute, RIKEN Wako Institute, 2-1 Hirosawa, Wako, Saitama, 351-0198, Japan. 3Center forGenomics and Bioinformatics, Karolinska Institutet, Berzelius v. 35, S-171 77 Stockholm, Sweden. 4UK Medical Research Council (MRC) Human Genetics Unit,Western General Hospital, Crewe Road, Edinburgh, EH4 2XU, UK. 5University of Oxford, Roosevelt Drive, Oxford, OX3 7BN, UK. 6Australian Research Council (ARC)Special Research Centre for Functional and Applied Genomics, Institute for Molecular Bioscience, The University of Queensland, Brisbane Qld, 4072, Australia.7Knowledge Extraction Laboratory, Institute for Infocomm Research, 21 Heng Mui Keng Terrace, 119613, Singapore. 8Department of Bioengineering, University ofCalifornia, San Diego, 9500 Gilman Drive, 0412 La Jolla, California 92093, USA. 9Broadband Communication Service Business Unit, Network Service SolutionBusiness Group, NTT Software Corporation, Teisan Kannai Bldg. 209, Yamashita-cho Naka-ku, Yokohama, Kanagawa, 231-8551, Japan. 10Department of Medicine,Karolinska Institute, Huddinge University Hospital, S 141 86 Huddinge, Sweden. 11The Giovanni Armenise–Harvard Foundation Laboratory, Sector of Neurobiology,International School for Advanced Studies-Scuola Internazionale Superiore Studi Avanzati (I.S.A.S.-S.I.S.S.A.), AREA Science Park, Padriciano 99, 34012 Trieste,Italy. 12Sector of Neurobiology, I.S.A.S.-S.I.S.S.A., AREA Science Park, Padriciano 99, 34012 Trieste, Italy, 13Dulbecco Telethon Institute, Institute of Genetics andBiophysics, Consiglio Nazionale delle Ricerche (IGB CNR), Epigenetics and Genome Reprogramming Laboratory, Pietro Castellino Street 111, Napoli, 80131, Italy.14Genome Institute of Singapore, 60 Biopolis Street #02-01, Singapore 138672, 15Kabushiki Kaisha Dnaform, 1-3-35, Mita, Minato-ku, Tokyo, 108-0073, Japan.16South African National Bioinformatics Institute, University of the Western Cape, Private Bag X17, Bellville, South Africa. 17Yokohama City University, 1-7-29Suehiro-cho Tsurumi-ku Yokohama 230-0045 Japan. 18Graduate School of Comprehensive Human Science, University of Tsukuba, 1-1-1 Tennodai, Tsukuba-shiIbaraki-ken, 305-8577, Japan.19The Eskitis Institute for Cell and Molecular Therapies, Griffith University, Nathan Campus, Kessels Road, Queensland 4111, Australia.20Present addresses: Bergen Center for Computational Science, Unifob AS, University of Bergen, Thormøhlensgate 55, N-5008 Bergen, Norway (B.L.), Scripps Florida,Jupiter, Florida 33458, USA (C.W.), Department of Molecular Medicine, National Public Health Instititute, Department of Medical Genetics, University of Helsinki,Biomedicum, FIN-00251 Helsinki, Finland (S.M.-T.) and MRC Functional Genetics Unit, Department of Physiology, Anatomy and Genetics, University of Oxford,Oxford OX1 3QX, UK (J.P.). 21These authors contributed equally to this work. Correspondence should be addressed to D.H. ([email protected]) orY.H. ([email protected]).
6 26 VOLUME 38 [ NUMBER 6 [ JUNE 2006 NATURE GENETICS
ART I C LES
RESULTSDefining TSSs by CAGE tagsCAGE tags are 20- or 21-nt sequence tags that are derived from themRNA sequenced in the proximity of the cap site, and their mappingonto unique genomic regions identifies TSSs4,5. CAGE libraries areconstructed from full-length cDNAs selected through a biotinylatedcap. Second-strand synthesis is absolutely dependent upon theligation, to the first-strand full-length cDNAs, of a primer thatcontains restriction sites allowing the cleavage of 5¢ 20- to 21-bptags from the resulting cDNA. These short fragments are concatemer-ized and sequenced. We applied CAGE sequencing to 145 differentmouse and 41 different human libraries. We mapped tags to themouse and human genomes using a hierarchical data structure(Fig. 1a). CAGE tags that had an identical 5¢ start site were groupedinto a CAGE-tag starting site (CTSS), whereas CTSSs that overlap onthe same strand form a tag cluster.
Mapping cDNAs, ESTs and CAGE, GIS and GSC tags to mouse andhuman genomes allowed us to identify 729,504 potential mouse and
665,278 human TSSs (Table 1, and Supplementary Fig. 1 andSupplementary Table 1 online). Of these, 593,290 in themouse genome and 629,716 in the human genome were defined byCAGE tag clusters.
The majority of tag clusters identified by two or more tags (159,075mouse and 177,563 human) were derived from independent libraries(Supplementary Note online). Therefore, we selected these tagclusters for detailed expression and promoter analysis. We aimed toidentify the major promoters of the widest possible diversity of genesby sampling at relatively low depth many tissues and conditions.Most single CAGE tags (singletons) reflect the fact that in mostlibraries the number of tags sequenced (B100,000) is lower thanthe total number of transcripts per cell6. Therefore, rare transcriptswere sampled randomly.
We provide several lines of evidence demonstrating thatCAGE identifies genuine transcription start sites, including (i) statis-tical analysis of reproducibility within and across species, (ii) experi-mental validation by distinct primer extension approaches, (iii)
©20
07 N
atu
re P
ub
lish
ing
Gro
up
h
ttp
://w
ww
.nat
ure
.co
m/n
atu
reg
enet
ics
CTSS
CTSS
CTSS
CTSS
Num
ber
of ta
gs
Tag cluster (TC)
0.30
0.20
0.10
0.00
0.30
0.20
0.10
0.00
Tags
from
tiss
ue
bp in
inne
r ex
ons
0.30
0.20
0.10
0.00
0Liver tags/bp inmajor promoter
Lung tags/bp inmajor promoter
Macrophage tags/bpin major promoter
10 20 30 40 50 0 10 20 30 40 50 0 10 20 30 40 50
0.01
0–25
25–5
0
Liver tags inmajor promoter (%)
Lung tags inmajor promoter (%)
Macrophage tagsin major promoter (%)
50–7
5
75–1
00
0–25
25–5
0
50–7
5
75–1
00
0–25
25–5
0
50–7
5
75–1
00
0.03
0.05
0.07
0.030
0.020
0.010
0.025
0.015
0.005
tags
from
tiss
ue
bp in
inne
r ex
ons
Mea
na b
500
300
100
0 10 20 30 40 50
Tag cluster width
Num
ber
of ta
g cl
uste
rs
Total number of tag clusters
Number of TATA-associated tag clusters
Number of CpG-associated tag clusters
c
d
20 60 1008040 20 60 1008040 20 60 1008040 20 60 1008040
80%
60%
40%
20%
80%
60%
40%
20%
80%
60%
40%
20%
80%
60%
40%
20%
Nucleotide position
Single dominant peak (SP)
Broad (BR)
Broad with dominant peak (PB)
Bi- or multimodal(MU)
Postn (T03F033EDB08)
ORF61(T10R04C2E25C) Ogdh (T11F005E65B7) Adsl (T15F04D83907) Peo1 (T19F02A4A00F)
Ppap2b (T04F062B54A0) Cd164 (T10F0277FE1C) Zfp385 (T15R06303CFB) 137774 (T18R05237FC0)
Trappc3 (T04F076DBE82) Pik3r5 (T11F040E47AA) Txndc7 (T12F0109631B) Mrpl2 (T17F02ABA5E8)
Myh3 (T11F03F99F20) Fth1 (T19F008A9C64) 130092 (T19R02C738F6)e
Fra
ctio
n of
tag
coun
ts in
tag
clus
ter
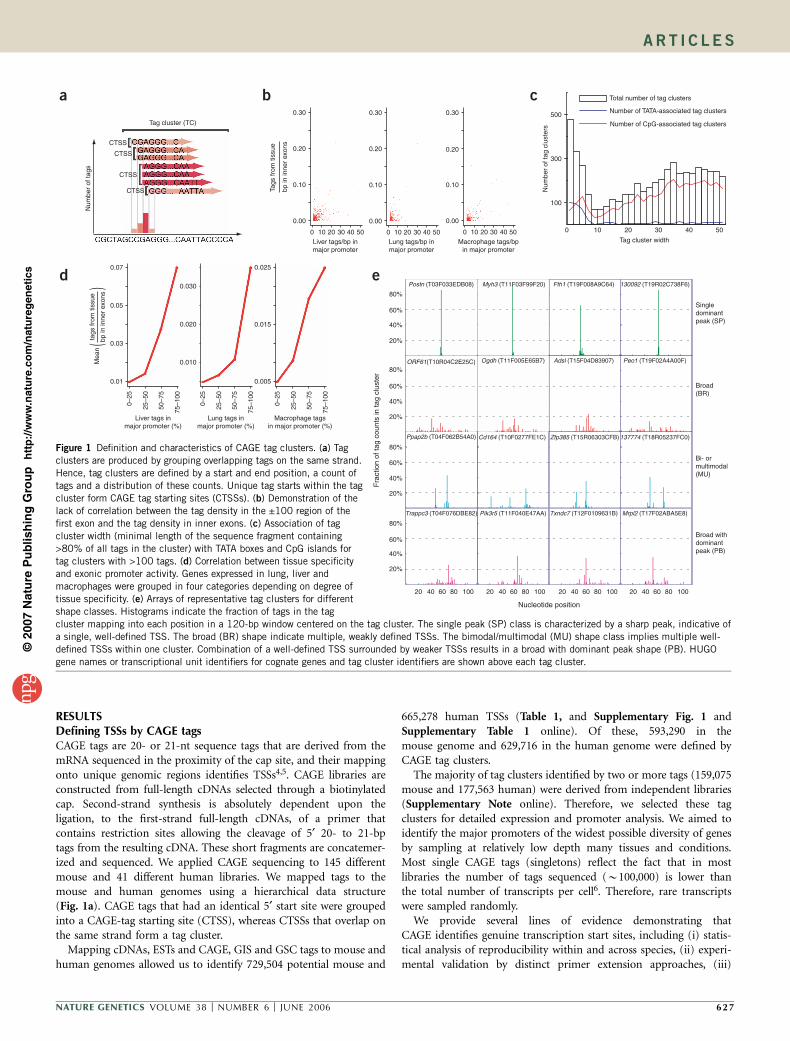
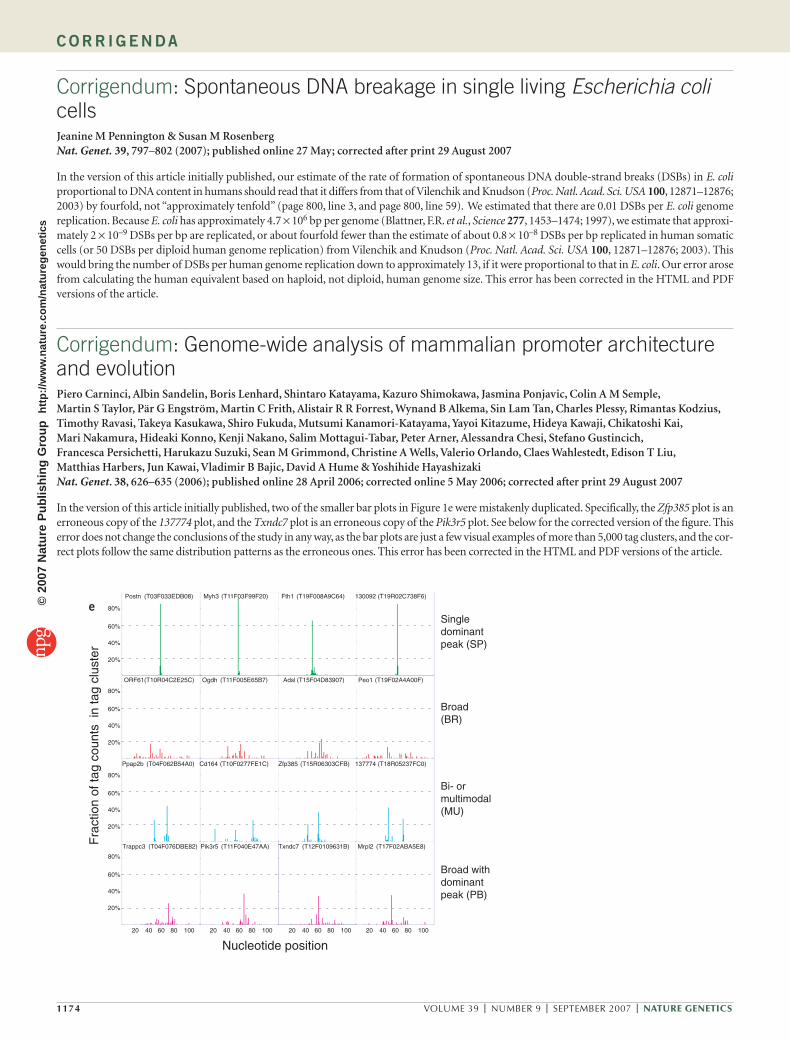
Figure 1 Definition and characteristics of CAGE tag clusters. (a) Tag
clusters are produced by grouping overlapping tags on the same strand.
Hence, tag clusters are defined by a start and end position, a count of
tags and a distribution of these counts. Unique tag starts within the tag
cluster form CAGE tag starting sites (CTSSs). (b) Demonstration of the
lack of correlation between the tag density in the ±100 region of the
first exon and the tag density in inner exons. (c) Association of tag
cluster width (minimal length of the sequence fragment containing
>80% of all tags in the cluster) with TATA boxes and CpG islands for
tag clusters with >100 tags. (d) Correlation between tissue specificityand exonic promoter activity. Genes expressed in lung, liver and
macrophages were grouped in four categories depending on degree of
tissue specificity. (e) Arrays of representative tag clusters for different
shape classes. Histograms indicate the fraction of tags in the tag
cluster mapping into each position in a 120-bp window centered on the tag cluster. The single peak (SP) class is characterized by a sharp peak, indicative of
a single, well-defined TSS. The broad (BR) shape indicate multiple, weakly defined TSSs. The bimodal/multimodal (MU) shape class implies multiple well-
defined TSSs within one cluster. Combination of a well-defined TSS surrounded by weaker TSSs results in a broad with dominant peak shape (PB). HUGO
gene names or transcriptional unit identifiers for cognate genes and tag cluster identifiers are shown above each tag cluster.
NATURE GENETICS VOLUME 38 [ NUMBER 6 [ JUNE 2006 62 7
ART I C LES
historical comparison to TSSs analyzed by other methodologies,(iv) sequence bias around CAGE tags, (v) correlation withpublished sites of TATA-binding protein–associated binding protein1 identified by chromatin immunoprecipitation (ChIP), (vi) conser-vation of start site architecture between orthologous mouseand human genes and (vii) enrichment over noncapped RNAs(Supplementary Note).
CAGE tags identify transcription from unconventional sitesNot all CAGE tags mapped to previously identified 5¢ ends of full-length cDNAs (Supplementary Fig. 1). Typically, we observed peaksover the known 5¢ end of the transcript and a second (generallysmaller) peak within 3¢ UTRs7. The CAGE tags that mapped togenomic regions between these two peaks mapped mostly toexons. For relatively highly expressed genes, the ‘internal’ CAGE tagfrequency was supported by a considerable number of 5¢ ESTsequences2 and has been confirmed using RACE based on the alter-native oligonucleotide-capping method8. If we consider the overall setof 159,075 TSSs identified by CAGE, 34,229 TSSs mapping withinexons would generate transcripts that truncate or eliminate thepredicted protein product.
Exonic promoter activity varies between genes and is conservedacross species. For example, the gene encoding albumin (Alb1 in miceand ALB in humans) has high level exonic initiation in both mouse
and human, whereas Col3a1 and COL3A1 have negligible levels inmouse and human, respectively (Supplementary Fig. 2 online).Exonic promoter activity does not correlate with the number of tagsover the major promoter(s) (Fig. 1b), but it is highest in tissue-specific genes (Fig. 1d) and correlates with a single dominantsite of transcription initiation (Supplementary Fig. 2 andSupplementary Note).
Promoter coverageWe found that 13,767 of the 20,639 mouse protein-codingtranscriptional units (67%) were supported by one or more tagclusters at ±20 nt from the reported 5¢ end of a full-lengthcDNA (Table 1). If tags aligned to the 5¢ UTR and the rest of thetranscript are included, 73% and 81%, respectively, of all protein-coding loci are supported. Many of the remaining protein-codingloci actually have a candidate TSS supported by individual tags.The extended distribution of TSS within CpG islands means thatfor weakly expressed transcripts there were multiple tags in theputative promoter region, but they did not overlap to form a largertag cluster. Given the reliability of the CAGE technology (Supple-mentary Note), single tags can be regarded as candidate TSSs. Theannotation of CAGE tags is based on the annotation of the closestgene on the same strand, which can be confirmed in specific cases byadditional experiments.
©20
07 N
atu
re P
ub
lish
ing
Gro
up
h
ttp
://w
ww
.nat
ure
.co
m/n
atu
reg
enet
ics
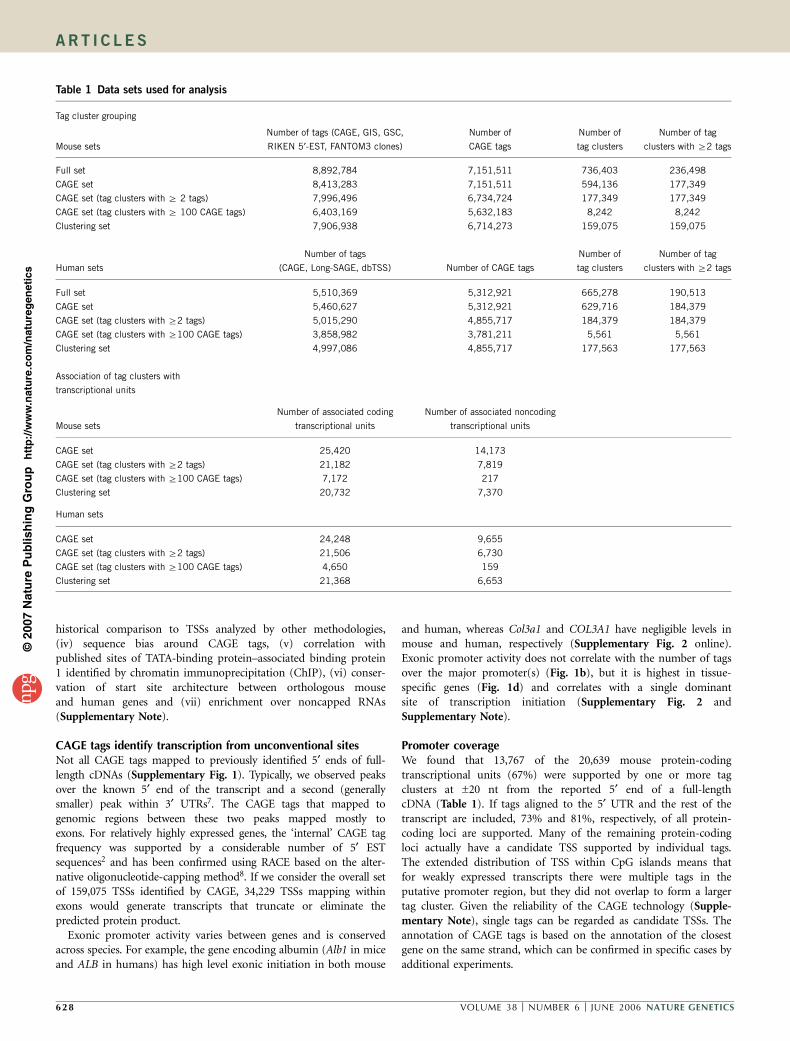
Table 1 Data sets used for analysis
Tag cluster grouping
Mouse sets
Number of tags (CAGE, GIS, GSC,
RIKEN 5¢-EST, FANTOM3 clones)
Number of
CAGE tags
Number of
tag clusters
Number of tag
clusters with Z2 tags
Full set 8,892,784 7,151,511 736,403 236,498
CAGE set 8,413,283 7,151,511 594,136 177,349
CAGE set (tag clusters with Z 2 tags) 7,996,496 6,734,724 177,349 177,349
CAGE set (tag clusters with Z 100 CAGE tags) 6,403,169 5,632,183 8,242 8,242
Clustering set 7,906,938 6,714,273 159,075 159,075
Human sets
Number of tags
(CAGE, Long-SAGE, dbTSS) Number of CAGE tags
Number of
tag clusters
Number of tag
clusters with Z2 tags
Full set 5,510,369 5,312,921 665,278 190,513
CAGE set 5,460,627 5,312,921 629,716 184,379
CAGE set (tag clusters with Z2 tags) 5,015,290 4,855,717 184,379 184,379
CAGE set (tag clusters with Z100 CAGE tags) 3,858,982 3,781,211 5,561 5,561
Clustering set 4,997,086 4,855,717 177,563 177,563
Association of tag clusters with
transcriptional units
Mouse sets
Number of associated coding
transcriptional units
Number of associated noncoding
transcriptional units
CAGE set 25,420 14,173
CAGE set (tag clusters with Z2 tags) 21,182 7,819
CAGE set (tag clusters with Z100 CAGE tags) 7,172 217
Clustering set 20,732 7,370
Human sets
CAGE set 24,248 9,655
CAGE set (tag clusters with Z2 tags) 21,506 6,730
CAGE set (tag clusters with Z100 CAGE tags) 4,650 159
Clustering set 21,368 6,653
6 28 VOLUME 38 [ NUMBER 6 [ JUNE 2006 NATURE GENETICS
ART I C LES

CAGE tag distribution shape defines distinct promoter groupsTo analyze and classify TSS distributions, we chose 8,185 mouse and5,928 human tag clusters supported by at least 100 CAGE tags. Theseclusters had biphasic distribution in terms of the genomic intervalcovered by the cluster of tag sequences (Fig. 1c).
We classified the landscapes defined by tags within a single clusterinto four shapes. In the single dominant peak class (SP), the majorityof tags are concentrated to no more than four consecutive startpositions (Fig. 1e, top row) with a single dominant TSS. We dividedthe clusters spanning a broader region into three categories (Fig. 1e): ageneral broad distribution (BR), a broad distribution with a dominantpeak (PB) and a bi- or multimodal distribution (MU). This classifica-tion is essential for further characterization of structural and func-tional difference of SP versus BR distributions; we devised theadditional PB and MU classes to sequester ambiguous cases. Therewas a high degree of conservation of shape classes between ortholo-gous mouse and human promoters, even at a single-nucleotide level(Supplementary Figs. 3 and 4 online).
Shape classes identify different promoter contextsWe identified putative TATA-box, CCAAT-box and GC-box sites usingposition-specific weight matrices9 and extracted positions of CpGislands from the UCSC Genome Browser database10. For each shapeclass, we compared the under- and overrepresentation of the fourpromoter features to the whole set of promoters (Table 2). TATA boxeswere strongly overrepresented in promoters showing sharp TSSs,whereas broad TSS regions were strongly associated with CpG islands.In roughly 90% of the cases, TATA-independent transcription initiation
occurred within a CpG island. This percentage of TATA-independenttranscription initiation is much greater than previous estimates11.
To distinguish between CpG-island and other types of transcription,we separated pure CpG island–overlapping promoters (without TATA,CCAAT and GC elements) and TATA, CCAAT and GC promoters,which are not in CpG islands (Table 2), and checked for the frequencyof occurrence of the four TSS shape categories. CCAAT-box andGC-box sequences that were not associated with CpG islands werepreferentially associated with SP-type TSSs.
Re-estimation of spacing of core TATA-promoter elementsThe main function of TATA boxes is to anchor the transcriptionpreinitiation complex guiding RNA polymerases12 upstream ofTSSs. Of the 1,315 putative TATA boxes situated within 50 bp of atightly defined TSS, 470% start between positions –33 and –28, withpositions –31 and –30 as the preferred sites (Fig. 2a). This spacing isconsistent with the structural evidence showing that the distance fromthe TATA box to the active center of RNA polymerase II is 30 bp13.
The consensus mammalian initiator sequenceTranscription preferentially starts with a purine at position +1, with apreference for pyrimidine at position –1 (58.6% of tags have apyrimidine-purine dinucleotide at position –1,+1). This pyrimidine-purine dinucleotide corresponds in part to the Inr element14 or Capmotif9 (pyrimidine, pyrimidine, A(+1), N, T/A, pyrimidine, pyrimi-dine, where N is any nucleotide), which was determined by mutagen-esis studies of specific promoters13. The sequence logos in Figure 2b–eshow that adenine is not actually the preferred starting base, and only
©20
07 N
atu
re P
ub
lish
ing
Gro
up
h
ttp
://w
ww
.nat
ure
.co
m/n
atu
reg
enet
ics
Table 2 Overrepresentation and underrepresentation of transcriptional starting site sequence
Overall analysis SP BR PB MU
TATA (all) 3.1 � 10–73 1.9 � 10–16 1.8 � 10–10 2.4 � 10–9
CCAAT (all) 0.04 0.42 0.37 0.49
GC (all) 1 � 10–4 0.20 0.40 0.33
CpG (all) 1.0 � 10–137 1.4 � 10–65 8.7 � 10–6 0.02
CpG promoters versus non-CpG promoters SP BR PB MU
TATA (no CpG) 2.6 � 10–77 1.6 � 10–16 2.8 � 10–16 1.0 � 10–9
CCAAT (no CpG) 6.8 � 10–23 9.2 � 10–16 0.11 0.42
GC (no CpG) 7.8 � 10–25 5.9 � 10–18 0.48 0.35
CpG (no TATA, CCAAT or GC) 4.8 � 10–45 4.7 � 10–17 3.4 � 10–5 0.87
For each shape class, we determined whether a TATA box (within 50 bp) or a CCAAT, GC or CpG (within 200 bp) upstream of the start site of the clusters was present. P values were determinedusing the Fisher exact test (Supplementary Note). P values in boldface and italics indicate significant underrepresentation (P o 0.01); P values in boldface alone indicate significantoverrepresentation (P o 0.01). In the lower part of the table, we separated pure CpG-island–overlapping promoters (without TATA, CCAAT and GC elements) and TATA, CCAAT and GC promoters(without CpG islands).
SP class promoters
BR class promoters
PB class promoters
MU class promoters
–50 –40 –30 –20
a
–50 –40 –30 –20 –10 10 20 30
b
d
e
c
Bits
1
1
1
1
+1
–50 –40 –30 –20 –10 10 20 30+1
–50 –40 –30 –20 –10 10 20 30+1
–50 –40 –30 –20 –10 10 20 30+1
Bits
Bits
Bits
Distance from start site (+1)
0
50
100
150
200
250
Num
ber
of s
ites
Position relative to TSS
Figure 2 TATA-box and TSS spacing definition and consensus. (a) Accurate
distribution of the spacing between TATA-box promoter and initiation sites.
(b–e) Sequence logos15 for promoter sequences aligned at the TSSs
constructed by counting each tag and its flanking region as one sequence,
divided by promoter shape class. The y axis shows the information content
(measured in bits), reviewed in ref. 15. In all cases, there is a clear
preference for a pyrimidine-purine initiation site at –1,+1. A TATA-like motif
is visible around the –30 position in the SP class promoters (b). In the BRclass promoters, as most of those promoters are overlapped by CpG islands,
the entire region is GC-rich; there is anisotropy of nucleotide content: there
are more guanine than cytosine nucleotides in the plus strand upstream of
the TSS (c). The logos of PB (d) and MU (e) class promoters look similar to
this, indicating that these two ambiguous two categories are more likely to
share the common initiation mechanism with BR promoters than with the
SP ones. The PB class has a certain proportion of mixed cases, with both
a CpG island and a TATA-box.
NATURE GENETICS VOLUME 38 [ NUMBER 6 [ JUNE 2006 62 9
ART I C LES

the central pyrimidine-purine shows any bias when assessed over thefull diversity of TSSs in the mouse transcriptome. The most preferredinitiators are CG, CA and TG. The comparative prevalence of CA, CGand TG increases with tag frequency class (Supplementary Fig. 4).Therefore, the initiator sequence is not an absolute determinant oftranscription initiation, and the presence of CG, TG or CA dinucleo-tides is associated with more active TSSs.
Sequence of TSSs for different shape classes of promotersWe constructed sequence logos15 for promoter sequences aligned at theTSSs (Fig. 2b–e) by counting each tag and its flanking region as onesequence . As expected, there is a prominent initiator sequence atposition –1,+1 and a TATA-box signature around the –30 position forthe single dominant start class. We observed an equivalent sequencelogo for broad-type promoters (Fig. 2c). Although there are multipleTSSs, there is still a preference for specific initiation sites, correspond-ing to pyrimidine-purine dinucleotides at position –1,+1. Additionally,there is evidence of GC anisotropy (more guanines on the plus strand)both upstream and downstream of the major TSSs (Fig. 2c). CpG-island promoters do show a preferential directionality in promoterassays12; the apparent prevalence of guanines on the plus strand could
contribute to promoter orientation, althoughno clear mechanism is evident. The transcrip-tion factor Sp1 has been found to recruitTATA-binding protein in the absence ofTATA boxes16. Consistent with this and theoverall high CG content, consensus Sp1 siteswere overrepresented in broad promoters,although the position relative to individualTSS was less precise than for TATA boxes(Supplementary Fig. 5 online).
Although the logos of two ‘hybrid’ promo-ter categories (Fig. 2d,e) look similar to thoseof the BR category, both contain a higherproportion of TATA boxes; a substantial num-ber of MU and PB promoter regions representTATA boxes within CpG islands. The classprobably represents independent functionalcore promoters that lie fewer than 20 bpapart and have been joined into a single tagcluster. In PB promoters, the TSS indicated bythe peak has on average a significantly highertissue specificity than the rest of the combinedtags in the cluster (Po 2.2 � 10–16, Wilcoxontest). Moreover, the tissue specificity of thepeak was significantly increased when clearTATA boxes were found (P o 3.823 � 10–7,Wilcoxon test; Supplementary Note).
Start site preference and bidirectionalpromoters in CpG islandsThe CAGE data is derived by polling TSS usefrom a wide variety of tissues. The broaddistribution of TSSs is a well-documentedfeature of CpG island promoters assayed insingle cell types13. In some cases, the depth ofcoverage is sufficient to determine whetherthe broad distribution of TSSs in CpG islandsderived from CAGE data represents overlap-ping distributions of TSSs used differentiallyby distinct tissues. Statistically significant
tissue-specific TSS preference occurs for 34% of 5,607 CpG islandpromoters (Po 0.01, Kruskal-Willis test) for which we currently havesufficient tags to make assessments (H. Kawaji et al., data not shown).CpG island promoter regions are also commonly associated withbidirectional promoter activity17. In these cases, the key issue iswhether the promoters are truly bidirectional. CAGE data stronglysupport multiple TSSs in the bidirectional promoter region separatingthe adenosine kinase and AP3m1 genes. There are two separate tagclusters in each direction within the one CpG island, and there is noabsolute overlap between any of the TSS regions (data not shown). Acontrary example is the bidirectional Gabpa-Atp5j promoter region18
in mouse. This bidirectional promoter region contains two promotersin each direction (Fig. 3), strongly supported by cDNAs and by geneidentification signature (GIS) and gene signature cloning (GSC) data.In such cases, there is potential for transcriptional interference asdescribed in yeast and bacteria19. Such instances extend the numerousexamples of sense-antisense interactions within the transcriptome20.
Promoter evolution in mammalian genomesPhylogenetic footprinting21 has been used to identify conservedtranscription factor binding sites (TFBSs) within the vicinity of
©20
07 N
atu
re P
ub
lish
ing
Gro
up
h
ttp
://w
ww
.nat
ure
.co
m/n
atu
reg
enet
ics
100
50
0
Num
ber
of C
AG
E ta
gs a
tm
inus
str
and
Num
ber
of C
AG
E ta
gs a
tpl
us s
tran
d
RIKEN and GenBank cDNAs
Collapsed GSC ditag start sites
Collapsed GIS ditag start sites
Atp5j
Chromosome16
Gabpa
Gabpa
Gabpa
Atp5j
Atp5j
50
100
85217.4k 85217.5k 85217.6k 85217.7k 85217.8k 85217.9k 85218.0k 85218.1k 85218.2k 85218.3k
Figure 3 Bidirectional overlapping promoters of Gabpa and Atp5j. The Gabpa (on the plus strand) and
Atp5j (on the minus strand) bidirectional gene pair contains two promoters in each direction, strongly
supported by overlapping start sites of full-length cDNA clones and by GIS and GSC data. The distri-
bution of CAGE tags mapping to the region is indicated in the top panel. Red and green denote plus
and minus strand direction for all data types. GIS and GSC data has been collapsed into single tracks.
6 30 VOLUME 38 [ NUMBER 6 [ JUNE 2006 NATURE GENETICS
ART I C LES
mammalian genes22. We evaluated evolutionary divergence in mam-malian promoters using a set of 30,898 mouse and 26,290 humanpromoter sequences validated by at least ten tags per TSS. For allcategories of TSSs, the percentage identity declined considerablywithin 200 nt upstream of the TSS (Supplementary Fig. 3). Thereis a pronounced pattern of troughs and peaks in conservation withinthe 70 nt flanking the TSS where the most conserved peak correspondsto the TATA box.
We analyzed substitution rates within the four distinct promotershape classes, based on the mouse promoter sequences versus rat,human and dog genomes and based on human promoters versuschimpanzee, dog, mouse and rat, over a 1,000-bp window upstream ofthe TSSs (Supplementary Table 2 online). In all comparisons, theTATA-containing promoters had a lower substitution rate than theother three promoter types (the ‘upstream’ regions in all of thesecomparisons, except for the human-chimpanzee comparison, which isuninformative owing to the short evolutionary distance). These datasupport the view that human BR promoters have higher substitutionrates (relative to the mutation rate) than mouse promoter regions23.
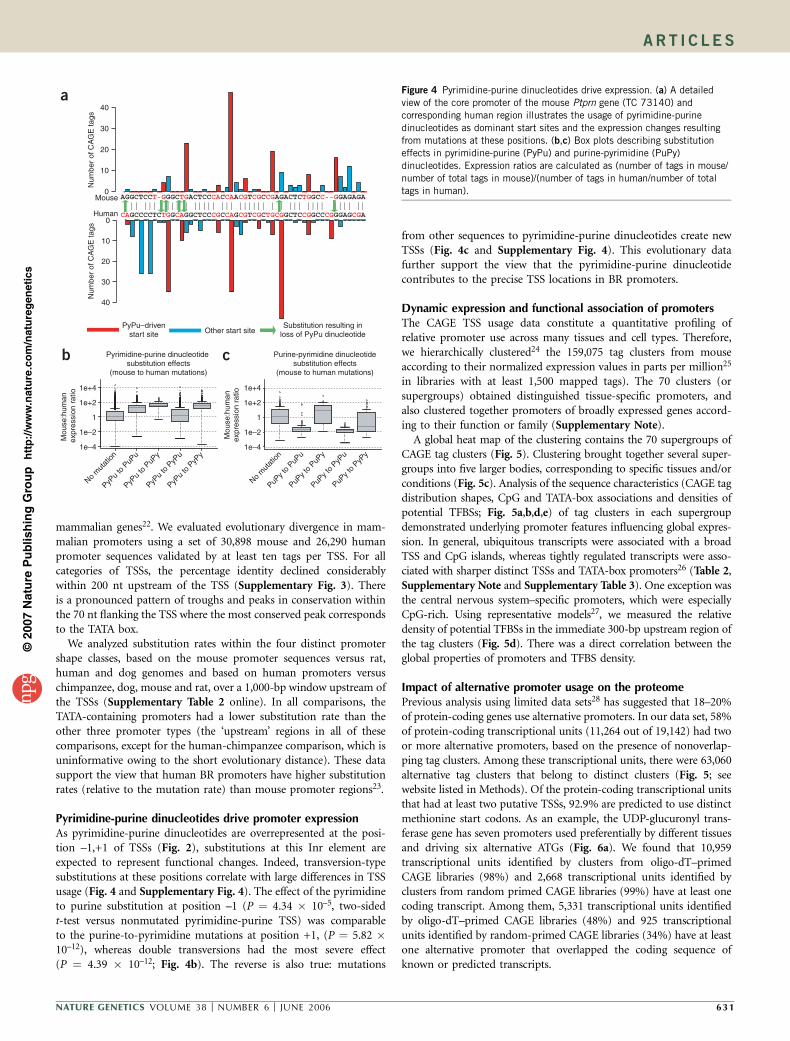
Pyrimidine-purine dinucleotides drive promoter expressionAs pyrimidine-purine dinucleotides are overrepresented at the posi-tion –1,+1 of TSSs (Fig. 2), substitutions at this Inr element areexpected to represent functional changes. Indeed, transversion-typesubstitutions at these positions correlate with large differences in TSSusage (Fig. 4 and Supplementary Fig. 4). The effect of the pyrimidineto purine substitution at position –1 (P ¼ 4.34 � 10–5, two-sidedt-test versus nonmutated pyrimidine-purine TSS) was comparableto the purine-to-pyrimidine mutations at position +1, (P ¼ 5.82 �10–12), whereas double transversions had the most severe effect(P ¼ 4.39 � 10–12; Fig. 4b). The reverse is also true: mutations
from other sequences to pyrimidine-purine dinucleotides create newTSSs (Fig. 4c and Supplementary Fig. 4). This evolutionary datafurther support the view that the pyrimidine-purine dinucleotidecontributes to the precise TSS locations in BR promoters.
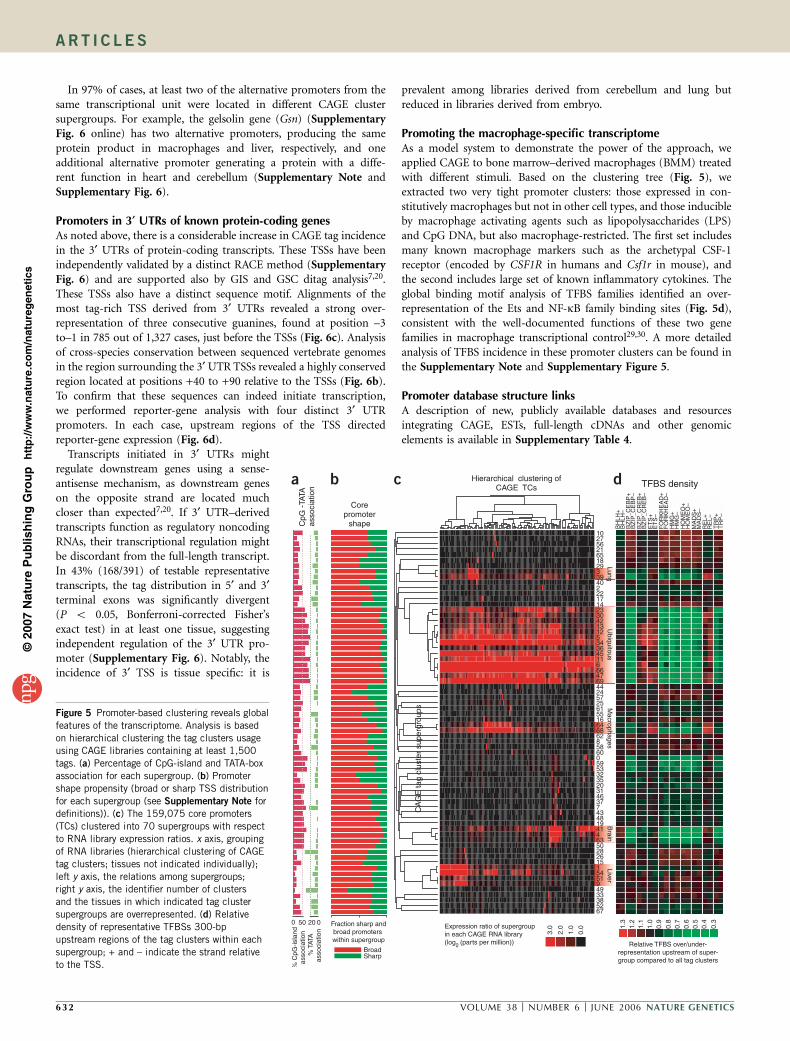
Dynamic expression and functional association of promotersThe CAGE TSS usage data constitute a quantitative profiling ofrelative promoter use across many tissues and cell types. Therefore,we hierarchically clustered24 the 159,075 tag clusters from mouseaccording to their normalized expression values in parts per million25
in libraries with at least 1,500 mapped tags). The 70 clusters (orsupergroups) obtained distinguished tissue-specific promoters, andalso clustered together promoters of broadly expressed genes accord-ing to their function or family (Supplementary Note).
A global heat map of the clustering contains the 70 supergroups ofCAGE tag clusters (Fig. 5). Clustering brought together several super-groups into five larger bodies, corresponding to specific tissues and/orconditions (Fig. 5c). Analysis of the sequence characteristics (CAGE tagdistribution shapes, CpG and TATA-box associations and densities ofpotential TFBSs; Fig. 5a,b,d,e) of tag clusters in each supergroupdemonstrated underlying promoter features influencing global expres-sion. In general, ubiquitous transcripts were associated with a broadTSS and CpG islands, whereas tightly regulated transcripts were asso-ciated with sharper distinct TSSs and TATA-box promoters26 (Table 2,Supplementary Note and Supplementary Table 3). One exception wasthe central nervous system–specific promoters, which were especiallyCpG-rich. Using representative models27, we measured the relativedensity of potential TFBSs in the immediate 300-bp upstream region ofthe tag clusters (Fig. 5d). There was a direct correlation between theglobal properties of promoters and TFBS density.
Impact of alternative promoter usage on the proteomePrevious analysis using limited data sets28 has suggested that 18–20%of protein-coding genes use alternative promoters. In our data set, 58%of protein-coding transcriptional units (11,264 out of 19,142) had twoor more alternative promoters, based on the presence of nonoverlap-ping tag clusters. Among these transcriptional units, there were 63,060alternative tag clusters that belong to distinct clusters (Fig. 5; seewebsite listed in Methods). Of the protein-coding transcriptional unitsthat had at least two putative TSSs, 92.9% are predicted to use distinctmethionine start codons. As an example, the UDP-glucuronyl trans-ferase gene has seven promoters used preferentially by different tissuesand driving six alternative ATGs (Fig. 6a). We found that 10,959transcriptional units identified by clusters from oligo-dT–primedCAGE libraries (98%) and 2,668 transcriptional units identified byclusters from random primed CAGE libraries (99%) have at least onecoding transcript. Among them, 5,331 transcriptional units identifiedby oligo-dT–primed CAGE libraries (48%) and 925 transcriptionalunits identified by random-primed CAGE libraries (34%) have at leastone alternative promoter that overlapped the coding sequence ofknown or predicted transcripts.
©20
07 N
atu
re P
ub
lish
ing
Gro
up
h
ttp
://w
ww
.nat
ure
.co
m/n
atu
reg
enet
ics
c
No m
utat
ion
PyPu
to P
uPu
PyPu
to P
uPy
PyPu
to P
yPu
PyPu
to P
yPy
1
No m
utat
ion
PuPy t
o PuP
u
PuPy t
o PuP
y
PuPy t
o PyP
u
PuPy t
o PyP
y
Mou
se:h
uman
ex
pres
sion
rat
io
b
a
Pyrimidine-purine dinucleotide substitution effects
(mouse to human mutations)
Purine-pyrimidine dinucleotidesubstitution effects
(mouse to human mutations)
|| ||| ||| | ||||| ||| |||||| | | ||| |||| |||| ||AGGCTCCT-GGGCTGACTCCCACCAACGTCGCCGAGACTCTGGCC--GGAGAGA
CAGCCCCTCTGGCAGGCTCCCGCCAGCGTCGCTGCGGCTCCGGCCCGGGAGCGA
40
30
20
10
0
0
10
20
30
40
Num
ber
of C
AG
E ta
gsN
umbe
r of
CA
GE
tags
PyPu–drivenstart site Other start site
Substitution resulting in loss of PyPu dinucleotide
Human
Mouse
1e+4
1e–4
1e+2
1e–2
1
Mou
se:h
uman
expr
essi
on r
atio 1e+4
1e–4
1e+2
1e–2
Figure 4 Pyrimidine-purine dinucleotides drive expression. (a) A detailed
view of the core promoter of the mouse Ptprn gene (TC 73140) and
corresponding human region illustrates the usage of pyrimidine-purine
dinucleotides as dominant start sites and the expression changes resulting
from mutations at these positions. (b,c) Box plots describing substitution
effects in pyrimidine-purine (PyPu) and purine-pyrimidine (PuPy)
dinucleotides. Expression ratios are calculated as (number of tags in mouse/
number of total tags in mouse)/(number of tags in human/number of total
tags in human).
NATURE GENETICS VOLUME 38 [ NUMBER 6 [ JUNE 2006 63 1
ART I C LES
In 97% of cases, at least two of the alternative promoters from thesame transcriptional unit were located in different CAGE clustersupergroups. For example, the gelsolin gene (Gsn) (SupplementaryFig. 6 online) has two alternative promoters, producing the sameprotein product in macrophages and liver, respectively, and oneadditional alternative promoter generating a protein with a diffe-rent function in heart and cerebellum (Supplementary Note andSupplementary Fig. 6).
Promoters in 3¢ UTRs of known protein-coding genesAs noted above, there is a considerable increase in CAGE tag incidencein the 3¢ UTRs of protein-coding transcripts. These TSSs have beenindependently validated by a distinct RACE method (SupplementaryFig. 6) and are supported also by GIS and GSC ditag analysis7,20.These TSSs also have a distinct sequence motif. Alignments of themost tag-rich TSS derived from 3¢ UTRs revealed a strong over-representation of three consecutive guanines, found at position –3to–1 in 785 out of 1,327 cases, just before the TSSs (Fig. 6c). Analysisof cross-species conservation between sequenced vertebrate genomesin the region surrounding the 3¢ UTR TSSs revealed a highly conservedregion located at positions +40 to +90 relative to the TSSs (Fig. 6b).To confirm that these sequences can indeed initiate transcription,we performed reporter-gene analysis with four distinct 3¢ UTRpromoters. In each case, upstream regions of the TSS directedreporter-gene expression (Fig. 6d).
Transcripts initiated in 3¢ UTRs mightregulate downstream genes using a sense-antisense mechanism, as downstream geneson the opposite strand are located muchcloser than expected7,20. If 3¢ UTR–derivedtranscripts function as regulatory noncodingRNAs, their transcriptional regulation mightbe discordant from the full-length transcript.In 43% (168/391) of testable representativetranscripts, the tag distribution in 5¢ and 3¢terminal exons was significantly divergent(P o 0.05, Bonferroni-corrected Fisher’sexact test) in at least one tissue, suggestingindependent regulation of the 3¢ UTR pro-moter (Supplementary Fig. 6). Notably, theincidence of 3¢ TSS is tissue specific: it is
prevalent among libraries derived from cerebellum and lung butreduced in libraries derived from embryo.
Promoting the macrophage-specific transcriptomeAs a model system to demonstrate the power of the approach, weapplied CAGE to bone marrow–derived macrophages (BMM) treatedwith different stimuli. Based on the clustering tree (Fig. 5), weextracted two very tight promoter clusters: those expressed in con-stitutively macrophages but not in other cell types, and those inducibleby macrophage activating agents such as lipopolysaccharides (LPS)and CpG DNA, but also macrophage-restricted. The first set includesmany known macrophage markers such as the archetypal CSF-1receptor (encoded by CSF1R in humans and Csf1r in mouse), andthe second includes large set of known inflammatory cytokines. Theglobal binding motif analysis of TFBS families identified an over-representation of the Ets and NF-kB family binding sites (Fig. 5d),consistent with the well-documented functions of these two genefamilies in macrophage transcriptional control29,30. A more detailedanalysis of TFBS incidence in these promoter clusters can be found inthe Supplementary Note and Supplementary Figure 5.
Promoter database structure linksA description of new, publicly available databases and resourcesintegrating CAGE, ESTs, full-length cDNAs and other genomicelements is available in Supplementary Table 4.
©20
07 N
atu
re P
ub
lish
ing
Gro
up
h
ttp
://w
ww
.nat
ure
.co
m/n
atu
reg
enet
ics
Expression ratio of supergroupin each CAGE RNA library(log2 (parts per million))
10 27 56 21 65 18 29 3 39 40 2 22 17 14 23 30 42 13 12 5 34 36 45 11
6 66 47 69 44 24 57 25 61 55 16 64 68 62 8 58 60 0 59 53 32 35 20 31 46 37 7 43 48 19 41 4 63 50 28 26 15 1 54 51 9 49 33 38 52 67
CA
GE
tag
clus
ter
supe
rgro
ups
TFBS densityHierarchical clustering of
CAGE TCs
Ubiquitous
LiverLung
Macrophages
Brain
BH
LH+
BH
LH–
BZ
IP_C
EB
P+
BZ
IP_C
EB
P–
BZ
IP_C
RE
B+
BZ
IP_C
RE
B–
ET
S+
ET
S–
FO
RK
HE
AD
+F
OR
KH
EA
D–
HM
G+
HM
G–
HO
ME
O+
HO
ME
O–
MA
DS
+M
AD
S–
RE
L+R
EL–
TR
P+
TR
P–
b c d
Relative TFBS over/under-representation upstream of super-group compared to all tag clusters
1.3
1.2
1.1
1.0
0.9
0.8
0.7
0.6
0.5
0.4
0.3
a
CpG
-TA
TAas
soci
atio
n
% C
pG-is
land
asso
ciat
ion
% T
ATA
asso
ciat
ion
0 50 20 0
0.0
1.0
2.0
3.0 Fraction sharp and
broad promoters within supergroup
BroadSharp
Corepromoter
shape
Figure 5 Promoter-based clustering reveals global
features of the transcriptome. Analysis is based
on hierarchical clustering the tag clusters usage
using CAGE libraries containing at least 1,500
tags. (a) Percentage of CpG-island and TATA-box
association for each supergroup. (b) Promoter
shape propensity (broad or sharp TSS distribution
for each supergroup (see Supplementary Note for
definitions)). (c) The 159,075 core promoters
(TCs) clustered into 70 supergroups with respect
to RNA library expression ratios. x axis, grouping
of RNA libraries (hierarchical clustering of CAGE
tag clusters; tissues not indicated individually);
left y axis, the relations among supergroups;right y axis, the identifier number of clusters
and the tissues in which indicated tag cluster
supergroups are overrepresented. (d) Relative
density of representative TFBSs 300-bp
upstream regions of the tag clusters within each
supergroup; + and – indicate the strand relative
to the TSS.
6 32 VOLUME 38 [ NUMBER 6 [ JUNE 2006 NATURE GENETICS
ART I C LES

DISCUSSIONBroad promoters are the major class in mammalsThis study contributes to the international Encyclopedia of DNAelements (ENCODE) project, which aims to identify all of the func-tional elements in the human genome31 by providing a definitivesurvey of the classes of mammalian promoters in mouse and humans.It complements and extends published work on human systems usingcombinations of RACE and tiling arrays32,33. Our data show that theclassical TATA-box promoter architecture represents a minority of theset of mammalian promoters in mouse and humans. This class is com-monly associated with tissue-specific genes and high conservationacross species (Supplementary Table 2). The BR classes, most com-monly based on CpG islands, represent the majority of mammalianpromoters. For the purpose of future genome and transcriptome anno-tation, the prevalence of the BR class of promoters in mammalsmeans that one cannot consider the most extreme 5¢ end of the longestcDNA in a cluster as the true full-length transcript, as is presentlyassumed in the construction of mRNA reference sequences34. Thisis an important issue in cross-species comparison, as we note thatthe initiator sequence is commonly subject to evolutionary changebetween mammals.
Promoters on exonsUsing CAGE technology, we have found that the exons in aspecific subset of highly expressed, multiexon genes contain putativepromoters supported by CAGE tags, either singly or in clusters,
around initiator-like motifs. We found that the patterns of exonicpromoter activity were gene-specific, were conserved acrossspecies and were prevalent amongst TATA-containing tissue-specificgenes. Notably, a recent study provides independent support forexonic promoter activity, showing by ChIP that hypophosphorylatedRNA polymerase II is selectively concentrated over exons, but notintrons, in a subset of human genes35. We can only speculate onthe importance of exonic promoters. A function could be envisionedin RNA processing. The cotranscriptional recruitment of mRNAprocessing factors is dependent on their binding to RNA polymeraseII (ref. 36). The binding of RNA polymerase II to exons could serveto recruit the entire transcribed gene to the concentrated transcrip-tional processing machinery in so-called ‘transcription factories’.Additionally, exonic transcription initiation sites might have somerelationship to so-called exonic splicing enhancers37, either influen-cing recruitment of the SR proteins SF2/SAF, SC35, SRp40 and SRp55,or being influenced by them. In any case, the truncated transcriptsgenerated from exonic promoters constitute a major new class ofnoncoding RNAs.
Evolutionary implicationsThe CpG island–associated category of promoters seems to beparticularly rapidly evolving in mammals, whereas TATA box–con-taining promoters are more constrained. The transcriptional regula-tion and evolutionary plasticity of CpG island–associated promoters isalso linked to epigenetic control of transcriptional activity. CpG
©20
07 N
atu
re P
ub
lish
ing
Gro
up
h
ttp
://w
ww
.nat
ure
.co
m/n
atu
reg
enet
ics
Adipose (T01F053ED8F9)Adipose, macrophage(T01F053ED940)
Liver (T01F053EF925) 96
150
Adipose, lung(T01F053F746A) 73
Liver (T01F053F8258) 18
Liver (T01F053FEE61) 477
Liver (T01F0540A1DA) 353
CAGE tags
mRNA mappings
88,000 k 88,050 k 88,100 k
chr1:87957000..88138000
0.00
5.00
15.00
25.00
–100to
+10
–100to
+120
Control –100to
+10
–100to
+120
Control –100to
+10
–100to
+120
Control –100to
+10
–100to
+120
Control
Luci
fera
se a
ctiv
ity(a
s a
mul
tiple
of t
he c
ontr
ol)
a
–400 –200 1 200 400
0.1
0.2
0.3
0.4
0.5
0.6
Position
Med
ian
phas
cons
cons
erva
tion
scor
e
Control
3′ UTRtranscripts
b
d
CATG
CATG
CATG
CTAG
CATGA
CT
ATCG
CTA
ATTG
CGCAT
CCAGC
G
21 3 4 5 6 7 8–1–2–3–4–5–6–7–8–9–10–11
2
1Bits
Position
c
Liver (T01F053E7A52) 76
T11F04A5422BALDOC
T07F058F361DILK
T03F05AE710FLASS2
T05F03CD91EBKLHL5
Tag clusterHUGO gene ID
Figure 6 Alternative promoters in protein-coding
genes. (a) The UDP-glucuronyl transferase gene
exemplifies the usage of multiple alternative
promoters: within the transcriptional unit there are
seven different promoters with specific tissue usage.Boxes indicate the number of CAGE tags for each
major tag cluster and the dominant tissue source(s)
of tags. (b) TSSs located in 3¢ UTRs of protein-
coding genes can be considered an extreme form of
alternative promoters. The sequence logo of the –30
to +10 region around the most prominent 3¢ UTR
TSS in terminal exons indicates a new upstream
motif immediately upstream of 3¢ UTR TSS. (c) A
highly conserved region is located around downstream of 3¢ UTR TSSs. Median phastcons conservation40 of 1-kb region surrounding the 3¢ UTR TSSs in last
exons, compared to randomly selected start sites in the same exons. (d) Four of the 3¢ UTR promoters (Supplementary Note) were tested with a luciferase
gene reporter system. Bars indicate signal as a multiple of the signal in the empty vector control, using both a shorter upstream region (–100 to +10 relative
to TSS) and a longer (–100 to +120) ahead of the reporter gene.
NATURE GENETICS VOLUME 38 [ NUMBER 6 [ JUNE 2006 63 3
ART I C LES
island–associated methylation events, including imprinting, havebeen related to the existence of noncoding RNA, includingsense-antisense transcription38. Given the extensive use of both broad,CpG-rich promoters and the widespread occurrence of antisensetranscripts20, it is possible that newly evolved CpG promoters are toa larger extent epigenetically controlled. We noted that amongthe so-called ‘bidirectional’ CpG island promoters, the two opposingpromoters actually frequently generate transcripts that overlap to formpotential sense-antisense pairs. One transcript might also influence theepigenetic state of the promoter of the other in such pairs. Thedevelopment of a promoter structure with multiple TSSs whoseexpression is regulated at a locus level by epigenetic events and fine-tuned by the actual initiation signals might have been an importantcomponent of the adaptive evolution of vertebrates.
Importance of proximal promoters as regulatory determinantsIn general, searches for shared patterns of motifs among coregulatedgenes have been based on the comparison of arbitrary lengths of DNAsequences upstream of the longest known cDNA (the presumptivepromoter)39. The availability of precise TSSs in two species willincrease the accuracy of these approaches by narrowing the windowto the actual phylogenetically conserved promoter used in the tissue,and excluding overlapping promoter regions. Our clustering analysisof promoters based on CAGE data and a detailed examination of themacrophage-expressed and LPS-inducible gene classes (Supplemen-tary Note) shows that there is a strong correlation between corepromoter sequences and tissue-specific promoter use. Hence, althoughproximal promoters may not contain all of the information requiredto precisely control transcription of individual genes in time and spaceduring development, analysis of promoters alone can generate mean-ingful models of transcriptional regulatory networks.
Implications for future researchThe results presented here provide a platform for future approaches togenome-wide analysis of transcription and transcriptional gene reg-ulation. Linking transcription to defined genomic regions and betterunderstanding of the functional landscape of different classes of corepromoters will fundamentally affect all future developments in pro-moter identification, regulatory determinant pattern detection andanalysis of clusters of coexpressed genes. Because technologies likeCAGE are scalable to whole organisms, these approaches pave the wayfor ‘systematic’ systems biology.
METHODSSee Supplementary Note, Supplementary Figures 6–8 and Supplementary
Tables 5–7 online for details of methods and extended biological findings.
The supplementary information is also available as a single file online
(http://fantom3.gsc.riken.jp or http://www.macrophages.com).
URLs. See http://gerg01.gsc.riken.jp/altp/ for a detailed description of alter-
native promoters.
Note: Supplementary information is available on the Nature Genetics website.
ACKNOWLEDGMENTSWe thank the following individuals for discussion, encouragement and technicalassistance: H. Atsui, A. Hasegawa, K. Hayashida, H. Himei, F. Hori, C. Kawazu,M. Kojima, K. Waki, M. Aoki, K Murakami, M. Murata, M. Nishikawa,H. Nishiyori, K. Nomura, M. Ohno, H. Sato, Y. Shigemoto, N. Suzuki, Y. Takedaand K. Yoshida. We especially thank A. Wada, T. Ogawa, M. Muramatsu, A. Kiraand all the members of RIKEN Yokohama Research Promotion Division forsupporting and encouraging the project. We also thank the Laboratory ofGenome Exploration Research Group for secretarial and technical assistance, andYokohama City University, who provided human samples and computational
resources of the RIKEN Super Combined Cluster (RSCC). This work was mainlysupported by Research Grant for the Genome Network Project from the JapaneseMinistry of Education, Culture, Sports, Science and Technology (MEXT), theRIKEN Genome Exploration Research Project from the Japanese Ministry ofEducation, Culture, Sports, Science and Technology of the Japanese Government(to Y.H.), Advanced and Innovational Research Program in Life Science (to Y.H.),National Project on Protein Structural and Functional Analysis from MEXT (toY.H.), Presidential Research Grant for Intersystem Collaboration of RIKEN (toP.C. and Y.H.) and a grant from the Six Framework Program from the EuropeanCommission (to P.C.).
AUTHORS’ CONTRIBUTIONSP.C., R.K., M.K.-K., Y.K., C.K., M.N., J.K., S.M.-T., P.A., A.C., S.G., F.P., H.S.,S.M.G. and C.W. produced data and resources. P.C. and Y.H. designed theexperiments. P.C., A.S., B.L. and D.A.H. wrote the paper. A.S., B.L., S.K., K.S., J.P.,C.A.M.S., M.S.T., W.B.A., P.G.E., M.C.F., A.R.R.F., W.B.A., S.L.T., C.P., R.K., T.R.,T.K., S.F., H. Kawaji, H. Konno, K.N., C.A.W., V.O., E.T.L., M.H., V.B.B., D.A.H.and Y.H. performed bioinformatic analysis and interpreted data.
COMPETING INTERESTS STATEMENTThe authors declare that they have no competing financial interests.
Published online at http://www.nature.com/naturegenetics
Reprints and permissions information is available online at http://npg.nature.com/
reprintsandpermissions/
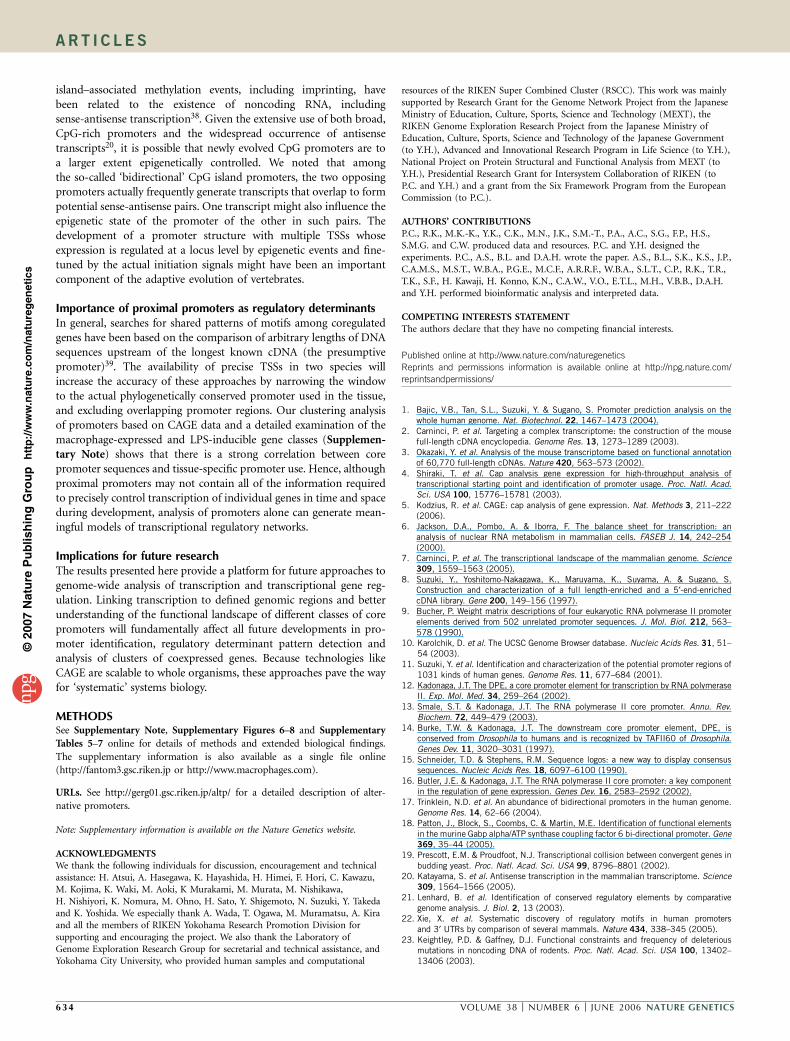
1. Bajic, V.B., Tan, S.L., Suzuki, Y. & Sugano, S. Promoter prediction analysis on thewhole human genome. Nat. Biotechnol. 22, 1467–1473 (2004).
2. Carninci, P. et al. Targeting a complex transcriptome: the construction of the mousefull-length cDNA encyclopedia. Genome Res. 13, 1273–1289 (2003).
3. Okazaki, Y. et al. Analysis of the mouse transcriptome based on functional annotationof 60,770 full-length cDNAs. Nature 420, 563–573 (2002).
4. Shiraki, T. et al. Cap analysis gene expression for high-throughput analysis oftranscriptional starting point and identification of promoter usage. Proc. Natl. Acad.Sci. USA 100, 15776–15781 (2003).
5. Kodzius, R. et al. CAGE: cap analysis of gene expression. Nat. Methods 3, 211–222(2006).
6. Jackson, D.A., Pombo, A. & Iborra, F. The balance sheet for transcription: ananalysis of nuclear RNA metabolism in mammalian cells. FASEB J. 14, 242–254(2000).
7. Carninci, P. et al. The transcriptional landscape of the mammalian genome. Science309, 1559–1563 (2005).
8. Suzuki, Y., Yoshitomo-Nakagawa, K., Maruyama, K., Suyama, A. & Sugano, S.Construction and characterization of a full length-enriched and a 5¢-end-enrichedcDNA library. Gene 200, 149–156 (1997).
9. Bucher, P. Weight matrix descriptions of four eukaryotic RNA polymerase II promoterelements derived from 502 unrelated promoter sequences. J. Mol. Biol. 212, 563–578 (1990).
10. Karolchik, D. et al. The UCSC Genome Browser database. Nucleic Acids Res. 31, 51–54 (2003).
11. Suzuki, Y. et al. Identification and characterization of the potential promoter regions of1031 kinds of human genes. Genome Res. 11, 677–684 (2001).
12. Kadonaga, J.T. The DPE, a core promoter element for transcription by RNA polymeraseII. Exp. Mol. Med. 34, 259–264 (2002).
13. Smale, S.T. & Kadonaga, J.T. The RNA polymerase II core promoter. Annu. Rev.Biochem. 72, 449–479 (2003).
14. Burke, T.W. & Kadonaga, J.T. The downstream core promoter element, DPE, isconserved from Drosophila to humans and is recognized by TAFII60 of Drosophila.Genes Dev. 11, 3020–3031 (1997).
15. Schneider, T.D. & Stephens, R.M. Sequence logos: a new way to display consensussequences. Nucleic Acids Res. 18, 6097–6100 (1990).
16. Butler, J.E. & Kadonaga, J.T. The RNA polymerase II core promoter: a key componentin the regulation of gene expression. Genes Dev. 16, 2583–2592 (2002).
17. Trinklein, N.D. et al. An abundance of bidirectional promoters in the human genome.Genome Res. 14, 62–66 (2004).
18. Patton, J., Block, S., Coombs, C. & Martin, M.E. Identification of functional elementsin the murine Gabp alpha/ATP synthase coupling factor 6 bi-directional promoter. Gene369, 35–44 (2005).
19. Prescott, E.M. & Proudfoot, N.J. Transcriptional collision between convergent genes inbudding yeast. Proc. Natl. Acad. Sci. USA 99, 8796–8801 (2002).
20. Katayama, S. et al. Antisense transcription in the mammalian transcriptome. Science309, 1564–1566 (2005).
21. Lenhard, B. et al. Identification of conserved regulatory elements by comparativegenome analysis. J. Biol. 2, 13 (2003).
22. Xie, X. et al. Systematic discovery of regulatory motifs in human promotersand 3¢ UTRs by comparison of several mammals. Nature 434, 338–345 (2005).
23. Keightley, P.D. & Gaffney, D.J. Functional constraints and frequency of deleteriousmutations in noncoding DNA of rodents. Proc. Natl. Acad. Sci. USA 100, 13402–13406 (2003).
©20
07 N
atu
re P
ub
lish
ing
Gro
up
h
ttp
://w
ww
.nat
ure
.co
m/n
atu
reg
enet
ics
6 34 VOLUME 38 [ NUMBER 6 [ JUNE 2006 NATURE GENETICS
ART I C LES

24. Eisen, M.B., Spellman, P.T., Brown, P.O. & Botstein, D. Cluster analysis and display ofgenome-wide expression patterns. Proc. Natl. Acad. Sci. USA 95, 14863–14868(1998).
25. Kodzius, R. et al. Absolute expression values for mouse transcripts: re-annotation ofthe READ expression database by the use of CAGE and EST sequence tags. FEBS Lett.559, 22–26 (2004).
26. Schug, J. et al. Promoter features related to tissue specificity as measured by Shannonentropy. Genome Biol. 6, R33 (2005).
27. Sandelin, A. & Wasserman, W.W. Constrained binding site diversity within families oftranscription factors enhances pattern discovery bioinformatics. J. Mol. Biol. 338,207–215 (2004).
28. Landry, J.R., Mager, D.L. & Wilhelm, B.T. Complex controls: the role ofalternative promoters in mammalian genomes. Trends Genet. 19, 640–648 (2003).
29. Rosmarin, A.G., Yang, Z. & Resendes, K.K. Transcriptional regulation in myelopoiesis:Hematopoietic fate choice, myeloid differentiation, and leukemogenesis. Exp. Hema-tol. 33, 131–143 (2005).
30. Bonizzi, G. & Karin, M. The two NF-kappaB activation pathways and their role in innateand adaptive immunity. Trends Immunol. 25, 280–288 (2004).
31. ENCODE Project Consortium. The ENCODE (ENCyclopedia Of DNA Elements) Project.Science 306, 636–640 (2004).
32. Kapranov, P. et al. Examples of the complex architecture of the human transcriptomerevealed by RACE and high-density tiling arrays. Genome Res. 15, 987–997(2005).
33. Cheng, J. et al. Transcriptional maps of 10 human chromosomes at 5-nucleotideresolution. Science 308, 1149–1154 (2005).
34. Pruitt, K.D., Tatusova, T. & Maglott, D.R. NCBI Reference Sequence (RefSeq): acurated non-redundant sequence database of genomes, transcripts and proteins.Nucleic Acids Res. 33, D501–D504 (2005).
35. Brodsky, A.S. et al. Genomic mapping of RNA polymerase II reveals sites of co-transcriptional regulation in human cells. Genome Biol. 6, R64 (2005).
36. Bentley, D.L. Rules of engagement: co-transcriptional recruitment of pre-mRNAprocessing factors. Curr. Opin. Cell Biol. 17, 251–256 (2005).
37. Wu, Y., Zhang, Y. & Zhang, J. Distribution of exonic splicing enhancer elements inhuman genes. Genomics 86, 329–336 (2005).
38. Imamura, T. et al. Non-coding RNA directed DNA demethylation of Sphk1 CpG island.Biochem. Biophys. Res. Commun. 322, 593–600 (2004).
39. Bluthgen, N., Kielbasa, S.M. & Herzel, H. Inferring combinatorial regulation oftranscription in silico. Nucleic Acids Res. 33, 272–279 (2005).
40. Siepel, A. & Haussler, D. Combining phylogenetic and hidden Markov models inbiosequence analysis. J. Comput. Biol. 11, 413–428 (2004).
©20
07 N
atu
re P
ub
lish
ing
Gro
up
h
ttp
://w
ww
.nat
ure
.co
m/n
atu
reg
enet
ics
NATURE GENETICS VOLUME 38 [ NUMBER 6 [ JUNE 2006 63 5
ART I C LES

Genome-wide analysis of mammalian promoter architecture and evolutionPiero Carninci, Albin Sandelin, Boris Lenhard, Shintaro Katayama, Kazuro Shimokawa, Jasmina Ponjavic, Colin A M Semple, Martin S Taylor, Pär G Engström, Martin C Frith, Alistair R R Forrest, Wynand B Alkema, Sin Lam Tan, Charles Plessy, Rimantas Kodzius, Timothy Ravasi, Takeya Kasukawa, Shiro Fukuda, Mutsumi Kanamori-Katayama, Yayoi Kitazume, Hideya Kawaji, Chikatoshi Kai, Mari Nakamura, Hideaki Konno, Kenji Nakano, Salim Mottagui-Tabar, Peter Arner, Alessandra Chesi, Stefano Gustincich, Francesca Persichetti, Harukazu Suzuki, Sean M Grimmond, Christine A Wells, Valerio Orlando, Claes Wahlestedt, Edison T Liu, Matthias Harbers, Jun Kawai, Vladimir B Bajic, David A Hume & Yoshihide HayashizakiNature Genetics; doi: 10.1038/ng1789; corrected 5 May 2006
In the version of this article initially published online, the x-axis of Figure 4b was mislabeled. Specifically, the five groups on the x-axis should be labeled:
No mutationPyPu to PuPuPyPu to PuPyPyPu to PyPuPyPu to PyPy
The error has been corrected for all versions of the article.
NATURE GENETICS | VOLUME 38 | NUMBER 6 | JUNE 2006
Corrigendum: Spontaneous DNA breakage in single living Escherichia coli cellsJeanine M Pennington & Susan M RosenbergNat. Genet. 39, 797–802 (2007); published online 27 May; corrected after print 29 August 2007
In the version of this article initially published, our estimate of the rate of formation of spontaneous DNA double-strand breaks (DSBs) in E. coli proportional to DNA content in humans should read that it differs from that of Vilenchik and Knudson (Proc. Natl. Acad. Sci. USA 100, 12871–12876; 2003) by fourfold, not “approximately tenfold” (page 800, line 3, and page 800, line 59). We estimated that there are 0.01 DSBs per E. coli genome replication. Because E. coli has approximately 4.7 × 10⁶ bp per genome (Blattner, F.R. et al., Science 277, 1453–1474; 1997), we estimate that approxi-mately 2 × 10⁻⁹ DSBs per bp are replicated, or about fourfold fewer than the estimate of about 0.8 × 10⁻⁸ DSBs per bp replicated in human somatic cells (or 50 DSBs per diploid human genome replication) from Vilenchik and Knudson (Proc. Natl. Acad. Sci. USA 100, 12871–12876; 2003). This would bring the number of DSBs per human genome replication down to approximately 13, if it were proportional to that in E. coli. Our error arose from calculating the human equivalent based on haploid, not diploid, human genome size. This error has been corrected in the HTML and PDF versions of the article.
Corrigendum: Genome-wide analysis of mammalian promoter architecture and evolutionPiero Carninci, Albin Sandelin, Boris Lenhard, Shintaro Katayama, Kazuro Shimokawa, Jasmina Ponjavic, Colin A M Semple, Martin S Taylor, Pär G Engström, Martin C Frith, Alistair R R Forrest, Wynand B Alkema, Sin Lam Tan, Charles Plessy, Rimantas Kodzius, Timothy Ravasi, Takeya Kasukawa, Shiro Fukuda, Mutsumi Kanamori-Katayama, Yayoi Kitazume, Hideya Kawaji, Chikatoshi Kai, Mari Nakamura, Hideaki Konno, Kenji Nakano, Salim Mottagui-Tabar, Peter Arner, Alessandra Chesi, Stefano Gustincich, Francesca Persichetti, Harukazu Suzuki, Sean M Grimmond, Christine A Wells, Valerio Orlando, Claes Wahlestedt, Edison T Liu, Matthias Harbers, Jun Kawai, Vladimir B Bajic, David A Hume & Yoshihide HayashizakiNat. Genet. 38, 626–635 (2006); published online 28 April 2006; corrected online 5 May 2006; corrected after print 29 August 2007
In the version of this article initially published, two of the smaller bar plots in Figure 1e were mistakenly duplicated. Specifically, the Zfp385 plot is an erroneous copy of the 137774 plot, and the Txndc7 plot is an erroneous copy of the Pik3r5 plot. See below for the corrected version of the figure. This error does not change the conclusions of the study in any way, as the bar plots are just a few visual examples of more than 5,000 tag clusters, and the cor-rect plots follow the same distribution patterns as the erroneous ones. This error has been corrected in the HTML and PDF versions of the article.
20 60 1008040 20 60 1008040 20 60 1008040 20 60 1008040
80%
60%
40%
20%
80%
60%
40%
20%
80%
60%
40%
20%
80%
60%
40%
20%
Nucleotide position
retsulc ga t ni stnuoc gat fo noitcarF
Singledominantpeak (SP)
Broad(BR)
Broad with dominantpeak (PB)
Bi- or multimodal(MU)
Postn (T03F033EDB08)
ORF61(T10R04C2E25C) Ogdh (T11F005E65B7) Adsl (T15F04D83907) Peo1 (T19F02A4A00F)
Ppap2b (T04F062B54A0) Cd164 (T10F0277FE1C) Zfp385 (T15R06303CFB) 137774 (T18R05237FC0)
Trappc3 (T04F076DBE82) Pik3r5 (T11F040E47AA) Txndc7 (T12F0109631B) Mrpl2 (T17F02ABA5E8)
Myh3 (T11F03F99F20) Fth1 (T19F008A9C64) 130092 (T19R02C738F6)
tnuoc rets ulc gaT
A)
C)
B)
D)
e
001003
005
Tag cluster width
0 10 20 30 40 50
Total number of tag clusters
Number of TATA-associated tag clusters
Number of CpG-associated tag clusters
sgat fo rebmu
N
00.050.0
01.051.0
02.052.0
03.0
Liver
liver tags/bp in major promoter
00.050.0
01.051.0
02.052.0
03.0
Lung
lung tags/bp in major promoter
00.050.0
01.051.0
02.052.0
03.0
Macrophage
macrophage tags/bpin major promoter
0 10 20 30 40 50 0 10 20 30 40 50 0 10 20 30 40 50
10.
02
0.0
30.
04
0 .0
50.
06
0.0
70.
0
%liver tags in major promoter
e
ussit m
orf sg
ats
nox
e re
nn i
ni p
b
01
0.0
51
0.0
02
0.0
52
0.0
03
0.0
50
0.0
01
0.0
51
0.0
02
0.0
52
0.0
%52-
0
%05-
52
%57-
05
%001
-57
%lung tags in major promoter
%52-
0
%05-
52
%57-
05
%001
-57
%macrophage tags in major promoter
%52-
0
%05-
52
%57-
05
%001
- 57
Liver Lung Macrophage
e
ussit m
orf sg
ats
nox
e re
nni
ni p
bn
ae
m
Figure 1
CORR IGENDA
1174 VOLUME 39 | NUMBER 9 | SEPTEMBER 2007 | NATURE GENETICS
©20
07 N
atur
e P
ublis
hing
Gro
up
http
://w
ww
.nat
ure.
com
/nat
ureg
enet
ics