The impact of high-resolution SALLJEX data on global NCEP analyses
20
The Impact of High-Resolution SALLJEX Data on Global NCEP Analyses DIRCEU L. HERDIES Center for Weather Forecast and Climate Studies (CPTEC), National Institute for Space Research (INPE), Cachoeira Paulista, São Paulo, Brazil VERNON E. KOUSKY AND WESLEY EBISUZAKI National Centers for Environmental Prediction, Climate Prediction Center, Camp Springs, Maryland (Manuscript received 23 February 2006, in final form 27 March 2007) ABSTRACT A data assimilation study was performed to assess the impact of observations from the South American Low-Level Jet Experiment (SALLJEX) on analyses in the region east of the Andes Mountains from western Brazil to central Argentina. The Climate Data Assimilation Systems (CDAS)-1 and -2 and the Global Data Assimilation System (GDAS) were run with and without the additional SALLJEX rawinsondes and pilot balloon observations. The experiments for each data assimilation system revealed similar features, with a stronger low-level flow east of the Andes when SALLJEX data were included. GDAS had the strongest low-level jet (LLJ) when compared with observations. In the experiments that used additional rawinsonde and pilot balloon data, the LLJ was displaced westward in comparison to the analyses run without the SALLJEX data. The vertical structure of the meridional wind in the analyses was much closer to observed rawinsonde profiles in the experiments that included SALLJEX data than in the control experiments, and the results show that, although there are more pilot balloon observations than rawinsonde observations in the SALLJEX dataset, most of the improvements in the analyses can be obtained by only including rawinsonde observations. This was especially true for GDAS. The results of this study can serve as a benchmark for similar data impact studies using higher-resolution data assimilation systems. 1. Introduction In recent years several studies demonstrated the im- portant role that the South American low-level jet (SALLJ) plays in transporting moisture from the Ama- zon basin to higher latitudes over the continent. Many of these studies have utilized the National Centers for Environmental Prediction (NCEP) reanalysis data (e.g., Nogués-Paegle and Mo 1997; Berbery and Collini 2000; Marengo et al. 2004) and the European Centre for Medium-Range Weather Forecasts (ECMWF) re- analysis data (Salio et al. 2002; Wang and Fu 2004) as the basis for studying climate and climate variability. For data-rich areas, the Climate Data Assimilation Systems, CDAS-1 (Kalnay et al. 1996) and CDAS-2 (Kanamitsu et al. 2002), provide a fairly homogeneous set of analyses spanning more than 50 years, which are ideal for climate studies. However, for data-sparse re- gions, including many areas in the Southern Hemi- sphere, uncertainty exists concerning the validity of those analyses. The characteristics (parameteriza- tion, resolution, topography, etc.) of the general circulation model (GCM), which serves as a nucleus of the data assimilation system, become increasingly im- portant in determining circulation features as the spa- tial and temporal resolution of the observations de- creases. Anderson and Arritt (2001), using the NCEP– National Center for Atmospheric Research (NCAR) reanalysis data to investigate the low-level jet (LLJ) in the Great Plains, pointed out the risk of using data analyzed at times when the analyses are heavily influ- enced by the GCM (times when observations are rela- tively sparse). The South American Low-level Jet Experiment (SALLJEX) field campaign was carried out in western- Corresponding author address: Dirceu L. Herdies, CPTEC/INPE, Rodovia Presidente Dutra km 40, 12630 Cachoeira Paulista, São Paulo, Brazil. E-mail: [email protected] 1DECEMBER 2007 HERDIES ET AL. 5765 DOI: 10.1175/2007JCLI1375.1 © 2007 American Meteorological Society JCLI4335
Transcript of The impact of high-resolution SALLJEX data on global NCEP analyses
The Impact of High-Resolution SALLJEX Data on Global NCEP Analyses
DIRCEU L. HERDIES
Center for Weather Forecast and Climate Studies (CPTEC), National Institute for Space Research (INPE), Cachoeira Paulista,São Paulo, Brazil
VERNON E. KOUSKY AND WESLEY EBISUZAKI
National Centers for Environmental Prediction, Climate Prediction Center, Camp Springs, Maryland
(Manuscript received 23 February 2006, in final form 27 March 2007)
ABSTRACT
A data assimilation study was performed to assess the impact of observations from the South AmericanLow-Level Jet Experiment (SALLJEX) on analyses in the region east of the Andes Mountains fromwestern Brazil to central Argentina. The Climate Data Assimilation Systems (CDAS)-1 and -2 andthe Global Data Assimilation System (GDAS) were run with and without the additional SALLJEXrawinsondes and pilot balloon observations. The experiments for each data assimilation system revealedsimilar features, with a stronger low-level flow east of the Andes when SALLJEX data were included.GDAS had the strongest low-level jet (LLJ) when compared with observations. In the experiments thatused additional rawinsonde and pilot balloon data, the LLJ was displaced westward in comparison to theanalyses run without the SALLJEX data. The vertical structure of the meridional wind in the analyses wasmuch closer to observed rawinsonde profiles in the experiments that included SALLJEX data than in thecontrol experiments, and the results show that, although there are more pilot balloon observations thanrawinsonde observations in the SALLJEX dataset, most of the improvements in the analyses can beobtained by only including rawinsonde observations. This was especially true for GDAS. The results of thisstudy can serve as a benchmark for similar data impact studies using higher-resolution data assimilationsystems.
1. Introduction
In recent years several studies demonstrated the im-portant role that the South American low-level jet(SALLJ) plays in transporting moisture from the Ama-zon basin to higher latitudes over the continent. Manyof these studies have utilized the National Centers forEnvironmental Prediction (NCEP) reanalysis data(e.g., Nogués-Paegle and Mo 1997; Berbery and Collini2000; Marengo et al. 2004) and the European Centrefor Medium-Range Weather Forecasts (ECMWF) re-analysis data (Salio et al. 2002; Wang and Fu 2004) asthe basis for studying climate and climate variability.For data-rich areas, the Climate Data AssimilationSystems, CDAS-1 (Kalnay et al. 1996) and CDAS-2
(Kanamitsu et al. 2002), provide a fairly homogeneousset of analyses spanning more than 50 years, which areideal for climate studies. However, for data-sparse re-gions, including many areas in the Southern Hemi-sphere, uncertainty exists concerning the validity ofthose analyses. The characteristics (parameteriza-tion, resolution, topography, etc.) of the generalcirculation model (GCM), which serves as a nucleus ofthe data assimilation system, become increasingly im-portant in determining circulation features as the spa-tial and temporal resolution of the observations de-creases. Anderson and Arritt (2001), using the NCEP–National Center for Atmospheric Research (NCAR)reanalysis data to investigate the low-level jet (LLJ) inthe Great Plains, pointed out the risk of using dataanalyzed at times when the analyses are heavily influ-enced by the GCM (times when observations are rela-tively sparse).
The South American Low-level Jet Experiment(SALLJEX) field campaign was carried out in western-
Corresponding author address: Dirceu L. Herdies, CPTEC/INPE,Rodovia Presidente Dutra km 40, 12630 Cachoeira Paulista,São Paulo, Brazil.E-mail: [email protected]
1 DECEMBER 2007 H E R D I E S E T A L . 5765
DOI: 10.1175/2007JCLI1375.1
© 2007 American Meteorological Society
JCLI4335
central South America during the period 15 November2002–14 February 2003 (Vera et al. 2006). The SALLJprogram, a component of the Climate Variability andPredictability/Variability of American Monsoon Sys-tems (CLIVAR/VAMOS), is an internationally coordi-nated effort to contribute to a better understanding ofthe role of the SALLJ in the moisture and energy ex-changes between the Tropics and extratropics and torelated aspects of the regional hydrology, climate, andclimate variability for the region of the South Americanmonsoon.
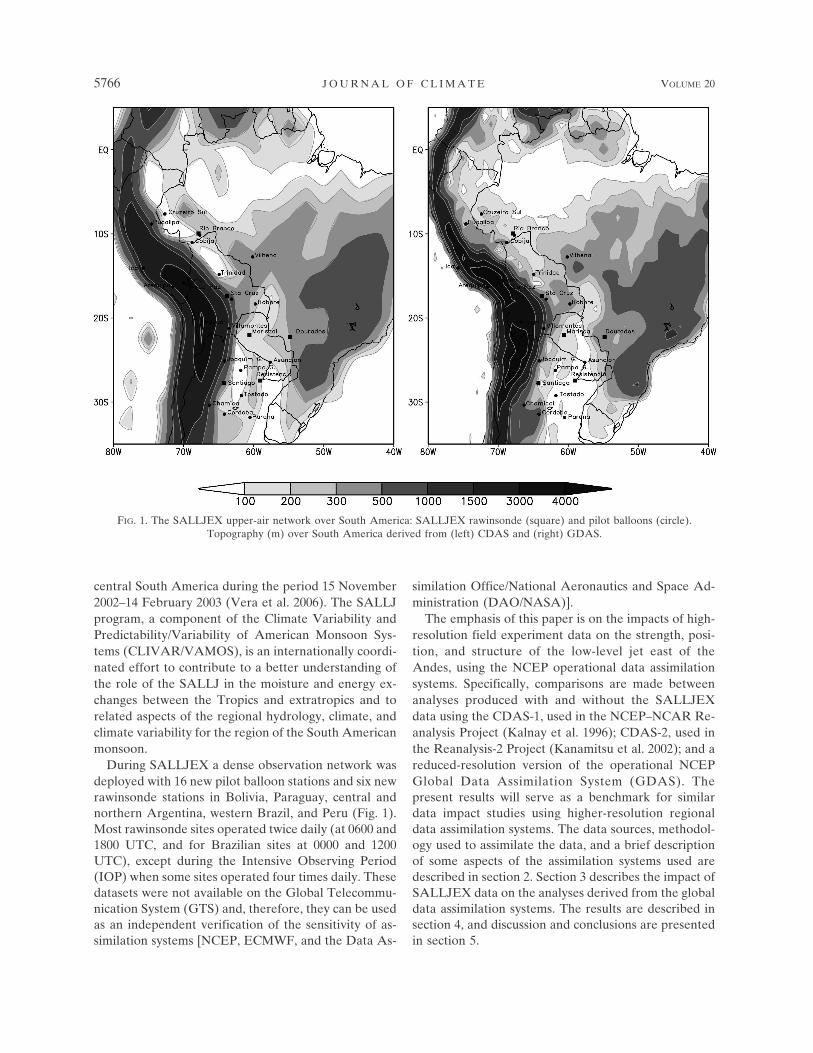
During SALLJEX a dense observation network wasdeployed with 16 new pilot balloon stations and six newrawinsonde stations in Bolivia, Paraguay, central andnorthern Argentina, western Brazil, and Peru (Fig. 1).Most rawinsonde sites operated twice daily (at 0600 and1800 UTC, and for Brazilian sites at 0000 and 1200UTC), except during the Intensive Observing Period(IOP) when some sites operated four times daily. Thesedatasets were not available on the Global Telecommu-nication System (GTS) and, therefore, they can be usedas an independent verification of the sensitivity of as-similation systems [NCEP, ECMWF, and the Data As-
similation Office/National Aeronautics and Space Ad-ministration (DAO/NASA)].
The emphasis of this paper is on the impacts of high-resolution field experiment data on the strength, posi-tion, and structure of the low-level jet east of theAndes, using the NCEP operational data assimilationsystems. Specifically, comparisons are made betweenanalyses produced with and without the SALLJEXdata using the CDAS-1, used in the NCEP–NCAR Re-analysis Project (Kalnay et al. 1996); CDAS-2, used inthe Reanalysis-2 Project (Kanamitsu et al. 2002); and areduced-resolution version of the operational NCEPGlobal Data Assimilation System (GDAS). Thepresent results will serve as a benchmark for similardata impact studies using higher-resolution regionaldata assimilation systems. The data sources, methodol-ogy used to assimilate the data, and a brief descriptionof some aspects of the assimilation systems used aredescribed in section 2. Section 3 describes the impact ofSALLJEX data on the analyses derived from the globaldata assimilation systems. The results are described insection 4, and discussion and conclusions are presentedin section 5.
FIG. 1. The SALLJEX upper-air network over South America: SALLJEX rawinsonde (square) and pilot balloons (circle).Topography (m) over South America derived from (left) CDAS and (right) GDAS.
5766 J O U R N A L O F C L I M A T E VOLUME 20
2. Datasets and methods
a. SALLJEX observations
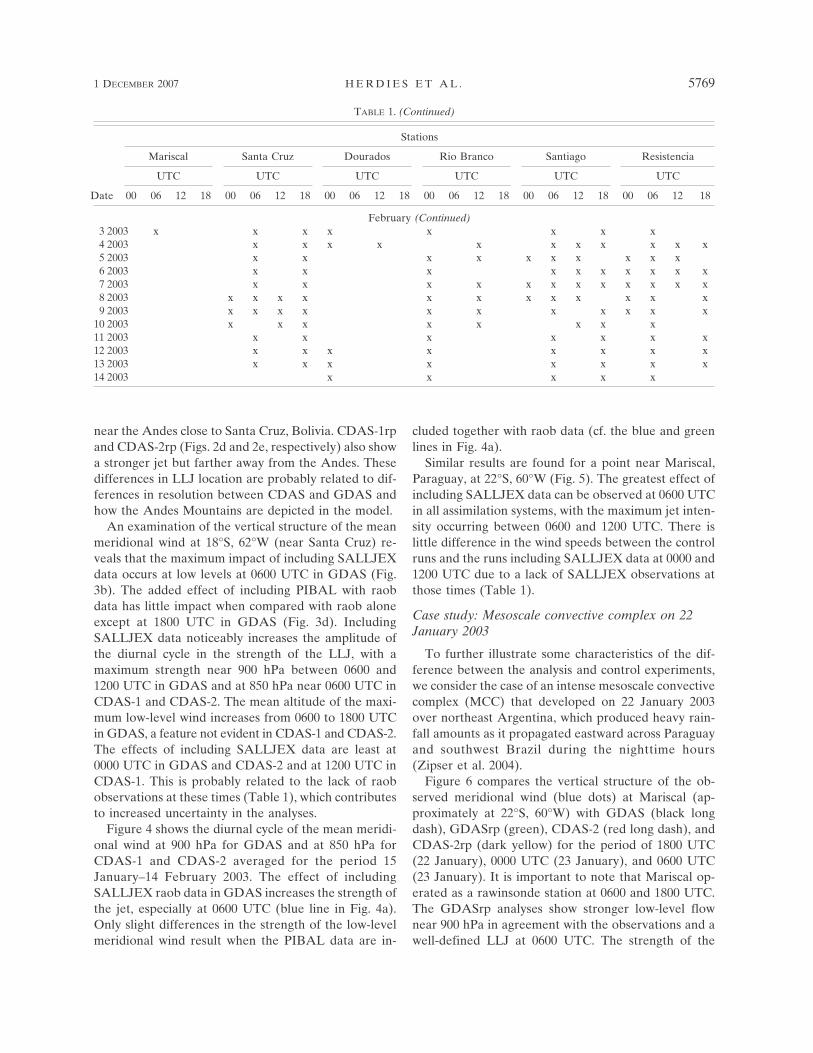
The SALLJEX field campaign took place during 15November 2002–14 February 2003 over west-centralSouth America east of the Andes Mountains. En-hanced (temporal and spatial) atmospheric soundingswere made over Argentina, Bolivia, Brazil, Paraguay,and Peru. These included 22 new upper air observationstations, with 16 pilot balloon (PIBAL) and six rawin-sonde (raob) stations (Fig. 1). Most raob stations oper-ated twice daily (0600 and 1800 UTC) while PIBALstations operated four times daily during the SpecialObservation Period (SOP) 6 January–14 February2003. During the Intensive Observation Period mostraob sites operated 3–4 times daily and up to 8 PIBALascents per day were made at selected sites. These ob-servations were not available on the GTS and were notassimilated into any operational analysis systems in realtime. They are used here as an independent verificationof the NCEP assimilation systems (CDAS and GDAS).Table 1 shows the soundings that were used by CDASand GDAS during the period 15 December 2002–14February 2003.
b. Global data assimilation systems
The basic idea of reanalysis is to use a frozen state-of-the-art analysis/forecast system to perform data as-similation using past data. In this study we compare theanalyses, derived from three different data assimilationsystems (CDAS-1, CDAS-2, and GDAS), for the pe-riod 15 December 2002–14 February 2003.
CDAS-1 is the frozen analysis/forecast system thatwas used to perform the NCEP–NCAR reanalysis (R-1;Kalnay et al. 1996) for the period from 1948 to present.CDAS-2 is an updated NCEP–NCAR reanalysis (R-2;Kanamitsu et al. 2002), covering 1979 to present, withan improved forecast model and data assimilation sys-tem. GDAS is a reduced-resolution version of the op-erational NCEP global model data assimilation system(version 2005).
The resolutions of the systems are T62L28 forCDAS, approximately 250 km horizontal resolutionwith 28 levels in the vertical, and T170L42 for GDAS,approximately 100 km horizontal resolution with 42levels in the vertical.
c. Experiments
To assess the impact that the introduction of theSALLJEX dataset has on the analyses, the followingexperiments were performed, using CDAS-1, CDAS-2,and GDAS:
1) control runs without the SALLJEX data;2) runs only including raob data (CDAS-1r, CDAS-2r,
and GDASr);3) runs including all SALLJEX upper-air data, raob
and PIBAL (CDAS-1rp, CDAS-2rp, and GDASrp);4) runs only including PIBAL in GDAS (GDASp).
All of the variables from the SALLJEX raob (me-ridional and zonal wind, specific humidity, and tem-perature) and PIBAL (meridional and zonal wind)have been incorporated in the data assimilation sys-tems.
3. Regional impact of SALLJEX
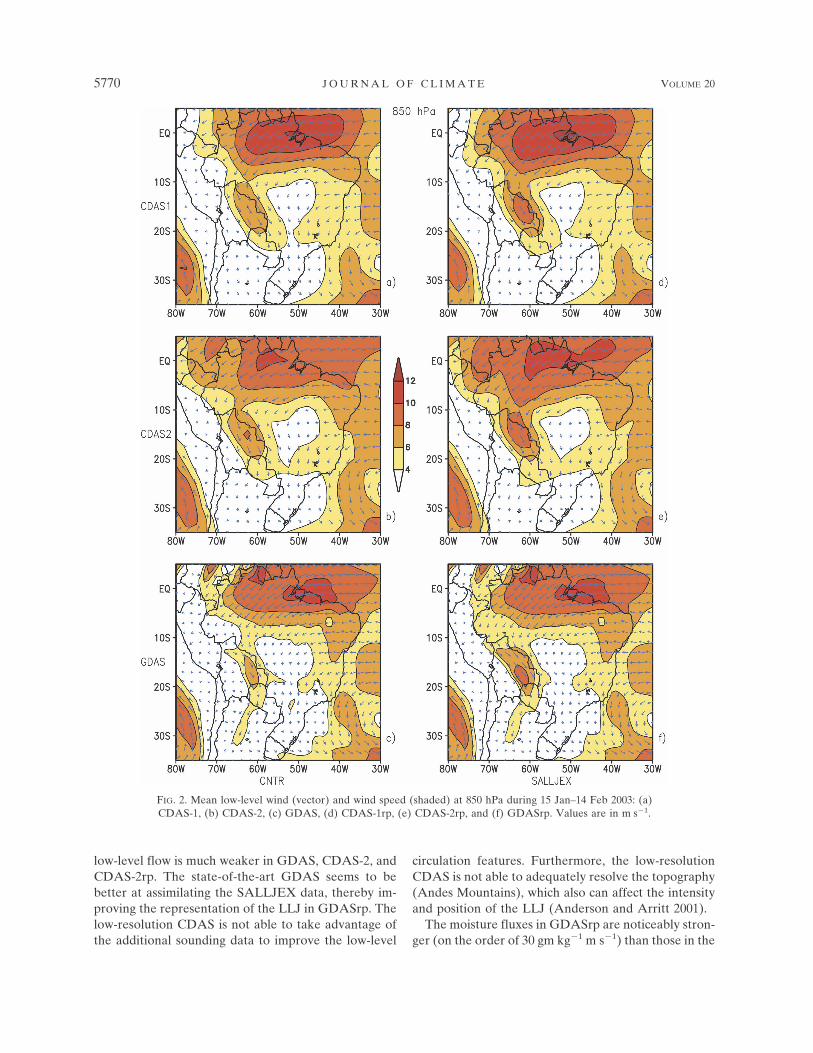
Global reanalysis, which combines general circula-tion model predictions with observations, is a powerfultool for understanding many climate and weather ques-tions that would otherwise remain elusive because ofthe limited availability of the data over some regions.However, owing to differences in data assimilation sys-tems (models and assimilation techniques), there is adegree of uncertainty in the reanalyzed fields. An ex-ample of this uncertainty is pointed out in Fig. 2, whichshows the low-level (850 hPa) vector wind over SouthAmerica during the period 15 January–14 February2003. The strength of the low-level flow east of theAndes Mountains varies by up to 40% in the analyses,with CDAS-2 (Fig. 2b) having the strongest jet andGDAS, the operational data assimilation system, hav-ing the weakest jet (Fig. 2c). Figures 2d, 2e, and 2f showthe impact of including SALLJEX data in CDAS-1,CDAS-2, and GDAS, respectively. The influence ofSALLJEX data is concentrated over the region wherethe raob and PIBAL observations were made (Fig. 1)and the global influence is close to zero outside of theregion (not shown). The strength and location of thecore of the low-level jet analyzed in the three systems,CDAS-1rp, CDAS-2rp, and GDASrp (Figs. 2d, 2e, and2f), are in better agreement than in the control runs,CDAS-1, CDAS-2, and GDAS (Figs. 2a, 2b, and 2c).
The results in Figs. 2d, 2e, and 2f show that includingthe special raob and PIBAL observations does not ap-preciably affect the large-scale circulation pattern overthe South American region. However, there is a dis-cernable effect on the intensity of the northwesterlyflow (LLJ) east of the Andes, with stronger winds in allcases where SALLJEX data have been included (right-hand panels in Fig. 2). There are also notable differ-ences in the cross-jet structure between the higher-resolution GDAS analysis and the lower-resolutionCDAS analyses. GDASrp (Fig. 2f) shows a narrowerjet, with wind speeds greater than 8 m s�1, concentrated
1 DECEMBER 2007 H E R D I E S E T A L . 5767
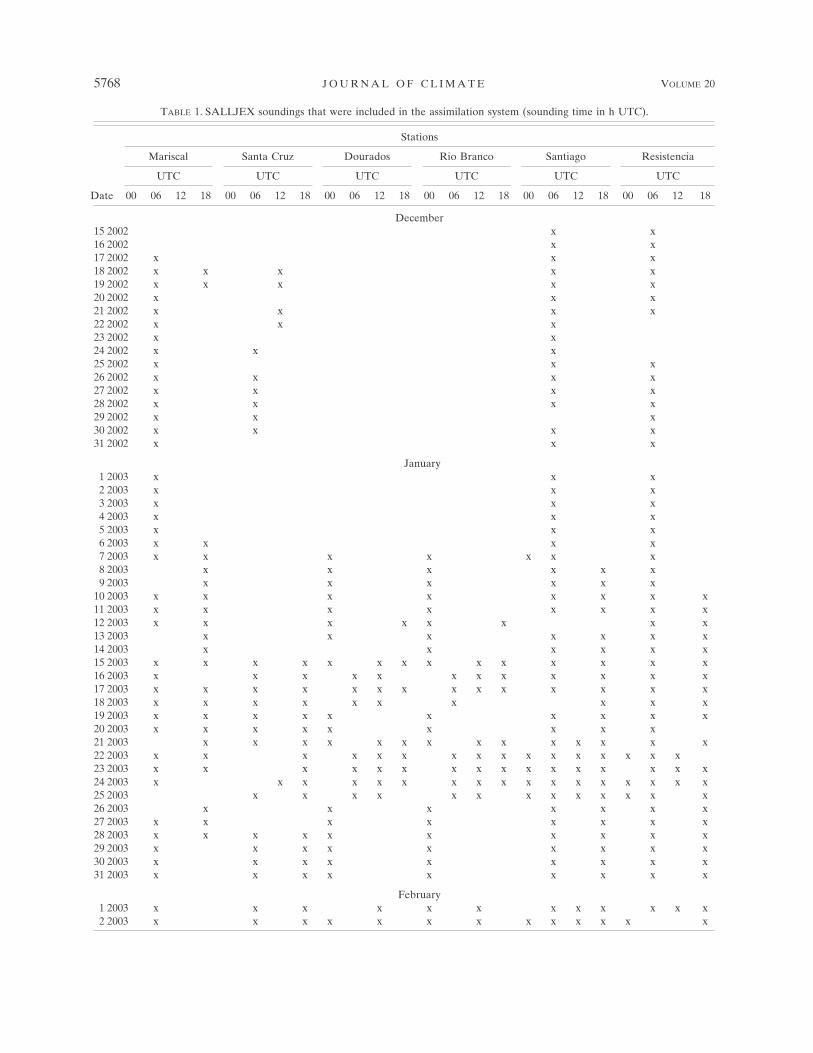
TABLE 1. SALLJEX soundings that were included in the assimilation system (sounding time in h UTC).
Date
Stations
Mariscal Santa Cruz Dourados Rio Branco Santiago Resistencia
UTC UTC UTC UTC UTC UTC
00 06 12 18 00 06 12 18 00 06 12 18 00 06 12 18 00 06 12 18 00 06 12 18
December15 2002 x x16 2002 x x17 2002 x x x18 2002 x x x x x19 2002 x x x x x20 2002 x x x21 2002 x x x x22 2002 x x x23 2002 x x24 2002 x x x25 2002 x x x26 2002 x x x x27 2002 x x x x28 2002 x x x x29 2002 x x x30 2002 x x x x31 2002 x x x
January1 2003 x x x2 2003 x x x3 2003 x x x4 2003 x x x5 2003 x x x6 2003 x x x x7 2003 x x x x x x x8 2003 x x x x x x9 2003 x x x x x x
10 2003 x x x x x x x x11 2003 x x x x x x x x12 2003 x x x x x x x x13 2003 x x x x x x x14 2003 x x x x x x15 2003 x x x x x x x x x x x x x x16 2003 x x x x x x x x x x x x17 2003 x x x x x x x x x x x x x x18 2003 x x x x x x x x x x19 2003 x x x x x x x x x x20 2003 x x x x x x x x x21 2003 x x x x x x x x x x x x x x22 2003 x x x x x x x x x x x x x x x x23 2003 x x x x x x x x x x x x x x x x24 2003 x x x x x x x x x x x x x x x x x25 2003 x x x x x x x x x x x x x26 2003 x x x x x x x27 2003 x x x x x x x x28 2003 x x x x x x x x x x29 2003 x x x x x x x x x30 2003 x x x x x x x x x31 2003 x x x x x x x x x
February1 2003 x x x x x x x x x x x x2 2003 x x x x x x x x x x x x x
5768 J O U R N A L O F C L I M A T E VOLUME 20
near the Andes close to Santa Cruz, Bolivia. CDAS-1rpand CDAS-2rp (Figs. 2d and 2e, respectively) also showa stronger jet but farther away from the Andes. Thesedifferences in LLJ location are probably related to dif-ferences in resolution between CDAS and GDAS andhow the Andes Mountains are depicted in the model.
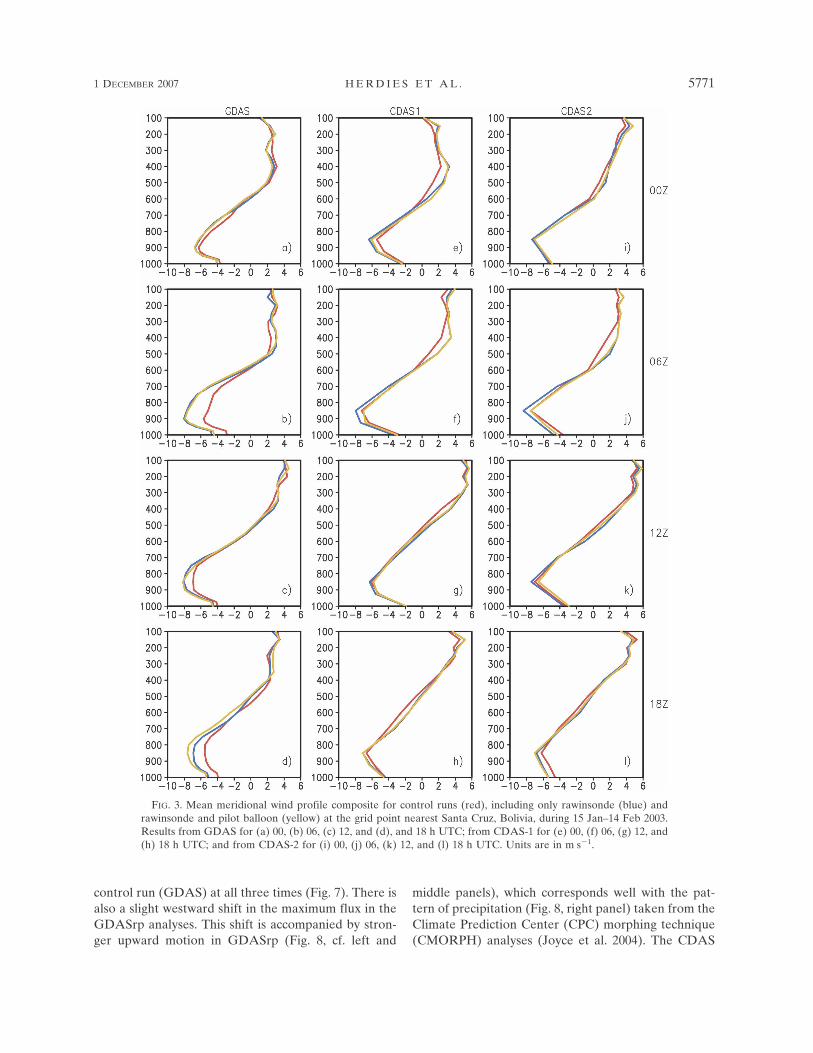
An examination of the vertical structure of the meanmeridional wind at 18°S, 62°W (near Santa Cruz) re-veals that the maximum impact of including SALLJEXdata occurs at low levels at 0600 UTC in GDAS (Fig.3b). The added effect of including PIBAL with raobdata has little impact when compared with raob aloneexcept at 1800 UTC in GDAS (Fig. 3d). IncludingSALLJEX data noticeably increases the amplitude ofthe diurnal cycle in the strength of the LLJ, with amaximum strength near 900 hPa between 0600 and1200 UTC in GDAS and at 850 hPa near 0600 UTC inCDAS-1 and CDAS-2. The mean altitude of the maxi-mum low-level wind increases from 0600 to 1800 UTCin GDAS, a feature not evident in CDAS-1 and CDAS-2.The effects of including SALLJEX data are least at0000 UTC in GDAS and CDAS-2 and at 1200 UTC inCDAS-1. This is probably related to the lack of raobobservations at these times (Table 1), which contributesto increased uncertainty in the analyses.
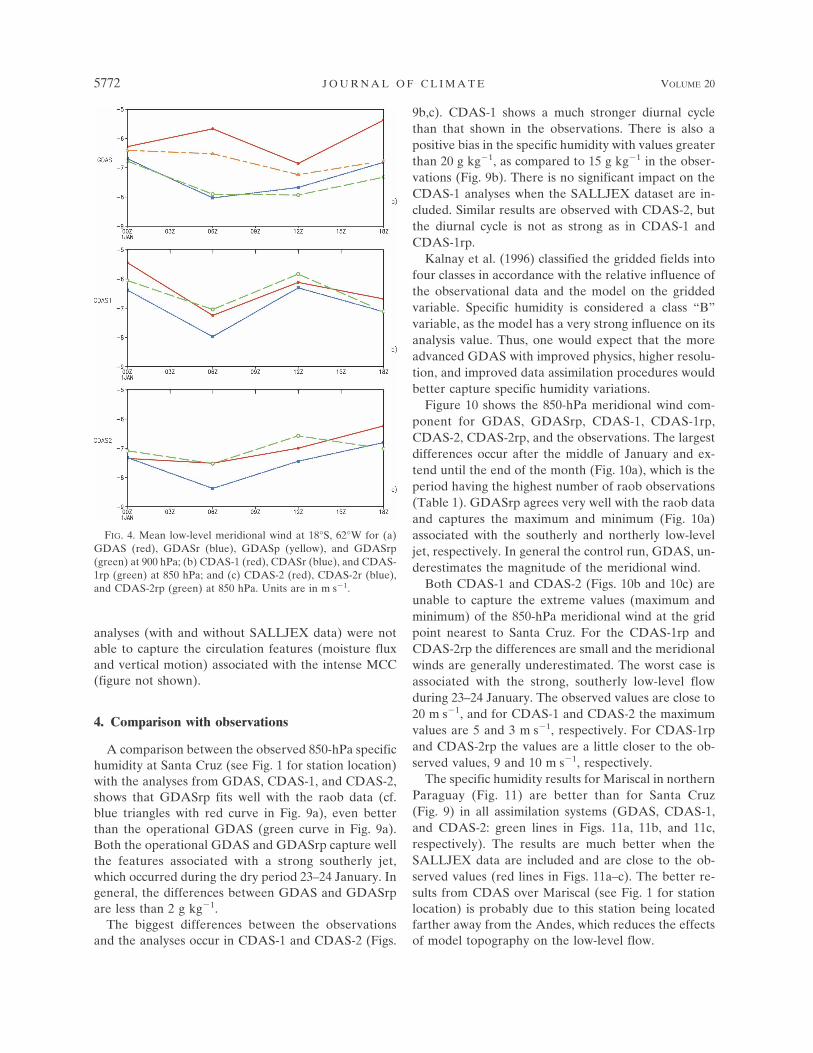
Figure 4 shows the diurnal cycle of the mean meridi-onal wind at 900 hPa for GDAS and at 850 hPa forCDAS-1 and CDAS-2 averaged for the period 15January–14 February 2003. The effect of includingSALLJEX raob data in GDAS increases the strength ofthe jet, especially at 0600 UTC (blue line in Fig. 4a).Only slight differences in the strength of the low-levelmeridional wind result when the PIBAL data are in-
cluded together with raob data (cf. the blue and greenlines in Fig. 4a).
Similar results are found for a point near Mariscal,Paraguay, at 22°S, 60°W (Fig. 5). The greatest effect ofincluding SALLJEX data can be observed at 0600 UTCin all assimilation systems, with the maximum jet inten-sity occurring between 0600 and 1200 UTC. There islittle difference in the wind speeds between the controlruns and the runs including SALLJEX data at 0000 and1200 UTC due to a lack of SALLJEX observations atthose times (Table 1).
Case study: Mesoscale convective complex on 22January 2003
To further illustrate some characteristics of the dif-ference between the analysis and control experiments,we consider the case of an intense mesoscale convectivecomplex (MCC) that developed on 22 January 2003over northeast Argentina, which produced heavy rain-fall amounts as it propagated eastward across Paraguayand southwest Brazil during the nighttime hours(Zipser et al. 2004).
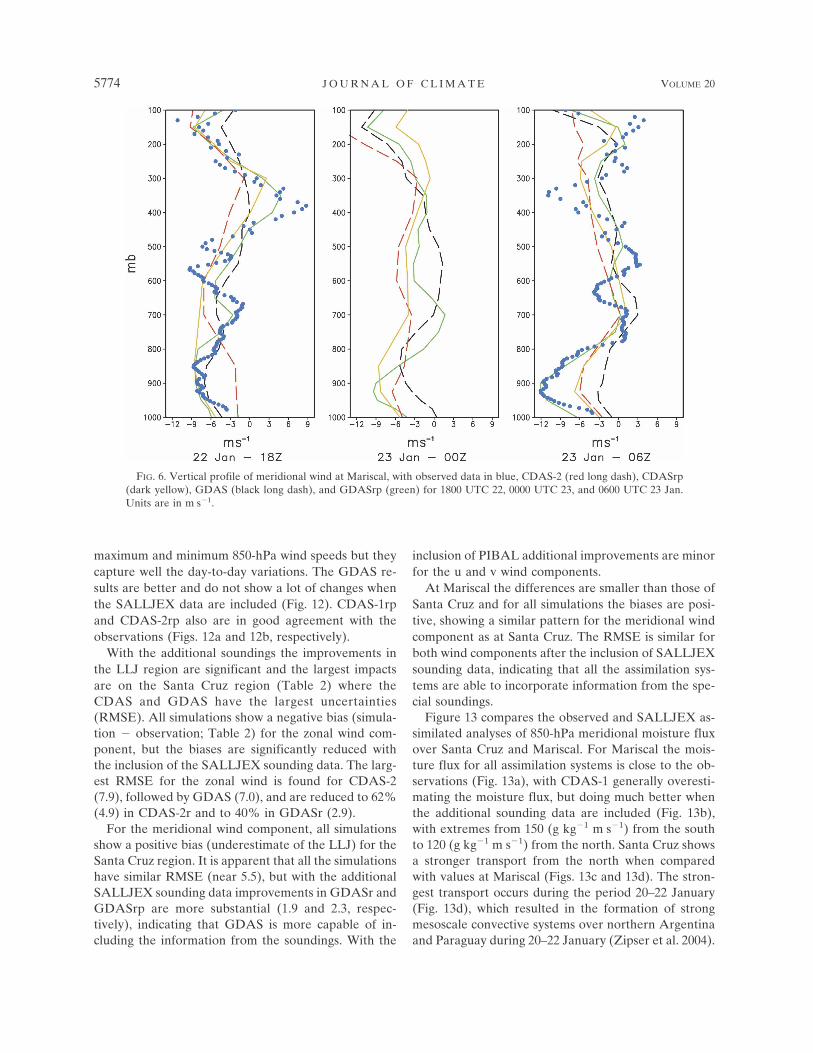
Figure 6 compares the vertical structure of the ob-served meridional wind (blue dots) at Mariscal (ap-proximately at 22°S, 60°W) with GDAS (black longdash), GDASrp (green), CDAS-2 (red long dash), andCDAS-2rp (dark yellow) for the period of 1800 UTC(22 January), 0000 UTC (23 January), and 0600 UTC(23 January). It is important to note that Mariscal op-erated as a rawinsonde station at 0600 and 1800 UTC.The GDASrp analyses show stronger low-level flownear 900 hPa in agreement with the observations and awell-defined LLJ at 0600 UTC. The strength of the
TABLE 1. (Continued)
Date
Stations
Mariscal Santa Cruz Dourados Rio Branco Santiago Resistencia
UTC UTC UTC UTC UTC UTC
00 06 12 18 00 06 12 18 00 06 12 18 00 06 12 18 00 06 12 18 00 06 12 18
February (Continued)3 2003 x x x x x x x x4 2003 x x x x x x x x x x x5 2003 x x x x x x x x x x6 2003 x x x x x x x x x x7 2003 x x x x x x x x x x x x8 2003 x x x x x x x x x x x x9 2003 x x x x x x x x x x x
10 2003 x x x x x x x x11 2003 x x x x x x x12 2003 x x x x x x x x13 2003 x x x x x x x x14 2003 x x x x x
1 DECEMBER 2007 H E R D I E S E T A L . 5769
low-level flow is much weaker in GDAS, CDAS-2, andCDAS-2rp. The state-of-the-art GDAS seems to bebetter at assimilating the SALLJEX data, thereby im-proving the representation of the LLJ in GDASrp. Thelow-resolution CDAS is not able to take advantage ofthe additional sounding data to improve the low-level
circulation features. Furthermore, the low-resolutionCDAS is not able to adequately resolve the topography(Andes Mountains), which also can affect the intensityand position of the LLJ (Anderson and Arritt 2001).
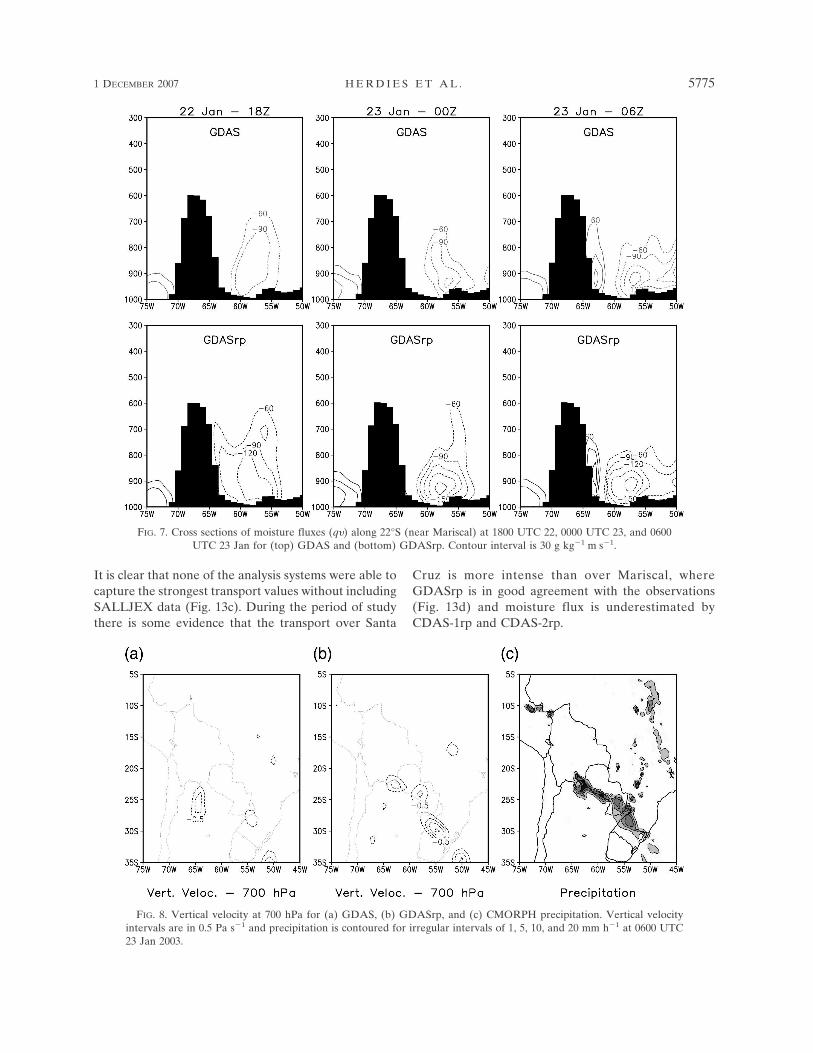
The moisture fluxes in GDASrp are noticeably stron-ger (on the order of 30 gm kg�1 m s�1) than those in the
FIG. 2. Mean low-level wind (vector) and wind speed (shaded) at 850 hPa during 15 Jan–14 Feb 2003: (a)CDAS-1, (b) CDAS-2, (c) GDAS, (d) CDAS-1rp, (e) CDAS-2rp, and (f) GDASrp. Values are in m s�1.
5770 J O U R N A L O F C L I M A T E VOLUME 20
Fig 2 live 4/C
control run (GDAS) at all three times (Fig. 7). There isalso a slight westward shift in the maximum flux in theGDASrp analyses. This shift is accompanied by stron-ger upward motion in GDASrp (Fig. 8, cf. left and
middle panels), which corresponds well with the pat-tern of precipitation (Fig. 8, right panel) taken from theClimate Prediction Center (CPC) morphing technique(CMORPH) analyses (Joyce et al. 2004). The CDAS
FIG. 3. Mean meridional wind profile composite for control runs (red), including only rawinsonde (blue) andrawinsonde and pilot balloon (yellow) at the grid point nearest Santa Cruz, Bolivia, during 15 Jan–14 Feb 2003.Results from GDAS for (a) 00, (b) 06, (c) 12, and (d), and 18 h UTC; from CDAS-1 for (e) 00, (f) 06, (g) 12, and(h) 18 h UTC; and from CDAS-2 for (i) 00, (j) 06, (k) 12, and (l) 18 h UTC. Units are in m s�1.
1 DECEMBER 2007 H E R D I E S E T A L . 5771
Fig 3 live 4/C
analyses (with and without SALLJEX data) were notable to capture the circulation features (moisture fluxand vertical motion) associated with the intense MCC(figure not shown).
4. Comparison with observations
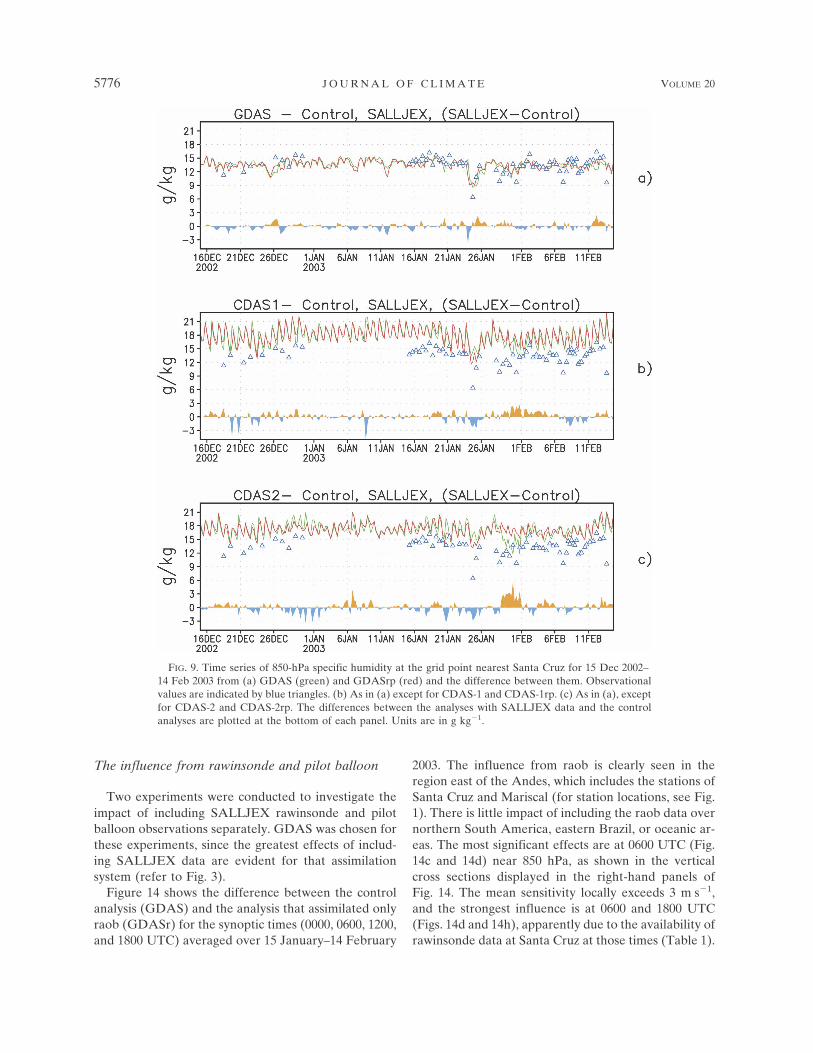
A comparison between the observed 850-hPa specifichumidity at Santa Cruz (see Fig. 1 for station location)with the analyses from GDAS, CDAS-1, and CDAS-2,shows that GDASrp fits well with the raob data (cf.blue triangles with red curve in Fig. 9a), even betterthan the operational GDAS (green curve in Fig. 9a).Both the operational GDAS and GDASrp capture wellthe features associated with a strong southerly jet,which occurred during the dry period 23–24 January. Ingeneral, the differences between GDAS and GDASrpare less than 2 g kg�1.
The biggest differences between the observationsand the analyses occur in CDAS-1 and CDAS-2 (Figs.
9b,c). CDAS-1 shows a much stronger diurnal cyclethan that shown in the observations. There is also apositive bias in the specific humidity with values greaterthan 20 g kg�1, as compared to 15 g kg�1 in the obser-vations (Fig. 9b). There is no significant impact on theCDAS-1 analyses when the SALLJEX dataset are in-cluded. Similar results are observed with CDAS-2, butthe diurnal cycle is not as strong as in CDAS-1 andCDAS-1rp.
Kalnay et al. (1996) classified the gridded fields intofour classes in accordance with the relative influence ofthe observational data and the model on the griddedvariable. Specific humidity is considered a class “B”variable, as the model has a very strong influence on itsanalysis value. Thus, one would expect that the moreadvanced GDAS with improved physics, higher resolu-tion, and improved data assimilation procedures wouldbetter capture specific humidity variations.
Figure 10 shows the 850-hPa meridional wind com-ponent for GDAS, GDASrp, CDAS-1, CDAS-1rp,CDAS-2, CDAS-2rp, and the observations. The largestdifferences occur after the middle of January and ex-tend until the end of the month (Fig. 10a), which is theperiod having the highest number of raob observations(Table 1). GDASrp agrees very well with the raob dataand captures the maximum and minimum (Fig. 10a)associated with the southerly and northerly low-leveljet, respectively. In general the control run, GDAS, un-derestimates the magnitude of the meridional wind.
Both CDAS-1 and CDAS-2 (Figs. 10b and 10c) areunable to capture the extreme values (maximum andminimum) of the 850-hPa meridional wind at the gridpoint nearest to Santa Cruz. For the CDAS-1rp andCDAS-2rp the differences are small and the meridionalwinds are generally underestimated. The worst case isassociated with the strong, southerly low-level flowduring 23–24 January. The observed values are close to20 m s�1, and for CDAS-1 and CDAS-2 the maximumvalues are 5 and 3 m s�1, respectively. For CDAS-1rpand CDAS-2rp the values are a little closer to the ob-served values, 9 and 10 m s�1, respectively.
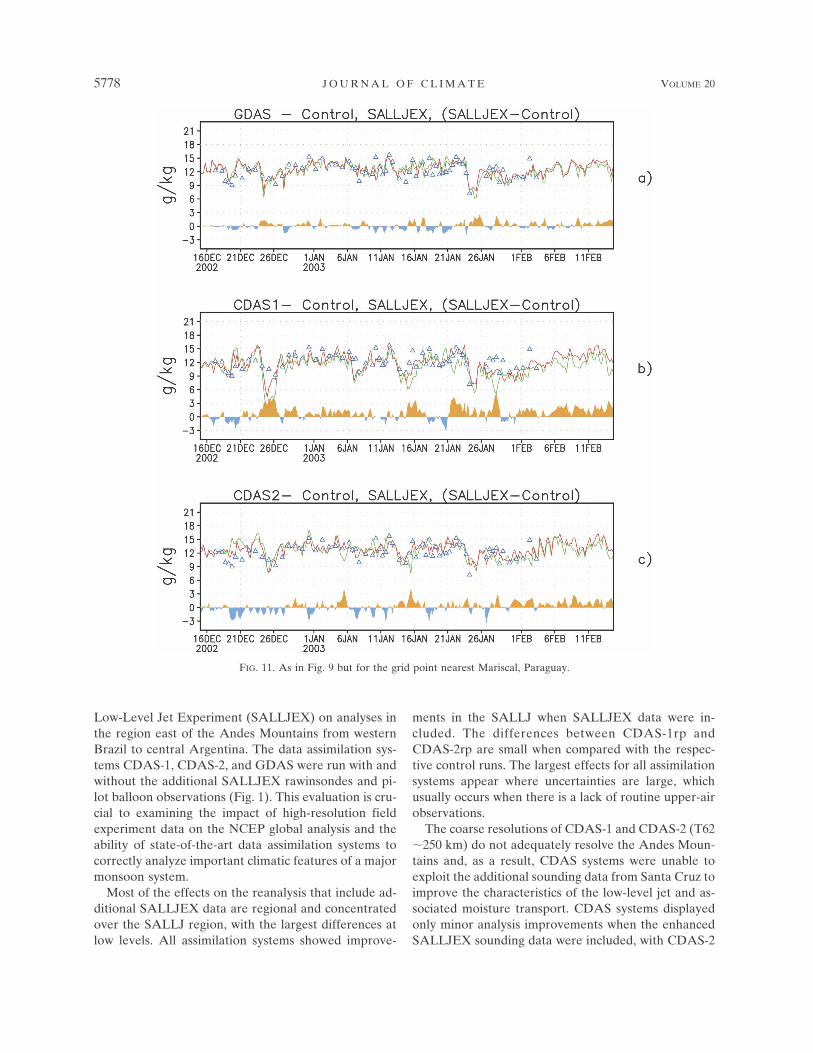
The specific humidity results for Mariscal in northernParaguay (Fig. 11) are better than for Santa Cruz(Fig. 9) in all assimilation systems (GDAS, CDAS-1,and CDAS-2: green lines in Figs. 11a, 11b, and 11c,respectively). The results are much better when theSALLJEX data are included and are close to the ob-served values (red lines in Figs. 11a–c). The better re-sults from CDAS over Mariscal (see Fig. 1 for stationlocation) is probably due to this station being locatedfarther away from the Andes, which reduces the effectsof model topography on the low-level flow.
FIG. 4. Mean low-level meridional wind at 18°S, 62°W for (a)GDAS (red), GDASr (blue), GDASp (yellow), and GDASrp(green) at 900 hPa; (b) CDAS-1 (red), CDASr (blue), and CDAS-1rp (green) at 850 hPa; and (c) CDAS-2 (red), CDAS-2r (blue),and CDAS-2rp (green) at 850 hPa. Units are in m s�1.
5772 J O U R N A L O F C L I M A T E VOLUME 20
Fig 4 live 4/C
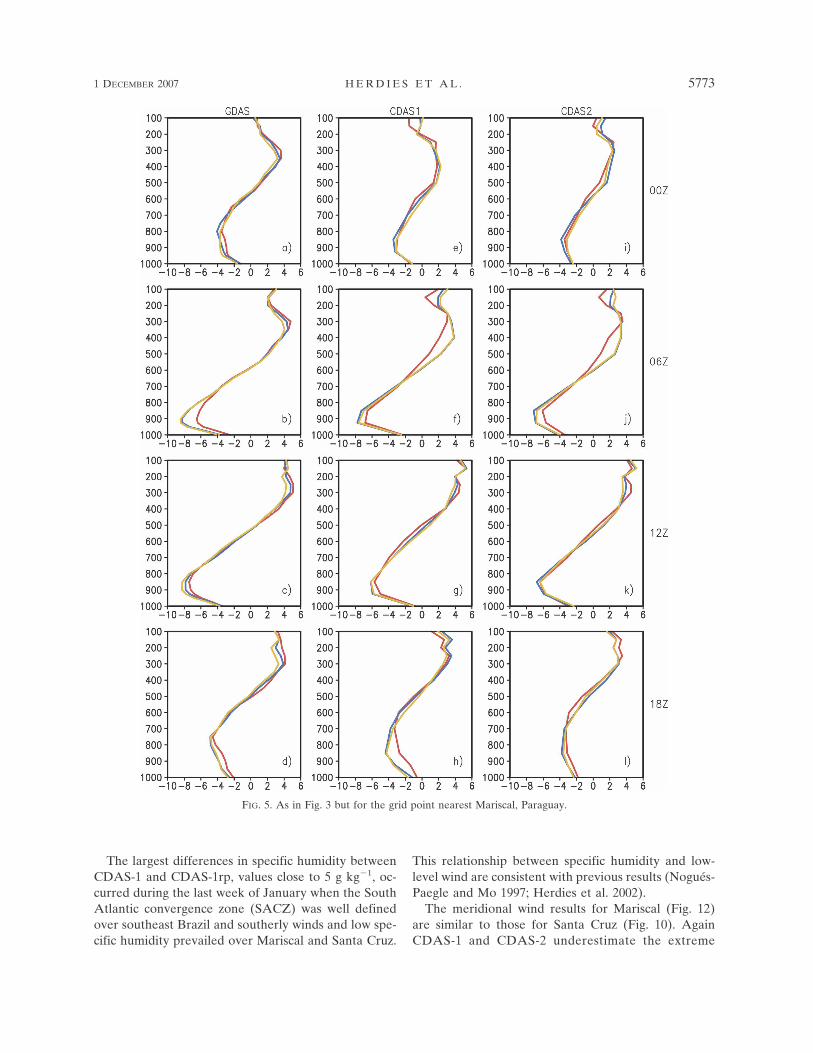
The largest differences in specific humidity betweenCDAS-1 and CDAS-1rp, values close to 5 g kg�1, oc-curred during the last week of January when the SouthAtlantic convergence zone (SACZ) was well definedover southeast Brazil and southerly winds and low spe-cific humidity prevailed over Mariscal and Santa Cruz.
This relationship between specific humidity and low-level wind are consistent with previous results (Nogués-Paegle and Mo 1997; Herdies et al. 2002).
The meridional wind results for Mariscal (Fig. 12)are similar to those for Santa Cruz (Fig. 10). AgainCDAS-1 and CDAS-2 underestimate the extreme
FIG. 5. As in Fig. 3 but for the grid point nearest Mariscal, Paraguay.
1 DECEMBER 2007 H E R D I E S E T A L . 5773
Fig 5 live 4/C
maximum and minimum 850-hPa wind speeds but theycapture well the day-to-day variations. The GDAS re-sults are better and do not show a lot of changes whenthe SALLJEX data are included (Fig. 12). CDAS-1rpand CDAS-2rp also are in good agreement with theobservations (Figs. 12a and 12b, respectively).
With the additional soundings the improvements inthe LLJ region are significant and the largest impactsare on the Santa Cruz region (Table 2) where theCDAS and GDAS have the largest uncertainties(RMSE). All simulations show a negative bias (simula-tion � observation; Table 2) for the zonal wind com-ponent, but the biases are significantly reduced withthe inclusion of the SALLJEX sounding data. The larg-est RMSE for the zonal wind is found for CDAS-2(7.9), followed by GDAS (7.0), and are reduced to 62%(4.9) in CDAS-2r and to 40% in GDASr (2.9).
For the meridional wind component, all simulationsshow a positive bias (underestimate of the LLJ) for theSanta Cruz region. It is apparent that all the simulationshave similar RMSE (near 5.5), but with the additionalSALLJEX sounding data improvements in GDASr andGDASrp are more substantial (1.9 and 2.3, respec-tively), indicating that GDAS is more capable of in-cluding the information from the soundings. With the
inclusion of PIBAL additional improvements are minorfor the u and v wind components.
At Mariscal the differences are smaller than those ofSanta Cruz and for all simulations the biases are posi-tive, showing a similar pattern for the meridional windcomponent as at Santa Cruz. The RMSE is similar forboth wind components after the inclusion of SALLJEXsounding data, indicating that all the assimilation sys-tems are able to incorporate information from the spe-cial soundings.
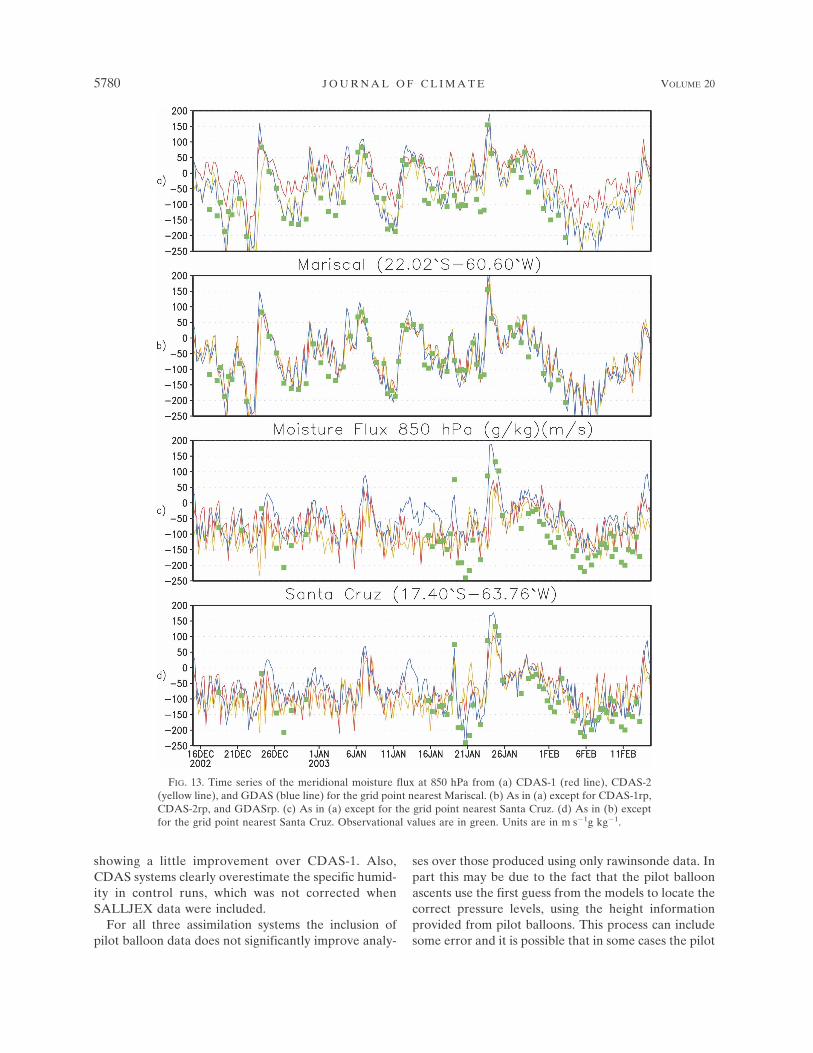
Figure 13 compares the observed and SALLJEX as-similated analyses of 850-hPa meridional moisture fluxover Santa Cruz and Mariscal. For Mariscal the mois-ture flux for all assimilation systems is close to the ob-servations (Fig. 13a), with CDAS-1 generally overesti-mating the moisture flux, but doing much better whenthe additional sounding data are included (Fig. 13b),with extremes from 150 (g kg�1 m s�1) from the southto 120 (g kg�1 m s�1) from the north. Santa Cruz showsa stronger transport from the north when comparedwith values at Mariscal (Figs. 13c and 13d). The stron-gest transport occurs during the period 20–22 January(Fig. 13d), which resulted in the formation of strongmesoscale convective systems over northern Argentinaand Paraguay during 20–22 January (Zipser et al. 2004).
FIG. 6. Vertical profile of meridional wind at Mariscal, with observed data in blue, CDAS-2 (red long dash), CDASrp(dark yellow), GDAS (black long dash), and GDASrp (green) for 1800 UTC 22, 0000 UTC 23, and 0600 UTC 23 Jan.Units are in m s�1.
5774 J O U R N A L O F C L I M A T E VOLUME 20
Fig 6 live 4/C
It is clear that none of the analysis systems were able tocapture the strongest transport values without includingSALLJEX data (Fig. 13c). During the period of studythere is some evidence that the transport over Santa
Cruz is more intense than over Mariscal, whereGDASrp is in good agreement with the observations(Fig. 13d) and moisture flux is underestimated byCDAS-1rp and CDAS-2rp.
FIG. 7. Cross sections of moisture fluxes (q�) along 22°S (near Mariscal) at 1800 UTC 22, 0000 UTC 23, and 0600UTC 23 Jan for (top) GDAS and (bottom) GDASrp. Contour interval is 30 g kg�1 m s�1.
FIG. 8. Vertical velocity at 700 hPa for (a) GDAS, (b) GDASrp, and (c) CMORPH precipitation. Vertical velocityintervals are in 0.5 Pa s�1 and precipitation is contoured for irregular intervals of 1, 5, 10, and 20 mm h�1 at 0600 UTC23 Jan 2003.
1 DECEMBER 2007 H E R D I E S E T A L . 5775
The influence from rawinsonde and pilot balloon
Two experiments were conducted to investigate theimpact of including SALLJEX rawinsonde and pilotballoon observations separately. GDAS was chosen forthese experiments, since the greatest effects of includ-ing SALLJEX data are evident for that assimilationsystem (refer to Fig. 3).
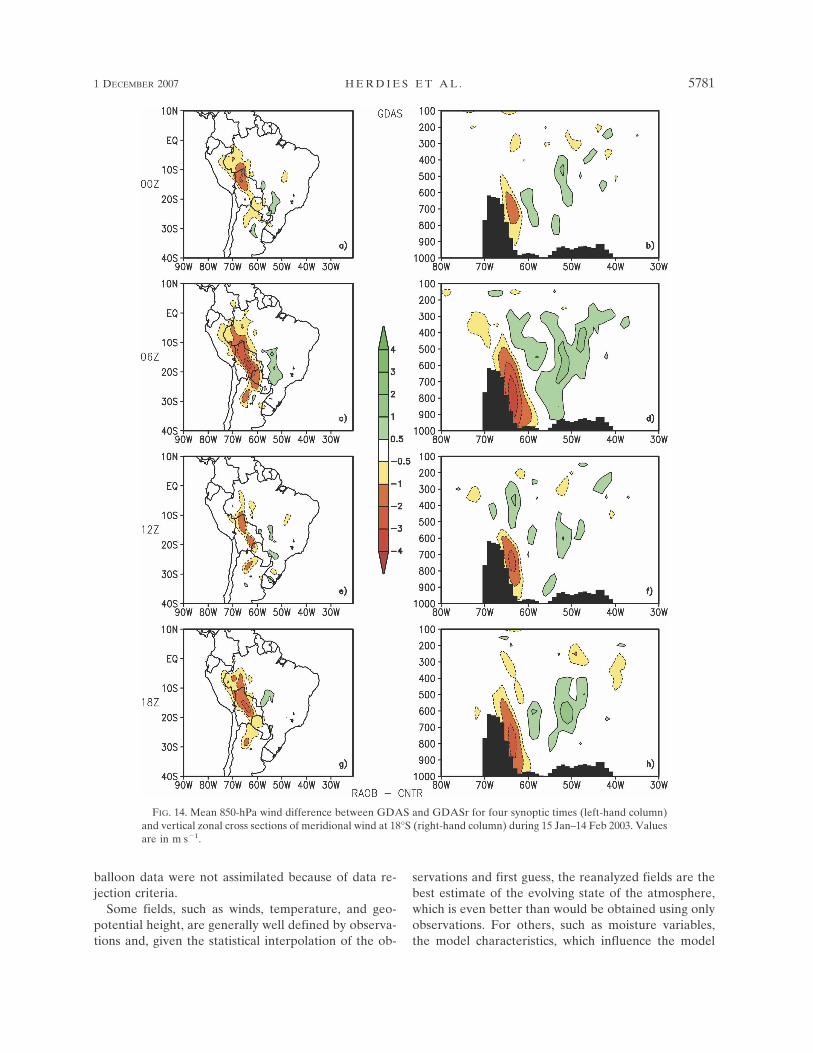
Figure 14 shows the difference between the controlanalysis (GDAS) and the analysis that assimilated onlyraob (GDASr) for the synoptic times (0000, 0600, 1200,and 1800 UTC) averaged over 15 January–14 February
2003. The influence from raob is clearly seen in theregion east of the Andes, which includes the stations ofSanta Cruz and Mariscal (for station locations, see Fig.1). There is little impact of including the raob data overnorthern South America, eastern Brazil, or oceanic ar-eas. The most significant effects are at 0600 UTC (Fig.14c and 14d) near 850 hPa, as shown in the verticalcross sections displayed in the right-hand panels ofFig. 14. The mean sensitivity locally exceeds 3 m s�1,and the strongest influence is at 0600 and 1800 UTC(Figs. 14d and 14h), apparently due to the availability ofrawinsonde data at Santa Cruz at those times (Table 1).
FIG. 9. Time series of 850-hPa specific humidity at the grid point nearest Santa Cruz for 15 Dec 2002–14 Feb 2003 from (a) GDAS (green) and GDASrp (red) and the difference between them. Observationalvalues are indicated by blue triangles. (b) As in (a) except for CDAS-1 and CDAS-1rp. (c) As in (a), exceptfor CDAS-2 and CDAS-2rp. The differences between the analyses with SALLJEX data and the controlanalyses are plotted at the bottom of each panel. Units are in g kg�1.
5776 J O U R N A L O F C L I M A T E VOLUME 20
Fig 9 live 4/C
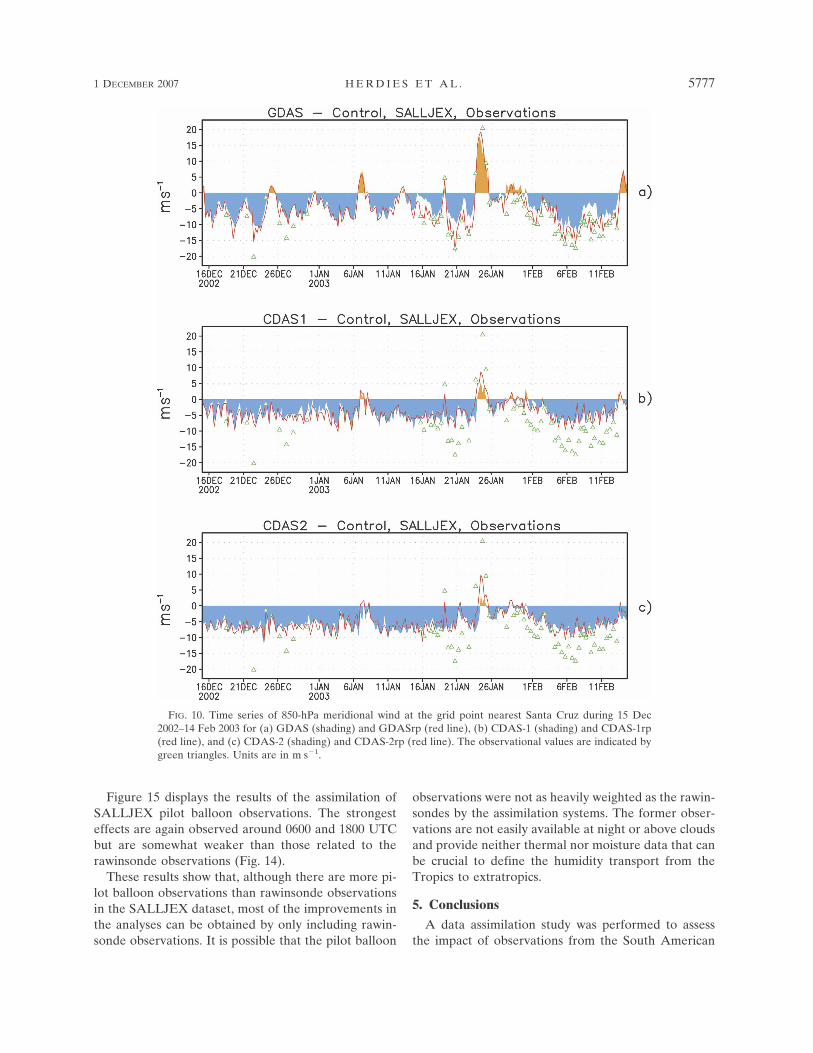
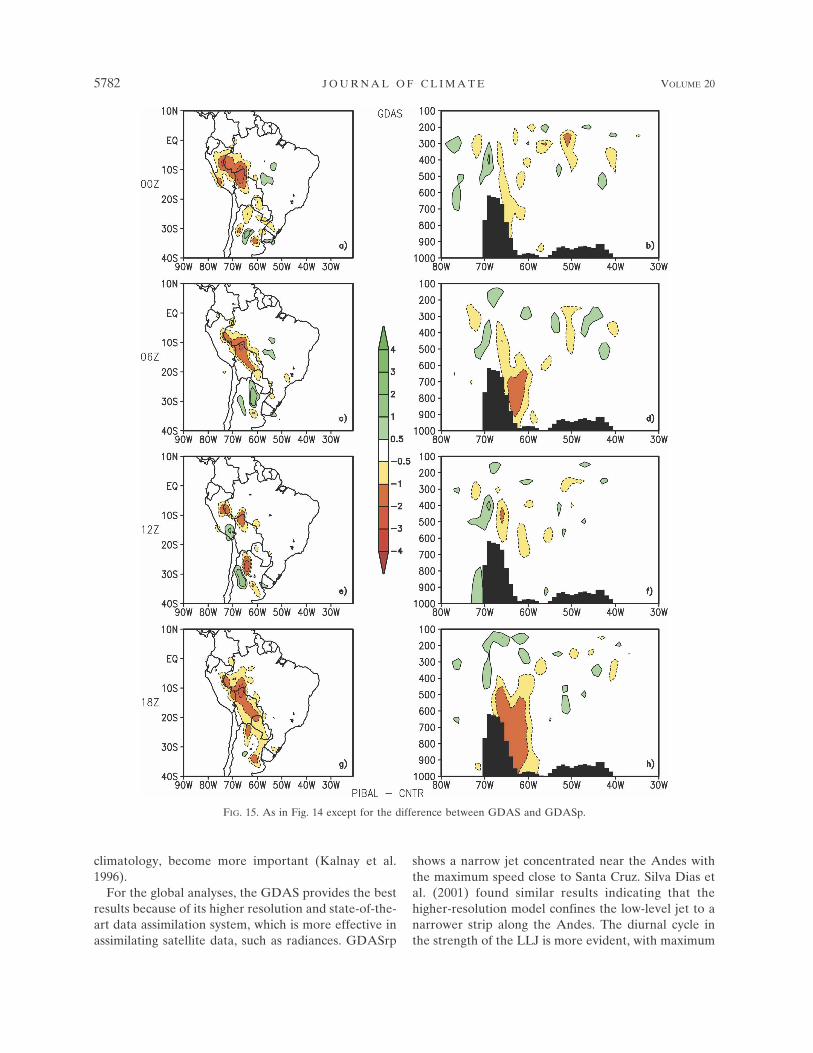
Figure 15 displays the results of the assimilation ofSALLJEX pilot balloon observations. The strongesteffects are again observed around 0600 and 1800 UTCbut are somewhat weaker than those related to therawinsonde observations (Fig. 14).
These results show that, although there are more pi-lot balloon observations than rawinsonde observationsin the SALLJEX dataset, most of the improvements inthe analyses can be obtained by only including rawin-sonde observations. It is possible that the pilot balloon
observations were not as heavily weighted as the rawin-sondes by the assimilation systems. The former obser-vations are not easily available at night or above cloudsand provide neither thermal nor moisture data that canbe crucial to define the humidity transport from theTropics to extratropics.
5. ConclusionsA data assimilation study was performed to assess
the impact of observations from the South American
FIG. 10. Time series of 850-hPa meridional wind at the grid point nearest Santa Cruz during 15 Dec2002–14 Feb 2003 for (a) GDAS (shading) and GDASrp (red line), (b) CDAS-1 (shading) and CDAS-1rp(red line), and (c) CDAS-2 (shading) and CDAS-2rp (red line). The observational values are indicated bygreen triangles. Units are in m s�1.
1 DECEMBER 2007 H E R D I E S E T A L . 5777
Fig 10 live 4/C
Low-Level Jet Experiment (SALLJEX) on analyses inthe region east of the Andes Mountains from westernBrazil to central Argentina. The data assimilation sys-tems CDAS-1, CDAS-2, and GDAS were run with andwithout the additional SALLJEX rawinsondes and pi-lot balloon observations (Fig. 1). This evaluation is cru-cial to examining the impact of high-resolution fieldexperiment data on the NCEP global analysis and theability of state-of-the-art data assimilation systems tocorrectly analyze important climatic features of a majormonsoon system.
Most of the effects on the reanalysis that include ad-ditional SALLJEX data are regional and concentratedover the SALLJ region, with the largest differences atlow levels. All assimilation systems showed improve-
ments in the SALLJ when SALLJEX data were in-cluded. The differences between CDAS-1rp andCDAS-2rp are small when compared with the respec-tive control runs. The largest effects for all assimilationsystems appear where uncertainties are large, whichusually occurs when there is a lack of routine upper-airobservations.
The coarse resolutions of CDAS-1 and CDAS-2 (T62�250 km) do not adequately resolve the Andes Moun-tains and, as a result, CDAS systems were unable toexploit the additional sounding data from Santa Cruz toimprove the characteristics of the low-level jet and as-sociated moisture transport. CDAS systems displayedonly minor analysis improvements when the enhancedSALLJEX sounding data were included, with CDAS-2
FIG. 11. As in Fig. 9 but for the grid point nearest Mariscal, Paraguay.
5778 J O U R N A L O F C L I M A T E VOLUME 20
Fig 11 live 4/C
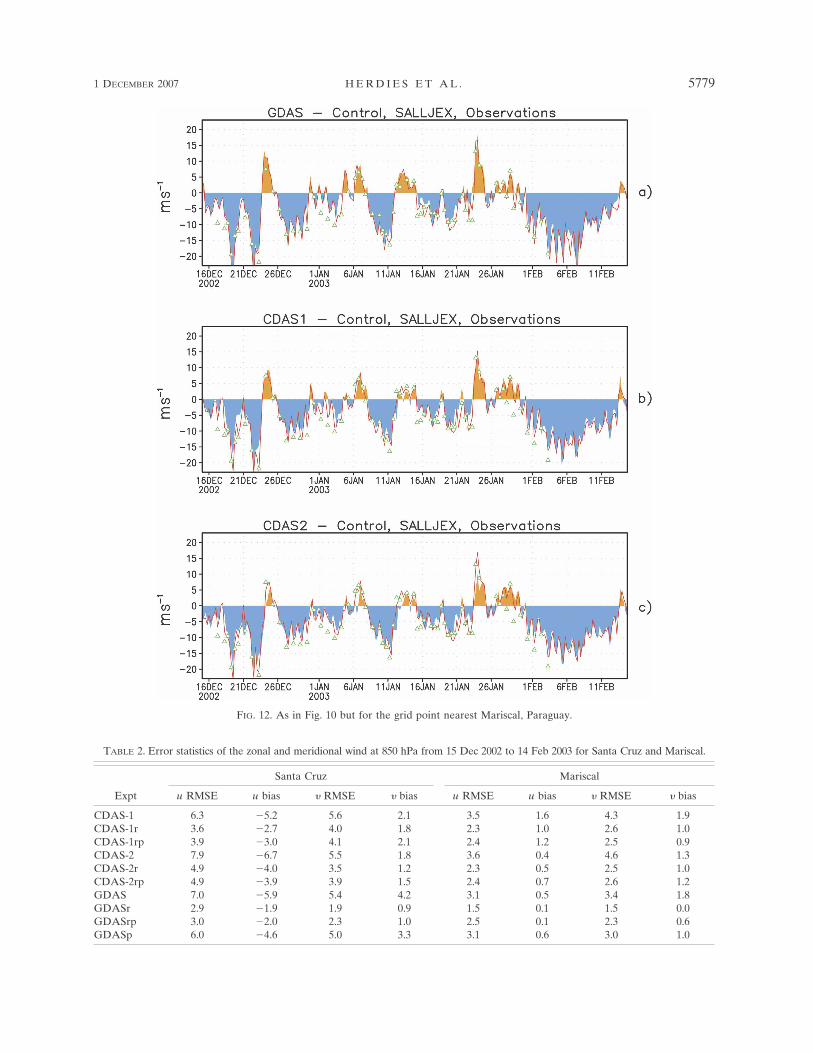
FIG. 12. As in Fig. 10 but for the grid point nearest Mariscal, Paraguay.
TABLE 2. Error statistics of the zonal and meridional wind at 850 hPa from 15 Dec 2002 to 14 Feb 2003 for Santa Cruz and Mariscal.
Expt
Santa Cruz Mariscal
u RMSE u bias � RMSE � bias u RMSE u bias � RMSE � bias
CDAS-1 6.3 �5.2 5.6 2.1 3.5 1.6 4.3 1.9CDAS-1r 3.6 �2.7 4.0 1.8 2.3 1.0 2.6 1.0CDAS-1rp 3.9 �3.0 4.1 2.1 2.4 1.2 2.5 0.9CDAS-2 7.9 �6.7 5.5 1.8 3.6 0.4 4.6 1.3CDAS-2r 4.9 �4.0 3.5 1.2 2.3 0.5 2.5 1.0CDAS-2rp 4.9 �3.9 3.9 1.5 2.4 0.7 2.6 1.2GDAS 7.0 �5.9 5.4 4.2 3.1 0.5 3.4 1.8GDASr 2.9 �1.9 1.9 0.9 1.5 0.1 1.5 0.0GDASrp 3.0 �2.0 2.3 1.0 2.5 0.1 2.3 0.6GDASp 6.0 �4.6 5.0 3.3 3.1 0.6 3.0 1.0
1 DECEMBER 2007 H E R D I E S E T A L . 5779
Fig 12 live 4/C
showing a little improvement over CDAS-1. Also,CDAS systems clearly overestimate the specific humid-ity in control runs, which was not corrected whenSALLJEX data were included.
For all three assimilation systems the inclusion ofpilot balloon data does not significantly improve analy-
ses over those produced using only rawinsonde data. Inpart this may be due to the fact that the pilot balloonascents use the first guess from the models to locate thecorrect pressure levels, using the height informationprovided from pilot balloons. This process can includesome error and it is possible that in some cases the pilot
FIG. 13. Time series of the meridional moisture flux at 850 hPa from (a) CDAS-1 (red line), CDAS-2(yellow line), and GDAS (blue line) for the grid point nearest Mariscal. (b) As in (a) except for CDAS-1rp,CDAS-2rp, and GDASrp. (c) As in (a) except for the grid point nearest Santa Cruz. (d) As in (b) exceptfor the grid point nearest Santa Cruz. Observational values are in green. Units are in m s�1g kg�1.
5780 J O U R N A L O F C L I M A T E VOLUME 20
Fig 13 live 4/C
balloon data were not assimilated because of data re-jection criteria.
Some fields, such as winds, temperature, and geo-potential height, are generally well defined by observa-tions and, given the statistical interpolation of the ob-
servations and first guess, the reanalyzed fields are thebest estimate of the evolving state of the atmosphere,which is even better than would be obtained using onlyobservations. For others, such as moisture variables,the model characteristics, which influence the model
FIG. 14. Mean 850-hPa wind difference between GDAS and GDASr for four synoptic times (left-hand column)and vertical zonal cross sections of meridional wind at 18°S (right-hand column) during 15 Jan–14 Feb 2003. Valuesare in m s�1.
1 DECEMBER 2007 H E R D I E S E T A L . 5781
Fig 14 live 4/C
climatology, become more important (Kalnay et al.1996).
For the global analyses, the GDAS provides the bestresults because of its higher resolution and state-of-the-art data assimilation system, which is more effective inassimilating satellite data, such as radiances. GDASrp
shows a narrow jet concentrated near the Andes withthe maximum speed close to Santa Cruz. Silva Dias etal. (2001) found similar results indicating that thehigher-resolution model confines the low-level jet to anarrower strip along the Andes. The diurnal cycle inthe strength of the LLJ is more evident, with maximum
FIG. 15. As in Fig. 14 except for the difference between GDAS and GDASp.
5782 J O U R N A L O F C L I M A T E VOLUME 20
Fig 15 live 4/C
strength at 0600 UTC near 900 hPa in GDAS and 850hPa in CDAS.
The data impact results for Mariscal in northernParaguay show considerable improvement in the windand humidity analyses, especially for CDAS. The betterresults for CDAS-1 and CDAS-2 at Mariscal are prob-ably due to the greater distance of that site from theAndes, which minimizes the effects of the model topog-raphy. The significant reduction of rms errors at SantaCruz and Mariscal show the ability of the GDAS toassimilate additional sounding data into the analysis.
The results show that, although there are more pilotballoon observations than rawinsonde observations inthe SALLJEX dataset, most of the improvements inthe analyses can be obtained by only including rawin-sonde observations.
The reanalysis dataset produced in this study usingthe information from SALLJEX has the potential toprovide the best possible information to be used forfuture studies at SALLJ region and can be used for thedesign of observing systems in the region. This paperpoints out the importance of regular observations fromthe region of Santa Cruz to properly depict the positionand intensity of the SALLJ.
All of the datasets used in this study are available atthe Joint Office for Science Support/University Corpo-ration for Atmospheric Research (JOSS/UCAR) fordistribution and use in additional validation/evaluationstudies in the future.
Acknowledgments. The authors wish to acknowledgeDennis Keyser for his excellent support in incorporat-ing the SALLJEX data into the assimilation systemsand the efforts of the anonymous reviewers and theassociate editor who greatly helped improve the manu-script. The first author wishes to acknowledge thesupport of the Earth System Science Interdisciplin-ary Center (ESSIC) and NCEP for providing the nec-essary conditions to develop this study and to fundingagencies from Brazil (CNPq Grant 481400/2004-04 andCAPES Grant 3219-04-6). SALLJEX was funded byNOAA/OGP, NSF (ATM0106776), and funding agen-cies from Brazil (FAPESP Grant 01/13816-1) and Ar-gentina (ANPCYT 07-06671, UBA 055). This work waspartially supported by the NOAA Office of Global Pro-
grams Pan American Climate Studies (PACS) underCooperative Agreement NA17EC1483 with the Uni-versity of Maryland Cooperative Institute for ClimateScience (CICS).
REFERENCES
Anderson, C. J., and R. W. Arritt, 2001: Representation of sum-mertime low-level jets in the central United States by theNCEP–NCAR reanalysis. J. Climate, 14, 234–247.
Berbery, E. H., and E. A. Collini, 2000: Springtime precipitationand water vapor flux over southeastern South America. Mon.Wea. Rev., 128, 1328–1346.
Herdies, D. L., A. da Silva, M. A. F. Silva Dias, and R. NietoFerreira, 2002: Moisture budget of the bimodal pattern of thesummer circulation over South America. J. Geophys. Res.,107, 8075, doi:10.1029/2001JD000997.
Joyce, R. J., J. E. Janowiak, P. A. Arkin, and P. Xie, 2004:CMORPH: A method that produces global precipitation es-timates from passive microwave and infrared data at highspatial and temporal resolution. J. Hydrometeor., 5, 487–503.
Kalnay, E., and Coauthors, 1996: The NCEP/NCAR 40-Year Re-analysis Project. Bull. Amer. Meteor. Soc., 77, 437–471.
Kanamitsu, M., W. Ebisuzaki, J. Woollen, S.-K. Yang, J. J. Hnilo,M. Fiorino, and G. L. Potter, 2002: NCEP–DOE AMIP-IIReanalysis (R-2). Bull. Amer. Meteor. Soc., 83, 1631–1643.
Marengo, J. A., W. R. Soares, C. Saulo, and M. Nicolini, 2004:Climatology of the low-level jet east of the Andes as derivedfrom the NCEP–NCAR reanalyses: Characteristics and tem-poral variability. J. Climate, 17, 2261–2280.
Nogués-Paegle, J., and K. C. Mo, 1997: Alternating wet and dryconditions over South America during summer. Mon. Wea.Rev., 125, 279–291.
Salio, P., M. Nicolini, and A. C. Saulo, 2002: Chaco low-level jetevents characterization during the austral summer season. J.Geophys. Res., 107, 4816, doi:10.1029/2001JD001315.
Silva Dias, P. L., D. Moreira, and M. A. F. Silva Dias, 2001:Downscaling resolution and the moisture budget of the Platabasin. Proc. IX Congreso Latinoamericano e Iberico deMeteorologia y Congreso Argentino de Meteorologia, LaMeteorologia y el Medio Ambiente en el Siglo XXI, BuenosAires, Argentina, Centro Argentino de Meteorológos, CD-ROM, 8.C.27-341.
Vera, C., and Coauthors, 2006: The South American low-level jetexperiment. Bull. Amer. Meteor. Soc., 87, 63–77.
Wang, H., and R. Fu, 2004: Influence of cross-Andes flow on theSouth American low-level jet. J. Climate, 17, 1247–1262.
Zipser, E., P. Salio, and M. Nicolini, 2004: Mesoscale convectivesystems activity during SALLJEX and the relationship withSALLJ events. CLIVAR Exchanges, Vol. 9, No. 1, Interna-tional CLIVAR Project Office, Southampton, United King-dom, 14–18.
1 DECEMBER 2007 H E R D I E S E T A L . 5783