NCAR-TN/IA-111 Data Sets for Meteorological Research
206
NCAR-TN/IA-1 11 NCAR TECHNICAL NOTE U. July 1975 Data Sets for Meteorological Research Roy L. Jenne ATMOSPHERIC TECHNOLOGY DIVISION NATIONAL CENTER FOR ATMOSPHERIC RESEARCH BOULDER, COLORADO a II ~~~-C -- -- ~~~~~-C- ~~~~-- I
-
Upload
khangminh22 -
Category
Documents
-
view
1 -
download
0
Transcript of NCAR-TN/IA-111 Data Sets for Meteorological Research
NCAR-TN/IA-1 11NCAR TECHNICAL NOTE
U.
July 1975
Data Sets for Meteorological Research
Roy L. Jenne
ATMOSPHERIC TECHNOLOGY DIVISION
NATIONAL CENTER FOR ATMOSPHERIC RESEARCHBOULDER, COLORADO
a II ~~~-C -- -- ~~~~~-C- ~~~~-- I

I
iii
FOREWORD
Primary emphasis is given to describing the data sets that are available
for meteorological research. Some of the main sets for physical oceanography are
also included. Conventional instrumental data and satellite data are discussed;
the proxy data such as tree rings and pollen receive only limited attention. We
have attempted to refer to the major sets of data held within the United States.
Many of the data sets give global coverage. Most of the data sets listed are
stored in such a way that they can be read by computers.

I

v
ACKNOWLEDGEMENTS
I would especially like to acknowledge the many people in different organi-
zations who have shared their knowledge about the various data sets. The time
taken by several of these organizations to help prepare the information about their
data and to proofread the completed chapters is appreciated very much.
J. Fletcher (Office of Polar Programs-NSF, then NOAA Environmental Research
Labs) and Uwe Radok (NSF) encouraged the expansion of the scope of this work and
its early completion to help with some of the aspects of establishing national
climate programs. Close contact has also been maintained with W. Sprigg of the
NOAA office that is responsible for helping to draft the U.S. Climate Program
Plan.
In December 1974, working group II (organized under the Office of Climate
Dynamics, NSF, and with NOAA input) met at NCAR to consider the assembly of
conventional data. I am very indebted to the other members of this group for
portions of the information in this Technical Note. Members were:
Maj. William Buchan - USAF ETAC (Environmental Technical Applications
Center, Washington, D.C.)
James Churgin - NODC (National Oceanographic Data Center,
Washington, D.C.)
Richard Davis - NCC (National Climatic Center, Asheville, N.C.)
Tadepalli Murty - Ocean and Aquatic Affairs, Dept. of the Environment,
Ottawa.
Richard Wert - NORPAX, Northern Pacific Ocean Experiment, Scripps
Institution of Oceanography, California.
James Zuver - FNWC, Navy Fleet Numerical Weather Central, Monterey,
California.
Roy Jenne - NCAR, Chairman.
W. Buchan and Ralph Russell (ETAC operating location in Asheville) have
been extremely helpful in assembling and proofreading the material for the ETAC
chapter. James Churgin played a similar role for the NODC chapter. Richard
Davis and Vincent Hagarty of NCC spent a lot of time checking information and
answering questions. Robert Quayle and Frank Quinlan of NCC also fielded many

vi
questions. Tad Murty shared his wealth of knowledge about the availability of
oceanographic products. Richard Wert provided information about data preparation
being done at NORPAX, and J. Zuver helped in the preparation of the FNWC chapter.
I also wish to acknowledge the efforts of several other people in both
helping us to obtain data and answering questions: Arthur Bedient, James McDonell,
and Robert Gelhard of NMC; Thomas Gray and Charles Bristor of National Environmental
Satellite Service (NESS); Thomas Flattery of National Meteorological Center (NMC)
and USAF; James Vette and Leland Dubach of the National Space Science Data Center
(NSSDC).
I also wish to acknowledge the administrative-level support that the various
organizations have given: Thomas Austin and Arnold Hull of the NOAA Environmental
Data Service; William Haggard, NCC; Robert Ochinero, NODC; Col. Robert Gottuso,
ETAC; Capt. Conley Ward, FNWC; Francis Bretherton and G. Stuart Patterson, NCAR.
The typing of the manuscript by Ruby Fulk, Sara Ladd, Colleen Velie, Nancy
Wright, Billie Wheat, Dianne Bernier, and Mary Buck is appreciated very much.
The preparation of the information about the NCAR data sets has been aided
by Dennis Joseph, Paul Mulder, and Wilbur Spangler.
Other review and proofreading efforts have been very helpful: by Bram Oort,
J. M. Wallace, Jay Winston, Thomas Vonder Haar, and Hugh O'Neil.
Finally I wish to acknowledge the patience of Harold Crutcher, of NCC, who
has been waiting for the completion of a project to clean up the monthly mean
rawinsonde data. The project has been further delayed by the preparation of
this text.
vii
TABLE OF CONTENTSPAGE
FOREWORD IIIACKNOWLEDGEMENTS VTARLE SHOWING LOCATION OF INFORMATION XIIINTRODUCT ION1
CHAPTER 1. GENERAL INFORMATION ABOUT DATA SETS AT NCAR 51. DAILY GRID DATA2. AVERAGE GRIDS3. SYNOPTICALLY FILED UPPER AIR OBSERVED DATA4. TIME SERIES OF UPPER AIR OBSERVED DATA5. SYNOPTICALLY FILED SURFACE OBSERVED DATA6. MONTHLY MEAN SURFACE DATA7. MONTHLY MEAN RAWINSONDE DATA8. SATELLITE BRIGHTNESS DATA9. GEOGRAPHIC DATA
10. DATA HANDLING METHODS
CHAPTER 2. SELECTED DAILY GRIDS AT NCAR (PRESSURE, HEIGHT, TEMPERATURE) 131. SEA LEVEL PRESSURE GRIDS 1899-CURRENT2. SEA LEVEL PRESSURE AND SURFACE TEMPERATURE FROM AFGWC3. SEA LEVEL PRESSURE AND SURFACE AIR TEMPERATURE FROM MNC B-34. SEA LEVEL PRESSURE AND 700 MB HEIGHT AND TEMPERATURE5. 300 MB DATA FROM UNIVERSITY OF WISCONSIN6. 433L ESSPO PROJECT GRID DATA7. IGY NORTHERN HEMISPHERE STRATOSPHERIC DATA8. HEIGHT AND TEMPERATURE ANALYSES FROM AFGWC9. ANALYSES FROM NMC
10. WESTERN HEMISPHERE ANALYSES OF THE HIGH STRATOSPHERE11. SOUTHERN HEMISPHERE DAILY GRID DATA12. IGY SURFACE AND 500 MB DAILY TROPICAL GRID
CHAPTER 3. NMC. ANALYSIS DATA FROM THE NATIONAL METEOROLOGICAL CENTER 191. INTRODUCTION2. MAIN STACK OF N. HEM. HEIGHT AND TEMP GRIDS THRU DEC 72-3. VERTICAL MOTION DATA4. ANALYZED WINDS FROM NMC B-35. TROPICAL GRID DATA FROM NMC6. SELECTED N. HEM. GRIDS FROM NMC7. THE SELECTION OF NMC GRID DATA STARTING IN JAN 19738. NMC FORECASTS AVAILABLE AT NCAR (WRITTEN SEP 1973)9. GLOBAL ANALYSES FROM NMC
CHAPTER 4. CLOUD, HUMIDITY, RAIN. MOISTURE, AND WATER DATA 291. DEW POINT AND NEPH DATA FROM AFGWC2. LAYER HUMIDITY FROM NMC B-3 TAPES (AT NCAR)3. U.S. NAVY MOISTURE ANALYSES4. TROPICAL NEP ANALYSIS DATA5. CLOUD COVER BASED ON SATELLITE BRIGHTNESS DATA6 AVERAGE CLOUDS BASED ON SURFACE OBSERVATIONS7. DAILY STREAMFLOW DATA8. PRECIPITATION DATA FROM RADAR9. SOIL MOISTURE AND DROUGHT DATA

viii
CHAPTER 5. MISCELLANEOUS DATA SETS 331 GULF OF MEXICO OCEANOGRAPHIC AND ATMOSPHERIC DATA2. OZONE DATA3. EOLE FRENCH BALLOON DATA4. LINE ISLANDS EXPERIMENT5. AIRCRAFT DATA FOR GATE6. S.E. ASIA MESOSCALE UPPER AIR DATA7. WATER VAPOR SPECTRUM LINES8. STATION LIBRARY INFORMATION9. DATA FROM NATIONAL HAIL RESEARCH EXPERIMENT10l DATA AT THE NATIONAL SEVERE STORMS LABORATORY11. DATA AT THE ILLINOIS STATE WATER SURVEY
CHAPTER 6. ETAC. ENVIRONMENTAL DATA SETS AT USAFETAC 371. INTRODUCTION2. SURFACE DATA -- SYNOPTIC CODE AND AIRWAYS3. UPPER AIR DATA4. SATELLITE SOUNDINGS5. TDF 13 SURFACE SYNOPTIC DATA6. ANALYSES FROM AFGWC7. OTHER DATA SETS AT ETAC
CHAPTER 7. NCC. DATA AT THE NATIONAL CLIMATOLOGICAL CENTER 491. INTRODUCTION2. LISTINGS OF DATA HOLDINGS3. RAWINSONDE DATA4. WINDS ALOFT DATA5. ROCKETSONDE DATA AT NCC (JAN 1975)6. SURFACE SYNOPTIC OBSERVATIONS7. AIRWAYS DATA8. DAILY SURFACE DATA FOR UNITED STATES9. OTHER DAILY SURFACE OBSERVATIONS
10. RAINFALL DATA11. MISC. SETS OF SURFACE DATA12. SOLAR RADIATION13. DATA FROM BOMEX EXPERIMENT14. CYCLONE POSITIONS15. TOWER DATA - CEDAR HILL, TEXAS16. DATA SETS STORED ELSEWHERE THAT ARE RELATED TO NCC DATA17. OZONE SOUNDINGS FROM BALLOON ASCENTS18. COASTAL OBSERVING STATIONS19. ATMOSPHERIC TURBIDITY DATA20. DATA FROM GATE EXPERIMENT
CHAPTER 8. UPPER AIR OBSERVED DATA 63SECTION A. UPPER AIR OBSERVED DATA IN SYNOPTIC ORDER
1. FROM NMC2 FROM AFGWC3. AT FNWC4. NORTHERN HEMISPHERE FROM UNIVERSITY OF MISSOURI, MITT NCC5 AIRCRAFT DATA6 PRINTED UPPER AIR DATA ON MICROFILM
SFCTION B. UPPER AIR OBSERVED DATA IN TIME SERIES ORDER
ix
CHAPTER 9. SURFACE SYNOPTIC OBSERVED DATA
1. INTRODUCTION2. FILED IN SYNOPTIC SEQUENCE3. FILED IN TIME SERIES ORDER
CHAPTER 10. CLIMATOLOGICAL YR-MO SURFACE AND UA DATA, TREE RINGS
1* MONTHLY MEAN RAWINSONDE DATA
2. MONTHLY MEAN REPORTS FROM' SURFACE STATIONS
3. ATLAS OF MEAN SURFACE TEMPERATURE AND PRESSURE BY MONTHS 1881-1960
4. TREE RING DATA FOR WESTERN AMERICA
5. N. AMERICAN CLIMATE DATA TO 109000 YEARS
6. DATA BANK OF EARLY CLIMATOLOGICAL SOURCES
67
69
CHAPTER 11. GLOBAL CLIMATOLOGICAL GRID DATA 73
1. GLOBAL CLIMATOLOGY TO 100 MB
2. CLIMATOLOGICAL GRID DATA PREPARED BY RAND
3. STRATOSPHERIC CLIMATOLOGY
75CHAPTER 12. STRATOSPHERIC DATA
1. INTRODUCTION
2. IGY NORTHERN HEMISPHERE STRATOSPHERIC DATA
3. HEIGHT AND TEMPERATURE ANALYSES FROM AFGWC (AIR FORCE)
4. DAILY HEIGHT AND TEMPERATURE ANALYSES FROM NMC
5. DAILY HEIGHT AND TEMPERATURE ANALYSES PREPARED IN GERMANY.
6. WEEKLY CONSTANT PRESSURE GRIDS AT 59 29 AND .4 MB
7. STRATOSPHERIC ANALYSES FROM GERMANY
8. STRATOSPHERIC CLIMATOLOGY9. RAWINSONDE DATA
10. MONTHLY THICKNESS DATA FROM SATELLITES AT NCAR
11. ROCKETSONDE DATA AT NCC
CHAPTER 13. SATELLITE DATA 81
1. INTRODUCTION2. SATELLITE BRIGHTNESS DATA FROM NESS
3. ARCHIVE OF NESS SCANNER IR AND VISIBLE DATA
4'. LRIR DATA5. OTHER SATELLITE IR DATA
6. MOISTURE DATA FROM NESS
7. CLOUD DRIFT WINDS AND MOVIE LOOPS
8. SOLAR PROTON MONITOR DATA
9. GENERAL INFORMATION ABOUT SATELLITE SIRS AND VTPR DATA
10. VTPR SATELLITE IR SOUNDING DATA FROM NESS
11. DEFENSE METEOROLOGICAL SATELLITE PROGRAM (DMSP) (WAS DAPP)
12. SEA SURFACE TEMPERATURE DATA FROM NESS
13. SCR SOUNDING DATA FROM NIMBUS-4 SATELLITE
14. NIMBUS-5 DATA15. OZONE SOUNDING DATA FROM SATELLITE
16. ICE AND SNOW AND ESMR MICROWAVE DATA
17. SATELLITE DATA FOR THE GATE EXPERIMENT
18. SEASAT SATELLITE19. ERTS DATA
x
CHAPTER 14. FNWC. METEOROLOGICAL AND OCEANOGRAPHIC DATA AT FLEET 107NUMERICAL WEATHER CENTRAL
SFCTION A. DAILY ANALYZED DATA1. INTRODUCTION2. COVERAGE OF SURFACE DATA3. SEA LEVEL PRESSURE4. SURFACE AIR TEMPERATURE5. UPPER AIR DATA IN ANALYZED GRIDS--ALL TWICE DAILY COVERAGE6. MOISTURE AND CLOUD GRIDS7. DERIVED SURFACE WIND8. HEAT FLUX90 TEMPERATURE AT DEPTH (DAILY GRIDS)
10. WAVES11. SURFACE CURRENTS12. TROPICAL GRIDS13. GLOBAL SEA LEVEL PRESSURE ANALYSES AND WATER TEMPERATURE14. SOUTHERN HEMISPHERE ANALYSES
SECTION B. OBSERVED DATA15. SYNOPTIC SURFACE OBSERVATIONS16. SYNOPTIC UPPER-AIR OBSERVATIONS17. RECENT SURFACE AND UPPER AIR SYNOPTICALLY FILED DATA18. SPECIAL MARINE OBSERVATIONS19. EXPENDABLE BATHYTHERMOGRAPH SOUNDINGS
SECTION C. AVERAGE OCEAN TEMPERATURE AT DEPTH20. AVERAGE OCEAN TEMPERATURES AT DEPTH PREPARED AT FNWC21. NORTHERN HEMISPHERE OCEAN TEMPERATURE ANALYSES
SECTION D. AVERAGE ANALYSIS DATA22. LONG TERM (NORMAL) MONTHLY GRID STATISTICS PRODUCED AT FNWC.23. MONTHLY AND HALF MONTHLY GRID MEANS FOR EACH YEAR AT FNWC
CHAPTER 15. NODC. DATA AT THE NATIONAL OCEANOGRAPHIC DATA CENTER 1191. INTRODUCTION2. OCEANOGRAPHIC STATION DATA FILE3. MBT4. XBT5. OCEAN WEATHER STATION DATA6. SURFACE TEMPERATURE AND SALINITY7. SURFACE AND SEABED CURRENTS8. DATA FROM CURRENT METERS AND FROM SELECTED DRIFTERS
CHAPTER 16. SEA SURFACE WATER TEMPERATURE GRID DATA 1231. NAVY SEA SURFACE TEMPERATURE GRIDS2. NMC SEA SURFACE TEMPERATURES3 BUREAU OF COMMERCIAL FISHERIES SST GRID DATA4. LONG-TERM MEAN SEA SURFACE WATER TEMPERATURE5. SEA SURFACE TEMPERATURES6. HALF MONTHLY PACIFIC OCEAN GRIDS PREPARED BY NORPAX7. SATELLITE DATA
xi
CHAPTER 17. WORLD SURFACE SHIP DATA 1251 INTRODUCTION2. PROJECTS THAT AID IN THE DEVELOPMENT OF THIS DATA SET3. RECOMMENDATIONS CONCERNING THE DATA FLOW AND CHECKING4. ASPECTS OF DATA MANAGEMENT5. STATUS OF THE DATA SETS BASED ON SHIP LOGS6. SYNOPTIC FILE OF SHIP OBSERVATIONS7. AN EVALUATION OF THE GLOBAL TELECOMMUNICATIONS SYSTEM (GTS) AS A
MARINE CLIMATIC DATA SOURCE
CHAPTER 18. GEOGRAPHICAL DATA 1311. ELEVATION DATA FROM USAF, 1 DEG, 30 MIN, 5 MIN2. AVE ONE DEGREE ELEVATION, DEPTH, AND ICE DATA FROM SCRIPPS3* TEN MINUTE ELEVATION DATA FOR THE WORLD4. ICE AGE SURFACE ELEV AND SEA SURFACE TEMPERATURE5. ELEVATION DATA--HIGH RESOLUTION6. CONTINENTAL SHELF DEPTH AND MAP DATA
CHAPTER 19. DATA FOR ASSESSMENT STUDIES 135SFCTION A. CROP ,DATA
1. CROP YIELDS BY STATES2. US COUNTY AND CROP DISTRICT DATA3. USDA CROP DISTRICT DATA4. CROP STATISTICS FOR THE WORLD5. CROP DATA FROM FAO IN ROME6. LACIE(LARGE AREA CROP INVENTORY PROGRAM)
SECTION B. AIR QUALITY DATA7. AIR QUALITY DATA8. DATA FROM LOS ANGELES REACTIVE POLLUTANT PROGRAM
SECTION C. CENSUS AND ECONOMIC DATA9. DATA AT LAWRENCE BERKELEY LABORATORY
CHAPTER 20. SELECTED INFORMATION ABOUT DATA SETS HERE AND IN OTHER 139COUNTRIES
1. FEDERAL DATA CENTERS IN THE US2. WMO CATALOG OF DATA FOR RESEARCH3. ENDEX SYSTEM FOR DATA SET INFORMATION4. WORLD SURVEY OF OCEANOGRAPHIC PRODUCTS AND METHODS5. DATA SETS IN CANADA6. INFORMATION ABOUT DATA HOLDINGS IN OTHER COUNTRIES
CHAPTER 21. SELECTED ASPECTS OF DATA SET PREPARATION 1411. INTRODUCTION2. CONSIDERATIONS NECESSARY IN PLANNING EACH SET OF DATA3. DATA VOLUME
APPENDIX' 1 ENVIRONMENTAL DATA SETS AT USAFETAC 149APPENDIX 2. A LISTING OF DATA SETS AT THE NATIONAL CLIMATIC CENTER 157APPENDIX 3. NEWS CLIPPINGS ABOUT DATA 165APPENDIX 4. SOURCES OF INFORMATION AND DATA 169
ADDRESSES 181REFERENCES 187INDEX 193

xii
Table Showing Location of Information in this Text
For selected data types, this table shows where information about the data may be
found in the text. An * means data are there but are not specifically described
in this text. The number 2.11 is Chapter 2, Section 11. The NMC data are
covered in the NCAR column. Also, see the Index at the end of the text.
Data Type
Sea level pressure grids
Northern hemisphere analyses
Tropical analyses
Southern hemisphere analyses
Stratosphere grids
Cloud analyses
Ocean analyses
Climatology grids
Average grids
Surface synoptic
Surface synoptic time series
Ship synoptic
Airways
Rainfall
Drought
Upper air synoptic file
Upper air time series
Rocketsonde
Crops
Solar
Satellite
Ocean currents
Ocean soundings
Geographical
NCAR
2.
2., 3.,4.1, 4.2
2.12, 3.5
2.11, 3.92.12
2.7, 3.2.10, 12.
4.1, 13.
11.
1.2, 11.3
1.5, 9.
9.
9.
10.
1.3, 8.A
1.4, 8.B
FNWC
14.3
14.
14.12
14.13,14.14
14.5
14.6
14.
ETAC
6.6
6.6
6.6
6.6
6.6
6.
14.D 6.6
14.15 6.2
6.2,
14.15, 17. 6.2,
6.2
6.2 6.2
6.5
9.
6.7
6.3
6.3
13.
14.11
14.B
NODC OTHERS
.~~~~5 18
NCC
dC~~~~~~~~~~~~~~~~~~~~~~~~~~~~~~~~~~~~~~~~~~~~~~~~~~~~~~~~~~~~~~~~~~~~~~~~~~~~~~.
*
*
*
7, 2.2.7, 2.10
20.6
12., 13.
*
13.
20.4
10.3
10.3, 16.6
6.2
6.2, 7.6
9., 17.
6.2, 7.7
7.8, 7.67.10, 10.
7.11
6.3
7.3, 7.4
7.5
4.
7.12
13.
19.
13.
13.
15.
15.
18. 18.
1
INTRODUCTION
This document is intended to provide information about various data sets for
meteorological and oceanographic research. We provide a few details about the data,
but generally avoid voluminous information such as station lists, and detailed
methods. Although several years ago this was conceived as a relatively brief write-
up describing the data sets archived at NCAR, it has been expanded to cover many of
the data sets held in other centers. Given this general information about various
data sets, people can more quickly approach a specific data bank to satisfy their
needs.
NCAR has an extensive set of grid point data. Our set of upper-air
synoptically filed observed data is also fairly complete. Other types of data
are usually in more complete sets at NOAA's National Climatic Center (NCC) in
Asheville, N.C., which is the basic national archive for meteorological data.
Since NCAR has data from sources other than NCC, and because we have often re-
formulated the data in a way that may be convenient for other groups, NCAR also
makes its data available (at cost) as a service to members of the research
community. The data can be accessed by approved projects run on the NCAR computers,
or they can be sent on tape. Because we have only a very small staff, requests for
hard copy output or for changes of format usually cannot be met. We anticipate
that most requests for data will continue to be directed to the data centers of
NOAA's Environmental Data Service and to NASA.
Those who wish to run their own research programs on the NCAR computer may
write to the Director of the NCAR Computing Facility, requesting the necessary
application forms.
In planning for data sets, NCAR attempts to emphasize multiple-use data
sets, continuity in time, and sufficient information to monitor some of the
changes in the global atmosphere.
We are preparing a data base for studies of climatic change and long-range
prediction. We routinely archive synoptic-scale data, and will archive an aug-
mented set of data during the GARP experiments.
We believe that it is most cost-effective for the data banks to spend a good
deal of time in cleaning the various errors out of the data and in making certain
that the formats are as stated. If this is done once at the centers, it means
that each user will not need to cope with all of these problems. Thus many of the
2
data sets that NCAR receives are processed to reduce the error content, and are
put into formats that often reduce the data volume and the time necessary to unpack
the data. Such cleanup work is always in progress at other data banks also. How-
ever, with hundreds of millions of observations, it is clear that the amount of
manual intervention involved in the cleanup process must be limited. Thus there
will always be some problems in the various data sets; however they are usually
reduced to the point that the data can be easily used. Feedback about problems
also helps; thus a listing or cards saying that station A for January 1949 reported
a mean temperature of 22° but it should have been 27° are helpful. However, since
there are a number of rather extreme rare events, one must be very cautious in
changing data (and normally changes should be flagged). Program checks for
extreme values (sometimes poorly known) have caused problems, such as the deletion
of jet stream winds.
We also note that various instrumental errors may be included in the data.
Finally, even if the instruments are perfect, there is the question of whether a
sample is representative of only a small area (such as the top of a black roof, a
heat island in a city, or the edge of a thunderstorm) or of a much wider area.
In the case of the analysis data, there are questions about how much observed data
were available for the analyses, how much smoothing was done, and whether the
procedures that were used tried to build in vertical consistency between levels.
We have included a few statements in the text about the content, reliability, and
methods used in preparing the sets. The basic point that we wish to make about
the observations and analyses is that although they are not perfect, if they are
used wisely they can help us find answers to a number of problems.
In organizing the material, we have compromised between a complete listing
of what each organization is doing, and a grouping of information according to
type of data. The text leans somewhat toward a listing by organization but a
number of chapters discuss given types of data. The Table of Contents, the table
showing the location of information (p. XII), and the index also help to track
individual types of data.
Chapter 1 gives an overview of the data sets at NCAR; Chapters 2 and 3 give
details about grid-point data at NCAR. Chapter 4 about cloud and moisture data
and Chapter 5 about other data sets include information about some sets of data
not available at NCAR. Chapter 6 discusses ETAC (Air Force Environmental
Technical Applications Center) and Chapter 7 covers NCC (National Climatic Center);
3
these centers have huge archives of meteorological data. Chapters 8-13 discuss
atmospheric data according to data type: upper air observed data, surface
synoptic, year-month mean data, climatological grid data, stratospheric data,
and satellite data.
In Chapter 14 we include more about the ocean data by considering both the
atmospheric and the ocean data at FNWC (Fleet Numerical Weather Central). We
then consider NODC (National Oceanographic Data Center). Chapters 16 and 17
discuss sea surface water temperature grid data and world surface ship data. In
Chapters 18 and 19 we consider geographical data and data for assessment studies
such as crop data. Chapter 20 discusses a few of the other sources of informa-
tion and includes information about a directory of federally supported information
analysis centers and about a world survey of oceanographic products. Finally,
in Chapter 21 we consider aspects of data set preparation that make it easier for
us to share data sets.
In order to make the current information widely available, we have arbitrarily
limited the scope of this writeup. The list of addresses, references, Appendix 4,
and comments in the text will indicate the best places to get other questions
answered.
Some comment on the relationship between the world data centers and the
national data centers may also be helpful. For example, World Data Center-A
for oceanography is located with NODC. However, it does not list all of NODC's
data holdings as belonging in its files. The reason is that all data that are
part of a WDC are supposed to be equally accessible at the sister WDCs overseas,
and it is not practical to exchange all data.


5
Chapter 1: General Information about Data Sets at NCAR
In this chapter we will discuss the data at NCAR in a general way. Other
chapters will provide more specific information about data sets located at NCAR
and elsewhere.
1. Daily Grid Data
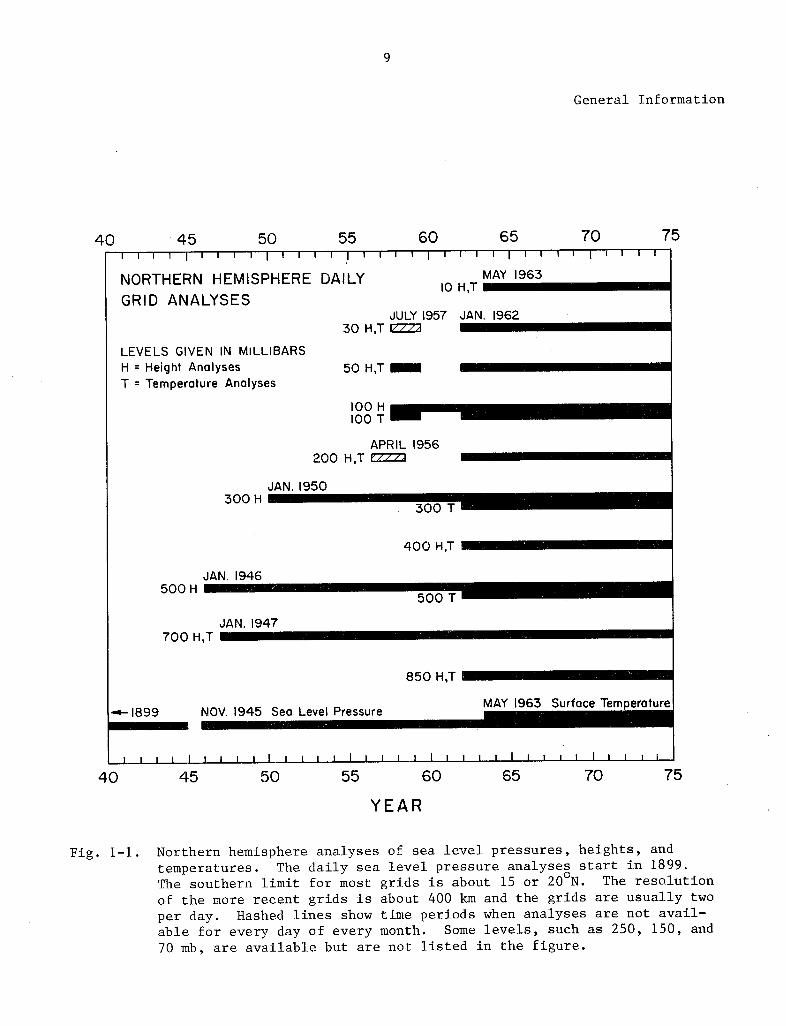
We have northern hemisphere sea level pressure daily grid data starting in
1899. Ten missing months in 1945 may soon be obtained from Scripps. Height and
temperature grids at 700 mb start in 1947, heights at 500 mb start in 1946, 300 mb
heights start in 1950, and 100 mb heights start in July 1957. Other stratospheric
grids are available from July 1957 through June 1959, and then start again in 1962
or 1964, depending on the source. The earlier grids often have a resolution of
only about 5° latitude by 10° longitude, whereas the later grids usually have a
spacing of about 400 km. Figure 1-1 shows the availability of height and tempera-
ture grids.
Dew point analyses are available for 850, 700, 500, and 400 mb, and neph-
analyses for low, middle, high, and total clouds start 1 September 1963. Only
total clouds are available until April 1964, when the layered clouds were added.
Cloud analyses in this form stop in November 1969. We also have grids of
1000-500 mb average relative humidity starting in March 1968.
We have wind analyses 850-100 mb for 1963 to date except that lower level
grids are missing during selected periods. We also have tropical analyses of
winds for 700-200 mb starting in 1968 and of temperature starting in 1970
(48°S - 48°N). There are analyses of southern hemisphere sea level pressure and
500 mb height for 18 months during the IGY.
Sea surface temperature grids are available for the northern hemisphere
starting in November 1961.
2. Average Grids
Long-term mean monthly climatological data are available on one magnetic tape
for each hemisphere, surface to 100 mb. Included are heights, temperature, dew
point, and geostrophic winds. Another tape has a climatology of the northern
hemisphere stratosphere from 100 to 10 mb. We also have global sea surface water
temperature data.
6
Chapter 1
The German stratospheric analyses for each month start in about 1957 or 1964,
depending on level and type. Monthly grids of surface water temperature in the
North Pacific cover the period January 1949 through December 1962.
3. Synoptically Filed Upper Air Observed Data
We have upper air data in synoptic sequence starting in May 1958. The first
five years were from MIT, and the later data from NMC (and sometimes from the
USAF). The coverage on the NMC tapes became global (as received operationally)
in June 1966. The data coverage for typical times in 1968 and 1974 is shown in
Figure 1-2.
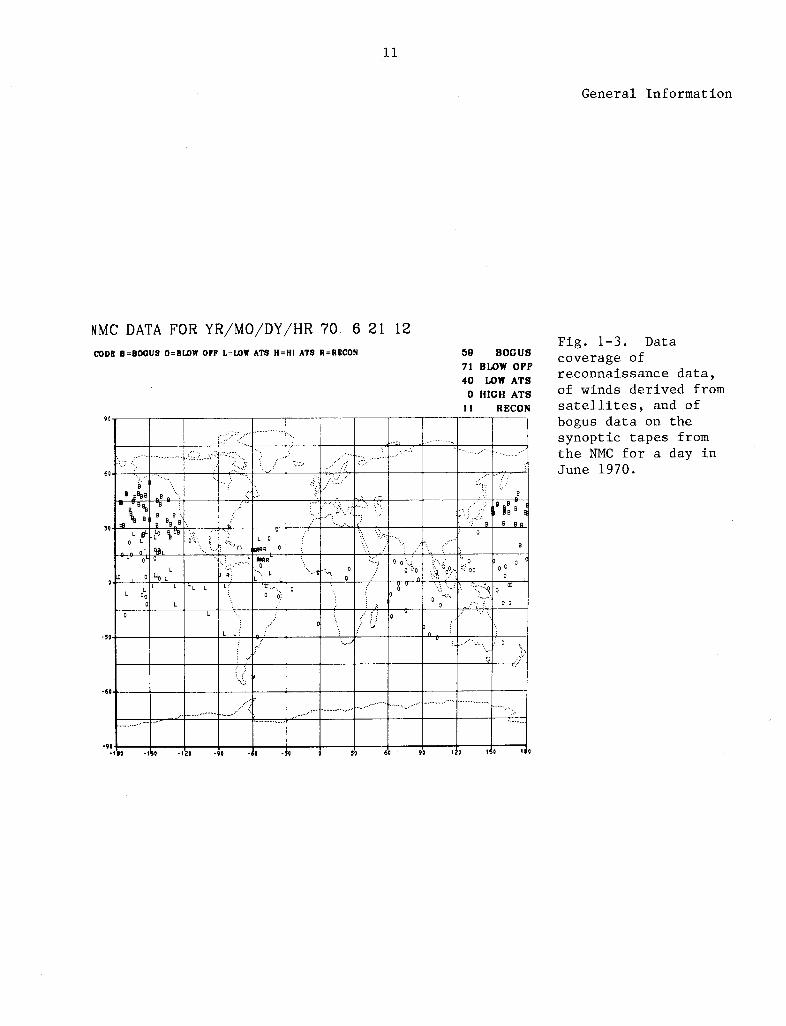
The NMC tapes include aircraft wind reports, wind data from the cirrus blowing
off from cumulonimbus clouds ("blowoff winds"), wind data from the drift of clouds
seen on ATS film loops, and "bogus" data put in by analysts to help the objective
analysis programs. Figure 1-3 shows the coverage of these data on a given day in
1970. Figure 13-1 shows wind data coverage in 1974.
4. Time Series of Upper Air Observed Data
NCAR also has data from about 1,600,000 rawinsonde ascents in time-series
sort (on 48 tapes). We are attempting to obtain all available mandatory level
rawinsonde data for the stations south of about 30°N. We have also just obtained
the U.S. and Canadian data starting with 1961. The primary source of data has
been NCC with additional data from England, Australia, New Zealand, Argentina,
Singapore, and Mauritius. We hope to soon obtain data from Brazil. We are also
corresponding with several other countries to try to make this set more complete.
5. Synoptically Filed Surface Observed Data
NCAR has observed surface data (synoptically filed) for 19 February 1967,
through 25 April 1967, and for December 1967. We are obtaining more of these
data. Three other organizations have more complete sets (see Chapter 9).
6. Monthly Mean Surface Data
We now have about 887,000 monthly reports from surface stations. In the period
from 1731 to 1860, the number of stations increased from 1 to 84; by 1900, there
7
General Information
were 438 stations. In the 1961-1970 decade, there were 1722 stations, of which
541 were in the southern hemisphere.
7. Monthly Mean Rawinsonde Data
We are cooperating with NCC to make available a set of about 75,000 mean monthly
rawinsonde reports (CLIMAT reports - global coverage). The southern hemisphere
climatology project made extensive use of these data. Error detection and correc-
tion work on the northern hemisphere reports is not yet complete.
8. Satellite Brightness Data
Daily global brightness data, averaged by 5° latitude-longitude squares are
available for 1 January 1967 through 31 August 1972. One average brightness value
is given for each grid point. These satellites view the earth at about 1500 local
time each day. To produce this data set, the Satellite Service summarized the
mesoscale brightness data, which are given for squares that are about 50 km on a
side (one-eighth of NMC grid). For each square there is a count of how many of the
64 sub-squares have brightnesses in categories one through five.
9. Geographic Data
We have two sets of global 1° elevation data; one of these also has water
depth and ice thickness. Elevation data for each 5 min are also available for
North America and Europe. A set with points each 208 ft is available for the
United States from the Army Map Service. A set of 5° global mean elevation data
is included on the climatology tape for the southern hemisphere.
10. Data Handling Methods
Our input data are received in a number of different formats on cards and
on tape. Much of the data would be easier to use if the formats were changed.
For example, some of the card formats have overpunches on the data, and some
binary packed data require the bits to be reordered in order to be meaningful.
The various levels for individual rawinsonde balloon ascents often are not
together in a data set. We have taken time to restructure many of these formats
so that the information is easy and quick to use. For example, one set of 602,000
rawinsonde reports on 56 tapes was repacked into a variable length binary format.
8
Chapter 1
The volume dropped by a factor of 3.9 and the time to unpack all of the data on the
Control Data 6600 dropped from 464 to 34 min.
Often we choose a format that uses packed positive numbers in order to save
storage volume and machine time. Most of the data are kept under checksum
protection.
In order to use the binary packed data easily on another computer, that
computer must have a binary capability (nearly all computers now have this).
Also, one standard general purpose routine (GBYTES) must be written for the
machine in question. Such a routine has now been written for 360 systems and for
the Univac 1108. We have prepared a technical note (Jenne and Joseph, 1974) which
discusses some of the techniques for the processing, storage, and exchange of data.
It describes some of the considerations involved in choosing formats and presents
some time and volume comparisons for different options. It also describes some of
the methods that can be used to process data that have been received in any of a
variety of formats.
9
General Information
45 50 55 60I I I I I i i I I I II I I I I I
NORTHERN HEMISPHERE DAILYGRID ANALYSES
LEVELS GIVEN IN MILLIBARSH = Height AnalysesT = Temperature Analyses
65I I , I I T
MAY 1963MAY 1963
10 H,T
JULY 1957 JAN. 196230 H,T A
50 H,T -
100 H 1100 T
APRIL 1956200 H,T r//
JAN. 1950
300 T =---
400 H,T
JAN. 1946
500 T
JAN. 1947
850 H,T
MAY 1963 Surface TemperatureNOV. 1945 bea Level Pressure
I I I 1 1 )I I I I I I
45 50I I I I I I
55I I I I I
60I I I I I I I I I I I
65 70
YEAR
Northern hemisphere analyses of sea level pressures, heights, and
temperatures. The daily sea level pressure analyses start in 1899.
The southern limit for most grids is about 15 or 200N. The resolution
of the more recent grids is about 400 km and the grids are usually two
per day. Hashed lines show time periods when analyses are not avail-
able for every day of every month. Some levels, such as 250, 150, and
70 mb, are available but are not listed in the figure.
40 70 75
300 H
500 H
700 H
- 1899
40
Fig. 1-1.
75
I
II , i' _C'
---- II-�
"L I' rl �
P ��Is'' -e� ' - ·I L '� L�- IbQ�Q�I I�
�ga
IBI ·I -- -r I-C·�ks�CI
I L I I I IL I II I I I I I I I I a a I· --- - -
,T
vvw ·
.1. 00%A - l a --- I IP~ -- --

10
Chapter 1
NMC DATA FOR YR/MO/DY/HR 68 7 15 0ALL LEVELS OF DATACODE X=RAOB, O=WIND OR RAWIN. V=ACF'
625 RAOB RPTS
246 RAWIN RPTS
257 WIND RPTS
672 ACFT RPTS
GATE ARCHIVE DATA FOR YR/MO/DY/HR 74 9 2 12ALL LEVELS OF DATACODE X=RAOB, O=WINDS ONLY , V=ACPT
Fig. 1-2a. Datacoverage of conven-tional observed upperair data from the NMCfor a typical time in1968 (0000 GMT on 15July). Separate wind-with-height soundingsreceived from stationsthat have thermal RAOBdata are counted as RAWINreports; if thermal dataare lacking, they arecounted as WIND reports.ACFT denotes aircraftreport. Nearly allRAOB reports alsoreport winds at manda-tory levels. A zeroplotted on top of an Xlooks like a rectangle.A spot check in 1969showed that data above100 mb were generallynot received from thesouthern hemisphere,North Africa, China, orthe Middle East.
668 RAOB RPTS304 WIND RPTS
331 ACPT RPTS
Fig. 1-2b. Datacoverage of upper airdata from NMC for atime period during theGATE experiment. Thecount of aircraftreports are for a 6-hperiod. The real-timereceipt of data fromthe GATE ships was notas good as this inJuly 1974.
11
General Information
NMC DATA FOR YR/MO/DY/HR 70 6 21 12
CODE B=BOCUS O=BLOW OFF L=LOW ATS H=HI ATS R=RECON 59 BOGUS71 BLOW OFF40 LOW ATS
0 HIGH ATS11 RECON
9. F o i _ \ j '-..*! r
... .. J _ ... . ; \ ..... ...
B11 B I B* _ Io.30 ~.. . B01 BBI~~~ B -IW R .~....
s t I 1 v I I o1; 1 1 0
-Bi
O ,.............. - 0 .....:" I ^ 0 ..
.10 -150 -120 o90 -<0 60 90 10 10
BL
~::~: :;!; .... L o : .... ? .......
-1oi L.t .. " -d .O o .... . . . ; -. ro
Fig. 1-3. Datacoverage ofreconnaissance data,of winds derived fromsatellites, and ofbogus data on thesynoptic tapes fromthe NMC for a day inJune 1970.

I
II
13
Chapter 2: Selected Daily Grids at NCAR
(Pressure, Height, Temperature)
Analyses discussed here are for the northern hemisphere unless otherwise
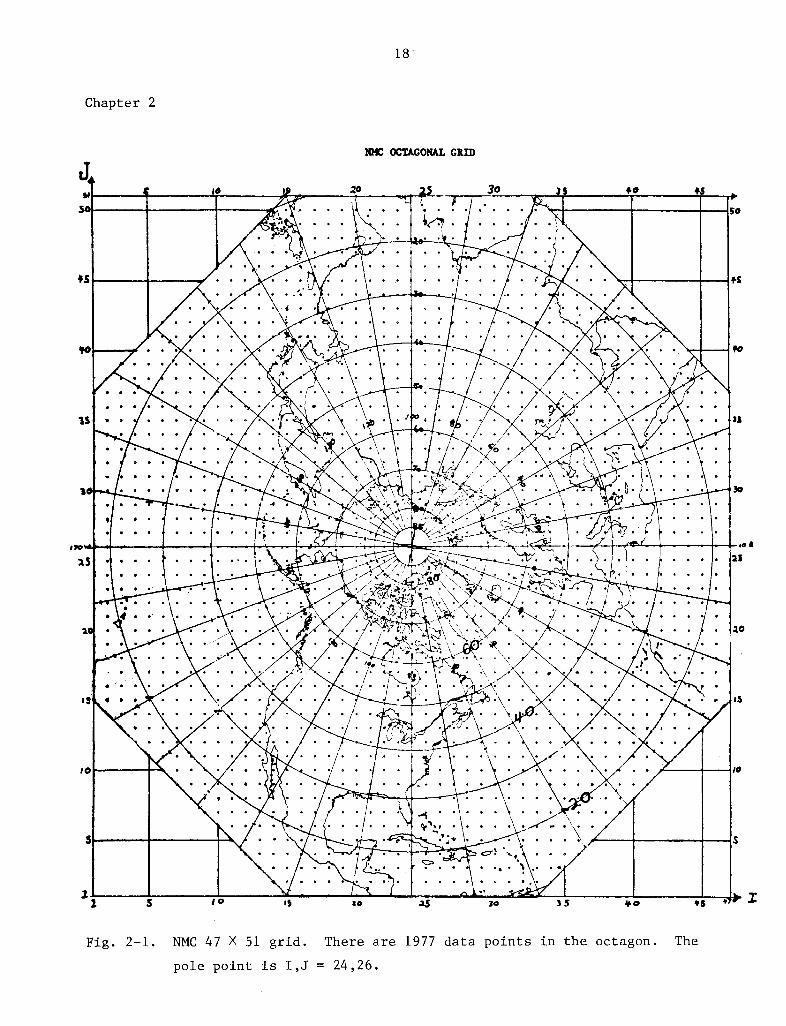
stated and usually do not extend to the equator. The NMC octagonal grid goes
to about 150N. See Figure 2-1.
1. Daily Sea Level Pressure Grids 1899-Current
a. Sea Level Pressure Grids from Historical Maps
These grids cover January 1899 through June 1939. The data are on a
diamond 5° latitude 10° longitude grid 20-80°N, with no data at 75°N.
G. Briar's laboratory in Environmental Data Service did a lot of work
cleaning these grids. Data are missing where the historical maps could
not be analyzed. Eastern Russia (40-80 N, 35-1500 E) is missing for
1916-1920, for three months in 1921, for one month in 1922 and in 1931,
and for six months in 1938 and in 1939. (On three tapes.)
b. Sea Level Pressure Data from MIT
These data cover July 1939 through November 1944. They are for each 5
latitude and even 10° longitudes for 15-80°N. This grid is always
complete. Data for 85°N are also available for ten days. (On one tape.)
c. Sea Level Pressure Data from the Navy
Sea level pressure grids for November 1945 through March 1955 (daily at
15Z) and April 1960 through June 1962 (1200Z) were digitized with a curve
follower at NCC under Navy contract. The Navy then used the points along
the contours, and used the high and low centers in their objective
analysis program which is also used on current data. The operational
analyses from the Navy are available starting in July 1963. See
Chapter 14 for more information.
d. Daily Sea Level Pressure Grids 1899-1972
These grids are daily data on a uniform 5 latitude-longitude grid taken
from a, b, c above and from the (ESSPO) data as prepared by NCAR, which
is described later in this chapter. We have received monthly mean 1945
data from NORPAX. The missing 5° latitude-longitude points from a and
b are interpolated, except that large missing areas are left as missing.
14
Chapter 2
2. Sea Level Pressure and Surface Temperature Data from Air Force Global
Weather Central (AFGWC)
100 mb height (H) 15 May 1963 - 2 Jan 1965 (00 and 12Z)
Surface temperature (T) 15 May 1963 - 2 Jan 1965 (00 and 12Z)
The 1000 mb height (in tens of feet) was calculated from the sea level
pressure using the formula:
1000 Tsfc [9.58 X Alog(P se - 66.18]1000 sfc sea Ivl
3. Sea Level Pressure and Surface Air Temperature from NMC B-3
Pressure 18 May 1965 - current (00 and 12Z)
Surface (T) 4 Oct 1965 - current (00 and 12Z)
4. Sea Level Pressure and 700 mb Height and Temperature from Extended
Forecast Laboratory
Sea level pressure Jan 1947 - Aug 1967 (00 and 12Z)
700 mb H,T Jan 1947 - Jun 1967 (00 and 12Z)
Many missing in the early months. On a diamond grid (5° latitude and 100
longitude) from 15°N to the pole. In earlier years the grid coverage was less.
5. 300 mb Data from University of Wisconsin
300 mb H 1 Jan 1950 - 31 Dec 1957 (15Z)
Values read to nearest 100 ft from USAF and WBAN charts. Ten days are
completely missing. Data in parts of eastern hemisphere are missing for three
months. See the atlas by Lahey et al. 1960. Diamond grid 15 N to the pole
(each 5° latitude, 10° longitude, with fewer points near the pole). Grids are
on one tape with a 5° grid and 15-bit pack at NCAR. Original height data were
read to the nearest 100 ft. The University of Wisconsin provided the original
170,000 cards.
6. 433L ESSPO Project Grid Data
Data for every other point (one-fourth of the points) in the NMC grid were
manually read from many charts for April 1955 through March 1960 (all twice daily).
The data have been cleaned up and are now in the standard NMC grid format.
15
Daily Grid Analyses at NCAR
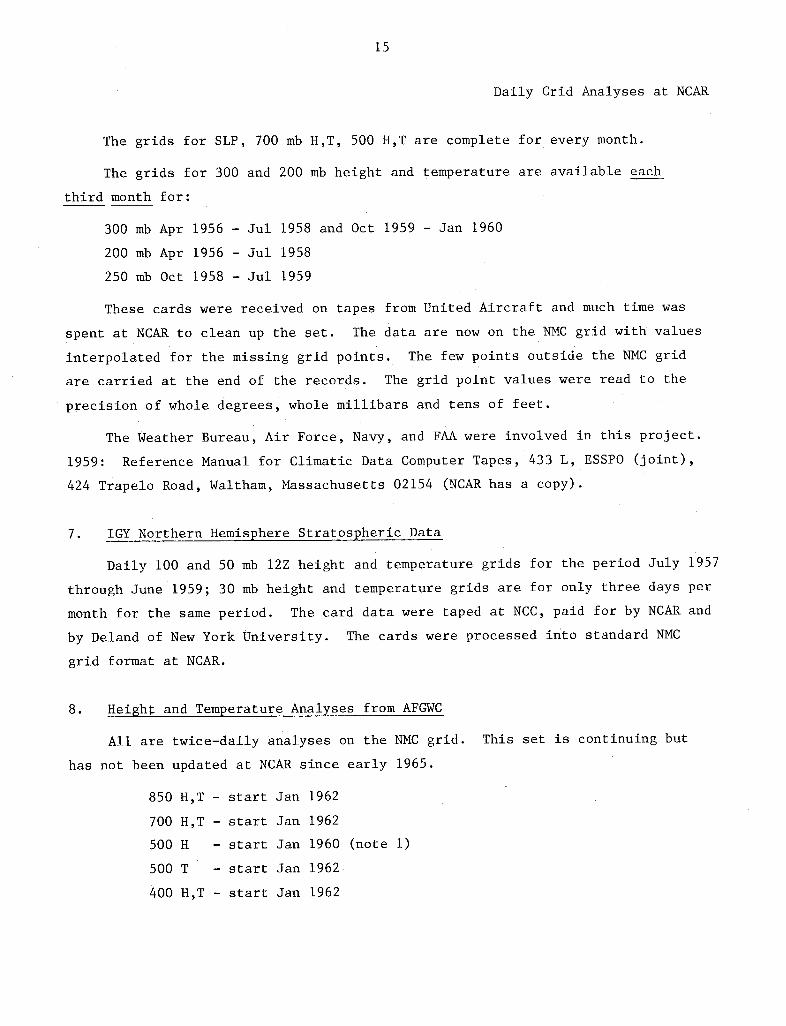
The grids for SLP, 700 mb H,T, 500 H,T are complete for every month.
The grids for 300 and 200 mb height and temperature are available each
third month for:
300 mb Apr 1956 - Jul 1958 and Oct 1959 - Jan 1960
200 mb Apr 1956 - Jul 1958
250 mb Oct 1958 - Jul 1959
These cards were received on tapes from United Aircraft and much time was
spent at NCAR to clean up the set. The data are now on the NMC grid with values
interpolated for the missing grid points. The few points outside the NMC grid
are carried at the end of the records. The grid point values were read to the
precision of whole degrees, whole millibars and tens of feet.
The Weather Bureau, Air Force, Navy, and FAA were involved in this project.
1959: Reference Manual for Climatic Data Computer Tapes, 433 L, ESSPO (joint),
424 Trapelo Road, Waltham, Massachusetts 02154 (NCAR has a copy).
7. IGY Northern Hemisphere Stratospheric Data
Daily 100 and 50 mb 12Z height and temperature grids for the period July 1957
through June 1959; 30 mb height and temperature grids are for only three days per
month for the same period. The card data were taped at NCC, paid for by NCAR and
by Deland of New York University. The cards were processed into standard NMC
grid format at NCAR.
8. Height and Temperature Analyses from AFGWC
All are twice-daily analyses on the NMC grid. This set is continuing but
has not been updated at NCAR since early 1965.
850 H,T - start Jan 1962
700 H,T - start Jan 1962
500 H - start Jan 1960 (note 1)
500 T - start Jan 1962
400 H,T - start Jan 1962
16
Chapter 2
300 H - start Apr 1959 (note 2)
300 T - start Jan 1962
200 H,T - start Jan 1962
100 H - start Apr 1959 (note 2)
100 T - start Jan 1962
50 H,T - start Jan 1962
30 H,T - start Jan 1962
10 H,T - start May 1963
Note 1: These were NMC grids with one-fourth of the points sent to AFGWC by
teletype (until January 1962).
Note 2: Based on hand analyses made at AFGWC with one-fourth of the points
manually read and the rest interpolated (until January 1962).
9. Analyses from NMC
See Chapter 3 for NMC grids, most of which start in 1963.
10. Western Hemisphere Analyses of the High Stratosphere
Once-weekly analyses of the 5, 2, and 0.4 mb heights for January, April,
July, and October for 1964, 1965, and 1966. (The area is 10°N to the pole and
0°W, 5°W, --, 220°W, but only 40°W - 190°W at 0.4 mb.) See Chapter 12 for more
information about similar data. On tape at NCAR and NCC.
11. Southern Hemisphere Daily Grid Data
IGY grids for sea level pressure and 500 mb height for the period July 1957
through December 1958, for the area 15°S to the South Pole are available. The
grids have data at each 5° of latitude and longitude. The original data were
generally read each 100 longitude on a diamond latitude-longitude grid, with
no sea level pressure data over Antarctica. The card data were from South
Africa or repunched from NOTOS. On tape at NCAR.
We also have grids for sea level pressure for 1951-1957, but these have not
yet been cleaned up.
17
Daily Grid Analyses at NCAR
12. IGY Surface and 500 mb Daily Tropical Grid
Daily sea level pressure and 500 mb heights for the period 1 July 1957
through 31 December 1958. (Pressure read to whole millibars, height read in
dekameters.) Data for 25°S through 25°N, each 5° of latitude and longitude.
18--
Chapter 2
NMC OC'ONtAL GRID
io 20 1 °- 30 #v 3 o I_ r
50 So~·· · ( · · \, · I· · · 5
,s L I · s
w~~~: :! ¼"::: -~--- X"
r /~~ ~~~~~ \· .~ a\a ./ *. i/ a * ·:' * *'tI `u~
#S · · · l - S. . . ' .. . 5
1} ' n ~·i X,/ EF Lc;+ m s af a loaaa · )53/ , ·. ..1, , < Is
to m XX W ,ta < ti ~~~~~~' ' ~ 1
' :' ..
2yon,& o .s .o 3o dE
A~~~~~~~~~~~~~~~~~~~~~~~~~~..;,t'l ',, · o , ., /·- "' \IE a -4:. hl· · 'v , '/U - 'I
4 a a a · . ,/T~· I · · · · · · a/ V / · h· Y
;· .~ · ,a a··I`~.\ ~r \ ;\ .,,.·,.~~~~~~~~~~~~~~~~~~~
~0 1 .....~~~~~~~~~~~~~~~~~~~3
~~~~~~~~~~~~~~· · ·· ell ' · ~l y E \P
----!--- ,-----~ · ·I· .. ,,,, ....,.- ~ ~ , --r-)-tY- CC-c--t YI
410~~~~~~
16~~t··· ~ I
;·3i: i~~~~~~~~~~~~~~~t
ia · ·a · aI· a··I· I a~~~~~~~~~~~~~~~~~~~~~~~~~J1
· I · · · a a · I· l~~~~~cq r · ,i 3 · ·
Fig. 2-1. NMC 47 X 51 grid. There are 1977 data points in the octagon. The
pole point is I,J = 24,26.

19
Chapter 3: NMC. Analysis Data from the
National Meteorological Center
Nearly all of these data sets are available at NCAR.
1. Introduction
The NMC has had a policy of purging much of their older data. Thus, the
files of NMC data at NCAR and at NCC are more extensive than those at NMC.
Until January 1973, the grid analysis data and the observed upper air data
were combined on one set of "B-3" tapes. Data for 4 March 1962 to 31 December 1972
were on 1845 tapes.
NCAR has processed these tapes to separate the analyses from the observed
upper air data and to block the observed data more tightly. Much of the forecast
data was thrown away. We have made separate data sets of analyses of heights and
temperatures, winds, and forecasts. The analyses on the B-3 tapes are those done
with a data cutoff of 3 h 20 min after data time. However, the primary archive
of NMC height and temperature analyses at NCAR are the final analyses which were
received on separate tapes. These were usually based on a data cutoff of about
lOh after data time. NCAR is now (February 1975) using the operational (B-3) tapes
to fill in the gaps in the final analysis tapes. All final and operational grids
have been put into a common format. Wind analyses are only made during the
operational run.
Starting in December 1974 NMC has been preparing selected zonal mean energy
statistics from their global analyses.
2. Main Stack of NMC Northern Hemisphere Height and Temperature Grids through
December 1972
These analyses are generally from the NMC final analyses tapes. Thus, they
include data up to about 10 h after data time for the time periods (usually at
least once a day) when NMC makes a final analysis after the earlier operational
run which has a data cutoff at 3 h 20 min. Data are available as follows.
20
Chapter 3
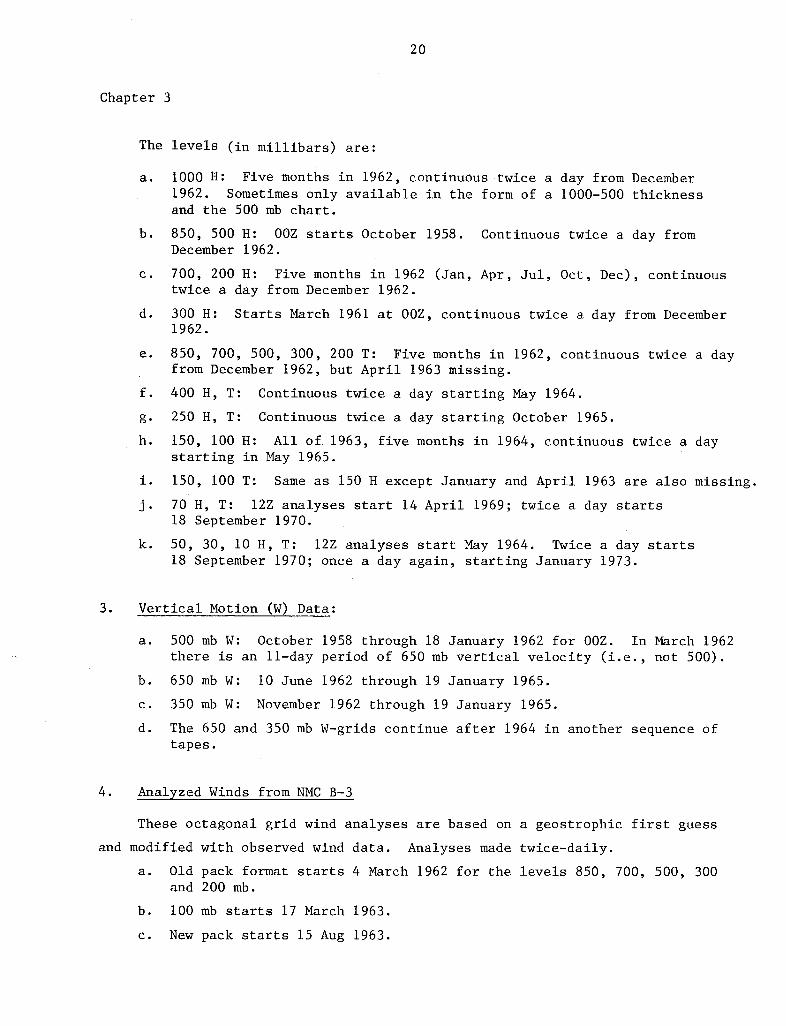
The levels (in millibars) are:
a. 1000 H: Five months in 1962, continuous twice a day from December1962. Sometimes only available in the form of a 1000-500 thicknessand the 500 mb chart.
b. 850, 500 H: 00Z starts October 1958. Continuous twice a day fromDecember 1962.
c. 700, 200 H: Five months in 1962 (Jan, Apr, Jul, Oct, Dec), continuoustwice a day from December 1962.
d. 300 H: Starts March 1961 at 00Z, continuous twice a day from December1962.
e. 850, 700, 500, 300, 200 T: Five months in 1962, continuous twice a dayfrom December 1962, but April 1963 missing.
f. 400 H, T: Continuous twice a day starting May 1964.
g. 250 H, T: Continuous twice a day starting October 1965.
h. 150, 100 H: All of 1963, five months in 1964, continuous twice a daystarting in May 1965.
i. 150, 100 T: Same as 150 H except January and April 1963 are also missing.
j. 70 H, T: 12Z analyses start 14 April 1969; twice a day starts18 September 1970.
k. 50, 30, 10 H, T: 12Z analyses start May 1964. Twice a day starts18 September 1970; once a day again, starting January 1973.
3. Vertical Motion (W) Data:
a. 500 mb W: October 1958 through 18 January 1962 for 00Z. In March 1962there is an 11-day period of 650 mb vertical velocity (i.e., not 500).
b. 650 mb W: 10 June 1962 through 19 January 1965.
c. 350 mb W: November 1962 through 19 January 1965.
d. The 650 and 350 mb W-grids continue after 1964 in another sequence oftapes.
4. Analyzed Winds from NMC B-3
These octagonal grid wind analyses are based on a geostrophic first guess
and modified with observed wind data. Analyses made twice-daily.
a. Old pack format starts 4 March 1962 for the levels 850, 700, 500, 300and 200 mb.
b. 100 mb starts 17 March 1963.
c. New pack starts 15 Aug 1963.

21
Analyses from NMC
d. Winds below 300 mb were dropped after 00Z, 1 Jun 1964.
e. 500, 400, 250, 150 mb added 20 Apr 1965.
f. 850, 700 mb included again 11 Aug 1966 to make a complete 850-100 mb set.
5. Tropical Grid Data from NMC
NCAR has NMC tropical grid analyses of winds starting 28 January 1968 for
1200Z. These are for the 700, 500, 300, 250, and 200 mb levels. Wind analyses
at 00Z start 3 March 1968. Temperature grids start 22 January 1970.
The data in these analyses include all tropical rawinsonds, wind soundings,
and aircraft data received at NMC. They also include an average of about 125 winds
deduced from cloud drift as shown in satellite pictures. The satellite SIRS
temperature data are now (as of February 1972) used only in the area north of
about 15°N.
6. Selected Northern Hemisphere Grids from NMC
a. Sea level pressure and surface air temperature from NMC B-3
Pressure: 18 May 1965 - current (00 and 12Z)
Surface Temperature: 4 Oct 1965 - current (00 and 12Z)
b. Sea level pressure and 700 mb height and temperature from the ExtendedForecast Laboratory.
Sea Level Pressure: Jan 1947 - Aug 1967 (00 and 12Z)
700 mb H, T: Jan 1947 - Jun 1967 (00 and 12Z)
Many missing in the early months. On a diamond grid (50 latitude and10° longitude) from 15 N to the pole. In earlier years the grid
coverage was less.
c. Layer Humidity from NMC B-3 Tapes
These are 1000-500 mb average relative humidity (3 March 1968 -31 December 1972, 00 and 12Z, type 44). Starting in January 1973,
there are three layers of relative humidity.
d. A discussion of NMC global grid data is contained in another section.
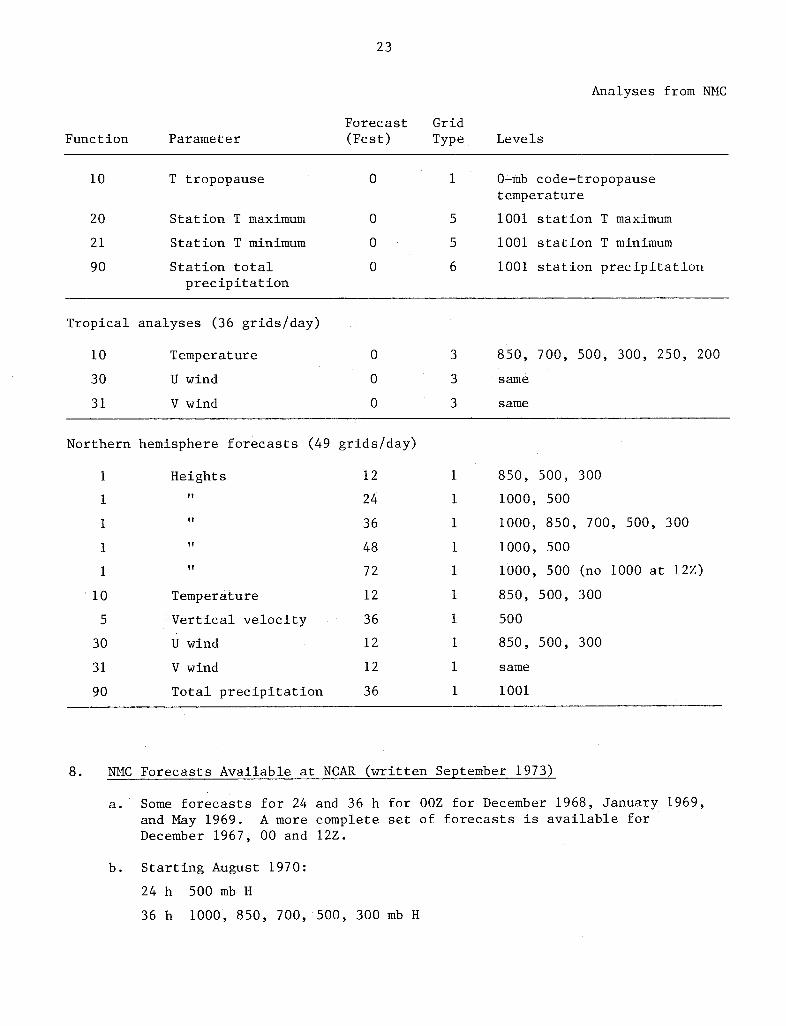
7. The Selection of NMC Grid Data Starting in January 1973
The Table shows th selection of NMC grid point data saved on the main
archive tapes starting on 1 January 1973. Most of these grids were also saved

22
Chapter 3
prior to 1973. Some NMC grid data such as global analyses are discussed elsewhere.
In the table below, the NCAR function code shows the type of data, and the grid
type is:
1 = 1977 point NMC octagon (northern hemisphere)
3 = 73 X 23 point tropical grid
5 = data for 143 U.S. cities (maximum and minimum temperatures)
6 = data for 286 U.S. cities (precipitation) (deleted on 10 August 1973)
If Fcst is 0, it is an analysis grid; otherwise it is a forecast valid the desig-
nated number of hours later. The level is in millibars, except that 1013 = sea
level and 1001 = surface.
Forecast Grid(Fcst) Type Levels (mb)
Northern hemisphere height and temperature analyses (50 grids/day) (should have8 more strato-grids/day)
28 Pressure (sea level) 0 1 1013
1 Heights 0 1 1000, 850, 700, 500, 400,300, 250, 200, 150, 100,(70, 50, 30, 10 = 12Z only)
10 Temperature 0 1 1001, 850, etc. as forheights
Northern hemisphere winds (42 grid analyses/day)
5 Vertical Velocity 0 1 850, 500, 200
30 U winds 0 1 850, 700, 500, 400, 300,250, 200, 150, 100
31 V winds 0 1 same as for U winds
Northern hemisphere miscellaneous analyses and observations (20 grids/day)
Relative humidity
Snow depth
Sea surface T
Pressure tropopause
0
0
0
0
1 layers (1002-900),(666-1000), (333-666)
1
1
1
1001
1001
0-mb code-tropopausepressure
Function Parameter
44
93
47
28
23
Analyses from NMC
Function ParameterForecast Grid(Fcst) Type Levels
10 T tropopause 0 1 0-mb code-tropopausetemperature
20 Station T maximum 0 5 1001 station T maximum
21 Station T minimum 0 5 1001 station T minimum
90 Station total 0 6 1001 station precipitationprecipitation
Tropical analyses (36 grids/day)
10 Temperature 0 3 850, 700, 500, 300, 250, 200
30 U wind 0 3 same
31 V wind 0 3 same
Northern hemisphere forecasts (49 grids/day)
1 Heights 12 1 850, 500, 300
1 " 24 1 1000, 500
1 " 36 1 1000, 850, 700, 500, 300
1 " 48 1 1000, 500
1 72 1 1000, 500 (no 1000 at 12Z)
10 Temperature 12 1 850, 500, 300
5 Vertical velocity 36 1 500
30 U wind 12 1 850, 500, 300
31 V wind 12 1 same
90 Total precipitation 36 1 1001
8. NMC Forecasts Available at NCAR (written September 1973)
a. Some forecasts for 24 and 36 h for OOZ for December 1968, January 1969,and May 1969. A more complete set of forecasts is available forDecember 1967, 00 and 12Z.
b. Starting August 1970:
24 h 500 mb H
36 h 1000, 850, 700, 500, 300 mb H

24
Chapter 3
c. Starting 15
12 h fcst.:
24 h fcst.:
36 h fcst.:
July 1971:
500 mb H, T; 850, 300 mb H
1000, 500 mb H
1000, 850, 700, 500, 300 mb H
650, 350 mb vertical motion
Precipitation forecast
d. Starting 1 January 1973:
12 h fcst.: U, V, H, T, at 850, 500, 300 mb
24 h fcst.: 1000, 500 mb H
36 h fcst.: 1000, 850, 700, 500, 300 mb H
500 vertical motion
Precipitation forecast
48 h fcst.: 1000, 500 mb H
72 h fcst.: 100, 500 mb H at 00Z
only 500 mb H at 12Z
9. Global Analyses from NMC
a. Introduction
Data Period: NCAR has data for 12Z, 31 October 1972 through 10 February
1974, 20-31 May 1974, and 2 July-23 September 1974. The file will re-
start about December 1974. Gaps are caused by machine changes and lost
tapes at NMC.
T. Flattery at NMC started running these test global analyses twice
a day in January 1972. We believe that they should be useful global
analyses starting 22 November 1972. The analyses are described by zonal
mean values, zonal harmonics in the east-west direction, Hough functions
in the north-south (program is called Huf-Puf), and other orthogonal
functions for the vertical. At first there were about 16 waves for each
horizontal direction and five vertical functions. During the archival
period there have been 24 waves in each horizontal direction and seven
vertical functions (smallest horizontal wave has a wavelength of 15°
latitude or longitude). Surprisingly, this resolution has been observed
to describe pressure troughs and jet stream core winds as well as or
25
Analyses from NMC
better than the analyses on the NMC mesh with a spacing (at the standard
latitude 600 N) of 381 km.
b. Height and wind analyses
Data were input at 12 levels: 1000, 850, 700, 500, 400, 300, 250, 200,
150, 100, 70, and 50 mb.
The number of 12-bit coefficients output is as follows for each of the
quantities: phase of heights, phase of winds (U and V handled together),
amplitude of heights, and amplitude of winds:
(7 in vertical) x (25 N-S) x (24 E-W)
The zonal mean values are given separately.
Descriptors for the vertical functions are also given. Since March 1973
a best choice of vertical functions is made each day from the global
raob data. The choice of functions changes little from day to day.
Initially the first guess was persistence. In areas far from observed
data, the methods that are used hold the persistence values rather rigidly
(even from summer to winter). On 14 September 1972, the northern
hemisphere forecasts were used as a guess north of 18 N, still persistence
elsewhere.
The guess became the output from Stackpole's 50 latitude-longitude,
8-level primitive equation model in October 1972. It worked correctly
starting 15 November 1972.
When this analysis program became the operational package (starting in
September 1974), the guess was Stackpole's 2.50 latitude-longitude,
8-level primitive equation model.
We have noted that average analyzed 150 mb winds at Gan Island in the
Indian Ocean for July 1973 show light westerly winds where the station
showed the normal easterly winds. This is probably due to some combin-
ation of: lack of observed data, a poor guess from the coarse resolution
forecast, something relating to the VTPR data, or the relative weighting
of winds vs heights in the tropics. The analysed wind data were about
250°/15 m s . The Gan observed monthly mean data was 0790/22 m s
NMC received data for 19 days during the month.
26
Chapter 3
The observed surface data were first used on about 30 April 1972.
VTPR satellite sounding data were available starting 22 November 1972.
These data were observed to improve the analyses considerably in the
southern hemisphere (even the zonal means changed). On each analysis
iteration, the heights for the VTPR soundings are recalculated, based
on the analyzed pressure-height near the surface. Thus, surface data and
rawinsonde data act to improve the reference level information for the use
of the infrared soundings.
The analysis program uses +6 h of VTPR data for the large scales and
only +3 h for the smaller scales.
Counts of the number of VTPR soundings for two random 12-h periods in May
1973 were 117 and 256 in the northern hemisphere, 159 and 222 in the
southern hemisphere.
On 14 May 1973, forecases from these analyses were first used to serve as
a guess temperature structure for the operational workup of the VTPR
soundings. This procedure was dropped after about three months because
a program bug apparently jacked the guess up by the height of the mountains
in the conversion from pressure sigma surfaces to heights and back. This
made pulses over Antarctica, and over mountainous areas, which were carried
along by the guess and may have caused good data to be thrown out. They
went back to the old guess for VTPR which was a blend of the northern
hemisphere forecasts, tropical forecast, and a simple southern hemisphere
analysis.
T. Flattery noted (May 1973) that his 50 mb analyses were rougher than
the operational analyses because he was not using as much smoothing.
c. Temperature and moisture analyses
Thickness temperatures are calculated from the height analyses. These
thicknesses are used to calculate temperatures at the mandatory levels.
The temperatures, in turn, are the guess for a reanalysis of the tempera-
ture for surface through 500 mb using temperature data. The surface
temperature is entered at its elevation in such a way that it can be
interpolated from the two surrounding mandatory levels. This analyzed
temperature starts on about August 1973. There is now (January 1975) some
27
Analyses from NMC
doubt as to whether the analyzed temperatures are recorded for
850-500 mb.
Humidity data are input at the levels 1000, 850, 700, 500, 400, and
300 mb. I believe that the first guess is persistence.
Data volume in the analyses
The number of bits in wave form in one analysis cycle is:
Bits - 60 bits per word (100 words + 4 x 845 words + 100 words
+ 4 x 400 words + 200 words)
- 3.25 x 105 bits per global analysis
If stored on a 2.5° grid point mesh, the volume is blown up by a factor
of about 30.
d. NCAR 2.50 Grid of global analyses
Because of its complexity and because machine time necessary to use the
Huf-Puf analyses in wave form is very high, NCAR is preparing an archive
of these data in 2.50 latitude-longitude grid point form.
For each analysis time there are 12 levels of height, temperature, U,
V grids (1000, 850, 700, 500, 400, 300, 250, 200, 150, 100, 70, 50 mb),
six levels of humidity (1000, 850, 700, 500, 400, 300 mb), and surface
temperature and tropopause pressure. This is 56 global analyses per time
or 224 hemispheric grids per day, each with 1032 x 60 bits.
Volume = 1.39 x 107 bits per day.
The 50 mb temperature grids are said to have problems because they are
derived from thickness temperatures and thus represent an extrapolation.

I

29
Chapter 4: Cloud, Humidity, Rain, Moisture, and Water Data
In this chapter, we will discuss only a portion of the available data. The
chapters on ETAC and NCC cover various sets of surface synoptic, daily summary,
and hourly rainfall data. Chapter 10 discusses the average monthly surface station
rainfall data. The satellite chapter indicates the brightness data that are
available. Note that the Nimbus-5 data include cloud pressure and amount.
Estimates of total clear column water vapor amount may be derived from the
satellite VTPR data.
1. Dew Point and Nephanalysis Data from AFGWC
Daily analyses are available at NCAR on the NMC octagonal grid for the
following levels:
Dew Point: 850, 700, 500, 400 mb
Nephanalyses: 1013 (total clouds), 850 mb (low), 600 mb (middle), 400 mb
(high). The period is 1 September 1963 - 20 November 1969, twice daily. Only
total clouds are available until 15 April 1964, when the layered clouds were
added.
2. Layer Humidity from NMC B-3 Tapes (at NCAR)
These are 1000-500 mb average relative humidity (3 March 1968 through
December 1972, 00 and 12Z, type 44). Starting in January 1973, there are three
layers of relative humidity.
3. U.S. Navy Moisture Analyses
The U.S. Navy has surface, 850, 700, and 500 mb moisture grids available from
about 1965. See Chapter 14.
4. Tropical Nephanalysis Data
Period February 1965 through January 1971 (at NCAR) and continuing. J. Sadler
of the University of Hawaii has prepared daily cloud cover grids for the equatorial
strip, 27.5°S to 30°N, with data each 2.5° of latitude and longitude. These data
are based on the nephanalysis charts from the Satellite Service which are, in turn,
based on brightness data from satellites.
30
Chapter 4
Maps of total average monthly cloudiness (30 N - 300 S) are given in
Atkinson and Sadler (1970).
5. Cloud Cover Based on Satellite Brightness Data
Global cloud cover based on four years of satellite mesoscale ( 40 x 40 km)
brightness data are also available. Observation time is about 1400 - 1600 local.
Has mean cloud cover, occurrence frequency of (a) 0, 1, 2 octas, (b) 3, 4, 5
octas, and (c) 6, 7, 8 octas. Tapes are available at NCC, Asheville. See Miller
and Feddes (1971). Other brightness data are discussed in the satellite chapter.
6. Average Clouds Based on Surface Observations
In a NASA study, the globe was divided into 29 climatic regions and monthly
statistics of cloudiness were prepared for each region, based on surface obser-
vations. Data for five cloud amounts (including clear and overcast), eight times
a day, and each month are given on 1740 punched cards. Included are data on cloud
changes with space and time. The climatic regions are located by 140 cards.
See Sherr et al. (1968).
7. Daily Stream-flow Data
The U.S. Geological Survey has prepared 12 tapes (1600 BPI) with the daily
stream-flow data for the United States. The set has 310,000 station-years of
data. Fof the most part, the file contains those records that have hydrologic
significance (excluding ditches, drains, etc.), and the file increases by about
14,000 station years per year. A related microfiche copy of a report is available
from the U.S. Geological Survey, Reston, Virginia.
8. Precipitation Data from Radar
a. Automatically digitized data
In October 1974, six U.S. radar sites had digitizers giving echo
intensity in 20 by 1 n mi increments out to about 120 n mi. There is
a scan each 12 min. Intensity in 256 levels. Thus, (180) (100 n mi)
(8 bits each) or about 150,000 bits each 12 min. This can be data-
compressed by a factor of four. Root-mean-square error on total rain
31
Cloud and Moisture Data
is about 13% using a 12 min scan, because of echo movement and intensity
changes. These data have not been archived yet.
There will be a digitizer at each of the 60 U.S. radar sites.
b. Manually digitized radar data
Archive started 1 July 1973, for an area of southeastern United States,
bounded approximately by Texas, Oklahoma, Tennessee, and Florida (these
states included). For each area 40 mi on a side, a digit is encoded in
each box, each hour. Codes 0-9 are for none, weak, very strong, and
include some information about echo coverage within the 40 mi box.
Plans are to go to a 20 mi box size. Information from D. Smith of the
National Weather Service. A report has been written.
The NWS Techniques Development Laboratory (TDL) has a similar data set
including all data from the Rockies eastward, starting 1 November 1973.
"Additive data" includes information about lines of echoes and changes
of intensity. Data for November 1973 to November 1974 are on one packed
1600 BPI tape. For the 1974 summer season, TDL is now making another
file of information about all severe storm reports (obtained from the
severe storms lab). Information from D. Foster, TDL (NOAA Techniques
Development Laboratory).
9. Soil Moisture and Drought Data
ETAC calculates soil moisture data. See Chapter 6, ETAC. Drought index
(1931 on) from the Palmer index is at NCC.

I
33
Chapter 5: Miscellaneous Data Sets
1. Gulf of Mexico Oceanographic and Atmospheric Data
Period of data: October 1968 through November 1971.
The data-gathering stations were installed on six offshore oil platforms
located about in an east-west line about 90 km south of the Louisiana-Mississippi
coastline.
The recorded data are wind speed, wind direction, barometric pressure, time,
and two wave staffs. Several hurricanes went over the network. (Available from
NCC.)
2. Ozone Data
NCAR has data prepared by J. London, University of Colorado, that contain all
the daily global total ozone data that he could locate and clean up. There were
about 20 stations in 1957 and 80 stations in 1972. Data prior to 1957 are spotty.
Oxford records go back to 1950 and Arosa records to 1932.
London has also provided gridded average total ozone data for each month from
May 1957 through December 1970. The grid is global and 10° latitude by 10°
longitude.
3. EOLE French Balloon Data
Data period 21 August 1971 to 23 December 1972 (satellite orbits 0065-7075).
Gives the position of drifting balloons over the southern hemisphere. Six
tapes have all of the data and one tape has the data for 27 August 1971 - 5 July
1972 without correction matrices. Data at NCAR. The French prepared a movie
showing balloon drift; NCAR has a print.
4. Line Islands Experiment
Surface and upper air data obtained in the Line Islands during the period
February-April 1967 are discussed in NCAR TN-35, A Catalog of Meteorological
Data Obtained During the Line Islands Experiment, (Zipser and Taylor, 1968).
These data are also archived at NCAR.

34
Chapter 5
5. Aircraft Data for GATE
NCAR is processing the aircraft data from the GATE experiment (June to
September 1974). The packed, calibrated, primary data base at NCAR from seven
aircraft will be about 3 X 1010 bits, including gust probe data. A set of these
data will be archived in one-minute averages on about 2 X 108 bits at NCAR. Most
of the data will also be available for distribution in higher volume character
formats. A copy will be available from NCC.
6. Southeast Asia Mesoscale Upper Air Data
This data set includes rawinsonde data for about 20 stations, often four times
a day starting in about April 1967. The soundings usually went up to about 300 mb.
This data set was being processed by the Army. Its current status is unknown.
7. Water Vapor Spectrum Lines
AFCRL has a data tape giving data for 110,000 lines of the water vapor spectrum.
8. Station Library Information
NCAR has a tape prepared by USAF ETAC showing the location and elevation of
WMO surface and upper air reporting stations. Elevations of raob stations are
checked by downward hydrostatic checks. When WMO data are corrected, this fact
is indicated. The tape has all WMO stations regardless of receipt. New tapes
are made each month, but NCAR does not usually obtain the updates.
9. Data from National Hail Research Experiment (NHRE)
There are now data from the NHRE experiment for the years 1972, 1973, and 1974.
The operational periods were:
1972: 1 May - 29 Jul (22 hail days)1973: 1 May - 9 Aug (6 hail days)1974: 13 May - 9 Aug (29 hail days)
The NHRE definition of a hail day is somewhat arbitrary.
Rawinsondes
There were four, five, and two raob stations for the three summers. Each
35
Miscellaneous Data Sets
generally took three or more soundings during every day of the operational
period.
Surface Observations
There were hourly and special surface observations at the upper air stations
for the hours 0800 to 1800 local time.
Mesoscale Network OBS
In a 70 by 70 km region in northern Colorado, there were about 30 stations
(running 24 h per day) with strip charts showing pressure, temperature, humidity,
wind and rain. These sites also had hail pads. Most of the rainfall charts have
been digitized, as have some of the other charts.
Precipitation Network
In addition to the 30 mesoscale stations, there were about 90 stations with
recording rain gauges and hail pads and 200 stations with regular rain gauges or
hail pads or both.
Radar Data
There were up to seven radars in operation. The scan data were recorded
digitally, and the magnetic tapes processed to produce simulated radar scope
pictures on microfilm. In 1974 there were 40 days with microfilm output. In
addition, a limited number of direct photographs of the radar scopes are available.
Aircraft Data
These data include digital data from penetrations of clouds and from flights
around the clouds.
For further information contact NCAR.
10. Data at the National Severe Storms Laboratory (NSSL)
NSSL concentrates on obtaining mesoscale data (surface, upper air, and
radar) during the period of about 15 April to 15 June. Radar data are obtained
for the whole year. The upper air mesoscale rawinsonde data network has included
as many as ten raob stations in an area 100 by 100 n mi. The surface mesoscale
network in the same area often had about 64 stations.
36
Chapter 5
11. Data at the Illinois State Water Survey (ISWS)
Hourly rainfall data for an east central Illinois station network from
1956-1967 (49 stations in summer, 25 in winter), are on cards. They have Saint
Louis Experiment rainfall data starting June 1971 to last five years, for June,
July, and August. ISWS has the upper air sounding data from the Saint Louis
Experiment. They have surface 1009 cards (daily rain, maximum and minimum
temperatures, etc.) for about 50 stations in Illinois, about 1901-1971. Data are
also at NCC.
37
Chapter 6: ETAC. Environmental Data Sets
at USAF Environmental Technical Application Center
1. Introduction
This gives some information (as of January 1975) about the data sets held by
the Air Force Environmental Technical Applications Center (ETAC), headquartered in
Washington, D.C. ETAC will move to Scott AFB, Illinois in July 1975. The text
sometimes refers to Offutt AFB, Nebraska, which is the location of the Air Force
Global Weather Central (AFGWC). Appendix 1 gives an area breakdown and report
counts of many of the major sets of data. Most of these data sets are saved at
Asheville, North Carolina, where they can be easily accessed by ETAC or by NCC.
A subunit of ETAC is located at Asheville. Some of these same data are also
described in Chapter 7 (NCC). Some of the analysis data are described in
Chapter 2. Major W. Buchan and Ralph Russell of ETAC have been a tremendous help
in providing most of this information and helping to resolve the various questions
that have arisen.
In this writeup, some data sets are referred to by Pnnn numbers, even though
ETAC has since dropped this numbering scheme.
2. Surface Data -- Synoptic Code and Airways
Appendix 1 discusses the availability of surface synoptic data and airways
code data in TDF 13 or TDF 14 formats. Between 1940 and about 1965 the data were
usually punched onto cards from hard copies and finally were incorporated into
TDF 13 and 14 which are arranged in station sequence. From about 1965 to 1970
the data were generally received on magnetic tape, decoded and manually edited.
From 1971 on the data have been taken as decoded and checked by AFGWC, with
additional quality control done only as required for specific projects.
a. Surface synfile (synoptically ordered file)
This is an ETAC decode of data from Carswell (data from communications
circuits) with some data still from other sources. For example, some
overseas circuits were recorded before they could be communicated to the
United States. This data set is called COLFAC data. The file started
1 June 1964 (2, 3, 5, 6 August 1964 are missing). Then almost no data
are missing up to June 1973.
38
Chapter 6
Years Usual No. of Days/Tape
1964/65 7
1966 6
1967/68 5
1969 4
1970 3
Only identical duplicates have been eliminated. Airways and synoptic
reports are included (but not combined, as Offutt does). Surface ship
observations are also in this set. There are consistency checks against
wild data but no checks for consistency with time (662 tapes up to
15 January 1972).
Captain Fenix (ETAC) thinks the quality is very good from 1966 on but is
less sure about 1965. In January 1972 there were about 9300 active
stations in the world. These are stations which normally report at least
once per day. Many stations give three-hourly data, some six-hourly,
and only once or twice per day.
The number of active stations was higher than in the tapes from Offutt
or NMC.
b. Surface synfile from AFGWC
These surface data are the decoded data from Offutt. Thus duplicates
have been eliminated and airways and synoptics combined. A copy of these
tapes are saved at NCC, called the surface Datsav. Loose binary pack.
Average length, 1200 bits each; 8.4 X 106 bits per day; 70,000 obser-
vations per day (but synoptics and airways at the same times combined
to one).
c. Archive at NCC of these surface synoptic files
NCC has the COLFAC decode tapes from January 1967 through May 1973.
Starting in June 1973 they have the tapes decoded from AFGWC. They pull
off eight synoptic and ship observations per day to use in other files.

39
Data at USAF/ETAC
d. Sfc stafile (surface station file)
Data are in order by station, then date. One month for a number of
stations on a tape. The ships are at the front of the tape (block 00)
until November 1971, then at the end of the tape. Starting January 1965
from COLFAC data (a above). This station-ordered file has all of the
data in the associated synoptically ordered set plus some hand inserted
data from decode or library rejects at the end of the month. Has 546
tapes up to December 1971.
e. Sfc stafile from the surface synfile decoded by AFGWC
Starts January 1971. One month of data for a number of stations on a
tape. Ships at end of the number sequence each month. Was about
13 tapes per month, now 18. Synoptic and airways reports combined. About
8.4 X 107 bits per day.
f. ARPA surface data
This is an improved set of global surface synoptic and airways data
starting January 1965. From January 1965 to June 1971 this set has data
from TDF 13 synoptics and TDF 14 airways as well as the COLFAC data in
d above. From July 1971 through May 1973 it has data from COLFAC and
AFGWC decodes (d + e above). Starting June 1973 it is solely the AFGWC
decode. The AFGWC decode saves wind gust data, the COLFAC decode did not.
This ARPA set contains synoptics, hourlies, specials. Rainfall is
included if reported. Synoptics and airways at the same hour are
combined.
This is a station-ordered file by years: One year of first station,
one year of second, etc. Permanent ships have block 99 and a station
number. The roving ships are in a separate file. The Navy FNWC ship
file is probably somewhat better than this one. An exact synoptic file
version of this set is not being prepared, but a above is very similar
and b above should be the same in recent months.
The volume increases from about 65,000 observations per day in 1965 to
about 80,000 observations per day now (February 1975). Average 1200 bits
each, 8.4 X 107 bits per day.

40
Chapter 6
ETAC plans to concentrate on saving the most recent ten years of data.
3. Upper Air Data
As in the case of the surface data, ETAC has decoded earlier data that were
saved by the communications system in order to get a better decode. In recent
years the AFGWC decode has become the only source.
a. P210 Upper air COLFAC data in synoptic file.
Only identical duplicates eliminated. Not hydrostatically checked yet.
Data are fairly continuous from 2 November 1964.
Years Usual No. of Days/Tape
1965/66 7
1967 10
1968/69 8
1970/71 6
In January 1972 ETAC received data from 1600 active upper air stations.
Raob and pibal stations that reported any data were counted. This is
more than AFGWC or NMC were obtaining then. This set includes permanent
ships, moving ships, and aircraft reports, but not dropsondes (375 tapes
to 31 December 1971).
b. Upper air synoptic data from Offutt (called Hydro tapes).
Starts 27 April 1966. From 1966 to 1968 there are usually about
6 days per tape. Data to 1 November 1969. The raobs had a radiation
correction applied until about August 1968; the corrections were applied
only to the higher mandatory levels and not to the corresponding sig-
nificant levels. After this date there is some gap in the data set,
and then it is in packed binary rather than in BCD, and it does not
have the radiation corrections applied. NCAR has some of these data.
c. Later upper air synoptic file from AFGWC.
These upper air Datsav tapes from Offutt started in 1970. ETAC says
the coverage and quality of the COLFAC is normally better where they
overlap in time, but by the time the COLFAC decode stopped, the AFGWC
decode was nearly as good. Has land raobs and pibals, and ship and
41
Data at USAF/ETAC
aircraft data. Usually three tapes per month, about 4700 observations of
all types per day.
d. Archive at NCC of these upper air synoptic files.
NCC has the COLFAC decode tapes from January 1967 through December 1972.
The data before 1968 are in a different format and, like the later COLFAC
data, have not been hydrostatically checked; the data set, however, has
been used with success. Starting January 1973 the tapes were decoded at
AFGWC. These are all in the NCC tape set 9601. In addition NCC makes a
selection-merge of data from the AFGWC and NMC tapes to produce a file
of raobs in TD 5600 format (started in July 1971).
e. P240 Upper air station file, from P210 COLFAC.
Only one month for a number of stations on a tape. Has land raobs and
pibals, and ship and aircraft data. Starts January 1968. At end of each
month a few stations that fail decode or library checks are inserted in
this set that are not in the synoptic set. Has 191 tapes January 1968
to December 1971, and continues.
f. P370 Upper air stafile from AFGWC.
September 1970 on. Much of the first of this data set has been thrown
away because the set from COLFAC data (P240) is better. ETAC does not
really use this until January 1973. They noticed a slight drop in quality
when they shifted to the AFGWC data in January 1973, and then a gradual
improvement. Data are hydrostatically checked at GWC. One month of data
for many stations on a tape.
g. ARPA Upper air data.
This will start with January 1968. It is the COLFAC set P240 through
1972, then the AFGWC set P370. It is all in the AFGWC Datsav format
(loose binary, variable length blocked). The data from COLFAC will also
be hydrostatically checked. The other raob TDF sets will not be used in
the preparation of this. Work on this set is starting at ETAC OL-A in
Asheville. They have received 300 tapes of data for January 1968 to
December 1972, and will receive about 72 more through December 1974.
They hope to have the set of data through 1974 finished by September 1975.
42
Chapter 6
It will then be in Datsav format on about 322 tapes. It will be in
station order within years: first station for a year, next station,
etc. Includes land raobs and pibals, and ship and aircraft data.
4. Satellite Soundings
Temperature retrievals from the IR radiances from the military satellites are
being saved as received from AFGWC. The radiances are not saved yet. See
Chapter 13 for more information.
5. TDF 13 Surface Synoptic Data
See Appendix 1 for a global breakdown. Each observation is variable length
with 65 standard characters and an estimated average of 15 more characters. Thus
total volume (excluding block fill characters) is: (107,231,000 observations)
(80 characters each) = 8.58 X 10⁹ characters.
6. Analyses from AFGWC
a. Northern hemisphere analyses
Analyses from AFGWC at Offutt (on the NMC northern hemisphere octagonal
grid). A more detailed listing of the available height, temperature,
cloud, and moisture analyses is given in Chapter 2.
Multilevel heights 1 Jan 1962 - 20 Aug 1970, continuing
Multilevel temperatures 1 Jan 1962 - 20 Aug 1970, continuing
Multilevel nephanalyses 1 Sep 1963 - 20 Nov 1969
b. Tropical analyses
Tropical analyses from Offutt starting August 1970. Winds and tempera-
tures for 40°S - 400N. Levels: surface and 850, 700, 500, 400, 300,
250, 200, 150, 100, 50 mb; this now (February 1975) goes to 10 mb. The
analysis guess was 6 h persistence, but this was blended with the
northern hemisphere forecast from 20 to 400N, and with a southern
hemisphere forecast when available from September 1971. The result was
then blended with 10% climatology to produce the guess that was used.
Each level was analyzed independently with no additional methods to
43
Data at USAF/ETAC
provide more vertical consistency. Two tapes per month. (1 August 1970
to 15 January 1972 uses 32 tapes.)
c. Southern hemisphere analyses
These analyses are for 15 levels from 1000 to 10 mb and start in
January 1972.
d. Upper-air analysis data base
The later years of the AFGWC analysis data are restructured in the
following ways for this data base, so that they can be more easily used
with the 3-D nephanalysis: This data base is maintained in two parts,
northern hemisphere and southern hemisphere. Each of the hemispheric
disks is divided into 64 boxes, as in the 3-D nephanalysis data base.
Within each box there are 64 grid points in an arrangement of eight rows
and eight columns. The data elements for each point are pressure and
temperature of the surface level; D value, temperature, and wind
components for 15 levels above surface; dew point temperature of the
surface, 850, 700, 500, and 400 mb levels.
Data are maintained for the 00Z and 12Z hours. The sequence of the file
is YR-MO-DA-HR-BOX-POINT-ELEMENT. Each hemisphere-year-month is a
separate subfile within the data base.
The period of record for the northern hemisphere begins with January
1971; for the southern hemisphere it begins with January 1972.
e. Monthly averages of analysis data
Year-month averages of the analysis data will start with January 1971
for the northern hemisphere and January 1972 for the southern hemisphere.
These will give means and standard deviations of height, temperature, U,
and V for the levels 1000 through 10 mb. Moisture will be included
through 400 mb.
f. Three-dimensional nephanalysis data base
1) The 3-D nephanalysis data base is formulated into two parts, the
northern hemisphere (3DNEPHNHA) and the southern hemisphere
(3DNEPHSHA). Each of the hemispheric disks is divided into 64 boxes.
Within each box there are 4096 grid points in an arrangement of 64

44
Chapter 6
rows and 64 columns. Figure 6 (la and lb) shows the arrangement
graphically.
Twenty-two parameters are reported at each grid point. The first
seven are cloud types (3), weather, maximum tops, minimum bases, and
total coverage. The remaining 15 are percent cloud amounts for 15
layers of variable thicknesses. The first layer goes from the surface
to 150 ft above the ground. The top of successive layers are 300,
600, 1000, and 2000 ft AGL, and 3500, 5000, 6500, 10,000, 14,000,
18,000, 22,000, 26,000, 35,000, and 55,000 ft MSL. The horizontal
resolution is one-eighth NMC mesh or about 45 km at 600N. The
analysis procedure uses satellite, aircraft, and conventional data.
See Coburn (1970) for a description of the procedure.
3DNEPHNHA is reported every three hours at 00, 03, 06, 09, 12, 15, 18,
21Z. The general period of record began in August 1970. Initially
32 boxes were reported; additional boxes were added in 1971 and 1972.
Sixty boxes are reported currently (boxes 1, 8, 57 and 64 are not
reportable since they are off the disk). Figure 6-1 shows the be-
ginning period of record for each box in the northern hemisphere.
The data base is kept in BOX-TIME sequence.
3DNEPHSHA period of record begins in May 1974. These data are not
currently processed into box-time files but are maintained in
synoptic sequence.
Volume: There are
5.905 X 105 bits per box analysis
1.726 X 109 bits per box year
2) Low, middle, high cloud file
This is a condensed version of the 3-D nephanalysis and has about
one-fourth the volume.
3) Histogram file
This file keeps histograms of cloud frequency from 3-D nephanalysis
by month, level, and time of day. There are 6.5 X 109 bits per
hemisphere.

45
Data at USAF/ETAC
g. AFGWC Boundary-layer model (BLM) grids
BLM analyses began in August 1970 at AFGWC for the U.S. window, 00Z and
12Z. The European and Asian windows were added later (see table below).
Mesh size is one-half NMC (100 n mi). The levels are: surface, 50, 150,
300, 600, 900, 1200 and 1600 m. Parameters are: U, V, W wind components,
temperature, specific humidity, specific moisture (vapor plus liquid),
relative humidity, and D-values. Only levels 1, 2, 5, and 6 were avail-
able until April 1973. When the data are prepared at AFGWC hourly
forecast values are also available, but these are dropped from the data
tapes before transmission to ETAC. See Hadeen (1970) for a description of
the boundary layer model.
Area Start Date # Points Degrees
U.S. Window Aug 1970 29 X 27 45N 137W, 62N 53W,17N 107W, 23N 70W
European Window 18 Jul 1974 29 X 35 73N 55W, 45N 91E32N 06W, 22N 48E
Asian Window 18 Jul 1974 29 X 35 44N 111E, 72N 110W21N 153E, 32N 155W
7. Other Data Sets at ETAC
a. Astrogeophysical data
ETAC has been accumulating AFGWC-processed solar/geophysical data since
January 1972. The original set contained 23 parameters; five more were
added in July 1974. The parameters include sunspot counts, flare data,
ionosonde data, and maximum and minimum observable radio frequency for the
ionospheric layers (120 magnetic tapes have been accumulated through
December 1974).
b. Long-term precipitation means from charts
Monthly data on an I,J grid. For Europe and Asia, not for North America.
On a 60 mi grid. Probably based on rain data for about 1950 to 1965.
c. Soil moisture
Calculated from precipitation, etc., in P200. Only available for selected
areas. One tape for a month. Saved for only a few months.
46
Chapter 6
d. Airfield summary data
ETAC has published worldwide airfield climatological summary data in 23
volumes, covering all of the world's runways over 3000 ft in length
(about 4500). In some cases a "closest station" had to be used rather
than one right at the airport. Monthly mean snowfall is included. Wind
rose data are not given, but the frequencies of days with winds over
17 kt and over 27 kt are given. These data are also on about 60 magnetic
tapes at ETAC Washington.
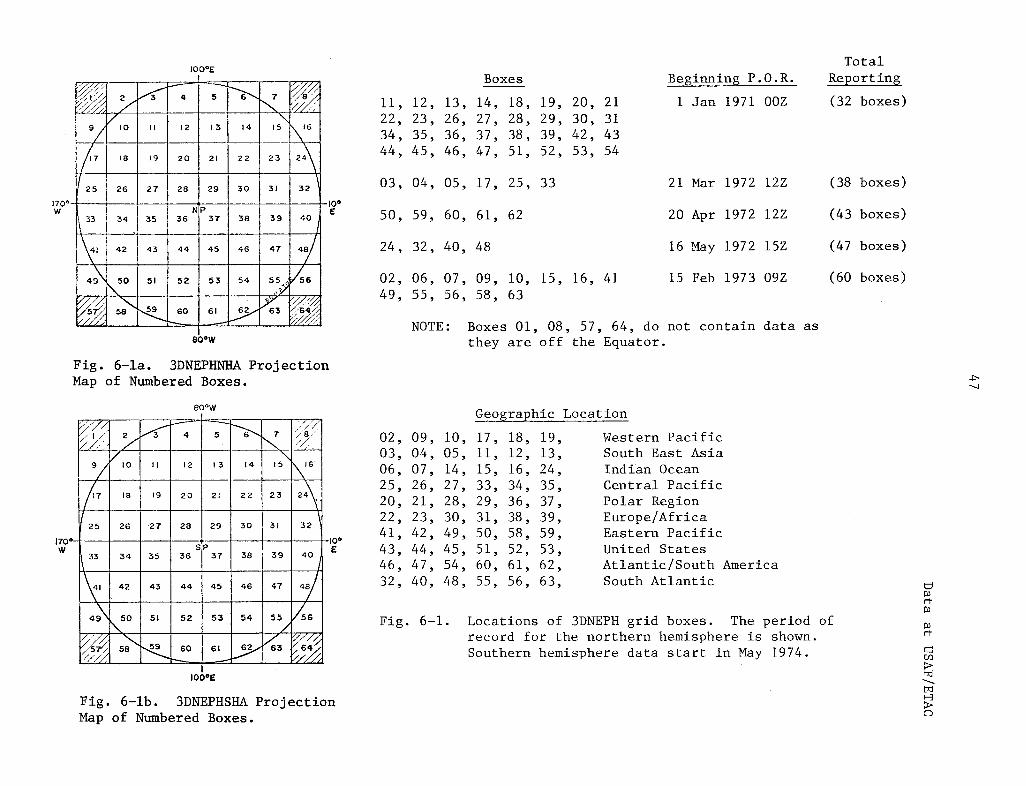
28
100°E
2 3 5 4 7
9 10 II 12 13 14 15 16
7 18 19 20 21 22 23 24
/ . \~~~~~~~~~~~~~~~~~~~~~~~~~~~~~~~~~~~~~~~~~~~~
322927
P373635
41 42 43 44 45 46 47 48
49\ 50 51 52 53 54 55 ,/56
57/ 58 5 60 6o 1 6 63 64X
80°W
11,22,34,44,
30 31
170" f ' i I I 4oo----- ---4 + -0'
38 39 40,
Boxes
12, 13, 14, 18, 19, 20, 2123, 26, 27, 28, 29, 30, 3135, 36, 37, 38, 39, 42, 4345, 46, 47, 51, 52, 53, 54
03, 04, 05, 17, 25, 33
50, 59, 60, 61, 62
24, 32, 40, 48
02, 06, 07, 09, 10, 15, 16, 4149, 55, 56, 58, 63
Beginning P.O.R.
1 Jan 1971 OOZ
21 Mar 1972 12Z
20 Apr 1972 12Z
16 May 1972 15Z
15 Feb 1973 09Z
TotalReporting
(32 boxes)
(38 boxes)
(43 boxes)
(47 boxes)
(60 boxes)
NOTE: Boxes 01, 08, 57, 64, do not contain data asthey are off the Equator.
Fig. 6-la. 3DNEPHNHA ProjectionMap of Numbered Boxes.
26 28
80°W
X-: 2 3 4 5 6 7 8
9 II 1 2 13 14 15 \16
'17 I 18 19 20 21 22 23 24
1/II
322725
403938363534
41 42 43 44 45 46 47 48
49\ 50 51 52 53 54 55 /56
57 58 59 60 61 62 3 A 64m
29
170-1 i- - + -- i,.._
W33 37
30 31
Geographic Location
02,03,06,25,20,22,
41E 43,
46,32,
09,04,07,26,21,23,42,44,47,40,
10,05,14,27,28,30,49,45,54,48,
Fig. 6-1.
17,11,15,33,29,31,50,51,60,55,
18,12,16,34,36,38,58,52,61,56,
19,13,24,35,37,39,59,53,62,63,
Western PacificSouth East AsiaIndian OceanCentral PacificPolar RegionEurope/AfricaEastern PacificUnited StatesAtlantic/South AmericaSouth Atlantic
Locations of 3DNEPH grid boxes. The period ofrecord for the northern hemisphere is shown.Southern hemisphere data start in May 1974.
tjP3rt
C)
cicnI'l
I100°Elvv-t
Fig. 6-lb. 3DNEPHSHA ProjectionMap of Numbered Boxes.
26
w33 34

I

49
Chapter 7: NCC. Data at the National Climatological Center
1. Introduction
NCC, in Asheville, N.C., is the main data archive in the United States for
meteorological data. It is under the Environmental Data Service (EDS) of NOAA.
In this writeup, we will only consider some of their main data sets. Analyzed and
observed data from NMC flow into NCC. Data from the Air Force AFGWC go to ETAC in
Washington, D.C., and, finally, most of it goes to the ETAC unit in Asheville.
Some of the Navy FNWC data also goes to NCC. There is a Navy unit at Asheville.
When data are punched by civilian or military sections at NCC, they become part of
a common data pool. Data on tape or cards from various foreign or United States
sources also become a part of the pool, although there is bound to be somewhat less
knowledge of data sets that were not locally created.
Much of the satellite data also now goes to NCC in Asheville, but the plans
are for it to be stored at NESS.
A number of the sets of NCC data will be treated outside of this section of
the text. Also some of the sets listed may be superseded by the same data in
better condition in a reformatted set.
For the U.S. first-order stations, there were many station moves from city
locations to airports during the period 1935-1939. Then between about 1955 and
1965 many of the instruments were moved from shelters on airport roofs to remote
reading locations above the grass in the middle of the airport. Only about five
of some 300 first-order stations were not moved in the period from 1935 to 1970.
Information about published climatic data can be found in Selective Guide
to Published Climatic Data Sources (NCC, 1969). The LCD (Local Climatic Data)
NCC publications provide information about the station histories.
2. Listings of Data Holdings
Appendix 1 gives a broad view of the data holdings within some of the sets
of observed surface and upper air data. The information for this appendix was
prepared by ETAC in December 1974. Appendix 2 gives a data listing prepared by
NCC and NCAR in 1975.
3. Rawinsonde Data
The U.S. sondes used during the approximate period 1963 to 1972 could give

50
Chapter 7
mixing ratios (in moist air and sunny skies) of 12 g/kg rather than the correct
20 g/kg. The humidity element absorbed too much direct sunlight and gave a
relative humidity appropriate to this elevated temperature and not to the cooler
actual temperature reported by the temperature element. The archived raob data
do not include any stratospheric radiation corrections made after data receipt.
See Mclnturff and Finger (1968) for suggested corrections as a function of instru-
ment type, pressure level, and solar elevation angle.
Canadian data are not now (January 1975) available at NCC past September
1971.
a. Rawinsonde mandatory and significant level data (TDF 5600)
Since 1971 the U.S. rawinsonde data have been saved in this format, which
includes significant levels. Some of the new data are converted to the
older formats and vice versa (2000 characters per raob).
b. Raob mandatory level cards (Deck 645) January 1961 - June 1971
The Deck 645 raob mandatory level cards were punched for Canadian stations,
for U.S. stations, and for selected other stations with bilateral agree-
ments. The mandatory levels are for each 50 mb in the lower troposphere.
There are about 33 levels in the normal sounding. These data are thus
more extensive and better checked than the data transmitted by teletype.
The wind direction is given to the nearest degree. Data are on 59
7-channel, 556 BPI tapes at NCC. Received on 32 9-channel, 1600 BPI tapes
at NCAR. Volume: 9.4 X 10⁸ characters.
c. Rawinsonde data -- mandatory levels (TDF-54) January 1928 - December 1971
ETAC has put many of the available U.S. and foreign mandatory level data
onto tape in TDF 54 format. This has 800 characters per raob and provides
for up to 40 levels. Data at constant pressure levels, except in early
periods when they are at constant heights. The U.S. data mostly start in
1946; Canadian data start in about 1955. The earlier U.S. constant height
raobs generally started about July 1939. The constant pressure data
include Deck 541 (1946-1948), Deck 542 (1949-1952), Deck 544 (1952-1955),
Deck 545 (1956-1960), and parts of Deck 645 (1961-1971). These data
are in a common set of units.

51
Data at NCC
Area: Worldwide, including ocean weather stations
Volume: 5,155,000 observations from 1412 stations,
800 characters per raob, on 535 reels of 9-track tape
d. Northern hemisphere rawinsonde (January 1949 - June 1971 on)
Area: Northern hemisphere
Rawinsonde observations going as high as 10 mb, 600 stations, on
magnetic tape
e. Rawinsonde data - Northern hemisphere Scherhag set (March 1954 -
December 1962)
Data from 31 northern hemisphere stations, once a day
The data are on magnetic tape
f. Dropsondes, Ptarmigan-Arctic (Deck 610) June 1951 - November 1959
Volume: 24,000 observations on two reels of Fosdic film
(Also, there are other decks of dropsonde and reconnaisance observations.)
g. Monthly means of rawinsonde data (about 1950 on)
NCC and NCAR have tapes of these data which are being cleaned up. These
data can be found in the NCC publication, Monthly Climatic Data of the
World.
h. Raob signal levels (Deck 606) January 1945 - May 1963
Area: Worldwide land and ships, mostly U.S. Nearly all of these are
for only the seasonal months January, April, July, and October. After
1952, this set will be mostly redundant with the data in Deck 505.
Volume: 5,000,000 significant levels (about 397,000 observations) on
431 reels of Fosdic film.
i. Radiosonde significant levels (Deck 505) July 1952 on
Area: United States, Canada, Mexico, Caribbean Sea, Antarctica, South
America, North Atlantic Ocean, Pacific Islands. Canadian data
are mostly from 1957 on.
Volume: 20,000,000 significant levels (about 1,450,000 observations)
on 125 reels of 9-track tape.

52
.apter 7
4. Winds Aloft Data
The mandatory level rawinsonde observations will include wind data for many
stations that are not in these sets.
a. WBAN winds aloft (TDF-53) January 1918-December 1964
Global coverage
Volume: 5,119,000 observations on 500 reels of 9-track tape
b. Foreign winds aloft (TDF 52) January 1922-December 1966
Global coverage, not including North America
Volume: 3,853,000 observations on 150 reels of 9-track tape
c. Winds aloft WBAN January 1945-August 1965
From 1400 worldwide stations
From rawinsonde and pilot balloons (Weather Service, Air Force, Navy,
and Canadian stations.)
The data are on Fosdic film
d. Upper air winds (Deck 508) March 1951-February 1959
For 950 to 10 mb, United States, Canada, Puerto Rico, Canal Zone
Volume: 275,000 observations on 25 reels Fosdic film
e. Upper air winds, Eurasian (Deck 500) January 1951-February 1958
Area: Asia, Europe, Greenland, North Africa
Volume: 115,000 observations on ten reels Fosdic film
f. Winds aloft, Canadian (Deck 685) July 1955-July 1971
Area: 70 stations in Canada
These data are on magnetic tape. They are also included in TDF-53
through 1964.
5. Rocketsonde Data at NCC (January 1975)
NCC has all of the U.S. data and a portion of the foreign data on about 24
tapes. The data for U.S. stations for 1961 through 1968 are on 12 tapes in an
earlier format. The main effort started in 1969; this tape format includes data
53
Data at NCC
for U.S. and foreign stations. The U.S., South American, and Spanish stations are
on one tape each four months. (In January 1975, data are available through 1972;
1973 should be ready in two months.)
There are three delayed data tapes. One is from Russian land stations with
some data back to 1961. Another similar tape contains Russian ship data, and
another has some of the Australian and Japanese data. NCC is attempting to obtain
more of these data.
The January 1970 and 1972 issues of the High Altitude Meteorological Data
Publications from NCC have inventories of the data. The January 1973 issue will
contain another inventory and will be published about July 1975.
6. Surface Synoptic Observations
Most of the smaller sets are not listed here. See Appendix 1 for coverage of
land synoptic observations.
a. Surface synoptic observations (TDF-13) January 1901 on
Area: worldwide land (not including the United States)
Volume: 64,000,000 observations on 1300 reels of 9-track tape
b. Surface synoptic observations, Norwegian January 1951-December 1956
Volume: 280,000 observations on two reels of 9-track tape
Surface synoptic observations, Greenland
Volume: 107,000 observations on two reels of 9-track tape
c. Surface marine synoptic observations (TDF-11) January 1854 on
See Chapter 17 for a more complete discussion.
Area: worldwide ocean (grouped by 100 latitude-longitude squares)
Volume: 43,000,000 observations on 375 reels 9-track tape
7. Airways Data
a. General
NCC has hourly observations from about 300 to 400 U.S. first-order
stations on tape for the period January 1949-December 1964. A number of
54
Chapter 7
stations go back to 1930. Starting in January 1965, only eight obser-
vations per day have been punched.
Worldwide U.S. military stations were still punched each hour through
December 1970 and are on tape. The punching of the military data stopped
when the receipt of the teletype data was considered good enough.
The tapes from ETAC-AFGWC have about 30,000 hourly airways and special
reports per day. These are for all stations received on the teletype
circuits, not just the first-order stations.
In 1977, NCC will get hourly information plus specials directly from about
1000 stations. They will be a primary node in the communications system.
b. Airways surface observations (TDF-14) January 1940 on
Area: worldwide land, mostly United States, 1800 stations. The U.S.
stations came from Deck 1440 and generally start in July 1948.
Volume: 166,000,000 observations on 2800 reels of 7-track, 556 BPI tape
through 1973.
c. Hourly surface observations (Deck TD-9753,928) January 1965-December 1970
Area: North Atlantic and North Pacific Oceans
Volume: 315,000 observations on two reels of 9-track tape
8. Daily Surface Data for United States
a. Daily data from U.S. Cooperative Stations and First-Order Stations (at NCC)
Daily data for about 12,000 stations are punched and checked at NCC
(Deck 486, punched from Form 612-3, formerly 1009, and First-Order
Summary of the Day from MF 1 10B). The data include at least daily
precipitation and most stations report maximum and minimum temperatures.
Evaporation data are included from 500 stations. The State Climatologists
assisted NCC with data checking until their positions were eliminated in
1973. Data for the current year are on four tapes per month: three
for the United States, Caribbean, Alaska, and Hawaii; and one for
delayed data.
55
Data at NCC
Once a year, between March and June, the previous year's file is combined
onto 20 reels. The data through about 1970 are organized on tapes by long
station time series within each state.
Through cooperative agreements with universities and state agencies, some
records as early as 1879 are included. Approximately 600 stations have
30 or more consecutive years of data. These long-term records are usually
from suburban areas. Some states have no data prior to 1948. The
general beginning date for this file is 1948. Data prior to October 1963
were placed on Fosdic film for retention, but by July 1975 all of these
will be placed on tape. The volume of observations in CD 486 on tape is
110,000,000 card images (80 characters each) on 700 reels of 9-track tape
and covers the United States, Caribbean, Alaska, Hawaii, Pacific Islands,
and a very small number of Canadian stations.
b. Summaries and climate division data
The world records data (year-month mean surface) are on tape at NCC and
NCAR; they are discussed in the NCAR section.
c. Surface observations - monthly means of 1009 (Deck TD 9924, 932)
January 1891 on
Area: United States, Caribbean, Pacific Islands
Volume: 4,000,000 observations on 30 reels of 9-track tape
d. Surface observations -- monthly summaries and daily data (TD 9716)
1 January 1960 on
Area: United States, Pacific Islands, Puerto Rico
Data for first-order stations, including some monthly summaries by hours.
From airways Deck 1440 (hourly or three-hourly data). Summary of winds by
speed categories, etc. Published in LCD (Local Climatological Data)
summaries.
Volume: 4,000,000 observations (80 characters each) on 22 reels of
9-track tape.
e. Station climatology
A tape containing station climatologies is also available. A new two-
volume publication of the station climatologies may be purchased from NCC.

56
Chapter 7
f. Climatic division data -- monthly summaries (Deck 475) January 1931 on
For the 400 climate divisions in the United States, this deck gives year-
month means of temperature and precipitation.
Volume: one tape
g. Daily and weekly data for climatic divisions (about 1965 on)
Includes daily maximum and minimum temperatures, by U.S. climatic
divisions. Heating and cooling degree days were calculated from this.
9. Other Daily Surface Observations
a. Summary of day observations (TDF-34) January 1885 on
Area: worldwide land (mostly United States)
Volume: 20,000,000 observations on 900 reels of 9-track tape
b. Summary of day observations (U.S.) (Deck 331) January 1934-December 1944
Volume: 90,000 observations on eight reels of Fosdic film
c. Summary of day observations (TDF 30)
NCC is gradually putting many summary-of-day observations into this
format. Now all summaries for first-order stations (Deck 345) and some
of Deck 486 have been converted. TDF 34 will also be converted.
d. Summary of day, Canadian Arctic (Deck 335) January 1955-December 1967
Area: Canadian Arctic
Volume: 24,000 observations on one reel of tape
e. Surface daily winds, ocean station vessels (Deck 328) January 1948-
December 1972
Area: North Atlantic, North Pacific
Volume: 25,000 observations on one reel of 9-track tape
10. Rainfall Data
In addition to the sets below, rainfall data are also given in the airways
data, the surface synoptic data, the radar data, the daily summary data, and the
monthly mean data.
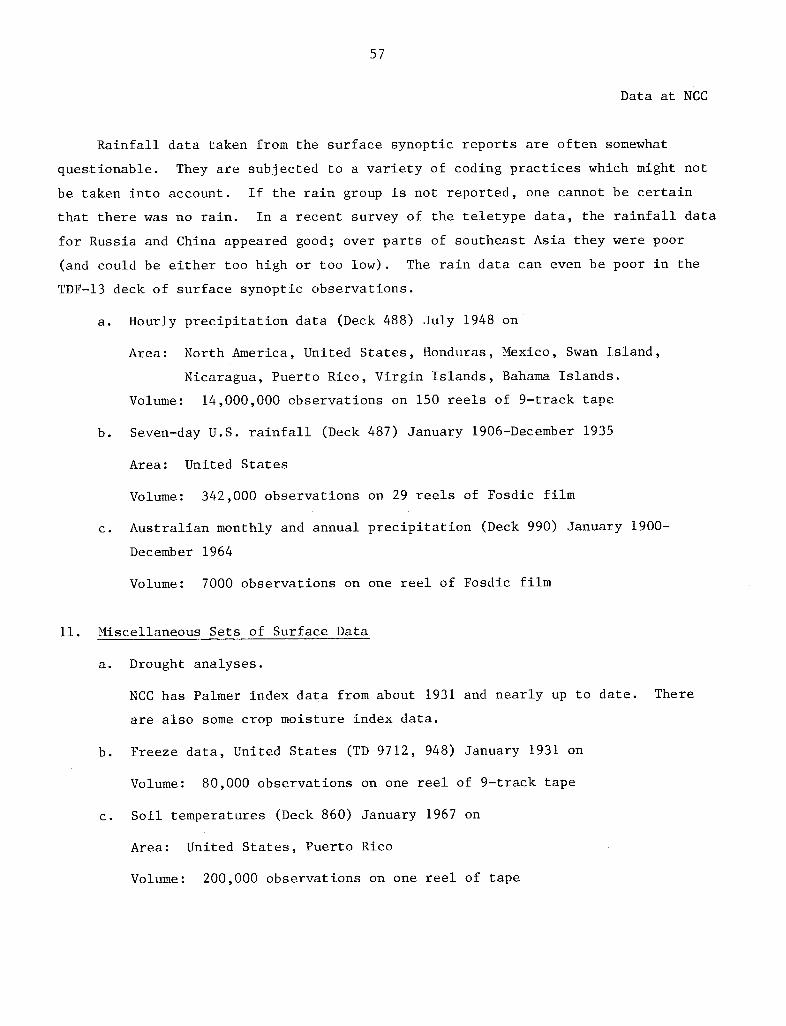
57
Data at NCC
Rainfall data taken from the surface synoptic reports are often somewhat
questionable. They are subjected to a variety of coding practices which might not
be taken into account. If the rain group is not reported, one cannot be certain
that there was no rain. In a recent survey of the teletype data, the rainfall data
for Russia and China appeared good; over parts of southeast Asia they were poor
(and could be either too high or too low). The rain data can even be poor in the
TDF-13 deck of surface synoptic observations.
a. Hourly precipitation data (Deck 488) July 1948 on
Area: North America, United States, Honduras, Mexico, Swan Island,
Nicaragua, Puerto Rico, Virgin Islands, Bahama Islands.
Volume: 14,000,000 observations on 150 reels of 9-track tape
b. Seven-day U.S. rainfall (Deck 487) January 1906-December 1935
Area: United States
Volume: 342,000 observations on 29 reels of Fosdic film
c. Australian monthly and annual precipitation (Deck 990) January 1900-
December 1964
Volume: 7000 observations on one reel of Fosdic film
11. Miscellaneous Sets of Surface Data
a. Drought analyses.
NCC has Palmer index data from about 1931 and nearly up to date. There
are also some crop moisture index data.
b. Freeze data, United States (TD 9712, 948) January 1931 on
Volume: 80,000 observations on one reel of 9-track tape
c. Soil temperatures (Deck 860) January 1967 on
Area: United States, Puerto Rico
Volume: 200,000 observations on one reel of tape
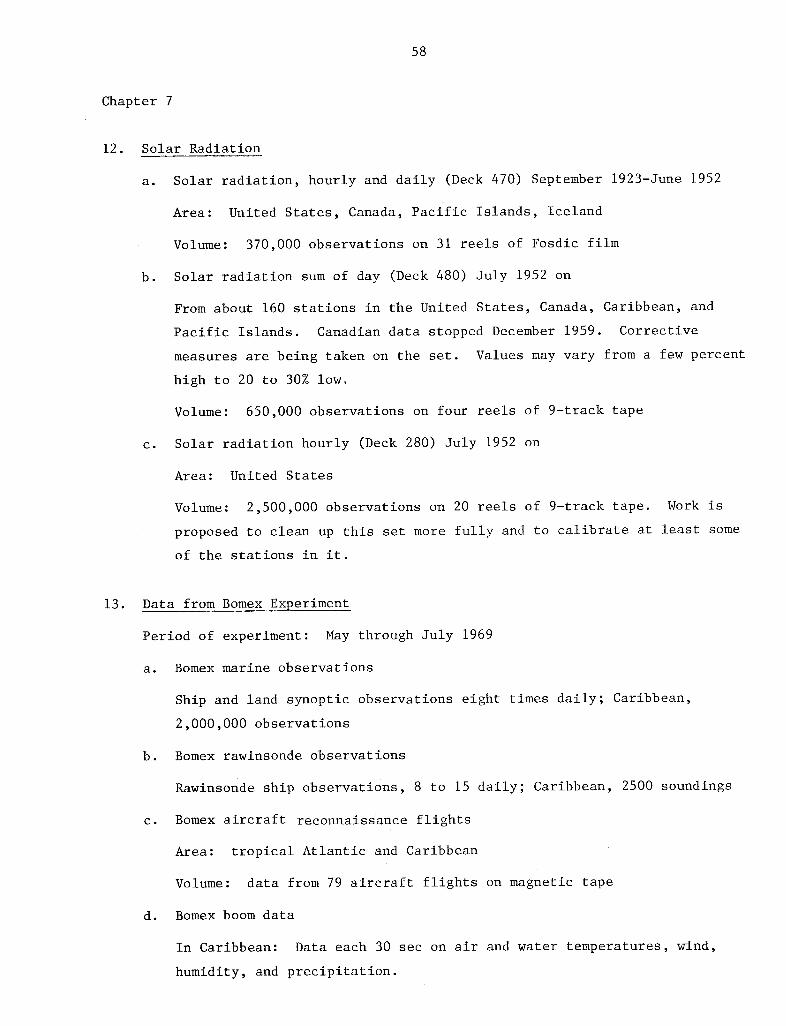
58
Chapter 7
12. Solar Radiation
a. Solar radiation, hourly and daily (Deck 470) September 1923-June 1952
Area: United States, Canada, Pacific Islands, Iceland
Volume: 370,000 observations on 31 reels of Fosdic film
b. Solar radiation sum of day (Deck 480) July 1952 on
From about 160 stations in the United States, Canada, Caribbean, and
Pacific Islands. Canadian data stopped December 1959. Corrective
measures are being taken on the set. Values may vary from a few percent
high to 20 to 30% low.
Volume: 650,000 observations on four reels of 9-track tape
c. Solar radiation hourly (Deck 280) July 1952 on
Area: United States
Volume: 2,500,000 observations on 20 reels of 9-track tape. Work is
proposed to clean up this set more fully and to calibrate at least some
of the stations in it.
13. Data from Bomex Experiment
Period of experiment: May through July 1969
a. Bomex marine observations
Ship and land synoptic observations eight times daily; Caribbean,
2,000,000 observations
b. Bomex rawinsonde observations
Rawinsonde ship observations, 8 to 15 daily; Caribbean, 2500 soundings
c. Bomex aircraft reconnaissance flights
Area: tropical Atlantic and Caribbean
Volume: data from 79 aircraft flights on magnetic tape
d. Bomex boom data
In Caribbean: Data each 30 sec on air and water temperatures, wind,
humidity, and precipitation.

59
Data at NCC
Volume: 2,000,000 observations on magnetic tape
14. Cyclone Positions
a. Tropical cyclone positions
This NCC set has about 70,000 12-hourly positions up through about 1971
(12,000 in the North Atlantic, 20,000 in the North Pacific, and 10,000 in
the Indian Ocean). Some of the data include the central pressure and
maximum winds. Some six-hourly positions are given. Data from a number
of sources are included. For example, data are included from Chin's
(1972) Tropical Cyclone Climatology for the China Seas and Western
Pacific from 1884 to 1970. After about 1947, data from reconnaissance
aircraft were often used to position the storms. Since about 1960,
satellite pictures have been available. Chin's book includes central
pressure and peak winds (NCAR has a copy).
b. Extratropical cyclone positions (1899 present)
For the period 1899-1939, there are once-a-day low pressure centers with
central pressure. For June 1965 to the present, there are six-hourly
positions, with central pressure only given at 12h. On tape.
15. Tower Data - Cedar Hill, Texas (December 1960-December 1962)
Wind and temperature data at 12 levels, 30-1420 ft, near Dallas. Observations
each 40, 280, or 580 s.
Volume: 256,000 observations on five reels of 9-track tape.
16. Data Sets Stored Elsewhere that are Related to NCC Data
a. In the section on NCAR data holdings, a number of sets are discussed which
originated partly or totally at NCC.
b. Maximum and minimum temperatures, daily precipitation data
Data at the Extended Range Forecast Laboratory (NMC), based on information
from R. Gelhard, September 1971.
The Extended Forecast Laboratory has tapes based on daily card data for
108 stations in the 48 contiguous states. The period of record is

60
Chapter 7
1947-1965; the data were from NCC. Their tapes contain cleaned-up
data (and no missing values) of maximum and minimum temperatures and
total daily precipitation. The Techniques Development Laboratory added
about 32 U.S. and Canadian stations, and Gelhard thinks that these were
also cleaned up.
The Extended Forecast Laboratory put the original cards (Gelhard thinks
WBAN-3 cards) on tape and edited them; the original records were used
to fill in the many missing values and to correct many errors.
c. Station data
A number of states have tapes that have much of the past station data.
A program should be started to identify such data unless they merely
duplicate NCC holdings without additional cleanup, etc.
d. The Bonneville Power Administration, in cooperation with several other
federal and state organizations maintains extensive sets of surface data
on magnetic tape for several western states and for British Columbia.
17. Ozone Soundings from Balloon Ascents (January 1963 through May 1969)
AFCRL Ozonesonde NetworkThe first eight months of data are
in one format on 11 tapes for 11 stations;
not much data on each tape. The rest of FAIRBANKS SHULE
the period is on two tapes. Bedford has
data for 68 months with 451 observations.
The next best station is Goose Bay with CHURCHILLS\SEATTLE e ^ S GOOSE BAY
53 months and 178 observations. The data
have been summarized by Hering and PT. MUGU FT. COLLINS GREEN BAY BEDFORD
Borden (1967). 0 J

61
Data at NCC
18. Coastal Observing Stations
There is no combined set of coastal station observations. Some Weather
Service stations such as Miami Beach record water temperatures on WBAN-10 forms,
but they are not punched because there is no room for the data in the card format.
Until recently there has been little standardization in Coast Guard station
practices. The WMO synoptic code includes a code group for water temperature
data, so if the code is used and if NMC or AFGWC decode the data, then the water
data should be available with the rest of the synoptic data at NCC. Such sets of
global synoptic code data start in 1965.
19. Atmospheric Turbidity Data
Starting in 1971 (and punched through October 1973 as of March 1975), NCC
has taped data for about 60 global stations measuring turbidity. Most of these
stations are in the United States. The data are published in the annual publi-
cations by NCC, Atmospheric Turbidity and Precipitation Chemistry Data for the
World.
The earlier data are being prepared by the Environmental Protection Agency
at Research Triangle Park and will then be sent to NCC. See Flowers et al.
(1969) for information about turbidity over the United States.
20. Data from GATE Experiment
The data from the June-September 1974 GARP Atlantic Tropical Experiment are
being archived at World Data Center-A at NCC. A GATE data catalog has been pre-
pared by NCC with the assistance of CEDDA. The data include ship surface and
rawindsonde data, ship radar data (digital and picture), satellite data (digital
and picture), boundary-layer data, aircraft data, radiation data, and oceanographic
data. The snyoptic-scale and global data will also be available. These data are
being prepared by the GATE National Processing Centers and Subprogram Centers and
will be sent to NCC when the data processing is completed.
A number of WMO publications about GATE are available. People ordering from
all countries except the United States should write to the WMO in Geneva, Switzer-
land. Orders from the United States should be sent to WMO Publications Center,
UNIPUB Inc., P. O. Box 433, New York 10016.

I

63
Chapter 8: Upper Air Observed Data
Section A: Upper Air Observed Data in Synoptic Order
NCAR has upper air data in synoptic sequence starting in May 1958. The
first five years were from MIT. Since about 1962, the synoptically filed data
are from real time teletype data decoded by the numerical weather centrals. These
data include significant-level information. In fact, more significant-level data
have been transmitted over teletype than were post-punched for U.S. stations at
NCC until procedures changed in 1971. The data coverage on the NMC tapes became
global (as received operationally) in June 1966.
1. From NMC
Data Period: 4 March 1962 - current.
NCAR has tapes containing the upper air data received synoptically at the
weather centrals. Figure 1-2 shows NMC data coverage on typical days in 1968 and
1974. This plot was computer-made by scanning one of the time periods on a tape
from NMC. (The coverage became global in June 1966.) Data from 4 March 1962 to
31 December 1972 are on 377 tapes. For earlier years up to 44 sounding times
(22 days) are stored on each tape; in 1972, about 15 sounding times are stored
per tape. Previous to 1 November 1969, only the 00Z and 12Z soundings were
archived; since 1 November 1969, 06Z and 18Z records have also been kept for a
few months, the former in the 00Z file and the latter in the 12Z file. To obtain
these data from 4 March 1962 to 31 December 1972, NCAR read 1,845 B-3 tapes from
NMC. The tapes have the upper air data received within about 10 h of 00 or 12Z.
Prior to 1973, the aircraft data were deleted on the tapes for NCC, but NCAR
retained these data. Starting on 1 January 1973, there is a format change to a
character code. NCAR receives the data on four tapes per month and is normally
within about six weeks of being up to date.
The NMC tapes include aircraft wind reports, wind data from the cirrus blowing
off from cumulonimbus clouds ("blowoff winds"), wind data from the drift of clouds
seen on ATS film loops, atmospheric temperature soundings calculated from
satellite infrared soundings, and "bogus" data put in by analyses to help the
objective analysis programs. See the satellite data chapter for more details.
For the GATE period (June-September 1974), tapes are available that contain
the six-hQurly data.

64
Chapter 8
2. From AFGWC
Data Period: 24 July 1966 - 28 August 1969 (many missing).
NCAR has 1,620 sounding times (00, 12Z) of these data through 28 August 1969.
These are now on 101 tapes, usually 18 sounding times (9 days) per tape. See the
section on data sets at ETAC for more information about these data. Time periods
covered with only minor skips are:
Day Mo. Yr. thru Day Mo. Yr.
24 7 66 29 7 66
14 10 66 2110 66
10 11 66 16 11 66
9 1 67 17 1 67
22 1 67 2 2 67
4 3 67 12 3 67
10 4 67 17 4 67
3 5 67 18 5 67
DaysMissing
75
18
54
5
60
27
15
Day Mo. Yr. thru Day Mo. Yr.
6 6 67 5 7 68
12 7 68 15 1 69
20 1 69 6 5 69
9 5 69 1 6 69
6 6 69 14 6 69
20 6 69 1 8 69
24 8 69 28 8 69
"Missing" gives the approximate number of days of data missing in the gap from the
previous date. Each sounding time usually has about 620 rawinsondes (of these
about 330 give wind by height as well as wind by pressure). There are 280 wind
soundings with no raob, and 450 to 700 aircraft reports. The original set of data
at ETAC is more complete (see chapter six).
3. At FNWC
The section on data at FNWC describes the upper air data that are available
on their tapes. NCAR now only has a small amount of these data.
4. Northern Hemisphere from University of Missouri, MIT, NCC
Data Period: May 1958 through April 1963.
Rawinsonde data for this five-year period were obtained from Prof. Ernest
Kung of the University of Missouri (OOZ and 12Z data are in the set). The data
originated on 60 tapes at Prof. Starr's General Circulation Laboratory at MIT.
Kung did some additional cleanup work on the data. Most of the original data were
DaysMissing
17
6
4
2
4
5
23
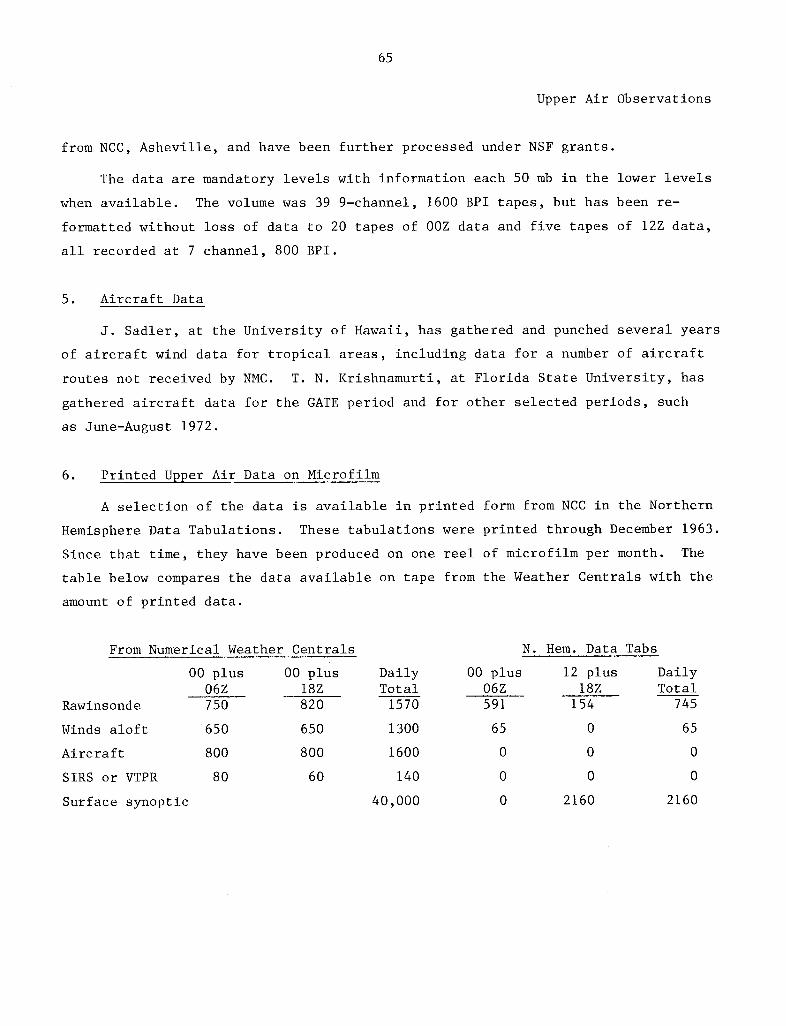
65
Upper Air Observations
from NCC, Asheville, and have been further processed under NSF grants.
The data are mandatory levels with information each 50 mb in the lower levels
when available. The volume was 39 9-channel, 1600 BPI tapes, but has been re-
formatted without loss of data to 20 tapes of OOZ data and five tapes of 12Z data,
all recorded at 7 channel, 800 BPI.
5. Aircraft Data
J. Sadler, at the University of Hawaii, has gathered and punched several years
of aircraft wind data for tropical areas, including data for a number of aircraft
routes not received by NMC. T. N. Krishnamurti, at Florida State University, has
gathered aircraft data for the GATE period and for other selected periods, such
as June-August 1972.
6. Printed Upper Air Data on Microfilm
A selection of the data is available in printed form from NCC in the Northern
Hemisphere Data Tabulations. These tabulations were printed through December 1963.
Since that time, they have been produced on one reel of microfilm per month. The
table below compares the data available on tape from the Weather Centrals with the
amount of printed data.
From Numerical Weather Centrals
00 plus 00 plus06Z 18Z
Rawinsonde 750 820
Winds aloft 650 650
Aircraft 800 800
SIRS or VTPR 80 60
Surface synoptic
DailyTotal1570
1300
1600
140
40,000
N. Hem. Data Tabs
00 plus 12 plus Daily06Z 18Z Total591 154 745
65 0 65
0 0 0
0 0 0
0 2160 2160
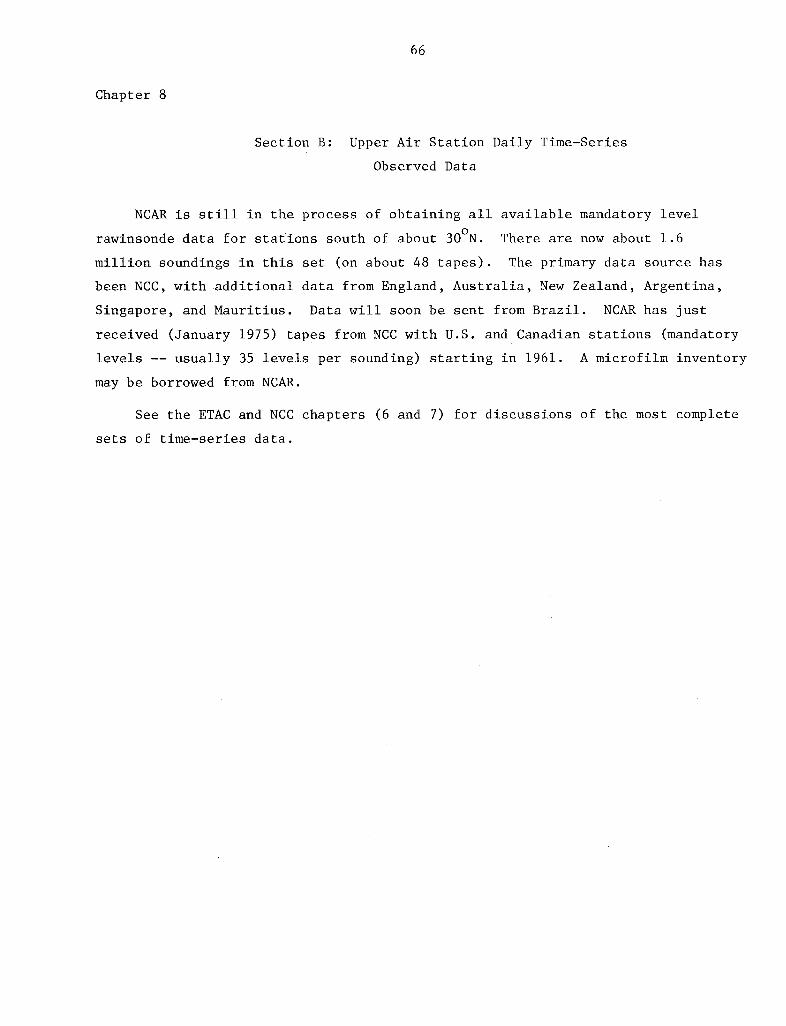
66
Chapter 8
Section B: Upper Air Station Daily Time-Series
Observed Data
NCAR is still in the process of obtaining all available mandatory level
rawinsonde data for stations south of about 300 N. There are now about 1.6
million soundings in this set (on about 48 tapes). The primary data source has
been NCC, with additional data from England, Australia, New Zealand, Argentina,
Singapore, and Mauritius. Data will soon be sent from Brazil. NCAR has just
received (January 1975) tapes from NCC with U.S. and Canadian stations (mandatory
levels -- usually 35 levels per sounding) starting in 1961. A microfilm inventory
may be borrowed from NCAR.
See the ETAC and NCC chapters (6 and 7) for discussions of the most complete
sets of time-series data.
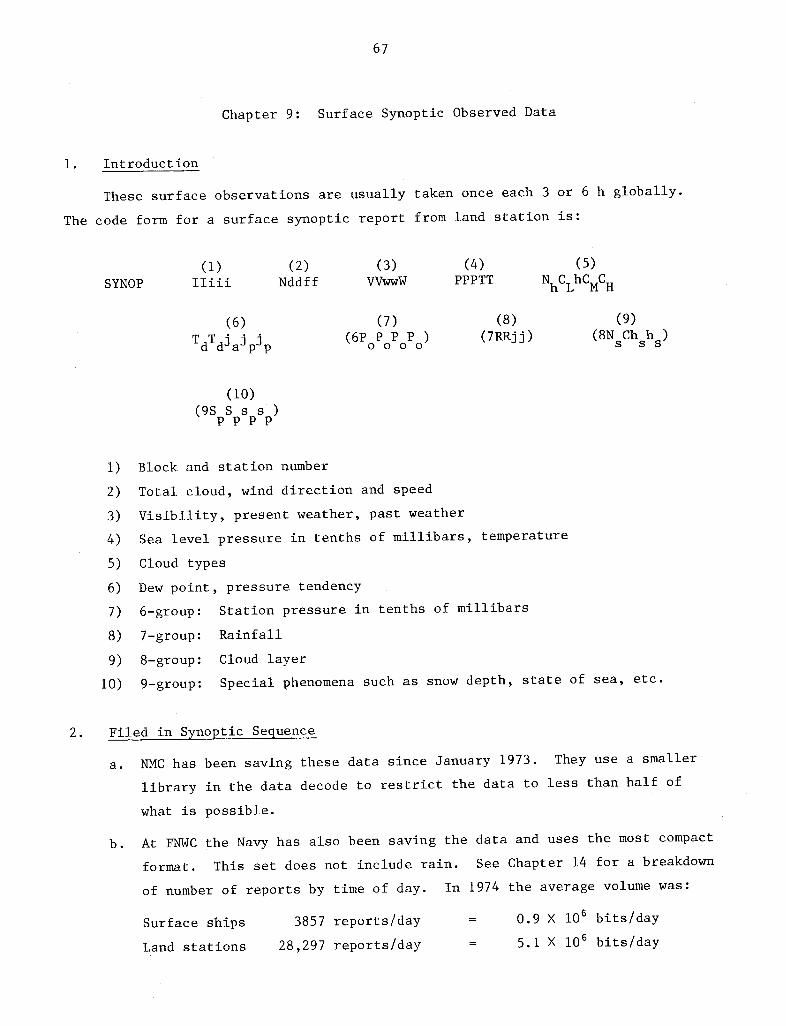
67
Chapter 9: Surface Synoptic Observed Data
1. Introduction
These surface observations are usually taken once each 3 or 6 h globally.
The code form for a surface synoptic report from land station is:
(1) (2) (3) (4) (5)
SYNOP IIiii Nddff VVwwW PPPTT NCLhCMCH
(6) (7) (8) (9)
TdT ajpjp (6P P P P ) (7RRjj) (8N Ch h )ddapp oo0 o s s s
(10)(9S S s s )
P P P P
1) Block and station number
2) Total cloud, wind direction and speed
3) Visibility, present weather, past weather
4) Sea level pressure in tenths of millibars, temperature
5) Cloud types
6) Dew point, pressure tendency
7) 6-group: Station pressure in tenths of millibars
8) 7-group: Rainfall
9) 8-group: Cloud layer
10) 9-group: Special phenomena such as snow depth, state of sea, etc.
2. Filed in Synoptic Sequence
a. NMC has been saving these data since January 1973. They use a smaller
library in the data decode to restrict the data to less than half of
what is possible.
b. At FNWC the Navy has also been saving the data and uses the most compact
format. This set does not include rain. See Chapter 14 for a breakdown
of number of reports by time of day. In 1974 the average volume was:
Surface ships 3857 reports/day = 0.9 X 106 bits/day
Land stations 28,297 reports/day = 5.1 X 106 bits/day

68
Chapter 9
c. Chapter 6 describes the surface synoptic data sets that have been decoded
at either ETAC or AFGWC. These are the only sets that contain data from
airways hourly reports (specials are included) as well as the synoptic
code data. In 1974 they contain about 50,000 synoptic reports per day
and 30,000 separate airways reports that have not been combined with a
synoptic.
d. NCAR has these data for 19 February 1967 through 25 April 1967, for
December 1967, and for the summer 1974 GATE period. We are now obtaining
a more comprehensive data set.
3. Filed in Time-Series Order
a. See Chapters 6 and 7 on ETAC and NCC. Note the table for TDF-13 in
Appendix 1 and the listing for surface synoptic data in Appendix 2.
b. NCAR has only a trivial amount of these data.

69
Chapter 10: Climatological Year-Month Surface
and Upper Air Data; Tree Rings
We will discuss the surface and upper air data that are available in averages
by single months or longer. Some tree ring data are also discussed. The avail-
ability of monthly mean grid point data is discussed elsewhere.
1. Monthly Mean Rawinsonde Data
We are cooperating with NCC to make a set of about 75,000 global mean monthly
rawinsonde reports available (CLIMAT reports). The southern hemisphere climatology
project made extensive use of these data. Error detection and correction work on
the northern hemisphere reports is not yet completed.
NCAR has made monthly summaries of about 2,000,000 daily rawinsonde sound-
ings. The output includes momentum transports, etc. Calculations have not been
made on U.S. raobs yet.
GFDL obtained about nine years of rawinsonde data from NCAR that had been
picked up by NMC from communications circuits. A. Oort at GFDL is having these
put into time-series sort and screened for errors; calculations of year-month
means, variances, and co-variances are being made.
2. Monthly Mean Reports from Surface Stations
NCAR has about 887,000 monthly mean reports from surface stations with
global coverage. In the period from 1731 to 1860 the number of stations in-
creased from 1 to 84. From 1870 to 1900 the number increased from 138 to 438.
In the decade 1961-1970 there were 1722 stations; of these, 541 were in the
southern hemisphere. In the total period there were about 487,000 reports of
average monthly sea level pressure, 458,000 reports of station pressure, 821,000
reports of temperature, and 887,000 reports of rainfall. (See Table 10-1 for
a general inventory.) These data include the World Weather Records data (mostly
from NCC, but six months punched at NCAR), and Clayton's (Smithsonian) Weather
Records. The latter were punched at NCC under contract with John Wolback of
Harvard College Observatory. Volume: two binary tapes, or four in BCD format.
Another data set contains monthly rainfall data from 200 Pacific Island
stations. Many of the periods of records are longer than 30 years. Ronald
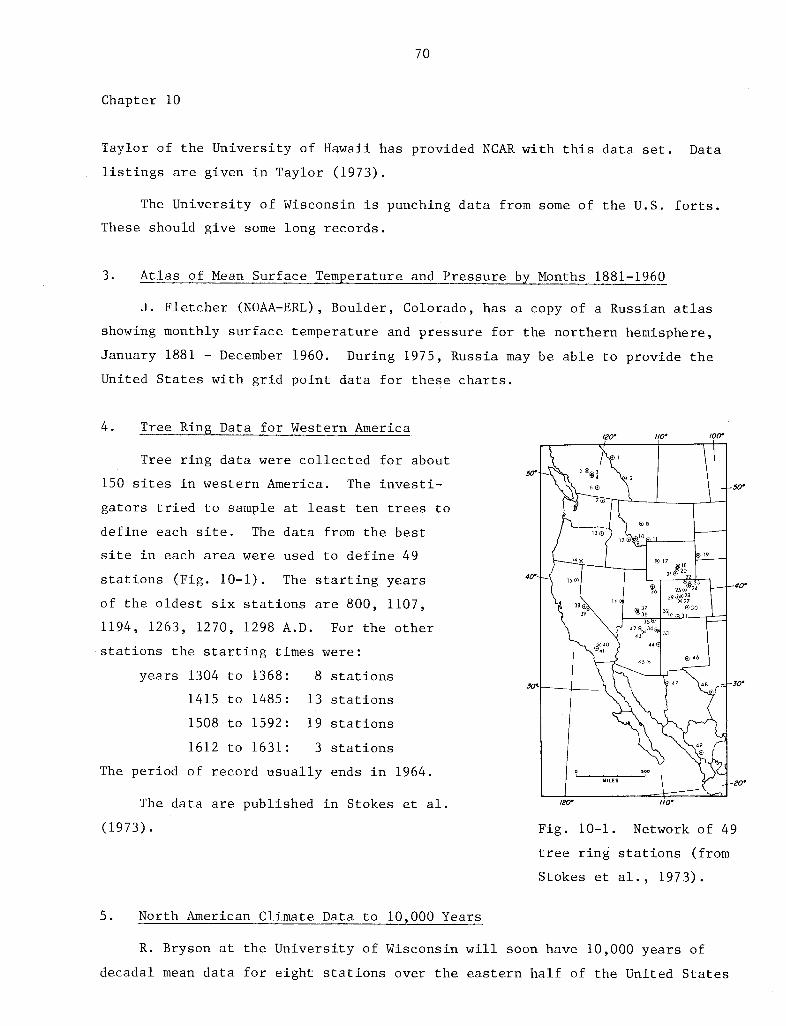
70
Chapter 10
Taylor of the University of Hawaii has provided NCAR with this data set. Data
listings are given in Taylor (1973).
The University of Wisconsin is punching data from some of the U.S. forts.
These should give some long records.
3. Atlas of Mean Surface Temperature and Pressure by Months 1881-1960
J. Fletcher (NOAA-ERL), Boulder, Colorado, has a copy of a Russian atlas
showing monthly surface temperature and pressure for the northern hemisphere,
January 1881 - December 1960. During 1975, Russia may be able to provide the
United States with grid point data for these charts.
4. Tree Ring Data for Western America120' I/10' I00
Tree ring data were collected for about \C50' - 5
® 23
150 sites in western America. The investi- 6
gators tried to sample at least ten trees to
define each site. The data from the best / ,
site in each area were used to define 49 1 1
stations (Fig. 10-1). The starting years 40' 2
of the oldest six stations are 800, 1107, 8 16 293 7
1194, 1263, 1270, 1298 A.D. For the other 3
stations the starting times were:
years 1304 to 1368: 8 stations
1415 to 1485: 13 stations
1508 to 1592: 19 stations
1612 to 1631: 3 stations
The period of record usually ends in 1964. . ..MILES \
The data are published in Stokes et al. / i/o'
(1973). Fig. 10-1. Network of 49
tree ring stations (from
Stokes et al., 1973).
5. North American Climate Data to 10,000 Years
R. Bryson at the University of Wisconsin will soon have 10,000 years of
decadal mean data for eight stations over the eastern half of the United States
71
Year-Month Data, Proxy Data
and Canada. From the pollen data, they hope to provide objective estimates of
snowfall to + 20%, rain within 10%, growing season + 5 days, and mean temperature
+ 0.5°C.
6. Data Bank of Early Climatological Sources
The Center for Climatic Research at the University of Wisconsin has estab-
lished a catalog of references containing information of past weather conditions.
Some sources are original, whereas others are summaries or analyses of original
data. The data bank was begun to help extend climatological records back in time
and to provide quantitative, although perhaps discontinuous, information of past
environments. These data may provide sufficient environmental information to
enable a better understanding of temporal and areal relationships between given
events and the environment.
Resources are organized by location (latitude and longitude, country, and in
some cases smaller scale political divisions). References are punched on computer
cards and may be queried by location or time (years before 1950), or both, thereby
yielding a list of the appropriate references, including parameters contained in
the source, the frequency of observations, and the length of the record.
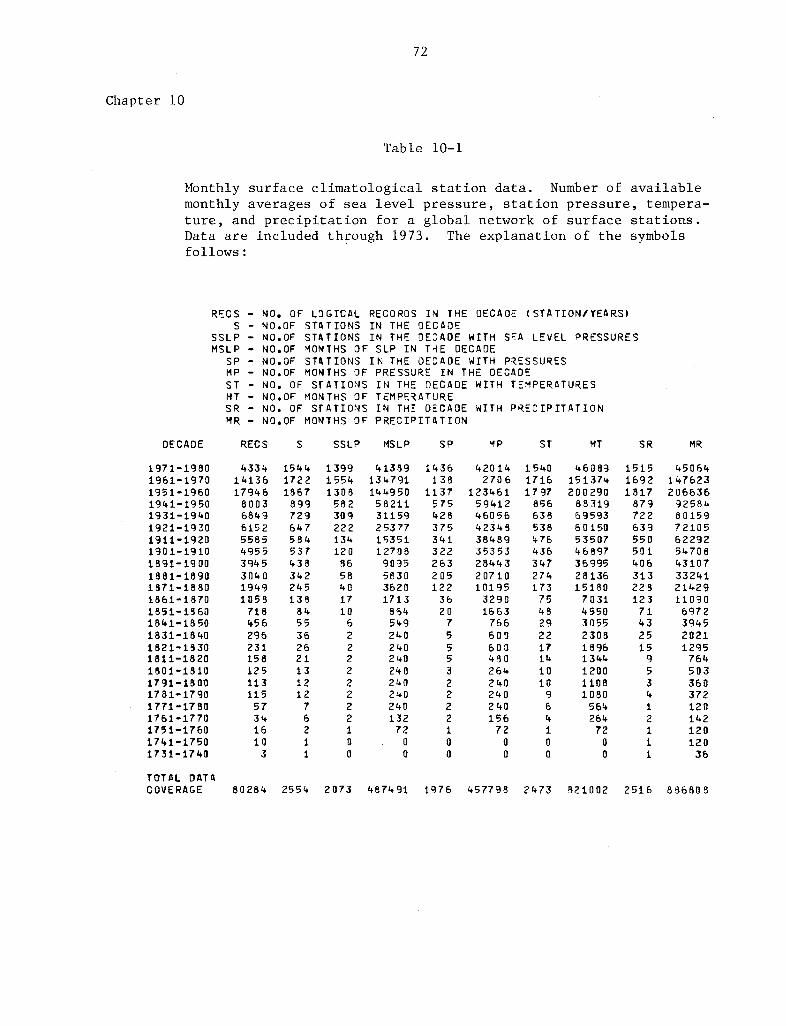
72
Chapter 10
Table 10-1
Monthly surface climatological station data. Number of availablemonthly averages of sea level pressure, station pressure, tempera-ture, and precipitation for a global network of surface stations.Data are included through 1973. The explanation of the symbolsfollows:
RECSS
SSLPMSLP
SPMPSTMTSR
NO, OF LOGICAL RECORDS IN THE DECAOE (STATION/YEARS)NO.OF STATIONS IN THE DECADENO.OF STATIONS IN THE DE3ADE WITH SEA LEVEL PRESSURESNO.OF MONTHS OF SLP IN THE DECADENO.OF STATIONS IN THE OECADE WITH PRESSURESNOOF MONTHS OF PRESSURE IN THE DECADENO, OF STATIONS IN THE DECADE WITH TEMPERATURESNO OF MONTHS OF TEMPERATURENO. OF STATIONS IN TH- DECADE WITH PRECIPITATION
MR - NO.OF MONTHS OF PRECIPITATION
DECADE RECS S SSLP MSLP SP MP ST MT SR MR
1971-19801961-19701951-19601941-19501931-19401921-19301911-19201901-19101891-19001881-18901871-18801861-18701851-1 601841-18501831-18401821-18301811-18201801-18101791-18001781-17901771-17801761-17701751-17601741-17501731-1740
TOTAL DATA
43341413617946
800368496152558549553945304019491058
718456296231158125113115
573416103
154417221867
899729647584537438342245138
8455362621131212
76211
139915541308
582309222134120
865840171062222222210
0
41389134791144950
5821131159253771535112708
9035583036201713
864549240240240240240240240132
7200
1436138
1137575428375341322263205122
3620755532222100
420 142706
1234615941246056423483848935353284432071010195
32901663
766600600480264240240240156
7200
154017161797
856638538476436347274173
7548292217141010964
100
46089151374200290
8831969593601505350746897369952813615180
703145503055230818961344120011081080
564264
7200
151516921817
87972263955050140631322812371432515953412111
45064147623206636
9258480159721056229254708431073324121429110906972394520211295
764503360372120142120120
36
COVERAGE 80284 2554 2073 487491 1976 457798 2473 821002 2516 886808
73
Chapter 11: Global Climatological Grid Data
1. Global Climatology to 100 mb
NCAR has one tape of climatological data for each hemisphere. The tapes
have long-term mean data for each 5° latitude-longitude point, and for each
month. Data are sea level pressure, surface air temperature, and height and
temperature for 850, 700, 500, 300, 200, and 100 mb. Dew points are given for
surface, 850, 700, and 500 mb. Calculated geostrophic winds are included for
each level. The tapes also include some other data. The northern hemisphere
data are based on Crutcher and Meserve (1970), and the southern hemisphere on
Taljaard et al. (1969). The southern hemisphere tapes, available microfilm,
and motion pictures are discussed in Jenne et al. (1974).
2. Climatological Data Prepared by RAND
Tapes are available from RAND having seasonal data for the surface, 850 mb,
and 400 mb. Data on sea level pressure, geopotential height, temperature,
moisture, and geostrophic winds were interpolated from the tapes above
(southern hemisphere and northern hemisphere Climatology projects) to a grid
4° latitude by 5 longitude. Data on sea surface water temperature, cloudiness,
precipitation, evaporation, albedo (surface and planetary), solar radiation
absorbed, long-wave radiation, radiation balance, sensible heat flux, heat
balance, and observed winds were included from other sources. Various charts
are shown in the report by Schutz and Gates (1971), one of four reports and
three supplements in which these seasonal data are documented.
3. Stratospheric Climatology
A climatology based on the German data has been prepared. Figure 12-1
shows the data input to this climatology. Two atlas volumes (Labitzke, 1972;
and van Loon et al., 1972) are available.
A tape with the climatology is available, as described in an NCAR Technical
Note (Jenne et al., in preparation). This note also describes the contents of a
set of data maps, cross sections, and graphs on about 5,000 frames of microfilm.
The contents of a motion picture based on these data are also described. Some
of the data available on magnetic tape and in the displays are:

74
Chapter 11
a. Long-term means of heights at 100, 50, 30, 10 mb (17 to 14 years) and
of temperature for five years (and for 15 years at 100 mb).
b. Cold and warm winter temperature and heights.
c. Geostrophic winds calculated from the height grids in a and b.
d. Standard deviation of the year-month height, temperature, U, and V winds.

75
Chapter 12: Stratospheric Data
1. Introduction
We will describe NCAR's stratospheric grid point data from NMC, the Free
University of Berlin, and the USAF. A climatology of the lower stratosphere has
been prepared based on the German data (see section 8 below).
2. IGY Northern Hemisphere Stratospheric Data
See Chapter 2 section 7.
3. Height and Temperature Analyses from AFGWC (Air Force)
All are twice daily analyses on the NMC octagonal grid. This set is con-
tinuing but has not been updated at NCAR since early 1965:
100 mb H
100 mb T
50 mb H,T
30 mb H,T
10 mb H,T
- start Apr 1959
- start Jan 1962
- start Jan 1962
- start Jan 1962
- start May 1963
4. Daily Height and Temperature Analyses from NMC
Octagonal grid.
100 mb H,T - start Feb 1963
70 mb H,T - start Apr 1969
50, 30, 10 mb H,T - start Jun 1964
5. Daily Height and Temperature Analyses Prepared in Germany
Since May 1973, the Free University of Berlin has been punching the daily
height and temperature analyses at 50 and 30 mb and putting them on tape. NCAR
has a selection of earlier daily grids from Germany.
6. Weekly Constant Pressure Grids at 5, 2, and 0.4 mb
The grid point values were from the National Climatic Center (NCC) based on
selected NMC weekly maps for the western northern hemisphere for January, April,
July, and October 1964, 1965, and 1966. The maps were based largely on rocket
- -- I --- :- -- . - .
1-

76
Chapter 12
data. The area covered is 10°N to the pole and 0°W, 5W --, 220°W, but only
40W - 190W at 0.4 mb. The selective digitizing was paid for by Marshall Space
Flight Center. The weekly maps were drawn at NMC during the period January 1964
December 1968.
Hemispheric analyses at 5, 2, 0.4 mb
Starting in January 1972, hemispheric analyses at these levels have been
prepared by the upper air section at NMC (contact: F. Finger). The analyses are
prepared as follows:
The VTPR channel-two radiance correlates very well with 100-5 mb thickness.
This is added to the operational 100 mb height analyses, which gives an estimated
5 mb height. These heights are then adjusted to the heights and winds from
rockets (and a few raobs) at 5 mb. From SCR (channel B34), which is mailed from
Oxford, England, they obtain a guess temperature at 5 mb which is then adjusted to
observed data.
In a similar way, 2 mb analyses are obtained from a correlation of VTPR
channel one with 100-2 mb thickness, and a SCR channel B12 correlation with 2 mb
temperature. These guesses are then adjusted to the observed data.
For 0.4 mb, the correlation of SCR channel B12 with 10-0.4 mb thickness is
used. This thickness is added to the operational 10 mb height, which does not now
involve the use of satellite data. This guess is adjusted to the 0.4 mb rocket
data. A temperature analysis is produced without direct assistance from satellite
data.
If satellite data are not available, the heights from 10 mb are built up by
first analyzing the 5 mb temperature, making a thickness from the 10 and 5 mb
temperatures, adding it to the 10 mb height, etc.
The maps for January 1972 - June 1973 will be published in about April 1975.
Karen Labitzke (Free University, Berlin) is using satellite data from
W. Smith, NESS, to help in making 5 and 2 mb analyses for 1969, 1970, and 1971.
Tape data
MIT (R. Newell) has digitized the 5 and 2 mb data for January - December
1972, for 20°N to the pole, each 10° latitude and longitude. NCAR will have a
77
Stratospheric Data
copy of the data, including both height and temperature.
AFCRL (Alan Cole, January 1975) has plans to digitize all of these maps to
aid in the preparation of the U.S. standard reference atmosphere.
7. Stratospheric Analyses from Germany
These grid data were tabulated in Germany from hand-analyzed maps; the card
punching was divided between Germany and NCAR. Latitude-longitude points at
intervals of 10 were punched for 10 N to the pole. Figure 12-1 shows the earlier
mean grids and the year-month analyses that were available for the preparation of
the longer term climatology described below. A tape of the year-month data is
available as described in Jenne et al. (in preparation). Additional year-month
data were received in 1974 (see Figure 12-1). Some of the German daily analyses
have been punched in Germany or Japan and sent to NCAR, but they have not been
processed yet.
8. Stratospheric Climatology
NCAR and Germany have prepared a climatology of northern hemisphere 100, 50,
30, and 10 mb heights and temperatures, based on German analyses. Many year-
month analyses are also available in this set. A motion picture based on this
climatology is available from NCAR. See Chapter 11 for more information about
these data.
9. Rawinsonde Data
NCC, ETAC, and NCAR have a large sample of the world's daily rawinsonde data
in both station and synoptic order on tapes.
10. Global Monthly Thickness Data
NCAR has tapes of global monthly thickness data for 100-50, 50-30, and 30-10
mb for May 1969 through April 1970. These data are based on retrievals made at
NESS from SIRS-A monthly mean radiance data. Various data and retrieval problems
are inherent in this set. Comparisons have been made with German thickness data
where possible.
78
Chapter 12
11. Rocketsonde data at NCC
See the information under NCC data holdings (Chapter 7).
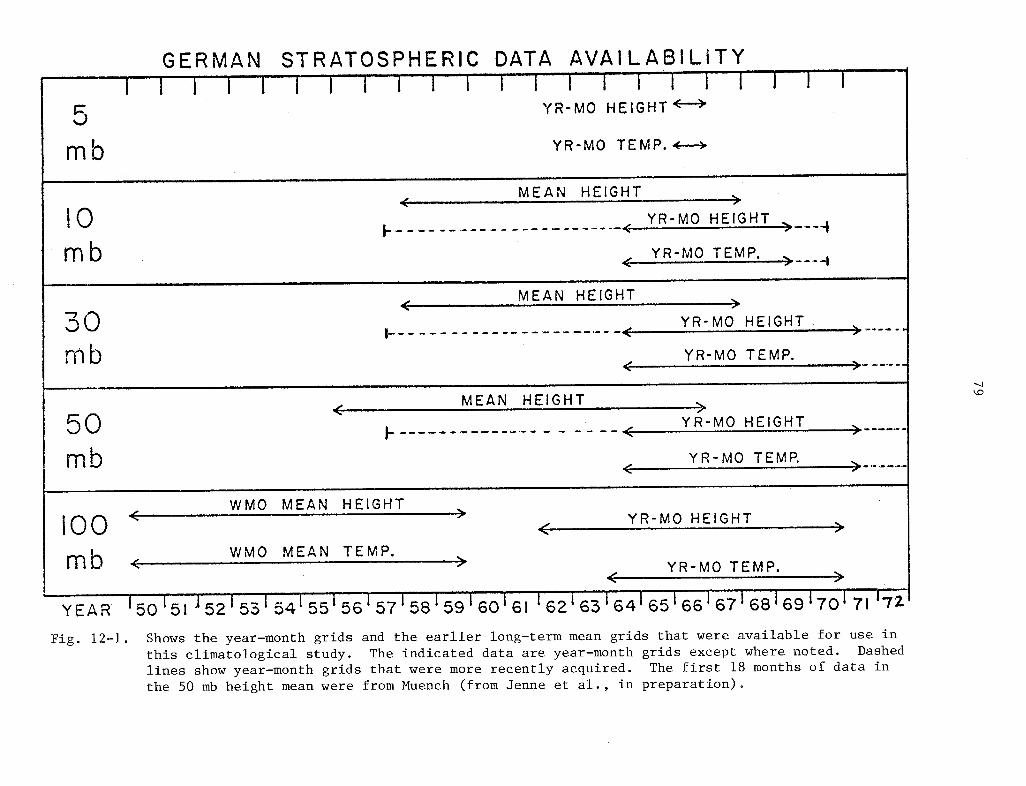
GERMAN STRATOSPHERIC DATA AVAILABILITY( --- I I I I I I I { I I I 1 - 1 1 1 i 'I I I I I I
E{= '{*~~~~ YR-MO HEIGHT<-
pmb YR-MO TEMP. -.
10._MEAN HEIGHT_
|.. -O-< YR-MO HEIGHT
mb , YR-MO TEMP. - ,
MEAN HEIGHT
'~~~IO)^~~~~0 <..YR-MO HEIGHT
nb YR-MO TEMP._
MEAN HEIGHT
50 YR-MO HEIGHT
p~~~~t)~~Ymb ___YR-MO TEMP..
\r~r\ < -----------10---------- > _ YR-MO HEIGHT >
mb WvMO MEAN TEMP.bmD <-> YR-MO TEMP. ..... _ I I I I I I
YEAR 15051 5253 54155 56 57 58 59 6061 162 63 64 1 65 66 1 67 68 1 69170 1 71 72
Fig. 12-1. Shows the year-month grids and the earlier long-term mean grids that were available for use in
this climatological study. The indicated data are year-month grids except where noted. Dashed
lines show year-month grids that were more recently acquired. The first 18 months of data in
the 50 mb height mean were from Muench (from Jenne et al., in preparation).

I
81
Chapter 13: Satellite Data
1. Introduction
In this section we will briefly describe a number of the U.S. satellites that
have contributed data sets that are important in the study of meteorological and
oceanographic problems. The principal locations of the data are the National
Space Science Data Center (NSSDC), Goddard Space Flight Center; the National
Environmental Satellite Service (NESS), Suitland, Md.; and the National Climatic
Center (NCC), Asheville, N.C. Assume that NCAR does not have the data unless
otherwise stated.
Stoldt and Havanac (1973) of ETAC have compiled data on the meteorological
satellite and instrument programs of the United States, U.S.S.R., United Kingdom,
and France. The compendium includes references to the various data catalogs and
to scientific papers.
NSSDC hopes to update this compendium in 1977. In early 1975, they will
publish a four-volume catalog of satellite experiments. One of the volumes will
cover experiments in meteorology and oceanography.
Figure 13-4 shows the data periods for various satellites.
Table 13-1, taken from the compendium, shows where some of the data may be
obtained. NSSDC maintains catalog listings that give information about the data
availability from the various experiments on each satellite. They also keep
track of data sets and publications associated with approximately 7000 rocket
launches. Table 13-2 includes information about the satellites and the experi-
ments from the compendium and from NESS. In the cases of disagreements in the
dates given, the latest termination dates are used.
Hoppe and Ruiz (1974) at NESS have published a catalog of operational
satellite products.
In April 1974, NESS and EDS (Environmental Data Service) prepared a
Satellite Data Archival Plan which covers the data produced by NESS. This plan
discusses the archival of pictures, microfilm, movie film loops, and magnetic
tapes. A Satellite Data Services Branch (of NCC under the EDS) has been located
with NESS in Washington. Requests for satellite data may be directed to them.
The archival location of the satellite data will gradually be moved from
Asheville to Washington. NESS has published a monthly magazine (Environmental
82
Chapter 13
Satellite Imagery) with global coverage of daily visible and IR pictures.
The Academy of Sciences publication, U.S. Contribution to the Polar
Experiment (Polex-North) (1974), includes a discussion of various types of
satellite data.
The book on Climatology from Satellites (Barrett, 1974) contains more
information about data from satellites, and shows many charts based on information
from satellites.
2. Satellite Brightness Data from NESS (Vidicon tubes) (Written October 1973)
Data Period: 1 January 1967 thru 31 August 1972
a. NCAR has 5 latitude-longitude daily global brightness data on one tape
in packed binary format, data set DS 670. The orbit numbers are listed
in the format.
These data were prepared at NESS from the mesoscale brightness data tapes
noted below. These mesoscale tapes have a gray scale with only five
levels.
The data are derived from vidicon tubes, which tend to drift in cali-
bration. Some of these problems have been taken care of (adjustments
made to make key points uniform); but, for example, the data have to be
used with caution in looking for long-period changes in global brightness.
b. Copies of the mesoscale brightness data tapes having a grid of 512 X 512
points per hemisphere (a resolution 8 X 8 that of the NMC grid) are kept
at NCC. There is one grid per day which is valid at about 1400 local
time (sun-synchronous satellites). The original tapes had 16 levels in
the gray scale, but these tapes have a gray scale with only five levels.
At each grid point there are 48 bits, giving frequency counts of the
number of the associated 64 points within the original 4096 X 4096 grid
that have each of the five brightness levels.
Volume for each hemispheric grid is 1.26 X 107 bits. Volume per day is
2.52 X 107 bits.
Tape volume at NCC is about one tape per three days for the period
1 January 1967 through 31 October 1972. NCAR has a limited number of
these tapes.

83
Satellite Data
c. D. B. Miller processed the mesoscale tapes for 1 January 1967 through
31 December 1970. He related the brightness levels to cloudiness in
order to prepare tapes of cloud frequency data for each month of the
four-year period. Adjustments were not made for changes in satellite
calibrations that were noted after the vidicon data were originally
saved. The tapes are at NCC; an associated cloud atlas is available
(Miller and Feddes, 1971).
3. Archive of NESS Scanner IR and Visible Data (Written November 1974)
a. This describes NESS procedures for archiving scanner IR and visible data
from NOAA-2 since 1 January 1973. (It was received starting in November
1972, but was not archived until January 1973.) The high resolution grid
is 2048 X 2048 per hemisphere (32 times the NMC grid resolution). There
are eight bits per visible or IR sample. During the daytime pass there
are both visible and IR data, but only the IR at night. There are three
tapes per day: one for northern hemisphere visible and IR data, one for
southern hemisphere visible and IR, and one for the global nighttime IR.
These three tapes are now being combined onto one 1600 BPI 9-track tape
per day.
b. Mesoscale version of the above: For a 512 X 512 grid for each hemisphere
there are 48 bits of data saved each day for each grid point. The 48
bits are broken into six bytes (eight bits each) with the following data:
1) Average minimum visual data; this is the average of the four smallest(darkest) values from the 4 X 4 cluster.
2) Average visual data.
3) Average maximum daytime IR; average of four largest (warmest) values.
4) Average daytime IR.
5) Average maximum nighttime IR.
6) Average nighttime IR.
Volume per day = 2 hemispheres X (1.26 X 107 bits/hemisphere)
= 2.52 X 107 bits/day
c. Larger scale averaged data. Starting with June 1973, NESS is averaging
the data onto a 125 X 125 grid for each hemisphere (the pole is the
center point, data average is centered about each point) of the average

84
Chapter 13
visible, the day IR, and the night IR. From these NESS is also cal-
culating the albedo, the absorbed solar radiation, and the total outgoing
long-wave radiation (about 106 bits per day). Thus, there will be a
gap in the larger scale averaged data from September 1972 through
May 1973. T. Gray says that there was some trouble with the digital
data for January - May 1973, even though the analog data were all right.
4. LRIR Data (low resolution infrared)
Recently these have been FPR data (flat-plate radiometer).
a. These are from a flat-plate radiometer.
The approximate dates of LRIR data availability are as follows:
ESSA-5 9 May 1967 - 30 Sep 1967
ESSA-7 3 Sep 1968 - 22 Jun 1969
ESSA-9 1 May 1969 - 15 Apr 1970
The tapes (about 30) are at NCC and at NESS (see S. Brown).
b. Tapes of the FPR data are at NESS (see Phillips and Rubin, 1972):
ITOS-1 23 Mar 1970 - 19 Jul 1970
NOAA-1 4 Feb 1971 - 27 May 1971
Volume: 1320 X 24 X 24 bits/day = 7.6 X 105 bits/day
5. Other Satellite IR Data
a. Tapes with 5 latitude-longitude average IR data are available for the
TIROS 7 period of about June 1963 - June 1964; the sampling was poorer
for the following year. Window channel.
b. ITOS - about June 1970 to April 1971
The daily global IR is available on 2048 X 2048 grids for each hemisphere.
About two days per tape per hemisphere; thus, about one tape per day.
Daily values for day and night.
The data are very noisy and badly calibrated. Gray thinks it would take
more time to summarize than it is worth. The tapes show erroneous warm
and cold strips of water in the Gulf Stream, etc.

85
Satellite Data
c. NOAA-1 19 April 1971 to 10 July 1971.
The 5° IR data are at NESS and NCAR.
d. Note from Table 2 that MRIR (medium resolution infrared) instruments
were on Tiros 2, 3, 4, 5, etc.
e. Some of the IR data have been gridded and processed into average heat
budget data for the periods shown below. Total IR, albedo from top of
atmosphere, and net radiation assuming a solar constant are included.
T. Vonder Haar at Colorado State University (CSU) has these data on tape
and he and J. Ellis have just published an atlas (Vonder Haar and Ellis,
1974).
Jul 1964 - Nov 1965
15 May - 15 Jul 1966
Dec 1966 - Jan 1967
1968 - Apr 1969
May 1969 - Jan 1970
Experimental
Nimbus 2
ESSA-3
ESSA-5
Nimbus-3
Vonder Haar (C.S.U.)monthly average
Raschke and Bandeen (GSFC)15-day average
McDonald (NESS)
NOAA/NESSNot final
Vonder Haar and EllisTen 15-day periods
6. Moisture Data from NESS
Since about July 1973, NESS has been preparing data on total precipitable
water (from VTPR), but has not archived it. (We would like to see it saved.)
Since about July 1972 NESS has been preparing estimates of relative humidity
for two layers over the Pacific Ocean, Western Atlantic, and Gulf of Mexico.
The layers are surface to 700 mb and 700 to 500 mb. The estimates are made from
cloud pictures. The data are not archived. Surface bogus reports are saved,
and contain estimates of present weather and cloud amount.
7. Cloud Drift Winds and Movie Loops
The winds derived by NESS
upper air data tapes from NMC.
at single pictures showing the
cumulonimbus clouds.
from satellite cloud pictures are included on the
Some of the winds have been estimated by looking
cirrus plumes blowing off of the tops of

86
Chapter 13
More reliable winds have been derived from clouds at various levels with the
advent of the geostationary satellites in the ATS and SMS-GOES series. These take
a "picture" about each 20 to 30 min. A number of these pictures for 3 or 4 h are
put together into a motion picture film loop in which great care has been taken to
position each frame properly by using physical landmarks. A person watches these
clouds move forward and then drop back, on a digitizing table as the film loop is
shown. From this, he obtains end-point locations, and then winds can be cal-
culated. The cloud heights (and thus wind levels) have been estimated from cloud
types, and the associated climatological knowledge of the operators. Starting in
July or August 1974, SMS infrared data have been available to provide 24-hour cloud
viewing and to help the operator estimate the cloud height. Starting in May 1972,
the picture-pair method has been used in deriving the low-level winds. Correlation
methods are used to obtain the winds; the operator compares this with film loop
data and usually rejects about 7% of the picture-pair calculations. Efforts are
now being made to implement computer vector derivation for various levels using
various temperature intervals in infrared.
Movie loops: Starting with June 1969, the movie loops are available at NESS.
The data locations and dates are as follows:
Satellite from which the data are obtained:
ATS-1 (Jun 1969 - Sep 1972), over the Pacific Ocean at 151°W
ATS-3 (Jun 1970 - on), at 45°W to 95°W
SMS-1 GOES (May 1974 - on) is at about 75 W since late Nov 1974
(was at 400 W during GATE, June - Sep 1974)
Cloud wind data: Starting in June 1969, the movie loop winds have been on
the NMC upper air data tapes. NESS tries to produce one wind for each 5 latitud2-
longitude square, and for each cloud layer when possible. Some cirrus blowoff
winds were also on the tapes until October 1974. Starting in August 1974, NESS
is also making a separate archive of these cloud wind data.
The NSSDC compendium on meteorological satellites (Stoldt and Havanac, 1973)
lists various motion pictures that have been produced, some from the movie loop
pictures, and some from one-per-day maps.

87
Satellite Data
8. Solar Proton Monitor Data
These data were processed at NESS and archived at the Space Environmental
Laboratory, NOAA, Boulder, Colorado 80302.
Periods:
ITOS-1 8 Mar 1970 - 14 Mar 1970
23 Mar 1970 - 19 Jul 1970
NOAA-1 5 Feb 1971 - 27 May 1971
Vol [125000 bt0 min X [12 viewing hiVolume . X X13.2 min J h day
1.36 X 106 bits/day
See Phillips and Rubin (1972).
9. General Information about Satellite SIRS and VTPR Data
In the SIRS (from Nimbus) and VTPR infrared sounding data, there are eight
channels which receive infrared radiation from different pressure bands in the
atmosphere (surface to about 10 mb; other experiments include higher data). The
amount of radiation emitted varies with the temperature and, thus, an approximate
temperature vs pressure sounding through the atmosphere can be constructed from
the temperatures in the eight layers. The pressure weighting functions of the
eight channels overlap each other somewhat, so that the eight pieces of information
are not entirely independent. It is clear that one cannot expect a sounding with
high resolution information in the vertical. Problems can also arise from un-
detected clouds or dust. Data from rawinsondes are used to "calibrate" the
channel radiances.
The NMC Upper Air Branch has noted that the VTPR Q channel radiance correlates
well with the 100 to 2 mb thickness and that the next channel correlates well with
the 100 to 5 mb thickness (correlation coefficients over 0.95, standard deviation
is about 250 to 300 m). For the 100 to 10 mb analyses, they stopped using the
VTPR retrieved temperatures in December 1970 because of problems.
There are differences of up to 2% in VTPR radiances between the ascending
orbits and the descending orbits. For example, this discrepancy is equivalent to
a 100 m thickness difference 100 to 2 mb, or 1 C in the mean temperature. Some of
88
Chapter 13
this error is probably real diurnal variation, but most of the error is likely
due to unremoved calibration changes with spacecraft temperatures.
The NMC Upper Air Branch has compared all raobs with all retrieved VTPR
soundings within 1° of latitude. Figure 13-2 shows the result of this comparison
for a given month. This problem is also discussed in Finger et al. (1973).
10. VTPR Satellite IR Sounding DATA from NESS (as of November 1974)
a. Started about October 1972
b. Archive I: Each VTPR spot (binary format)
II: Clear column radiance (binary)
III: Retrieved soundings (BCD format)
These three archives are all together on the tapes sent by NESS to NCC.
Tape volume is about ten tapes each three weeks. Practical limit of
information in the vertical is up to 10 to 20 mb.
c. The retrieved soundings are also in the NMC archived data (available
at NCAR). The NMC tapes had about 400 to 550 soundings (average 525)
each 12 h in December 1972. These include data during every hour in the
day. On about one-fourth of the sounding times the VTPR data are missing
on the NMC tapes.
The average counts in August 1974 were still about 1000 per day
(400 in northern hemisphere, 600 in southern hemisphere).
Figure 13-3 shows the coverage of these data.
11. Defense Meteorological Satellite Program (DMSP, formerly DAPP)
Starting 25 February 1973 (but July 1973 missing), picture transparencies of
the 2 n mi resolution IR data have been saved at the University of Wisconsin. They
also have IR pictures of the 1/3 n mi data for northern hemisphere land masses.
The nighttime pictures that show city lights, the aurora, etc., are archived
in the NOAA EDS center in Boulder, Colorado.
The IR sounder data contain six C02 channels with peak response at about
30, 70, 150, 400, 600, and 1000 mb. There is a channel for surface temperature
and one for total water vapor content. These sounders are calibrated for each
89
Satellite Data
scan line. There is about a 20 C change in calibration during an orbit. The NOAA
satellites have only been calibrated once per orbit. In about July 1975, the Air
Force hopes to add a 7-channel moisture profiler and a measurement for total
ozone (03). They are also planning for microwave systems. The clear column
radiance data have not been saved, but the retrieved soundings are saved on the
AFGWC archive tapes. (Information from Major Wilkes and Captain St. Onge,
January 1975.)
12. Sea Surface Temperature Data from NESS
Starting 1 December 1972 NESS (John Leese) has been sending one tape per
month to NCC with these data.
To obtain the sea level temperature data, the clear sky radiance data must
be corrected for the amount of water vapor in the column. The corrections are
usually about:
1 to 30C high latitudes
3 to 6 C mid-latitudes (30-500 N or S)
1 to 12°C tropics
NESS does not trust the data too much until September 1973. In March 1973 and
July 1973 there were calibration problems. Until 31 May 1973, there was only a
latitudinal moisture correction. Then they used a latitude-longitude clima-
tological correction until September 1973. Sometimes they still use a climate
correction when they are fighting other calibration problems such as changes
between NOAA-2 and NOAA-3 satellites. Now they usually derive the total column
moisture from the VTPR data, and use this to make the temperature correction.
Each day they receive about 1100 ship observations from Navy/Monterey
(100 from southern hemisphere). R. Brower, NESS, then prepares ship vs satellite
statistics for 14 ocean regions. Comparisons:
a. Average ship observations vs average satellite observations iswithin + 0.5°C
b. The RMS of differences between ship and satellite observations within a
distance of 1 latitude is 1.5 C
c. The RMS of differences between shig observations and Navy analyses based
mostly on ship observations is 1.4 C
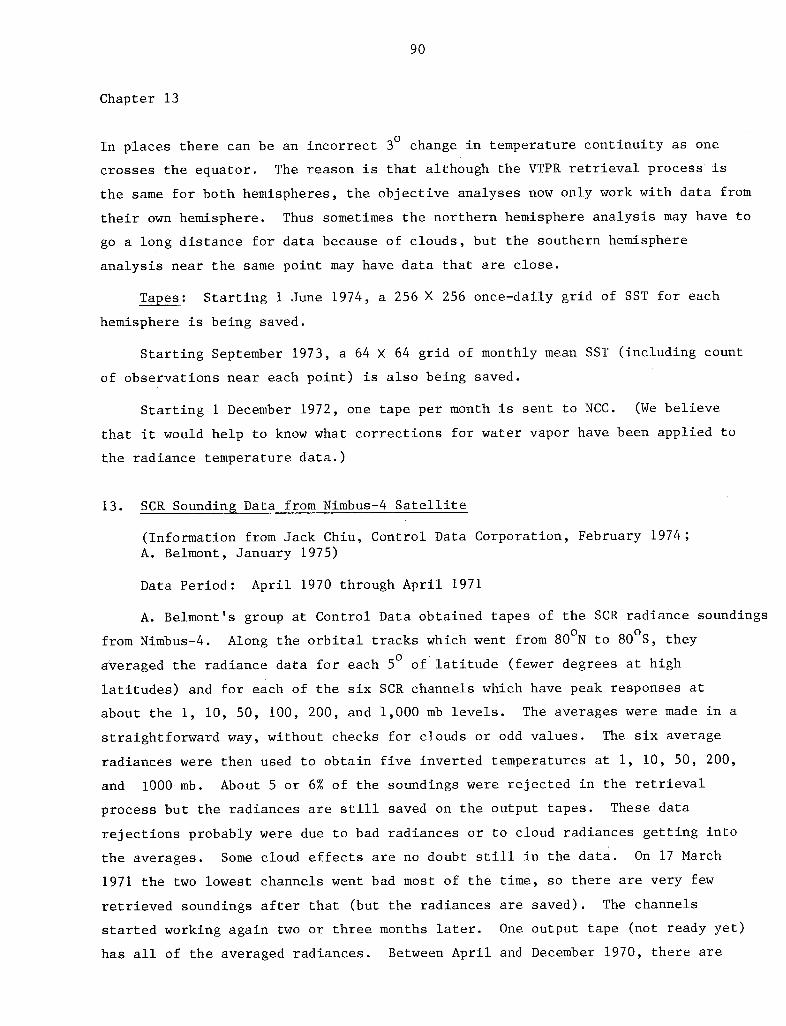
90
Chapter 13
In places there can be an incorrect 3° change in temperature continuity as one
crosses the equator. The reason is that although the VTPR retrieval process is
the same for both hemispheres, the objective analyses now only work with data from
their own hemisphere. Thus sometimes the northern hemisphere analysis may have to
go a long distance for data because of clouds, but the southern hemisphere
analysis near the same point may have data that are close.
Tapes: Starting 1 June 1974, a 256 X 256 once-daily grid of SST for each
hemisphere is being saved.
Starting September 1973, a 64 X 64 grid of monthly mean SST (including count
of observations near each point) is also being saved.
Starting 1 December 1972, one tape per month is sent to NCC. (We believe
that it would help to know what corrections for water vapor have been applied to
the radiance temperature data.)
13. SCR Sounding Data from Nimbus-4 Satellite
(Information from Jack Chiu, Control Data Corporation, February 1974;
A. Belmont, January 1975)
Data Period: April 1970 through April 1971
A. Belmont's group at Control Data obtained tapes of the SCR radiance soundings
from Nimbus-4. Along the orbital tracks which went from 80 N to 80 S, they
averaged the radiance data for each 5° of latitude (fewer degrees at high
latitudes) and for each of the six SCR channels which have peak responses at
about the 1, 10, 50, 100, 200, and 1,000 mb levels. The averages were made in a
straightforward way, without checks for clouds or odd values. The six average
radiances were then used to obtain five inverted temperatures at 1, 10, 50, 200,
and 1000 mb. About 5 or 6% of the soundings were rejected in the retrieval
process but the radiances are still saved on the output tapes. These data
rejections probably were due to bad radiances or to cloud radiances getting into
the averages. Some cloud effects are no doubt still in the data. On 17 March
1971 the two lowest channels went bad most of the time, so there are very few
retrieved soundings after that (but the radiances are saved). The channels
started working again two or three months later. One output tape (not ready yet)
has all of the averaged radiances. Between April and December 1970, there are

91
Satellite Data
about 50 missing days, and other whole orbits are missing. The other tape has
168,722 retrieved soundings for the year. The number of possible soundings for
the year would be about (380 days) (13 orbits per day) (70 per orbit) = 345,000.
In the output format, time and location are packed into one 60-bit word, the
temperatures are one word each, and the six average radiances are packed into two
words. There are 40 such logical records per physical record. The archive tapes
for the first year should be ready in about March 1975. Control Data is now
(January 1975) hoping to obtain funds to process the second year of data; they
have the tapes from NASA. The group in Oxford has published portions of the
second year of data.
14. Nimbus-5 Data
(Information from W. Smith and H. Woolf, NESS, 20 September 1973)
Data start February 1973.
Outputs are:
a. Global surface temperature analyses
b. Global stratospheric radiance analyses (including the SCR data)
c. Global multilayer temperature analyses
d. Vertical soundings:
Quantity Resolution (km)
T (P) 400, 150
q (P) 400
W precipitable H 20 400
T surface (from 3.7 and 11 pm windows) 400, 150
P , N Cloud pressure and amount 400
FT Total outgoing IR flux 400
The tapes have about 1100 soundings (called ITPR soundings) per day. The
retrieval of the temperature soundings uses neither raob data nor first-guess
analyses from NMC. The microwave data help in defining clear column radiances,
and even improve the retrievals in clear regions. These data are not used in NMC
analyses and do not get into the NMC data tapes. However, during special DST
(Data Systems Test) periods, they are put onto the NMC DST archive tapes, and

92
Chapter 13
used in the DST analyses. The above data are on about one tape each two weeks
and are sent to NCC. Data start February 1973 and include the SCR data.
On Nimbus-F we will also have visible reflected data, and the resolution
will generally be 150 km.
15. Ozone Sounding Data from Satellites
a. Data from an orbiting geophysical observatory satellite (OGO-4), back-
scattered ultraviolet. Period August 1967 through January 1969. Five
months of the data have been processed. They hope to process the rest
in late 1975.
There are about 12 orbits per day, eight scans for each 10° of latitude,
twenty 10° latitude bands per orbit, about 100 spectral bands (2500 to
3400 A), 15 bits each measurement. This gives 2.9 X 106 bits per day or
about 1.6 X 109 bits for the 18-month period.
In order to obtain this data they have processed 300 data tapes to output
five tapes. There are about 600 tapes that have not yet been processed.
The basic tapes are at LASP. (Information March 1974 from Julius London,
Laboratory of Atmospheric and Space Physics, University of Colorado.)
b. Ozone data from Nimbus-4 are being processed by Heath's office at NASA-
Goddard. The data start in April 1970 and are still being taken
(January 1975). At first it was buried in about 13 tapes per day, later
on about 4 tapes per day. The first year about 60% of the potential
data was obtained, second year about 85%, and the third and fourth years
(with power problems) only about 50% could be gathered.
The raw radiance data for the period April 1970 through April 1972 are
available on 20 tapes.
The ozone results (total and vertical distribution) are available for
April 1970-March 1971 (one month per tape). The second year is being
worked on.
(This information from Arlin Krueger and Donald Heath, NASA,
January 1975.)

93
Satellite Data
16. Ice and Snow and ESMR Microwave Data
a. The ESMR microwave data from Nimbus-5, starting in December 1972, has
a nadir resolution of about 25 km. Maps are made about once a week.
The maps help to distinguish between open water, types of sea ice, and
fresh snow. They are not affected by clouds, and do not depend on the
availability of visible light.
CSU has the data tapes for the period 22 December 1972 through
26 February 1973. Each tape file is one orbit and there are about
15 files per tape. There are usually about ten orbits per day with
data. We do not know of anyone who has gridded these data.
b. NESS has produced a northern hemisphere ice and snow chart each week
since about 1967. The charts are saved at NESS. The daily satellite
pictures are the basis for this manual product. The ESMR weekly pictures
are available to this group but have not been used much as yet. This map
is digitized on a standard NMC 47 X 51 grid and is archived in the NMC
data base. These charts were also digitized (total ice area per chart)
by the Kuklas at Columbia University in preparing their ice trend charts
for the hemisphere.
NESS also prepares a weekly ice chart for the Great Lakes (since about
1967). Starting about March 1973 they have prepared weekly charts of the
Bering Sea, the Beaufort Sea, and the Chukchi Sea.
c. From late 1967 through late 1972 NESS saved global five-day minimum
brightness data on 512 X 512 grids. During some periods it was a ten-
day minimum. These were "end-to-end" five- or ten-day periods. Paul
McClain has found that clouds can still be some problem for the five-day
period, but usually are not a problem for a ten-day minimum. A new set
of global ten-day grids has been produced since 1 December 1974. These
are overlapping grids, made each day. A similar grid is also made from
IR data.
d. The Navy group at NMC obtains the satellite pictures from NESS and ESMR
pictures from NASA in order to aid in drawing ice coverage charts for
both polar areas.

94
Chapter 13
e. A Navy group at FNWC is experimenting with the direct use of the ESMR
digital data.
17. Satellite Data for the GATE Experiment
During the period June-September 1974, a number of tapes of high-resolution sat-
ellite data were saved and are at NCC, Asheville. There are 5986 tapes of SMS data
and 1830 tapes from ATS-3. A GATE data catalog is being prepared by NCC with the
assistance of NOAA's Center for Equipment Development and Data Analysis (CEDDA).
18. SEASAT Satellite
SEASAT is scheduled for launch in about June 1978. The major instrumentation
on this satellite will be as follows:
a. Compressed pulse radar altimeter. Measures the satellite to ocean
distance by +10 cm and measures wave heights from 1-20 m with an
accuracy of 0.5 m or 10%. Sees only the subsatellite track. This
instrument will also be on GEOS-C in early 1975. Given this surface
height, one can "see" intense currents, tides, wind pile-up, and storm
surges.
b. Coherent synthetic aperture imaging radar. Combined with the pulse
radar data, this allows one to calculate wave frequency vs amplitude in
15 spectral intervals of waves between 50 and 700 m in length. Swath
under satellite 400 km wide. One spectrum each 24 h for each 50 by 50 km
square globally. Also, 18 directional intervals of waves. Wave-height
error +0.5 or 1 m, or 25%.
c. Microwave wind scatterometer. To measure surface wind speed in the
range from 3 to 50 m/s with an accuracy of +2 m/s or 10%. Swath 1200 km
under satellite. Wind direction 0-360° to an accuracy of +200. Will
produce a wind for each 100 X 100 km grid in the open oceans, and
10 X 10 km in selected coastal areas.
d. Scanning visible and IR radiometer (SR). Same sensors as flown on
ITOS (see section 5b above).
95
Satellite Data
19. ERTS Data
The Satellite Data Services Branch (of NCC in Washington) assists users of
ERTS-1 data by answering questions about the products available and helping with
the placing of orders. Coverage of each ERTS-1 photograph may be seen in browse
files located across the country. NOAA and the Department of Interior have 40 files
at the NOAA data centers and many other locations. The Department of Interior is
supplying ERTS-1 data for the geologic and geographic community through the EROS
Data Center.
The NOAA Browse Files have 16 mm microfilm (with reader) consisting of one
channel of the Return Beam Vidicon (RBV) and one channel of the Multispectral
Scanner (MSS), standard catalogs identifying each image, data user's handbook
giving additional ERTS System information, list of products available, prices
of these products, and detailed ordering procedures. We feel all of the material
is necessary for the requester to make a proper evaluation of the data and
subsequently to order only those products that he requires.
The preferred way to place an order is for the user to visit one of the
browse files and select the frame he wishes to order by viewing the 16 mm
microfilm. The microfilm will not have the definition shown by the larger prints
but should enable one to see whether clouds are covering the point of interest at
the time of the photograph. If it is impractical to visit one of the browse
files, browse file microfilm or catalogs can be purchased. Write to the NOAA
Satellite Data Services Branch explaining your needs.

96
Chapter 13
GATE ARCHIVE DATA FOR YR/MO/DY/HR 74 7 25 0ALL LEVELS OF DATACODE O=BOCUS X=CLOUD WINDS
90T-
60o
0.
-5. ..
-9§ - 4 _ .-I - i - i +. t I - -
Fig. 13-la
GATE ARCHIVE DATA FOR YR/MO/DY/HR 74 7 25 6ALL LEVELS OF DATACODE =BOOCUS X=CLOUD WINDS
60 -........ '..... ' .....
,-¥.:9, 'Fig. '"* * " 1''-
__ _ ___ ___ * __ £'? . "''". .
. . _,,, *__,,i_. ,.. ' ._._,..- _ --,, ':--
. » rI -.n 2o I, - I, . , ?' -..... ...
Fig. 13-lb
F~~~~~i g .13l
Fig. 13-1. Shows the location of cloud drift winds produced from satellitedata for two typical periods during GATE.
377 CLOUD WIND0 BOGUS RPTS
'"
, ....... .. L. _ 1 . ......
i .~~~ ...... _.v,.. :,..,:: . .,-.'
.1 ::,::. 1'" ) '-v::. __ . . .. 4'4~~~~~~~~~~~~~~'~~~~~~~~~~~~~~~~~~~~~~~~~.....~~~~~~~~~~~~~~~~~~~~~~~~~~~~~~~~~~j...i·... C--·. . ..· · :
lO
206 CLOUD WIND0 BOGUS RPTS
.···r ·lr- I --- r I .··- I i i i i t ··..~~
I 1O0 ISO 1t1so -*I0 0 0 'O 60

97
Satellite Data
VTPR MINUS RADIOSONDE TEMP COMPARISONSJan. 4 - Feb. 18, 1974
LAT.
18S18N 18-30 N10 o 0lO0--___ ... _20
30-40N 40-50N 50-60N 60-70N0
4-
Op0
-2
QI7+2 0
Fig. 13-2. Comparison of VTPR retrieved temperature with radiosonde data for4 January - 18 February 1974. Comparisons made for satellite datawithin 60 n mi of raob data (from F. Finger, NMC).
30
50
70
100
MB150
200
250
300
400
500
700
850
1000-4

98
Chapter 13
GATE ARCHIVE DATA FOR YR/MO/DY/HR 74 7 25 6ALL LEVELS OF DATACODE N NIMBUS V=VTPR
Fig. 13-3a
GATE ARCHIVE DATA FOR YR/MO/DY/HR 74 7 25 12ALL LEVELS OF DATACODE N=NIMBUS V=VTPR
Fig. 13-3.
Fig. 13-3b
Shows the receipt of VTPR and Nimbus sounding data in the archivetapes for typical time periods during the GATE experiment. Notethat although the Nimbus data are not routinely sent to NMC, theywere sent during the GATE period.
204 NIMBUS306 VTPR
222 NIMBUS299 VTPR
t

1960 1961 1962 1963 1964 .1965 1966 1967 1968 1969 1970 1971 1972 1973. . I I
!---- Explorer 7Tiros 1H
--- I Tiros 2Tiros 3-- I
--4Tiros 4Tiros 5----
1 .-... Tiros 6Ti ros 71 ---
-I I Tiros 8Nimbus 1H
1--- Ti ros 9Tiros 10H
I-- .ESSA 1..i. ............ IESSA 2
Nimbus 211I' -----' ESSA 3I----! ..---- ..ATS 1
ESSA 41---F -------- .1 Dodge
ATS 2HI iESSA 5
........--------...... ATS 3I .-- .. I ESSA 6
ESSA 71---1. ..........-- ESSA 8
)I---- * ESSA 9Nimbus 31 - - I
i - ;I ITOS 1F---- --- Nimbus 4
'-- i NOM 1
§ ERTS 1
1960 1961 1962 1963 1964 1965 1966 1967 1968 1969 1970 1971 1972 1973
Fig. 13-4. Launch and termination dates of satellites (from Stoldt and Havanac, 1973). 13
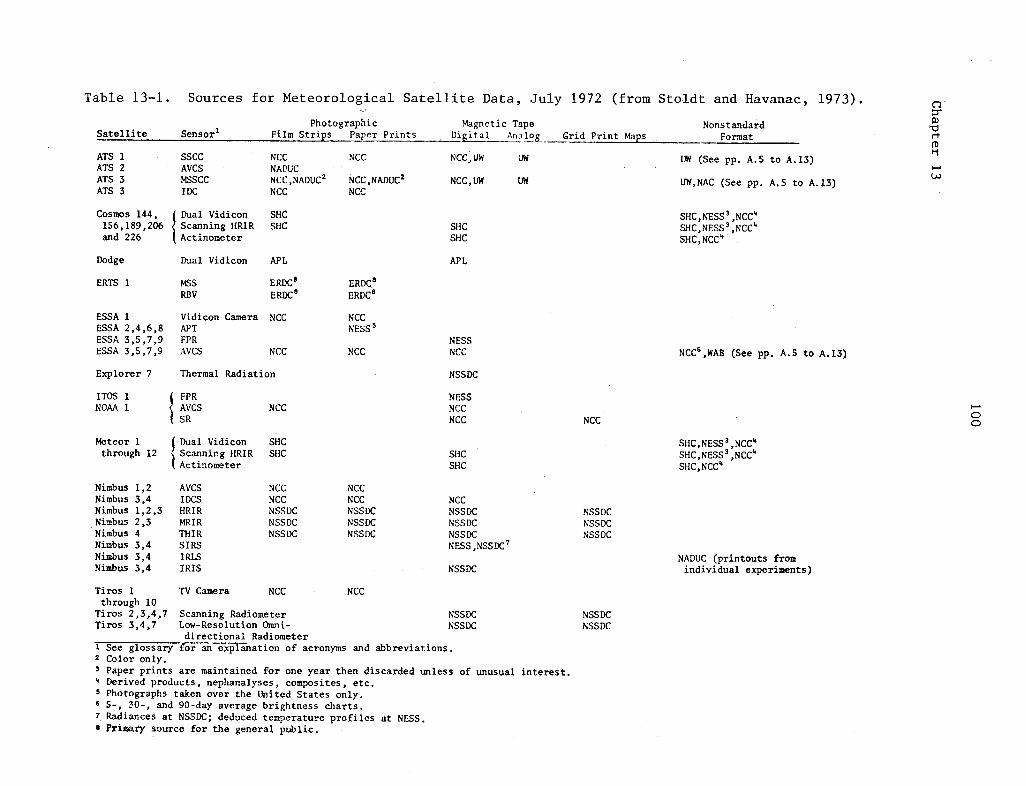
Table 13-1. Sources for Meteorological Satellite Data, July 1972 (from Stoldt and Havanac, 1973).
Satellite SensorlPhotographic
Film Strips Paner PrintsMagnetic Tape
Diital An:loo
NCC, UW tlUW
NCC,UW UW
m3
rt(D
.
UW (See pp. A.5 to A.13)
UW,NAC (See pp. A.5 to A.13)
Dual VidiconScanning HRIRActinometer
SHCSHC SHC
SHC
Dual Vidicon APL
MSS
RBVERDC e
ERDC e
Vidicon Camera NCCAPTFPRAVCS NCC
SHC,NESS 3,NCC4
SHC,NESS3,NCC
4
SHC,NCC4
APL
ERDC 8
ERDC 8
NCCNESS 5
NCCNESSNCC NCC 6,WAB (See pp. A.5 to A.13)
Explorer 7 Thermal Radiation
ITOS 1NOAA 1
FPRAVCSSR
NCC
Meteor 1 IDual Vidiconthrough 12 Scanning HRIR
I Actinometer
Nimbus 1,2Nimbus 3,4Nimbus 1,2,3Nimbus 2,3Nimbus 4Nimbus 3,4Nimbus 3,4Nimbus 3,4
AVCSIDCSHRIRMRIRTHIRSIRSIRLSIRIS
SHCSHC
NCCNCCNSSDCNSSDCNSSDC
SHCSHC
NCCNCCNSSDCNSSDCNSSDC
NCCNSSDCNSSDCNSSDCNESS,NSSDC 7
NSSDC
0r,
SHC,NESS 3 ,NCC 4
SHC,NESS 3 ,NCC 4
SHC,NCC4
NSSDCNSSDCNSSDC
NADUC (printouts fromindividual experiments)
Tiros 1 TV Camera NCC NCCthrough 10
Tiros 2,3,4,7 Scanning Radiometer NSSDCTiros 3,4,7 Low-Resolution Omni- NSSDC
directional Radiometer1 See glossary for an explanation of acronyms and abbreviations.2 Color only.3 Paper prints are maintained for one year then discarded unless of unusual interest.4 Derived products, nephanalyses, composites, etc.5 Photographs taken over the United States only.6 5-, 30-, and 90-day average brightness charts.7 Radiances at NSSDC; deduced temperature profiles at NESS.* Primary source for the general public.
ATS 1ATS 2ATS 3ATS 3
SSCCAVCSMSSCCIDC
NCCNADUCNCC,NADUC 2
NCC
NCC
NCC,NADUC 2
NCC
NonstandardPnorm~qt
Cosmos 144,156,189,206and 226
Dodge
ERTS 1
ESSA 1ESSA 2,4,6,8ESSA 3,5,7,9ESSA 3,5,7,9
NSSDC
NESSNCCNCC NCC
NSSDCNSSDC
. -- -J _ - _ - .-. -- -. I&. I- 1 -6-" L - I.u U AAL plr-1 , U -J4 LG;rid Print Mans
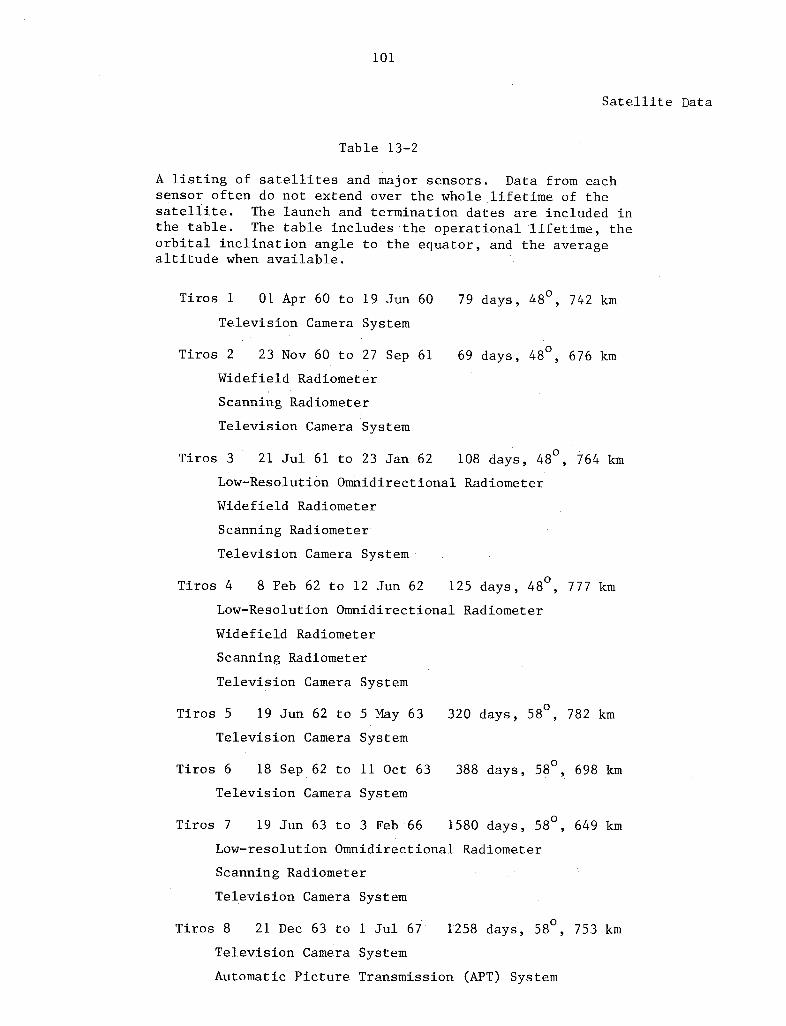
101
Satellite Data
Table 13-2
A listing of satellites and major sensors. Data from eachsensor often do not extend over the whole lifetime of thesatellite. The launch and termination dates are included inthe table. The table includes the operational lifetime, theorbital inclination angle to the equator, and the averagealtitude when available.
Tiros 1 01 Apr 60 to 19 Jun 60
Television Camera System
Tiros 2 23 Nov 60 to 27 Sep 61
Widefield Radiometer
Scanning Radiometer
Television Camera System
79 days, 480, 742 km
69 days, 480, 676 km
Tiros 3 21 Jul 61 to 23 Jan 62 108 days, 48°, 764 km
Low-Resolution Omnidirectional Radiometer
Widefield Radiometer
Scanning Radiometer
Television Camera System
Tiros 4 8 Feb 62 to 12 Jun 62 125 days, 48°, 777 km
Low-Resolution Omnidirectional Radiometer
Widefield Radiometer
Scanning Radiometer
Television Camera System
Tiros 5 19 Jun 62 to 5 May 63
Television Camera System
Tiros 6 18 Sep 62 to 11 Oct 63
Television Camera System
320 days, 580, 782 km
388 days, 580, 698 km
Tiros 7 19 Jun 63 to 3 Feb 66 1580 days, 580, 649 km
Low-resolution Omnidirectional Radiometer
Scanning Radiometer
Television Camera System
Tiros 8 21 Dec 63 to 1 Jul 67 1258 days, 580, 753 km
Television Camera System
Automatic Picture Transmission (APT) System
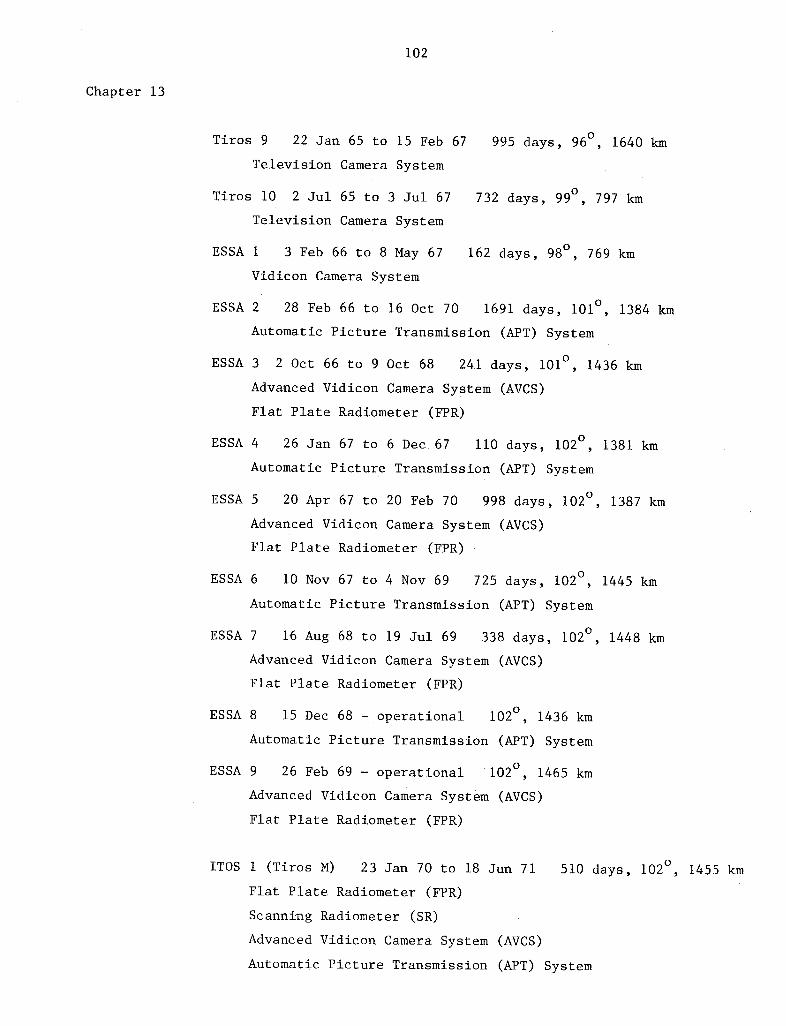
102
Chapter 13
Tiros 9 22 Jan 65 to 15 Feb 67 995 days, 96°, 1640 km
Television Camera System
Tiros 10 2 Jul 65 to 3 Jul 67 732 days, 99°, 797 km
Television Camera System
ESSA 1 3 Feb 66 to 8 May 67 162 days, 98°, 769 km
Vidicon Camera System
ESSA 2 28 Feb 66 to 16 Oct 70 1691 days, 101°, 1384 km
Automatic Picture Transmission (APT) System
ESSA 3 2 Oct 66 to 9 Oct 68 241 days, 101°, 1436 km
Advanced Vidicon Camera System (AVCS)
Flat Plate Radiometer (FPR)
ESSA 4 26 Jan 67 to 6 Dec 67 110 days, 102°, 1381 km
Automatic Picture Transmission (APT) System
ESSA 5 20 Apr 67 to 20 Feb 70 998 days, 1020, 1387 km
Advanced Vidicon Camera System (AVCS)
Flat Plate Radiometer (FPR)
ESSA 6 10 Nov 67 to 4 Nov 69 725 days, 1020, 1445 km
Automatic Picture Transmission (APT) System
ESSA 7 16 Aug 68 to 19 Jul 69 338 days, 1020, 1448 km
Advanced Vidicon Camera System (AVCS)
Flat Plate Radiometer (FPR)
ESSA 8 15 Dec 68 - operational 1020, 1436 km
Automatic Picture Transmission (APT) System
ESSA 9 26 Feb 69 - operational 1020, 1465 km
Advanced Vidicon Camera System (AVCS)
Flat Plate Radiometer (FPR)
ITOS 1 (Tiros M) 23 Jan 70 to 18 Jun 71 510 days, 102 , 1455 km
Flat Plate Radiometer (FPR)
Scanning Radiometer (SR)
Advanced Vidicon Camera System (AVCS)
Automatic Picture Transmission (APT) System

103
Satellite Data
ITOS-D (NOAA 2) 15 Oct 72 - standby 102°, 902 mi
Scanning Radiometer (SR)
Very High Resolution Radiometer (VHRR)
Vertical Temperature Profile Radiometer (VTPR)
ITOS-F (NOAA 3) 6 Nov 73 - operational 1020, 935 mi
Scanning Radiometer (SR)
Very High Resolution Radiometer (VHRR)
Vertical Temperature Profile Radiometer (VHRR)
ITOS-G (NOAA 4) 15 Nov 74 - 102°, 1457 km
Scanning Radiometer (SR)
Very High Resolution Radiometer (VHRR)
Vertical Temperature Profile Radiometer (VTPR)
ITOS-H, I, J
Advanced Very High Resolution Radiometers (AVHRR)
Tiros Operational Vertical Sounder (TOVS)
Data Collection and Platform Location System (DCS)
NOAA 1 (ITOS A) 11 Dec 70 to 19 Aug 72 251 days, 102°, 899 st mi
Flat Plate Radiometer (FPR)
Scanning Radiometer (SR)
Advanced Vidicon Camera System (AVCS)
Automatic Picture Transmission (APT) System
ATS 1 7 Dec 66 - operational 4.35° 22,237 mi (151 W)
Spin-Scan Cloudcover Camera (SSCC)
Meteorological Data Relay System (WEFAX)
ATS 3 5 Nov 67 to 12 Dec 74 2.71° 22,233 mi (450 W-950 W)
Multicolor Spin-Scan Cloudcover Camera (MSSCC)
Image Dissector Camera (IDC)
Meteorological Data Relay System (WEFAX)
Omega Position and Location Equipment (OPLE)
ATS 4 10 Aug 68 to 17 Oct 68
Image Orthicon (Day/Night) Camera

104
Chapter 13
ATS-F
Geosynchronous Very High Resolution Radiometer (GVHRR)
ATS-G
Atmospheric Sounder
Visual/Infrared Imager
Nimbus 1 28 Aug 64 to 22 Sep 64
Advanced Vidicon Camera System (AVCS)
Automatic Picture Transmission (APT) System
High-Resolution Infrared Radiometer (HRIR)
Nimbus 2 15 May 66 to 17 Jan 69
Advanced Vidicon Camera System (AVCS)
Automatic Picture Transmission (APT) System
High-Resolution Infrared Radiometer (HRIR)
Medium-Resolution Infrared Radiometer (MRIR)
Nimbus 3 14 Apr 69 to 22 Jan 72
High-Resolution Infrared Radiometer (HRIR)
Infrared Interferometer Spectrometer (IRIS)
Satellite Infrared Spectrometer (SIRS)
Medium-Resolution Infrared Radiometer (MRIR)
Image Dissector Camera System (IDCS)
Interrogation, Recording, and Location System (IRLS)
Nimbus 4 8 Apr 70 - 1000, 1090 km
Temperature-Humidity Infrared Radiometer (THIR)
Infrared Interferometer Spectrometer (IRIS)
Satellite Infrared Spectrometer (SIRS)
Backscatter Ultraviolet (BUV) Spectrometer
Image Dissector Camera System (IDCS)
Interrogation, Recording, and Location System (IRLS)
Filter Wedge Spectrometer (FWS)
Selective Chopper Radiometer (SCR)
Nimbus 5 late 72
Infrared Temperature Profile Radiometer (ITPR)
Selective Chopper Radiometer (SCR)

105
Satellite Data
Nimbus-E Microwave Spectrometer (NEMS)
Electrically Scanning Microwave Radiometer (ESMR)
Temperature-Humidity Infrared Radiometer (THIR)
Nimbus-F Estimate Jun 75
Tropical Wind Energy Conversion and Reference LevelExperiment (TWERLE)
High-Resolution Infrared Radiation Sounder (HRIRS)
Electrically Scanning Microwave Radiometer (ESMR)
Limb Radiance Inversion Radiometer (LRIR)
Earth Radiation Budget (ERB)
Pressure Modulated Radiometer (PMR)
Scanning Microwave Spectrometer (SCAMS)
Temperature-Humidity Infrared Radiometer (THIR)
SMS-1 17 May 74 - operational 1.950, 22,300 mi
Visible/Infrared Spin-Scan Radiometer (VISSR)
Meteorological Data Collection and Transmission System
SMS-B
Visible/Infrared Spin-Scan Radiometer (VISSR)
Meteorological Data Collection and Transmission System
ERTS 1 Jul 72
Return Beam Vidicon (RBV) Camera System
Multispectral Scanner (MSS)
Data Collection System (DCS)
ERTS-B
Return Beam Vidicon (RBV) Camera System
Multispectral Scanner (MSS)
Data Collection System (DCS)

I ~ ~ ~ ~

107
Chapter 14: FNWC. Meteorological and Oceanographic
Data at Fleet Numerical Weather Central
Section A: Daily Analyzed Data
1. Introduction
We will present a partial listing of the taped data at the Fleet Numerical
Weather Central at Monterey. The data are on a 63 X 63 northern hemisphere grid
unless otherwise stated. This grid is a superset of the NMC grid; it includes the
whole northern hemisphere. The North Pole is in the middle and 80 W is down.
The southern hemisphere version of this grid has the South Pole in the middle and
80 W is up. Forecast grids and fields easily derived are not included. Also,
grids of less general interest and grids for limited areas are not listed. The
grids are generally available twice a day unless otherwise indicated. FNWC is
preparing a Technical Note on climatology which will give more detailed information.
FNWC now (January 1975) has 257 microfilm cartridges of filmed CALCOMP charts.
These include daily charts and mean charts.
GRID DATA
2. Coverage of Surface Data
SFC COVER 00-06-12-18Z Mar 1965 - Apr 1972
3. Sea Level Pressure
PS 00-12 (or once Nov 1945 - Dec 1966a day)
PS 00-06-12-18Z Jan 1963 - current
These include manually inserted bogus data to put tropical storms into the
grids. The sea level pressure grids for November 1945 through March 1955 (daily
at 15Z) and April 1960 through June 1962 (1200Z) were digitized with a curve
follower at NCC under Navy contract. The Navy then used the points along the
contours, and used the high and low centers in their objective analysis program
that is used on current data. Output maps were compared against the original
charts. The April 1955 through March 1960 data were the ESSPO data from NCAR.
In the Navy sea level pressure data set, the ESSPO grid points have been run

108
Chapter 14
through the Navy analysis program as data.
4. Surface Air Temperature
T AIR 00-12Z May 1965 - current
5. Main Stack of Upper Air Data in Analyzed Grids (twice-daily coverage)
Height and temperature grids.
D 1000 Nov 1945
T 1000 Jun 1962
D,T 925 Aug 1969
D,T 850, 700 Nov 1961
D 500 Nov 1945
T 500 Nov 1961
D 400 Mar 1963
T 400 Jul 1963
D,T 300 Nov 1961
D,T 250 Aug 1969
D 200 Mar 1963
T 200 Jan 1964
D,T 150 Aug 1969
D,T 100 Jan 1968
D,T 50, 30, 10 Aug 1969
Data coverage Jul 1963
- current
- current
- current
- current
- current
- current
- current
- current
- current
- current
- current
- current
- current
- current
- Apr 1972
- Apr 1972
Height, "D" Value (mb)
Temperature
distribution of input data
Source of the 500 mb data: The Navy got the AROWA set of hand digitized
500 mb data for November 1945 through December 1952. They used these grid points
in their objective analysis program. The maps for January 1953 through March
1955 were digitized at NCC with a curve follower and objectively analyed at FNWC.
These maps usually had contours to about 8°N. April 1955 through March 1960 was
the ESSPO set of data in which the grid point values were manually read off. This
set was cleaned up by NCAR. In the Navy data set, these points were then put
through their analysis program.
The April 1960 through 1962 data were from AFGWC.
-- _ -
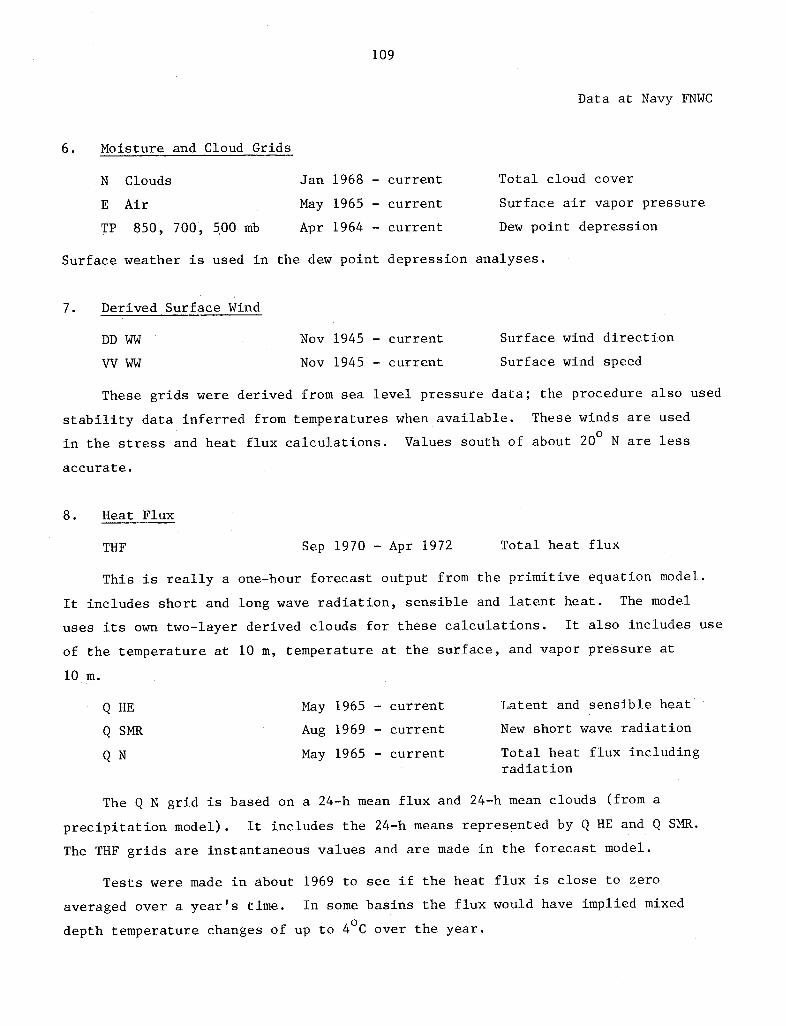
109
Data at Navy FNWC
6. Moisture and Cloud Grids
Clouds
Air
850, 700, 500 mb
Jan 1968 - current
May 1965 - current
Apr 1964 - current
Total cloud cover
Surface air vapor pressure
Dew point depression
Surface weather is used in the dew point depression analyses.
7. Derived Surface Wind
Nov 1945 - current
Nov 1945 - current
Surface wind direction
Surface wind speed
These grids were derived from sea level pressure data; the procedure also used
stability data inferred from temperatures when available. These winds are used
in the stress and heat flux calculations. Values south of about 20 N are less
accurate.
8. Heat Flux
Sep 1970 - Apr 1972 Total heat flux
This is really a one-hour forecast output from the primitive equation model.
It includes short and long wave radiation, sensible and latent heat. The model
uses its own two-layer derived clouds for these calculations. It also includes use
of the temperature at 10 m, temperature at the surface, and vapor pressure at
10 m.
May 1965 - current
Aug 1969 - current
May 1965 - current
Latent and sensible heat
New short wave radiation
Total heat flux includingradiation
The Q N grid is based on a 24-h mean flux and 24-h mean clouds (from a
precipitation model). It includes the 24-h means represented by Q HE and Q SMR.
The THF grids are instantaneous values and are made in the forecast model.
Tests were made in about 1969 to see if the heat flux is close to zero
averaged over a year's time. In some basins the flux would have implied mixed
depth temperature changes of up to 4 C over the year.
N
E
TP
DD WW
VV WW
THF
Q HE
Q SMR
QN
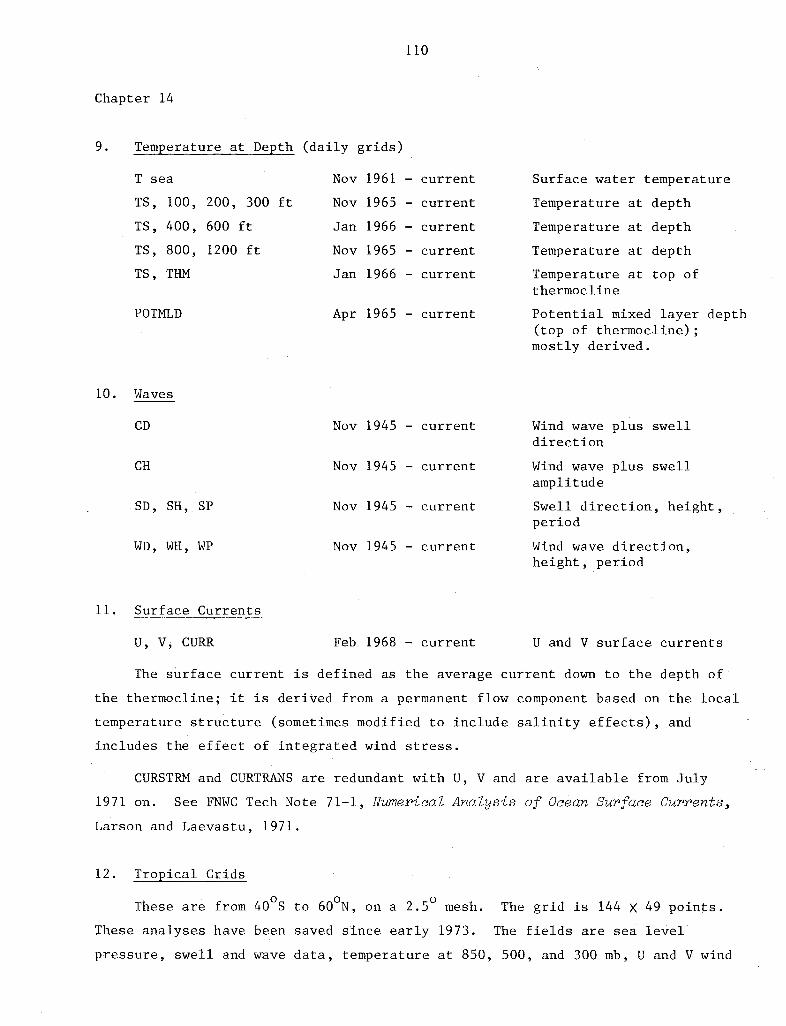
110
Chapter 14
9. Temperature at Depth (daily grids)
T sea
TS, 100, 200, 300 ft
TS, 400, 600 ft
TS, 800, 1200 ft
TS, THM
POTMLD
Nov
Nov
Jan
Nov
Jan
1961
1965
1966
1965
1966
- current
- current
- current
- current
- current
Apr 1965 - current
Surface water temperature
Temperature at depth
Temperature at depth
Temperature at depth
Temperature at top ofthermocline
Potential mixed layer depth(top of thermocline);mostly derived.
10. Waves
Nov 1945 - current
Nov 1945 - current
SD, SH, SP
WD, WH, WP
Nov 1945 - current
Nov 1945 - current
Wind wave plus swelldirection
Wind wave plus swellamplitude
Swell direction, height,period
Wind wave direction,height, period
11. Surface Currents
U, V, CURR Feb 1968 - current U and V surface currents
The surface current is defined as the average current down to the depth of
the thermocline; it is derived from a permanent flow component based on the local
temperature structure (sometimes modified to include salinity effects), and
includes the effect of integrated wind stress.
CURSTRM and CURTRANS are redundant with U, V and are available from July
1971 on. See FNWC Tech Note 71-1, Numerical Analysis of Ocean Surface Currents,
Larson and Laevastu, 1971.
12. Tropical Grids
These are from 400 S to 600N, on a 2.5° mesh. The grid is 144 X 49 points.
These analyses have been saved since early 1973. The fields are sea level
pressure, swell and wave data, temperature at 850, 500, and 300 mb, U and V wind
CD
CH

111
Data at Navy FNWC
at the surface, 700, 400, 250, and 200 mb. A variational calculus scheme is used
in the analysis program.
13. Global Sea Level Pressure Analyses and Water Temperature
In August 1974 the Navy started archiving global sea level pressure and water
temperature analyses on a 2.5 mesh.
14. Southern Hemisphere Analyses
Archives of the SST analyses started 1 July 1973. Made on the Navy grid
63 X 63 points (800W is up). We believe that some satellite data are used in
these analyses. There is also an analysis of sea level pressure. Southern
hemisphere surface air temperature analyses are not yet being made (as of
February 1975).
In August 1974, FNWC started archiving 63 X 63 analyses of height and
temperature in the southern hemisphere at the following levels: 1000, 925, 850,
700, 500, 400, 300, 250, 200, 150, 100 mb.
Section B: Observed Data
RAW DATA
15. Synoptic Surface Observations (October 1966 - current)
Four synoptic reports per day for available northern hemisphere (southern
hemisphere after December 1970) land and ship stations are received between
observation time and observation time +3 h (average 4000 reports each synoptic
time). Identified by WMO station number or ship identifier and latitude and
longitude to nearest tenth of a degree.
16. Synoptic Upper-air Observations (October 1966 - current)
Two synoptic reports per day for available northern hemisphere land and ship
stations are received between observation time and observation time +9 h
(average 500 reports each synoptic time). Identified by WMO station number or
ship identifier and latitude and longitude to nearest tenth of a degree.

112
Chapter 14
17. Recent Surface and Upper Air Synoptically Filed Data (as of October 1973)
A binary pack of
included 3 through 11
Contains both surface
mate counts of data:
the synoptic data starts
January 1973 (nine days)
and upper air data. The
24 November 1970. A sample tape
on one 7-channel tape, 556 BPI.
tapes contain the following approxi-
06 09 Other hours (1-11)
Surface ships
Surface land
UA mandatory
UA significant
UA aireps
670
4350
1000
840
1450
12Z
Surface ships
Surface land
UA mandatory
UA significant
UA Aireps
650
5000
950
800
1450
85
3400
15
60
3100
500
4750
18
470
4300
9070
3600
21 Other hours (13-23)
50
3000
95
The upper air
and all duplicates
report counts are high because transmissions are not combined
are not eliminated.
18. Special Marine Observations (Mid-1962 - current)
Bathythermograph (BT) soundings (estimated 435,000 total) for the northern
hemisphere. Converted by computer from original transmission codes to a single
format and corrected where possible. (Refer to Samples, 1966.) Also see section
on average ocean temperatures at depth (C 20 below).
19. Expendable Bathythermograph Soundings (Mid-1966 - current)
Estimated 195,000 total observations for the northern hemisphere. XBT
traces digitized and converted to a packed binary format (format unpublished;
available from FNWC, Monterey, California).
OOZ 03
.____
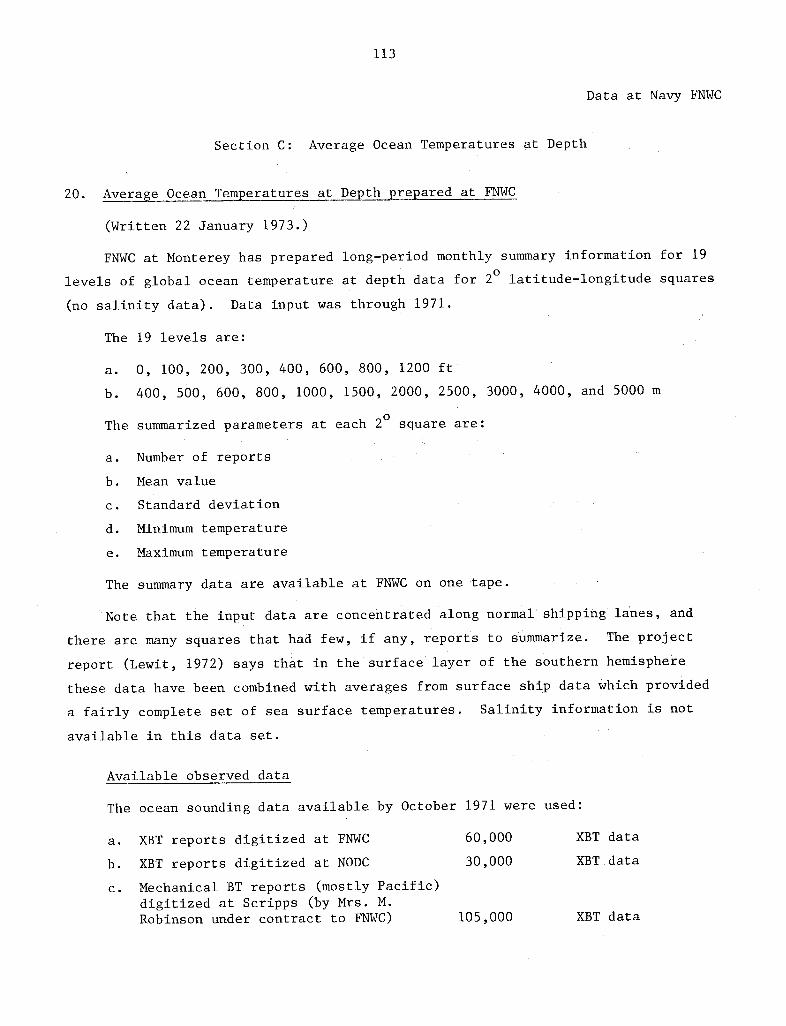
113
Data at Navy FNWC
Section C: Average Ocean Temperatures at Depth
20. Average Ocean Temperatures at Depth prepared at FNWC
(Written 22 January 1973.)
FNWC at Monterey has prepared long-period monthly summary information for 19
levels of global ocean temperature at depth data for 2 latitude-longitude squares
(no salinity data). Data input was through 1971.
The 19 levels are:
a. 0, 100, 200, 300, 400, 600, 800, 1200 ft
b. 400, 500, 600, 800, 1000, 1500, 2000, 2500, 3000, 4000, and 5000 m
The summarized parameters at each 2 square are:
a. Number of reports
b. Mean value
c. Standard deviation
d. Minimum temperature
e. Maximum temperature
The summary data are available at FNWC on one tape.
Note that the input data are concentrated along normal shipping lanes, and
there are many squares that had few, if any, reports to summarize. The project
report (Lewit, 1972) says that in the surface layer of the southern hemisphere
these data have been combined with averages from surface ship data which provided
a fairly complete set of sea surface temperatures. Salinity information is not
available in this data set.
Available observed data
The ocean sounding data available by October 1971 were used:
a. XBT reports digitized at FNWC 60,000 XBT data
b. XBT reports digitized at NODC 30,000 XBT data
c. Mechanical BT reports (mostly Pacific)
digitized at Scripps (by Mrs. M.Robinson under contract to FNWC) 105,000 XBT data
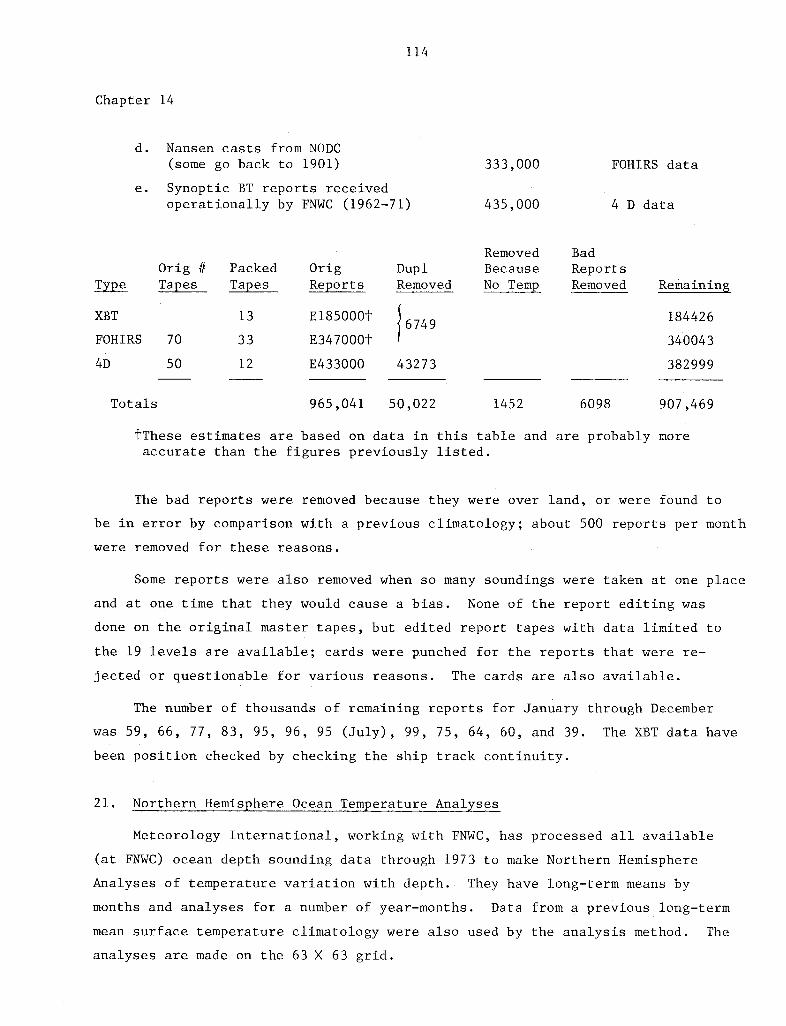
114
Chapter 14
d. Nansen casts from NODC(some go back to 1901) 333,000 FOHIRS data
e. Synoptic BT reports receivedoperationally by FNWC (1962-71) 435,000 4 D data
Removed BadOrig # Packed Orig Dupl Because Reports
Type Tap TaTapes Reports Removed No Temp Removed Remaining
XBT 13 E185000t9 1844266749
FOHIRS 70 33 E347000+t 340043
4D 50 12 E433000 43273 382999
Totals 965,041 50,022 1452 6098 907,469
tThese estimates are based on data in this table and are probably moreaccurate than the figures previously listed.
The bad reports were removed because they were over land, or were found to
be in error by comparison with a previous climatology; about 500 reports per month
were removed for these reasons.
Some reports were also removed when so many soundings were taken at one place
and at one time that they would cause a bias. None of the report editing was
done on the original master tapes, but edited report tapes with data limited to
the 19 levels are available; cards were punched for the reports that were re-
jected or questionable for various reasons. The cards are also available.
The number of thousands of remaining reports for January through December
was 59, 66, 77, 83, 95, 96, 95 (July), 99, 75, 64, 60, and 39. The XBT data have
been position checked by checking the ship track continuity.
21. Northern Hemisphere Ocean Temperature Analyses
Meteorology International, working with FNWC, has processed all available
(at FNWC) ocean depth sounding data through 1973 to make Northern Hemisphere
Analyses of temperature variation with depth. They have long-term means by
months and analyses for a number of year-months. Data from a previous long-term
mean surface temperature climatology were also used by the analysis method. The
analyses are made on the 63 X 63 grid.
115
Data at Navy FNWC
Two sets of analyses have been made. One gives temperature at depth for
seven levels: surface, 200, 400, ..., 1200 ft. The other gives temperature
analyses vs the top of the main temperature change layer (thermocline): top of
thermocline, 100 ft below it, 200 ft below, gradient in layer above (not over
100 ft above), gradient to 100 ft below, gradient 100-200 ft below, gradient
200-300 ft below. These will be combined, using a vertical profile blending
scheme, into a set to give the most complete description of temperature with depth
to 1200 ft. In the analyses, each sounding (station) has been used in such a way
that the thermocline gradient is preserved, even though different stations in one
area have different thermocline depths. Methods are used to preserve Gulf Stream
gradients, and features near or across land barriers (such as in the Panama area).
Analyses are available for:
a. Monthly, all years
b. Monthly, 1964 and earlier
c. Monthly, 1965 through 1967
d. Year-months, 1968 through 1972.
By the end of 1975, the method will probably be used for daily depth
temperature analyses at FNWC. The guess will be the previous day's analysis.
At first it will not be adjusted by the convergence caused by surface stress.
Bad BTs can be rejected. Each BT is looked at (along with newer data) for three
days to keep improving the decision of bad vs good. The analysis methods are
described in Weigle and Mendenhall (1974).
W. Weigle is considering the possibility of including salinity analyses.
They also will probably make changes to handle multiple thermoclines in a better
way (information from W. Weigle, February 1975). The analyses could also be
made for the southern hemisphere if funds were available.
Deep Ocean Salinity and Temperature
These are poorer quality global analyses of deep ocean salinity and
temperature that were adapted from various atlases: 400, 600, 800, 1000, ...,
5000 m.

116
Chapter 14
Section D: Average Analysis Data
22. Long-term (Normal) Monthly Grid Statistics Produced at FNWC
Parameter
Sea Level Pressure
Z850
Z700
Z400
Z300
Z250
Z500
TS 100 ft depth
TS 200 ft
TS 300 ft
TS 400 ft
Air temperature
Grid
N/H 63X6311
t
it
it
t,
it
it
Mean SD Diurnals Inclusive Period
x
x
x
x
x
x
x
x
x
x
x
x
x
x
x
x
x
x
x
x
x
1964-1969
1965-1973
1965-1973
1965-1973
1965-1973
1965-1973
1946-1969
1965-1972
1965-1972
1965-1972
1965-1972
1968-1973
The statistics were formed from the daily gridded analyses produced at FNWC
with data at each grid point required to meet a criteria of within four standard
deviations of the mean plus a variable factor of up to 100 m, depending on level.
Other long-term grid means available that have been obtained either by digi-
tization of atlases or from averages of station data (1° or 2° latitude-longitude),
or from a combination, include salinity and temperature from the surface down to
5000 m (including a thermocline level) for the northern hemisphere. The sea
surface temperature is available for the southern hemisphere.
23. Monthly and Half-monthly Grid Means for Each Year at FNWC
a. Monthly grid means and half-monthly means routinely produced at FNWC
for the northern hemisphere include:
Sea level pressure and anomaly since January
Heat flux (total) September 1971
Short wave radiation (net) September 1971
Sea surface temperature and anomaly November
1946
1961
117
Data at Navy FNWC
Sea surface temperature and anomaly (125 X 125) January 1972
TS 100, 200, 300, 400, 600, 800, 1200 ft and anomalies September 1971
Surface wind speed September 1971
Potential mixed layer depth anomaly September 1971
Z500 mb and anomaly September 1971
Wave height September 1971
Air temperature September 1971
Vapor pressure September 1971
Note: Grids are 63 X 63 unless otherwise indicated.
The above grids are quality controlled by visual inspection of the plotted
charts. (Information from James Zuver, FNWC, December 1974.)
b. Other monthly means
The following monthly grid statistics for the northern hemisphere were
derived from once daily analyses (ocean areas) for the period from
January 1946 to March 1974, northern hemisphere only:
Wave height--mean, SD, maximum, minimum
Combined wave height--mean, SD, maximum, minimum
Wave period--mean, SD
Wave direction--modal
U, V surface wind components--mean
Wind direction--modal
Wind speed--mean, SD, maximum, minimum
c. Microfilm maps
FNWC has a microfilm of the monthly mean charts.

I
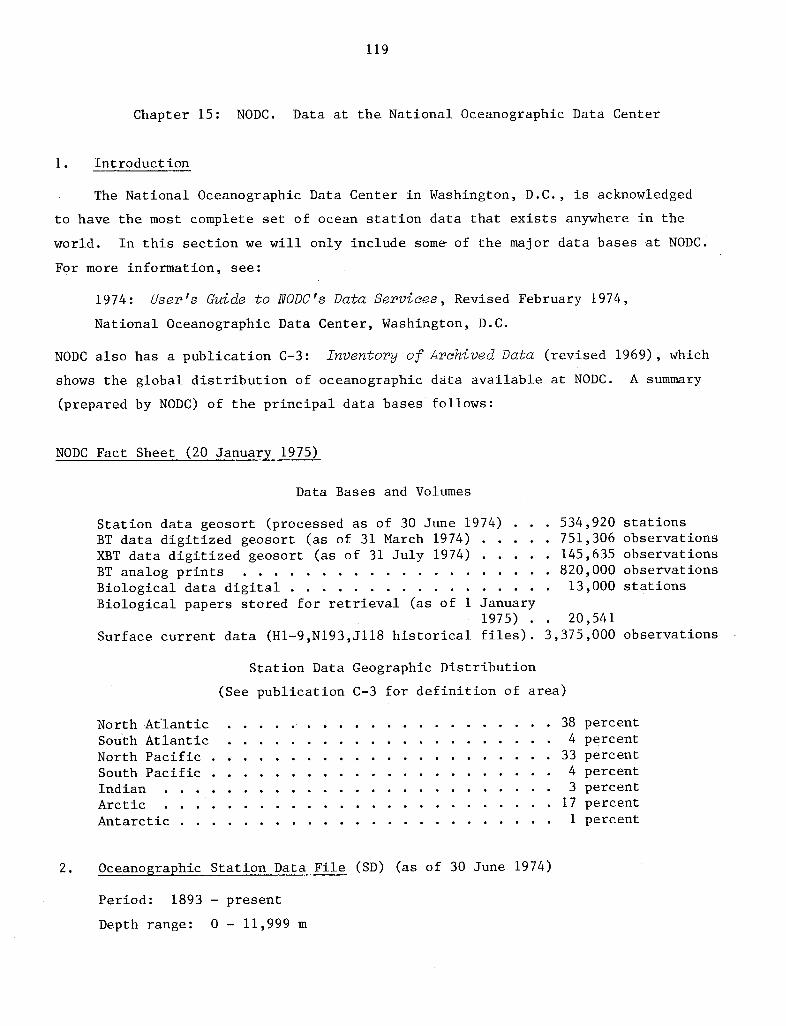
119
Chapter 15: NODC. Data at the National Oceanographic Data Center
1. Introduction
The National Oceanographic Data Center in Washington, D.C., is acknowledged
to have the most complete set of ocean station data that exists anywhere in the
world. In this section we will only include some of the major data bases at NODC.
For more information, see:
1974: User's Guide to NODC's Data Services, Revised February 1974,
National Oceanographic Data Center, Washington, D.C.
NODC also has a publication C-3: Inventory of Archived Data (revised 1969), which
shows the global distribution of oceanographic data available at NODC. A summary
(prepared by NODC) of the principal data bases follows:
NODC Fact Sheet (20 January 1975)
Data Bases and Volumes
Station data geosort (processed as of 30 June 1974) . .BT data digitized geosort (as of 31 March 1974) . . .XBT data digitized geosort (as of 31 July 1974) . . .BT analog prints ...................Biological data digital ................Biological papers stored for retrieval (as of 1 January
1975) .Surface current data (H1-9,N193,J118 historical files).
. 534,920 stations
. 751,306 observations
. 145,635 observations
. 820,000 observations13,000 stations
. 20,5413,375,000 observations
Station Data Geographic Distribution
(See publication C-3 for definition of area)
North Atlantic . . . . . . . . . . . . . . . . . . . .South Atlantic ... . . .. .. . . . . . .. ... .North Pacific . . ................South Pacific .....................Indian ............ . . . . . ..Arctic . . . . . . . . . . . . . . . . . . . . .Antarctic . . . . . . . . . . . . . . . . .. . . . .
38 percent4 percent33 percent4 percent3 percent
17 percent1 percent
2. Oceanographic Station Data File (SD) (as of 30 June 1974)
Period: 1893 - present
Depth range: 0 - 11,999 m

120
Chapter 15
Types: 535,000 Nansen casts
5000 STD stations (low vertical resolution)
Volume: 34 tapes, 1600 BPI, 1,284,000,000 characters
This volume is duplicated in cruise sort and in area sort.
Growth: About 35,000 stations per year
Quality: The temperatures are usually accurate to about +0.02-0.05 0C
NOTE: There are about 20,000 STDs that went down to 5000 m which took
about six observations per meter. These will be condensed to a
lower resolution set and included in the above file.
3. MBT (mechanical bathythermograph)
Digitized from MBT slides. Gives temperature vs depth. May have bias of
+1-4°C. With bias ignored, these are probably accurate to +0.2°C.
Period: 1941 - present
Depth: 0 to 285 m
Report Length: Maximum 324 bytes, estimated average 275 bytes
Volume: 756,306 observations, 31 March 1974, or about 2.08 X 108 bytes(packed decimal)
Sort: This data volume is available in cruise sort and in area sort.
Growth: Phased out. Only possible foreign digitized data. Growth
less than 5000 per year.
NOTE: NODC has a backlog of 240,000 of these (of which 160,000 are
usable). These are being digitized at Scripps (for $3 each) at
the rate of 15,000 per year. Funding is provided for calendar
year 1975. The work will stop before completion unless additional
support is provided. Approximately 3,000 observations are ready
to be included in the next NODC tape update as of January 1975.
4. XBT (expendable bathythermograph)
These expendable bathythermographs are usually accurate to within about
+0.2°C. This file includes data from instruments dropped from ships and from
aircraft.
121
Data at NODC
Period: 1966 - present
Depth: 0 to 1830 m
Report Length: Maximum 1304 characters, estimated average 700 characters
Volume: 145,635 records, 31 July 1974, or about 1.02 X 10⁸ characters
Sort: This volume is available in either cruise or area sort.
Growth: About 25,000 per year. Also, the Navy will soon give NODC a copy
of 116,000 additional observations.
Backlog: NODC has a backlog of about 30,000 of these and will need about
$100,000 to digitize them.
5. Ocean Weather Station Data from the permanent ships and special projects.
U.S. vessels occupying Ocean Weather Stations (OWS) Alpha, Bravo, Delta, and
Echo in the Atlantic and November and Victor in the Pacific took once-a-day MBTs
(XBTs when they became available). During selected short periods, a crew would
be available to take once-a-day Nansen casts. Ships on OWS Bravo took once-daily
Nansen casts in about 1972-1974. Canadian ships on OWS Papa in the Pacific have
generally taken once-daily Nansen casts. Weather station data are in the regular
files, but are flagged when they are from a weather ship that is within +10
latitude and longitude of its standard position.
NORPAX is instrumenting (December 1974) three commercial ships to obtain
United States to Japan depth x-sections from soundings each two weeks.
6. Surface Temperature and Salinity
NODC has about 200,000 observations, with about 120 characters each, covering
a 50-year period. Each observation includes the temperature and salinity within
the top few meters.
7. Surface and Seabed Currents
One file of ship drift data from the Naval Oceanographic Office has 1,934,000
records on six reels (95% of the observations are for the period 1904-1945, with
some later data to 1972). The other, from the Netherlands, has 1,260,293 records
on four reels (period 1853-1931). About 80 characters per observation. There

122
Chapter 15
is also one tape of drift bottle and seabed drifter data, with about 85,000
observations, mostly in the North Atlantic. Growth is about 2,000 observations
per year.
8. Data from Current Meters and from Selected Drifters
These data are from current meters at different levels and from drifters at
various depths. The data have not yet been gathered together into a more unified
set. A significant amount of current meter data has been taken in the continental
shelf area of the United States.
123
Chapter 16: Sea Surface Water Temperature Grid Data
1. Navy Sea Surface Temperature Grids
Twice-daily grids from 6 November 1961 through January 1972 are available
at NCAR (on five tapes). The grid is a 63 X 63 grid that includes all of the
Northern Hemisphere and is a superset of the NMC octagonal grid. This data set
will be updated.
Southern hemisphere grids are available starting in July 1973. See
Chapter 14,which describes data at FNWC.
Year-month grids are also available for April 1962 through March 1967.
Long-term monthly means with 14-20 years of data are available. These means
used the Bureau of Commercial Fisheries grid data where available (Pacific Ocean).
2. NMC Sea Surface Temperatures
These start on the northern hemisphere octagon grid starting in January 1973.
3. Bureau of Commercial Fisheries SST Grid Data
Year-month grids of Pacific Ocean Data for the period January 1949 through
December 1962 are at NCAR. These 168 grids are for the area north of 200 S. The
project was described and the associated maps have been published in an atlas
(Eber et al., 1968).
4. Long-term Mean Sea Surface Water Temperature
Maps of global mean monthly sea surface temperatures were prepared and then
digitized at intervals of 2.5 and 5.00 latitude-longitude. The maps were based
on various atlas sources. NCAR TN-54 (Washington and Thiel, 1970) describes this
project and shows small maps based on the digitized data.
5. Sea Surface Temperatures
The Fisheries group at Scripps has been preparing monthly averages of sea
surface temperature by 2 latitude-longitude squares. Since this is just an
average of the raw data, it avoids the smoothing of gradients seen in objective
analyses. They produce maps of the temperatures and of anomalies vs long-term
124
Chapter 16
mean and vs the last year's temperature. These are published as the Monthly
Fisheries Advisory by the National Marine Fisheries Service at Scripps. This
effort has been going on for about ten years along the Pacific coast and is now
expanded to the whole North Pacific.
6. Half-monthly Pacific Ocean Grids Prepared by NORPAX
NORPAX is preparing (March 1975) grids for each half-month, starting in 1899
for the Pacific Ocean, 300 S to 600N. Grids are for each 1° latitude-longitude
square. Note that many squares will not have any data. Based on the historical
marine decks from NCC. They are calculating the mean and variance for sea surface
temperature, air temperature, total cloud cover, U wind, V wind, total wind speed,
direction, and heat flux. Values are included if they are within +2 standard
deviations of the long-term mean calculated from the whole period of record. See
Chapter 17 for a discussion of the basic data used.
7. Satellite Data
See Chapter 13 on satellites for information about other sea surface
temperature grids.
125
Chapter 17: World Surface Ship Data
1. Introduction
Although the surface ship data have been listed in the chapter on NCC data,
their current status and importance to many problems are such that more details
will now be given. This discussion will primarily refer to the ship logs that
are punched after the ships have returned home and not to the similar reports that
are broadcast from the moving ships.
2. Projects that Aid in the Development of this Data Set
First we will mention the projects which are being utilized in the develop-
ment of this data set. Then we will make some recommendations on a data flow plan
that would provide for the orderly addition of more old data, and file updating
with new data.
a. Appendix 2 includes a listing of some of the ship data subsets that are
included in the total set of ship data.
b. For the 1860-1960 period, there has been a recent project (under NSF's
program, International Decade of Ocean Exploration) to gather all the
cards from bucket-temperature ships. Three countries receive the data:
Germany--Atlantic Ocean
Holland--Indian Ocean, etc.
United States--Pacific Ocean
For this project a number of old ship logs have been punched. (Germany
has punched about 5,000,000 old observations.) Each of these three
countries will put the data into an international exchange format with
common units where possible. Data groups such as current weather,
visibility, and wave heights may be dropped in the final format, but it
now appears that the countries may have another tape series that includes
these data, plus data from nonbucket-temperature ships, and all other
data in best checked form. NCC now (February 1975) estimates that it
will be one or two years before all of the new data from this project
are available.

126
Chapter 17
c. The data since 1960 are being gathered by nine countries, each allotted
specified regions. The United States (NCC) gets copies of all of the
data. Data have been received through about 1970 (January 1975).
d. The practice in the United States is as follows: We recruit a number of
ships for which the ship logs are sent to Asheville. The observations
were punched (usually four or eight observations per day) and put through
a computer program in which reported ship positions were compared against
a time series of positions. For budget reasons, U.S. card punching
terminated after March 1973. Data for April and May 1973 are now (May
1975) being punched and it appears that the new punching program will
continue.
In 1961, the United States was punching about 30,000 to 50,000 ship cards
each month. When a U.S. ship was located in the area of responsibility
of another country, copies of the edited data were sent to that country.
3. Recommendations Concerning the Data Flow and Checking
a. The basic data should keep the data for individual ship tracks together.
It would not be split into regions. Another data set would be prepared
(from the basic set) in which the data are ordered by area and time.
Because of the cost of conversion, this latter set would be updated less
frequently than the basic set.
b. It is current practice for several different countries to take the
responsibility for collecting all marine punched cards for their own
ships and for the ships of a few other nations. The smaller or less
involved country just punches the time-series ship data or perhaps just
sends the ship logs to the nation accepting the responsibility. The
responsible country should then make computer checks for the consistency
of the data along the ship tracks. The originating country might then
be involved in making the checks necessary to punch correction cards.
c. All data should go through ship position and data parameter checks before
being added to the data set. When we asked R. Quayle at NCC if he
thought that the punched ship data had many position errors in it, he
noted that in at least one older data set, a number of ships were shown

127
World Surface Ship Data
in the Sahara Desert. In time-series form, it is easy to check ship
position, temperature and pressure (using pressure change, too) for
reasonable continuity. If, for example, it is discovered that the ship
barometer is 3 mb off between specified dates, that is also easy to
correct in the computer.
Until all data have been through a ship time-series check, a bit in the
format could be used to indicate whether the data had been checked in this
way.
d. Inventories at the national and international levels need to be prepared
to identify what ships and time periods are in the global set, and what
are outside. Then as more old or new data are punched and checked, they
can be accumulated on update tapes to become a part of the main set.
The U.S. NCC can identify more than three million U.S. ship observations
that are not part of any computer data set.
4. Aspects of Data Management
a. The ship number and nation of origin should be in the tape record so that
the data can always be sorted back into ship time-series order. Future
computer systems will make it feasible to make certain additional data
checks on the whole set of ship observations if the ship numbers are
available on the records. For example, the pressure reading from each
ship could be compared to that from every other ship whenever a pair of
ships are relatively close to each other. In this way, biases in the
sensors could be detected.
b. The format of the tape ordinarily will not be the same as the cards. If
the ship number is ever dropped from each card, a header card in front of
each ship track should be used to make sure that the number is retained
in the tape record.
c. The original units should be indicated in the taped data.
d. Data groups, such as weather and waves, should be carried along if they
have been punched.
128
Chapter 17
e. Data from the nonbucket-temperature ships should be carried along if they
have been punched. One bit could specify that the water temperature is a
bucket temperature.
f. At a later time, a copy of the data should be put into a compact, packed
binary format to save tape volume, reproduction cost, and processing time.
g. We should plan a data flow so that we do not have to add duplicate un-
checked observations to a clean data set in order to obtain some
additional reports that were not originally included in the clean set.
5. Status of the Data Sets Based on Ship Logs
NCC has the most complete set of these observations. They have about 375
tapes, containing approximately 43 million observations. This data set contains
several subsets and will have even more when other data are incorporated. There
is considerable duplication between the sets. The data are generally in time sort
within 10° X 10° Marsden Square location.
The Navy (Monterey) bought this set and has packed it in binary onto 100
tapes, dropping significant clouds and ice accretion. They use four 60-bit words
for each observation. They obtained 16 tapes with the permanent ship observations
(not in the above set) and they obtained 60 tapes to update the files to June
1970. NCC summarized the wave height and temperature data for a marine atlas
(Meserve, 1974).
NORPAX has condensed the North Pacific Ocean data onto 19 tapes (1600 BPI).
The Navy-NORPAX tapes still contain some problems from a few subsets on the
original tapes in which units were converted twice (can be identified and removed).
NCC is further cleaning up all of the original data which are now on 375
tapes. The Atlantic Ocean is done and the Indian Ocean is about half done
(January 1975).
6. Synoptic File of Ship Observations
Tapes with synoptic observations (including ships) are created by NMC, Navy
FNWC, AFGWC, and AF ETAC. These are data received in near-real time from the
teletype networks.
129
World Surface Ship Data
7. An Evaluation of the Global Telecommunications System (GTS) as a Marine
Climatic Data Source (condensed from a report by R. Quayle, NCC)
GTS observations derived from the Air Force Global Weather Central were
compared to original shipboard manuscript observation forms. For the observations
taken at regular synoptic times by U.S. ships at sea:
* About 39% were transmitted via GTS
* About 31% were received in decodable form
- About 14% were received with no transmission errors
* About 8% were received with no transmission errors and no observational
errors
Analysis of the observation counts shows that about 85,000 observations per
month are received via GTS. Under the marine punching program, NCC was punching
about 50,000 observations per month and receiving a similar number in exchange.
It is now abundantly clear that one data set is not a subset of the other. A
great many observations are received via GTS from foreign ships with unofficial
instrumentation. Also, some GTS observations are received for which the log books
have been lost. The result is that GTS coverage is quantitatively superior in some
areas (near the U.S.S.R. coast, some places in the southern hemisphere, etc.)
compared with the exchange data. For thoroughly comprehensive data coverage both
sources would be desirable, with the GTS serving as an alternate source,
customer budgets permitting.
The lower quality of the GTS data is also a problem for many climatic users.
Thus, we recommend that the U.S. ship log punching programs be restarted.

I

131
Chapter 18: Geographical Data
NCAR has two sets of global 1° resolution elevation data. One of these also
has water depth and ice thickness. Elevation data for each 5 min are also
available for North America and Europe. A set of 50 global mean elevation data is
included on the climatology tape for the southern hemisphere. Over the United
States, elevation data are available for horizontal resolution of 208 ft.
1. Average Elevation Data from USAF, by 1°, 30 min, and 5 min squares
NCAR has a tape containing mean elevation data for 1 latitude-longitude
squares for 30 min squares (global), and for 5 min squares. The 5 min data
coverage is for Europe, a portion of North Africa, and North America (but not for
Alaska or parts of the Northwest Territories). The data coverage is shown on a
map in the writeup sent out with the data.
The data, received on seven tapes from the Air Force Aeronautical Chart and
Information Center (ACIC), have now been blocked and merged onto one tape. The
first 76,161 cards contain the 10 and 30 min data. The complete tape, including
the 5 min data, has 163,978 cards.
ACIC writeups describe the method of obtaining the data and the format of
the card images.
2. Average Elevation, Depth, and Ice Data from Scripps
This 1° latitude-longitude set of global data gives the elevation of the
earth's rock surface; thus, these are the data giving the depth, height of land,
and base of ice caps. It also gives the ordinary elevation above sea level. This
set was updated with corrections by L. Gates and A. Nelson at Rand in 1973.
3. Ten-Minute Elevation Data for the World
The Navy (FNWC) has a set of terrain data by 10 min latitude-longitude squares.
For each square there are data on the minimum elevation, average elevation, and
the maximum. There are also ridge orientation, percent of square covered by
water, terrain characteristics (flat, mountainous, swamp, etc.), and percent
urbanization. Ocean depth data are not given.
132
Chapter 18
Data for the northern hemisphere are on two binary tapes at FNWC. There are
96 bits for each 10 min square. The southern hemisphere is nearing completion
(April 1975).
4. Estimated Surface Elevation Data and Sea Water Surface Temperatures are
available for the last ice age.
5. Elevation Data--High Resolution (information as of June 1973)
Data at a horizontal resolution of 208 ft (not available at NCAR).
The Army Map Service (Washington, D.C.) has digitized contour maps for the
United States, and for parts of Europe and Asia. They mainly used maps with a
scale of 20,000 ft = 1 in. On the digitized maps the contours can be off by
about 2% -- +400 ft in the horizontal and 100 ft in elevation.
The data are grouped together for 1° longitude by 1 latitude blocks (one
tape each). An elevation is given for each 208 ft in the horizontal. There are
about 900 tapes for the United States.
Manager of the data set:
Gerald Kniskern, Director, DMATC6500 Brooks LaneWashington, D.C. 20315
Attn: Code 40320Phone number: (202) 227-2374
6. Continental Shelf Depth and Map Data
The National Ocean Survey is working on a project to digitize the hydrographic
survey charts giving depth, obstruction, etc., for the continental shelf of the
United States. NCC is digitizing 2700 past charts. About 10,000 points are read
from each chart. Currently (March 1975) NCC has finished the East and Gulf Coasts
and is working on the West Coast and the Gulf of Alaska. The ocean survey input
data has been in digital form since 1964. NOS will merge the older data with the
newer data to make a data base that will be used to make nautical charts that are
mostly prepared by computers. The map scales will vary from 1:10,000 to l:millions.
The high-resolution maps usually will have depth contours at sea level, 3, 6, 12,
18, 30, 60 ft, etc.
133
Geographical Data
At present NOS has no plans to make depth data available on a lower
resolution grid mesh, such as one point each kilometer.

I

135
Chapter 19: Data for Assessment Studies
Section A: Crop Data
1. James McQuigg (University of Missouri and NOAA) has yields of U.S. wheat
crops by states for 70 years. By about September 1975, he will have state yields
of corn, soybeans, flax, grain, sorghum, and rice. He will gradually obtain a
supply of U.S. crop yield data by counties and Canadian crops by crop districts.
The yields for small areas of the United States are really estimates. They
are based on acreage planted and estimated yield made by measurements from a few
small sample areas in fields. The estimates of the national crop yield for a given
year are usually improved for about five years. The final estimate is usually
within about 2% of the year-end estimate made during the crop year.
Studies have shown that yield data can be closely approximated from cal-
culations made from daily rainfall and from maximum and minimum temperatures.
Using these data, the Canadians came within 1.6 bushels per acre of the measured
average wheat yield over three provinces (about 20-25 bushels per acre). Such
calculations can also be used to make up-to-date crop estimates that are more
timely than estimates from samples.
A U.S. Department of Agriculture (1951) book, Fluctuations in Crop and
Weather, has crop data from 1866 to 1948.
2. U.S. county and crop district data have been gathered by the Agriculture
Department's Statistical and Research Services (SRS) division for 1968 through
1973. McQuigg has been contacting individual states for additional data.
3. The U.S. Department of Agriculture publishes information about crop acreage,
yield per acre, and production for the United States and for selected crops in
other countries:
1973: Agriculture Statistics, U.S. Department of Agriculture,Government Printing Office
4. The U.S. Department of Agriculture is preparing a tape with crop statistics
for the world, by individual countries. The grains are nearly done. Time period
is 1950-present, except that data for most African countries do not start until
1960.

136
Chapter 19
5. The Food and Agriculture Organization (of the United Nations) in Rome
publishes data giving acreage for various crops, yields per acre, and total
production for each crop and for each country: World Crop Statistics, Area,
Production and Yield 1948-64 (1967). It is sometimes hard to tell what the data
for some countries mean. In some economies that are basically at a subsistence
level, the crops reported may be only the cash crops for export.
6. LACIE (Large area crop inventory experiment)
This program was initiated by NASA in cooperation with the Department of
Agriculture and NOAA. The objective is to demonstrate techniques for assessing
wheat production, using NASA-ERTS and NOAA satellite information plus conventional
climatological surface data. Other crops will be included later. The 1975 year
will concentrate on the U.S. Great Plains area and a few foreign areas. They may
build a data base of daily maximum and minimum temperatures, rainfall, and
planted acreage by crop districts (areas about one-tenth of a state in size).
(Information obtained February 1975.)
Section B: Air Quality Data
7. Air Quality Data
The National Aerometric Data Bank of the Environmental Protection Agency
archives various types of air quality data as obtained from various states and
cities.
See Chapter 7 section 19, atmospheric turbidity data.
8. Data from Los Angeles Reactive Pollutant Program
Data are for a variety of smog conditions during September-November 1973.
Surface and inversion layer measurements of chemical and some meteorological
parameters are included. The idea was to look at aerometric measurements within
a moving air parcel. Data will be on about six tapes at NCAR and at the National
Technical Information Service (NTIS). See Appendix 4 for more information about
NTIS.

137
Data for Assessment Studies
Section C: Census and Economic Data
9. Data at Lawrence Berkeley Laboratory (LBL)
LBL has the 1970 census, census surveys 1968-1973, census cause of death,
and the 1949-1969 census of agriculture. It has a number of data sets of economic
factors to aid in economic modeling: U.S. personal income by category and county
(1929-1970), county business patterns, census of manufacturers, 1947-1972 GNP by
industry, employment data, water use, etc. They also have data on transportation,
commodity trade flow, etc.
Their 16 December 1974 listing of data sets showed 53 data sets, which varied
in volume from 2.5 X 10³ characters to 5.3 X 10⁹ characters. Other sets are
outputs from models.
Many of LBL's data sets are from NTIS.

I

139
Chapter 20: Selected Information About Data
Sets Here and in Other Countries
1. Federal Data Centers in the United States
A directory of federally supported information analysis centers, compiled by
the National Referral Center (1974), lists 108 centers. Each is covered by about
half a page of text giving the name of the center, the staff, address and phone
number, mission, scope of operations, data holdings, and services.
2. WMO Catalog of Data for Research
The WMO published a Catalogue of Meteorological Data for Research (1972).
The listings were prepared in about 1968 in the various countries. The listings
for the United States were neither entirely up to date nor inclusive of our
total holdings in 1968.
3. ENDEX System for Data Set Information
NOAA has put information about a number of data sets into a computer data
bank. The information can be retrieved by a system called ENDEX. The ENDEX
system does not get around the need for organizations to prepare booklets
describing their data set holdings. See Appendix 4 for more information about
this service.
4. World Survey of Oceanographic Products and Methods
This survey includes descriptions of analyses and forecasts of a variety of
parameters related to the oceans, as well as the methods used in their preparation.
It gives the situation as it was in 1973, the year in which the visits to oceano-
graphic and selected meteorological centers in 13 countries were made. Most of
these visits were made by Dr. T. S. Murty of Canada; he prepared the text which
was edited by A. Wood. It should be available in mid-1975 (see Murty and Wood,
1975). Some of the items discussed are sea surface temperature products, ice
products, sea condition, water level, storm surge, surface current, subsurface
parameters, data, facsimile broadcasts, and codes.

140
Chapter 20
5. Data Sets in Canada
a. More details about the following data sets are given in the Guide to
Data Holdings (Inland Waters Directorate, Canada, 1973):
Physiographic dataStreamflow and water level (about 2450 stations)GroundwaterGlaciologyThe Great LakesWater QualitySediment
b. Cards have been punched and taped which include the following Canadian
data (contact the Atmospheric Environment Service of Canada for more
details):
Hourly surface observationsSurface synoptic data (usually only 12Z is punched)Hourly precipitation dataSummary for the climatological day and monthly summary
(some back to 1841)Rawinsonde standard level dataRawinsonde significant level dataSurface ship observationsDaily sunshineSoil temperatureEvaporationAir pollution dataAgrometeorological data
6. Information About Data Holdings in Other Countries
I will mention only three of the countries that have made listings of data
holdings:
a. England has a Catalog of Machineable Meteorological Data (BritishMeteorological Office, 1974).
b. Australia has published a booklet about its data sets (Bureau ofMeteorology, 1970).
Australia has saved numerical analyses of H, T, U, V for the sector80°E - 1700 W, 100 S - 600 S starting in 1969. The levels are 1000, 850,700, 500, 300, 250, 200, and 100 mb. Fully hemispheric analyses for thesame levels (not 250 mb) are available starting in 1971. Moistureanalyses are made through 500 mb.
c. The Philippines has a List of Meteorological Data Transferred intoComputer Usable Forms (Philippines Weather Bureau, 1973).
141
Chapter 21: Selected Aspects of
Data Set Preparation
1. Introduction
In this chapter we will discuss some of the considerations that are desirable
when preparing sets of data. We will also give some examples of the volume of
Various data sets. The volume is small enough that if the sets of conventional
data are prepared on magnetic tape, even the current level of technology makes it
relatively easy for copies of the sets to be made.
Because of a formerly poor technology for exchanging data, the assumption has
been made in world data set planning that "local data" such as rainfall data from
reasonably dense surface networks would only be used within the country of origin.
If each country or block of countries is encouraged to prepare their various data
sets in computer form, they can now be easily exchanged as necessary. Selected
derived sets of data should be prepared in order to provide support for various
climatology, energy, and agriculture studies. An example is daily average
maximum-minimum temperatures and rainfall for the various climate regions of each
country. Catalogs for the data sets are also needed.
2. Considerations Necessary in Planning Each Set of Data
In this section, we will discuss various aspects of data set planning that
should be considered.
a. Data Formats
The formats for the data sets should be chosen so that they are easy to
use, and so that they make efficient use of the storage media. For
efficiency, short logical records (reports) must be blocked together
to make larger blocks of data that are 3000-5000 characters in length.
If the short logical records are of widely variable lengths, then a
variable length blocking scheme should be used to conserve storage space.
In such a variable blocking scheme, the first characters (or bits) of
each report are used to give the length of the report. The blocks of data
(physical records) are usually best left with variable lengths and not
padded to be of equal size (as is done in some systems). Very long
logical records should be segmented so that each section is not more than
about 5000 characters in length. Some of the sets of data, such as
142
Chapter 21
satellite data and most grid point analyses, will only be available in
binary packed form; other sets can often also be more efficiently kept in
binary packed form. However, many people still are not familiar with the
methods used, and this can lead to some difficulty in sharing data.
Computer routines and concepts are, however, available which make the use
of binary data very easy on most binary machines. These comments should
not be taken to suggest binary packing for all sets, but the various trade-
offs should be considered in choosing a format. The floating-point word
structure of any one computer should generally not be used for data
exchange. When selecting a data format, several different formats should
be considered so that the relative data volume, computer time, and
complexity for each possible choice can be evaluated.
Additional information on the blocking of short reports and on the binary
packing of data is given in Jenne and Joseph (1974).
Observations of a given type should normally be in a common format in the
final data set. If data exchange between several organizations or
countries is involved, one should consider the amount of time necessary
to define common formats and the relatively small amount of time necessary
to reformat the data. For long-term programs, involving the sharing of
data between many centers, common formats can save a lot of effort and
can avoid the possibility of introducing errors during format conversion.
b. Content of Data Sets
Data sets should normally consist of one type of observational report or
of a group of such reports that are very likely to be used together.
Thus meteorological surface synoptic reports will be stored together.
Rawinsonde data will be in a set. Another set might include a combination
of all upper air observed data, which thus will include rawinsondes, air-
craft winds, winds from cloud drifts seen by satellites, etc.
c. Quality Control
Checks should be made on data sets to ensure reasonable quality. Thus
rawinsonde data can be checked for internal hydrostatic consistency.
Ship tracks can be checked for reasonable continuity so that a sudden
jump in latitude or to a different ocean area can be spotted. Checks
143
Data Set Preparation
for reasonable continuity can be made on other data. A desirable system
would be one in which an observer submitted data to a computer, and then
the computer could talk back to the observer and say, for example, "Are
you sure the reported temperature of 37.6 is correct?"
The use of a data set for the calculation of statistics or for other
scientific calculations often helps to uncover problems in the data.
d. The Need for Low Resolution Data
When data sets represent rather high-resolution information in space or
time, consideration should be given to the creation of lower resolution
data sets that are averaged by space or time. Examples are sets of
monthly mean station rainfall or rawinsonde data. If possible it is
desirable to generate such means from the computerized daily observations
to avoid manual errors of addition that may be made in the stations. Sets
of satellite-mapped data shoiuld be available on a resolution of about
200 km.
e. Separate the Low-Resolution Data
Low-resolution and high-resolution data of a particular type should
normally not be physically stored together, because the data user then
has to obtain and read a large volume of data in order to use the small
amount of low-resolution data which he needs.
f. Updating
It should be easy for customers of a data set to update their own set.
It can get very frustrating with a large data set, if one is forced to
obtain the whole set again when he only needs the last year. Thus, for
example, with time series of station data there should be some tapes
with updates of all stations for the last few weeks or months of data,
and other tapes with blocks of data for the previous one-, two-, or
three-year period.
In some data sets, such as for historical surface ship data, both old
and new ship logs are often being punched. All of the newly punched data
should be on update tapes for a specified period of time.

144
Chapter 21
g. Sort Order of Data Sets
For efficiency of data use, a number of data sets will have to be saved
in both "synoptic" sort and in time-series sort by stations. These are
needed to serve the two types of uses in which one person needs all
reports over a wide area on one day, while another needs to study ten
years of data from a station. However, the group creating a data set
should concentrate on creating the set in one or the other sort order.
The introduction of mass storage technology into major data centers and
computing centers will make it easier for them to create the other sort
order.
h. Station Library Data
Station histories for all global stations should be available. For
example with rawinsonde data, this would at least include location,
elevation, and instrument type as a function of time. In various
meetings and group discussions over the last decade, this need has been
discussed, but no one has found time to do the work. To be complete, it
would have to be an international effort. Key portions of station
histories should be available on magnetic tape; this would include the
data mentioned plus the types of observations taken at the station, cross
references between the different station numbering schemes that were used
for the station, and other information. In current station library tapes,
one should be able to distinguish between actual station changes and
errors that have been corrected. It would also help if the station
libraries distinguished between stations with good exposure and
negligible city effects (thus good benchmark stations) and stations
that are affected to differing extents.
i. Data Set Protection
The sets should be under sufficient protection that one can verify that
none of the data have been lost or altered since they were prepared.
This usually means that checksums and data volumes need to be kept with
the data sets.
145
Data Set Preparation
After data leave the central memory of a computer for storage, they\go
through many hardware and software systems before getting back into
memory. In order to guard against rare data changes in these data paths,
it is desirable that major data centers keep checksums with the data.
Secure backup copies of most data sets must also be available.
j. Inventories of the Data Set
Information about the contents of each data set should be available in a
general brief abstract and in more detail. The abstracts should be
incorporated into catalogs. Some of the more detailed inventory data
should be available on microfiche, microfilm, and often on magnetic tape.
If the inventory is itself a data set that a user can access, then he can
answer many questions for himself without spending so much time using the
consulting help in a data center.
k. Documentation
A detailed description of the format and data content of each data set
must be available. This should include information about the data volume
as well as comments on data sources and data problems. Lip service has
always been paid to the documentation of data sets, but often too little
has been done because all of us are caught in competing pressures. The
requirement needs to be faced in a reasonable way, but firmly enough to
ensure that adequate information is available. If a documentation system
is too complex and time-consuming, it will probably fail.
3. Data Volume
We will now consider the data volume in several different data sets that are
currently available. Table 21-1 also includes projected satellite data volume for
the FGGE period.
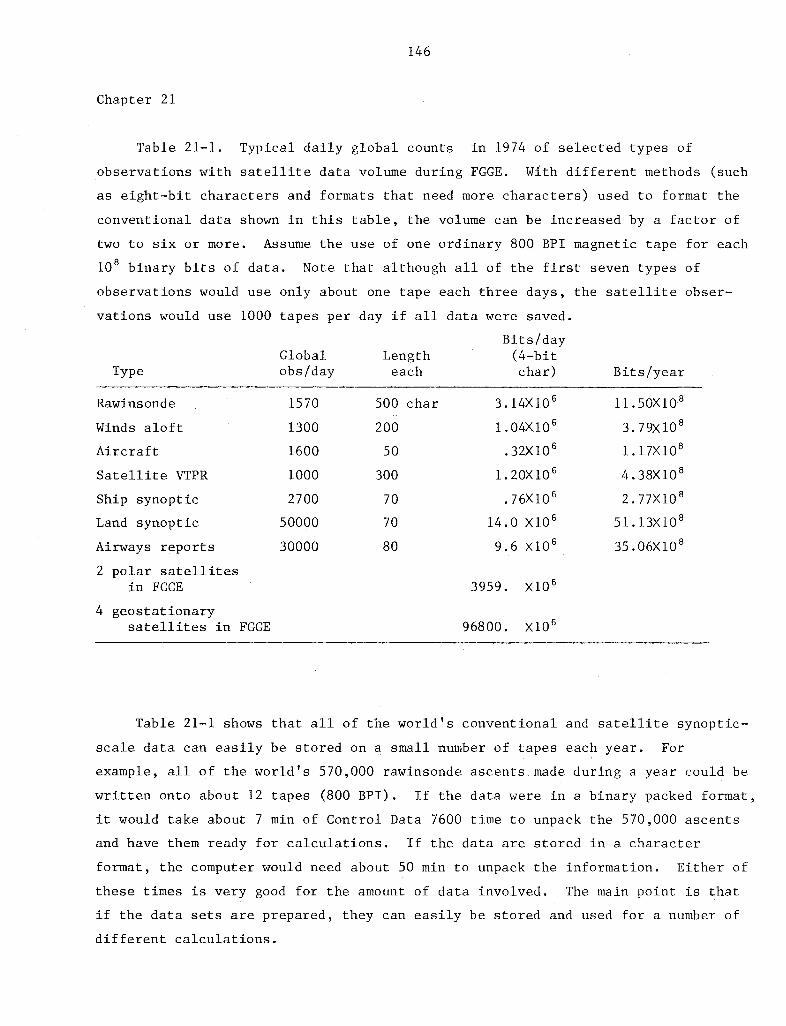
146
Chapter 21
Table 21-1. Typical daily global counts in 1974 of selected types of
observations with satellite data volume during FGGE. With different methods (such
as eight-bit characters and formats that need more characters) used to format the
conventional data shown in this table, the volume can be increased by a factor of
two to six or more. Assume the use of one ordinary 800 BPI magnetic tape for each
108 binary bits of data. Note that although all of the first seven types of
observations would use only about one tape each three days, the satellite obser-
vations would use 1000 tapes per day if all data were saved.
Bits/dayGlobal Length (4-bit
Type obs/day each char) Bits/year
Rawinsonde 1570 500 char 3.14X10 6 11.50X10⁸
Winds aloft 1300 200 1.04X10 6 3.79X10⁸
Aircraft 1600 50 .32X106 1.17X10⁸
Satellite VTPR 1000 300 1.20X10 6 4.38X10 8
Ship synoptic 2700 70 .76X10 6 2.77X10⁸
Land synoptic 50000 70 14.0 X10 6 51.13X10⁸
Airways reports 30000 80 9.6 X10 6 35.06X10⁸
2 polar satellitesin FGGE 3959. X10 6
4 geostationarysatellites in FGGE 96800. X10 6
Table 21-1 shows that all of the world's conventional and satellite synoptic-
scale data can easily be stored on a small number of tapes each year. For
example, all of the world's 570,000 rawinsonde ascents made during a year could be
written onto about 12 tapes (800 BPI). If the data were in a binary packed format,
it would take about 7 min of Control Data 7600 time to unpack the 570,000 ascents
and have them ready for calculations. If the data are stored in a character
format, the computer would need about 50 min to unpack the information. Either of
these times is very good for the amount of data involved. The main point is that
if the data sets are prepared, they can easily be stored and used for a number of
different calculations.
147
Data Set Preparation
The high volume of satellite data shown in Table 21-1 means that until better
storage technologies are available, most of the data bits will be thrown away
after pictures, mean soundings, and cloud drift winds have been derived. It also
indicates that averages of the satellite data should be prepared on a scale of
about 250 km to meet the climate goals of monitoring the heat balance. Even if all
of the high-resolution data were saved, it would clearly be impractical to process
the hundreds of trillions of bits necessary to obtain heat balance data for a few
years. For some satellite data, NESS is creating a low-resolution set of about
200 km resolution for brightness and IR data.
It may be less expensive to do the averaging using wide-angle sensors in the
spacecraft. The heat balance data should also be sampled more than once a day,
since many clouds have strong diurnal changes.
Some of the high-resolution data must also be saved for special studies.

I
149
APPENDIX I
ENVIRONMENTAL DATA SETS AT USAFETAC
(As of 31 December 1974)
This listing of data sets at the Air Force Environmental Technical Applications
Center was prepared by ETAC. These data represent major subsets of the data base
that can be used by both ETAC and NCC. See Chapter 6 for information about other
ETAC data sets. The listing in Appendix 2 presents many of these same data. Also
see Chapter 7 for further information.

DATA FA:ALY 13 - FOREIGN SFC SYN - (1,414
AREA # STNS
Russia, China, Korea 4956
Reels, 9
POR
32-71
track, 00 BPI)
..# YR-MOS
361,354
# OBS (THOUSANDS)
50,000
S. E. Asia
Europe, Br. Isles
Scandinavia
Africa
Middle East
Indonesia
Cent. & So. America
North America
Pacific Ocean & Islands
Atlantic Ocean & Islands
Indian Ocean & Islands
Philippines, Australia,Formosa, Japan & NZ
Greenland & Adjacent
TOTALS
352
1600
71
757
602
80
739
298
180
25
8
305
74
10,047
43-66
26-72
01-60
41-68
35-68
42-66
30-71
34-63
39-68
05-67
48-68
45-69
49-71
01-72
39,988
127,960
4,877
63,431
47,149
10,740
65,741
25,344
18,144
2,409
586
39,958
6,473
814,154
6,600
18,464
706
5,015
4,155
712
4,308
1,364
3,576
217
34
11,168
912
107,231
II' ,' 'II
- I]

DATA FAMILY 14 - AIRWAYS SURFACE - (1,430
AREA I# STNS
North American and U.S. 2372stations abroad
Europe 18
Middle East 19
Korea, Formosa, Japan 29
Asia 28
New Zealand & Philippines 36
DATA FAMILY 34 (Basicallysummary-of-day for the aboveTDF-14) (65 Reels)
1699
Reels 9
POR
31-74
44-70
50-59
47-69
54-64
49-69
31-74
track, 800 BPI)
# YR-MOS
226,278
1,607
1,163
2,40O
3,254
5,397
206,270
# OBS
989,741
523,149
1 ,606,068
1,732,809
1,524,797
U,-
-
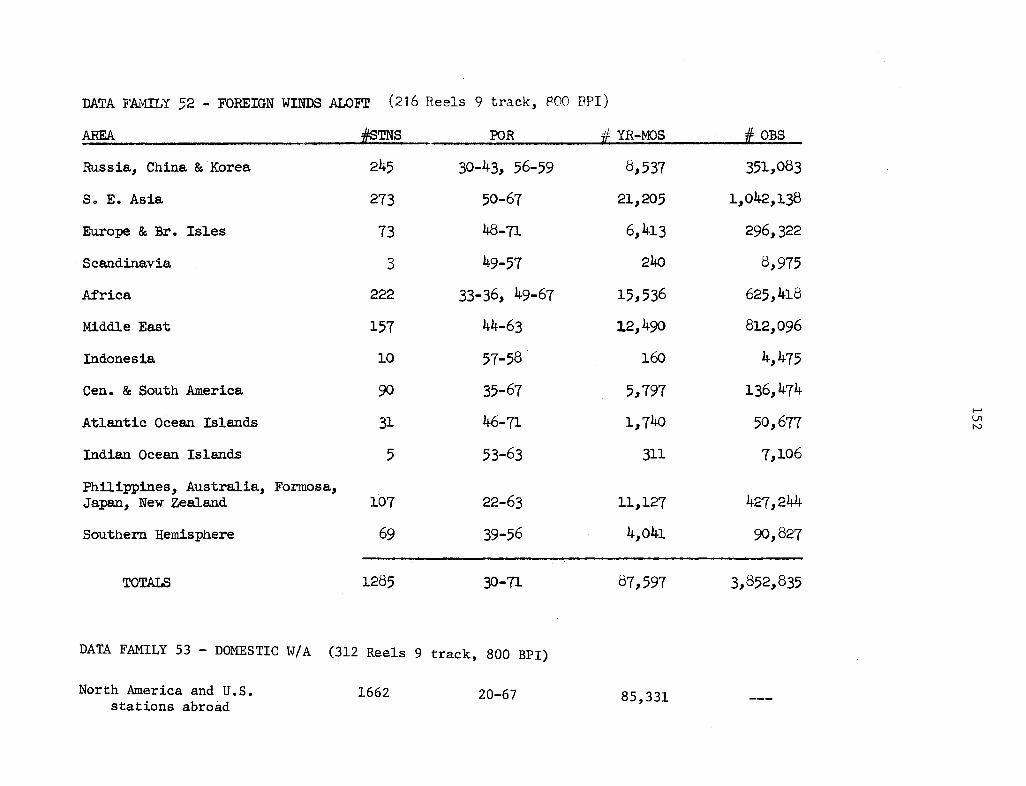
DATA FAMILY 52 - FOREIGN WINDS ALOFT (216
AREA ,STNS
Russia, China & Korea 245
So E. Asia 273
Europe & Br. Isles 73
Scandinavia 3
Africa 222
Middle East 157
Indonesia 10
Cen. & South America 90
Atlantic Ocean Islands 31
Indian Ocean Islands 5
Philippines, Australia, Formosa,Japan, New Zealand 107
Southern Hemisphere 69
TOTALS 1285
Reels 9 track, 800
FOR
30-43, 56-59
50-67
48-71
49-57
33-36, 49-67
44-63
57-58
35-67
46-71
53-63
22-63
39-56
30-71
YR-MOS
8,537
21,205
6,413
240
15,536
12,490
160
5,797
1,740
311
11,127
4,041
87,597
3OBS,
351,083
1,042,138
296,322
8,975
625,418
812,096
4,475
136,474
50,677
7,106
427,244
90,827
3,852,835
DATA FAMILY 53 - DOMESTIC W/A (312 Reels 9 track, 800 BPI)
North America and U.S. 1662 20-67 85,331stations abroad
LlNo
]
PPI)
-
_
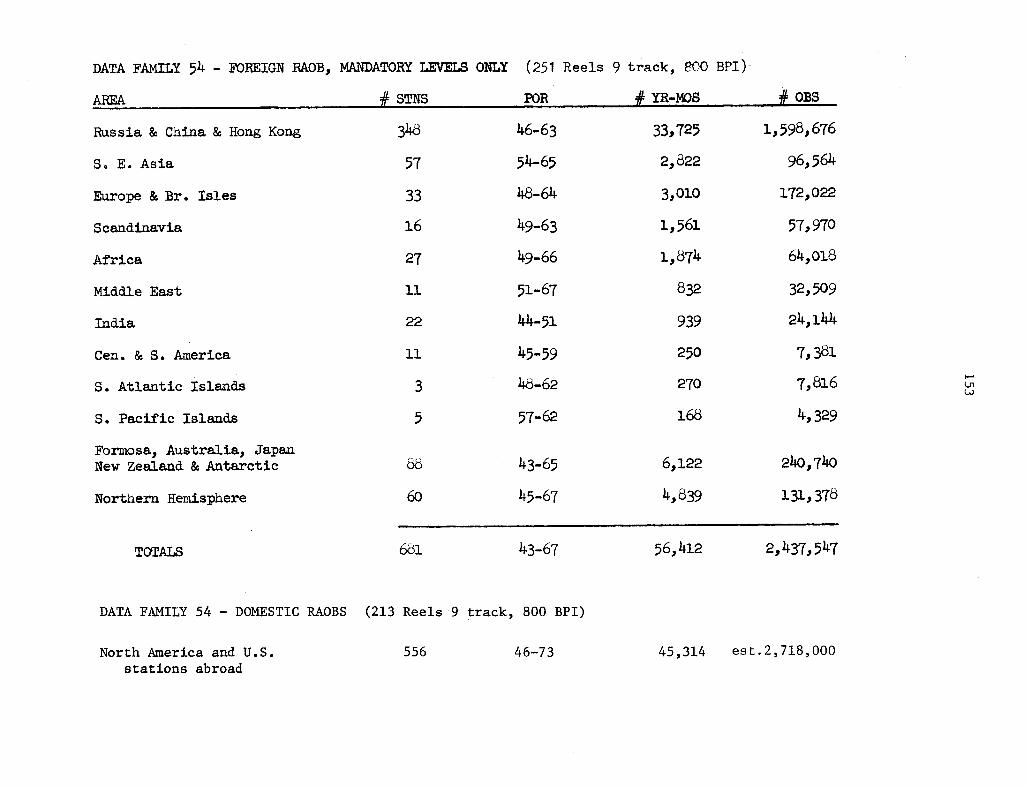
DATA FAMILY 54 - FOREIGN RAOB, MANDATORY LVELS ONLY
AREA ,# STNS
Russia & China & Hong Kong 348
So E. Asia 57
Europe & Br. Isles 33
Scandinavia 16
Africa 27
Middle East 11
India 22
Cen. & S. America 11
S. Atlantic Islands 3
S. Pacific Islands 5
Formosa, Australia, JapanNew Zealand & Antarctic
Northern Hemisphere
88
60
(251
FOR
46-63
54-65
48-64
49-63
49-66
51-67
44-51
45-59
48-62
57-62
43-65
45-67
Reels 9 track, 800 BPI)
# YR-MOS
33,725
2,822
3,010
1,561
1,874
832
939
250
270
168
6,122
4,839
# OBS
1,598,676
96,564
172,022
57,970
64,018
32,509
24,144
7,381
7,816
4,329
240,740
131,378
43-67 56,412 2,437,547
DATA FAMILY 54 - DOMESTIC RAOBS (213 Reels 9 track, 800 BPI)
556North America and U.S.stations abroad
46-73 45,314 est.2,718,000
TOTALS
-3l
UnLO
681
iiII
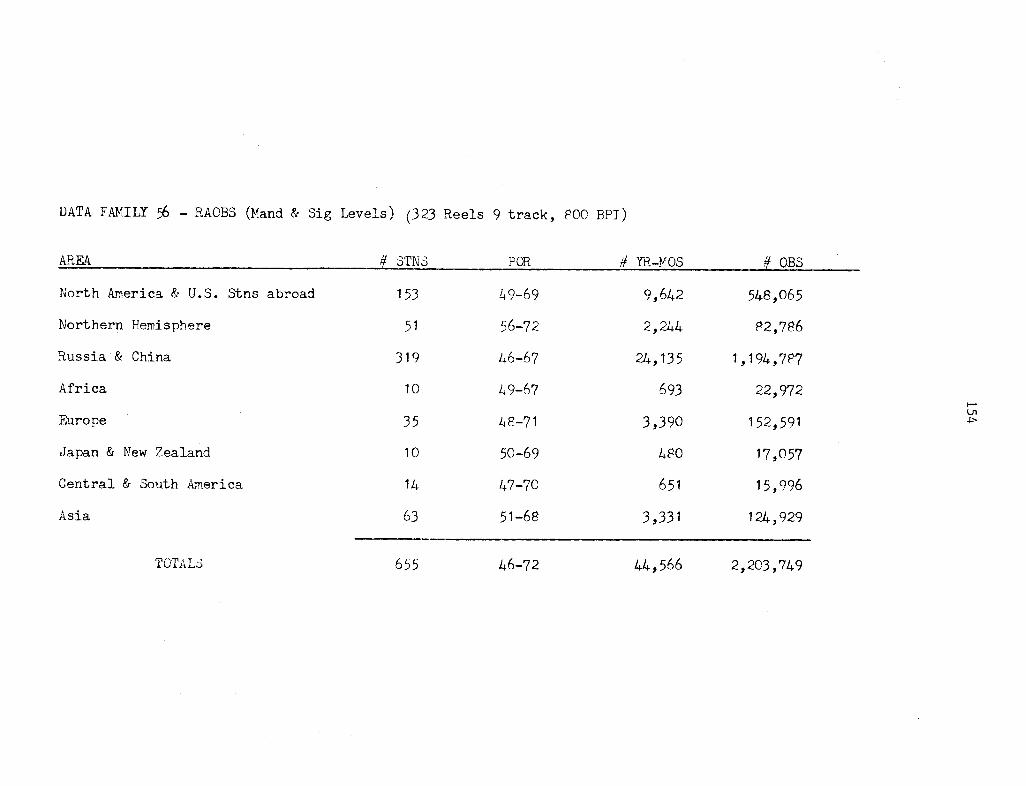
DATA FAMILY 56 - RAOBS (Mand & Sig Levels) (323 Reels 9 track, P00 BPI)
AREA
North America & U.S. Stns abroad
Northern Hemisphere
Russia & China
Africa
Europe
Japan & New Zealand
Central & South America
Asia
655 46-72 44,566
1STN
153
51
319
10
35
10
14
63
POR
49-69
56-72
46-67
49-67
48-71
50-69
47-70
51-68
# YR-YOS
9,642
2,244
24, 135
693
3,390
4P0
651
3,331
# OBS
548,065
82,786
1,194,787
22,972
152,591
17,057
15,996
124,929
I-U
--__ ___ ___ _ _ _ __ ___ _______ ____ _
__._ � I __ I __
TOTALS 2,203,749
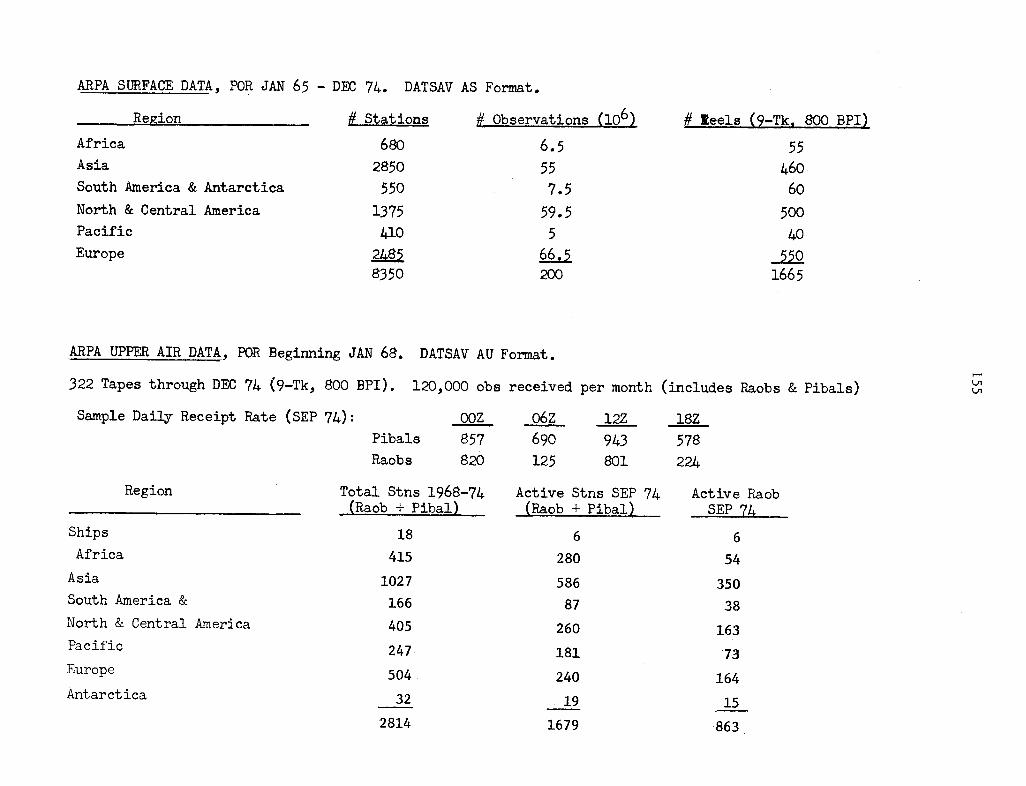
ARPA SURFACE DATA, POR JAN 65 - DEC 74. DATSAV AS Format.
Africa
Asia
South America & Antarctica
North & Central America
Pacific
Europe
# Stations
680
2850
550
1375410
28858350
# Observations (106)
6.5
557.5
59.55
66.5200
# Reels (9-Tk. 800 BPI)
55460
60
500
40
5501665
ARPA UPPER AIR DATA, POR Beginning JAN 68. DATSAV AU Format.
322 Tapes through DEC 74 (9-Tk, 800 BPI). 120,000 obs received per month (includes Raobs & Pibals)
Sample Daily Receipt Rate (SEP 74): 00Z 06Z 12Z 18ZPibals
Raobs857820
690125
943801
578224
Region
Ships
Africa
Asia
South America &
North & Central America
Pacific
Europe
Antarctica
Total Stns 1968-74(Raob + Pibal)
18
415
1027
166
405
247
504
32
2814
Active Stns SEP 74(Raob + Pibal)
6
280
586
87
260
181
240
19
1679
Active RaobSEP 74
6
54
350
38
163
73
164
15
863
UILnLn

I
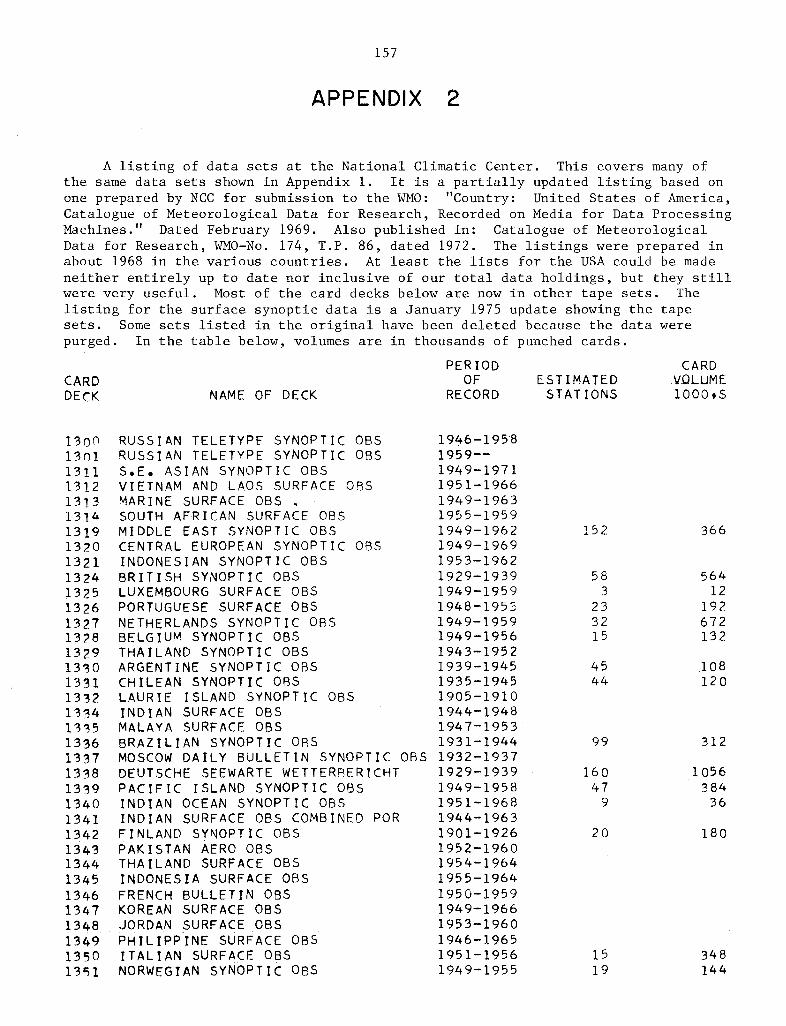
157
APPENDIX 2
A listing of data sets at the National Climatic Center. This covers many ofthe same data sets shown in Appendix 1. It is a partially updated listing based onone prepared by NCC for submission to the WMO: "Country: United States of America,Catalogue of Meteorological Data for Research, Recorded on Media for Data ProcessingMachines." Dated February 1969. Also published in: Catalogue of MeteorologicalData for Research, WMO-No. 174, T.P. 86, dated 1972. The listings were prepared inabout 1968 in the various countries. At least the lists for the USA could be madeneither entirely up to date nor inclusive of our total data holdings, but they stillwere very useful. Most of the card decks below are now in other tape sets. Thelisting for the surface synoptic data is a January 1975 update showing the tapesets. Some sets listed in the original have been deleted because the data werepurged. In the table below, volumes are in thousands of punched cards.
PERIODOF
NAME OF DECK RECORDESTIMATEDSTATIONS
RUSSIAN TELETYPE SYNOPTIC OBSRUSSIAN TELETYPE SYNOPTIC OBSS.E. ASIAN SYNOPTIC OBSVIETNAM AND LAOS SURFACE OBSMARINE SURFACE OBSSOUTH AFRICAN SURFACE OBSMIDDLE EAST SYNOPTIC OBSCENTRAL EUROPEAN SYNOPTIC OBSINDONESIAN SYNOPTIC OBSBRITISH SYNOPTIC OBSLUXEMBOURG SURFACE OBSPORTUGUESE SURFACE OBSNETHERLANDS SYNOPTIC OBSBELGIUM SYNOPTIC OBSTHAILAND SYNOPTIC OBSARGENTINE SYNOPTIC OBSCHILEAN SYNOPTIC OBSLAURIE ISLAND SYNOPTIC OBSINDIAN SURFACE OBSMALAYA SURFACE OBSBRAZILIAN SYNOPTIC OBSMOSCOW DAILY BULLETIN SYNOPTIC OBSDEUTSCHE SEEWARTE WETTERBERICHTPACIFIC ISLAND SYNOPTIC OBSINDIAN OCEAN SYNOPTIC OBSINDIAN SURFACE OBS COMBINED PORFINLAND SYNOPTIC OBSPAKISTAN AERO OBSTHAILAND SURFACE OBSINDONESIA SURFACE OBSFRENCH BULLETIN OBSKOREAN SURFACE OBSJORDAN SURFACE OBSPHILIPPINE SURFACE OBSITALIAN SURFACE OBSNORWEGIAN SYNOPTIC OBS
1946-195'81959--1949-19711951-19661949-19631955-19591949-19621949-19691953-19621929-19391949-19591948-19531949-19591949-19561943-19521939-19451935-19451905-19101944-19481947-19531931-19441932-19371929-19391949-19581951-19681944-19631901-19261952-19601954-19641955-19641950-19591949-19661953-19601946-19651951-19561949-1955
CARDDECK
CARDVOLUME1000,S
152 366
130013011311131213131314131913201321132413251326132713281329133013311332133413351336133713381339134013411342134313441345134613471348134913501351
583
233215
56412
192672132
4544
99
108120
312
105638436
160479
20
1519
180
348144
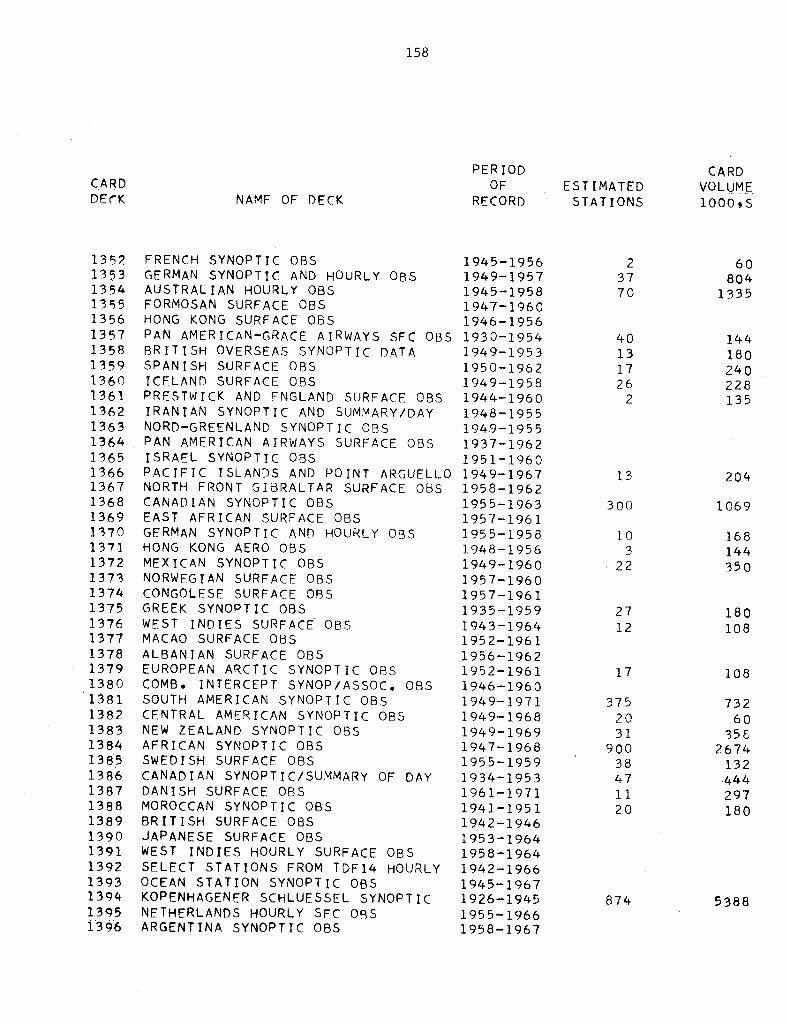
158
PERIODOF
NAME OF DECK RECORDESTIMATEDSTATIONS
FRENCH SYNOPTIC OBSGERMAN SYNOPTIC AND HOURLY OBSAUSTRALIAN HOURLY OBSFORMOSAN SURFACE OBSHONG KONG SURFACE OBSPAN AMERICAN-GRACE AIRWAYS SFC OBSBRITISH OVERSEAS SYNOPTIC DATASPANISH SURFACE OBSICELAND SURFACE OBSPRESTWICK AND ENGLAND SURFACE OBSIRANIAN SYNOPTIC AND SUMMARY/DAYNORD-GREENLAND SYNOPTIC OBSPAN AMERICAN AIRWAYS SURFACE OBSISRAEL SYNOPTIC OBSPACIFIC ISLANDS AND POINT ARGUELLONORTH FRONT GIBRALTAR SURFACE OBSCANADIAN SYNOPTIC OBSEAST AFRICAN SURFACE OBSGERMAN SYNOPTIC AND HOURLY OBSHONG KONG AERO OBSMEXICAN SYNOPTIC OBSNORWEGIAN SURFACE OBSCONGOLESE SURFACE OBSGREEK SYNOPTIC OBSWEST INDIES SURFACE OBSMACAO SURFACE OBSALBANIAN SURFACE OBSEUROPEAN ARCTIC SYNOPTIC OBSCOMB. INTERCEPT SYNOP/ASSOC, OBSSOUTH AMERICAN SYNOPTIC OBSCENTRAL AMERICAN SYNOPTIC OBSNEW ZEALAND SYNOPTIC OBSAFRICAN SYNOPTIC OBSSWEDISH SURFACE OBSCANADIAN SYNOPTIC/SUMMARY OF DAYDANISH SURFACE OBSMOROCCAN SYNOPTIC OBSBRITISH SURFACE OBSJAPANESE SURFACE OBSWEST INDIES HOURLY SURFACE OBSSELECT STATIONS FROM TDF14 HOURLYOCEAN STATION SYNOPTIC OBSKOPENHAGENER SCHLUESSEL SYNOPTICNETHERLANDS HOURLY SFC OBSARGENTINA SYNOPTIC OBS
1945-19561949-19571945-19581947-19601946-19561930-19541949-19531950-19621949-19581944-19601948-19551949-19551937-19621951-19601949-19671958-19621955-19631957- 196 11955-19581948-19561949-19601957-19601957-19611935-19591943-19641952-19611956-19621952-19611946-19601949-19711949-19681949-19691947-19681955-19591934-19531961-19711941-19511942-19461953-19641958-19641942-19661945-19671926-19451955-19661958-1967
CARDDECK
CARDVOLUME1000,S
23770
60804
1335
40131726
2
144180240228135
135213531354135513561357135813591360136113621363136413651366136713681369137013711372137313741375137613771378137913801381138213831384138513861387138813891390139113921393139413951396
13
300
204
1069
103
22
168144350
2712
180108
17 108
3752031
90038471120
73260
3562674132444297180
874 5388
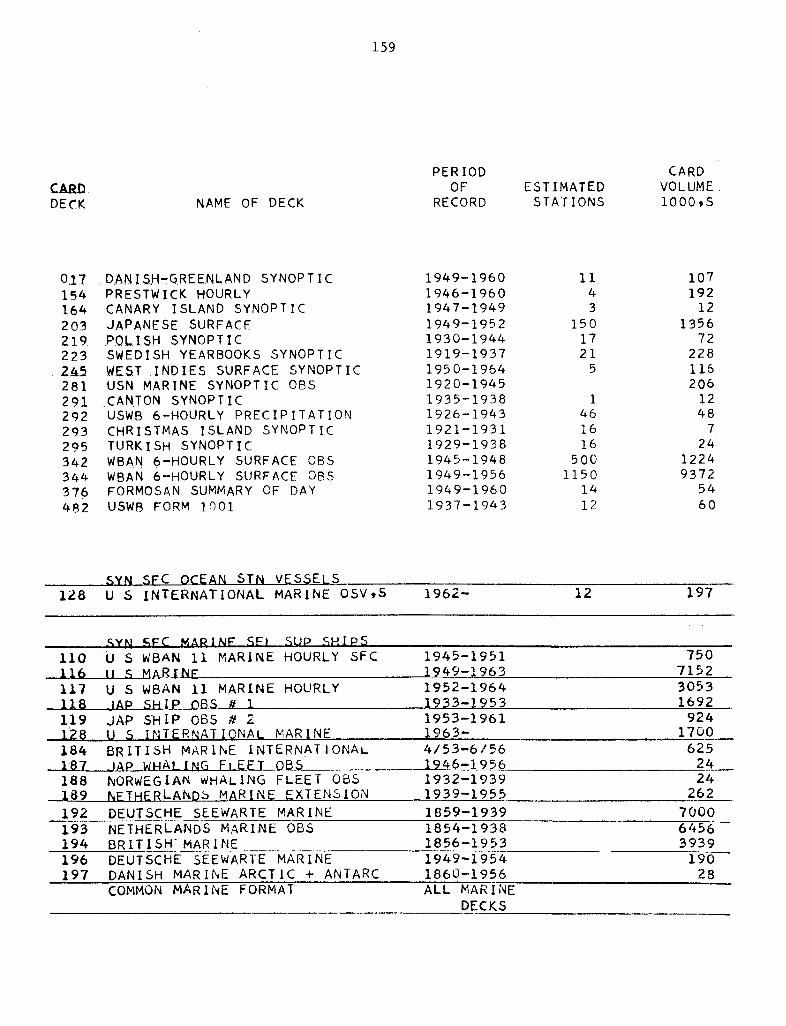
159
PERIODOF
NAME OF DECK RECORDESTIMATEDSTATIONS
DANI.SH-GREENLAND SYNOP T I CPRESTWICK HOURLYCANARY ISLAND SYNOPTICJAPANESE SURFACEPOLI.SH SYNOPTICSWEDISH YEARBOOKS SYNOPTICWE.ST .INDIES SURFACE SYNOPTICUSN MARINE SYNOPTIC OBSCANTON SYNOPTICUSWB 6-HOURLY PRECIPITATIONCHRISTMAS ISLAND SYNOPTICTURKISH SYNOPTICWBAN 6-HOURLY SURFACE OBSWBAN 6-HOURLY SURFACE OBSFORMOSAN SUMMARY OF DAYUSWB FORM 1001
1949-19601946-19601947-19491949-19521930-19441919-19371950-19641920-19451935-19381926-19431921-19311929-19381945-19481949-19561949-19601937-1943
SYN SFC OCEAN STN VESSELS128 U S INTERNATIONAL MARINE OSV,S 1962- 12 197
,YN SFC MARINF .FI SP S SHIPS110 U S WBAN 11 MARINE HOURLY SFC 1945-1951 750116 .l -$ MARINF 1949-1963 7152117 U S WBAN 11 MARINE HOURLY 1952-1964 3053118 JIAP SHIP OBS # ] _ 1933-1953 1692119 JAP SHIP 08S # 2 1953-1961 924128 U S INTERNATIONAL MARINE 1963- , 1700
BRITISH MARINE INTERNAT-IONALJAP WHALING Fi EEE OBSNORWEGIAN WHALING FLEET 08SNETHERLANDS MARINE EXTENSIONDEUTSCHE SEEWARTE MARINENETHERLANDS MARINE OBSBRITISH- MARINEDEUTSCHE SEEWARTE MARINEDANISH MARINE ARCTIC + ANTARCCOMMON MARINE FORMAT
4/53-6/561946-19561932-19391939-1955
1859-19391854-19381856-19531949-19541860-1956ALL MARINE
DECKS
6252424
262700064563939
19028
CARDDECK
CARDVOL UME1000,S
0171541642032192232.A5281291292293295342344376482
1143
1501721
5
107192
121356
72228116206
1248
724
12249372
5460
1461616
5001150
1412
18418 7188_189
192193194196197
---
r-
--
-----
,- .._,.!.i1
- I--~-�-I- ---- --
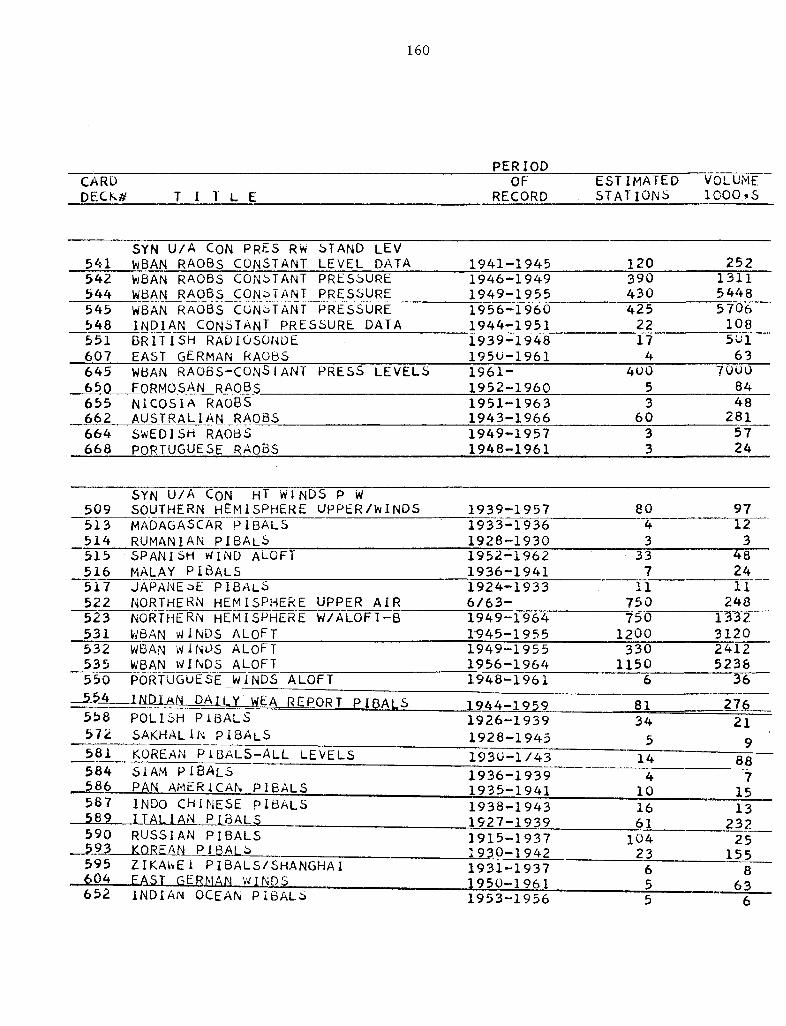
160
PERIOD _CARL OF ESTIMATED VOLUMEDECK# T I I L E RECORD STATION 1000,S
SYN U/A CON PRES Rw STAND LEV541 WBAN RAOBS CONSTANT LEVEL DATA542 WBAN RAOBS CONSTANT PRESSURE544 WBAN RAOBS CONSTANT PRESSURE545 WBAN RAOBS CUONTANT PRESSURE548 INDIAN CONSTANT PRESSURE DATA551 BRITISH RADIOSONDE607 EAST GERMAN RAO6S645 WBAN RAOBS-CONSTANT PRESS LEVELS650 FORMOSAN RAQBS655 NICOSIA RAOBS662 AUSTRALIAN RAOBS664 SwEDISH RAOBS668 PORTUGUESE RAOBS
1941-19451946-19491949-19551956-19601944-19511939-1948195U-19611961-1952-19601951-19631943-19661949-19571948-1961
SYN U/A CON HT WINDS P W509 SOUTHERN HEMISPHERE UPPER/WINDS 1939-1957513 MADAGASCAR PIBALS 1933-1936514 RUMANIAN PIBALS 1928-1930515 SPANISH WIND ALOFT 1952-1962516 MALAY PI6ALS 1936-19415i7 JAPANEoE PIBALS 1924-1933522 NORTHERN HEMISPHERE UPPER AIR 6/63-523 NORTHERN HEMISPHERE W/ALOFT-B 1949-1964531 WBAN WINDS ALOFT 1945-1955532 WBAN WINDS ALOFT 1949-1955535 WBAN WINDS ALOFT 1956-1964550 PORTUGUESE WINDS ALOFT 1948-1961
_5_A4 NDIAN DAILY WEA REPORT PIBALS 1.4.-1QosQPOLISH PIBALSSAKHALIN PIBALS
KOREAN PIBALS-ALL LEVELSSIAM PIBALSPAN AMERICAN PIBALS_INDO CHINESE PIBALSITALIAN PIBALi$RUSSIAN PIBALSKOREAN PlIBAL SZIKAWEI PIBALS/SHANGHAIEAST GERMAN WINDS..INDIAN OCEAN PIBALS
1926-19391928-1945
193U-1 /431936-19391935-19411938-19431927-19391915-19371930-19421931-19371950-1 9611953-1956
80 974 123 3
33 487 24
11 11750 248750 1332
1200 3120330 2412
1150 52366 36
81 27634 21
5 914 88
4 710 1516,F 1
104_ 0s
131') lln
25, m- _
Zj 1356P!
8p 0%
5 6
120390430425
2217
44uO
53
6033
252131154485706
1085U1
637000
8448
2815724
558572
5815845865875895905i93
595604652
- --_ _
----I
.
_--
�,,IIi
�-.
-- '' --I -- __l
-
.... I
-
L
-
.- i..
--II , _ _,. .
- ---~Di- Z.:)I--
5 63--

161
--PERIODCARD OF ESTIMATED VOLUMEnFC_ T T L E RECORD STAT IONS 1000,S_
653 SELECTED FOREIGN WINDS ALOF1 1949-1962 20 41659 GREEK PibALS 1949-1959 9 36665 AUSTRALIAN wINDS ALOFT 1943-1956 100 590666 BELGIAN WINDS ALOFT 1949-1956 10 18
_673_ YUGOSLOVIA P BALS 1955-1959 11 60677 AFRICAN WINDS ALOFT 1953-1963 46 144685 CANADIAN WINDS ALOFT 1955-1967 75 916
SYN U/A CON PRES MAND LEV_526 SPAN!SH RAOBS 8f.../52-1961__ 5 24
SYN U/A CON PRES MAND, SIG LV524 NORTHERN HEMISPHERE RA)IOSONDE-C 1949-1959 750 3420525 NORTHERN HEMISPHERE RADIOSONDE-C 1960- 546 2839
_648 RAOBSMANDAT'ORY-SIG LEV SCHERHAG 1954-1962 34 -1-500
SYN U/A SIG LEV505 RAO SIGNIFICANT LEVEL_ 1948- 260 15000510 WORLD-wIDE RADIOSONDE 1943- 101 4518606 RAOB ALL SIG LEVELS 9.1945-1963 _75 5172
AERO OBS MET STA038 NORWEGIAN HOURLY SFC 1957-1960 8 280048 NORWEGIAN HOURLY SURFACE 1951-1956 7 216132. CANA-DAN HOURLY SFC ,,1946-1951_ .... 6 ... 168134 CANADIAN HOURLY SURFACE 1951-1953 7 132135 CANADIAN HOURLY SURFACE 1950-1967 36 2456141 USAF HOURLY SFC 1937-1945 1080 17976A142 WlBAN HOURI Y SFC-_ 1945-1948 500 860144 WBAN HOURLY SFC OB 1948- 1800 940001_53 . CANADI AN AIRAYS SFC I, · 1942-1949 1_S156 BRITISH HOURLY OBS 1941-1948 12 300157 TURKISH H OU RLY i 1950-1959 19 540158 GERMAN HOURLY OBS GZMO 1955-1961 3 204158 GERMAN. HOU.RLY OBS GZMO 1962- 3 52159 KOREAN HOURLY 06S ROK 1954-1964 18 117615_9 KOREAN HOURLY OBS ROK_ _ __965-__ I18 _151176 FORMOSAN SURFACE 1949-1965 17 412
OBSERVATlnNS FROM AIRCRAFT567 AWS RECON FLIGHTS 1947-19575 _ WFATHE R RFCON Ft IGHTS_ 152-1955 432570 PTARMIGAN RECON ARCTIC 1947-1952

162
PERIODCARD OF ESTIMATED VOLUME__DEC__K T I f .L E _ RECORD STATIONS 1OOS
cL1s IM TNS__SUM_ OF DAY166 IRANIAN oYNO-PTlC/SUM OF DAY 1948-1955 16 252_202 .JAPANESE SFC SUM OF DAY 1939-1945 41 300334 CANADIAN SUMMARY OF DAY 1942-1958 4 10335 CANADIAN ARCI C $TNo. SUM OF DAY 1955-1967 4 36357 TURKISH oUMMARY OF DAY 1950-1955 19 36358 GERMAN ZMO SUMMARY OF DAY 1951- 3 17359 KOREAN SUMMARY OF DAY ROK 1954- 18 61394 NEI 24-HR PRECIPITATION AMOUNT 1901-1916 27 121401 JAPANESE SUMMA-RY OF DAY 1896-1936 43 156403 JAPANESE SUMMARY OF DAY 1949-1952 150 160410 DENMARK-GREENLAND SUMMARY 1906-1937 19 72461 PHILIPPINE SUM OF DAY 1929-1938 10 37462 PHILIPPINE SUM OF DAY 2 1907-1916 16 37481 USWB MAX MIN TEMPERATURE 1898-1943 13 144
S CLIM STNo SUM OF DAY US WBAN341 USAF FORM 94] SUM OF DAY 1937-1945 900 766343 WBAN SUMMARY OF DAY 1945-1948 300 331345 WBAN SUMMARY OF DAY 1949- 2100 5500
CLIM STNS SUM OF DAY AND MONTH318 GERMAN SUM OF DAY AND MONIH 1879-1960 73 830
SOLAR RADIATION OR SUNSHINE280 USwB HOURLY oOLAR RADIATION 1951- 50 1908470 HOURLY SOLAR RADIATION AND ILLUM 1928-1952 44 372480 USWB SOLAR RADIATION SUM OF DAY 1951- 145 444
PRECIPITATION HOURLY488 HOURLY PRECIPITATION 1947- 2800 11964
4.86 USWB FORM 1009 1948-6/66 12000 84000486 USWd FORM 1009 7/66 12000
SOIL TEMPERATURE047 GERMAN SOIL TEMPERATURE 1951-1961 39 144
TIROS INFRARED 2 THRU 7
METEORLOGICAL TOWER DATA700 CEDAR HILL MICRO-MET 1960-1962 1 250701 ATMOSPHERIC ELECTRICITY 1957-1963 7 116705 AF MICROMET 10VER DATA 1963-1967 1 40

163
PERIODOFCARD EST IMATLD
_- _ ._-r _ . . r-VOL UMI _s - I
DLCK/F T I L E RECORD STA11ONN 1000.5
FREEZE DATA948 FREEZE DATA 1931- 5800 19
999 NORTH AMER OZONE 1963-1967 8
450 SOLAR bEOPHYoICAL DATA 1965- 5 20
DERIVED DATA
HISTORICAL SFC AND UPPER AIRSPACE ARRAYS OF DATA
621 COORDINATE PREoS DATA sURFACE 1899-1939 1066631 NORTH HEM EXT FORECAST-DETAIL 1948-1963 3108
633 PROJECI 433-L bRID DATA 1955-1960 948
AREA MEAN OR NORMALS475 DIVISION'L TEMP + PRECIP NORMALS 1931-1966 150 27
MONTHLY MEAN 700MB AND SFC EXFD 1947-1965
CHRONOLOGICAL ARRAY OF DATA
SFC STA CLIM ARRAYS OF NORMAL465 DAILY TEMPERATURES NURMALz 1931-1960 150 318490 30 YEAR NORMALS 1931-1960 3656 20
985 EXCESSIVE PRECIP. AMOUNTS 1962 2800
_ QSFC STA CLIM MONTHLY MEAN _
720 A-CDNS MONTHLY SURFACE METRIC 1961- 400 43720 CDNS MONTHLY SURFACE ENGLISH 1961- 400 43932 USWB MONTHLY 1009 MEANS 1891-1966 12000 3500
U/A CLIM MONTHLY MEAN R, RW722 WORLD CLIMAT DATA-RAOB 1951- 400 84_933 USWd RADIOSONDE SUMMARY 1946- 350 924
-_. T.IME AND SPA.CE .RA ..-.--.. ... " -- ------------623 NORTHERN HEM PRESS CNTR I RACK627 _NQR THERN HEM STORM INTENSITY988 N ATLANTIC TROPICAL CYCLONES
l 89v-1931924-19381886-
3612
_ _ _ _ _ . - - - I _ - , II I r-

I
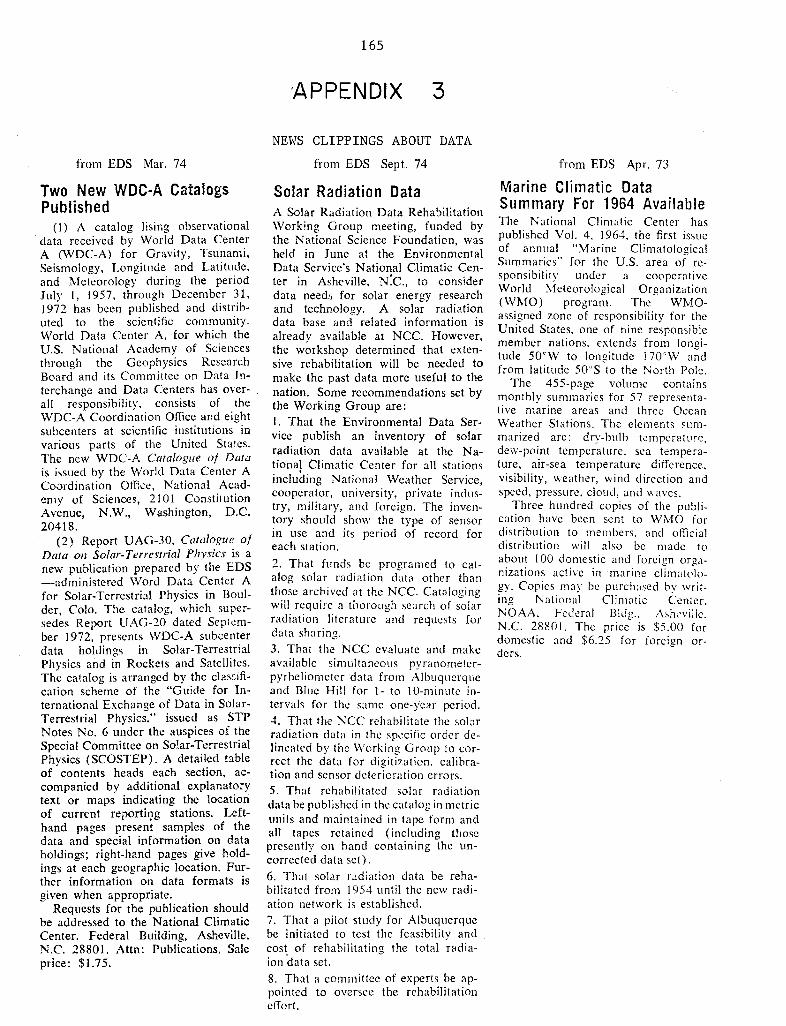
165
APPENDIX
from EDS Mar. 74
Two New WDC-A CatalogsPublished
(1) A catalog lising observationaldata received by World Data CenterA (WDC-A) for Gravity, Tsunami,Seismology, Longitude and Latitude,and Meteorology during the periodJuly 1, 1957, through December 31,1972 has been published and distrib-uted to the scientific community.World Data Center A, for which theU.S. National Academy of Sciencesthrough the Geophysics ResearchBoard and its Committee on Data In-terchange and Data Centers has over-all responsibility, consists of theWDC-A Coordination Office and eightsubcenters at scientific institutions invarious parts of the United States.The new WDC-A Catalogue of Datais issued by the World Data Center ACoordination Office, National Acad-emy of Sciences, 2101 ConstitutionAvenue, N.W., Washington, D.C.20418.
(2) Report UAG-30, Catalogue ofData on Solar-Terrestrial Physics is anew publication prepared by the EDS-administered Word Data Center Afor Solar-Terrestrial Physics in Boul-der, Colo. The catalog, which super-sedes Report UAG-20 dated Septem-ber 1972, presents WDC-A subcenterdata holdings in Solar-TerrestrialPhysics and in Rockets and Satellites.The catalog is arranged by the classifi-cation scheme of the "Guide for In-ternational Exchange of Data in Solar-Terrestrial Physics." issued as STPNotes No. 6 under the auspices of theSpecial Committee on Solar-TerrestrialPhysics (SCOSTEP). A detailed tableof contents heads each section, ac-companied by additional explanatorytext or maps indicating the locationof current reporting stations. Left-hand pages present samples of thedata and special information on dataholdings; right-hand pages give hold-ings at each geographic location. Fur-ther information on data formats isgiven when appropriate.
Requests for the publication shouldbe addressed to the National ClimaticCenter, Federal Building, Asheville,N.C. 28801. Attn: Publications. Saleprice: $1.75.
NEWS CLIPPINGS ABOUT DATA
from EDS Sept. 74
Solar Radiation DataA Solar Radiation Data RehabilitationWorking Group meeting, funded bythe National Science Foundation, washeld in June at the EnvironmentalData Service's National Climatic Cen-ter in Asheville, N.C., to considerdata needs for solar energy researchand technology. A solar radiationdata base and related information isalready available at NCC. However,the workshop determined that exten-sive rehabilitation will be needed tomake the past data more useful to thenation. Some recommendations set bythe Working Group are:1. That the Environmental Data Ser-vice publish an inventory of solarradiation data available at the Na-tional Climatic Center for all stationsincluding National Weather Service,cooperator, university, private indus-try, military, and foreign. The inven-tory should show the type of sensorin use and its period of record foreach station.
2. That funds be programed to cat-alog solar radiation data other thanthose archived at the NCC. Catalogingwill require a thorough search of solarradiation lilerature and requests fordata sharing.3. That the NCC evaluate and makeavailable simultaneous pyranometer-pyrheliometer data from Albuquerqueand Blue Hill for 1- to 10-minute in-tervals for the same one-year period.4. That the NCC rehabilitate the solarradiation data in the specific order de-lineated by the Working Group to cor-rect the data for digitization. calibra-tion and sensor deterioration errors.5. That rehabilitated solar radiationdata be published in the catalog in metricunits and maintained in tape form andall tapes retained (including thosepresently on hand containing the un-corrected data set).6. That solar radiation data be reha-bilitated from 1954 until the new radi-ation network is established.7. That a pilot study for Albuquerquebe initiated to test the feasibility andcost of rehabilitating the total radia-ion data set.
8. That a committee of experts be ap-pointed to oversee the rehabilitationeffort.
from EDS Apr. 73
Marine Climatic DataSummary For 1964 AvailableThe National Climatic Center haspublished Vol. 4. 1964, the first issueof annual "Marine ClimatologicalSummaries" for the U.S. area of re-sponsibilitv under a cooperativeWorld Meteorological Organization(WMO) program. The WMO-assigned zone of responsibility for theUnited States, one of nine responsiblemember nations, extends from longi-tude 50'W to longitude 170'W andfrom latitude 50°S to the North Pole.
The 455-page volume containsmonthly summaries for 57 representa-tive marine areas and three OceanWeather Stations. The elements sum-marized are: dry-bulb temperature,dew-point temperature. sea tempera-ture, air-sea temperature difference,visibility, weather, wind direction andspeed, pressure, cloud, and waves.
Three hundred copies of the publi-cation have been sent to WMO fordistribution to members, and officialdistribution will also be made toabout 100 domestic and foreign orga-nizations active in marine climatolo-gy. Copies may be purchased by writ-ing National Climatic Center,NOAA, Federal Bldg., Ashevillc.N.C. 28801. ]-he price is $5.00 fordomestic and $6.25 for foreign or-ders.
3
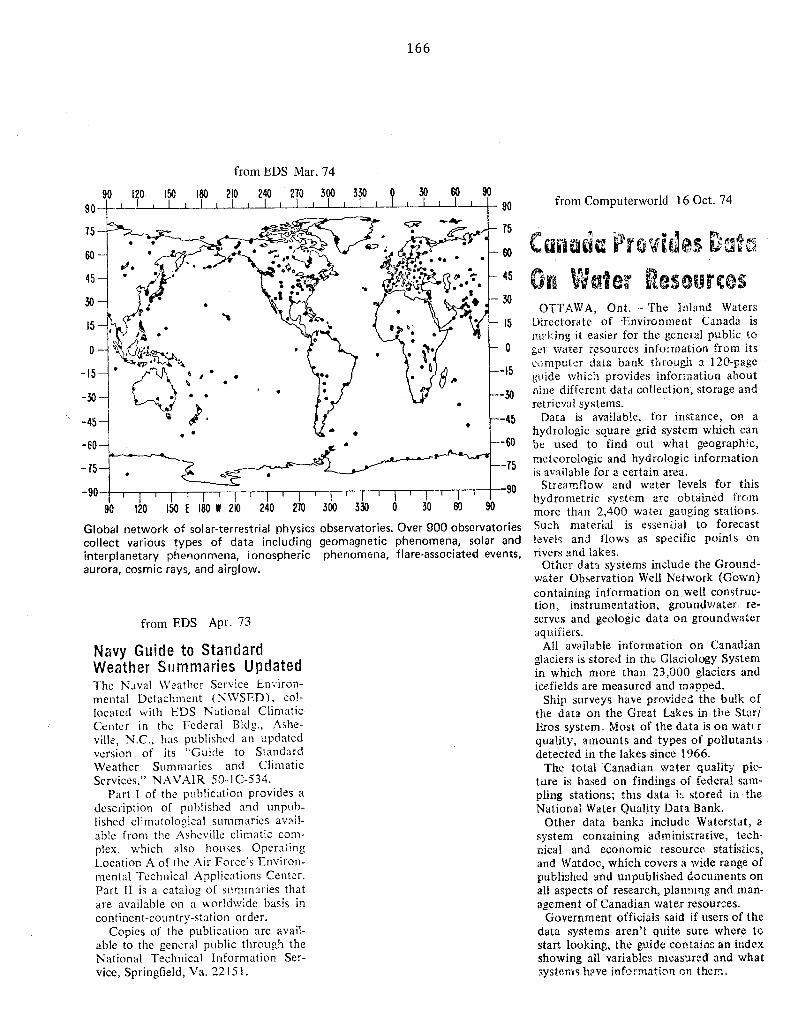
166
from EDS Mar. 74
15
-0
-15
Global network of solar-terrestrial physics observatories. Over 900 observatoriescollect various types of data including geomagnetic phenomena, solar andinterplanetary phenonmena, ionospheric phenomena, flare-associated events,aurora, cosmic rays, and airglow.
from EDS Apr. 73
Navy Guide to StandardWeather Summaries UpdatedThe Naval Weather Service Environ-mental Detachment (NWSED), co!-located with EDS National ClimaticCenter in the Federal Bldg., Ashe-ville, N.C., has published an updatedversion of its 'Guide to StandardWeather Summaries and ClimaticServices," NAVAIR 50..1C-534.
Part I of the publication provides adescription of published and unpub-lished climatological summaries avail-able from the Asheville climatic com-plex. which also houses OperatingLocation A of the Air Force's Environ-mental Technical Applications Center.Part II is a catalog of summaries thatare available on a worldwide basis incontinent-country-station order.
Copies of the publication are avail-able to the general public through theNational Technical Information Ser-vice, Springfield, Va. 22151.
90 from Computerworld 16 Oct. 74
0 cijid7 PPrvvides D
45 ff eater esoIJrcesM. 30
OTTAWA, Ont. -- The Inland WatersDirectorate of -Environment Canada ism.t..king it easier for the general public toget water resources information from itscomputer data bank thro.ugh a 120-pageguide which provides information aboutrane different data collection, storage andretrieval systems.
Data is available, for instance, on ahydrologic square grid system which canbe used to find out what geographic,meteorologic and hydrologic informationis available for a certain area.
Streamnflow and water levels for thishydrometric system are obtained frommore than 2,400 water gauging stations.Such material is essential to forecastlevels and flows as specific points onrivers and lakes.
Other data systems include the Ground-water Observation Well Network (Gown)containing information on.well construc-tion, instrumentation, groundwater re-serves and geologic data on groundwateraquifiers.
All available information on Canadianglaciers is stored in the Glaciology Systemin which more than 23,000 glaciers andicefields are measured and mapped.
Ship surveys have provided the bulk ofthe data on the Great Lakes in the Star/Eros system. Most of the data is on watcrquality, amounts and types of pollutantsdetected in the lakes since 1966.
The total 'Canadian water quality pic-ture is based on findings of federal sam-pling stations; this data is stored ir- theNational Water Quality Data Bank.
Other data banks include Waterstat, asystem containing administrative, tech-nical and economic resource statistics,and Watdoc, which covers a wide range ofpublished and unpublished documents onall aspects of research, planning and man-agement of Canadian water resources.
Government officials said if users of thedata systems aren't quite sure where tostart looking, the guide contains an indexshowing all variables measured and whatsystems have information on them.
167
from EDS Nov. 74
Ocean Data Resources SurveyEDS has prepared a 135-page reporton "Ocean Data Resources" in re-sponse to a request from the NationalOcean Policy Study Committee of theU.S. Senate to the Interagency Com-mittee on Marine Science and Engi-neering. The report, which addressesitself primarily to Federal data man-agement activities, lists the locations,principal contacts, and capabilities ofGovernment facilities with ocean dataprograms. In addition, informationavailable on State and regional activi-ties, academic institutions, and in-dustry are included. In compiling theindustry information, EDS selected267 of some 600 marine-orientedcompanies on the basis of significantcapabilities in ocean data collection,processing, or analysis.
The study has been forwarded tothe Senate Committee. Avaiiability ofcopies of the report will be announcedin a later issue.
Marine Pollutants StudyData AvailableEDS has acquired environmental dataresulting from the Prediction ofOcean Pollutants Study conducted bythe Ocean Affairs Board of the Na-tional Research Council (NRC).
The study to assess the potentialeffects of man-generated substancesand activities on the marine environ-ment began in May 1973 with theidentification of six substance typesfor study by a steering committee.The substances were chosen becauseof their persistence, toxicity, andabundance in the marine environment.They include nuclear wa'stes, syntheticorganic chemicals, marine litter, me-tallic processing wastes from indus-trial operations, organic sludges, andmedical and agricultural pharmaceuti-cals.
Ocean Currents BibliographyEDS' National Oceanographic DataCenter (NODC) recently published amicrofiche Bibliography on Sutbsur-face Ocean Currents (1900-1972),which contains about 4,000 citations,most with abstracts. This bibliography,a comprehensive and timely revie\w ctopen literature concerning subsurfacecurrents of the world's oceans andseas, was compiled by the OceanicLibrary and information Center (OL-IC), La Jolla, California. under con-tract to NODC.
The Bibliography is available inmicrofiche form (15 microfiche pages)or in hard copy (1,390 pages) fromthe National Technical Informationservice, U.S. Department of Com-merce, 5285 Port Royal Rd., Spring-field, Va. 22151. Tel. (703) 321-8500.
Catalog of DigitalGeomagnetic Variation DataThe first in a series of detailed cata-logs. Report UAG-35, "Catalogue ofDigital Geomagnetic Variation Dataat World Data Center A for Solar-Terrestrial Physic'," has t, en pub-
lished. Other detailed catalogs areplanned for each of the solar-terres-trial discipline holdings of the center.
The catalog lists observatory names,mnemonic codes, geographic and geo-magnetic coordinates, and the monthsfor which hourly values and 2.5-min-ute values are available. A map showsthe 126 stations for which the centerholds digital hourly or 2.5-minuttdata values. Hourly values are lieldfor 124 stations, dating from 1902:2.5-minute values are held for 11stations, with the earliest data for1961.
Copies of the catalog are availablefor $.20 from the National Clinat'cCenter, Federal Bldg.. Ashevilie, N '..2'8801, Attn: Publications.
i [ I -- I ........... I I I II .... I I __
168
from EDS Nov. 74from EDS Nov. 74
Global Guide to TropicalStorms at SeaMariners Worldwide Climatic Guideto Tropical Storms at Sea, co-authoredby H. L. Crutcher and R. G. Quayle,has been prepared by the NationalClimatic Center for the NavalWeather Service Command. The 10-in.by 15-in. hardbound book contains114 pages of illustrated text (includ-ing sea-state photographs and morethan 60 special statistical storm trackcharts), as well as 312 charts showingmonthly and annual tropical cyclonestatistics by 5 -quadrangles for eachof six major ocean basins and fourstorm-stage categories.
The guide provides information onwhere and when tropical cyclones oc-cur, their frequency, direction ofmovement and speed, and generaltracks. It also includes discussions onship handling and tips on avoidingstorms, as well as information on spe-cific basins and tropical cyclones ingeneral.
While the guide is designed for themariner, its information will be valu-able to the industrial and scientificcommunities, since it brings tropicalcyclone statistics on all ocean basinstogether into one volume for the firsttime.
Copies of the publication are avail-able from: Superintendent of Docu-ments, U.S. Government Printing Of-fice, Washington. D.C. 20402, or theNational Climatic Center, FederalBuilding. Asheville, N.C. 28801. Theprice is $13.50.
Northern Hemisphere WeatherMaps Available on MicrofilmThe National Climatic Center has mi-crofilmed the monthly publication,Daily Synoptic Series, HistoricalWeather Maps, Northern HemisphereSea Level for the period from January1899 through November 1944. Theseries contains one chart per day, gen-erally for either 1230 or 1300 GMT.NCC also has microfilmed the relatedmonthly series, Daily Series, WeatherMaps, Northern Hemisphere Sea Leveland 500rmb Charts coN ering the pe-riod December 1944 through Decem-ber 1967. This series contains onedaily sea level chart (generally near1200 GMT) and one 500mb Chart(times vary from near 0400 GMT to1200 GMT). All these charts wereplaced on 48 reels of 35mm microfilm100 feet long. (Synoptic Data Tabula-tions included in some of these publi-cations were not placed on these reelsof microfilm.)
Microfilming the data drasticallyreduces their cost to customers. Paperstock issues for the entire period(1899-1967), if available, would cost$2,277 ($2.75 per issue). Since manyissues are out of print, the cost toretrieve them would be much higher.Duplicate copies of the entire 48 reelsof microfilm can be purchased for$528; individual reels cost $11. Theentire series described above, in itsoriginal paper form, occupied 34 cubicfeet of storage space. The 48 reels of35mm microfilm occupy under 1 cu-bic feet of space.
Further information may be ob-tained by writing to National ClimaticCenter, Federal Building, Asheville,N.C. 28801,

169
APPENDIX 4
Sources of Information and Data
National Climatic Center
National Oceanographic Data Center
National Geophysical and Solar-Terrestrial Data Center
Center for Experiment Design and Data Analysis
National Space Science Data Center ''
NCAR Libraries
National Technical Information Service
Environmental Science Information Center
ENDEX and OASIS :
a.
b
C,c .
d.
e.
f.
g-
h.
i .

VISITORS ARE WELCOME at the NationalClimatic Center. Many data users find avisit advantageous. NCC's meteorologists,data processing specialists, and recordsspecialists then work most effectively asa team in exploring the problem with theuser and in determining how NCC maybest serve his needs.
Advance notice is desirable, especiallyif the visitor wishes to confer with specificstaff members or types of specialists.Working space and assistance are pro-vided as needed. Call 704-258-2850ex-tension 683, or write to the address givenbelow. Residents of the Washington, D.C.,area may reach us directly and toll-freeby dialing (no area code required) 495-2424. Our Federal TelecommunicationsSystem number is (704) 254-0683. Lettersshould be addressed to:
The National Climatic CenterNational Oceanic and Atmospheric
AdministrationFederal BuildingAsheville, North Carolina 28801
CLIMATIC INFORMATIONAVAILABLE FROM NCC
* HOURLY SURFACE OBSERVATIONSFROM LAND STATIONS (ceiling, skycover, visibility, precipitation or otherweather phenomena occurring, ob-structions to vision, pressure, tempera-ture, dew point, wind direction, windspeed, gustiness).
* THREE-HOURLY AND SIX-HOURLYSURFACE OBSERVATIONS FROMLAND STATIONS, OCEAN WEATHERSTATIONS, AND MOVING SHIPS (vari-able data content).
* UPPER AIR OBSERVATIONS (radio-sondes, rawinsondes, rocketsondes,low-level soundings, pilot balloonwinds, aircraft reports).
* RADAR OBSERVATIONS (radar logsheets, radar scope photography).
* SATELLITE DATA (vidicon pictures ofearth and clouds, Earth ResourcesTechnology Satellite (ERTS) imageryand other radiation data, derivedproducts).
* SELECTED MAPS AND CHARTS (Na-tional Meteorological Center products).
* DERIVED AND SUMMARY DATA (gridpoints, computer tabulations, digitalsummary data).
* SPECIAL COLLECTIONS (BarbadosOceanographic-Meteorological Experi-ment meteorological data, Global At-mospheric Research Program basic dataset, solar radiation data, many others).
NCC SERVICES
*Data and map reproduction, in-cluding hard-copy manuscripts,microforms, digital media, andother forms.*Analysis and preparation of sta-tistical summaries based on ar-chive holdings.*Evaluation of various data re-cords for specific analyticalrequirements.*Library search for bibliographicreferences, abstracts, and docu-ments.-Referral to organizations holdingrequested information.*Provision of general atmosphericsciences information.-Supply of publications, includingreference manuals, catalogs ofholdings, data reports, andatlases.
REQUESTS FOR SERVICES
Requests should define data re-quired, stations or geographicallimits involved, desired carriermedium (magnetic tape, punchedcards, microforms, hard copy),and such other pertinent informa-tion as a description of the pro-blem for which the data are re-quired. NCC personnel and theuser consult on content and speci-fications, but nongovernment userswho require assistance in specify-ing their needs are referred to aprivate meteorological consultant.Work is performed on a reimbur-
sable basis. Unit costs for somesimple services have been esta-blished by the Department of
Commerce; otherwise, the requesteris provided a cost estimate beforework begins.
0

The information used may be of theday-to-day type, which describes and pre-dicts natural events; or it may be of amore historical type, which describes na-ture as it has been. Fulfilling the nationalneed for such historical documentation isthe work of NOAA, the National Oceanicand Atmospheric Administration of theU.S. Department of Commerce, and itsEnvironmental Data Service.
Where these histories are concernedwith the envelope of air surroundingplanet Earth, and with observations of the
processes we call weather, the data man-agement activities focus in the NationalClimatic Center (NCC), Asheville, NorthCarolina, the largest of the five major fa-cilities* in the Environmental Data Serv-* Others are the National Geophysical and Solar-Terrestrial
Data Center, Boulder, Colo.; the National Oceanographic
Data Center, the Environmental Science Information Center,
and the Center for Experiment Design and Data Analysis,
Washington, D.C.
ice, and the largest climatic center in theworld. For researchers in government, pri-vate institutions, and industry, for atmos-pheric scientists and engineers, and forthe general public, it is a unique centralsource of historical weather informationand related products; it also administersWorld Data Center A, Meteorology,which provides for international data ex-change.
As the collection center and custodianof all United States weather records, theNational Climatic Center obtains the datagenerated by NOAA's National WeatherService, the weather services of the AirForce, Navy, and the Federal Aviation Ad-ministration, the Coast Guard, and coop-
erative observers on land, at sea, and inthe air. Also included are the cloud pho-tography and other data obtained fromenvironmental satellites.
Records from the military services in-clude those from ships at sea, aircraft, andforeign bases. Archives include automated,miniaturized, and hard-copy forms.
After computer and human editing,data for which there is general user de-mand are summarized and published fordistribution to a wide variety of sub-scribers and for answering requests fordata. One million copies of monthly andannual climatological publications aremailed to 65,000 subscribers annually.
The National Climatic CenterNational Oceanic and Atmospheric
Administration
~, -.- w i :ullt i
; , :: --
ll; "Oo o, ". : ~~~~~~~~~~~~~~~~~~~~~~~~~~~~~~~ ; :::

The NationalOceanographicData Center
Visitors are welcome at the NationalOceanographic Data Center; how-ever, it is desirable to have advancenotice if visitors wish to interviewstaff members. Special workingspace and technical assistance areprovided on request. Call (202) 426-9052, or write:
The National Oceanographic DataCenter
National Oceanic and AtmosphericAdministration
Rockville, Maryland 20852
Oceanographic DataAvailable From NODC
Mechanical and expendable bathy-thermograph data in analog anddigital form.
Oceanographic station data for sur-face and serial depths, giving valuesof temperature, salinity, oxygen, in-organic phosphate, total phos-phorus, nitrite-nitrogen, nitrate-nit-rogen, silicate-silicon, and pH.
Continuously recorded salinity-tem-perature-depth data in digital form.
Surface current information ob-tained by using drift bottles or cal-culated from ship set and drift.
Biological data, giving values ofplankton standing crop, chlorophyllconcentrations, and rates of primaryproductivity; also bibliographic ref-erences to papers on marine biol-ogy.
Geological sampling inventory, pri-marily for the New England Conti-nental Shelf.
Bottom sample information.
NODC Services
uata processing.
Data reproduction, including com-puter printouts, punched cards,magnetic tapes, and other forms.
Analysis and preparations of statis-tical summaries based on archiveholdings.
Evaluation of various data recordsfor specific requirements.
Referral to organizations holding re-quested information.
Provision of general marine sciencesinformation.
Supply of publications, includingdata processing manuals, catalogs ofholdings, data reports, and atlases.
Requests for Services
Requests should define data required,geographic limits involved, and suchother pertinent information as a descrip-tion of the problem for which the dataare required. They should also specifyformat-magnetic tape, punched cards,microfilm, or hard copy (computer print-outs, publications, analog charts).
Cost varies with amount of ma-terial, special analysis, computer time,and other factors. Requests for smallamounts of information are completedfree of charge; otherwise, a cost estimateis presented to the requester beforework begins, and the request is handledupon receipt of funds.
The User's Guide for NODC's DataProcessing Systems, available fromNODC on request, provides detailed in-formation concerning data holdings.
|

N SDC PRODUCTS AND SERVICESNGSDCThe National
Geophysical &Solar-Terrestrial
Data Center
Mailing addresses and telephones are:
Environmental Data Service,D6 NOAA -Boulder, Colo. 80302, U.S.A.
Environmental Data Service,(MGG)DF62 NOAAWashington, D.C. 20235, U.S.A. NOAA/PA 72014
1974 (Rev.)
Telephones: Boulder: dial 303-499-1000 and ask for exten-sion listed; for FTS dial 303-499 and dial extension listed;Director NGSDC-6215; Solid Earth Data Services-6521,WDC-A for Solid Earth Sciences-6474; Solar TerrestrialData Services-6323, WDC-A for Solar Terrestrial Physics-6467. Washington: Marine Geology and ophysics-202-343-7368, commercial and FTS.
Copies of primary data and of data products areavailable to users on an exchange basis or at thecost of copying. Contributors of data to NGSDCand its associated World Data Centers are entitled
SEISMOLOGY
Seismograms, 70-mm and 35-mm film, originalsize on paper.Accelerograms, original size reproductions and35-mm and 70-mm film.Digitized strong-motion accelerograms, on punch-ed cards and magnetic tapes.Earthquake data list (events since January 1900),sorted chronologically and geographically, onmagnetic tape, punched cards, and 16-mmmicrofilm.Earthquake data service, punched-card updatesof data list on a monthly basis.Reid Earthquake Catalog, 16-mm microfilm.
PUBLICATIONS: United States Earthquakes (an annualsummary of earthquakes in the U.S. and nearby ter-ritories, and associated phenomena; series began in1928).:: tPublication 41-1, Earthquake History of the UnitedStates.(Revised Edition through 1970). (GPO cataloguenumber C55.228:41-1).':: *:Special Publication 282, Earthquake Investigation inthe United States (GPO catalogue number C4.19:282). *Seismicity maps (issued at irregular intervals),Seismological Publications and Services (free on re-quest from NGSDC).
GEOMAGNETIC MAIN FIELDMagnetic survey data tables of selected observedvalues or long-term changes in magnetic declina-tion or other components, tape copies of file,information on magnetic anomalies.Secular-change data tables showing long-termchanges in declination and other components.
PUBLICATIONS: U.S. Magnetic Charts (isogonic charts ofU.S., show lines of equal magnetic declination andrates of annual change; published every 5 years, withmagnetic charts for magnetic dip, horizontal inten-sity, vertical intensity, and total intensity publishedevery 10 years).'-'U.S. Magnetic Tables (published every 10 years, showmagnetic values for each station occupied in the U.S.during the preceding 10-year period).::":
Beginning in 1974, these publications will be producedjointly with the USGS.
: Available from the National Climatic Center, FederalBuilding, Asheville, N.C. 28801. Attn: Publications.
'':Available from the Environmental Science informationCenter, NOAA Environmental Data Service, Washington,D.C. 20235.
*: :Available from the Superintendent of DocumentsU.S. Government Printing Office, Washington, D.C. 20402.
to an equivalent amount without charge. The costsof copying are listed in various NGSDC catalogs orwill be provided on request. For large orders,charges will be actual cost.
MARINE GEOLOGY AND GEOPHYSICS
Bathymetric measurements, microfilmed originalrecords, processed tapes, printouts, punchedcards, data plots, and profiles.Seismic reflection profiles, original records onmicrofilm.Gravimetric measurements, microfilmed originalrecords, processed tapes, printouts, punchedcards, data plots, and profiles.Geomagnetic total field measurements, micro-filmed original records, processed tapes, print-outs, punched cards, data plots, and profiles.Geological data, including data on heat flow,cores, samples, and sediments (lists and descrip-tions only).
PUBLICATIONS: Data Reports (issued at irregular inter-vals).
SOLAR-TERRESTRIAL PHYSICS
Ionosphere data, including ionograms, frequencyplots, riometer and field-strength strip charts,and tabulations, some on tape and punchedcards.Solar activity data, microfilm copies of originalrecords, tape, and punched cards; solar flarepatrol film, solar maps from computer outputsor drawings.Geomagnetic variation data, magnetograms asfull-size paper or on 35-mm microfilm, daily/hourly values and magnetic indices, 2.5 minutevalues for selected stations on magnetic tape.Auroral data, 16- or 35-mm all-sky camera filmin 100-foot rolls, radar observations on 16-rmmfilm.Cosmic ray data, microfilmed original records,tape, punched cards.Airglow data, original data tables (many micro-filmed), punched cards, computer printouts.
PUBLICATIONS: Ionospheric Data (monthly issue, pre-sents monthly median ionospheric characteristics forionospheric physics community and users of HF radiopropagation).::Solar-Geophysical Data (monthly issue, Part I, PromptReports, and Part II, Comprehensive Reports, de-scribes solar activity and associated ionospheric, ra-dio propagation, and other geophysical effects).':'UAG Reports (issued at irregular intervals by WorldData Center A for Solar-Terrestrial Physics, reports onsolar-terrestrial environment and interplanetaryspace). :Magnetic Activity Indices (various types of relativemeasures of magnetic activity, derived from magneto-grams, in particular the AE indices).

A UNITED STATESDEPARTMENT OFCOMMERCEPUBLICATION
The Center forExperiment Designand Data Analysis
nn C flA is organized around its two majorUA program areas-data management and
scientific research. Its data managementservices division has technical responsibility for datamanagement from delivery of original records byacquisition personnel in the field to the archiving offinal data and data products. The research divisionassists in recommending, monitoring, reviewing, ancttesting data acquisition systems and procedures to,ensure that these data will be of optimum qualitynot only for the scientific analyses carried out withinthe division, but for data users within the inter-national scientific community. Computer and graph-ics support are provided by two other groups inCEDDA.
For more information, write:DirectorCenter for ExperimentDesign and Data AnalysisNOAA EnvironmentalData ServicePage Bldg. 2Washington, D.C. 20235
O ATMp
1,
NOAA/PA 730161973
B MExv was conducted in the tropical Atlantic
lBOM X east of Barbados in May, June, andJuly 1969 as a national, multiagency
study of the behavior and interaction of the ocean-atmosphere system in subtropical and tropicalwaters. Ships, aircraft, buoys, satellites, and islandstations were used as observation platforms withina 500-kilometer by 500-kilometer square, with datataken from the ocean floor to the stratosphere. Con-ducted in cooperation with the Government olBarbados, BOMEX involved the U.S. Department'of Commerce, Defense, Transportation, and the In-terior, the National Aeronautics and Space Adminis-tration, the National Science Foundation, and numer-ous universities and other institutions.With the end of field operations, the BarbadosOceanographic and Meteorological Analysis Projectoffice (now CEDDA) was established to reduce, proc-ess, and validate BOMEX data. BOMEX data for whichCEDDA is responsible include: salinity-temperature-depth soundings to a depth of 1,000 meters; ship-board meteorological observations and rawinsondedata; low-level atmospheric soundings made withthe Boundary Layer Instrument Package (BLIP); air-craft dropsonde and other meteorological observa-tions; shipboard and land-based radar observations;high-level (50,000 and 60,000 feet) panoramic cloudphotographs; intermediate and low-level time-lapsecloud photographs; and satellite cloud imagery.
In addition to data management, CEDDA is alsocompleting analysis of the BOMEX "core experi-ment"-evaluating the energy budget of the at-mospheric volume overlying the BOMEX array andthe upper ocean beneath the array, and computingthe energy flux across the sea-air boundary.
GL is a joint United States-Canada programl of environmental research aimed atL achieving more effective management of
Great Lakes water resources and at solving the watermanagement problems posed by a growing popu-lation in the Great Lakes basin area. Lake Ontarioand the Ontario basin were the subject of the fieldoperations (April 1972 through March 1973) whichwere designed to provide data for these closelycoordinated international scientific programs: ter-restrial water balance, atmospheric water balance,evaporation synthesis, lake heat balance, lake chem-istry and biology, water movement (lake circulation),atmospheric boundary layer, and simulation. Partici-pants included scientists from eight federal and stateagencies, and representatives of a number of univer-sities and research institutions.
Gn Tf* scheduled for the summer of 1974, is theGlA I , first major observational experiment of* the Global Atmospheric Research Pro-
gram, sponsored jointly by the World MeteorologicalOrganization and the International Council of Scien-tific Unions. This multinational research project willspan the Atlantic Ocean and will be the most am-bitious project yet undertaken to study the equa-torial atmosphere and ocean-the main heat sourcesdriving the atmosphere's general circulation.CEDDA's main responsibility here, as in IFYGL, is toestablish data management procedures before fieldoperations begin, ensure that these procedures arefollowed during the field program, and later reducepart of the data collected by United States acquisi-tion systems into final archive form. CEDDA mayalso merge sets of data obtained by the many par-ticipating nations into international data sets de-signed for specialized scientific analyses.Also as in IFYGL, CEDDA is participating in thedevelopment and testing of special acquisition sys-tems, specifically the automatic data-acquisition sys-tem to be used aboard United States ships duringGATE, the Omega rawinsonde tracking system, andthe GATE version of the BLIP.As part of the overall environmental budget studiesprogram of GATE, CEDDA will undertake the analy-sis of the bulk atmospheric budgets of the "B-scale"area, a portion of the Atlantic Ocean off the NorthAfrican coast chosen for intensive, concentratedobservations. CEDDA is also assigned responsibilityfor radar analyses, and planetary boundary layerstudies.
The CEDDA scientists and systems analysts who willbe responsible for deriving specific data and scien-tific products from the GATE field program areplaying a key part in the planning of the experi-ment. By formulating specific data requirements andanalyzing the effects of various alternative designs,they are able to recommend many details of plat-form array configuration, observation scheduling,sensor calibrations, and intercomparison activities.

NATIONALSPACESCIENCEDATACENTER
SPHERE OF ACTIVITY
The National Space Science Data Center(NSSDC) was established by NASA to furtherthe widest practicable use of reduced dataobtained from space science investigations andto provide investigators with an activerepository for such data. As such, it isresponsible for the active collection, organiza-tion, storage, announcement, retrieval, dissem-ination, and exchange of data received fromsatellite experiments, sounding-rocket probes,and high-altitude aeronautical and balloon in-vestigations. In addition, the Data Centercollects correlative data, such as magnetogramsand ionograms, from ground-basedobservatoriesand stations for NASA investigators and for on-site use at NSSDC in the analysis andevaluation of space science experimental results.
Primarily, NSSDC acquires reduced datarecords which have been prepared from theoriginal data by the introduction of scaling andcorrection factors. These data normallypresent the corrected sensor response as afunction of time, position, and other appro-priate parameters. In addition, an attempt ismade to assure later investigators independentuse of the data by providing additional informa-tion such.as:
MAILING ADDRESS
National Space Science Data CenterGoddard Space Flight CenterCode 601Greenbelt, Maryland 20771
* Description of the instrument or meas-uring device and the results of allpertinent calibrations which contributeto the quantitative understanding ofthe instrument characteristics
* Discussion of any important or un-usual developments during the courseof the experiment which affected thedata
* Specific methods employed by theprincipal investigator in performing hisdata reduction and data analysis
* References to the scientific results ofthe analyzed data and all other perti-nent bibliographic materials
Upon approval of proposals to conductspace research, principal investigators are re-quested to contact the Data Center at theearliest opportunity to formulate plans for thesubmission of their reduced data to NSSDC.
Data Acquisition
NSSDC attempts to collect data recordsbefore any types of reduction have been per-formed which might result in the destruction ofthe fundamental information content. Theserecords are usually prepared by a compaction,editing, and merging operation performed bythe principal investigator. Included are theinstrument responses measured as functions oftime along with appropriate position, attitude,and equipment performance information neces-sary to analyze the data in an independentfashion.
In addition, the Data Center collectsthose final analyzed data which the principalinvestigator designates as the most useful and
"best. illustrating the scientific results of hisexperiment.
Consequently, the form of the data ac-cepted by the Data Center is determined in alarge part by what is available from theexperimenter. In general, reduced data are inmachine-sensible form (compatible with elec-itronic computer processing equipment), butthey can be in a nonmachine-sensible form
TELEPHONE
(301) 982-6695
(charts, graphs, photographs, and tables whichare the results of data processing and analysistechniques employed by the investigator). Mostanalyzed data will be in nonmachine-sensibleform. The preferred medium in each individualcase usually is determined by consultationbetween the principal investigator and theData Center staff.
NSSDC assigns a specialist in the appro-priate scientific discipline for each experimentto arrange for data acquisition with the princi-pal investigator and to help solve relatedproblems.
Data Announcements
The Data Catalog of Satellite Experimentslists the NSSDC collection of data gatheredthrough space-exploration experiments. In-cluded are parameters of the space vehicle,description of the experiment, the types ofmeasurements or measuring instruments, datareduction techniques, lists of data content, andappropriate indexes. The computer programsavailable for distribution by NSSDC are alsolisted.
The Handbook of Correlative Data de-scribes and lists the general availability ofground-based measurements,such as ionospheric,cosmic-ray, solar, and geomagnetic observations.Since the data referred to in this Handbook arenormally distributed by primary sources outsideof NASA, the NSSDC collection is availableonly to NASA personnel; however, it is availableto all investigators for onsite; analysis! andevaluation of space science experimental results.The Data Center will identify the sources ofcorrelative information on request.
The Data Users' Note, a document whichdescribes the data available at the Data Centerfrom a specific investigation, is produced byNSSDC. Prepared in close cooperation with theprincipal investigator, it provides a descriptionof the instrument, calibration data, discussionof the experiment, specific methods employedin reducing the data, format of available data,and references to the scientific results of theanalyzed data and all other pertinent biblio-igraphic material.
The Data Announcement Bulletin an-nounces the availability of newly acquired databetween editions of the Data Catalog of Satel-lite Experiments.
A space science document file with appro-priate keywords and descriptors is maintained.Special bibliographies are produced on request.
(-(_n

a_'
$ WELCOME TOI HE LIBRARIES
Our purpose is to supply the scientific, technical, and business informa-tion needed by NCAR personnel in their work. Our holdings includebooks, yournals, reports, data, atmospheric maps and charts, microfilmfiles, /indexes, and abstracts. The subject emphasis is on physics, meteo-rology, chemistry, mathematics, astrophysics, and related areas inengineering and instrumentation. The collection at the Mesa Librarycomprises approximately 40,000 items, The library at the NCAR HighAltitude Observatory (HAO),- located on the University of Coloradocampus, houses 13,500 items. About 700 periodicals come regularly to theMesa Library, and over 340 are received at the HAO Library. A smallcollection of general non-fiction books and several non-technical periodi-cals are available in the Damon Room lounge at the Mesa Laboratory.
NCAR personnel may use either library at any time. Non-NCAR personsmay use the librarie during normal working hours, 8:00 A.M. to 5:00P.M. Monday through Friday. The HAO Library is also open 7:00 P.M. to10:00 P.M1 Monday through Friday,
177
U.S. DEPARTMENT OF COMMERCENational Technical Information Service5285 Port Royal RoadSpringfield, Virginia 22151
ABOUT NTIS...The National Technical Information Service* is a centralsource for the public sale of Government-sponsored re-search reports and other analyses prepared by Federalagencies, their contractors or grantees, and it is a centralsource for Federally generated machine processable datafiles and programs.NTIS fills 5,000 new and 6,000 standing orders daily as oneof the world's leading processors of specialty information,supplying the public with approximately three milliondocuments and microforms annually. The NTIS informationcollection exceeds 730,000 titles with more than 100,000documents in current stock. All are available for sale andthis catalog describes those most in demand.The agency is obligated by statute to recover its cost andhas become largely self sustaining. Less than 20% of itsfunding comes from its direct appropriation as an agencyof the U.S. Department of Commerce.Timely and continuous reporting to subscribers is ensuredby agreements between NTIS and hundreds of Federalresearch-sponsoring organizations. NTIS is the marketingcoordinator for various information analysis centers in theU.S., for their publications and technical inquiries andspecial analyses.The public may quickly locate abstracts of interest fromamong the 300,000 Federally sponsored research docu-ments published since 1964. Copies of the whole reportsare sold, in paper copy or microform.Current abstracts of NTIS documents and other records invarious categories of interest are published in weeklyjournals (Weekly Government Abstracts). These are curnu-lative and indexed. The magnetic tape from which thejournals are prepared is also available.A microfiche service, with a custom profile option, auto-matically provides subscribers with the full texts of reportsin categories of interest they select.The foregoing and many more products and services aredescribed in detail in the NTIS Information Services Book-let, free on request. Use the request card inside the backcover of this catalog to receive the Information ServicesBooklet and other free material.
*Formerly the Clearinghouse for Federal Scientific and TechnicalInformation.
INFORMATIONREQUESTCARDMail this postal cardto order additional catalogsand to find out aboutother NTIS productsand services.
Gentlemen: Pleasesend me the following free material.
O NTIS Special Interest Publications. NTIS-PR-73-01.[ NTIS Information Services Booklet. NTIS-PR-73-00.
[ NTIS Deposit Account Brochure and Application.n NTISearch Booklet. Describes how I can obtaincustom information searches of the NTIS data base ofmore than 360,000 publications like those described inthis catalog. NTIS-PR-73-03.] Guide to Available NTISearch Packages. Describes
how I can benefit from more than 100 already com-pleted searches on specific topics of current interest.NTIS-PR-73-02.Weekly Government Abstract Brochures. Describeweekly newsletters reporting on the latest technologicaladvances with complete abstracts of new Government-funded reports. Brochures describe WGA newslettersavailable by annual subscription and published underthe following titles. (Check those of interest to you.)
O AdministrationL1 Behavior
C] Biomedical Technology& Engineering
C] Building Technology[ Business & Economics] Computers, Control &
Information Theory
[ Environmental Pollu-tion & Control
n Industrial Engineering[ Library & Information
Sciencesn Materials Sciencesn TransportationO Urban Technology
Name
Title, Organization
Address
City, State, Zip

tED STATES ESICIRTMENT OFMMERCEIUCATION
OwlS^s The EnvironmentalScience Information
CO/B or iCenter
THE SCIENTIFIC VIEW of the physicalworld exists in the form of observations,measurements, photographs, digital bits,analog records, biological samples-types ofinformation we call data. Ensuring that thisview has order, continuity, and utility is thetask of the U. S. Department of Commerce'sNational Oceanic and Atmospheric Adminis-tration (NOAA), and its Environmental DataService.
When the varied information takes the formof literature, it becomes the concern of EDS'ESIC, the Environmental Science InformationCenter, NOAA's scientific and technical pub-lisher, information banker, and librarian. ESICcomplements the Enironmental Data Servicefamily of data centers*, enhancing the servicestructure needed for a comprehensive, singlesource for environmental data and informa-tion within NOAA. ESIC has also developed acomputerized information service that makesvirtually the entire body of environmental
The National Climatic Center, Asheville, N.C.; theNational Oceanographic Data Center and the Center forExperiment Design and Data Analysis, Washington,D.C.; the National Geophysical and Solar-TerrestrialData Center, Boulder, Colo.; and the Center for Cli-matic and Environmental Assessment, Columbia, Mo.The EDS also operates corresponding World Data Cen-ters in conjunction with these facilities as well as aSatellite Data Services Branch in Camp Springs, Md.
literature relating to earth, atmosphere, andoceans available to users anywhere.
PublisherAS NOAA'S SCIENTIFIC AND TECHNICAL
PUBLISHER, ESIC guides the flow of manu-scripts from agency researcher scientists andtechnical service offices through channels ofreview, editorial processing, and printing,then monitors the dissemination of NOAA pub-lications to a wide audience. These publica-tions appear as reports, technical memoranda,data listings, handbooks, manuals, catalogs,atlases, and fact sheets, all announcedthrough NOAA Publications AnnouncementNOAA Library Accessions lists, and specialbibliographies. Professional societies; infor-mation services in other Federal agencies; andpublishers of commercial, scientific, and tech-nical journals are notified of NOAA issuances.New articles on scientific and technical find-ings by NOAA scientists are distributed tomore than 700 trade, technical, scientific,and engineering publications with a combinedcirculation of more than four million.
Information BankerTHE COMPUTERIZED INFORMATION SERV-
ICE developed by ESIC provides environmentalscientists and managers ready access to a
Address inquiries to: m!
ESIC, NOAAEnvironmental D
Data Service 2Washington, D.C.20235 ~%rENT o
large number of bibliographic data basesdealing with the atmospheric, oceanic, andearth sciences, and marine resources. CalledOASIS (for Oceanic and Atmospheric Scien-tific Information System), the service includes:
* Retrospective searches, in which specificsubject matter from an entire data baseor a given number of volumes of a database can be retrieved, providing referral topublished literature in alreas of interests tousers working on relatively short-termprojects.
* Selective dissemination of information, a"current awareness" feature in which cita-tions are retrieved from current scientificliterature as it is published, providing peri-odic dissemination of information to userswith relatively long-term requirements.
The services may be requested from anyNOAA library (see "Library Services") or atechnical information specialist
Library ServicesAS NOAA'S LIBRARIAN, ESIC coordinates
the agency's library services and its partici-pation in the national network of scientificlibraries. The collections are extensive-forexample, 175,000 volumes in the AtmosphericSciences Library, and 150,000 in the Marineand Earth Sciences Library. ESIC providestechnical assistance to NOAA libraries outsidethe Washington area and has functional super-vision of over 30 field libraries. There is aNOAA library in Miami, Fla., administered byESIC which provides library and informationservices to several nearby offices and labora-tories. In 1974 the Great Lakes Library be-came part of ESIC to provide informationservices to all NOAA components at Detroitand Ann Arbor, Mich. ESIC also maintainsclose liaison with the Environmental ResearchLaboratories Library in Boulder, Colo.
NOAA/PA 72029 * 1972
00
LIBRARY SERVICESThe libraries have open stacks, reading
rooms, and a common service policy: loan,reference, literature-searching, and inter-library loan services for NOAA personnel.Bibliographies are compiled upon request. Thelibraries are open to the public for referenceuse only.
Atmospheric Sciences LibraryThe comprehensive collection includes sci-
entific studies in meteorology, climatology,and hydrology, and their applications; also,extensive holdings of published daily weathermaps and climatic data. The Library main-tains, for loan, microfilm of National WeatherService manuscript maps. Address inquiriesto: Atmospheric Sciences Library (D821), Na-tional Oceanic and Atmospheric Administra-tion, 8060 13th Street, Silver Spring, Md.20910. (301) 427-7800.
Marine and Earth Sciences LibraryThe comprehensive collection specializes
in geodetic astronomy, nautical and aeronau-tical cartography, geodetic and hydrographicsurveying, photogrammetry, mathematics, andthe following divisions of geophysics: geodesy,gravity, geological oceanography, and tidalphenomena. There is a branch containing acore collection on fisheries. Address inquiriesto: Marine and Earth Sciences Library(D822), National Oceanic and AtmosphericAdministration, 6001 Executive Boulevard,Rockville, Md. 20852. (301) 496-8021.
NOAA Miami LibraryThe collection deals mainly with the special-
ties of the Atlantic Oceanographic and Me-teorological Laboratories of NOAA's Environ-mental Research Laboratories and other local
NOAA installations, and includes physicaloceanography, marine geology and geophys-ics, cartography, paleogeology, tropical me-teorology, hurricanes, experimental meteorol-ogy, and weather modification. Address in-quiries to: NOAA Miami Library, 15 Ricken-backer Causeway, Miami, Fla. 33130 (305)350-1330.
Great Lakes LibraryThe EDS Great Lakes Library contains an
archival collection on lake levels and hydrol-ogy of the Great Lakes. The disciplines ofhydrology and limnology comprise about 85percent of the collection of 12,000 volumes.Library services are provided for NOAA per-sonnel in both Detroit and Ann Arbor, Mich.,the location of the Great Lakes EnvironmentalResearch Laboratory established in 1974 tostudy the natural processes and develop anunderstanding of the Great Lakes. Addressinquiries to: Great Lakes Library, NationalOceanic and Atmospheric Administration, 630Federal Building and U.S. Courthouse, Detroit,Mich. 48226 (313) 226-6126.
Boulder Laboratories LibraryManaged by NOAA's Environmental Re-
search Laboratories, this collection has spe-cialized in the scientific areas of interestto researchers in NOAA, the National Bureauof Standards, and the Office of Telecommuni-cations including: telecommunication sci-ences, ionospheric and solar physics, electro-magnetic wave propagation, cryogenics, radioand electronic standards, remote sensing,weather modification, quantum electronics,geomagnetics, and related fields. Address in-quiries to: NOAA Environmental ResearchLaboratories Library (R51), Boulder, Colo.80302. (303) 499-1000, Ext. 3788.
Illll~lllsllC1III------
LLpl----P ·s-l~ I

NOAA Environmental Data KeyENDEX/OASIS provide users rapid referral to avail-able environmental data and information files ofNOAA, other Federal agencies, state and local gov-ernments, universities, research institutes, and pri-vate industry. Subject areas include aeronomy,cartography, climatology, coastal zone management,environment-related engineering, geodesy, hydro-graphy, hydrology, marine geology, meteorology,oceanography, and space and solar science.
In developing this system the Environmental DataService has sought out and documented selectedfiles of environmental data and information. Theapproach has been one step at a time, beginning witheasily accessible collections pertinent to the solutionof current national problems-such as coastal zonecollections needed for offshore activities related tothe energy crisis. The objective is to complete acomprehensive nationwide inventory by 1980.
At present, just under 2,000 environmental data filesare referenced. These pertain largely to the Chesa-peake Bay, New York Bight, and Great Lakes areas.Further file description efforts are underway inFlorida and California, and negotiations have begunto initiate work in North and South Carolina and inGeorgia. On the literature side, the new servicereferences literally millions of technical publications.
ENDEX contains computer-searchable descriptionsof interdisciplinary files of environmental data onmany levels; when these files are large, detailedinventories are also provided. Specifically, ENDEXhas three major components:* Descriptions of data collection efforts.* Descriptions of data files.* Detailed inventories of large, commonly used files.
An ENDEX data file description lists the types ofparameters and volumes of data available, themethods used to measure them, when and wherethe data were collected, the sensors and platformsused, data formats, restrictions on data availability,publications in which the data may be found, whomto contact for further information, and the estimatedcost of obtaining the data.
ENDEX services and products include:* Access to specialized indexes of environmentaldata, grouped by geographic areas, institutions, ordisciplines.* On-line, interactive searches of the indexes toanswer specific questions concerning the availabilityand whereabouts of data files.* A quick-response determination of the costs ofretrieval from large data files.e* Data catalogs from large NOAA environmentaldata collection projects.
Individual ENDEX data files descriptions will beupdated every two years.
The great mass of environmental data received andheld by data centers today could present an increas-ingly complicated labyrinth to data users, withoutsome easy-to-use key. Now that key is available fromthe National Oceanic and Atmospheric Administra-tion, in the form of a one-stop environmental dataand information referral service that can be as closeto a data-user as the telephone. Called ENDEX (fromEnvironmental Data Index)/OASIS (from Oceanicand Atmospheric Scientific Information System), thenew system was devised and put into operation bythe Commerce Department agency's EnvironmentalData Service.
Cost of ServicesThe cost of ENDEX/OASIS referral services is deter-mined by the type of search provided and the num-ber and character of the data files searched. Forexample, although the average cost of a search andretrieval is $50, for a simple request it could beas low as $5. In some cases, there may be no chargeat all. In any case, there is no obligation for theinitial contact, and a firm estimate of costs will beprovided the user before a chargeable search ismade.
OASIS is a computerized information retrieval serv-ice that provides ready reference to the technicalliterature and to research environmental sciencesand marine and coastal resources. It provides com-puterized searches of both NOAA and non-NOAAdata bases containing references to technical publi-cations. User products include bibliographic refer-ences, abstracts, and indexing terms. OASIS offersaccess to major meteorological and oceanicbibliographic information files not available any-where else in computer-searchable form.
OASIS services include:* On-line searching: where the user needs information immediately, a data base can be queried fromone of several terminals. (A large data base can becomputer-searched in a few minutes.)* Selective Dissemination of Information (SDI), orcurrent awareness: citations are retrievable fromcurrent scientific literature as it is published. SDIprovides periodic dissemination of information tothe user with relatively long-term needs.* Retrospective searches: the retrieval of specificsubject matter from an entire data base or a givennumber of volumes of a data base. Retrospectviesearches provide a survey of a specific interest areato a user working on relatively short-term projects.* Special bibliographies: these can be preparedfrom one or more data bases with numerous options,and with output in printout, photocomposition, ormagnetic tape for photocomposition.
Using ENDEX and OASISTo use the NOAA/EDS referral services, call or visitan ENDEX or OASIS Technical Information Specialistat any of the Environmental Data Service Centerslisted below:
Its five major facilities include the National ClimaticCenter, in Asheville. North Carolina; the NationalGeophysical and Solar-Terrestrial Data Center, inBoulder, Colorado; and the National OceanographicData Center, Center for Experiment Design andData Analysis, and Environmental Science Informa-tion Center, all in Washington, D.C.
General information on ENDEX or OASIS servicesmay also be obtained by contacting or visiting any ofthe NOAA scientific and technical libraries scatteredthroughout the United States. I
000
181
ADDRESSES
AFCRL Meteorological LaboratoryAir Force Cambridge Research LabsHanscom FieldBedford, Massachusetts 01731
AFGWC USAF Global Weather CentralOffutt AFB, Nebraska 68113
CEDDA The Center for Experiment Design and Data AnalysisNOAA Environmental Data ServicePage Building 2Washington, D.C. 20235
EDS Environmental Data ServiceNOAAWashington, D.C. 20235
ERDC (for ERTS pictures - also called EROS Data Center)Earth Resources Data CenterDepartment of the InteriorSioux Falls, South Dakota 57189
ESIC Environmental Science Information Center, NOAAEnvironmental Data ServiceWashington, D.C. 20235
ETAC USAF Environmental Technical Applications CenterBuilding 859, Stop 825Scott AFB, Illinois 62225
FNWC Fleet Numerical Weather CentralMonterey, California 93940
GFDL Geophysical Fluid Dynamics Lab/NOAAP. O. Box 308Princeton, New Jersey 08540
GPO (Government Printing Office)Superintendent of DocumentsU.S. Government Printing OfficeWashington, D.C. 20402
182
LBL Lawrence Berkeley LaboratoryUniversity of CaliforniaBerkeley, California 94720
Nimbus/ATSNASA/GSFCGreenbelt,
Data Utilization Center
Maryland 20771
Data Analysis SectionNational Center for Atmospheric ResearchP. 0. Box 3000Boulder, Colorado 80303 303-494-5151
FTS 303-394-5526
National Climatic CenterNOAAFederal BuildingAsheville, North Carolina 28801 704-258-2850
FTS 704-254-0683
National Environmental Satellite ServiceF.O.B. 4Suitland, Maryland 20233
National Geophysical and Solar-Terrestrial Data CenterNOAAEnvironmental Data ServiceBoulder, Colorado 80302 303-499-1000, Ext. 6323
FTS 303-449-6323
National Hurricane Experimental MeteorologicalLaboratory
P. O. Box 8265University of Miami BranchCoral Gables, Florida 33124
National Meteorological CenterWorld Weather BuildingSuitland, Maryland 20233
National Oceanographic Data Center/EDSPage Building #12001 Wisconsin Ave., N.W.Washington, D.C. 20235 202-426-9052
NESS
NGSDC
NHEML
NMC
NODC
NADUC
NCAR
NCC

183
National Ocean SurveyNOAARockville, Maryland 20852
National Space Science Data CenterCode 601.4NASA-Goddard Space Flight CenterGreenbelt, Maryland 20771 301-982-6695
National Severe Storms Laboratory1313 Halley CircleNorman, Oklahoma 73069
National Technical Information Service5285 Port Royal RoadSpringfield, Virginia 22151
Climate Dynamics GroupThe RAND Corporation1700 Main StreetSanta Monica, California 90406
Scripps Institution of OceanographyUniversity of CaliforniaLaJolla, California 92037
Illinois State Water Survey
Box 232Urbana, Illinois 61801
Meteorology SectionBonneville Power AdministrationPortland, Oregon 97208
Air Quality and Turbidity Data
National Aerometric Data BankEnvironmental Protection AgencyResearch Triangle Park, North Carolina 27711
NOS
NSSDC
NSSL
NTIS
RAND
SCRIPPS &NORPAX

184
Assessment Studies
Center for Climatic and Environmental AssessmentNOAAFederal Building, Room 116Columbia, Missouri 65201 FTS (314) 442-3261
Crop Data
Economics Research ServiceDepartment of AgricultureForeign Demand and Competition DivisionGroup Hospital Insurance Building500 12th Street, S.W.Washington, D.C. 20250
Data Bank of Early Climatological Sources
Center for Climatic ResearchAttention: Data Bank1225 West Dayton StreetMadison, Wisconsin 53704
NOAA Satellite Data
Satellite Data Services Branch (NOAA-EDS-NCC)D 543, World Weather Building, Rm. 606Washington, D.C. 20233
Commercial or FTS (301) 763-8111
Stream Flow Data
U. S. Geological SurveyNational CenterMail Stop 43712201 Sunrise Valley DriveReston, Virginia 22092
CANADADepartment of the EnvironmentInland Waters DirectorateElectronic Data Processing CommitteeOttawa, Canada
185
Atmospheric Environment ServiceClimatic Data Processing Division4905 Dufferin StreetDownsview, Ontario, Canada M3H5T4

I

187
REFERENCES and BIBLIOGRAPHY
Academy of Sciences, 1974: U. S. Contribution to the Polar Experiment (Polex-North). U.S. Academy of Sciences, 2101 Constitution Ave., Washington, D.C.
Atkinson, G. D., and J. C. Sadler, 1970: Mean-Cloudiness and Gradient-level-windCharts over the Tropics, Vol. II. Charts. USAF Air Weather Service, Tech.
Report 215, Vol. 11.
Barrett, E. C., 1974: Climatology from Satellites. Methuen & Co., Ltd.,11 New Fetter Lane, London EC4, 418 pp.
Bedient, H. A., W. G. Collins, and G. Dent, 1967: An operational tropical analysis
system. Mon. Wea. Rev. 95 (12), 942-949.
Bedient, H. A., and J. R. Irwin, 1970: National Meteorological Center's
Operational Tropical Analysis Procedures. Symposium on Tropical Meteorology,2-11 June 1970, University of Hawaii (available from the American
Meteorological Society, Boston, Mass.).
British Meteorological Office, 1974 (unpublished): Catalog of MachineableMeteorological Data (1974 edition), British Meteor. Office, Bracknell.
Bureau of Meteorology, Australia, 1970: Data Held in Computer-compatible Form
(as at 31 December 1969). Director of Meteorology, P. 0. Box 1289 K,
Melbourne, Victoria, 3001, Australia.
Chin, P. C., 1972: Tropical Cyclone Climatology for the China Seas and WesternPacific from 1884 to 1970, Volume 1: Basic Data. Royal Observatory,
Hong Kong, 207 pp.
Coburn, A. R., 1970: Three-Dimensional Nephanalysis. AFGWC Tech. Memo 70-9,
USAF Global Weather Central, Offutt AFB, Nebraska.
Cressman, G. P., 1959: An operational objective analysis system, Mon. Wea. Rev.
87, 367-374.
Crutcher, H. L., and J. M. Meserve, 1970: Selected Level Heights, Temperatures
and Dew Points for the Northern Hemisphere. NAVAIR 50-1C-52 (revised),
Chief of Naval Operations, Washington, D.C.
Eber, L. E., J. F. T. Saur, and O. E. Sette, 1968: Monthly mean charts of sea
surface temperatures, North Pacific Ocean, 1949-1962. Circular 258,
U. S. Bureau of Commercial Fisheries.
Environmental Data Service, 1974: Atmospheric Turbidity and PrecipitationChemistry Data for the World 1972 (WMO, EPA, NOAA). Prepared by EDS,
National Climatic Center, Asheville, N. C.
EDS (Environmental Data Service): This is a monthly publication by NOAA that
includes information about various data sets.

188
Finger, F. G., K. W. Johnson, M. E. Gelman, R. M. McInturff, 1973: Compatibilityof radiosonde and NIMBUS-4 SIRS - derived data at stratospheric constant-pressure surfaces. Mon. Wea. Rev. 101, No. 3, 244-251.
Flowers, E. C., R. A. McCormick, and K. R. Kurfis, 1969: Atmospheric turbidityover the United States, 1961-66. J. AppZ. Meteor. 8, 955-962.
Hadeen, Kenneth D., 1970: AFGWC Boundary Layer Model. AFGWC Tech. Memo 70-5.A.F. Global Weather Central, Offutt Air Force Base, Nebraska.
Hering, W. S., and T. S. Borden, 1967: Ozonesonde Observations over NorthAmerica, AFCRL-64-30 (IV), Vol. 4, ERP No. 279 (available from Clearinghouse,Federal Scientific and Technical Information).
Hoppe, E. R., and A. L. Ruiz (eds.), 1974: Catalog of Operational SatelliteProducts. NOAA Tech. Memo NESS-53, Washington, D.C.
Inland Waters Directorate, 1973: Guide to Data Holdings. Department of theEnvironment, Inland Water Directorate, Electronic Data Processing Committee,Ottawa, Canada.
Jenne, R. L., H. L. Crutcher, H. van Loon, and J. J. Taljaard, 1974: A SelectedClimatology of the Southern Hemisphere: Computer Methods and DataAvailability. NCAR-TN/STR-92, National Center for Atmospheric Research,Boulder, Colo., 91 pp.
Jenne, Roy L., and Dennis H. Joseph, 1974: Techniques for the Processing,Storage, and Exchange of Data. Technical Note NCAR-TN/STR-93, NationalCenter for Atmospheric Research, Boulder, Colo., 52 pp.
Jenne, R. L., K. Labitzke, and H. van Loon (in preparation): A Climatology ofthe Northern Stratosphere from 100 to 10 mb on Microfilm and Tape. NCARTechnical Note, National Center for Atmospheric Research, Boulder, Colo.
Labitzke, K., 1972: Climatology of the stratosphere in the northern hemisphere.1: Heights, temperatures, and geostrophic resultant wind speeds at 100,50, 30, and 10 mb. Meteor. Abh. 100 (4), 1972.
Lahey, J. F., R. A. Bryson, H. A. Corzine, and C. W. Hutchins, 1960: 300-mbWind Characteristics for the Northern Hemisphere. University of WisconsinPress, Madison, Wisconsin.
Larson, S., and T. Laevastu, 1971: Numerical Analysis of Ocean Surface Currents.FNWC Tech. Note 71-1, Fleet Numerical Weather Central, Monterey, Calif.
Leese, J. A., A. L. Booth, and F. A. Godshall, 1970: Archiving and ClimatologicalApplications of Meteorological Satellite Data. ESSA Tech. Report NESC 53.NESS, Suitland, Md.
Lewit, H. L., 1972 (unpublished): Project Report, FNWC OceanographicClimatology Project. Fleet Numerical Weather Central, Monterey, California.
189
McInturff, R. M., and F. G. Finger, 1968: The Compatibility of Radiosonde Dataat Stratospheric Levels over the Northern Hemisphere. ESSA Tech. Memo
WBTM-DATAC 2, National Meteorological Center, Suitland, Md.
Meserve, J. M., 1974: Marine Climatological Atlas of the World. Vol. 1:N. Atlantic. NAVAIR 50-1C-528 (revised). Naval Weather Service Command,
Washington, D. C.
Miller, Donald B., and Robert G. Feddes, 1971: Global Atlas of Relative CloudCover 1967-70. NOAA/NESS (U.S. Dept. of Commerce) and USAF, Asheville, N.C.
Muench, H. S., 1962: Atlas of Monthly Mean Stratosphere Charts 1955-59. Air
Force Surveys in Geophysics No. 141, AFCRL-62-494.
Murty, T. S., and A. Wood, 1975: Oceanographic Products and Methods of Analysisand Prediction. Intergovernmental Oceanographic Committee, UNESCO, Paris.
National Climatic Center, 1969: Selective Guide to Climatic Data Sources.Superintendent of Documents, U.S. Government Printing Office, Washington,
D.C. (Prepared by the National Climatic Center, Asheville, N.C.)
National Referral Center, 1974: Directory of Federally Supported InformationAnalysis Centers. Superintendent of Documents, GPO, Washington, D.C.
(Compiled by National Referral Center.)
NOAA, 1974: Environmental Satellite Imagery (August, 1974). NOAA and EDS,
each month starting November 1972. (Available from the National TechnicalInformation Service, Springfield, Va.)
Philippines Weather Bureau, 1973 (unpublished): List of meteorological data
transferred into computer-usable forms. Weather Bureau, Quezon City,
Philippines.
Phillips, H. L., and L. Rubin, 1972: The Operational Processing of Solar Proton
Monitor and Flat Plate Radiometer Data. NOAA Tech. Memo, NESS 29.
Project 433L ESSPO, 1959: Reference Manual for Climatic Data Computer Tapes.
433L ESSPO (joint), 424 Trapelo Rd., Waltham, Mass. (NCC and NCAR have
copies).
Raschke, E., T. Vonder Haar, M. Pasternak, and W. Bandeen, 1973: The Radiation
Balance of the Earth-Atmosphere System from Nimbus 3 Radiation Measurements.
NASA Tech. Note TN D-7249, NASA, Washington, D.C.
Samples, L. C., 1966: Automatic Processing Data, FNWC TN-22, FNWC, Monterey,Calif.
Schutz, C., and W. L. Gates, 1971: Global Climatic Data for Surface, 800 mb,
400 mb, January. ARPA Report, RAND, Santa Monica, Calif.
190
Sherr, Paul E., Arnold H. Glaser, James C. Barnes, and James H. Willard, 1968:World-wide Cloud Cover Distributions for Use in Computer Simulations.NASA CR-61226 NASA George C. Marshall Space Flight Center, Huntsville, Ala.
Stokes, M. A., L. G. Drew, C. W. Stockton (editors), 1973: Tree RingChronologies of Western America. Laboratory of Tree-Ring Research,University of Arizona, Tucson, Ariz. (Contributors were J. S. Dean,H. C. Fritts, C. W. Ferguson, T. P. Harlan, R. L. Holmes, P. R. Julian.,M. L. Parker, V. C. LaMarche, R. L. Nichols, D. G. Smith.)
Stoldt, N. W., and P. J. Havanac, 1973: Compendium of Meteorological Satellitesand Instrumentation. NSSDC 73-02, National Space Science Data Center, NASA,Goddard Space Flight Center, Greenbelt, Md., 500 pp.
Taljaard, J. J., H. van Loon, H. L. Crutcher, and R. L. Jenne, 1969: Climate ofthe Upper Air: Southern Hemisphere. Vol. I, Temperatures, Dewpoints,and Heights at Selected Pressure Levels. NAVAIR 50-1C-55, Chief of NavalOperations, Washington, D.C., 135 pp.
Taylor Ronald C., 1973: An Atlas of Pacific Islands Rainfall. Data Report 25,H1G-73-9, Hawaii Institute of Geophysics, University of Hawaii.
U. S. Department of Agriculture, 1951: Fluctuations in Crop and Weather, 1866-1948. Statistics Bull. No. 101. Superintendent of Documents, GovernmentPrinting Office, Washington, D.C., 183 pp.
U. S. Department of Agriculture, 1973: Agricultural Statistics, 1973, U.S.Department of Agriculture, Government Printing Office, Washington, D.C.
U. S. Department of Commerce, 1964: History and Catalogue of Upper Air Data forthe Period 1946-1960, (key to meteorological records documents No. 5.21.).Superintendent of Documents, Government Printing Office, Washington, D.C.(Prepared by NCC, Asheville, N.C., for U.S. and Canadian stations, domesticand overseas.)
U. S. Department of Commerce, NOAA, 1948-: Monthly Climatic Data of the World,National Climatic Center, Asheville, N.C.
U. S. Department of Commerce, NOAA, yearly; Atmosphere Turbidity and PrecipitationChemistry Data for the World. National Climatic-Center, Asheville, N.C.
U. S. Department of Commerce, NOAA, monthly; High Altitude Meteorological Data.National Climatic Center, Asheville, N.C.
van Loon, H., R. L. Jenne, and K. Labitzke, 1972: Climatology of the stratospherein the Northern Hemisphere. 2, Geostrophic winds at 100, 50, 30, and 10 mb.Meteor. Abh. 100, 5.
Vonder Haar, Thomas H., and James S. Ellis, 1974: Atlas of Radiation BudgetMeasurements from Satellites (1962-1970). Atmospheric Sciences Paper No. 231,Department of Atmospheric Sciences, Colorado State University, Ft. Collins,Colo., 180 pp and microfilm.

191
Washington, W. M., and L. G. Thiel, 1970:Surface Temperatures. Technical NoteAtmospheric Research, Boulder, Colo.,
Digitized Global Monthly Mean OceanNCAR TN-54, National Center for30 pp.
Weigle, W. F., and B. R. Mendenhall, 1974: Climatology of the Upper ThermalStructure of the Seas. Proj. M-196 for the U.S. Navy, MeteorologyInternational Inc., Monterey, Calif.
World Meteorological Organization, 1972: Catalogue of Meteorological Data forResearch. WMO-No. 174, T.P. 86, Geneva. (The listings were prepared inabout 1968.)
Zipser, E. J., and R. C. Taylor, 1968: A Catalog of Meteorological Data ObtainedDuring the Line Islands Experiment. Technical Note NCAR TN-35, NationalCenter for Atmospheric Research, Boulder, Colo., 318 pp.

I
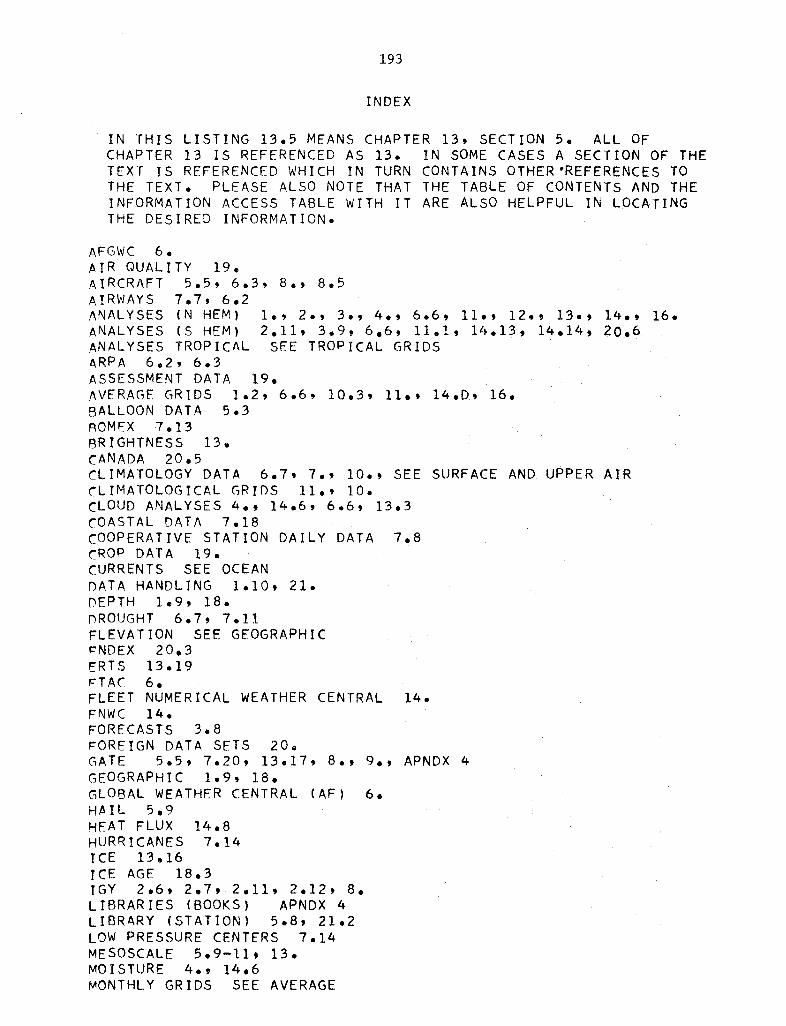
193
INDEX
IN THIS LISTING 13.5 MEANS CHAPTER 13, SECTION 5. ALL OFCHAPTER 13 IS REFERENCED AS 13. IN SOME CASES A SECTION OF THETEXT IS REFERENCED WHICH IN TURN CONTAINS OTHER'REFERENCES TOTHE TEXT. PLEASE ALSO NOTE THAT THE TABLE OF CONTENTS AND THEINFORMATION ACCESS TABLE WITH IT ARE ALSO HELPFUL IN LOCATINGTHE DESIRED INFORMATION.
AFGWC 6.AIR QUALITY 19.AIRCRAFT 5.5, 6.3, 8., 8.5AIRWAYS 7.7, 6.2ANALYSES (N HEM) 1., 2., 3*, 4., 6.6, 11., 129. 13., 14., 16.ANALYSES (S HEM) 2.11, 3.9, 6.6, 11.1, 14.13, 14.14, 20.6ANALYSES TROPICAL SEE TROPICAL GRIDSARPA 6.2, 6.3ASSESSMENT DATA 19.AVERAGE GRIDS 1.2, 6.6, 10.3, 11,9 14*D, 16.BALLOON DATA 5.3ROMEX 7.13BRIGHTNESS 13.CANADA 20.5CLIMATOLOGY DATA 6.79 7., 10., SEE SURFACE AND UPPER AIRCLIMATOLOGICAL GRIDS 11., 10.CLOUD ANALYSES 4., 14.6, 6.6, 13.3COASTAL DATA 7.18COOPERATIVE STATION DAILY DATA 7.8CROP DATA 19.CURRENTS SEE OCEANDATA HANDLING 1.10, 21.DEPTH 1.9, 18.DROUGHT 6.7, 7.11FLEVATION SEE GEOGRAPHICrNDEX 20.3ERTS 13.19FTAC 6.FLEET NUMERICAL WEATHER CENTRAL 14.FNWC 14.FORECASTS 3.8FOREIGN DATA SETS 20.GATE 5.5, 7.20, 13.17, 8., 9., APNDX 4GEOGRAPHIC 1.9, 18.GLOBAL WEATHER CENTRAL (AF) 6.HAIL 5.9HEAT FLUX 14.8HURRICANES 7.14ICE 13.16ICE AGE 18.3IGY 2*6, 2.7, 2.11, 2.12, 8.LIBRARIES (BOOKS) APNDX 4LIBRARY (STATION) 5.8, 21.2LOW PRESSURE CENTERS 7.14MESOSCALE 5.9-11 13.MOISTURE 4., 14.6MONTHLY GRIDS SEE AVERAGE

194
NATIONAL CENTER FOR ATMOSPHERIC RESEARCH SEE NCARNATIONAL CLIMATIC CENTER SEE NCCNATIONAL ENVIRONMENTAL SATELLITE SERVICE 13.NATIONAL METEOROLOGICAL CENTER SEE NMCNATIONAL OCEONOGRAPHIC DATA CENTER SEE NODCNATIONAL SPACE SCIENCE DATA CENTER 13.NCAR 1.NCC 7.NESS 13.NMC 2., 3., 4*2, 8.1NODC 15.NSSDC 13.OCEAN ANALYSES 14*, 14.C, 14.DOCEAN CURRENTS 14.11, 15.8OCEAN SOUNDINGS 14.B, 15.OZONE 5.2, 7.17, 13.15POLLUTION SEE AIR QUALITYRADAR 4.8, 5.9RADIATION SEE SATELLITE AND SOLARRAINFALL 4., 7.10, 6.2, 7.6, 7.8, 9., 10.RAWINSONDE, SEE UPPER AIRROCKETSONDE 7.5SATELLITE CENTER 13.SATELLITE DATA 13., 1.8SATELLITE SOUNDINGS 6.4, 8.1, 13., 13.9-14SEA LEVEL PRESSURE GRIDS 2., 6.6, 14.3SEA SURFACE WATER TEMPERATURE GRIDS 16., 13.12SEASAT 13.18SHIP OBSERVATIONS (SURFACE) 17., 9*. 14.15, 6.2SOIL TEMPERATURE 7.SOLAR 7.12, 13.SOLAR PROTONS, ETC 13.8, APNDX 4STRATOSPHERIC DATA 12., 13.STREAMFLOW 4.7, 20.5SURFACE OBSERVED DATA (MO MEANS) 1.6, 10.SURFACE SYNOPTIC DATA (SYNOP FILE) 1.5, 6.2, 14.15, 9.2, 17.SURFACE SYNOPTIC DATA (TIME SERIES FILE) 6.2, 6.5, 7.6, 9.3, 17.6TOWER DATA 5.1, 7.15TREE RINGS 10.4TROPICAL GRIDS 2.12, 3.5, 6.6, 14.12TURBIDITY 7.19UPPER AIR DATA (SYNOP FILE) 1.3, 8., 6.3UPPER AIR DATA (TIME SERIES) 1.4, 6.3, 7.3, 8.BUPPER AIR OBSERVED DATA (MO MEANS) 1.7, 10.VOLUME OF DATA 21.3WAVES 14.10, 13.18, 9., 17.WIND ANALYSES, DAILY 3., 6.6, 14.AWIND AT SURFACE SEE SURFACE OBSERVED AND AIRWAYSWINDS ALOFT 6.3, 7.4, SEE UPPER AIRWMO 20.2