Automatically Assessing Children’s Writing Skills Based on Age-Supervised Datasets
12
Transcript of Automatically Assessing Children’s Writing Skills Based on Age-Supervised Datasets
Automatically Assessing Children's Written Skills
Based on Age-supervised Datasets
Nelly Moreno, Sergio Jimenez and Julia Baquero
Universidad Nacional de Colombia, Bogotá
{nemorenoc,sgjimenezv,jmbaquerov}@unal.edu.co
Abstract. In this paper, we propose an approach for predicting theage of the authors of narrative texts written by children between 6 and13 years old. The features of the proposed model, which are lexical andsyntactical (part of speech), were normalized to avoid that the model usesthe length of the text as a predictor. In addition, the initial features wereextended using n-grams representations and combined using machinelearning techniques for regression (i.e. SMOreg). The proposed model wastested with collections of texts retrieved from Internet in Spanish, Frenchand English, obtaining mean-absolute-error rates in the age-predictiontask of 1.40, 1.20 and 1.72 years-old, respectively. Finally, we discuss theusefulness of this model to generate rankings of documents by writtenpro�ciency for each age.
1 Introduction
Children's writing skills increase as they progress in their process of languagelearning and education. It is commonly accepted that older children write richerand more complex texts than their younger counterparts. However, for any age(e.g. age 8) it is common to observe individuals with big di�erences in theirwriting skills. This paper explores the use of an age-prediction model, on thebasis of features extracted from texts written by children, to make inferencesabout their written pro�ciency. In particular, deviations from this model wereused to identify di�erences in the level of pro�ciency of individuals.
The development of children's writing skills has been studied consideringdi�erent levels of analysis. For instance, the evolution of the superstructureof narrative texts has been analyzed [5, 12, 23] as other approaches considermacrostructure and coherence [23]. Similarly, other features related to the textmicrostructure, cohesion and syntactic complexity have also been considered [1,5, 10].
The manual process of assessing the written production of students is a costlyand time-consuming task. Moreover, human cognitive limitations and other psy-chological factors a�ect assessments compromising quality and objectivity. Onlyrecently, the need to assist this process with automated tools has been recognized[8]. Current approaches for automatic evaluation of text employ a variety of tech-niques from natural language processing and machine learning �elds. Common

methods use features including bag-of-words representations, stylistic features[4], part-of-speech taggers [20, 3], syntactic parsers and latent semantic analysis[14, 13], among other approaches. Some practical applications of these methodsare automatic scoring of essays and written short answers [13].
One of the causes that have limited the widespread use of these tools istheir cost. For example, rule-based systems require careful tuning and mightfrequently need adjustment. Similarly, approaches that use supervised machinelearning techniques require a considerable amount of good quality training datato obtain suitable models. These issues have been addressed in other �elds byusing unlabeled data, cheap sources of supervision or even noisy data. Our ap-proach uses the age of the children as a source of low-cost supervision to builda model for written pro�ciency assessment.
The proposed method is inspired in a recommender system proposed by Be-cerra et al. [2], which is able to identify products that o�er to users high value fora low price. The approach consists of learning with a regression model to predictthe product's price, and deviations of particular products are used to identifyinteresting outliers. Thus, a product with a large (positive) di�erence betweenits predicted and actual price is considered a "good deal" and vice versa. Thatsystem, rather than relying on feedback from users, uses the price of the product(which is an inexpensive class variable) to provide predictions of value for theusers. That model exploits the average trend according to which more expensiveproducts o�er more value to the users. Analogously, we used the age of the texts'authors for assessing written pro�ciency, as Becerra et al. used products' pricefor assessing product value.
Recently, the task of predicting author's age from text was proposed, at arelatively large scale, in the past PAN workshop [18]. Most of the proposedapproaches used combinations of various lexical, syntactic and stylistic features[7, 15]. Similarity, our model followed the approach of Nguyen et al. [16] bycombining these features using a regression model.
For experimental evaluation, we gathered from the Internet three collectionsof documents in Spanish, French and English, which contain narrative textswritten by children of di�erent ages. Results obtained using several combinationsof text representations, feature sets and regression algorithms were reported anddiscussed. Although there is considerable variation in the writing skills amongchildren of the same age in our data, the average trend in the proposed modelobtained a fairly good correlation between predictions and actual ages.
In addition to the age-prediction experiments, we conducted a preliminarystudy with volunteers which we called �toy-study�. There, we asked participantsto predict the age of the authors of a set of narrative texts written by children inorder to assess the di�culty of the task for humans. Finally, we reviewed textsthat had large di�erences between their predictions and actual author's age,concluding that these di�erences provide promising clues for assessing writtenpro�ciency of their respective authors. For that, a few illustrative examples areprovided and discussed.
2 Predicting Children's Age from Text
2.1 A �Toy-study�
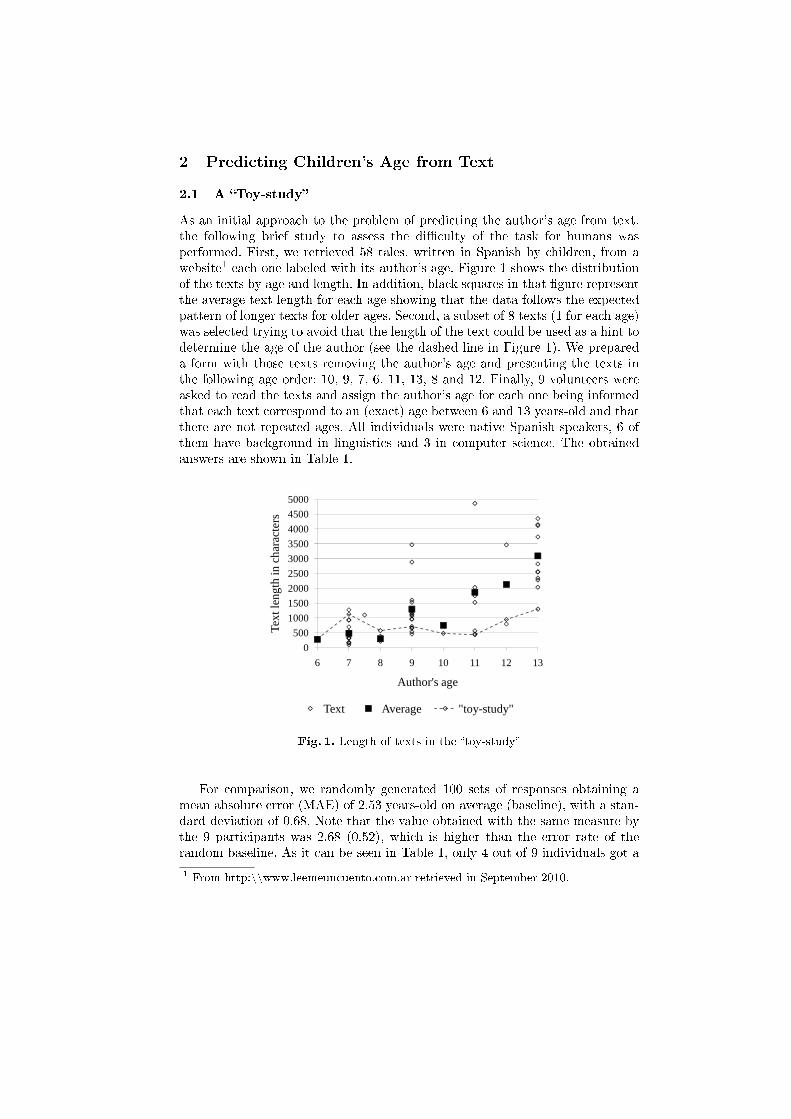
As an initial approach to the problem of predicting the author's age from text,the following brief study to assess the di�culty of the task for humans wasperformed. First, we retrieved 58 tales, written in Spanish by children, from awebsite1 each one labeled with its author's age. Figure 1 shows the distributionof the texts by age and length. In addition, black squares in that �gure representthe average text length for each age showing that the data follows the expectedpattern of longer texts for older ages. Second, a subset of 8 texts (1 for each age)was selected trying to avoid that the length of the text could be used as a hint todetermine the age of the author (see the dashed line in Figure 1). We prepareda form with those texts removing the author's age and presenting the texts inthe following age order: 10, 9, 7, 6, 11, 13, 8 and 12. Finally, 9 volunteers wereasked to read the texts and assign the author's age for each one being informedthat each text correspond to an (exact) age between 6 and 13 years-old and thatthere are not repeated ages. All individuals were native Spanish speakers, 6 ofthem have background in linguistics and 3 in computer science. The obtainedanswers are shown in Table 1.
1000
1500
2000
2500
3000
3500
4000
4500
5000
Text
leng
th in
ch
arac
ters
0
500
1000
6 7 8 9 10 11 12 13
Text
leng
th in
ch
arac
ters
Author's age
Text Average "toy-study"
Fig. 1. Length of texts in the �toy-study�
For comparison, we randomly generated 100 sets of responses obtaining amean absolute error (MAE) of 2.53 years-old on average (baseline), with a stan-dard deviation of 0.68. Note that the value obtained with the same measure bythe 9 participants was 2.68 (0.52), which is higher than the error rate of therandom baseline. As it can be seen in Table 1, only 4 out of 9 individuals got a
1 From http:\\www.leemeuncuento.com.ar retrieved in September 2010.

Table 1. �Toy-study� answers sheet (units for all data are 'years old')
text 1 text 2 text 3 text 4 text 5 text 6 text 7 text 8 †MAEindividual #1 6 9 11 13 10 12 7 8 2.75individual #2 6 12 13 10 8 11 7 9 3.25individual #3 9 10 12 8 6 13 7 11 2.00individual #4 6 7 9 12 11 8 10 13 2.75individual #5 6 7 13 10 9 12 8 11 2.50individual #6 6 7 11 13 8 9 10 12 3.25individual #7 8 10 13 9 6 12 7 11 2.50individual #8 7 6 12 13 8 10 9 11 3.25individual #9 8 7 12 6 8 13 9 10 1.88
average 6.89 8.33 11.78 10.44 8.22 11.11 8.22 10.67 2.68std. deviation 1.17 2.00 1.30 2.51 1.64 1.76 1.30 1.50 0.52
real author's age 10 9 7 6 11 13 8 12 0.00
† Henceforth, MAE stands for mean-absolute error
lower error rate than the baseline. These results suggest that the prediction ofauthors age based on the text seems to be a di�cult task for humans.
2.2 Regression for Age Prediction
In the past, the age prediction task based on text has been addressed mainlyusing classi�cation models [17]. However, the use of regression models for thistask has been only recently proposed by Nguyen et al. [16]. In this approach, ageis considered as a continuous and ordinal variable. Our approach is similar tothe method proposed by them, in which texts are represented in a vector spacemodel indexed by words, POS tags and bigrams of POS tags.
Generalization is a desirable factor for any prediction model, and in particu-lar, for a regression model for the age prediction task. An alternative to achieve agood degree of generalization is to use simple linear regression models. Although,these minimum-error models provides good interpretability, other discriminativemodels such as support vector machines [6] have shown to provide better gen-eralization conditioned on a good regularization and low model complexity. Forour age prediction model we used a simple linear model and SMO reg. [22, 21],which is an adaptation of the well-known SVM model for regression.
In order to measure the amount of over�tting we should expect when trainingthe model with and unseen dataset, the generalization property of the model wasassessed by doing random divisions into train and test datasets. A model thatlearns an e�ective regularized function from the entire dataset should have alower error rate than one that only uses a portion for training. In addition,several random splits have to be made to assess the statistical signi�cance of thedi�erence in error rate among the two regression models. In our experiments,data was divided into 66.6% for training and 33.3% for testing in 30 di�erentrandom splits.
Another issue that concerns generalization is the fact that representationsbased on words usually involve high-dimensional sparse feature spaces. Although,

texts written by children usually contain less than 500 words (see Figure 2), thevocabulary size reaches thousands of words. Using the vector space model, eachtext is represented as a vector with zeroes in the majority of dimensions. If thenumber of texts is considerably smaller than the size of the vocabulary, thishigh-dimensional space leads to over�tted regressors. For instance, in a shorttext with a rich vocabulary, which isn't common to the rest of the texts, theregression model �ts the age prediction due to the occurrence of low-frequencywords. This problem can be alleviated by dimensionality reduction techniquessuch as latent semantic analysis (LSA) [9] or mapping the words to a smaller setof features such as POS tags. In our experiments, we have trained regressors inthe vector space model [19] indexed by words or POS tags and in reduced latentsemantic spaces as well.
Regarding the distribution of texts per age in the dataset, a uniform dis-tribution is preferable. In our experiments, we provided one balanced dataset(English) and two unbalanced datasets (Spanish and French). Particularly, inthe French dataset, 70% of the texts belong to ages between 7 and 8. Thus, avery low error rate can be achieved predicting 7.5 years-old for all instances.Finally, another important factor that must be considered is the fact that thelength of the texts is highly correlated with the author age (see Figures 1 and 2).For the task at hand, it is mandatory to normalize all instances in order to avoidmisleading predictions regarding this issue. Therefore, the vectors associated toall the used feature sets were scaled in a way that all of them have a Euclideannorm of 1.
3 Experimental Evaluation
The aim of the proposed experiments is to determine to what extend the age ofa child can be determined from his (or her) written production. To do this, wetested various con�gurations of document collections, feature sets and regressionalgorithms
3.1 Datasets
The data consist of texts labeled with the age of their authors, which wereretrieved from di�erent Internet sources (see Table 2). The number of texts foreach language is: 484 texts for Spanish, 662 for French and 1,800 for English.The distributions of the number of texts for each age in the datasets in Spanishand French are shown in Figure 2. The English dataset is balanced becauseit contains 200 texts for each age between 7 and 15 years old. The averagelength of the texts and their standard deviations are also depicted in Figure2. Regarding the genre of the texts, the Spanish dataset consists of narrativetexts, while the French and English datasets also include descriptive, expositoryand argumentative texts. Some automatic and manual preprocessing tasks wereperformed in order to clean up the texts by removing html tags, website names,author's age and other irrelevant information.

Table 2. Languages and source URLs of the collected texts
Language and source URL Retrieved inSpanish http://www.pekegifs.com Jan 2011Spanish http://www.pequelandia.org Jan 2011Spanish http://www.leemeuncuento.com.ar Nov 2010Spanish http://www.puroscuentos.com.mx Jan 2011Spanish http://www.escritoresninyosyjovenes.es.tl Feb 2011Spanish http://www.elhuevodechocolate.com Jan 2011Spanish http://www.morellajimenez.com.do May 2011Spanish http://www.encuentos.com May 2011French http://www.kidadoweb.com Feb 2011English http://www.edbydesign.com/ Jun 2011
20406080
100120140160180
Nu
mb
er o
f tex
ts
020
5 6 7 8 9 10 11 12 13 14 15 16
Nu
mb
er o
f te
xts
Author's age
Spanish dataset French dataset
450500
Ave
rage
wor
d co
unt p
er
text
300350400
Ave
rage
wor
d co
unt p
er
text
200250300
Ave
rage
wor
d co
unt p
er
text
100150200
Ave
rage
wor
d co
unt p
er
text
050
100
Ave
rage
wor
d co
unt p
er
text
0
5 6 7 8 9 10 11 12 13 14 15 16
Author's Age
Spanish Dataset French Dataset English DatasetSpanish Dataset French Dataset English Dataset
Fig. 2. Number of texts and text length histograms for all datasets
3.2 Features
Lexical and syntactic features were extracted from the texts to produce di�erentrepresentations of the texts using words or POS tags provided by automatic toolssuch as TreeTagger (Spanish, English and French) [20] and Freeling (Spanishand French) [3]. Additional representations were obtained generating bigramsof words or POS tags. Subsequently, these representations were processed bythe �lter StringToWordVector, provided by WEKA [11], using vector normaliza-tion and converting all characters to lowercase. Also, alternative sets of vectorswere obtained either by selecting the options `occurrences' or `frequencies' inthe StringToWordVector �lter, which means that the occurrence of a featureis represented by a binary indicator variable or the number of times that thisfeature occurs. Another text representations were provided by LSA [9] and a setof stylistic features (see De-Arteaga et al. [7]).
The naming convention to identify each feature set is as follows. The pre�xes`word', `TT' or `FL' identify representations of words and POS tags provided byTreeTagger or Freeling respectively. If these representations are transformed bybigrams or LSA, then the name includes `2g' or `lsa' respectively. To identify theusage of occurrences or frequencies, an `o' or `f' are added to the name. Finally,

if the feature set includes the set of stylistic features, then the su�x `s' is added.For instance, `TT.2g.o.s' represents a feature set of bigrams of POS tags providedby TreeTagger using occurrences and including the stylistic feature set.
3.3 Regression Models
The di�erent sets of vectors, presented in the previous subsection, were used tobuild regression models to predict the age of the author for an unseen text. Threeregression models were used in our experiments. First, decision stump, a �weaklearner�, which is a single-level decision tree adapted for regression. Second, thesimple linear regression, which is the classic least squares estimator for a linearmodel. Finally, the SMO.Reg model, which is an adaptation of the popular SVMalgorithm for regression. For the latter, we use a Gaussian kernel with γ = 0.01and the complexity parameter C = 1.0.
The measures employed to evaluate the performance of the regression modelwere the Pearson correlation coe�cient (r) and mean-absolute error (MAE).Two baselines are provided using these measures (see Table 3). The �rst, labeled�age average�, is a model that always predicts the average age of the on eachdataset. In the second, we produced 100 sets of predictions by generating randompredictions of age with the same distribution as the data for each language. Theaverage from these 100 runs and standard deviation is reported. Given that theEnglish dataset has a uniform age distribution, only the �rst baseline is providedfor this dataset. As expected, both baselines obtained a value for r very close to0.
Table 3. Baselines for experiments
Age average Random 100 runsr MAE r MAE
Spanish 0.00 1.91 0.00 2.45(0.07)French 0.00 1.34 0.00 1.88(0.05)English 0.00 2.22 na na
3.4 Results
Table 4 summarizes the results of all the experiments that were carried out usingthe data mining framework WEKA [11]. Columns �Feat. set� and �#Feat.� pro-vide the name of the feature set and the number of these. For the three regressionalgorithms (decision stump, simple linear regression and SMO.Reg), the averageresults of 30 runs corresponding to random training-test divisions (66.6%-33.3%)of the datasets are reported. Results marked with * are signi�cantly better thanthe result obtained by decision stump, using the paired T-test with p < 0.05.
It can be seen that, in general terms, the SMO.Reg regressor performs betterthan the other algorithms. Regarding the choice of occurrence/frequency, Table
9
10
11
12
13
14Pr
edic
ted
age
Spanish
6
7
8
9
6 7 8 9 10 11 12 13
Pred
icte
d ag
e
True age
9
10
11
12
13
14
15
Pred
icte
d ag
e
French
5
6
7
8
9
5 6 7 8 9 10 11 12 13 14 15 16
Pred
icte
d ag
e
True age
10
11
12
13
14
15
Pred
icte
d ag
e
English
7
8
9
10
7 8 9 10 11 12 13 14 15
Pred
icte
d ag
e
True age
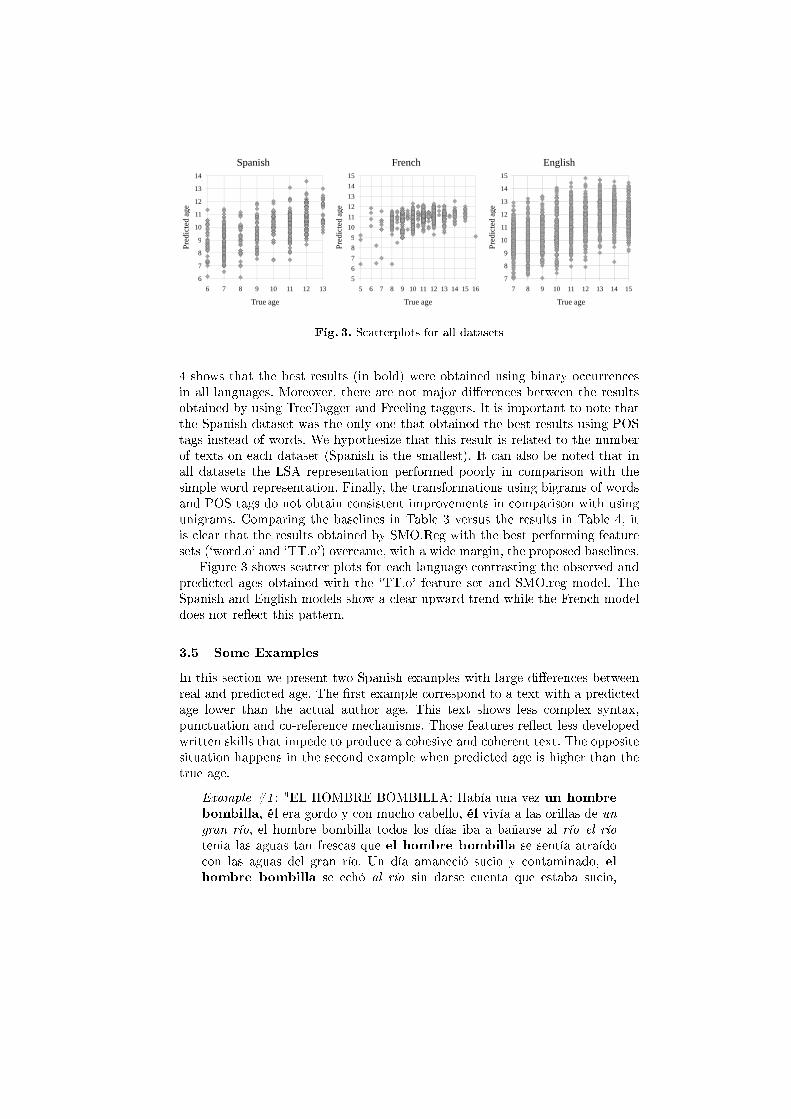
Fig. 3. Scatterplots for all datasets
4 shows that the best results (in bold) were obtained using binary occurrencesin all languages. Moreover, there are not major di�erences between the resultsobtained by using TreeTagger and Freeling taggers. It is important to note thatthe Spanish dataset was the only one that obtained the best results using POStags instead of words. We hypothesize that this result is related to the numberof texts on each dataset (Spanish is the smallest). It can also be noted that inall datasets the LSA representation performed poorly in comparison with thesimple word representation. Finally, the transformations using bigrams of wordsand POS tags do not obtain consistent improvements in comparison with usingunigrams. Comparing the baselines in Table 3 versus the results in Table 4, itis clear that the results obtained by SMO.Reg with the best performing featuresets (`word.o' and `TT.o') overcame, with a wide margin, the proposed baselines.
Figure 3 shows scatter plots for each language contrasting the observed andpredicted ages obtained with the `TT.o' feature set and SMO.reg model. TheSpanish and English models show a clear upward trend while the French modeldoes not re�ect this pattern.
3.5 Some Examples
In this section we present two Spanish examples with large di�erences betweenreal and predicted age. The �rst example correspond to a text with a predictedage lower than the actual author age. This text shows less complex syntax,punctuation and co-reference mechanisms. Those features re�ect less developedwritten skills that impede to produce a cohesive and coherent text. The oppositesituation happens in the second example when predicted age is higher than thetrue age.
Example #1 : "EL HOMBRE BOMBILLA: Había una vez un hombre
bombilla, él era gordo y con mucho cabello, él vivía a las orillas de ungran río, el hombre bombilla todos los días iba a bañarse al río el ríotenia las aguas tan frescas que el hombre bombilla se sentía atraídocon las aguas del gran río. Un día amaneció sucio y contaminado, elhombre bombilla se echó al río sin darse cuenta que estaba sucio,

Table 4. Age prediction results for all datasets. Results marked with * were signi�-cantly better in comparison to decision stump.
Decision Stump Simple Linear Reg. SMO Reg.
†Feat. set #Feat. r MAE r MAE r MAE
Spanish
word.o 5,892 0.35(0.06) 1.73(0.07) 0.42(0.05) 1.69(0.06) 0.48(0.05)* 1.59(0.06)*
word.lsa 386 0.35(0.06) 1.74(0.06) 0.46(0.05)* 1.65(0.07) 0.41(0.05) 1.70(0.07
word.2g.o 10,691 0.30(0.06) 1.77(0.07) 0.24(0.07) 1.83(0.06) 0.55(0.04)* 1.54(0.06)*
TT.o 63 0.30(0.06) 1.79(0.06) 0.26(0.05) 1.81(0.06) 0.61(0.04)* 1.45(0.07)*
TT.2g.o 1,433 0.33(0.06) 1.75(0.07) 0.35(0.06) 1.74(0.07) 0.49(0.03)* 1.62(0.06)*
TT.o.s 82 0.37(0.05) 1.72(0.07) 0.43(0.04) 1.69(0.05) 0.50(0.04) 1.56(0.06) *
FL.o 3,845 0.32(0.06) 1.75(0.08) 0.45(0.04)* 1.67(0.06)* 0.48(0.04)* 1.58(0.06)*
FL.2g.o 4,082 0.35(0.05) 2.16(0.07) 0.44(0.05)* 2.06(0.07)* 0.48(0.04)* 1.94(0.07)*
French
word.o 6,894 0.10(0.07) 1.35(0.07) 0.03(0.05) 1.36(0.07) 0.36(0.04)* 1.23(0.06)*
word.lsa 507 0.06(0.06) 1.35(0.07) 0.09(0.07) 1.34(0.06) 0.19(0.04)* 1.36(0.06)
TT.o 46 0.08(0.07) 1.33(0.07) 0.10(0.07) 1.32(0.06) 0.27(0.06)* 1.29(0.06)*
TT.f 46 0.12(0.05) 1.33(0.07) 0.11(0.06) 1.33(0.07) 0.28(0.04)* 1.27(0.06)*
TT.2g.o 818 0.13(0.06) 1.35(0.06) 0.09(0.05) 1.35(0.06) 0.29(0.05)* 1.34(0.06)*
TT.2g.f 818 0.13(0.06) 1.35(0.06) 0.07(0.06) 1.35(0.07) 0.30(0.05)* 1.28(0.05)*
TT.o.s 55 0.17(0.07) 1.34(0.06) 0.23(0.06) 1.31(0.06) 0.24(0.05) 1.32(0.05)
English
word.o 6,478 0.57(0.02) 1.72(0.04) 0.50(0.04)* 1.85(0.04) 0.77(0.01)* 1.32(0.03)*
word.lsa 1,098 0.34(0.03) 2.04(0.05) 0.37(0.03) 2.01(0.04) 0.60(0.02)* 1.70(0.04)*
TT.o 84 0.42(0.03) 1.96(0.04) 0.35(0.05) 2.06(0.04) 0.49(0.03) 1.84(0.04)*
TT.2g.o 2146 0.56(0.03) 1.74(0.04) 0.48(0.04)* 1.90(0.03) 0.66(0.02) 1.54(0.4)*
TT.o.s 72 0.57(0.02) 1.71(0.04) 0.35(0.06) * 2.02(0.04) 0.52(0.02) * 1.80(0.04)
† o: occurrence, f: frequency, TT: TreeTagger, FL: Freeling, 2g: bigrams, s: stylisticfeatures
para el otro día el hombre bombilla amaneció enfermo que nunca ledieron ganas de ir a bañarse, de miedo de encontrar la muerte en el riosucio y contaminado." [true age 11, predicted age 7.39]
Example #2 : "El niño que no obedecía: Erase una vez un niño que noobedecía a sus padres y siempre se perdía. Sus padres le advirtieron queno fuera al bosque pero él como siempre no les hizo caso y se perdió.Cuando se había divertido mucho se dio cuenta que se había perdido yentonces grito, !PAPA! !MAMA!. y se sentó en un árbol y lloro y lloro.Admitió que se portó mal. Entonces alguien le contestó. Le dijo !Por �nlo has admitido!. ¾Quién ha dicho eso dijo el niño?. He sido yo, he sidoyo. y quien eres tú? Soy yooooooo el árbol. Y tu cómo te llamas señorárbol? Sooooy el árboool de laaa verdaaad. Árbol de la verdad que nuncamientes, ¾me puedes decir donde están mis padres? No te acuerdas quehoy os ibais a mudar? AH! sí. Pero qué podré hacer para encontrarlos?Pues supongo que tendrás que viajar. Bien veamos.... La mudanza era

a Francia. Paso un día, ando y ando hasta que cayó en las arenas deuna playa y dijo el niño: ¾Qué es eso que brilla en el suelo?. Resultoque eran diamantes. Por muy joven que sea ya era rico y por los cartelesque enseñaban de él, al �nal se dieron cuenta sus padres y gracias alos carteles pudo regresar con sus padres y les dijo: !PAPA! !MAMA!os prometo que de ahora en adelante os obedeceré y fue todo gracias alárbol de la verdad." [true age 7, predicted age 11.91]
In these examples, we can see that the author of the second text uses, in a greaterextent, references mechanisms, punctuation marks, and di�erent in�ected formsof verbs. With regard to reference mechanisms, in the �rst example the authoruses, frequently, noun phrases for reference and co-reference. Note how the au-thor refers to entities �el hombre bombilla� (in bold) and �el rio� (in italics):mainly referred through noun phrases. In the second example, in addition tonoun phrases, the author uses another reference mechanisms to refer to the enti-ties �el niño� (in bold) and �el árbol� (in italics) such as pronominal phrases withpersonal pronouns (yo, él and tu); object pronouns (le, te and me); inde�nitepronouns (alguien) and interrogative pronouns (quién). On the other hand, inthe second example we can see a wider range of punctuation marks. For instance,in addition to comma [,] and full stop [,] used in the �rst text, the second authoruses question and exclamation marks [¾?½!], colon [:] and ellipsis [...]. Finally, letus consider the verbs used in the two texts. In the second one, unlike the �rst,based on TreeTagger and Freeling tags, it is possible to observe a wider mor-phological paradigm which includes non-�nite verbs (participle and in�nitive),and �nite forms (principal, auxiliary and modal verbs) in di�erent tense (past,present, future) and mood, and verbal periphrasis (haber+participle). In con-clusion, the written pro�ciency di�ers importantly and the divergences againstthe age predicted by the model clearly reveal this situation.
4 Discussion
The results shown in the Table 4, the scatter plots in Figure 3 and the examplesin subsection 3.5 indicate that our method can identify patterns which makepossible to predict the authors' age. Scatter plots show, qualitatively, that thebest results were obtained for the Spanish dataset in which it can observe a clearcorrelation between true and predicted age. Interestingly, for the three datasets,the linear pattern increasing between true and predicted age does not hold forages above 12. These graphs also show the rankings obtained for each age. In theFrench dataset, regression models have di�culty �nding appropriate patterns,probably, due to the distribution of the ages of the authors, which is highlyconcentrated in the range of 9 to 12 years (see Figure 2). This highlights theimportance of a balanced dataset for obtaining meaningful models and results.
The examples analyzed in subsection 3.5 show that the deviations of the trueage and the proposed model manage to reveal either good or poor writing skillsaccording to the signs of these deviations. Although it is not possible to make ageneral statement based on the observation of these data issues, this result is a
promising research direction. Clearly, in order to probe the hypothesis that thedeviations from a prediction model of age are predictors of written pro�ciency,these deviations should be proved and correlated with a gold standard built onpro�ciency assessments.
5 Conclusion
An age prediction model for texts written by children between 6 and 13 years oldwas proposed using words and POS tags as features (unigrams and bigrams) anda regression model for combination. The proposed method obtained considerablybetter correlations and lower error rates than the plausible baselines. In addition,we showed that humans perform poorly (close to a random baseline) in theage-prediction task from text in a much simpler scenario compared with theexperimental setup used for the evaluation of our model. Finally, we showedthat deviations of the true age against the predictions provided by our modelare useful for assessing the level of written pro�ciency for children.
References
1. C. Aguilar. Análisis de frecuencias de construcciones anafóricas en narracionesinfantiles. Estudios de Lingüística Aplicada, 22(38):33�43, 2003.
2. C. Becerra, F. Gonzalez, and A. Gelbukh. Visualizable and explicable recom-mendations obtained from price estimation functions. In Proceedings of the RecSys2011 Workshop on Human Decision Making in Recommender Systems (Decisions@RecSys' 11), pages 27�34, Chicago, IL, 2011.
3. X. Carreras, I. Chao, and P. Lluis. FreeLing: an open-source suite of language an-alyzers. In Proceedings of the 4th International Conference on Language Resourcesand Evaluation (LREC'04), Barcelona, Spain, 2004.
4. N. Cheng, R. Chandramouli, and K. Subbalakshmi. Author gender identi�cationfrom text. Digital Investigation, 8(1):78�88, 2011.
5. J.-M. Colletta, C. Pellenq, and M. Guidetti. Age-related changes in co-speechgesture and narrative: Evidence from french children and adults. Speech Commu-nication, 52(6):565�576, June 2010.
6. C. Cortes and V. N. Vapnik. Support-vector networks. Machine Learning,20(3):273�297, 1995.
7. M. De-Arteaga, S. Jimenez, G. Dueñas, S. Mancera, and J. Baquero. Authorpro�ling using corpus statistics, lexicons and stylistic features. In Online WorkingNotes of the 10th PAN evaluation lab on uncovering plagiarism, authorship. andsocial misuse, CLEF 2013, Valencia, Spain, Sept. 2013.
8. S. Dikli. An overview of automated scoring of essays. Journal of Technology,Learning and Assessment, 5(1), Aug. 2006.
9. S. Dumais. Latent semantic analysis. Annual review of information science andtechnology, 38(1):188�230, 2004.
10. R. Furman and A. Özyürek. Development of interactional discourse markers: In-sights from turkish children's and adults' oral narratives. Journal of Pragmatics,39(10):1742�1757, Oct. 2007.

11. M. Hall, F. Eibe, G. Holmes, and B. Pfahringer. The WEKA data mining software:An update. SIGKDD Explorations, 11(1):10�18, 2009.
12. H. Ilgaz and A. Aksu-Koç. Episodic development in preschool children's play-prompted and direct-elicited narratives. Cognitive Development, 20(4):526�544,Oct. 2005.
13. T. Kakkonen, N. Myller, J. Timonen, and E. Sutinen. Automatic essay gradingwith probabilistic latent semantic analysis. In Proceedings of the second workshopon Building Educational Applications Using NLP, EdAppsNLP 05, pages 29�36,Stroudsburg, PA, USA, 2005. Association for Computational Linguistics.
14. T. Landauer. Pasteur's quadrant: Computational linguistics, LSA, and education.In Proceedings of the HLT-NAACL 03 Workshop on Building Educational Appli-cations Using Natural Language Processing, Edmonton, Canada, 2003.
15. A. P. López-Monroy, M. Montes-y Gómez, H. J. Escalante, L. Villaseñor-Pineda,and E. Villatoro-Tello. INAOE's participation at PAN'13: author pro�ling tasknotebook for PAN at CLEF 2013. In Online Working Notes of the 10th PAN eval-uation lab on uncovering plagiarism, authorship. and social misuse, CLEF 2013,Valencia, Spain, Sept. 2013.
16. D. Nguyen, N. A. Smith, and C. P. Rosé. Author age prediction from text usinglinear regression. In Proceedings of the 5th ACL-HLT Workshop on Language Tech-nology for Cultural Heritage, Social Sciences, and Humanities, LaTeCH '11, pages115�123, Stroudsburg, PA, USA, 2011. Association for Computational Linguistics.
17. J. W. Pennbaker and L. D. Stone. Words of wisdom: Language use over the lifespan. Journal of Personality and Social Psychology, 85(2):291�301, Aug. 2003.
18. F. Rangel, P. Rosso, M. Koppel, E. Stamatatos, and G. Inches. Overview of theauthor pro�ling task at PAN 2013. In Online Working Notes of the 10th PAN eval-uation lab on uncovering plagiarism, authorship. and social misuse, CLEF 2013,Valencia, Spain, Sept. 2013.
19. G. Salton, A. K. C. Wong, and C.-S. Yang. A vector space model for automaticindexing. Commun. ACM, 18(11):613�620, 1975.
20. H. Schmid. Probabilistic part-of-speech tagging using decision trees. In Proceedingsof International Conference on New Methods in Language Processing, Manchester,UK, 1994.
21. S. Shevade, S. Keerthi, C. Bhattacharyya, and K. Murthy. Improvements to theSMO algorithm for SVM regression. IEEE-NN, 11(5):1188�1193, 2000.
22. A. J. Smola. Learning with Kernels. GMD Forschungszentrum Informationstech-nik, Sankt Augustin, 1998.
23. M. A. Stadler and G. C. Ward. Supporting the narrative development of youngchildren. Early Childhood Education Journal, 33(2):73�80, Oct. 2005.