DungarvanObserver - You're automatically being redirected to ...
Upload
khangminh22Category
view
0download
0
Automatically generating hypertext by computing semanticsimilarity
Stephen J. Green
University of TorontoComputer Systems Research Group
Technical Report number 3661
October 14, 1997
1This work is the author’s Ph.D. thesis from the Department of Computer Science of the University ofToronto

Abstract
We describe a novel method for automatically generating hypertext links within and betweennewspaper articles. The method is based on lexical chaining, a technique for extracting the setsof related words that occur in texts. Links between the paragraphs of a single article are built byconsidering the distribution of the lexical chains in that article. Links between articles are built byconsidering how the chains in the two articles are related. By using lexical chaining we mitigatethe problems of synonymy and polysemy that plague traditional information retrieval approachesto automatic hypertext generation.
In order to motivate our research, we discuss the results of a study that shows that humansare inconsistent when assigning hypertext links within newspaper articles. Even if humans wereconsistent, the time needed to build a large hypertext and the costs associated with the productionof such a hypertext make relying on human linkers an untenable decision. Thus we are left toautomatic hypertext generation.
Because we wish to determine how our hypertext generation methodology performs whencompared to other proposed methodologies, we present a study comparing the hypertext linkingmethodology that we propose with a methodology based on a traditional information retreival ap-proach. In this study, subjects were asked to perform a question-answering task using a combina-tion of links generated by our methodology and the competing methodology. We show combinedresults for all subjects tested, along with results based on subjects’ experience in using the WorldWide Web.
We detail the construction of a system for performing automatic hypertext generation in thecontext of an online newspaper. The proposed system is fully capable of handling large databasesof news articles in an efficient manner.

Contents
1 Introduction 71.1 Current efforts in Web-based news : : : : : : : : : : : : : : : : : : : : : : : : : : : : : : : : : : : : : : : : : : : : : : : : : : : 71.2 Large-scale hypertexts : : : : : : : : : : : : : : : : : : : : : : : : : : : : : : : : : : : : : : : : : : : : : : : : : : : : : : : : : : : : : : : 81.3 Automatic hypertext generation : : : : : : : : : : : : : : : : : : : : : : : : : : : : : : : : : : : : : : : : : : : : : : : : : : : : : : 9
2 Background and previous work 102.1 The structure of newspaper articles : : : : : : : : : : : : : : : : : : : : : : : : : : : : : : : : : : : : : : : : : : : : : : : : : : : 102.2 Lexical chains : : : : : : : : : : : : : : : : : : : : : : : : : : : : : : : : : : : : : : : : : : : : : : : : : : : : : : : : : : : : : : : : : : : : : : : 10
2.2.1 An implementation of lexical chaining : : : : : : : : : : : : : : : : : : : : : : : : : : : : : : : : : : : : : 112.3 Information Retrieval : : : : : : : : : : : : : : : : : : : : : : : : : : : : : : : : : : : : : : : : : : : : : : : : : : : : : : : : : : : : : : : : 14
2.3.1 Measuring retrieval performance : : : : : : : : : : : : : : : : : : : : : : : : : : : : : : : : : : : : : : : : : : 142.3.2 Vector space models : : : : : : : : : : : : : : : : : : : : : : : : : : : : : : : : : : : : : : : : : : : : : : : : : : : : : : 152.3.3 Latent Semantic Indexing : : : : : : : : : : : : : : : : : : : : : : : : : : : : : : : : : : : : : : : : : : : : : : : : : 162.3.4 Thesauri and IR : : : : : : : : : : : : : : : : : : : : : : : : : : : : : : : : : : : : : : : : : : : : : : : : : : : : : : : : : : 162.3.5 Computational linguistics and IR : : : : : : : : : : : : : : : : : : : : : : : : : : : : : : : : : : : : : : : : : : 17
2.4 Manual hypertext construction : : : : : : : : : : : : : : : : : : : : : : : : : : : : : : : : : : : : : : : : : : : : : : : : : : : : : : : 182.4.1 Inter-linker consistency : : : : : : : : : : : : : : : : : : : : : : : : : : : : : : : : : : : : : : : : : : : : : : : : : : : 18
2.5 Automatic hypertext construction : : : : : : : : : : : : : : : : : : : : : : : : : : : : : : : : : : : : : : : : : : : : : : : : : : : : 202.5.1 Structural links : : : : : : : : : : : : : : : : : : : : : : : : : : : : : : : : : : : : : : : : : : : : : : : : : : : : : : : : : : : 212.5.2 Semantic links : : : : : : : : : : : : : : : : : : : : : : : : : : : : : : : : : : : : : : : : : : : : : : : : : : : : : : : : : : : : 21
2.6 Models of hypertext search : : : : : : : : : : : : : : : : : : : : : : : : : : : : : : : : : : : : : : : : : : : : : : : : : : : : : : : : : : 252.6.1 Paper versus electronic systems : : : : : : : : : : : : : : : : : : : : : : : : : : : : : : : : : : : : : : : : : : : 252.6.2 The role of domain and search expertise : : : : : : : : : : : : : : : : : : : : : : : : : : : : : : : : : : : : 262.6.3 When hypertext is most useful : : : : : : : : : : : : : : : : : : : : : : : : : : : : : : : : : : : : : : : : : : : : 27
3 Testing inter-linker consistency 293.1 Methodological issues : : : : : : : : : : : : : : : : : : : : : : : : : : : : : : : : : : : : : : : : : : : : : : : : : : : : : : : : : : : : : : : 293.2 The task : : : : : : : : : : : : : : : : : : : : : : : : : : : : : : : : : : : : : : : : : : : : : : : : : : : : : : : : : : : : : : : : : : : : : : : : : : : : 303.3 Results : : : : : : : : : : : : : : : : : : : : : : : : : : : : : : : : : : : : : : : : : : : : : : : : : : : : : : : : : : : : : : : : : : : : : : : : : : : : : 30
3.3.1 Examining the data : : : : : : : : : : : : : : : : : : : : : : : : : : : : : : : : : : : : : : : : : : : : : : : : : : : : : : : 303.3.2 Similarity results : : : : : : : : : : : : : : : : : : : : : : : : : : : : : : : : : : : : : : : : : : : : : : : : : : : : : : : : : 33
3.4 Discussion : : : : : : : : : : : : : : : : : : : : : : : : : : : : : : : : : : : : : : : : : : : : : : : : : : : : : : : : : : : : : : : : : : : : : : : : : : 35
1
4 Linking within the article 374.1 Analyzing the lexical chains : : : : : : : : : : : : : : : : : : : : : : : : : : : : : : : : : : : : : : : : : : : : : : : : : : : : : : : : : : 404.2 Determining paragraph links : : : : : : : : : : : : : : : : : : : : : : : : : : : : : : : : : : : : : : : : : : : : : : : : : : : : : : : : 40
4.2.1 Weighting chain density vectors : : : : : : : : : : : : : : : : : : : : : : : : : : : : : : : : : : : : : : : : : : : 404.2.2 Normalizing chain density vectors : : : : : : : : : : : : : : : : : : : : : : : : : : : : : : : : : : : : : : : : : 424.2.3 Calculating paragraph similarity : : : : : : : : : : : : : : : : : : : : : : : : : : : : : : : : : : : : : : : : : : 424.2.4 Deciding on the links : : : : : : : : : : : : : : : : : : : : : : : : : : : : : : : : : : : : : : : : : : : : : : : : : : : : : 444.2.5 Examining a connection : : : : : : : : : : : : : : : : : : : : : : : : : : : : : : : : : : : : : : : : : : : : : : : : : : : 454.2.6 Generating a hypertext representation : : : : : : : : : : : : : : : : : : : : : : : : : : : : : : : : : : : : : 47
4.3 Selecting representative hypertexts : : : : : : : : : : : : : : : : : : : : : : : : : : : : : : : : : : : : : : : : : : : : : : : : : : : 48
5 Linking between articles 515.1 Comparing chains across documents : : : : : : : : : : : : : : : : : : : : : : : : : : : : : : : : : : : : : : : : : : : : : : : : : 515.2 An initial approach : : : : : : : : : : : : : : : : : : : : : : : : : : : : : : : : : : : : : : : : : : : : : : : : : : : : : : : : : : : : : : : : : : 555.3 Synset weight vectors : : : : : : : : : : : : : : : : : : : : : : : : : : : : : : : : : : : : : : : : : : : : : : : : : : : : : : : : : : : : : : : : 56
5.3.1 Simple synset vectors : : : : : : : : : : : : : : : : : : : : : : : : : : : : : : : : : : : : : : : : : : : : : : : : : : : : : 575.3.2 Synset weight vectors : : : : : : : : : : : : : : : : : : : : : : : : : : : : : : : : : : : : : : : : : : : : : : : : : : : : : 585.3.3 Building inter-article links : : : : : : : : : : : : : : : : : : : : : : : : : : : : : : : : : : : : : : : : : : : : : : : : : 595.3.4 How related words affect linking : : : : : : : : : : : : : : : : : : : : : : : : : : : : : : : : : : : : : : : : : : 59
5.4 A preliminary test of inter-article links : : : : : : : : : : : : : : : : : : : : : : : : : : : : : : : : : : : : : : : : : : : : : : : : 605.4.1 Selecting topics : : : : : : : : : : : : : : : : : : : : : : : : : : : : : : : : : : : : : : : : : : : : : : : : : : : : : : : : : : : 605.4.2 Clustering documents : : : : : : : : : : : : : : : : : : : : : : : : : : : : : : : : : : : : : : : : : : : : : : : : : : : : 605.4.3 Clustering runs : : : : : : : : : : : : : : : : : : : : : : : : : : : : : : : : : : : : : : : : : : : : : : : : : : : : : : : : : : : 625.4.4 Discussion of results : : : : : : : : : : : : : : : : : : : : : : : : : : : : : : : : : : : : : : : : : : : : : : : : : : : : : : 62
6 Evaluating a linking methodology 666.1 Experimental Design : : : : : : : : : : : : : : : : : : : : : : : : : : : : : : : : : : : : : : : : : : : : : : : : : : : : : : : : : : : : : : : : 66
6.1.1 The task : : : : : : : : : : : : : : : : : : : : : : : : : : : : : : : : : : : : : : : : : : : : : : : : : : : : : : : : : : : : : : : : : 666.1.2 The questions and the database : : : : : : : : : : : : : : : : : : : : : : : : : : : : : : : : : : : : : : : : : : : : 676.1.3 Whose links to use? : : : : : : : : : : : : : : : : : : : : : : : : : : : : : : : : : : : : : : : : : : : : : : : : : : : : : : : 676.1.4 The evaluation system : : : : : : : : : : : : : : : : : : : : : : : : : : : : : : : : : : : : : : : : : : : : : : : : : : : : 686.1.5 Performing searches : : : : : : : : : : : : : : : : : : : : : : : : : : : : : : : : : : : : : : : : : : : : : : : : : : : : : : 71
6.2 Analysis : : : : : : : : : : : : : : : : : : : : : : : : : : : : : : : : : : : : : : : : : : : : : : : : : : : : : : : : : : : : : : : : : : : : : : : : : : : : 716.2.1 An initial look at the system : : : : : : : : : : : : : : : : : : : : : : : : : : : : : : : : : : : : : : : : : : : : : : : 716.2.2 Examining the data : : : : : : : : : : : : : : : : : : : : : : : : : : : : : : : : : : : : : : : : : : : : : : : : : : : : : : : 716.2.3 Inter-article links : : : : : : : : : : : : : : : : : : : : : : : : : : : : : : : : : : : : : : : : : : : : : : : : : : : : : : : : : 726.2.4 A two-dimensional model : : : : : : : : : : : : : : : : : : : : : : : : : : : : : : : : : : : : : : : : : : : : : : : : : 776.2.5 Viewed answers : : : : : : : : : : : : : : : : : : : : : : : : : : : : : : : : : : : : : : : : : : : : : : : : : : : : : : : : : : 816.2.6 Inter- and intra-article links : : : : : : : : : : : : : : : : : : : : : : : : : : : : : : : : : : : : : : : : : : : : : : : 82
6.3 Other results : : : : : : : : : : : : : : : : : : : : : : : : : : : : : : : : : : : : : : : : : : : : : : : : : : : : : : : : : : : : : : : : : : : : : : : : 846.3.1 Size of the database : : : : : : : : : : : : : : : : : : : : : : : : : : : : : : : : : : : : : : : : : : : : : : : : : : : : : : : 846.3.2 Preference for early links : : : : : : : : : : : : : : : : : : : : : : : : : : : : : : : : : : : : : : : : : : : : : : : : : : 84
6.4 Discussion : : : : : : : : : : : : : : : : : : : : : : : : : : : : : : : : : : : : : : : : : : : : : : : : : : : : : : : : : : : : : : : : : : : : : : : : : : 846.4.1 Implementation factors : : : : : : : : : : : : : : : : : : : : : : : : : : : : : : : : : : : : : : : : : : : : : : : : : : : 856.4.2 Task factors : : : : : : : : : : : : : : : : : : : : : : : : : : : : : : : : : : : : : : : : : : : : : : : : : : : : : : : : : : : : : : 866.4.3 The influence of the domain : : : : : : : : : : : : : : : : : : : : : : : : : : : : : : : : : : : : : : : : : : : : : : : 86
2

7 Deploying a system for a Web newspaper 887.1 Preparing the database : : : : : : : : : : : : : : : : : : : : : : : : : : : : : : : : : : : : : : : : : : : : : : : : : : : : : : : : : : : : : : 88
7.1.1 Lexical chaining : : : : : : : : : : : : : : : : : : : : : : : : : : : : : : : : : : : : : : : : : : : : : : : : : : : : : : : : : : 887.1.2 Building weighted synset vectors : : : : : : : : : : : : : : : : : : : : : : : : : : : : : : : : : : : : : : : : : : 897.1.3 Database updates : : : : : : : : : : : : : : : : : : : : : : : : : : : : : : : : : : : : : : : : : : : : : : : : : : : : : : : : : 907.1.4 Efficiency considerations : : : : : : : : : : : : : : : : : : : : : : : : : : : : : : : : : : : : : : : : : : : : : : : : : : 90
7.2 Serving articles over the Web : : : : : : : : : : : : : : : : : : : : : : : : : : : : : : : : : : : : : : : : : : : : : : : : : : : : : : : : : 917.2.1 The HyperTect client : : : : : : : : : : : : : : : : : : : : : : : : : : : : : : : : : : : : : : : : : : : : : : : : : : : : : : 927.2.2 The HyperTect server : : : : : : : : : : : : : : : : : : : : : : : : : : : : : : : : : : : : : : : : : : : : : : : : : : : : : 927.2.3 Efficiency issues : : : : : : : : : : : : : : : : : : : : : : : : : : : : : : : : : : : : : : : : : : : : : : : : : : : : : : : : : : 93
8 Contributions and suggestions for future work 948.1 Contributions : : : : : : : : : : : : : : : : : : : : : : : : : : : : : : : : : : : : : : : : : : : : : : : : : : : : : : : : : : : : : : : : : : : : : : : 94
8.1.1 Inter-linker consistency : : : : : : : : : : : : : : : : : : : : : : : : : : : : : : : : : : : : : : : : : : : : : : : : : : : 948.1.2 Linking methodology : : : : : : : : : : : : : : : : : : : : : : : : : : : : : : : : : : : : : : : : : : : : : : : : : : : : : 948.1.3 Evaluation : : : : : : : : : : : : : : : : : : : : : : : : : : : : : : : : : : : : : : : : : : : : : : : : : : : : : : : : : : : : : : : 958.1.4 Large-scale lexical chaining : : : : : : : : : : : : : : : : : : : : : : : : : : : : : : : : : : : : : : : : : : : : : : : 95
8.2 Suggestions for future work : : : : : : : : : : : : : : : : : : : : : : : : : : : : : : : : : : : : : : : : : : : : : : : : : : : : : : : : : : 968.2.1 Further evaluation : : : : : : : : : : : : : : : : : : : : : : : : : : : : : : : : : : : : : : : : : : : : : : : : : : : : : : : : 968.2.2 Lexical chaining : : : : : : : : : : : : : : : : : : : : : : : : : : : : : : : : : : : : : : : : : : : : : : : : : : : : : : : : : : 968.2.3 Typing links : : : : : : : : : : : : : : : : : : : : : : : : : : : : : : : : : : : : : : : : : : : : : : : : : : : : : : : : : : : : : : 978.2.4 Efficiency : : : : : : : : : : : : : : : : : : : : : : : : : : : : : : : : : : : : : : : : : : : : : : : : : : : : : : : : : : : : : : : : 978.2.5 A wider range of texts : : : : : : : : : : : : : : : : : : : : : : : : : : : : : : : : : : : : : : : : : : : : : : : : : : : : 988.2.6 Applying lexical-chaining techniques to traditional IR : : : : : : : : : : : : : : : : : : : : : : 98
References 99
Index 103
A The Toronto amalgamation article in hypertext format 105
B Instructions to subjects 110
C Post-task questionnaire 112
3

List of Tables
3.1 An adjacency matrix for the maple syrup article. : : : : : : : : : : : : : : : : : : : : : : : : : : : : : : : : : : : 313.2 Link counts by subject and article. : : : : : : : : : : : : : : : : : : : : : : : : : : : : : : : : : : : : : : : : : : : : : : : : 313.3 Summary of link counts per article. : : : : : : : : : : : : : : : : : : : : : : : : : : : : : : : : : : : : : : : : : : : : : : : 323.4 Summary matrix for the bank scandal article. : : : : : : : : : : : : : : : : : : : : : : : : : : : : : : : : : : : : : : 32
4.1 Lexical chains in the virtual parenting article. : : : : : : : : : : : : : : : : : : : : : : : : : : : : : : : : : : : : : : 384.2 Description of the paragraphs of the virtual parenting article : : : : : : : : : : : : : : : : : : : : : : : 394.3 The chain density vectors for the virtual parenting article. : : : : : : : : : : : : : : : : : : : : : : : : : : 414.4 Functions for calculating paragraph similarity. : : : : : : : : : : : : : : : : : : : : : : : : : : : : : : : : : : : : 434.5 An 11� 11 similarity matrix for the virtual parenting article, calculated using the
Dice coefficient of similarity. : : : : : : : : : : : : : : : : : : : : : : : : : : : : : : : : : : : : : : : : : : : : : : : : : : : : : 444.6 Adjacency matrix for the virtual parenting article. : : : : : : : : : : : : : : : : : : : : : : : : : : : : : : : : : 45
5.1 Lexical chains from an article about cuts in children’s aid societies. : : : : : : : : : : : : : : : : : 525.2 Lexical chains from a related article. : : : : : : : : : : : : : : : : : : : : : : : : : : : : : : : : : : : : : : : : : : : : : : 535.2 Lexical chains from a related article (cont’d). : : : : : : : : : : : : : : : : : : : : : : : : : : : : : : : : : : : : : : 545.3 Lengths of the vectors in the example articles. : : : : : : : : : : : : : : : : : : : : : : : : : : : : : : : : : : : : : 595.4 Similarities of the vectors in the example articles. : : : : : : : : : : : : : : : : : : : : : : : : : : : : : : : : : : 595.5 Descriptions of topics used for evaluation. : : : : : : : : : : : : : : : : : : : : : : : : : : : : : : : : : : : : : : : : 625.6 Clustering TREC articles with a threshold of 0.1. : : : : : : : : : : : : : : : : : : : : : : : : : : : : : : : : : : : 645.7 Clustering TREC articles with a threshold of 0.15. : : : : : : : : : : : : : : : : : : : : : : : : : : : : : : : : : : 645.8 Clustering TREC articles with a threshold of 0.2. : : : : : : : : : : : : : : : : : : : : : : : : : : : : : : : : : : : 645.9 Randomly clustering TREC articles with a threshold of 0.1. : : : : : : : : : : : : : : : : : : : : : : : : : 655.10 Randomly clustering TREC articles with a threshold of 0.15. : : : : : : : : : : : : : : : : : : : : : : : : 655.11 Randomly clustering TREC articles with a threshold of 0.2. : : : : : : : : : : : : : : : : : : : : : : : : : 65
6.1 Questions used in evaluation of linking methodology. : : : : : : : : : : : : : : : : : : : : : : : : : : : : : 676.2 Data collected during question answering tasks : : : : : : : : : : : : : : : : : : : : : : : : : : : : : : : : : : : 736.2 Data collected during question answering tasks (cont’d) : : : : : : : : : : : : : : : : : : : : : : : : : : : 746.3 Summary statistics for experimental results. : : : : : : : : : : : : : : : : : : : : : : : : : : : : : : : : : : : : : : : 756.4 ANOVA analysis for a regression model with an intercept. : : : : : : : : : : : : : : : : : : : : : : : : : 756.5 95% confidence intervals for a model with an intercept. : : : : : : : : : : : : : : : : : : : : : : : : : : : : 766.6 ANOVA analysis for a regression model without an intercept. : : : : : : : : : : : : : : : : : : : : : : 766.7 95% confidence intervals for a model without an intercept. : : : : : : : : : : : : : : : : : : : : : : : : : 776.8 95% confidence intervals for a two-dimensional model of all data. : : : : : : : : : : : : : : : : : : 786.9 ANOVA analysis for a regression model using viewed answers. : : : : : : : : : : : : : : : : : : : : 826.10 95% confidence intervals for coefficients in a model using viewed answers. : : : : : : : : : : 82
4

6.11 ANOVA analysis for a regression model including all link types. : : : : : : : : : : : : : : : : : : : 826.12 95% confidence intervals for coefficients in a model using all three link types. : : : : : : : 836.13 ANOVA analysis for Low Web group including all link types. : : : : : : : : : : : : : : : : : : : : : : 836.14 95% confidence intervals for coefficients in a model using all three link types and
viewed answers. : : : : : : : : : : : : : : : : : : : : : : : : : : : : : : : : : : : : : : : : : : : : : : : : : : : : : : : : : : : : : : : : 836.15 Distribution of the position of selected links. : : : : : : : : : : : : : : : : : : : : : : : : : : : : : : : : : : : : : : 84
5

List of Figures
2.1 Strong relations between words. : : : : : : : : : : : : : : : : : : : : : : : : : : : : : : : : : : : : : : : : : : : : : : : : : : 122.2 A regular relation connecting apple and carrot. : : : : : : : : : : : : : : : : : : : : : : : : : : : : : : : : : : : : : 132.3 Two portions of a text tagged with chain numbers. : : : : : : : : : : : : : : : : : : : : : : : : : : : : : : : : : 132.4 Histogram of similarity frequencies for technical documents, reproduced from Ellis
et al. (1994). : : : : : : : : : : : : : : : : : : : : : : : : : : : : : : : : : : : : : : : : : : : : : : : : : : : : : : : : : : : : : : : : : : : : : 20
3.1 Histogram of similarity frequencies for the maple syrup article. : : : : : : : : : : : : : : : : : : : : 333.2 Histogram of similarity frequencies for the bank scandal article. : : : : : : : : : : : : : : : : : : : : 343.3 Histogram of similarity frequencies for the Silicon Valley article. : : : : : : : : : : : : : : : : : : : : 343.4 Histogram of similarity frequencies for all articles. : : : : : : : : : : : : : : : : : : : : : : : : : : : : : : : : : 35
4.1 Portions of an article about virtual parenting. : : : : : : : : : : : : : : : : : : : : : : : : : : : : : : : : : : : : : : 394.2 Links between paragraphs for the virtual parenting article. : : : : : : : : : : : : : : : : : : : : : : : : : 464.3 Paragraphs 2 and 8 of the virtual parenting article. : : : : : : : : : : : : : : : : : : : : : : : : : : : : : : : : : 47
5.1 Computing chain similarity. : : : : : : : : : : : : : : : : : : : : : : : : : : : : : : : : : : : : : : : : : : : : : : : : : : : : : : 575.2 A sample topic from TREC. : : : : : : : : : : : : : : : : : : : : : : : : : : : : : : : : : : : : : : : : : : : : : : : : : : : : : : 61
6.1 The structure of the system used for the evaluation. : : : : : : : : : : : : : : : : : : : : : : : : : : : : : : : : 696.2 The interface of the evaluation system. : : : : : : : : : : : : : : : : : : : : : : : : : : : : : : : : : : : : : : : : : : : : 706.3 Data and regression line for all questions. : : : : : : : : : : : : : : : : : : : : : : : : : : : : : : : : : : : : : : : : : 776.4 Data and regression line for question 1. : : : : : : : : : : : : : : : : : : : : : : : : : : : : : : : : : : : : : : : : : : : 786.5 Data and regression line for question 2. : : : : : : : : : : : : : : : : : : : : : : : : : : : : : : : : : : : : : : : : : : : 796.6 Data and regression line for question 3. : : : : : : : : : : : : : : : : : : : : : : : : : : : : : : : : : : : : : : : : : : : 796.7 Data and regression line for Low Web group. : : : : : : : : : : : : : : : : : : : : : : : : : : : : : : : : : : : : : : 806.8 Data and regression line for High Web group. : : : : : : : : : : : : : : : : : : : : : : : : : : : : : : : : : : : : : 81
7.1 Preprocessing a file of articles. : : : : : : : : : : : : : : : : : : : : : : : : : : : : : : : : : : : : : : : : : : : : : : : : : : : : 897.2 The format of a chain from the chain file. : : : : : : : : : : : : : : : : : : : : : : : : : : : : : : : : : : : : : : : : : : 907.3 Graph of number of words chained versus Time to chain. : : : : : : : : : : : : : : : : : : : : : : : : : : 917.4 HyperTect client-server model. : : : : : : : : : : : : : : : : : : : : : : : : : : : : : : : : : : : : : : : : : : : : : : : : : : : 92
B.1 The System : : : : : : : : : : : : : : : : : : : : : : : : : : : : : : : : : : : : : : : : : : : : : : : : : : : : : : : : : : : : : : : : : : : : : 111
6

Chapter 1Introduction
The popularity of graphical interfaces to the World Wide Web (WWW) has shown that a hyper-text interface can make what was once a daunting task, accessing information across the Internet,considerably easier for the novice user. Along with — and perhaps because of — the growth ofthe Web, many newspapers are beginning to take their first steps into the online world. A sur-vey, reported in Outing (1996), found that there were 1,115 commercial newspaper online servicesworld-wide, 94% of which were on the Web. Of the total, 73% (814) of the online newspapers werein North America. Outing predicted that the number of newspapers online would increase to morethan 2000 by 1997. His prediction was reasonable, as by the middle of 1997 there were 1715 onlinenewspapers, 95% of which were on the WWW (see Outing, 1997 for up-to-date statistics). Thesetotals do not include services such as InfoSeek and InfoSage that provide access to a number offull-text databases over the WWW.
The problem is that these services are not making full use of the hypertext capabilities of theWeb. The user may be able to navigate to a particular article in the current edition of an onlinepaper by using hypertext links, but she must then read the entire article to find the informationthat interests her. Many services offer keyword searching for articles of interest, but there arealmost no links between related articles.
These collections are “shallow” hypertexts; the documents retrieved as the result of a searchare usually dead-ends in the hypertext, rather than starting points for other explorations. Thehypertext capabilities of the WWW are hardly used at all. In order to truly reflect the hypertextnature of the Web, links would need to be placed within and between the documents.
1.1 Current efforts in Web-based news
The Washington Post’s Web site, WashingtonPost.com (Washington Post, 1997, http://www.Washington-Post.com) is, in many ways, a typical newspaper Web site. The top-level page resembles a tradi-tional newspaper’s front page, with links from short descriptions of articles to the full text of thearticles themselves. What distinguishes this site is that some articles offer links to related articles.For example, an article about a standoff between the government and a militia group in Texaswas linked with a profile of the militia group, and recent Associated Press stories on the standoff.Along with these news links, there are links to related sites on the Web, for example, a link to thehome page of the militia group. These links are assigned by hand by WashingtonPost.com editors,and so only the top stories of the day receive this treatment.
College NewsLink (Simon and Schuster, 1997, http://www.ssnewslink.com/) is a service de-signed to provide course-related news items to students around the world. The service collectsarticles from various news sources (e.g., the Globe and Mail and the New York Times), automati-cally classifies them into subject areas (e.g., Multimedia), and mails them out to users as a page
7

of HTML. One of the selling points of this service is that the articles have been annotated withhypertext links. For the most part, however, these links simply connect named entities (e.g., IBMor Netscape) to their Web pages. These links connect to the top-level domain of these sites, anddo not seem to take into account the context in which an entity is mentioned (e.g., Netscape’s newWeb browser). There are no links within the articles, and certainly no links to other articles, andthus, no way for an interested user to break out of the classification hierarchy.
GLOBEnet (1997, http://www.theglobeandmail.com/) is the Web-based service of the Globeand Mail newspaper. When a user arrives at GLOBEnet’s home page, she is presented with a choiceof various information resources. One of these is the news of the day, divided into sections just asthe print version is. The user can enter these sections, see short descriptions of the articles, andthen click on a link to access the full versions. At this point, the browsing possibilities are simply toreturn to the top-level index of the paper, or to use the Web browser’s Back button to return to thesection level index. This is exactly the sort of “impoverished” hypertext that we described above— there is no easy way to get from this article to another, related article except by following thestructure of the newspaper. GLOBEnet, however, offers a feature called WebExtra, a selection ofstories that have been enhanced for the Web edition of the paper. As with College Newslink, thesestories have links to related sites on the Web, but no links to related articles in the Globe and Mailitself.
In earlier versions, the Web edition of the Globe and Mail did try to provide automatically gen-erated links to related articles. These links were built using the subject terms assigned to the articleby InfoGlobe. Any article available on the Web site that shared a subject term (e.g., forestry indus-try) with the article in question was taken to be related, and a link was placed at the end of thearticle. The result was a large number of links to articles that were only peripherally related.
1.2 Large-scale hypertexts
If we consider the sites described above, it certainly seems that the creators of these sites wantto be able to use the hypertext capabilities of the Web. Furthermore, as we shall see in section2.6, novice users of information retrieval systems are often unable to form the complex queriesthat will retrieve only those documents that they are interested in. For the most part, these userswill pose simple queries and browse through the results looking for information relevant to theirparticular needs. Clearly, this is a kind of interaction that a well-built hypertext would supportvery naturally. The user could begin by posing a query to the database or by browsing a “tableof contents” and then use hypertext links within and between documents to navigate through thedatabase.
This raises the question: Why are there no (or almost no) links in these Web sites? Westland(1991) has pointed out the economic constraints on building large-scale hypertexts. Manually cre-ating and maintaining the large sets of links that would be needed for an online newspaper isprohibitively expensive, given the volume of newspaper and newswire articles produced everyday. This could certainly account for the state of current WWW newspaper efforts.
Aside from the time-and-money aspects of building such large hypertexts manually, there havebeen indications that humans are very inconsistent in assigning hypertext links between the para-graphs of technical documents. That is, different people will tend to insert different hypertext linksinto the same document. In section 2.4.1 and in chapter 3, we will discuss the experiments that giveus these results, both for technical documents and for newspaper articles.
The cost and inconsistency of manually constructed hypertexts does not necessarily mean thatlarge-scale hypertexts can never be built. It is well known in the information retrieval (IR) commu-nity that humans are inconsistent in assigning index terms to documents, but this has not hindered
8
the construction of IR systems intended to be used for very large collections of documents. Sim-ilarly, we can turn to automatically generated hypertext links to solve the problems of cost andinconsistency.
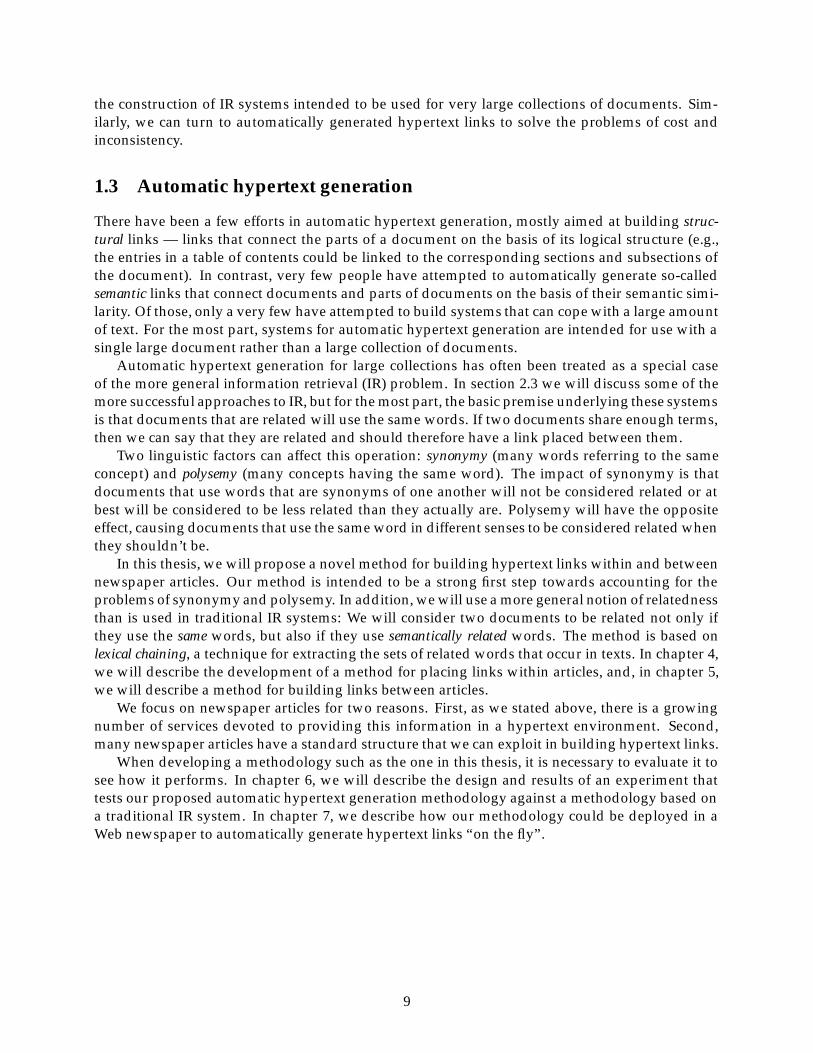
1.3 Automatic hypertext generation
There have been a few efforts in automatic hypertext generation, mostly aimed at building struc-tural links — links that connect the parts of a document on the basis of its logical structure (e.g.,the entries in a table of contents could be linked to the corresponding sections and subsections ofthe document). In contrast, very few people have attempted to automatically generate so-calledsemantic links that connect documents and parts of documents on the basis of their semantic simi-larity. Of those, only a very few have attempted to build systems that can cope with a large amountof text. For the most part, systems for automatic hypertext generation are intended for use with asingle large document rather than a large collection of documents.
Automatic hypertext generation for large collections has often been treated as a special caseof the more general information retrieval (IR) problem. In section 2.3 we will discuss some of themore successful approaches to IR, but for the most part, the basic premise underlying these systemsis that documents that are related will use the same words. If two documents share enough terms,then we can say that they are related and should therefore have a link placed between them.
Two linguistic factors can affect this operation: synonymy (many words referring to the sameconcept) and polysemy (many concepts having the same word). The impact of synonymy is thatdocuments that use words that are synonyms of one another will not be considered related or atbest will be considered to be less related than they actually are. Polysemy will have the oppositeeffect, causing documents that use the same word in different senses to be considered related whenthey shouldn’t be.
In this thesis, we will propose a novel method for building hypertext links within and betweennewspaper articles. Our method is intended to be a strong first step towards accounting for theproblems of synonymy and polysemy. In addition, we will use a more general notion of relatednessthan is used in traditional IR systems: We will consider two documents to be related not only ifthey use the same words, but also if they use semantically related words. The method is based onlexical chaining, a technique for extracting the sets of related words that occur in texts. In chapter 4,we will describe the development of a method for placing links within articles, and, in chapter 5,we will describe a method for building links between articles.
We focus on newspaper articles for two reasons. First, as we stated above, there is a growingnumber of services devoted to providing this information in a hypertext environment. Second,many newspaper articles have a standard structure that we can exploit in building hypertext links.
When developing a methodology such as the one in this thesis, it is necessary to evaluate it tosee how it performs. In chapter 6, we will describe the design and results of an experiment thattests our proposed automatic hypertext generation methodology against a methodology based ona traditional IR system. In chapter 7, we describe how our methodology could be deployed in aWeb newspaper to automatically generate hypertext links “on the fly”.
9

Chapter 2Background and previous work
2.1 The structure of newspaper articles
Newspaper articles are divided (generally speaking) into two types: news and feature articles.While these two types may exhibit very different writing styles, there are some generalizationsthat can be made. Both types have a lead, an initial paragraph (or group of paragraphs) that reflectsthe shape of the story.
Hard leads are used in news stories. They give the reader all of the facts of the story as quicklyas possible, and are designed so that the reader can stop reading after the lead if they wish and stillhave a good idea of the important information contained in the story. The hard lead may (somesay should) be as short as 35 words (Cumming and McKercher, 1994, p. 132).
Soft leads are used in feature stories to draw the reader into the following text. They are notconcerned so much with the facts of the story as with getting the reader interested in the story. Inrecent years, there has been an increase in the number of feature articles appearing in newspapers,and writing styles have been changing so that even news articles may be written using a soft lead,rather than a traditional hard lead.
Newspaper articles are often written in the inverted pyramid style. The most important infor-mation is offered in the lead of the story, and further paragraphs offer progressively more detailedinformation. If there are several aspects to a story, then the most important information for eachaspect is offered first, followed by the next-most important information, and so on. The benefit ofusing such a style is that the reader can stop reading at the end of any paragraph and still feel asthough they have read a complete article. Along with the trend towards using soft leads, there hasbeen a movement towards writing articles with a narrative style, which is meant to engage, as wellas inform, the reader.
2.2 Lexical chains
A lexical chain (Morris and Hirst, 1991) is a sequence of semantically related words in a text. Forexample, if a text contained the words apple and fruit they would appear in a chain together, sinceapple is a kind of fruit. Generally speaking, a document will contain many such chains, each ofwhich captures a portion of the cohesive structure of the document. Cohesion is what, as Hallidayand Hasan (1976) put it, helps a text “hang together as a whole”. The lexical chains contained ina text will tend to delineate the parts of the text that are “about” the same thing. Morris and Hirst(1991) showed that the organization of the lexical chains in a document mirrors, in some sense, thediscourse structure of that document.
The lexical chains in a text can be identified using any lexical resource that relates words bytheir meaning. While the original work was done using Roget’s Thesaurus (Chapman, 1992), ourcurrent lexical chainer, which is similar to the one described in St-Onge (1995), uses the WordNet
10

database (Beckwith et al., 1991). The WordNet database is composed of synonym sets or synsets.Each synset contains one or more words that have the same (or nearly the same) meaning. Aword may appear in many synsets, depending on the number of senses that it has. Synsets canbe connected to each other by several different types of links that indicate different relations. Forexample, two synsets can be connected by a hypernym link, which indicates that the words in thesource synset are instances of the words in the target synset.
For the purposes of lexical chaining, each type of link between WordNet synsets is assigneda direction of up, down, or horizontal. Upward links correspond to generalization: for example,an upward link from apple to fruit indicates that fruit is more general than apple. Downward linkscorrespond to specialization: for example, a link from fruit to apple would have a downward di-rection. Horizontal links are very specific specializations. For example, the antonymy relation inWordNet is considered to have a horizontal direction, since it specializes the sense of a word veryaccurately.
Given these types of links, three kinds of relations are built between words:
Extra strong An extra strong relation is said to exist between repetitions of the same word.
Strong A strong relation is said to exist between words that are in the same WordNet synset (i.e.,words that are synonymous), as in figure 2.1(a). Strong relations are also said to exist betweenwords that have synsets connected by a single horizontal link, as in figure 2.1(b), or wordsthat have synsets connected by a single IS-A or INCLUDES relation, as in figure 2.1(c).
Regular A regular relation is said to exist between two words when there is at least one allowablepath between a synset containing the first word and a synset containing the second word inthe WordNet database. A path is allowable if it is shorter than a given length (usually 4) andadheres to three rules:
1. No other direction may precede an upward link,
2. No more than one change of direction is allowed, except in the case that:
3. A horizontal link may be used to move from an upward to a downward direction.
Figure 2.2 shows the regular relation that can be built between apple and carrot.
The result of lexical chaining is a file containing the lexical chains from a document and an-other file containing a description of which chains appear in which paragraphs of the document.Figure 2.3 shows the second and eighth paragraphs of an article about the trend towards “virtualparenting” in which all of the words participating in chains have been tagged with their chainnumbers.
2.2.1 An implementation of lexical chaining
In the current implementation of the chainer, there are three distinct steps in the recovery of thelexical chains from a document. In the first stage, all extra strong relations (i.e., term repetitions)are found, and this set of unique terms is used as the starting set of lexical chains. Initially, eachterm in a chain has associated with it all of the WordNet synsets in which it appears. During thesecond stage of chaining, all strong relations between chains are recovered. The number of strongrelations between the synsets from each pair of chains is calculated. The pair of chains that sharethe most strong relations are merged. During the merging, the synsets that participated in strongrelations are retained, and all other synsets are removed. This process is repeated until there are no
11

successorreplacement
successor
successorheir
precursorforerunner
predecessorprecursor
antecedent
harbingerforerunner
heraldprecursor
schoolshoal
school
schoolschoolhouse
private_school
humanhuman_being
man
person
person
individualsomeone
mortal
human
soul
(a) (b)
(c)
human person
IS-A
private_schoolschool
successor precursor
ANTONYMY
Figure 2.1: Strong relations between words.
more strong relations between chains. The third stage is similar to the second, except that regularrelations are considered.
As lexical chaining proceeds through these three stages, the number of synsets associatedwith a particular term will decrease. Thus, the words in the chains are progressively sense-disambiguated during lexical chaining.
The algorithm described above has a few drawbacks. The first is that words that do not appearin WordNet are not included in lexical chains, even if they are repeated, so useful information (e.g.,a chain containing all instances of a proper noun) is lost.
Compared to traditional document processing tasks in information retrieval (i.e., keyword ex-traction), the chaining process is slow. For example, chaining a database of approximately 30,000newspaper articles (about 85 MB) takes 5 hours, compared to approximately 15 minutes for a tradi-tional information retrieval system to process the same amount of text. Still, this is much faster thantraditional computational linguistic techniques for discovering document structure (e.g., parsing),and there are several optimizations that could still be made to the chaining software.
12

producegreen_goods
apple carrot
fruit vegetableveggie
apple carrot
IS-A INCLUDES
INCLUDESIS-A
Figure 2.2: A regular relation connecting apple and carrot.
Although no one is pushing12 virtual-reality headgear16 as a substitute1 forparents1, many technical ad campaigns13 are promoting cellular phones22,faxes22, computers1 and pagers to working1 parents1 as a way of bridgingseparations17 from their kids1. A recent promotion13 by A T & T and Res-idence2 Inns7 in the United States6, for example3, suggests that business3
travellers1 with young1 children use video3 and audio tapes22, voice3 mail3,videophones and E-mail to stay3 connected, including kissing23 the kids1
good night21 by phone22.
More advice3 from advertisers1: Business3 travellers1 can dine with theirkids1 by speaker1-phone or ”tuck them in” by cordless phone22. Separately, amanagement10 newsletter24 recommends faxing your child1 when you haveto break17 a promise3 to be home2 or giving12 a young1 child1 a beeper tomake him feel23 more secure when left5 alone.
Figure 2.3: Two portions of a text tagged with chain numbers.
Because we want to be able to process text as quickly as possible, we must accept some errors(or at least bad decisions) during the chaining process. For example, consider the two portions oftext shown in figure 2.3. The words kid and speaker are in the same chain, because a speaker can bea kind of human, as can a kid. This is the incorrect sense of speaker for this text — it is clearly meantin the sense of loudspeaker.
We have also found that the current implementation of the lexical chainer is sensitive to severalparameters, in that slight changes in these parameters can produce large changes in the lexicalchains produced. For example, the size and contents of the stop-word list given to the chainer canaffect the chains by removing “key words” used to build chains. Also, if we allow the path lengthin a regular relation to increase, then the chainer will generate more questionable connectionsbetween synsets and produce longer chains.
We have tried to mitigate these problems by using a very simple stop-word list (one providedwith WordNet), and by choosing a path length that seems to balance between worthwhile connec-tions and bad connections. Current research by Budanitsky (1998) is aimed at determining exactlyhow the measure of semantic distance used affects the structure of the lexical chains extracted from
13

a document.Another problem, unrelated to the implementation, is that the WordNet database is relatively
unconnected, that is, it is difficult to build relations between nouns and verbs, since the nounand verb hierarchies are connected only at the top level. Currently we attempt to get around thisproblem by seeing whether a nominalization of a verb appears in the noun hierarchy and if it does,using the nominalization instead. This is an unsatisfactory solution, but the only one available tous. Fortunately, much of the content of a document is carried in the nouns rather than the verbs.
We do note, however, some advantages that lexical chaining has compared to traditional infor-mation retrieval processing. For example, in the paragraphs shown in figure 2.3, multiple wordterms such as United States are taken whole, rather than taken as separate terms. Another advan-tage, which we will make use of later, is the sense disambiguation mentioned earlier. Despite thelimitations, we believe that the current implementation of the chainer is sufficiently powerful touse for our research.
In fact, lexical chaining has been used in several applications. The current implementationof the chainer is based on the implementation described in St-Onge (1995), where lexical chainswere used to detect and correct malapropisms. Stairmand (1994), implemented a different lexicalchainer using WordNet and used the results for work in information retrieval. In a similar vein,Kominek and Kazman (1997) have used a derivative of lexical chains, lexical trees, to providereal-time concept indices for meetings. Barzilay and Elhadad (1997) have used lexical chains toautomatically summarize documents.
2.3 Information Retrieval
Generally speaking, the task of Information Retrieval systems is to select from a large database ofdocuments the subset that meets the information requirement of a user. Many different systemsand methodologies have been proposed for dealing with this task. A general overview of work inthe field can be found in Meadow (1992).
Here we will present only those aspects most relevant to our research. In general, we areinterested in how document similarity is calculated in traditional (and non-traditional) IR systemsso that we can consider ways in which it can be improved. As our lexical chaining technique isbased on a thesaurus, we are also interested in seeing how thesauri have traditionally been usedin IR systems. We begin with a discussion of how retrieval performance is measured, so that theseconcepts will be familiar when the time comes to evaluate our own work.
2.3.1 Measuring retrieval performance
One of the most interesting aspects of the IR field is its insistence on measuring the performanceof proposed systems. The most commonly used measures of IR performance are recall and preci-sion. Simply stated, recall is the proportion of the documents relevant to a query that were actuallyretrieved, while precision is the proportion of the documents retrieved that are actually relevant.More formally, given a query, we can divide the documents in a system into the following cate-gories:
Relevant Not relevantRetrieved a bNot retrieved c d
and then define:
14

recall =jaj
ja+ cj precision =jaj
ja+ bjBoth recall and precision can vary between 0 and 1. Theoretically speaking, there is no reason
why both recall and precision cannot both be 1 (i.e., a system retrieves all and only the relevantdocuments), but in practice there is a trade-off between the two — as recall is increased, precisionfalls and vice-versa. As a result of this relationship, performance results for IR systems are usuallystated in terms of average precision at various recall levels.
Some have attempted to combine the recall and precision measures into a single measure thatdescribes how closely a system approaches the ideal of perfect recall and precision (see Meadow,1992, p. 284 for a few examples), but most research results (e.g., the TREC conference, Harman,1994) still use recall and precision.
2.3.2 Vector space models
One of the most successful approaches to IR has been the vector space model advocated by Salton(1989) and others. In this model, each document in a collection is represented by a vector of lengtht, where t is the number of distinct word root forms (or terms) in the entire collection. The elementsof the vector for a specific document are the weights for each of the terms in that document. Typ-ically, the number of unique terms in the database of documents can be quite large. For example,Forsyth (1986) found that, over the course of 149 days, the number of unique terms in a databaseof newspaper articles was 108,587.
The weight for a specific term in a specific document is calculated by considering the frequencyof the term in that particular document and the number of documents that the term appears in.The intuition behind this calculation is that the terms that are most significant in a documentare those that appear frequently in the document, and infrequently in the rest of the database. Thisweighting approach is referred to as the term frequency-inverse document frequency or tf�idf weightingscheme. Typically, a normalization function is applied to the vector for a document, so that longerdocuments do not dominate shorter documents. These normalized document representations areunit vectors in a t-dimensional space.
An equation that incorporates both weighting and normalization to calculate wik, the weight ofterm k in document i, is given in Salton and Allan (1993):
wik =tf ik � log(N=nk)q
∑tj=1(tf i j)
2 � (log(N=n j))2
In this formula, tf ik is the frequency of term k in document i, N is the number of documents in thecollection, nk is the number of documents in the collection that contain term k, and t is the numberof terms in all documents.
Documents that contain many of the same terms will have vectors that lie close together int-space. The similarity of two documents can then be measured by taking the cosine of the an-gle between the vectors representing them. For two normalized vectors, the cosine of the anglebetween them is simply the dot product of the vectors.
This provides a measure of similarity between 0 and 1, with 1 indicating complete similarity.To retrieve documents that are similar to a given document, all that is required is to compute thesimilarity of the vector from the given document to all other document vectors and rank eachdocument by its similarity to the given document.
15

This global (i.e., document level) restriction can be extended to a local restriction in order todefeat the problem of polysemy. If two documents show a sufficient similarity, they can then bebroken down into pieces (usually sentences). Each piece of one document can then be compared toeach piece of the other. If there is a common usage of words between these pieces of the document,then they are assumed to be using the same words in the same senses, and the documents shouldbe considered related (this process is described fully by Salton et al., 1993).
2.3.3 Latent Semantic Indexing
The development of Latent Semantic Indexing (LSI) (Deerwester et al., 1990) was motivated by theneed to address both synonymy and polysemy in IR systems. Deerwester et al. take the positionthat the term vector representing a document in a traditional vector space system is really animperfect representation of the concepts contained in the document.
In LSI, a database of documents is originally represented by a t�N term-document matrix,where t is the number of terms in the database, and N is the number of documents. This is es-sentially the representation that is used in vector space systems. The goal of LSI is, given thisterm-document matrix, to determine the actual association between terms and documents by de-termining the patterns of occurrence of words. Berry and Dumais (1995) present the example of thesynonyms car and automobile, which will tend to occur with many of the same words (e.g., motor,model, engine, etc.).
Using a technique called Singular Value Decomposition (SVD), this rather large term-docum-ent matrix can be reduced to a much smaller set of k orthogonal factors (where k � 200). This setof factors is meant to represent the underlying concepts that are expressed in the database. Boththe documents and the terms in the database can be represented as a linear combination of these kfactors. The idea is that similar words, such as car and automobile will be very close together in k-space. As with vector space systems, the similarity between documents (or terms) can be calculatedby taking the dot product or cosine of their representative vectors. Queries can be represented asa weighted sum of the factors and the same cosine measure can be used to find the most-similardocuments.
Because of this reduction in dimensionality, it is possible that documents that contain none ofthe query terms will be retrieved if the terms in the documents are synonyms of the query terms.The method performs less well in dealing with polysemy. Since each term is represented by aunique vector of weights for each factor, a polysemous term is represented as a sort of “average”across all senses. Despite this, the method performs reasonably well compared to SMART (a vectorspace IR system) on some standard test collections.
This reduction of a term vector to a “concept vector” is somewhat similar to the reduction thatis made during lexical chaining, when a document is reduced to a collection of synsets. Of course,when using LSI, there is no way to interpret exactly what these factors mean. The method may beable to tell that engine and car co-occur, but not that one is part of the other. The regular relationsbuilt during lexical chaining have no analogue in LSI, since these relations can not be specified bysimple co-occurrence.
2.3.4 Thesauri and IR
One of the most common proposals for overcoming the problem of synonymy is to use a the-saurus to expand the query with related terms. In the simplest case, these extra terms are simplysynonyms of the words used in the query. This expanded query is then used while searching thedatabase.
16

More complicated thesauri have been proposed for use in information retrieval. An early ex-ample is that of Gotlieb and Kumar (1968), who attempted to automatically define a set of conceptsfrom the Library of Congress Subject Headings. They describe the set of semantic relatives of an in-dex term x as all of the terms y such that x contains a see also reference to y or y contains a see alsoreference to x.
These sets are used to define an association metric that can be used to build graphs of therelationships between index terms. Using graph-theoretic methods, Gotlieb and Kumar proposeways to group index terms into sharp concepts (corresponding to maximal complete subgraphs ofthe term graph) and to group sharp concepts into diffuse concepts. This attempt to reduce a set ofterms to a smaller set of concepts is similar to the reductions made in both LSI and lexical chaining.
Forsyth (1986) has proposed what he calls a dictionary/thesaurus (or d/t) for information re-trieval. The basic unit in his d/t is the word, and each word can have several kinds of relationsto other words. These relations can be used to expand the terms in a query in more-general ways.Forsyth classifies the relations between words into three categories:
Synonymy relations Synonyms (or near synonyms) as well as antonyms are related.
Hierarchical relations These relations are the IS-A or HAS-A relations.
Affinity relations This is a more diffuse set of relationships meant to contain “related terms”.
Interestingly enough, the structure of his proposed d/t is similar to that of the WordNet database,although WordNet specifies a much larger set of relations, and the basic unit is a set of synonymsrather than a single word.
In fact, Voorhees (1994) has used WordNet to perform term expansion on queries that were usedin the TREC evaluations. Essentially she performed a sort of “reverse” lexical chaining operationon the words contained in the queries, determining what words from WordNet were related to thequery terms and adding those to the query. She found that this term expansion had little effecton well specified queries, but that it had a significant effect on under-specified queries. It wouldbe interesting to see how LSI would fare when used in a similar evaluation, but Voorhees focusesspecifically on WordNet.
2.3.5 Computational linguistics and IR
While there has been much work that attempts to apply some of the techniques of computationallinguistics (e.g., parsing and semantic interpretation) to information retrieval (Mauldin, 1991, Rauet al., 1989, Rau and Jacobs, 1991), the degree of success of such techniques has been much lessthan expected. The idea underlying most of this work has been that if a system can understand atext, then it will be better able to retrieve that text in response to a user’s query. In most cases, theword understand as it is used here means “producing document and query representations moredetailed than those used by traditional IR systems.” Even IR researchers have noted the problem:
It is generally agreed that new approaches must be introduced in information retrieval,if meaningful enhancements in retrieval effectiveness are to be obtained. . . . Ultimately,any advanced information retrieval model must deal with the problem of languageanalysis, because the content of texts and documents necessarily controls the retrievalactivities. (Salton et al., 1990, p. 73)
17

While some of the work has been quite successful in limited domains (e.g., Rau et al., 1989),there have never been any systems that produced results that were significantly better than tra-ditional, word-based IR systems on typical IR problems. Furthermore, many of the systems thathave been built have not been able to cope with the megabytes (or even gigabytes) of data that arebeing produced every day. Sparck Jones (1991) stresses that systems that employ techniques fromcomputational linguistics must perform at least as well as the current systems, or else there is noreason to do all of the work involved in producing complex representations.
This is not to say that the task of building an efficient and effective IR system that uses tech-niques from computational linguistics is impossible, merely that it is very difficult. Rather thanattempting to solve the entire problem at once, perhaps we should be focusing on smaller aspectsand attempting to achieve incremental gains in performance, or focusing on different aspects ofthe IR problem, such as question-answering.
2.4 Manual hypertext construction
Much of the work in the area of hypertext has focused on authoring systems for the manual con-struction of hypertext (see, for example, Rada and Diaper (1991) for a discussion of some authoringsystems). Needless to say, manual hypertext construction is a time-consuming and difficult task.It also seems that manually constructed hypertexts may not be useful in information retrieval orquestion-answering systems, because different authors will tend to insert different sets of linksinto the same document.
2.4.1 Inter-linker consistency
It is well known that human indexers display a distressing lack of consistency when assigningindex terms to documents. That is, different indexers will often use different terms to describe thesame document. For example, Furnas et al. (1987) found that their subjects agreed less than 20%of the time when choosing terms to describe objects. Ellis et al. (1994a) hypothesized that a similareffect would arise in the manual construction of hypertext, where the human linker must decidewhich paragraphs of a document are related. In order to test this hypothesis, they conducted astudy in which subjects were asked to assign links between the paragraphs of technical documents.The inter-linker consistency could then be assessed by measuring the similarity between differenthypertext versions of the same document.
In the first part of their experiment, five hypertext versions of each of five documents wereproduced by the subjects. Each version of each document was produced by a different subject,using an authoring system based on the Guide hypertext system. The paragraphs of the docu-ments were used as the nodes of the hypertext. Two types of links between nodes were generatedautomatically:
1. Links between nodes that were linearly adjacent in the original document.
2. Links from the headings in a table of contents to the nodes that begin the correspondingsections.
The subjects were then asked to connect nodes whose contents were related somehow, that is,their links would represent conceptual associations between nodes. They were urged to define allsuch links that they could find, even if the link already existed (e.g., a link between two adjacentnodes). Nodes could be linked in two ways:
18
1. A term (a word or multi-word phrase) within one node could be connected to the beginningof another node, so that the target node would be the one most relevant to someone wishingmore information about the term in the source node.
2. The whole of one node could be connected to the beginning of another node, so that the targetnode would be the most relevant to someone seeking more information about the subjects inthe source node.
Ellis et al. divided the sets of links that the linkers created into three types of link set:
Type 1 A link set of Type 1 included all of the links inserted into the document by the subject.
Type 2 A link set of Type 2 excluded forward links that connected the whole of a source node to atarget node that is physically adjacent to it.
Type 3 A link set of Type 3 excluded all forward links, from both the whole of a source node andfrom a term in a source node, to a target node that is physically adjacent to it.
The hypertexts created by the subjects were converted to graphs using three different repre-sentations: adjacency matrices, distance matrices, and converted distance matrices. Ellis et al. thenanalyzed the similarity of the graph representations of each possible pair of hypertexts, to see howsimilar the graphs produced by different subjects were.
The similarities of the graph representations of the hypertexts were computed using 27 dif-ferent similarity coefficients that have appeared in the IR literature over the years (see Ellis et al.,1994a, p. 43 for a complete list). These similarity metrics all work on two vectors, so they also con-sidered several methods for converting the graph representation of a hypertext to a vector. Twoof these methods worked directly on the matrix representations of the graphs. In the first, the ele-ments of the matrix are placed in a single n-tuple. In the second, multiple n-tuples are used, one foreach node in the graph. The rest of the methods depended on vectors of node indices. Each vector iscomposed of n node indices, one for each node in the graph. These node indices represent certaintopological characteristics of a graph, for example, one node index that they used is the in-degreeof a node.
Their results were tables of similarity for each combination of:
1. The type of link set used (Type 1, 2, or 3).
2. The type of matrix representation used (adjacency, distance, or converted distance).
3. The type of vector used in the similarity calculations (matrix element or node index).
4. The similarity coefficient.
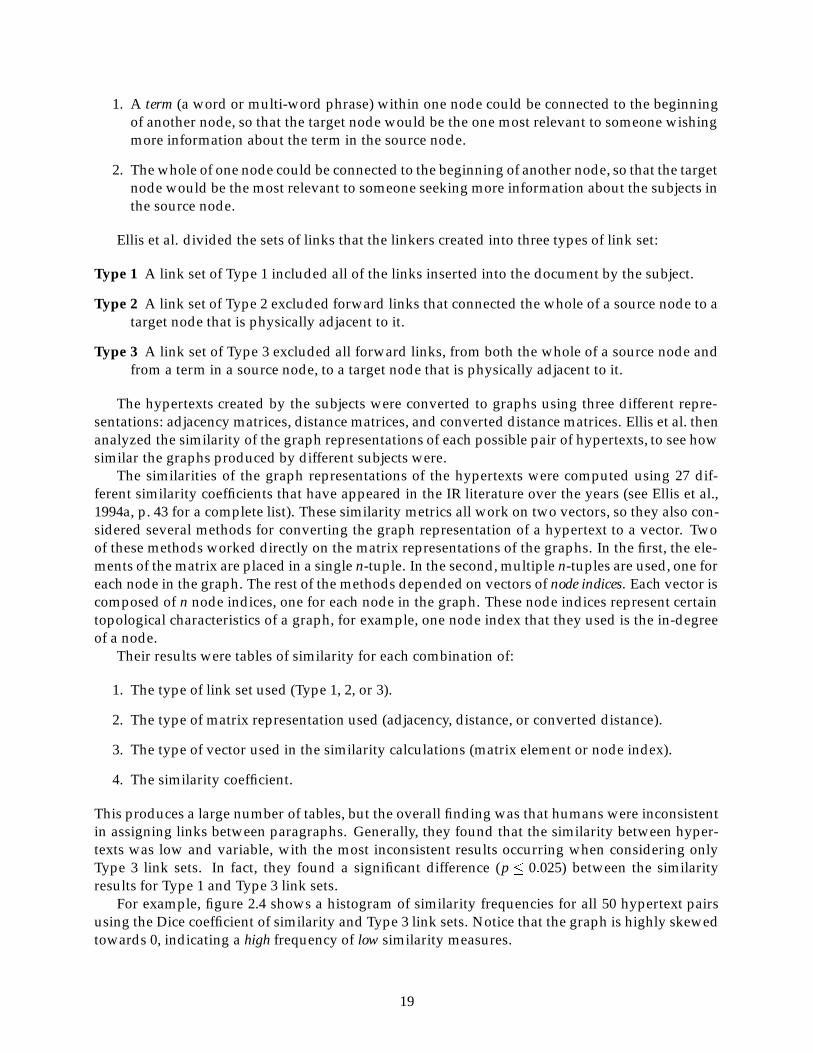
This produces a large number of tables, but the overall finding was that humans were inconsistentin assigning links between paragraphs. Generally, they found that the similarity between hyper-texts was low and variable, with the most inconsistent results occurring when considering onlyType 3 link sets. In fact, they found a significant difference (p � 0:025) between the similarityresults for Type 1 and Type 3 link sets.
For example, figure 2.4 shows a histogram of similarity frequencies for all 50 hypertext pairsusing the Dice coefficient of similarity and Type 3 link sets. Notice that the graph is highly skewedtowards 0, indicating a high frequency of low similarity measures.
19

0.00 0.20 0.40 0.60 0.80 1.00Hypertext Similarity (Dice coefficient)
0.0
2.0
4.0
6.0
8.0
10.0
12.0
Freq
uenc
y of
Sim
ilarit
y
Figure 2.4: Histogram of similarity frequencies for technical documents, reproduced from Ellis etal. (1994).
That human linkers are inconsistent is a very interesting (although not entirely unexpected)result, and shows that the task of constructing hypertexts is a difficult one. Despite this, there area few aspects of the study that could be improved.
In total, there were only 50 hypertext pairs (10 for each of the five documents) to consider. Thisis a relatively small sample size, and it would be interesting to have seen more hypertext versionsof each document. The results would have been more compelling if a single subject had con-structed hypertext versions of each of the five documents. Unfortunately, constructing a hypertextis also a time-consuming process, and they were unable to convince their subjects to do more thanone text.
It is also very possible that the types of documents used for the study had a significant effecton the inter-linker consistency. The documents were, in general, quite long (up to 347 nodes) andcomplicated. It is possible that inter-linker consistency may increase when considering shorterdocuments. The documents were also from diverse sources (Ph.D. theses, journal articles), someof which might not have had strict editorial control. Documents that are produced with strictereditorial and stylistic constraints might be easier to link, and perhaps human linkers would showa higher consistency. We will return to this question in chapter 3.
2.5 Automatic hypertext construction
When automatically constructing a hypertext, there are, in general, two types of links that can bebuilt. First, there are structural links. Structural links reflect the hierarchical structure of manydocuments. For example, in a technical report, structural links could be built from the entries inthe table of contents to the beginning of each section or subsection, from an entry in the referencessection to the point in the text where the reference is mentioned, or from an index entry to the
20

places in the text where the indexed term is mentioned.Semantic links, on the other hand, are those that relate portions of a document based on their
semantic similarity, that is, these links connect the portions of a document that are about the samething. For example, the introduction to a technical report could contain links from the paragraphsdescribing various aspects of the work to the sections where those aspects are explained in greaterdetail. Semantic links can be used to connect documents (or parts of documents) when there is noexplicit relationship between them.
2.5.1 Structural links
While it seems that structural links would be relatively straightforward to create, problems maybe encountered. In the best case, the document to be linked is available in electronic form andthe logical structure of the document (e.g., sections, subsections, etc.) is indicated by some sort ofdocument mark-up (e.g., SGML, LATEX 2ε ).
Furuta et al. (1989) describe their attempts to build the structural links in four different cases:a collection of eight scientific papers, a university course catalogue, a technical report abstractlisting, and a dissertation abstract listing. Their experience runs the gamut from extensive editingof the source documents (in the case of the scientific papers) to almost entirely automatic detectionof structural links (in the case of the technical report and dissertation abstract listings).
The main problem in constructing structural links lies in the fact that much of the formattingdone in machine-readable documents does not reflect the logical structure of the document. Forexample, simply using a font size change to indicate the beginning of a section, rather than using anexplicit tag such as \section , makes it much more difficult to determine where a section actuallybegins. This difficulty will probably dissipate as logical structuring features make their way intomore document creation systems (i.e., commercially available word-processing software).
If the document does contain tags indicating the logical structure, the problem is then to builda pattern recognition engine to determine where each logical unit begins. Furuta et al. found thatthis might take as little as a week of effort. Once the logical units have been found, a variety ofhypertext structures can be built using simple techniques. For example, in the case of the technicalreport and abstract listings, indices can be built by both author and title. Also, a back-of-the-bookindex may be used as a structure for the hypertext version of a document, if this is supported bythe mark-up language.
Structural links can also be built across documents using references. Wilson (1990) developedthe Justus suite of programs to convert traditional legal documents into an integrated hypertextdatabase. The system detects (among other structural links) what she calls location cross referencesthat point to different documents as well as another part of the same document. Fortunately, legalcitation styles are very standard and can be automatically recognized.
While the process of determining the structural links in a document is more a matter of soft-ware engineering (i.e., writing the recognizers), it is nonetheless an important part of building ahypertext database of documents.
2.5.2 Semantic links
When we move from building strictly structural links towards building semantic links, the taskbecomes much more difficult. Without explicit clues to show how links should be built, we needto rely on more complicated techniques that take into account how language is used in a documentor a set of documents. Indeed, there have been some doubts that such links could be discoveredwithout resorting to full natural language processing of a text (see, for example, Bernstein, 1990
21

comments about building semantic links). Despite these doubts, there has been some work onautomatically constructing semantic links within documents.
A link apprentice
Bernstein (1990) proposes what he calls a link apprentice. This is a software tool that can be usedto examine the draft version of a hypertext and propose links that a human editor or author caneither accept or reject. The apprentice that he proposes is a “shallow” one, considering only lexicalequivalence. The apprentice was designed to operate in the Hypergate system, where, for eachnode in a hypertext, each word and each left-substring of a word are placed in a hash table for thatnode. These hash tables can then be used to compute a similarity (between 0 and 1) between nodesin an already-established hypertext. While an author is working on a particular node, the systemscans the rest of the nodes in the hypertext for nodes that are similar to the current one. The top 20most-similar nodes are then shown to the author.
The strength of this system is its efficiency. Bernstein reports a time of 6 seconds to process a186-node hypertext. The problem is that the criteria for determining similarity are limited. Thereis no attempt to remove stop words from the nodes, and common word stems could cause a highsimilarity, even when words are not related. Even though these difficulties could be easily reme-died, the real difficulty is that the apprentice is intended for “compact, independent hypertextdocuments” (Bernstein, 1990, p. 213) such as textbooks or training manuals, and would proba-bly not scale up to a wider domain where there is a large amount of text to be linked and littleopportunity for human involvement.
An incremental approach to constructing hypertext
Chignell et al. (1990) have implemented a system that takes an incremental approach to automatichypertext construction. As with Bernstein’s system, their system is designed to produce a hyper-text from a single document such as a technical manual. There are six steps in their incrementalapproach:
Node preparation The text is automatically segmented into nodes and each node is labeled. Thestructure of the text (i.e., the section and subsection information) can be exploited to deter-mine what the nodes should be.
Indexing Index terms are assigned to each node, either through manual or automatic means.
Link creation The index terms for each node are used to compute the similarity between nodes.Nodes whose similarity exceeds a given threshold are linked.
Organization The nodes of the hypertext are organized by one of two methods:
1. Hierarchical organization through special link types such as INSTANCE-OF and PART-OF.
2. Emphasis of landmarks, nodes that are well connected in the hypertext. These landmarkscan be used as entry points to topics in the hypertext.
Link refinement The usability of the hypertext thus constructed is tested in several ways. Forexample, the links may be tested to see whether they facilitate navigation. Links may beadded or removed to improve the local and global coherence of the hypertext.
Hypertext specification The links and nodes of the hypertext are stored in a standard specificationlanguage that can be used to generate hypertexts for a number of hypertext viewing shells.
22

Chignell et al. also include a description of the conversion of a textbook from text to hypertext.In this case, each subsection of the book was placed in a node. The index used for computingnode similarity was derived (manually) from the author and subject indices taken from the text.The similarity between two nodes i and j, sim(i, j) is calculated using the inverse term frequencymeasure:
sim(i; j) = ∑fkjk2i;k2 jg
1Nk
where k is an index term that the two nodes share, and Nk is the number of nodes that term k ap-pears in throughout the hypertext. This is a simplified version of the tf�idf metric that we showedin section 2.3.2. Similarities that exceed a set threshold (that depends on the size of the hypertext)indicate that two nodes should be linked. The links are then organized hierarchically according tothe table of contents of the text.
It should be noted that the system described by Chignell et al. was a prototype, and some ofthe tasks which were carried out manually (e.g., building the index) could be done automatically.It is unclear how this system could be extended to handle a set of documents, rather than a singledocument. Also, shorter documents may defeat the statistical techniques used, since the numberof nodes will be small and there might not be enough term repetition. Still, this approach shouldperform better than Bernstein’s since it is based on strict term repetition rather than substringmatching. It also requires a method to break the text into nodes. In the absence of a logical de-scription (i.e., the table of contents), the system would have to resort to much smaller node sizes(e.g., paragraphs), which might decrease the likelihood of term repetitions, making it even moredifficult to build the links between paragraphs.
Unrestricted hypertext construction
More recently, Allan (1995) has been working on the automatic construction of hypertexts usingthe vector space model described in section 2.3.2. His work is significant in that it is intended towork on unrestricted collections of documents, rather than on single documents.
The similarity computation used in vector space IR systems lends itself very easily to buildinghypertext links between documents. From a query document, several kinds of links to a relateddocument can be built:
� A link to the beginning of the most similar matching document or to the passages of thatdocument that have the highest local similarity.
� A link between the passages of the query document and the matching documents that arethe most similar.
� Links between the query document and all documents that show a sufficient similarity. Thethreshold could be set to 0 to link all similar documents.
� Links between documents that show global similarity, but fail the local similarity constraints.
Allan presents a method for visualizing the links between two documents as a graph. By con-sidering these graphs, Allan develops methods so that hypertexts generated using some combi-nation of the above link types can be simplified, and the links between documents and parts ofdocuments can be automatically typed. In general, the procedure for describing the type of a linkis as follows:
23

1. Decompose each document into parts. In Allan’s examples, paragraphs are used, since theycan usually be detected even when no mark-up language is used.
2. Compare each part of the first document to each part of the second document, noting whichpairs have a non-zero similarity. This is the global similarity constraint.
3. For each such pair, apply a local similarity constraint by:
(a) Breaking the two parts into sub-parts (sentences in this case).
(b) Compare each of the sub-parts of the parts as above. Note the highest sub-part similar-ity.
If there is at least one sub-part pair similarity that exceeds a threshold, mark that pair as“good”, otherwise mark it as “tenuous”.
4. If there are any “good” pairs that have a similarity over another (higher) threshold, markthem as “strong” and the others as “weak”.
5. Simplify the connections between the documents’ parts by merging nearby links.
6. Identify patterns within the simplified set of part links and use those patterns to identify thetype of the link.
Links are merged by considering the distance between them. The distance is calculated in thefollowing fashion: suppose that document D1 contains two text sections α1 and β1 and documentD2 contains two text sections α2 and β2. Furthermore, suppose that there are two links A and Bthat connect, respectively, α1 to α2 and β1 to β2. We can then define the distance between A andB as the sum of the proportion of the document that lies between α i and βi. This is a real numberthat may vary between 0 and 2.
Link pairs with the smallest distances are merged first, and the result is what Allan calls ameta-link that connects a larger section of the two documents. If two pairs of links have the samedistance, then one pair is selected by considering the relationship between the links, that is, what“shape” the links form. Merging continues until there is no pair of links with a distance smallerthan a given threshold (which Allan sets at 0.10). Once the merging is complete, the final set oflinks is analyzed to detect patterns that will assist in the typing of the link. Allan specifies fourmeasurements that are useful in identifying patterns:
Convolution How “parallel” were the links that made up a meta-link?
Expansion How much extraneous text was added at one endpoint during meta-link creation?
Relative size What proportion of two documents is included in a link?
Absolute size What size are the sections linked?
These measurements can be used to determine the following link types:
Revision Links documents with very little convolution and whose paragraphs remain in the sameorder.
Summary/expansion Links documents that have many strong paragraph links, but are also spe-cial because of what is not linked. One would expect that a summary document is largelycomposed of a smaller part of the expanded document.
24

Equivalence Links other strongly related documents that don’t fall into the above two categories.
Contrast Links documents that have strong local similarities but weak global similarities.
Tangent Links documents that fail the global/local constraints.
Comparison Links that don’t fall into any of the above categories.
Allan proposes an informal evaluation of the link typing process discussed above. Subjects(Computer Science graduate students) were given two encyclopedia articles that had been relatedby the algorithm and asked several questions to determine what they believed the relationshipbetween the texts to be. Their answers could then be compared against the automatically gener-ated link types. The results of the study were somewhat ambiguous. There was little consistencybetween the answers of the subjects, especially when determining the degree of relatedness of twotexts. In general, the results seemed to show that the system performed well in choosing distinctpassages that were well focused.
Despite the simplicity of the underlying vector space model, Allan’s work is one of the bestattempts at fully automatic hypertext construction on a large scale. Unfortunately, because of theunderlying model, it has a few problems. Most notably, it requires strict term repetition to work.This is not much of a problem when dealing with large sections of text where term repetition willbe common, but in smaller sections of text, the system may encounter problems1. The problem ofpolysemy has been moderately well handled by the global/local constraints on similarity measure-ment, at the cost of some efficiency. There has been no attempt to deal with synonymy, although amechanism similar to Vorhees’ (1994) could be used in this respect.
It is unfortunate that his link typing experiments proved inconclusive. The fact that his subjectswere inconsistent in their judgments of the relatedness of two texts may simply be another facet ofthe inconsistency demonstrated by Ellis et al.
2.6 Models of hypertext search
While research in automatic hypertext generation is interesting, it is important to determine whetherhypertext browsing is a viable method for performing IR tasks. In particular, we want to under-stand how browsing is incorporated into the search strategies of different classes of users. Further-more, we need to consider what kinds of tasks are best performed using hypertext rather than atraditional IR system. In this section we will consider some of the empirical studies that have beenconducted to answer these questions.
2.6.1 Paper versus electronic systems
Marchionini (1989) has investigated searcher behaviour in the transition from a print to an elec-tronic version of an encyclopedia. Subjects in the experiment (high school students) performedthree searches. The first was a “mental search” that was intended to gather information abouttheir mental models for information seeking. Subjects were given a research problem and thenwere asked how they would begin searching for information to solve the problem. Specifically,they were asked what sources they would consult and what terms they would use to search thesesources. They were also asked what they expected the results of these searches would be. Theywere asked why they had selected a particular source, and asked what their next source would be.These questions were repeated until the subject could provide no further sources.
1Allan has confirmed that this may indeed be the case (personal communication).
25

The second search that the subjects performed was a print search. Students were asked toperform a search for information on a specific topic (possibly provided by the subject) using theprint version of an encyclopedia. The terms that the subjects used to find articles and whetherthey used the index or went directly to articles were noted. Subjects were also questioned as towhy they had taken particular actions. The searches were limited to 35 minutes.
The third search was performed using an electronic version of the same encyclopedia used forthe second search. The subjects had been introduced to the electronic version previously, and hadhad the use of the Boolean connectives AND and OR demonstrated to them. The researchers gaveno advice to the students, and time was reserved so that the subjects could be interviewed aboutthe difference between the print and electronic versions of the encyclopedia.
The results of the experiment showed that there was little variation in the search outcomebetween the print and electronic versions of the encyclopedia. Variation occurred only in the cate-gory of “too many hits”, which would seem to be a consequence of full-text searching as opposedto using the print encyclopedia’s index. They did find that searches in the electronic version ofthe encyclopedia took almost twice as long as searches in the print version. In general, the sub-jects took little advantage of the electronic search features. Although two-thirds of the searcheswere performed using full-text matching, less than half of those used AND as a connective, and nosubjects used the proximity features (e.g., NEAR) or the OR or NOT connectives.
The subjects also tended to ignore the complex screen displays of the electronic encyclopediaand accept default settings. The subjects made some use of the hypertext characteristics availablein the system (e.g., jumping from one occurrence of a keyword to the next), but these aspects alsoseemed to cause some problems. For example, when an article was displayed, the first paragraphshown was the one which contained the first occurrence of a keyword. Subjects would then readfrom that point down, ignoring the text above. Subjects also demonstrated some “lost in hypertext”phenomena, such as trying to move up or down when at the top or bottom of an article.
2.6.2 The role of domain and search expertise
Marchionini et al. have also explored the role of domain and search expertise in full-text searching.(Marchionini et al., 1993) reports on several studies that have been conducted, specifically exam-ining the roles of domain and search expertise in several fields (e.g., computer science, law). Ingeneral, domain experts focus on answers to their problems. They understand the problems andhave expectations about the answers. They use technical terminology in their queries and devotelarge amounts of their search time to examining search results by scanning, reading, and assessingtext. They are also capable of quick relevance assessments. Search experts, on the other hand,focus on query formulation, gathering documents, the structure of the database, and refining theirqueries. Texts are examined briefly in order to generate more query terms and to gain a better un-derstanding of the problem. Their relevance judgments are more tentative than those of domainexperts.
So, both domain and search experts use browsing as a part of their information-seeking strate-gies, although domain experts and novice searchers make more use of browsing (i.e., reading textsand scanning title lists). Marchionini et al. argue that this browsing lessens the cognitive load onthe searcher. They do note however that browsing is often inefficient early in a search and takesmore time than a focused search. Also, novices and domain experts may accept browsing as thedefault strategy if a system “invites” browsing. They recommend that multiple interfaces to adatabase be available in order to support both focused searches and browsing.
Tenopir and Shu (1989) have also found that users of a full-text information retrieval system(for general-interest magazines) often use browsing in their search strategies. Most users of such a
26
system were searching for background information on a certain subject. Tenopir and Shu come tomuch the same conclusions as Marchionini et al.: users of an information retrieval system shouldbe presented with a range of options for searching and browsing.
Hertzum and Frøkjær (1996), while investigating the effects of user interfaces in online docu-mentation, found that printed manuals provide answers more quickly and more accurately, butthat browsing was the fastest mode of searching and the mode that caused the fewest operationalerrors.
2.6.3 When hypertext is most useful
Rada and Murphy (1992) have conducted an experiment to determine the relationship betweeninformation-seeking tasks, user types, and tools for viewing hypertext. Their hypothesis was thata hypertext version of a textbook would help readers perform queries. They make a distinctionbetween search queries, in which there is a single portion of the document that gives the answer(i.e., fact retrieval), and browse queries, in which multiple parts of the document must be consulted(i.e., complex question-answering).
In their study, a textbook was converted to several different hypertext representations (Em-acs-Info, Guide, HyperTies, and MaxiBook). Subjects were classified as either experts (i.e., expertsin hypertext software), trainees, or novices. Each expert was given four pairs of questions (eachpair consisting of a search and a browse question) and each novice was given three pairs. Thetrainees were part of a course on hypertext, and were given questions from the course text toanswer using each of the hypertext systems. Their comments on each of the systems were collectedand analyzed.
The results showed that for the experts, search questions were answered more accurately andcompletely using the hypertext versions of the textbook, while browse questions were answeredmore accurately and completely using the paper versions of the textbook. There was also a signif-icant difference in the search times between the hypertext and paper versions, with the hypertextsearches taking longer. Novices performed both tasks more accurately and completely using thepaper version, and also took more time with the hypertext version. Their results were better forthe browsing questions than for the search questions.
This does not necessarily contradict the conclusions of Marchionini et al., nor those of Teno-pir and Shu and Hertzum or Frøkjær, since it is true that the novice users did perform better onthe browsing tasks. The fact that the novices preferred the paper version of the textbook to thehypertext version is somewhat troubling. This may be due to the fact that the hypertext was con-structed using only structural links, and no semantic links. Also, this result is only for a (relatively)small hypertext. It would be interesting to see how the novices would have fared in a large (i.e.,multi-thousand document) hypertext, where the use of the paper form would be problematic.
Lehto et al. (1995) have come to similar conclusions. In their study, users were given hyper-text versions of two different texts. The first text was an annotated bibliography of warning-related issues, intended for practitioners and researchers interested in obtaining overviews of re-cent warnings-related research. In this case, the hypertext links were built using the author andsubject indices, as well as a full-text search engine. The second text was a more traditional text-book on industrial ergonomics. In this case, two hypertexts were produced. The first hypertextused links based on full-text indexing, while the second used links based on the author’s indexand the table of contents.
In their first experiment, the participants were required to perform two types of tasks usingthe annotated bibliography: reading-to-do tasks (search queries) that required users to find andrecord which annotations contained relevant information for a very specific topic, and reading-to-
27

learn tasks (browse queries) that required the user to become familiar with general safety relatedtopics. They found that for the search queries, users of the hypertext answered more quickly andmore accurately than users of the book. For the browse queries, book users provided more correctanswers and took a slightly shorter time.
In their second experiment, users were given a set of 10 questions to answer using either thehypertext containing machine-generated links created by full-text indexing or the one containingmanually-generated links that were created from the table of contents and the subject index. Theyfound that responses were given more quickly and accurately using the manually-generated links.
This is an interesting result, and would seem to discourage us from using machine-generatedlinks, but Lehto et al. recognize the difficulty of manually assigning links in large documents and,presumably, large document collections. Furthermore, this is a single result and further investiga-tion of the conclusions is warranted. At any rate, Lehto et al. suggest providing links generatedboth manually and automatically. Considering the relatively simple ways in which the hypertextlinks were automatically generated, an improvement in automatic generation may provide betterresults.
28

Chapter 3Testing inter-linker consistency
If we wish to automatically generate hypertext, then we need to be able to determine when we havebuilt a “good” hypertext. One way to solve this problem is to take manually linked hypertexts,assume that they are “good”, and then train our algorithm to produce similar hypertexts. Thereare two problems with this approach. Firstly, it is difficult to find a large number of manually-linked documents, since this process is extremely time-consuming. Secondly, Ellis et al.’s (1994a)results (reported in section 2.4.1) cast doubt on the consistency of such hypertexts.
Earlier, we noted some deficiencies in Ellis et al.’s study. Due to the time-consuming natureof the task, the number of hypertexts that they were able to collect was small (five hypertext ver-sions of each of five documents, allowing only 50 pairs of different hypertexts). The nature ofthe documents linked (i.e., their length and complexity) might have also had an adverse effect oninter-linker consistency. This raises the question of how subjects would fare when presented withshorter documents that have undergone a strict editorial process and are written with a more reg-ular structure. Ellis et al. themselves suggested that the experiment should be repeated under suchcircumstances, and this chapter details our efforts at replicating it.
3.1 Methodological issues
In the original study, Ellis et al. had their subjects place two different kinds of links between nodes:from a term in one node to the beginning of another or from an entire node to the beginning ofanother. In our replication, we allowed only the second type of link. We made this decision simplybecause of the nature of the text being linked. In the original study, the documents being linkedwere of a highly technical nature, and so such “definitional” links are more appropriate than theywould be in a more general domain (such as newspaper articles).
Another difference is that the subjects in the original study used an authoring system based onthe Guide hypertext system. In our study, the linking task was performed using pencil and paper.This saved us from having to tutor the subjects (some of whom had little computer experienceof any kind) in an unknown system. It was also more natural for the subjects, who are used toreading newspaper stories on paper, and not on a computer screen.
Because we used a pencil-and-paper system, no links were automatically generated in the ar-ticles. In the original study, these links were built so that the subjects could navigate throughthe documents in a linear fashion, which was unnecessary in our case. Thus, we only concernedourselves with what Ellis et al. called Type 3 link sets.
29

3.2 The task
Subjects were presented with three newspaper articles. These articles were not selected randomly;rather they were selected so that there would be a variation in topic, story structure, and length.One hard news story of 20 paragraphs, and two feature stories of 33 and 47 paragraphs wereselected. The hard news article reported recent studies on the effect of acid rain on sugar maples,while the feature articles were about a bank scandal and white collar crime in Silicon Valley. Forease of reference, we will call these the “maple syrup” article, the “bank scandal” article, and the“Silicon Valley” article respectively.
The articles presented to the subjects were printed in two columns so that their format wassimilar to something that would be found in an actual newspaper. The paragraphs of the articleswere numbered so that they could be referenced easily. The subjects were then given a worksheetand asked to write down pairs of numbers indicating which paragraphs they thought were related.In the instructions to the subjects, the term related was loosely defined as “paragraphs that share asimilar topic or topics. Essentially, related paragraphs are ‘about’ the same subject.” We felt that itwas necessary to leave the definition of related somewhat vague, so as not to influence the subjectsunduly.
Subjects were reassured that there were no “right” or “wrong” answers, and were urged towrite down pairs of numbers for any paragraphs that they felt were related, even if the paragraphswere adjacent in the story. They were advised that it was acceptable not to include a paragraph inany pairs or to have one paragraph in many different pairs. We suggested to the subjects that theymay wish to read the entire article before beginning to record pairs.
3.3 Results
The pairs of paragraphs that the subjects designated as related were used to build adjacency matrixrepresentations. These matrices could then be used to calculate the similarity of the hypertexts inthe same manner as Ellis et al. Table 3.1 shows the adjacency matrix from one subject for the maplesyrup article.3.3.1 Examining the data
In general, the number of links assigned by the subjects was much smaller than the number oflinks possible. Table 3.2 shows the number of links that each subject placed in each of the articles,along with the average number of links per paragraph. Table 3.3 provides a summary of the data.
Paired t-tests show a significant difference (p < 0:01) in the number of links assigned to thebank scandal article and the maple syrup article. We also see a similar difference in the SiliconValley and maple syrup articles. There is no significant difference in the numbers of links assignedin the bank scandal and Silicon Valley articles. If we consider the average number of links perparagraph, then we find no significant differences between any of the articles. So it appears thatthe subjects placed more links into longer articles, which is to be expected, but that across the threearticles the average number of links per paragraph were about the same.
It is also interesting to consider where the majority of the links were placed. Table 3.4 showsa summary matrix which is the result of adding all of the adjacency matrices for the bank scandalarticle. Note the predominance of links near the diagonal, indicating very short distances for thelinks that the subjects placed into the articles. This predominance suggests that our results wouldbe similar to those of Ellis et al., that is, the lowest consistency between linkers would be foundwhen considering Type 3 link sets.
30

Table 3.1: An adjacency matrix for the maple syrup article.
1 2 3 4 5 6 7 8 9 10 11 12 13 14 15 16 17 18 19 201 0 0 0 1 1 0 0 0 0 0 0 0 1 0 0 0 0 0 0 02 0 0 0 1 1 0 0 0 0 0 0 0 1 0 0 0 1 0 0 03 0 0 0 0 0 0 1 1 1 1 1 1 0 0 0 0 0 0 0 04 0 0 0 0 0 0 0 0 0 0 0 0 1 0 0 0 1 0 0 05 0 0 0 0 0 0 0 0 0 0 0 0 1 0 0 0 1 0 0 06 0 0 0 0 0 0 0 0 0 0 0 0 0 0 0 0 0 0 0 07 0 0 0 0 0 0 0 0 0 0 0 0 0 0 0 0 0 0 0 08 0 0 0 0 0 0 0 0 0 0 0 0 0 0 0 0 0 0 0 09 0 0 0 0 0 0 0 0 0 0 0 0 0 0 0 0 0 0 0 0
10 0 0 0 0 0 0 0 0 0 0 0 0 0 0 0 0 0 0 0 011 0 0 0 0 0 0 0 0 0 0 0 0 0 0 0 0 0 0 0 012 0 0 0 0 0 0 0 0 0 0 0 0 0 0 0 0 0 0 0 013 0 0 0 0 0 0 0 0 0 0 0 0 0 0 0 0 1 0 0 014 0 0 0 0 0 0 0 0 0 0 0 0 0 0 0 1 0 0 0 015 0 0 0 0 0 0 0 0 0 0 0 0 0 0 0 0 0 0 0 016 0 0 0 0 0 0 0 0 0 0 0 0 0 0 0 0 0 0 0 017 0 0 0 0 0 0 0 0 0 0 0 0 0 0 0 0 0 0 0 018 0 0 0 0 0 0 0 0 0 0 0 0 0 0 0 0 0 0 0 119 0 0 0 0 0 0 0 0 0 0 0 0 0 0 0 0 0 0 0 020 0 1 0 1 1 1 1 1 1 0 0 0 0 0 0 0 0 0 0 0
Table 3.2: Link counts by subject and article.Article
Bank scandal Maple syrup Silicon ValleySubject Links Avg. Links Avg. Links Avg.A01 13 0.39 13 0.65 24 0.51A02 23 0.70 13 0.65 28 0.60A03 31 0.94 17 0.85 47 1.00A04 92 2.79 32 1.60 48 1.02A05 29 0.88 21 1.05 65 1.38A06 38 1.15 17 0.85 44 0.94A07 29 0.88 22 1.10 51 1.09A08 25 0.76 16 0.80 47 1.00A09 23 0.70 19 0.95 76 1.62A10 35 1.06 16 0.80 43 0.92A11 53 1.61 40 2.00 53 1.13A12 13 0.39 8 0.40 21 0.45A13 44 1.33 28 1.40 48 1.02A14 60 1.82 31 1.55 44 0.94
31

Table 3.3: Summary of link counts per article.
Number Mean StandardArticle of Paragraphs Min Max Mean Per Para. DeviationBank scandal 33 13 92 36.3 1.01 21.0Maple syrup 20 8 40 20.9 1.04 8.8Silicon Valley 47 21 76 45.6 0.97 14.7
Table 3.4: Summary matrix for the bank scandal article.
1 2 3 4 5 6 7 8 9 10 11 12 13 14 15 16 17 18 19 20 21 22 23 24 25 26 27 28 29 30 31 32 331 0 0 3 2 0 2 1 0 4 0 0 0 0 0 0 0 0 1 0 1 0 1 1 1 0 1 0 0 0 0 0 1 02 0 0 0 5 0 5 4 4 3 1 0 0 0 0 0 0 0 1 0 0 0 1 1 0 0 2 0 0 0 0 0 1 03 0 0 0 0 0 3 0 0 5 0 0 0 0 0 0 0 0 0 0 0 0 4 0 2 0 0 0 0 0 0 0 0 04 0 0 0 0 0 0 2 3 8 2 5 1 5 1 1 0 1 1 1 1 0 0 0 0 0 0 1 1 0 0 0 0 05 0 0 0 0 0 0 0 0 2 0 2 1 1 1 1 0 1 0 1 1 0 0 0 0 0 0 0 0 0 0 0 0 06 0 0 0 0 0 0 0 5 3 1 0 0 0 1 0 0 1 0 0 1 1 1 0 4 0 5 0 0 2 5 0 3 17 0 0 0 0 0 0 0 0 2 3 1 5 4 1 1 2 2 3 0 0 1 0 0 0 0 0 0 0 0 0 0 0 08 0 0 0 0 0 0 0 0 0 2 1 0 1 0 0 0 0 0 0 2 0 2 0 1 0 1 0 0 0 0 0 1 19 0 0 0 0 0 0 0 0 0 0 1 0 2 0 0 0 0 0 0 0 0 1 0 0 0 1 0 0 0 0 0 0 0
10 0 0 0 0 0 0 0 0 0 0 0 0 0 0 0 0 1 0 0 0 0 0 0 0 0 1 1 0 0 0 0 0 011 0 1 0 1 1 0 0 0 0 0 0 0 0 0 0 0 1 0 0 0 0 0 0 0 0 0 0 0 0 0 0 0 012 0 1 0 1 1 0 2 0 0 0 0 0 0 4 3 1 2 0 2 3 0 0 0 0 0 0 0 0 0 0 0 0 013 0 1 0 2 0 0 2 1 1 0 0 0 0 0 2 0 1 0 1 3 0 1 0 0 0 1 0 0 0 0 0 0 014 0 0 0 0 1 0 1 0 0 0 0 0 0 0 0 0 1 0 1 2 1 0 0 0 0 0 0 0 0 0 0 1 115 0 0 0 0 0 0 1 0 1 0 0 1 0 0 0 0 8 1 5 1 0 0 0 0 0 0 0 0 0 0 0 0 016 0 1 0 1 0 0 0 0 0 0 0 0 0 1 0 0 0 1 1 0 3 0 0 0 0 0 0 0 0 0 0 0 017 0 0 0 0 0 0 0 0 0 0 1 0 0 2 0 0 0 0 1 2 0 0 0 0 0 0 0 0 0 0 0 0 018 0 0 0 0 0 0 2 0 0 0 0 0 0 0 0 0 0 0 0 1 0 0 0 0 0 0 0 0 0 0 0 0 019 0 0 0 0 0 0 0 0 0 0 0 0 0 0 1 0 1 0 0 0 0 0 0 0 0 0 0 0 0 0 0 0 020 0 0 0 1 0 0 0 0 0 0 0 0 1 1 0 0 0 0 0 0 0 0 1 1 0 0 0 0 0 0 1 0 021 0 0 0 0 0 0 0 0 0 0 0 0 0 0 0 0 0 0 0 0 0 0 4 2 1 0 0 0 0 0 1 1 122 1 0 3 0 0 1 0 0 1 0 0 0 0 1 0 0 0 0 0 0 0 0 0 3 0 0 0 2 0 1 0 0 023 0 0 0 0 0 0 0 0 0 0 0 0 0 0 0 0 0 0 0 0 1 0 0 0 3 0 0 0 1 1 0 1 024 0 0 0 0 0 2 0 0 0 0 0 0 0 0 0 0 0 0 0 0 0 1 0 0 0 3 1 0 0 1 1 0 025 0 0 0 0 0 0 0 0 0 0 0 0 0 1 0 0 0 0 0 0 0 1 1 0 0 0 0 0 0 0 0 2 726 0 0 0 0 0 0 1 0 1 0 0 0 0 0 0 0 0 0 0 0 0 0 0 1 0 0 0 0 0 1 0 0 027 0 0 0 0 0 0 0 1 0 0 0 0 0 0 0 0 0 0 0 0 0 0 0 0 0 0 0 0 3 1 0 0 028 0 0 0 0 0 0 0 0 0 0 0 0 0 0 0 0 0 0 0 0 0 0 0 0 0 1 0 0 0 4 0 0 029 0 0 0 0 0 1 0 0 0 0 0 0 0 0 0 0 0 0 0 0 0 0 0 0 0 0 0 0 0 0 0 0 030 0 0 0 0 0 1 0 1 0 0 0 0 0 0 0 0 0 0 0 0 0 0 1 0 0 1 0 0 0 0 0 1 031 0 0 0 0 0 0 0 0 0 0 0 0 0 0 0 0 0 0 0 0 1 0 0 0 0 0 0 0 0 0 0 0 132 1 1 0 0 0 0 0 0 0 0 0 0 0 1 0 0 0 0 0 0 0 1 0 0 1 0 0 0 0 0 0 0 033 0 0 0 0 0 0 0 0 0 0 0 0 0 0 0 0 0 0 0 0 0 2 0 0 1 0 0 0 0 0 0 0 0
32

3.3.2 Similarity results
The result of each of the 14 subjects placing links between the paragraphs of each of the threearticles is 14 hypertext versions of each of the articles. With 14 hypertext versions, there are 91possible pairs of hypertexts for each of the articles, giving a total of 273 possible hypertext pairsfor all articles. We computed graph similarities among all pairs of adjacency matrices using singlen-tuple, multiple n-tuple, and node index representations of the adjacency matrices. Only Type 3link sets were considered, since these sets demonstrate most clearly the non-linear links that thesubjects produced.
Figure 3.1 shows a histogram of similarity frequencies for the maple syrup article. These simi-larities were calculated using the Dice coefficient of similarity and a single n-tuple representationof the adjacency matrix.
0.00 0.20 0.40 0.60 0.80 1.00Hypertext Similarity (Dice coefficient)
0.0
2.0
4.0
6.0
8.0
10.0
12.0
Freq
uenc
y of
Sim
ilarit
y
Figure 3.1: Histogram of similarity frequencies for the maple syrup article.
This is the shortest of the three articles, with only 20 paragraphs. It is also the article that hadthe highest mean similarity among the three articles when calculated under the above conditions.The mean similarity among all 91 hypertext pairs for the maple syrup article was 0.35, while themean similarity was 0.22 and 0.29 for the bank scandal and Silicon Valley articles, respectively.Figures 3.2 and 3.3 show the similarity frequency histograms for the bank scandal and SiliconValley articles respectively. Notice that they are skewed more towards 0 than the graph in figure3.1.
Figure 3.4 shows the similarity frequency histogram for all possible document pairs in ourstudy. This graph can be compared to the similarity frequency histogram shown in figure 2.4,which gives the corresponding data from the original study. The mean similarity in this case inthe original study was 0.116, with a standard deviation of 0.161. Thus, the 95% confidence intervalfor this mean was (0.0712, 0.161). In our study, the mean similarity across 273 document pairs was0.285 and the standard deviation was 0.151. The 95% confidence interval for this mean is (0.267,
33

0.00 0.20 0.40 0.60 0.80 1.00Hypertext Similarity (Dice coefficient)
0.0
2.0
4.0
6.0
8.0
10.0
12.0
Freq
uenc
y of
Sim
ilarit
y
Figure 3.2: Histogram of similarity frequencies for the bank scandal article.
0.00 0.20 0.40 0.60 0.80 1.00Hypertext Similarity (Dice coefficient)
0.0
2.0
4.0
6.0
8.0
10.0
12.0
Freq
uenc
y of
Sim
ilarit
y
Figure 3.3: Histogram of similarity frequencies for the Silicon Valley article.
34
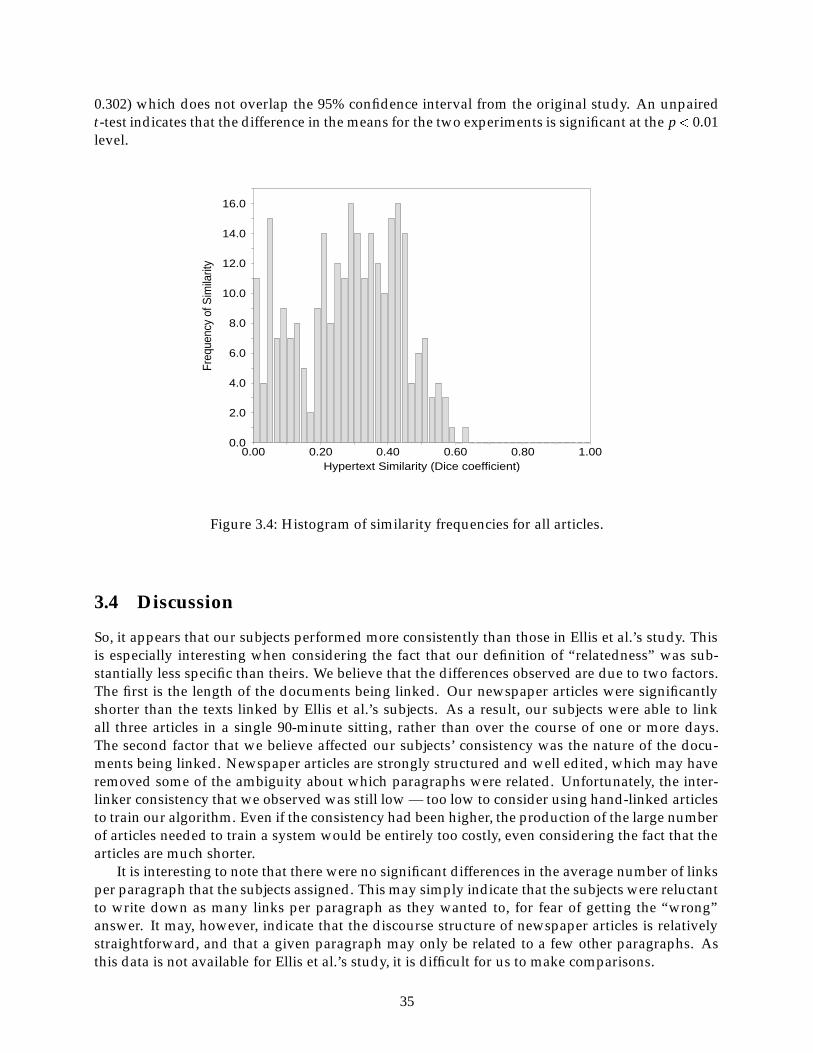
0.302) which does not overlap the 95% confidence interval from the original study. An unpairedt-test indicates that the difference in the means for the two experiments is significant at the p< 0:01level.
0.00 0.20 0.40 0.60 0.80 1.00Hypertext Similarity (Dice coefficient)
0.0
2.0
4.0
6.0
8.0
10.0
12.0
14.0
16.0Fr
eque
ncy
of S
imila
rity
Figure 3.4: Histogram of similarity frequencies for all articles.
3.4 Discussion
So, it appears that our subjects performed more consistently than those in Ellis et al.’s study. Thisis especially interesting when considering the fact that our definition of “relatedness” was sub-stantially less specific than theirs. We believe that the differences observed are due to two factors.The first is the length of the documents being linked. Our newspaper articles were significantlyshorter than the texts linked by Ellis et al.’s subjects. As a result, our subjects were able to linkall three articles in a single 90-minute sitting, rather than over the course of one or more days.The second factor that we believe affected our subjects’ consistency was the nature of the docu-ments being linked. Newspaper articles are strongly structured and well edited, which may haveremoved some of the ambiguity about which paragraphs were related. Unfortunately, the inter-linker consistency that we observed was still low — too low to consider using hand-linked articlesto train our algorithm. Even if the consistency had been higher, the production of the large numberof articles needed to train a system would be entirely too costly, even considering the fact that thearticles are much shorter.
It is interesting to note that there were no significant differences in the average number of linksper paragraph that the subjects assigned. This may simply indicate that the subjects were reluctantto write down as many links per paragraph as they wanted to, for fear of getting the “wrong”answer. It may, however, indicate that the discourse structure of newspaper articles is relativelystraightforward, and that a given paragraph may only be related to a few other paragraphs. Asthis data is not available for Ellis et al.’s study, it is difficult for us to make comparisons.
35

Even though our subjects showed more consistency than those in Ellis et al.’s study, we stillmust contend with the fact that when humans read something, they bring to the task their ownviews of what is interesting and important. These biases will undoubtedly affect how they performthe task of linking related paragraphs. Studies of inter-indexer inconsistency have shown thatconsistency can be increased by using a controlled vocabulary of index terms (see, for example,Tarr and Borko, 1974). Unfortunately, there is no such “controlled vocabulary” of hypertext links,although our study seems to indicate that providing shorter, more strongly structured documentsmay have a similar effect. Building large-scale hypertext is still a relatively new task, and whilesuch a “vocabulary” might eventually develop, it is difficult to tell when or if that will occur.
The kind of automatic hypertext generation methodology that we will discuss in the next chap-ter has the benefit that, even if the results are not perfect, the process is at least mechanistic andunderstandable.
36

Chapter 4Linking within the article
As part of their work, Morris and Hirst (1991) demonstrated that the structure of the lexical chainsin a document corresponds to the structure of the document (see section 2.2 above). In other words,the lexical chains will tend to delineate the parts of a document that are “about” the same topic.Due to the difficulty of building lexical chains by hand, they did not test whether this is the casefor a large number of texts. If the lexical chains do indicate the structure of the document, thenthey are a natural tool to use when attempting to build a hypertext representation of a document.If we are using documents that have a strict structure, such as newspaper articles, then the chainsshould prove sufficient to build intra-article links, that is, hypertext links within an article.
As we said in section 2.1, newspaper articles are written so that one may stop reading at theend of any paragraph and feel as though they have read a complete article. For this reason, itis natural to choose to use paragraphs as the nodes in our hypertext. Figure 4.1 shows the first,second, fifth, and eighth paragraphs of a news article about the trend towards “virtual parent-ing” (Shellenbarger, 1995). As before, superscript numbers after a term indicate to which chaina term belongs. Table 4.1 shows the lexical chains contained in the article. Here, the numbers inparentheses indicate the number of times that a particular term appears in the article.
We will use this particular article to illustrate the process of building intra-article links. Beforewe begin, however, we should look at the structure of the article, in terms of how it talks about thephenomena of virtual parenting. We can do this on a paragraph by paragraph basis, as shown intable 4.2. There are several ways in which we could generate links between the paragraphs of thisarticle, many of which would be useful and valid. We choose to consider how this article shouldbe linked for someone who is trying to find out exactly what virtual parenting is. In this case, linkswould probably be most useful from paragraph 2 (the definition of the term) to paragraphs 5, 6, 7,8, and 9 (examples of and warnings about virtual parenting).
In their original work on lexical chaining, Morris and Hirst showed a mapping between thelexical chains contained in a document and the discourse intentions (i.e., the topics the writer in-tends to discuss) in the document. Unfortunately, they gave no easily implementable algorithmfor determining this correspondence. Furthermore, they provided no way to determine the relat-edness of two parts of the document. Our goal is to provide a method to make this determination.Because this has not been attempted before, we shall try to use techniques that are as simple aspossible to begin with, and only turn to more complex techniques if necessary.
In general, our approach is similar to Morris and Hirst’s in that we assume that the parts of adocument that have the same lexical chains are about the same thing, but we are willing to considerthat a particular unit of a document’s structure may be indicated by the presence of many chains.
37

Table 4.1: Lexical chains in the virtual parenting article.
C Word Syn C Word Syn C Word Syn1 working (5) 40755 21551 school (1) 55261
ground (1) 58279 21577 university (1) 55299field (1) 57992 office (1) 21928 company (1) 54918antarctica (1) 58519 place (1) 21928 11 brochure (1) 47300michigan (1) 57513 work (1) 21919 12 giving (1) 19911feed (1) 53429 calling (1) 21911 pushing (1) 20001chain (1) 57822 business (3) 21909 push (1) 20001hazard (1) 77281 game (1) 21910 high-tech (2) 19957risk (1) 77281 homework (1) 22348 13 step (1) 20667young (2) 24623 babysitting (1) 22205 21665need (1) 58548 works (1) 21890 travel (1) 20661parent (7) 62334 bother (1) 51139 promotion (2) 20336kid (3) 60256 technology (2) 23165 campaign (1) 23228child (1) 60256 overuse (1) 23173 expedition (1) 20778baby (1) 59820 using (2) 21236 petersburg (1) 24516wife (1) 63852 4 folk (1) 54362 united states (1) 57412adult (1) 59073 family (4) 54362 city (1) 56043traveller (3) 59140 5 left (1) 20946 new york (1) 57551substitute (1) 63327 37680 14 calm (1) 42035backup (1) 63327 44572 15 real (1) 73220computer (1) 60118 55723 74629expert (1) 59108 56371 16 headgear (1) 36154mark (1) 60270 6 reality (2) 75601 17 break (1) 50935worker (1) 59145 75603 51123speaker (1) 63258 state (1) 19695 separation (1) 51004advertiser (1) 59643 excess (1) 76985 going (1) 51014entrepreneur (1) 60889 age (1) 42122 18 course (1) 56574engineer (1) 59101 7 inn (1) 36320 trend (1) 56574sitter (1) 59827 8 middle (1) 45633 19 planning (1) 23089consultant (2) 59644 kind (2) 45529 arranging (1) 23127management consultant (1) 61903 form (1) 45529 20 urge (1) 57698man (1) 61902 idea (1) 45509 21 good night (1) 48074flight attendant (1) 63356 9 call (2) 19870 wish (1) 48061
2 residence (1) 56129 20208 22 phone (2) 40017home (2) 56130 23590 cellular phone (1) 33808
3 note (1) 48602 23591 fax (2) 35302term (1) 48631 46540 gear (1) 32030check (1) 24363 46798 joint (2) 36574stay (1) 24363 47837 junction (1) 36604promise (1) 50589 48737 network (1) 37247example (1) 48215 50172 system (2) 32196advice (1) 48211 50445 audiotape (1) 39983voice (1) 50135 50452 gadget (1) 32428video (3) 46821 50455 23 feel (1) 22808mail (2) 48021 50456 kissing (1) 22806lullaby (1) 21739 10 management (2) 55578 24 newsletter (1) 48253singing (1) 21733 professor (1) 62638 account (1) 48252trick (1) 21586 conference (1) 55372 25 little league (1) 55057play (1) 21240 meeting (1) 55371
38

Working1 parents1 note3: From the folks4 who brought you virtual reality6
and the virtual office3, now comes a new kind8 of altered state6 - virtual par-enting.
Although no one is pushing12 virtual-reality headgear16 as a substitute1 forparents1, many technical ad campaigns13 are promoting cellular phones22,faxes22, computers1 and pagers to working1 parents1 as a way of bridgingseparations17 from their kids1. A recent promotion13 by A T & T and Res-idence2 Inns7 in the United States13, for example3, suggests that business3
travellers1 with young1 children use video3 and audiotapes22, voice3 mail3,videophones and E-mail to stay3 connected, including kissing23 the kids1
good night21 by phone22.
When Mark1 Vanderbilt, a network22 systems22 engineer1, was planning19 ascientific expedition13 to Antarctica1, he taught his wife1 and three childrento send and receive live video3 feeds1 over the Internet.
More advice3 from advertisers1: Business3 travellers1 can dine with theirkids1 by speaker1-phone or “tuck them in” by cordless phone22. Separately, amanagement10 newsletter24 recommends faxing your child1 when you haveto break17 a promise3 to be home2 or giving12 a young1 child1 a beeper tomake him feel23 more secure when left5 alone.
Figure 4.1: Portions of an article about virtual parenting.
Table 4.2: Description of the paragraphs of the virtual parenting article
Par Chains Topic1 1, 3, 4, 6, 8 Introduction of the term virtual parenting.2 1, 2, 3, 6, 7, 12, 13, 16, 17, 21, 22,
23A definition of virtual parenting — parents usingnew communication technologies to keep in touchwith their kids.
3 1, 3, 4, 9, 10, 12, 13, 19, 20, 22 How businesses are trying to cash in on the trend.4 1, 3, 4, 8, 10, 12, 15, 18, 21 22 The trend is meeting the need of parents.5 1, 3, 13, 19, 22 An example: live video over the Internet.6 1, 3, 10, 13, 14 More examples: using email or recorded videos to
keep in touch.7 1, 3, 4, 9, 11, 13, 17, 22, 24, 25 Advice from communication companies: attend
missed Little League games by cellular phone.8 1, 2, 3, 5, 10, 12, 17, 22, 23, 24 More advice for parents: phone or fax your child
when you’re travelling.9 1, 3, 6, 12, 22 A warning from the man who coined the term vir-
tual parenting.10 1, 2, 3, 4, 8, 10, 13, 22 A warning from someone who designed a system
allowing parents to check up on their kids.11 1, 3, 8 Conclusion: find the middle ground.
39

4.1 Analyzing the lexical chains
We begin our analysis of an article’s structure by determining how “important” each chain is toeach paragraph in the article. By making this determination, we will be able to link togetherparagraphs that share sets of important chains. We judge the importance of a chain to a particularparagraph by calculating the fraction of the content words of the paragraph that are in that chain.We refer to this fraction as the density of that chain in that paragraph. The density of chain c inparagraph p, dc;p, is defined as:
dc;p =wc;p
wp
where wc;p is the number of words from chain c that appear in paragraph p and wp is the numberof content words (i.e., those words that are not stop words) in p. For example, if we considerparagraph 1 of our virtual parenting article, we see that there are two words from chain 1. We alsonote that there are 14 content words in the paragraph. So, in this case, the density of chain 1 inparagraph 1, d1;1 is:
d1;1 =2
14= 0:14
Similarly, we find that d4;1 = 0:07, and so on. The result of these calculations is that each para-graph in the article will have associated with it a vector of chain densities. Each of these vectorswill contain an element for each of the chains in the article. These chain density vectors for our sam-ple article are shown in figure 4.3. Note that an empty element in a vector indicates a density of 0,that is, it indicates that a particular paragraph contained no words from a particular chain.
4.2 Determining paragraph links
As we said earlier, the parts of a document that are about the same thing, and therefore related, willtend to contain the same lexical chains. Given the chain density vectors that we computed above,we need a method to determine the similarity of the sets of chains contained in each paragraph.
4.2.1 Weighting chain density vectors
Although the similarity between paragraphs can be calculated using the chain density vectors asthey are computed from the paragraphs of the article, this does not take into account Morris andHirst’s intuition that some chains are more important (or stronger) than others. Thus, the chaindensity vectors can be weighted using one of three different weighing functions:
Stairmand weighting This strategy is due to Stairmand (1994). The weight for each chain in adocument is computed by considering the distance between successive paragraphs that con-tain elements of the chain. This function will increase1 the density for those chains that havemany elements that occur close together.
Chain length Each element of the chain density vector is weighted by considering the total lengthof that particular chain, that is, the total number of elements in the chain (including termrepetitions). By using this function, we will increase the density of each chain depending
1Note that we are using the term “increase” only for simplicity’s sake. Whether the weighting function increasesor decreases the density of a particular chain depends on whether we are using an association coefficient or a distancecoefficient, respectively, to calculate the similarity between density vectors.
40

Table 4.3: The chain density vectors for the virtual parenting article.Paragraph
Chain 1 2 3 4 5 6 7 8 9 10 111 0.14 0.19 0.07 0.16 0.28 0.18 0.10 0.25 0.24 0.13 0.332 0.02 0.04 0.033 0.14 0.12 0.07 0.11 0.06 0.14 0.14 0.11 0.13 0.13 0.224 0.07 0.11 0.05 0.03 0.035 0.046 0.14 0.02 0.057 0.028 0.07 0.11 0.03 0.119 0.04 0.03
10 0.07 0.05 0.11 0.04 0.0311 0.0312 0.02 0.04 0.05 0.04 0.0313 0.06 0.04 0.06 0.07 0.03 0.0714 0.0415 0.0516 0.0217 0.02 0.03 0.0418 0.1119 0.04 0.0620 0.0421 0.02 0.0522 0.08 0.04 0.05 0.11 0.07 0.07 0.08 0.0323 0.02 0.0424 0.03 0.0425 0.03
Chain Words 8 30 15 15 10 15 16 19 20 15 6Content 14 48 27 19 18 28 29 28 38 30 9Density 0.57 0.62 0.56 0.79 0.56 0.54 0.55 0.68 0.53 0.50 0.67
41

on the number of elements in the chain, the intuition being that long chains represent majoraspects of an article, and so they should contribute more towards the decision to link twoparagraphs.
Overall density Each element of the chain density vector is weighted by considering the densityof that chain throughout the entire article (i.e., the number of elements of the chain divided bythe total number of content words in the document.) This function increases the density forchains that are long with respect to the length of the document, that is, this is a measurementof relative chain length.
4.2.2 Normalizing chain density vectors
We can also normalize the chain density vectors in two different ways:
Unit length The vectors are normalized so that their length is 1.
Zero mean The vectors are normalized so that the mean of the elements in the vector is 0.
Generally speaking, normalization is used to ensure that vectors representing large sectionsof a text are not necessarily more important than vectors representing shorter sections. This isimportant in IR systems such as SMART where the size of the documents in a database may varyconsiderably. It is most likely that this is less useful in the case of newspaper articles, since therewill not be nearly as much variation in the length of paragraphs within a single article.
Although there is apparently no use for these normalization functions in a newspaper context,our experience demonstrates that they become necessary when paragraph size begins to exceedthat typically found in newspaper articles. For example, in section 5.4 we will describe a test inwhich some of the articles were taken from magazines. In these cases, generating intra-article linkswith no normalization function led to an inordinately large number of links.
4.2.3 Calculating paragraph similarity
Once we have the set of (possibly weighted and normalized) chain density vectors, the secondstage of paragraph linking is to compute the similarity between the paragraphs of the article bycomputing the similarity between the chain density vectors representing them. We can computethe similarity between two chain density vectors using any one of 16 similarity coefficients thatwe have taken from Ellis et al. (1994a). These 16 similarity coefficients include both distance coef-ficients (where smaller numbers indicate a greater similarity) and association coefficients (wherelarger numbers indicate a greater similarity). Table 4.4 gives the names and definitions of thesefunctions.
We are assuming that we can choose freely among these coefficients, since they have all beenused in the past to perform exactly the kind of task that we want to use them for, namely comparingthe similarity of two text representations. Ellis et al. selected this subset of the similarity functionsthat have been discussed in the IR literature because they could show that there were no strongcorrelations in their values for a set of test documents.
Once we’ve decided on a similarity metric, we can compute the similarity of each pair of chaindensity vectors, giving us a symmetric p� p matrix of similarities, where p is the number of para-graphs in the article. From this matrix we can calculate the mean and the standard deviation of theparagraph similarities.
Table 4.5 shows the 11� 11 similarity matrix for the virtual parenting article. This particularsimilarity matrix was calculated using the Dice association coefficient with no weighting and no
42

Table 4.4: Functions for calculating paragraph similarity.
FunctionName
Formula Range FunctionName
Formula Range
Manhattan ∑ jxi�yij 0 to ∞ Russel/Rao ∑(xi�yi)n 0 to ∞
Mean Manhat-tan
∑ jxi�yijn 0 to ∞ Sokal/Sneath ∑(xi�yi)
2∑ x2i +2∑y2
i �3∑(xi�yi)0 to 1
Euclideanp
∑(xi�yi)2 0 to ∞ Kulczynski (1) ∑(xi�yi)
∑x2i +∑y2
i �2∑(xi�yi)0 to ∞
Mean Eu-clidean
p∑(xi�yi)2
n 0 to ∞ Ochialp
∑(xi�yi)p∑x2
i �∑ y2i
0 to 1
Mean SquaredEuclidean
∑(xi�yi)2
n 0 to ∞ Kulczynski (2)∑(xi �yi)
2 (∑x2i �∑ y2
i )
∑x2i +∑y2
i0 to ∞
Bray/Curtis ∑ jxi�yij
∑(xi+yi)0 to 1 Forbes n∑(xi�yi)p
∑x2i �∑ y2
i
0 to ∞
Jaccard ∑(xi�yi)
∑x2i +∑y2
i �∑(xi�yi)0 to 1 Fossum n∑(xi�yi)�1=2
∑x2i �∑y2
i0 to ∞
Dice 2∑(xi�yi)
∑x2i +∑y2
i0 to 1 Simpson ∑min(xi;yi)
min(∑xi;∑yi)0 to 1
43

normalization. Since we used an association metric, larger numbers indicate a greater similarity(i.e., the vectors are closer together). Note that only the upper half of the matrix is shown, and thatthe diagonal entries are all 1.0 (i.e., a paragraph is perfectly similar to itself).
Table 4.5: An 11� 11 similarity matrix for the virtual parenting article, calculated using the Dicecoefficient of similarity.
Par 1 2 3 4 5 6 7 8 9 10 111 1.00 0.70 0.54 0.67 0.56 0.65 0.65 0.64 0.78 0.73 0.712 1.00 0.57 0.71 0.88 0.83 0.84 0.90 0.93 0.89 0.763 1.00 0.59 0.48 0.64 0.67 0.53 0.52 0.72 0.394 1.00 0.64 0.67 0.62 0.72 0.72 0.73 0.715 1.00 0.73 0.65 0.89 0.90 0.72 0.776 1.00 0.72 0.81 0.80 0.88 0.757 1.00 0.73 0.76 0.86 0.608 1.00 0.93 0.78 0.829 1.00 0.80 0.85
10 1.00 0.7111 1.00
Number of pairs: 55Average similarity: 0.72Std. Deviation: 0.12
4.2.4 Deciding on the links
The next step is to decide which paragraphs should be linked, on the basis of the similaritiescomputed in the previous step. We make this decision by looking at how the similarity of twoparagraphs compares to the mean paragraph similarity across the entire article. Each similaritybetween two paragraphs i and j, si; j, is converted to a z-score, zi; j using the well-known formula:
zi; j =si; j �µ
σ
where µ is the mean similarity and σ is the standard deviation. Thus, each similarity is converted toa measure indicating how many standard deviations away from the mean it is. If two paragraphsare more similar than a threshold given in terms of a number of standard deviations, then a link isplaced between them. The result is a symmetric adjacency matrix where a 1 indicates that a linkshould be placed between two paragraphs.
This z-score metric of similarity is meant to capture our intuition that we want to link para-graphs that are “very similar”. The problem is that how similar two paragraphs are will dependon the context in which they occur. Articles with a lot of large chains spread throughout themwill tend to display higher inter-paragraph similarity scores. If we set a simple threshold to de-termine which paragraphs to link, then in cases such as this we will tend to link almost all pairsof paragraphs. This is clearly not the right thing to be doing, as this would severely disrupt thereader. What we would like to do is to link only those paragraphs whose similarity significantlydeviates from the average. The z-score measure that we have proposed is a traditional method fordetermining how much a single number stands out from the mean.
It should be noted that the use of z-scores to determine which paragraphs should be linkedcarries with it the implicit assumption that the paragraph similarities are normally distributed. In
44

order to test this assumption, we collected the inter-paragraph similarity measures from approxi-mately 1,400 randomly selected articles. Kolmogorov-Smirnov tests show that the inter-paragraphsimilarities for most of the articles show no significant deviation from the normal distribution.Thus, we feel that the use of z-scores is reasonably well justified.
Continuing with our example, consider s1;2 = 0:70. We know that the mean paragraph similar-ity is 0.72 and that the standard deviation in paragraph similarity is 0.12. We compute z1;2 in thefollowing way:
z1;2 =s1;2�µ
σ=
0:70�0:720:12
=�0:17
So, s1;2 is 0.17 standard deviations closer to 0 than the mean. If we are using a threshold of 1.0,paragraphs 1 and 2 will not be linked, since in this case z1;2 would have to be greater than 1:0(since higher scores are better.) If, on the other hand, we consider s2;5 = 0:88, then we would havez2;5 = 1:33, and for a threshold of 1.0, we would link paragraphs 2 and 5. Figure 4.6 shows theadjacency matrix that is produced when a z-score threshold of 1.0 is used to compute the linksfrom the similarity matrix in table 4.5.
Table 4.6: Adjacency matrix for the virtual parenting article.
Par 1 2 3 4 5 6 7 8 9 10 111 0 0 0 0 0 0 0 0 0 0 02 0 0 0 1 0 0 1 1 1 03 0 0 0 0 0 0 0 0 04 0 0 0 0 0 0 0 05 0 0 0 1 1 0 06 0 0 0 0 1 07 0 0 0 1 08 0 1 0 09 0 0 1
10 0 011 0
We can visualize this adjacency matrix as a set of links between the paragraphs as in figure 4.2.This set of links shows exactly the kind of connections that we wanted for this article. The secondparagraph (the definition) is linked to paragraphs 5 (an example), 8 (advice), and 9 (a warning).Furthermore, the fifth paragraph is linked to paragraphs 8 and 9.
4.2.5 Examining a connection
At this point we should step back and look at the relations between the words in the linked para-graphs. For example, consider the link that was built between paragraphs 2 and 8. This connectionwas built on the strength of the seven chains that they have in common: chains 1, 2, 3, 12, 17, 22,and 23. Figure 4.3 shows these two paragraphs with only words from these chains highlighted inbold. Terms which are repeated across the two paragraphs are shown in italics. Thus, bold italicterms are both in one of these chains and repeated.
While there is a small amount of term-repetition between these paragraphs (e.g., cellular phone,parent), standard IR methods would not have enough data available to make the connection. The
45

7Advice 1
8Advice 2
9Warning 1
10Warning 2
11Conclusion
1Intro
2Definition
3Cashing In
4Parents
5Example 1
6Example 2
Figure 4.2: Links between paragraphs for the virtual parenting article.
46

Although no one is pushing12 virtual-reality headgear as a substitute1 for par-ents1, many technical ad campaigns are promoting cellular phones22, faxes22,computers1 and pagers to working1 parents1 as a way of bridging separa-tions17 from their kids1. A recent promotion by A T & T and Residence2 Innsin the United States, for example3, suggests that business3 travellers1 withyoung1 children use video3 and audiotapes22, voice3 mail3, videophonesand E-mail to stay3 connected, including kissing23 the kids1 good night byphone22.
More advice3 from advertisers1: Business3 travellers1 can dine with theirkids1 by speaker1-phone or “tuck them in” by cordless phone22. Separately,a management newsletter recommends faxing your child1 when you have tobreak17 a promise3 to be home2 or giving12 a young1 child1 a beeper to makehim feel23 more secure when left alone.
Figure 4.3: Paragraphs 2 and 8 of the virtual parenting article.
lexical chains, on the other hand, connect together synonyms such as kid and child. More-distantconnections are also made between the paragraphs, such as the fact that phones, cellular phones,and faxes are all communication media, or the fact that there is a relation between the words parentand child. This extra information allows the linker to make the connection between these twoparagraphs and build a link between them.
As we have noted, the process of lexical chaining is not perfect, and so we must accept some er-rors (or at least bad decisions) for the benefits that we get. In our sample article, for example, chain1 is a conglomeration of words that would have better been separated into different chains. Thisis a side effect of the current implementation of the lexical chainer, but even with these difficulties,we are able to perform useful tasks.
4.2.6 Generating a hypertext representation
Once the linker decides which paragraphs should be linked, a representation of the hypertext thatcan be used for browsing needs to be produced. We have decided to use HTML as our hypertextrepresentation, since it is an open standard and relatively easy to use. This is not to say that HTMLis the only possible (or even the best) representation, and we have taken care to ensure that thehypertexts that our method produces will be usable in other hypertext systems. For example, inappendix A we show two hypertexts that were rendered into a form suitable for inclusion in thisthesis.
In the current system, there are two ways to output the HTML representation of an article.The first simply displays all of the links that were computed during the last stage of the processdescribed above. The second is more complicated, showing only some of the links. The idea isthat links between physically adjacent paragraphs should be omitted so that they do not clutterthe hypertext, making it more difficult to use.
The process for generating the HTML is as follows: for each paragraph in the story, we first testwhether the current paragraph is the destination of a link from some other paragraph. If it is, thenan HTML anchor is generated with the same name as specified in the source paragraph. The bodyof the paragraph is then output.
At this point, if we are using the first method for displaying the links, then the appropriate rowof the adjacency matrix is scanned, and a link is output for each entry that contains a 1.
If we are using the second method, then links are generated in the following way: first we scan
47

through the appropriate row of the adjacency matrix, looking for the first entry that is 0, in orderthat we not link to directly adjacent paragraphs. We continue scanning until we encounter a 1, andthen output a link for that paragraph and then scan until we reach another 0. The process repeatsuntil each of the other paragraphs has been considered. The result is that the text is broken into“chunks” that are connected by links.
Choosing anchors
Once the linker makes the decision that a link should be present in the hypertext being displayed,it is necessary to select an anchor to represent the link on the page. The anchor is the text that theuser will use to decide whether this is a link that they would like to follow. There is relativelylittle direction about how to build anchors for intra-article links, and several strategies suggestthemselves
We could place the anchors in the text so that they surround the words that connect the twoparagraphs. This is problematic for two reasons. First, given the density of the lexical chains inthe text, and depending on the number of links that are generated, there is a good chance thatthe user will be looking at “blue” text, text that is all links. While this problem can be remediedto some extent using HTML, these anchors would give very little indication about where the linkwould lead: to the same word somewhere else or to a similar word? The second problem withthis strategy is that the same words may participate in links to more than one paragraph. In thiscase, it would be necessary for the user to select the target at the time that she clicks on the link,a task that would unnecessarily interrupt the browsing process (and also be somewhat difficult torepresent in HTML).
It seems more reasonable to separate the anchors from the text of the paragraphs. In the case ofour system, the anchor text selected for these separate links is the first few words of the destinationparagraph. This is a relatively straightforward anchoring strategy that has some problems of itsown, most notably that pronouns in the anchor text are not resolved, leading to confusion aboutwhere a link leads. Still, this strategy seems to be a better one than placing the links within the textof the paragraph.
If the links are placed outside the text of the paragraph, then we must decide how to displaythem to the user. Currently, our system displays the links for a paragraph directly after the text ofthe paragraph. This is relatively intrusive, and it might be better to place the links in a separateframe that would track the user’s motion through the hypertext. The benefit of our present methodis that it is displayable on a wide range of Web browsers, something that cannot be said for a frame-based solution.
4.3 Selecting representative hypertexts
The previous sections detailed our method for the generation of intra-article links, but do notanswer an important question: How do we choose a set of parameters (a similarity coefficient, aweighting function, a normalization function, and a z-score threshold) for generating these links?
Clearly, the choice of a specific set of parameters will produce a particular set of paragraphlinks. We have discussed the 16 similarity metrics available, the choice of four weighting functions(including the choice of no function), and the choice of three normalization functions. The z-scorethreshold is a real number, but our examinations have demonstrated that it seems best to selectthresholds between 1.0 and 2.0 in increments of 0.1, giving us 11 possible similarity thresholds.Given these possibilities, we are capable of generating 4�3�16�11 = 2112 hypertexts. Obviously,
48

not all of these will be distinct, since for many articles, there are less than 2112 possible pairs ofparagraphs.
Fortunately, upon closer examination, the problem is not nearly this complex. As we’ve men-tioned previously, the normalization functions will not be very useful in a newspaper domain,since these kinds of functions are generally meant to prevent the vectors associated with largerparagraphs from “overwhelming” those associated with shorter paragraphs. In newspaper arti-cles, there will be not nearly as much variation in paragraph size as there is in magazine articles.Furthermore, many of the similarity metrics include something very similar to normalization sothat they will generate similarities between 0 and 1. So, if the normalizations will have no effect orif they are already accounted for, we can leave them out of consideration (at least for newspaperarticles).
The z-score threshold can obviously take on a large number of values, but for the most part,the value of this threshold will affect a very visible factor in the hypertext: the number of links.Given the way we’ve developed the linking methodology, as the z-score threshold increases wewill eliminate more and more pairs of paragraphs as possible candidates for linking, since theirz-score will not exceed the increased threshold. This is clearly something straightforward enoughthat it could be put under the control of the user through the use of some sort of sliding controlbetween “More links” and “Less links” with appropriate scores at either end of the interval. If wedo leave this threshold to the user’s taste, then we will need to ensure that any such control willwork in a consistent way, no matter what article it is used for.
Having dealt with normalization and the similarity threshold, we are left with the question ofwhich similarity metric and weighting function to use. Our 16 similarity functions and 4 weightingschemes give us 64 possible hypertexts from a single article. Of course, some of these may be thesame. Even if there are many duplicate hypertexts, we still have the problem of judging whichones are “good”. Unfortunately, we would need to examine a very large number of hypertexts inorder to do this, and the task may be fruitless in any event, since making this judgment seems tobe another aspect of the problems encountered by Ellis et al. and Allan, as discussed in sections2.4.1 and 2.5.2.
Most systems that compute document similarity do so using some variation of the Dice coef-ficient (e.g., the cosine measure used in vector space systems). Ellis et al., however, showed thatthere were no strong correlations among any of the 16 similarity coefficients that we are using.There does not seem to be any a priori way to select among the various similarity coefficients.
It is left to us then to decide how we can reduce this space of possible hypertexts to a set ofrepresentative hypertexts; that is, given the 64 possible combinations of a similarity metric and aweighting function, can we determine which combinations will produce similar hypertexts? Wecan use the method of Ellis et al. to compute the pairwise similarity between all of the hypertextversions of an article and then can then cluster the hypertexts on the basis of their similarity. Bydoing this for a large number of articles, we should be able to use the results to determine if thereis a large number of co-occurrences between any of the 64 combinations.
The idea underlying this computation is that if two hypertexts are highly similar (in the sensethat they have most of the same links), then clearly our algorithm for generating intra-article linksis insensitive to whatever variation there might be in the similarity or weighting function. If wecan find these insensitivities, then we can reduce our problem space to a more manageable size. Ifwe could reduce the number of parameter sets to four or five, then evaluation of which is “best”(or which one people would prefer) would be relatively straightforward.
We performed this clustering operation for a random sample of 97 articles from the Globe andMail of 1992. The average number of paragraphs for these articles was 10.13, and the averageinitial number of hypertexts (after equivalent hypertexts had been removed from consideration),
49

was 20.2. After the clustering operation, the average number of representative sets was 4.31. Un-fortunately, the co-occurrence counts for the pairs of similarity function and weighting functionshow no obvious pattern of co-occurrence — the distribution of pairs among clusters is relativelyuniform.
We would like to submit all of these possible hypertexts to experiment to see which are “best”,but this would be prohibitively expensive, especially in light of the fact that we have not deter-mined yet whether the kind of intra-article links that we are proposing is useful in informationretrieval tasks. In chapter 6 we shall tackle this question.
50

Chapter 5Linking between articles
While it is useful to be able to build links within articles, for a large scale hypertext, links alsoneed to be placed between articles. You will recall from section 2.2 that the output of the lexicalchainer is a list of chains, each chain consisting of one or more words. Each word in a chain hasassociated with it one or more synsets. These synsets indicate the sense of the word as it is beingused in this chain. An example of the kind of output produced by the chainer is shown in table 5.1,which shows the chains extracted from an article (Gadd, 1995b) about cuts in staff at children’s aidsocieties due to a reduction in provincial grants. As before, the numbers in parentheses show thenumber of occurrences of a particular word. Table 5.2 shows another set of chains, this time froman article (Gadd, 1995a) describing the changes in child-protection agencies, due in part to budgetcuts.
It seems quite clear that these two articles are related, and that we would like to place a linkfrom one to the other. It is also clear that the words in these two articles display both of thelinguistic factors that affect IR performance, namely synonymy and polysemy. For example, thefirst set of chains contains the word abuse, while the second set contains the synonym maltreatment.Similarly, the first set of chains includes the word kid, while the second contains child. The wordabuse in the first article has been disambiguated by the lexical chainer into the “cruel or inhumantreatment” sense, as has the word maltreatment from the second article. We once again note thatthe lexical chaining process is not perfect: for example, both texts contain the word abuse, but it hasbeen disambiguated into different senses.
Although the articles share a large number of words, by missing the synonyms or by makingincorrect (or no) judgments about different senses, a traditional IR system might miss the relationbetween these documents or rank them as less related than they really are. Aside from the prob-lems of synonymy and polysemy, we can see that there are also more-distant relations betweenthe words of these two articles. For example, the first set of chains contains the word maltreatmentwhile the second set contains the related word child abuse (a kind of maltreatment).
Our aim is to build hypertext links between articles that will account for the fact that twoarticles that are about the same thing will tend to use similar (although not necessarily the same)words. These inter-article links can be built by determining how links could be built between thewords of the chains from the two articles. By using the lexical chains extracted from the articles,rather than just the words, we can account for the problems of synonymy and polysemy, and wecan take into account some of the more-distant relations between words.
5.1 Comparing chains across documents
Once we have extracted the lexical chains from a document, we can consider how the words thatmake up these chains are related to the chains extracted from another document. This comparison
51

Table 5.1: Lexical chains from an article about cuts in children’s aid societies.C Word Syn C Word Syn C Word Syn1 drop (1) 42930 pay cut (1) 20952 response (2) 64129
fall (1) 42930 hire (1) 24218 process (1) 73369shortfall (1) 42938 decision (1) 20204 reducing (1) 73441deficit (1) 42938 call (1) 20208 pressure (1) 64434
2 aid (3) 72660 travel (1) 20661 22 treatment (1) 23905support (2) 72660 running (1) 20709 management (1) 23903grant (1) 72663 10 saying (1) 50294 government (1) 23871
3 society (7) 54351 interview (2) 50268 23 working (1) 40755group (1) 19698 11 wednesday (1) 79629 extra (1) 33311mother (1) 62088 12 per cent (3) 75017 24 spending (1) 23855parent (4) 62334 proportion (1) 75012 25 social (2) 55184kid (1) 60256 13 cope (1) 36156 26 million (1) 74742recruit (1) 62769 john (1) 40190 27 try (1) 22561employee (2) 60862 board (2) 79392 seeking (1) 22571worker (2) 59145 14 receiving (1) 19907 acting (1) 21759computer (1) 60118 addition (1) 19858 services (1) 21922teen-ager (2) 59638 15 nothing (1) 74685 work (3) 21919provincial (3) 62386 year (1) 79808 risk (2) 22613face (1) 59111 79819 care (1) 22204spokesman (1) 63287 79820 social work (1) 24180insolvent (1) 59869 birth (1) 79543 slowdown (1) 23640annual (1) 64656 start (2) 80111 abuse (3) 21214
4 ron (1) 49609 oct (1) 79867 child abuse (1) 212155 ontario (1) 56918 week (2) 79505 neglect (1) 21235
canadian (1) 58424 79506 28 living (1) 7562959296 yesterday (4) 79599 standing (1) 75573
burlington (1) 57612 day (2) 79595 complaint (1) 76270union (3) 57424 night (1) 79596 agency (1) 75786
6 record (1) 73286 79646 stress (1) 76799budget (2) 73288 16 subdivision (1) 21139 76906pay (1) 72709 39145 29 suck (2) 22767question (1) 48679 47219 30 think (1) 45337
50328 55646 31 family (3) 5436250336 56540 people (3) 54363
information (1) 48081 17 funding (1) 23765 32 executive director (2) 609227 staff (3) 55303 18 number (2) 47893 manager (1) 59634
public (1) 54349 issue (1) 47893 33 times (1) 79443high (2) 55689 monthly (1) 47883 34 money (1) 73198
8 program (3) 45706 19 durham (2) 30254 stake (1) 72746plan (1) 45706 20 region (2) 56394 35 crude (1) 78956attribute (1) 45567 outside (1) 56323 36 empty (1) 35183basis (1) 45366 front line (1) 56193 37 layoff (2) 20457
9 cut (4) 20950 home (2) 55932 38 norm (1) 46113reduction (1) 20949 56234 75184
52

Table 5.2: Lexical chains from a related article.C Word Syn C Word Syn C Word Syn1 canadian (1) 58424 prostitute (1) 62660 6 numbers (1) 21560
river (1) 58309 provincial (2) 62386 7 give (1) 42565rapid (1) 58321 welfare worker (1) 63220 8 laws (1) 47389britain (1) 57004 lorelei (1) 61833 9 onus (1) 45505country (1) 56080 god (1) 58615 10 say (4) 77086ontario (4) 56918 4 protection (2) 22672 11 better (1) 43058toronto (2) 56919 care (5) 22721 43059vancouver (1) 56906 preservation (2) 22676 bad (2) 43062canada (1) 56897 judgment (1) 22881 12 draw (1) 20012new brunswick (1) 56909 act (1) 19697 pulling (1) 20010ottawa (1) 56920 behaviour (1) 24235 leaving (1) 19749support system (1) 55819 24236 sending (1) 20030
2 wit (1) 48647 making (1) 23076 support (3) 20171play (1) 48668 calling (1) 21911 proof (1) 20169abuse (4) 48430 services (2) 21922 getting (1) 19854cut (4) 48431 prevention (1) 23683 13 recurrence (1) 51047criticism (1) 48406 supply (1) 23596 14 single (1) 74692recommendation (1) 48310 providing (3) 23596 number (3) 73854case (1) 48682 maltreatment (2) 21214 factor (1) 73861problem (1) 48680 child abuse (2) 21215 million (1) 74742question (3) 48679 investigation (1) 22142 year (2) 79808
3 child (10) 60256 research (1) 22143 79819parent (9) 62334 investigating (1) 22142 79820mother (3) 62088 work (1) 21885 period (1) 79429daughter (1) 60587 aid (9) 22204 week (1) 79506foster home (1) 54374 social work (1) 24180 79661society (5) 54351 risk (1) 22613 day (1) 79635at home (1) 55170 dispute (1) 24051 79842social (1) 55184 intervention (1) 24317 years (4) 80023function (1) 55154 fail (1) 19811 month (1) 79847expert (3) 59108 5 agency (5) 75786 hour (1) 79949human (1) 19677 prison (2) 75540 summer (1) 79991guardian (1) 59099 situation (1) 75502 half (1) 80080official (1) 62223 want (1) 77120 old (3) 79446worker (1) 59145 poverty (3) 77119 past (1) 79444neighbour (1) 62152 need (1) 77122 future (1) 79448youngster (1) 60255 condition (1) 75493 set (1) 54454kid (2) 60255 decline (1) 76848 rate (1) 80186natural (1) 62139 neglect (4) 76852 15 name (1) 54366lawyer (2) 61725 difficulty (1) 76792 family (8) 54362professional (1) 62636 stress (1) 76799
(cont’d)
53

Table 5.2: Lexical chains from a related article (cont’d).C Word Syn C Word Syn C Word Syn
16 call (1) 19870 57880 38 system (4) 4513920208 62738 plan (1) 4552023590 27 day care (1) 24188 november (1) 7986923591 28 normal (1) 44921 reason (1) 4545946540 29 per cent (1) 75017 lead (1) 4548846798 30 produce (1) 52869 evidence (2) 4547547837 31 child support (1) 72806 aim (1) 4599648737 cost (1) 72821 4600150172 32 major (1) 61881 experience (1) 4601150445 33 school (1) 55261 part (1) 4563150452 university (1) 55299 end (3) 4563450455 professor (1) 62638 total (1) 4560550456 34 led (1) 36879 39 keeping (1) 22674
17 budget (1) 73288 35 rock (1) 57716 supervision (1) 2390873362 type (1) 40411 40 headline (1) 47032
18 high (1) 56231 bob (1) 32045 41 tragedy (1) 50939place (1) 56524 36895 breakdown (1) 51097
19 profile (1) 47606 level (1) 35493 42 crack (2) 34491life (1) 47603 35495 cocaine (1) 34123
20 executive director (1) 60922 home (2) 35090 43 putting (1) 2187121 matthew (1) 64046 housing (2) 36932 44 alcoholic (1) 59668
john (1) 64019 36 sweeping (1) 20525 45 harm (2) 5135922 sword (1) 39915 reform (1) 20562 dwindling (1) 5136723 wish (1) 51618 overhaul (1) 20596 46 metro (1) 37269
desire (1) 51606 killing (1) 20412 47 positive (1) 3823224 health (1) 76967 death (1) 20414 48 things (1) 72559
welfare (8) 76965 shift (3) 20873 49 authorities (1) 5450125 education (1) 45224 move (1) 20650 court (1) 55432
special education (1) 45230 rise (1) 20839 united states (3) 55495study (1) 45212 movement (1) 20650 work force (1) 54965
26 rip (1) 21119 approach (1) 20651 institute (2) 5568051285 37 rear (1) 56391 turner (1) 63644
54

can be seen as exactly the same sort of operation that was done during the initial chaining of bothdocuments, that is, this comparison is a kind of “cross-document” chaining.
The main difference from chaining within a document is that in cross-document chaining, wewant to restrict the chaining algorithm so that only extra strong and strong relations are allowed.We enforce such a restriction for two reasons. First, allowing regular relations between words willintroduce too many spurious connections. For example, in table 5.2, chain 38 contains the wordsNovember and evidence. This is clearly not the kind of relation that we would like to build in general.We allow it at the article level so that intra-article links can be built more easily.
The other reason is that the bulk of the time spent in lexical chaining is devoted to findingregular relations, since this involves performing a complicated graph traversal in WordNet. This isnot a problem when dealing with small amounts of text (as in the original chaining of a document),but becomes problematic when we wish to perform chaining operations on large numbers of textsin real-time.
Along with the restriction on the types of relations between words, we will need to ensure thatthere is a certain minimum number of links between the chains of two documents before we cansay that the documents are related. We require multiple connections so that polysemy does notlead us to place a link where there should not be one.
Consider the following case: Suppose that we allow two chains from two different documentsto be related on the strength of only one link. It is possible that two chains containing the wordbank, for example, could be related, even though one chain uses bank in the “financial” sense, andone uses it in the “river” sense. This can be resolved by considering what synsets are associatedwith a word, but consider the case where we have the word union in two different articles. Evenif both articles use the word in the “labour movement” sense, one article may be about the policeunion, while the other is about the auto workers union. We require multiple connections becausethe probability that multiple words are co-ambiguous is relatively quite small.
5.2 An initial approach
If we wish to link two articles using their lexical chains, taking into consideration the above criteria,then there is a straightforward solution. Given two sets of chains, we can determine the numberof connections between them using the following algorithm:
Algorithm 1: Cross-document chaining.Input: C1 and C2, chain sets from different documentsOutput: The number of strong and extra strong links between the articlesRELATED(C1, C2)(1) foreach chain c1 in C1(2) foreach chain c2 in C2(3) foreach word w1 in c1(4) foreach word w2 in c2(5) if w1 = w2 and w1 and w2 share a synset then(6) extra strong++(7) else if w1 and w2 share a synset or w1 has a synset that is a single
link from a synset of w2 then(8) strong++
Once we have determined the number of strong and extra strong connections between two chainsets, we can decide whether they should be related.
55

The main strength of this algorithm is its simplicity. It is easy to implement and understand.It also has the desirable property that documents that contain the same term can only be relatedwhen the two words share the same synset (i.e., when the words are used in the same sense).Salton et al. (1993) have used a local/global criteria for document similarity in order to solve thisproblem, but this is a natural side effect of the lexical chaining process.
Unfortunately, this approach also has some rather debilitating weaknesses. Due to the hierar-chical structure of WordNet, it is very easy to find documents that have a large number of relatedwords, even when the documents are completely unrelated. When a word in a chain is in synsetsthat are near the top of WordNet’s hierarchy, there are a large number of synsets that are a singleIS-A or INCLUDES link away. Very general words like human can be linked to a large number ofother words. This is especially a problem when the articles in question are long, since there is moreopportunity for such connections.
The other main weakness is that this approach is extremely time consuming. Clearly we needto compare each word in C1 with each word in C2, which takes O(n2) time (if the number of wordsin each set of chains is comparable). At steps 5 and 7 in the above algorithm, we need to search alist of synsets of which w1 and w2 are members (usually not very large) and a list of synsets that areone link away from one of w1 or w2’s synsets. This second list can be quite large, for example, theword human has 165 synsets that are one link away from one of its synsets. So, if m is the number oflinked synsets, then to do the comparisons between words requires O(m 2) time, not counting thetime to do the comparison of the word strings. If m is of the same order as n, then we are dealingwith a very inefficient algorithm.
Our calculations indicate that, using this method, it would take approximately six years todetermine all possible inter-article links for one year of the Globe and Mail. If we attempt to do thisin real-time, and simply search through a year of articles to find links from a particular article, wecan reduce the time to approximately one hour. Unfortunately, this is still unacceptable.
The problem is that there is no straightforward, global description for a document, so each setof chains must be treated as a special case. In traditional vector space IR systems the term weightvector provides such a global description. This vector is the same length for each document, anda particular element of the vector is used for the weight of a particular term in every document.Lexical chaining, on the other hand, is more fluid. It is highly unlikely that two documents willcontain the same set of lexical chains. In the vector space model, it is a simple decision to saywhether two documents have a term in common; all that is required is to check the term weightvector. Discovering related documents is as simple as taking the dot product of two vectors. It isquite difficult to say that two documents have related chains, since it is necessary to try to relateeach of the words in the two chains of interest.
In order to build a system that is reasonably efficient, we need to devise a simple, global rep-resentation for the lexical chains which retains the properties of disambiguation and linking-by-relation as the method described above, while at the same time dealing with the problem of spuri-ous links.
5.3 Synset weight vectors
In considering the simple algorithm shown above, we noted that much of the work being donewas simply determining whether two words have a synset in common or whether a synset of oneword is one link away from a synset of the other word. Our first step will be to make this processmore efficient.
56

5.3.1 Simple synset vectors
We can represent each chain in a document by two vectors. Each vector will have an element foreach synset in WordNet. An element in the first vector will contain the number of occurrences ofthat particular synset in the words of the chains contained in the document. An element in thesecond vector will contain the number of occurrences of that particular synset when it is one linkaway from a synset associated with a word in the chains. We will call these vectors the member andlinked synset vectors, or simply the member and linked vectors, respectively.
We can then compute the relatedness of two chains C1 and C2 by measuring three similarities(shown by the lines in figure 5.1):
1. The similarity of the member vectors of C1 and C2;
2. The similarity of the member vector of C1 and linked vector of C2; and
3. The similarity of the linked vector of C1 and the member vector of C2.
1C 2C1
3
2Member Vectors
Linked Vectors
Figure 5.1: Computing chain similarity.
Clearly, the first similarity measure (which we call the member-member similarity) is the most im-portant, as it will capture extra strong (i.e., term repetition) relations as well as strong relationsbetween synonymous words. The last two measures (called the member-linked similarities) are lessimportant as they capture strong relations that occur between synsets that are one link away fromeach other.
If we enforce a threshold on these measures of relatedness, we can capture our requirementfor multiple connections, since each element of the vectors will contribute only a small part of theoverall similarity. We can calculate this similarity for all pairs of chains from two articles, and ifthere are a certain number of pairs that are more similar than our threshold, we can then say thatthe two articles should be linked. We have also removed the necessity for performing actual stringcomparisons on the words contained in the two sets of chains.
Unfortunately, this method still has some efficiency problems. It will be necessary to computethe similarities for all pairs of chains in the two articles. It would be more efficient if the memberand linked vectors were built at the article level, rather than at the chain level.
It is reasonable to assume that, if we build the member vectors at the chain level, then they willbe nearly disjoint (i.e., they will tend not to have synsets in common). This is a side-effect of thelexical chaining process: if two words share a synset, then they would likely have been placed inthe same chain. So, at the article level, calculating the similarity between member vectors will beas effective as calculating the similarity between the pairs of member vectors at the chain level.
The linked synset vectors for the various chains will, in all likelihood, have many synsets incommon, especially when chains include words such as human, as we showed above. As strongrelations due to IS-A or INCLUDES relations are less important, the overlap may not seem to pose
57

much of a difficulty. In reality, this overlap means that the linked vectors will be populated withhigh-frequency synsets that will contribute enough to the similarity calculation to introduce linkswhere there should be none. In addition to this, we will still have the problem of a longer arti-cle’s vectors, with many more synsets, overwhelming a shorter article’s vectors. To solve theseproblems, we look to traditional vector space approaches to IR.
5.3.2 Synset weight vectors
As we said in section 2.3.2, in the vector space model for IR, documents are represented by weightedterm vectors. The weight of a particular term in a particular document is not based solely on thefrequency of that term in the document, but also on how frequently that term appears throughoutthe database. The terms that are the most heavily weighted in a document are the ones that appearfrequently in that document but infrequently in the entire database.
The equation from Salton and Allan (1993) used to compute term weights will serve equallywell when computing weights for synsets:
wik =sf ik � log(N=nk)q
∑tj=1(sf i j)
2 � (log(N=n j))2
Here, wik is the weight of synset k in document i, sf ik is the frequency of synset k in document i, nkis the number of documents that contain synset k, and N is the number of documents in the entirecollection.
In our case, rather than calculate a single set of weights incorporating the frequencies of bothmember and linked synsets, the weights are calculated independently for the member and linkedvectors. We do this because the linked vectors introduce a large number of synsets that do notnecessarily appear in the original chains of an article, and should therefore not influence the fre-quency counts of the member synsets. Thus, we make a distinction between strong relations thatoccur due to synonymy, and ones that occur due to IS-A or INCLUDES relations.The similarity be-tween documents is then determined by calculating the three similarities between member andlinked vectors discussed above.
These synset weight vectors can be seen as a conceptual or semantic representation of the contentof an article, as opposed to the traditional IR method of representing a document by the words thatit contains. This representation also addresses both synonymy and polysemy. Synonymy is takencare of by virtue of the fact that all of the synonyms for a word will be collected in the same synset,and therefore represented in the same element of the synset vectors. Because of the disambiguationperformed by the lexical chainer, a word will be represented only by synsets (i.e., senses) that areappropriate in the context of the article. Only these synsets will appear in the weighted synsetvectors, solving (to some extent) the problem of polysemy.
As a side-effect of representing documents by the synsets that they contain, we reduce the sizeof the vectors needed to represent each document. For a database of four months of the Globeand Mail we find that there are 31,360 distinct synsets in the member vectors and 46,612 distinctsynsets in the linked vectors. Thus, the combined size of the two vectors necessary to representan article (77,962) is substantially smaller than the more than 108,000 unique terms that Forsyth(1986) says we can expect. This reduction in dimensionality is similar to the reduction that we seein Latent Semantic Indexing, although their reduction is even more substantial than ours (from108,000 terms to 200 factors).
58

5.3.3 Building inter-article links
Once we have built a set of synset weight vectors for a collection of documents, the process ofbuilding links between articles is relatively simple. Given an article that we wish to build linksfrom, we can compute the similarity between the article’s synset weight vectors and the vectorsof all other documents. If the member-member similarity of two articles is higher than a giventhreshold, then we can calculate the two member-linked similarities and place a link between thetwo documents. We can rank the links using the sum of the three document similarities that wecompute. Our work shows that a threshold of 0.15 will include most related documents whileexcluding many unrelated documents. In section 4.2.4 we discussed the fact that the distributionsof inter-paragraph similarities seemed to be close to normal. No such claim can be made for thedistribution of inter-article similarities. In fact, in a sample of approximately 500,000 inter-articlesimilarities calculated from 20 different articles, only 584 met or exceeded our threshold of 0.15.
By using such a strenuous threshold, we enforce our constraint that there must be multipleconnections between the chains of the documents. This is almost exactly the methodology used invector space IR systems such as SMART, with the difference being that for each pair of documentswe are calculating three separate similarity measures. By using the sum of the three similaritiesas our ranking criterion, we are taking full account of not only the terms and synonyms that thedocuments have in common, but also how many more distantly related terms that they share. Thesum of the three similarities can lie, theoretically, anywhere between 0 and 3. In practice, the sumis usually less than 1. For example, the average sum of the three similarities when running thevectors of a single article against 5,592 articles is 0.039.
This method is also much more efficient than the methods that we discussed in the previoussections. For a database of approximately 30,000 articles and a threshold of 0.15, it takes approxi-mately 1.2 seconds to build all the links from a single document. This is certainly more in line withthe demands of a system that must perform in real-time.
5.3.4 How related words affect linking
Now that we have settled on a method for building inter-article links, we can see how the two setsof chains shown in table 5.1 and table 5.2 are handled. Tables 5.3 and 5.4 give information aboutthe member and linked vectors that represent these two articles.
Table 5.3: Lengths of the vectors in the example articles.
Article Vector Length Article Vector Length1 Member 128 2 Member 2151 Linked 574 2 Linked 1481
Table 5.4: Similarities of the vectors in the example articles.
Article 1Article 2 Member LinkedMember 0.224 0.096Linked 0.079 —
If we are using a linking threshold of 0.2, then we will place a link between these articles. Thesum of the similarities for these two articles is 0.399. Approximately 23% of the member-member
59

similarity of these articles is accounted for by synsets from which the articles do not share exactlythe same words. This proportion of the similarity is sufficiently large that, if it were removed, themember-member similarity of these articles would fall below the linking threshold that we hadset.
5.4 A preliminary test of inter-article links
There is certainly a need for an evaluation to test how well our machine-generated links performwhen being used for IR tasks such as question-answering. Before we perform such an evaluation,however, we need to ensure that our links are in fact working on a larger scale than the singleexample shown in the previous sections. We can perform this “sanity check” by testing our linkeragainst a set of reference queries. If the results are favourable, then we may proceed to a full scaleevaluation.
Our test involves taking a set of articles that are known to be related and seeing what connec-tions are made between them. Such a set can be taken from the data used for the Text RetrievalConference (TREC) (Harman, 1994). The object of TREC is a head-to-head evaluation of IR sys-tems. Participating sites are provided with approximately 2 GB of data comprising AssociatedPress wire stories, six years of the Wall Street Journal, San Jose Mercury News articles, Ziff-Davismagazine articles, U.S. Department of Energy abstracts, U.S. Federal Register articles, and U.S.Patent abstracts.
TREC participants are given a set of topics which specify an information requirement. Thesetopics are used in training the IR systems. A sample topic is shown in figure 5.2. Participants arealso provided with relevance judgments, detailing which documents are relevant to which topics.From this set of judgments we can select a set of articles to use in a preliminary evaluation of ourinter-article linking methodology. We wish to determine whether articles that are relevant to thesame topic will be linked, while articles that are relevant to different topics will not be linked.
5.4.1 Selecting topics
For our evaluation, we selected six topics from the 50 available. Table 5.5 shows the descriptions ofeach topic. Notice that each of the topics fall into one of two distinct groups, those about satellitesystems, and those about cancer treatments. If our linking methodology works perfectly, then wewould expect that documents that are relevant to one topic would never be linked to documentsrelevant to a different topic. Unfortunately, this may be too much to expect, especially given thatsome documents are relevant to more than one of these topics. A more realistic expectation wouldbe that documents relevant to the “satellite” topics are not linked to the “cancer” topics.
For our evaluation, we excluded documents from the Department of Energy, Patent Office, andFederal Register corpora, since they are not newspapers or magazines. We were left with 2406documents relevant to one or more of these topics.
5.4.2 Clustering documents
Rather than computing the similarity of all document pairs, a computationally expensive task, wedecided to use a clustering technique to find groups of documents that could be linked to one an-other. The clustering technique used is the same as that used in the SMART system. This techniquerequires only O(n) time, as opposed to the O(n2) time for computing all document similarities. Thealgorithm is as follows:
60

<top><head> Tipster Topic Description<num> Number: 113<dom> Domain: Science and Technology<title> Topic: New Space Satellite Applications
<desc> Description:Document will report on non-traditional applications of spacesatellite technology.
<smry> Summary:Document will report on non-traditional (innovative) applications ofspace satellite technology.
<narr> Narrative:A relevant document will discuss more recent or emerging applicationsof space satellite technology. NOT relevant are such "traditional" orearly satellite age usages as INTELSAT transmission of voice and datacommunications for telephone companies or program feeds forestablished television networks. Also NOT relevant are suchestablished uses of satellites as military communications, earthmineral resource mapping, and support of weather forecasting. A fewexamples of newer applications are the building of private satellitenetworks for transfer of business data, facsimile transmission ofnewspapers to be printed in multiple locations, and directbroadcasting of TV signals. The underlying purpose of this topic isto collect information on recent or emerging trends in the applicationof space satellite technology.
<con> Concept(s):1. satellite, technology, use of space2. satellite network, facsimile, direct broadcasting
<fac> Factor(s):<def> Definition(s):INTELSAT: a 113-nation consortium with a near monopoly oninternational satellite communications.COMSAT: the congressionally chartered U.S. satellite communicationscompany which holds 25% of INTELSAT’s stock.</top>
Figure 5.2: A sample topic from TREC.
61

Table 5.5: Descriptions of topics used for evaluation.
Topic Description113 Document will report on non-traditional applications of
space satellite technology.114 Document will provide data on launches worldwide of
non-commercial space satellites.121 Document will discuss the life and death of a prominent
U.S. person from a specific form of cancer.122 Document will report on the research, development, test-
ing, and evaluation (RDT&E) of a new anti-cancer drug de-veloped anywhere in the world.
123 Document will report on studies into linkages between en-vironmental factors or chemicals which might cause can-cer, and/or it will report on governmental actions to iden-tify, control, or limit exposure to those factors or chemicalswhich have been shown to be carcinogenic.
124 Document will report on innovative approaches to prevent-ing or curing cancer.
5.4.3 Clustering runs
We performed three separate runs of the clustering algorithm, using thresholds of 0.1, 0.15, and0.2. The results of these clusterings is shown in tables 5.6 through 5.8. We distinguish four kindsof clusters in the results:
Unit A “cluster” containing a single document.
With Same Topic A cluster containing more than one document where all the documents are rel-evant to a single topic.
With Similar Topics A cluster containing more than one document where the documents are rel-evant to topics in the same group.
With Different Topics A cluster containing documents relevant to topics in different groups.
The percentage measures indicate the percentage of the documents relevant to each topic that areincluded in the clusters.
It should be noted that this clustering method is dependent on the order in which the vectorsare added. In order to make sure that this was not the case in this instance, we reclustered the doc-uments using a randomized order. The results of these clusterings is shown in tables 5.9 through5.11. It seems that the order in which the documents were clustered was not significant.
5.4.4 Discussion of results
One thing that is easily discernible from these tables is that the similarity function for synset weightvectors works as expected, that is, higher thresholds result in less connections. As the thresholdincreases, the number of vectors clustered into the Unit or With Same Topic categories increases,
62

Algorithm 2: Clustering articles.Input: W , a file containing the weighted synset vectors for a collection of articlesand T , a thresholdOutput: C, an array of document clustersCLUSTER(W , T)(1) nextcluster = 0(2) foreach vector v in W(3) maxsim = 0(4) bestcluster = nextcluster(5) foreach cluster c in C(6) if v � c > maxsim and v � c� T(7) maxsim = v � c(8) bestcluster = c(9) bestcluster += v(10) if bestcluster == nextcluster then nextcluster++
while the number of vectors clustered from different groups decreases. In both cases, at the 0.2level, the majority of the documents are clustered either with documents relevant to the sametopic, or documents in the same group of topics.
The number of clusters produced is quite high in all cases. This is to be expected, since docu-ments that may be relevant to a particular topic may not be entirely related to each other, leadingto a low similarity score. In fact, we begin to see that the clusters divide up the set of all documentsrelevant to a topic into subsets centered around a particular subject. For example, using the ran-domly ordered vectors with a threshold of 0.2, two clusters are formed containing articles abouthigh-definition television. All of these articles are classified as relevant to topic 113, but they doform a sub-topic that is recovered during clustering.
It is also worth investigating why some articles are clustered with articles that are clearly notrelated. For example, when using a threshold of 0.2, an article describing the launch of a satellite(from topic 114), is clustered with articles from topic 123 on the strength of a single word that waspoorly disambiguated: bill. When weighting the documents, the synsets containing the word billoccur infrequently throughout the database, but frequently in these documents, so it is given avery high weight. This weight is sufficient to link the two documents on the strength of a singlecommon word. Problems such as this should dissipate when we use a larger database.
This experiment has also shown that it is possible to link articles across newspapers, as many ofthe clusters contained articles from the Associated Press, Wall Street Journal, and San Jose MercuryNews corpora. It is also worth noting that our methodology seemed to work just as well for theZiff corpus, which contains some magazine-style articles as long as 77 paragraphs.
63

Table 5.6: Clustering TREC articles with a threshold of 0.1.
Unit With Same Topic With Similar Topics With Other TopicsTopic Clusters Percent Clusters Percent Clusters Percent Clusters Percent113 29 5.9% 63 63.3% 115 8.2% 80 22.7%114 12 3.9% 9 29.9% 115 44.4% 67 21.9%121 70 13.3% 94 56.7% 56 19.0% 41 11.0%122 10 6.1% 5 7.4% 32 58.9% 16 27.6%123 48 8.1% 53 48.8% 62 34.2% 25 8.9%124 30 9.4% 8 6.9% 75 69.9% 25 13.8%
Number of clusters: 626
Table 5.7: Clustering TREC articles with a threshold of 0.15.
Unit With Same Topic With Similar Topics With Other TopicsTopic Clusters Percent Clusters Percent Clusters Percent Clusters Percent113 111 22.7% 81 56.7% 111 8.4% 56 12.2%114 30 9.6% 29 53.1% 111 23.8% 52 13.5%121 206 39.1% 81 45.2% 45 11.8% 16 4.0%122 30 18.4% 14 25.8% 28 44.8% 6 11.0%123 104 17.4% 71 46.0% 52 28.7% 22 7.9%124 71 22.3% 13 17.9% 69 53.3% 19 6.6%
Number of clusters: 1008
Table 5.8: Clustering TREC articles with a threshold of 0.2.
Unit With Same Topic With Similar Topics With Other TopicsTopic Clusters Percent Clusters Percent Clusters Percent Clusters Percent113 180 36.7% 78 45.9% 81 4.7% 29 4.7%114 54 17.4% 45 62.1% 81 15.4% 28 4.8%121 302 57.3% 73 33.0% 28 7.0% 13 2.7%122 51 31.3% 18 33.1% 25 33.7% 2 1.8%123 168 28.2% 87 51.7% 38 17.3% 13 2.5%124 112 35.1% 22 27.3% 52 35.7% 5 1.9%
Number of clusters: 1300
64

Table 5.9: Randomly clustering TREC articles with a threshold of 0.1.
Unit With Same Topic With Similar Topics With Other TopicsTopic Clusters Percent Clusters Percent Clusters Percent Clusters Percent113 29 5.9% 65 70.6% 121 7.1% 81 16.3%114 12 3.9% 8 25.4% 121 35.4% 71 35.4%121 59 11.2% 90 54.6% 67 21.6% 43 12.5%122 10 6.1% 6 19.0% 33 62.6% 12 12.3%123 54 9.1% 47 44.0% 59 31.0% 27 15.9%124 33 10.3% 6 5.0% 76 74.0% 25 10.7%
Number of clusters: 621
Table 5.10: Randomly clustering TREC articles with a threshold of 0.15.
Unit With Same Topic With Similar Topics With Other TopicsTopic Clusters Percent Clusters Percent Clusters Percent Clusters Percent113 119 24.3% 81 54.5% 102 8.4% 56 12.9%114 26 8.4% 30 58.8% 102 17.4% 53 15.4%121 199 37.8% 87 46.3% 43 11.8% 20 4.2%122 25 15.3% 19 38.0% 27 42.9% 5 3.7%123 111 18.6% 73 48.7% 44 26.5% 20 6.2%124 72 22.6% 17 12.2% 67 59.2% 18 6.0%
Number of clusters: 1017
Table 5.11: Randomly clustering TREC articles with a threshold of 0.2.
Unit With Same Topic With Similar Topics With Other TopicsTopic Clusters Percent Clusters Percent Clusters Percent Clusters Percent113 185 37.8% 76 45.5% 74 3.7% 27 4.9%114 57 18.3% 45 60.8% 74 15.1% 26 4.5%121 304 57.7% 72 34.2% 22 5.3% 12 2.5%122 49 30.1% 19 32.5% 24 35.6% 2 1.8%123 174 29.2% 78 49.0% 34 18.5% 14 2.5%124 114 35.7% 26 27.3% 49 35.4% 4 1.6%
Number of clusters: 1300
65

Chapter 6Evaluating a linking methodology
Clearly, methodologies such as the one that we have presented in the previous two chapters requireevaluation. In this chapter, we will describe the design and results of a study that was undertakento test our linking methodology.
We will not attempt to answer the question of whether browsing is a useful way of performingIR tasks, as it seems clear from the work discussed in section 2.6 that browsing is a viable andnecessary component of any IR system. Rather, we will be asking the question: Is our hypertextlinking methodology superior to other methodologies that have been proposed (e.g., that of Allan,1995)? The obvious way to answer the question is to test whether the links generated by ourmethodology will lead to better performance when they are used in the context of an appropriateIR task.
The null hypothesis for our tests is simply that there is no significant difference between thehypertext links generated by our method and those generated by another methodology — onecould perform IR tasks equally well using either kind of links. Our research hypothesis is that ourmethod provides a significant improvement, because it is based on semantic similarity of conceptsrather than strict term repetition.
6.1 Experimental Design
6.1.1 The task
We selected a question-answering task for our study. We made this choice because it appears (as wesaw in section 2.6.3) that this kind of task is well suited to the browsing methodology that hypertextlinks are meant to support. This kind of task is also useful because it can be performed easily usingonly hypertext browsing. This is necessary because in the interface used for our experiment, noquery engine was provided for the subjects.
It may be argued that the restriction to strict hypertext browsing creates an unnatural settingfor the study and that in any real system, users would at least be able to perform a keyword search.This may be true, but if we had included a query engine, then it is possible that any results that weobtained would pertain more to the use of queries rather than browsing or to how well users canform queries. By making the restriction, we tested just the hypothesis in which we were interested:is a semantically-based approach to hypertext link generation better than a strict term-repetitionapproach? If we can make a determination one way or the other, then we will be able to drawconclusions about how hypertext links should be built in a system that provides both queryingand browsing.
66

6.1.2 The questions and the database
The most difficult part of performing an evaluation of any IR or hypertext system is developingreasonable questions and then determining which documents from the test database contain theanswers. Several test collections have been developed over the years that can be used by anyonewho wishes to compare the performance of her IR system to others. The most recent, and certainlythe largest, of these collections is the TREC collection, which we discussed in section 5.4.
Figure 5.2 showed a sample topic that we used in our preliminary evaluation of the inter-articlelinking methodology. Notice that the section labeled “Narrative” provides an English descriptionof which documents are relevant and which are not. We used this section as the basis of our testquestions. From the 50 available topics, we selected three that were appropriate for our evaluationand used them to develop the questions shown in table 6.1. We specifically excluded from consid-eration the topics that were used for our preliminary test of inter-article linking, in order to avoidpossible confounding of the experimental results.
Table 6.1: Questions used in evaluation of linking methodology.
Number Answers QuestionTest N/A List the names of as many premiers of Canadian
provinces as you can find. Be sure to include thename of the province.
1 61 List all the drug brand names that you can find, ifyou can also list the name of a generic substitute forthe drug or the chemical name of the drug.
2 56 List the names of as many people as you can find thatare identified as “terrorists”. You should not includethe names of terrorist groups.
3 34 List the names of biotechnology companies that haveparticipated in mergers or joint ventures. You shouldlist the names of all participants in the merger or jointventure.
There were approximately 1996 documents that were relevant to the topics from which thesequestions were created. We read these documents and prepared lists of answers for the questions.Our test database consisted of these articles combined randomly with approximately 29,000 otherarticles selected randomly from the TREC corpus. The combination of these articles provided uswith a database that was large enough for a reasonable evaluation and yet small enough to beeasily manageable.
6.1.3 Whose links to use?
We considered two possible methods for generating inter-article hypertext links. The first is ourown method, described in chapter 5. The second method uses a vector space IR system calledManaging Gigabytes (MG) (Witten et al., 1994) to generate links by calculating document simi-larity. We used the MG system to generate links in a way very similar to that presented in Allan(1995).
Links from a source article were built by passing the entire text of the source article to the MGsystem as a “query”. MG builds the term vector representing this query after removing stop words
67

and stemming the words in the query. This query vector was compared against the documentvectors stored in the MG database, and the top 150 related articles were returned and used as thetargets of the inter-article hypertext links. The MG system provided most of the same capabilitiesas the SMART system used by Allan. We used the MG system because it was much more easilyintegrated into our other software. For simplicity’s sake, we will call the links generated by ourtechnique HT links and the links generated by the MG system MG links.
At this point we considered two approaches to testing the effectiveness of these two sets oflinks. The first was to set two experimental conditions: one using HT links and the other usingMG links. This is a very typical experimental strategy, and certainly viable in this case. The prob-lem was that such a design would have required a large number of subjects to be tested in eachcondition to ensure that the study was valid.
The second method was, at each stage during a subject’s browsing, to combine the sets of linksgenerated by the two methods. This results in a single experimental condition where the systemmust keep track of how each inter-article link was generated. By using this strategy, the subjects“vote” for the system that they prefer by choosing the links generated by that system. Of course,the subjects are not aware of which system generated the links that they are following — they canonly decide to follow a link by considering the article headlines displayed as anchors. We can,however, determine which system they “voted” for by considering their success in answering thequestions they were asked. If we can show that their success was greater when they followedmore HT links, then we can say that they have “voted” for the superiority of HT links. A similarmethodology has been used previously by Nordhausen et al. (1991) in their comparison of humanand machine-generated hypertext links.
The two sets of inter-article links can be combined by simply taking the unique links from eachset, that is, the links that we take are those that appear in only one of the sets of links. Of course,we would expect the two methods to have many links in common, but it is ifficult to tell how theselinks should be counted in the “voting” procedure. By leaving them out, we test the differencesbetween the methods rather than their similarities. Of course, by excluding the links that themethods agree on we are reducing the ability of the subjects to find answers to the questions thatwe have posed for them. This appears to be a necessary difficulty of this method and, as we shallsee, the number of correct answers that the subjects found was generally quite low, but it wasnonetheless sufficient to compare the two methodologies.
The intra-article links that were presented to the users were generated by the methodologydescribed in chapter 4. Because there was no other method for generating these links, the sub-jects were presented only with links generated by our method, using the Mean Euclidean distancemetric with no weighting or normalization of the chain density vectors and a z-score threshold of1.0. This set of parameters was selected as one that had produced “good” sets of links during thetesting of the system.
6.1.4 The evaluation system
The evaluation system used a front-end written in Java combined with a back-end written in C++.Although we have discussed the use of our system over the World-Wide Web, we found it nec-essary to use a non-Web-based system to perform the evaluation. This was mostly due to thedifficulty in obtaining sufficient logging information (e.g., what links were followed?) from a Webbrowser.
The system works by sending requests to three servers, as shown in figure 6.1. When a userclicks on a link to another article, three requests are sent out:
1. A request for HT links, which is sent to the “HT Link Server”.
68

2. A request for MG links, which is sent to the “MG Link Server”.
3. A request for the text of the article, including intra-article links. This request is sent to the“Article Server”.
Java Front End
Article Server
ArticleText
ChainDescriptions
HT Link Server
LinkedSynsetVectors
MemberSynsetVectors
MG Link Server
ManagingGigabytesDatabase
Figure 6.1: The structure of the system used for the evaluation.
The interface of the system was quite straightforward. It consisted of a single screen similarto the one shown in figure 6.2 The main part of the screen showed the text of a single article. Thesubjects could navigate through the article by using the intra-article links, the scroll bar, or thepage up and down keys. The buttons to the left of the article could be used for navigating throughthe set of articles that had been visited (the Previous Article and Next Article buttons) or navigatingwithin an article (the Back button would return to the point from which an intra-article link wastaken).
At the bottom of the screen was a list of the articles from the database that were related to thearticle displayed. The anchor text for these links was the headline of the article that the user wouldjump to when the link was clicked on. In order to leverage the subjects’ experience with Webbrowsers such as Netscape Navigator, all hypertext links were shown in blue, while all regular
69

Jump toRelatedArticles
Here is a link that will...
Back
Next Article
Previous Article
Here is the Headline of the ArticleHere is a subheading
Here is the headline of an article that you can jump to.Try clicking on me to jump to a new article!
Help
it and you decide that it’s relevant to the query that you’re trying toThe text of the article that you’re viewing goes here. If you’re looking at
This is another link...
Headline
File Article
answer, then you should write down the answer!
Figure 6.2: The interface of the evaluation system.
70

text appeared in black. To ease navigation difficulties (i.e., “Have I been here before?”), links thathad already been traversed (both intra- and inter-article) were shown in magenta.
6.1.5 Performing searches
To begin, subjects were given a set of instructions on using the system (shown in appendix B), andwere allowed to ask questions about the interface. The subjects were all provided with the “test”question and allowed 5 minutes to become familiar with the properties of the system. Once com-fortable, the subjects were given the rest of the questions one by one. The time for each questionwas limited to 15 minutes so that subjects would not spend inordinate amounts of time on onequery and then give the others short shrift. The order in which questions were given was variedamong the six possible orders across all of the subjects who performed the task.
Each search began on a “starter” page that contained the text of the appropriate TREC topic asthe “article” and the list of articles related to the topic shown (this was computed by using the textof the topic as the initial “query” to the database). Subjects were expected to traverse the links,writing down whatever answers they could find.
As the subjects browsed through the database of articles, the links that they followed withinand between articles were automatically logged. In addition, any scrolling motions within anarticle were recorded (e.g., using the scrollbar or the page up and down keys). When a subject leftone article to go to another, the amount of time spent on the article was recorded.
After they had finished answering the questions, the subjects were given a short questionnaireto fill out. This questionnaire is shown in appendix C.
6.2 Analysis
6.2.1 An initial look at the system
Given the evaluation system described above, we note that for a particular starting point, thehypertext that our subjects could navigate is completely determined. To simplify somewhat, wecan view this hypertext as a tree whose root is the starting point for a particular question. Beforewe begin the analysis of the experimental data, we should explore whether there is any differencebetween the trees that are generated by the two methodologies.
For each method it is a relatively straightforward task to generate the hypertext tree. We can dothis in a breadth-first manner, and note at which level in the tree documents containing answersoccur. This level tells us how long the path is from the root node to the document in question. Apaired t-test can then be used to see if there is a significant difference in the path lengths to theanswers.
We built the trees generated by both methodologies for each question that we gave to the sub-jects. The results were that for question 1, the path lengths were significantly shorter for the MGtree; for question 2, the path lengths were significantly shorter for the HT tree; and there was nosignificant difference in path lengths for question 3. Thus we can say that there are some objectivedifferences between the methods under examination.
6.2.2 Examining the data
We tested 27 subjects during the course of the evaluation. However, our analysis will only include23 subjects. Some changes were made after the first day of the evaluation in order to improvethe reliability of the Java front-end, resulting in significantly fewer disruptive system crashes. In
71

one case during the first day, the system crashed five times during the course of one 15-minutequestion. More importantly, the way in which inter-article links were displayed was changed. Inaddition to the system changes, we corrected a grammatical error in one of the questions, andslightly modified the instructions that were provided to the subjects. Because of these changes, wedecided that it would be best if the results from the first day were removed from considerationduring the analyses, since those subjects were not operating under the same set of experimentalconditions as the others.
The data for the remaining 23 subjects are shown in table 6.2 and a summary is shown in table6.3. In these tables, the variable name LMG refers to the number of MG links followed, LHT refersto the number of HT links followed, LI refers to the number of intra-article links followed, and Ansrefers to the number of correct answers found.
The number of both inter- and intra-article links followed was, on average, quite small andvariable. As we expected, the number of correct answers found was also low and variable. Onaverage, the subjects showed a slight bias for HT links, choosing 52.1% HT links and 47.9% MGlinks. This is interesting, especially in light of the fact that, for all the articles the subjects visited,50.4% of the links available were MG links, while 49.6% were HT links. A paired t-test, howeverindicates that this difference is not significant.
We can also combine LHT and LMG in a ratio that we will call LR. Because LMG = 0 in somecases, we will define LR in the following way:
LR =
(LHTLMG
when LMG > 0LHT when LMG = 0
If LR > 1, then a subject followed more HT links than MG links. An interesting question to askis: did subjects with significantly higher values for LR find more answers? With 23 subjects eachanswering 3 questions, we have 69 values for LR. If we sort these values in decreasing order anddivide the resulting list at the median, we have two groups with a significant difference in LR. Anunpaired t-test then tells us that the differences in Ans should occur by chance with p < 0:1. Thisis certainly unlikely enough that there may be some relationship between the number and kindsof links that a subject followed and his or her success in finding answers to the questions pose. Inthe following sections, we will explore this relationship using regression analyses. In fact, thereare two cases that we wish to consider. In the first, we look at only the inter-article links that thesubjects followed. In the second, we include the intra-article links as well.
6.2.3 Inter-article links
In the first case, we will consider solely the relationship between the kinds of inter-article links thatthe subjects used (i.e., HT versus MG links). We can use a multivariate regression model with twoindependent variables, LMG and LHT , to express the relationship between HT links, MG links, andthe number of correct answers found. The dependent variable in our analysis is Ans, the numberof correct answers found by the subject. For each subject, we will have three measurements of theindependent and dependent variables corresponding to the three questions that they answered.
Note that we are using the number of correct answers that the subjects found as our dependentvariable. It may be argued that a more appropriate measure would be the percentage of the possi-ble answers that they found — essentially the recall of the correct answers. This would be a validconcern for an evaluation in which the subjects were allowed to look for answers until they feltthey had found them all. In our task, however, searches were limited to 15 minutes and the speedof the system tended to limit the number of answers that a subject could find. Indeed, the subjectsfound significantly (p < 0:05) more answers for question 2 than for questions 1 and 3. There was no
72

Table 6.2: Data collected during question answering tasks
Trial HT Links Percent MG Links Percent Intra Answers(LMG) (LHT ) (LI) (Ans)
s05/q1 1 14.3 6 85.7 1 3s05/q2 5 62.5 3 37.5 5 4s05/q3 7 53.8 6 46.2 0 5s06/q1 10 52.6 9 47.4 11 6s06/q2 11 61.1 7 38.9 11 8s06/q3 7 43.8 9 56.2 2 3s07/q1 6 85.7 1 14.3 1 3s07/q2 5 62.5 3 37.5 0 5s07/q3 5 50.0 5 50.0 4 6s08/q1 9 60.0 6 40.0 0 2s08/q2 9 69.2 4 30.8 0 3s08/q3 4 40.0 6 60.0 0 0s09/q1 8 72.7 3 27.3 0 3s09/q2 6 40.0 9 60.0 1 8s09/q3 9 37.5 15 62.5 0 4s10/q1 8 47.1 9 52.9 17 4s10/q2 9 69.2 4 30.8 12 5s10/q3 6 42.9 8 57.1 15 3s11/q1 9 42.9 12 57.1 5 7s11/q2 8 80.0 2 20.0 1 16s11/q3 8 57.1 6 42.9 1 7s12/q1 5 29.4 12 70.6 16 2s12/q2 10 71.4 4 28.6 3 0s12/q3 1 7.1 13 92.9 4 3s13/q1 1 50.0 1 50.0 7 1s13/q2 1 50.0 1 50.0 11 0s13/q3 8 53.3 7 46.7 1 0s14/q1 2 33.3 4 66.7 3 1s14/q2 3 33.3 6 66.7 8 4s14/q3 7 70.0 3 30.0 0 1s15/q1 9 60.0 6 40.0 5 5s15/q2 11 57.9 8 42.1 2 5s15/q3 13 65.0 7 35.0 0 2s16/q1 4 23.5 13 76.5 0 5s16/q2 9 75.0 3 25.0 3 7
(cont’d)
73

Table 6.2: Data collected during question answering tasks (cont’d)
Trial HT Links Percent MG Links Percent Intra Accuracy(LMG) (LHT) (LI) (Ans)
s16/q3 8 44.444 10 55.556 2 6s17/q1 2 18.182 9 81.818 0 3s17/q2 8 53.333 7 46.667 0 5s17/q3 8 57.143 6 42.857 7 5s18/q1 3 30.000 7 70.000 14 2s18/q2 5 71.429 2 28.571 11 6s18/q3 6 42.857 8 57.143 3 3s19/q1 11 68.750 5 31.250 8 6s19/q2 6 50.000 6 50.000 8 6s19/q3 5 45.455 6 54.545 8 0s20/q1 6 85.714 1 14.286 1 6s20/q2 4 100.000 0 0.000 8 4s20/q3 2 25.000 6 75.000 0 5s21/q1 10 50.000 10 50.000 7 10s21/q2 10 50.000 10 50.000 7 11s21/q3 12 50.000 12 50.000 1 8s22/q1 9 52.941 8 47.059 12 8s22/q2 19 79.167 5 20.833 23 9s22/q3 5 33.333 10 66.667 6 2s23/q1 7 63.636 4 36.364 0 2s23/q2 14 73.684 5 26.316 1 2s23/q3 7 53.846 6 46.154 0 5s24/q1 2 22.222 7 77.778 17 3s24/q2 7 70.000 3 30.000 13 6s24/q3 1 8.333 11 91.667 10 0s25/q1 7 50.000 7 50.000 7 2s25/q2 9 60.000 6 40.000 0 2s25/q3 9 60.000 6 40.000 0 11s26/q1 7 58.333 5 41.667 3 6s26/q2 6 66.667 3 33.333 5 7s26/q3 12 70.588 5 29.412 0 3s27/q1 4 40.000 6 60.000 8 5s27/q2 4 40.000 6 60.000 3 4s27/q3 5 41.667 7 58.333 0 0
74

Table 6.3: Summary statistics for experimental results.
Data Min Max Mean Std. Dev.LHT 1 19 6.87 3.44LMG 0 15 6.32 3.20LI 0 23 4.97 5.41Ans 0 16 4.48 2.98
significant difference in the number of answers between questions 1 and 3, even though question1 has nearly twice as many possible answers as question 3. If we were to use the percentage ofcorrect answers found, then we would artificially lower the subjects’ scores.
A standard regression
Using the data from table 6.2, our regression model gives us the following equation for derivingthe number of correct answers found from the number of each type of link followed:
Ans = 2:08 +0:33 �LHT +0:03 �LMG (R2 = 0:14)
So, at least at first glance, it seems that by following an HT link, a user would derive a greaterbenefit (in terms of the number of correct answers found) than she would get from traversingan MG link. Unfortunately, the analysis is not that simple. We also need to ask ourselves whatthe possibility is that the independent variables that we have chosen are actually unrelated to thedependent variable. We can test this hypothesis with an ANOVA analysis of the linear regressionto see how much of the difference between the observed and fitted values of Ans is attributable tothe regression and how much to simple error. The ANOVA table is shown in table 6.4.
Table 6.4: ANOVA analysis for a regression model with an intercept.
Source of Variation Sum of Squares df Mean Square Calculated F pRegression 87.13 2 43.56 5.55 0.01Error 518.09 66 7.85
For the calculated value of F, we can reject the initial hypothesis that LMG and LHT are unre-lated to Ans with p < 0:01. Now, if our dependent variable is related to our independent variables,then we still need to ask what range of values we can reasonably expect the coefficients of our in-dependent variables to take on. Table 6.5 shows the 95% confidence intervals for these coefficients,which provides an estimate of this range.
Here, the column labeled t is the t-score associated with the hypothesis H0: the coefficient inquestion is 0. The alternative hypothesis is that the coefficient is greater than 0. The column labeledp is the probability that H0 is true. For this model, we can safely reject H0 for the coefficient of LHTwith p < 0:05. We can also reject H0 for the constant in our equation. This is surprising, as we toldthe subjects to record only those answers that they found in the database, and not those that theyalready knew. In addition, there were no answers on any of the “starter” pages for the questions.So, if a subject followed no links, then they should have been unable to find any answers and
75

Table 6.5: 95% confidence intervals for a model with an intercept.
Parameter Value Standard Error t p Low HighConstant 2.08 0.98 2.11 0.02 0:11 4:04LHT 0.33 0.10 3.30 0.00 0:13 0:52LMG 0.03 0.11 0.24 0.41 �0:19 0:24
Ans should therefore have been 0. Interestingly, we cannot reject H0 for LMG, meaning that thecoefficient may be 0.
The columns labeled Low and High give the endpoints of the 95% confidence interval for thevalues of each of the coefficients. Notice that the confidence intervals for the coefficients of LMGand LHT overlap significantly. This leads us to the conclusion that it is possible that, for this model,the coefficient of LMG may be greater than the coefficient of LHT some of the time, if, in fact, thecoefficient of LMG is not 0. Thus, for this case, we cannot reject our null hypothesis that the numberof answers that a user will find does not depend on which kind of links that they follow.
Removing the constant
In the previous model, we noted that we could not necessarily say that the constant term was 0,even though this was to be expected. Also, we were unable to say that the coefficient of L MG wasgreater than 0. This would seem to be a useful result for us, since we could say that following MGlinks has no benefit. However, as we are proposing an alternative method, we feel that we shouldgive the MG method of generating links the benefit of the doubt in this case. So, we proposeanother regression model, in which we ensure that the fitted value of the constant is its theoreticalvalue of 0. This model results in the equation:
Ans = 0:46 �LHT +0:17 �LMG (R2 = 0:09)
which shows a smaller benefit than the previous model for the selection of an HT link over anMG link. The ANOVA analysis in table 6.6 shows that our independent variables are related toour independent variable and that with p � 0:05, we can safely assume that the number of linksfollowed is related to the number of answers found.
Table 6.6: ANOVA analysis for a regression model without an intercept.
Source of Variation Sum of Squares df Mean Square Calculated F pRegression 52.19 2 26.10 3.11 0.05Error 553.02 66 8.38
The 95% confidence intervals for the model coefficients are shown in table 6.7. Notice that thestandard errors for the coefficients have dropped when compared to the ones in table 6.5, andthat we can now safely reject the hypothesis that the coefficients of the model parameters are 0for all of the coefficients. Unfortunately, there is still an overlap in the confidence intervals forthe coefficients of LHT and LMG, so we cannot reject our null hypothesis in this case. We do note,however, that the overlap is relatively small. By inspection, we find that the confidence intervalsbegin overlapping at approximately the 92.5% level. This overlap may be accounted for by someof the factors to be discussed in section 6.4.
76

Table 6.7: 95% confidence intervals for a model without an intercept.
Parameter Value Standard Error t p Low HighLHT 0.46 0.08 5.96 0.00 0:31 0:62LMG 0.17 0.08 2.01 0.02 0:00 0:34
6.2.4 A two-dimensional model
Rather than casting our data as a three-dimensional regression problem, we could instead considerthe question of how the ratio of HT links to MG links, LR, and the number of correct answers, Ans,are related. If we can show that the regression line for these two variables has positive slope, thenwe will know that increasing the number of HT links that a user takes will increase his or hernumber of correct answers.
This model gives us the following equation for the regression line:
Ans = 3:65 +0:56 �LR (R2 = 0:05)
Ans = 3:65+0:56 �LRData
LR
Ans
76543210
16
14
12
10
8
6
4
2
0
Figure 6.3: Data and regression line for all questions.
Figure 6.3 shows a scatter plot of the values and the regression line. Notice that the interceptis quite high, almost at the average for the data that we collected. An ANOVA analysis similar tothose above, however, shows us that LR is related to Ans with p < 0:07. Table 6.8 shows the 95%confidence intervals for the parameters of this model. From this table, we see that we can reject thehypothesis that the coefficient of LR is 0 with p < 0:05. We note, however, that a very small portionof the 95% confidence interval is negative, indicating that some of the time, we could expect agreater benefit from following MG links rather than HT links.
77

Table 6.8: 95% confidence intervals for a two-dimensional model of all data.
Parameter Value Standard Error t p Low HighConstant 3.65 0.56 6.52 0.00 2:53 4:77LR 0.56 0.30 1.90 0.03 �0:03 1:16
Data by question
Figure 6.3 shows that the regression line from our model is not a particularly good fit to our highlyvariable data. It is worthwhile to look at the data and regression lines computed for each separatequestion. The scatter plots for these data sets are shown in figures 6.4 through 6.6.
Ans = 3:91+0:15 �LRData
LR
Ans
76543210
16
14
12
10
8
6
4
2
0
Figure 6.4: Data and regression line for question 1.
Paired t-tests show that the subjects found significantly more answers (p < 0:05) for question2 than for questions 1 and 3. Interestingly, question 2 also showed the greatest benefit for subjectsfollowing HT links, with a slope of 0.93 for the regression line. The ANOVA analysis for theregression model of question 2 also showed the greatest amount of variation that was due to theregression and not to the residual. Although the ANOVA analyses of these models indicate thatnone of them are significant (the model for question 2 comes the closest with p < 0:25), they mayoffer clues about what kinds of questions should be used for evaluations like the one that we haveperformed.
Data by experience
We can also ask how a subject’s success is affected by their degree of previous experience in usinghypertext. Question 5 of the questionnaire given to the subjects asked how often they browse the
78

Ans = 3:70+0:93 �LRData
LR
Ans
76543210
16
14
12
10
8
6
4
2
0
Figure 6.5: Data and regression line for question 2.
Ans = 3:22+0:56 �LRData
LR
Ans
76543210
16
14
12
10
8
6
4
2
0
Figure 6.6: Data and regression line for question 3.
79

Web. We can take their answer to this as an indication of their experience using hypertext. Wedivide the subjects into two groups. The first group, which we will call the Low Web group, circled1, 2, or 3 in response to this question, indicating that they use the Web less than three times aweek. The second group (the High Web group) circled 4 or 5, indicating that they use the Webthree or more times a week. An unpaired t-test shows that the High Web group (12 subjects)chose significantly more (p < 0:01) inter-article links than the Low Web group (11 subjects). Thisdifference indicates that these subjects are probably more comfortable in a hypertext environmentthan the other subjects, and adapted more quickly to the interface used for the task.
When we look at the numbers of each kind of hypertext links followed by each group, we seethat the High Web group chose significantly more HT links than the Low Web group (p < 0:01).There was no significant difference in the number of MG links chosen by the two groups. Withineach group, we find that the High Web group chose significantly (p < 0:05) more HT links thanMG links, while there was no such significant difference in the Low Web group. There is also asignificant difference (p < 0:01) in the number of answers found by the two groups, with the HighWeb group finding more correct answers.
If we consider transforming our ratio measure by taking its inverse, 1LR
, then we see a significant(p < 0:05) difference in the ratios between the High and Low Web groups. Thus, we can see a setof subjects (the High Web group) who found significantly more answers and followed significantlymore HT links, indicating the advantage of HT links over MG links.
As with our other data sets, we can build two-dimensional regression models for each of thesegroups. Figures 6.7 and 6.8 show the data and regression lines for the Low and High Web groups,respectively. Although only the model for the Low Web group is significant, we see that the slopeof the regression line for the Low Web group is steeper than that for the High Web group, indicatingthat the Low Web group benefited more from following HT links than did the High Web group.
Ans = 2:56+0:73 �LRData
LR
Ans
76543210
16
14
12
10
8
6
4
2
0
Figure 6.7: Data and regression line for Low Web group.
80

Ans = 4:92+0:25 �LRData
LR
Ans
76543210
16
14
12
10
8
6
4
2
0
Figure 6.8: Data and regression line for High Web group.
6.2.5 Viewed answers
In the analyses that we’ve performed to this point, we have been using the number of correctanswers that the subjects provided as our dependent variable. We have also mentioned that thereason we are using this dependent variable is that the subjects were limited in the amount of timethat they could spend on each search. We can mitigate this effect by introducing a new dependentvariable, AnsV , or the number of viewed answers.
The number of viewed answers for a particular question is simply the number of answers thatwere contained in articles that a subject visited while attempting to answer a question. These an-swers need not have been written down. We are merely saying that, given more time, the subjectsmight have been able to read the article more fully and find these answers. This idea is analogousto the use of judged and viewed recall by Golovchinsky (1997) in his studies.
For the data collected from our study, a paired t-test indicates that there is a significant differ-ence (p � 0) between AnsV and Ans, so we could investigate a two-dimensional regression modelusing AnsV as the dependent measure; however, such a model is not significant. We must thenreturn to a three-dimensional model incorporating separate terms for LMG and LHT . Such a modelis highly significant when considering the ANOVA analysis shown in table 6.9 and gives us thefollowing equation:
AnsV = 0:70 �LHT +0:26 �LMG (R2 = 0:22)
which shows a greater benefit for HT links over MG links. The 95% confidence intervals for thismodel, however, do show a very small overlap (less than 1% of the interval for LHT) betweenthe coefficients of LMG and LHT , as we see in table 6.10. This overlap precludes us from claimingsignificance for this result, but it may be accounted for by some of the factors that we will discussin section 6.4.
81

Table 6.9: ANOVA analysis for a regression model using viewed answers.
Source of Variation Sum of Squares df Mean Square Calculated F pRegression 293.43 2 146.71 9.14 0.00Error 1059.18 66 16.05
Table 6.10: 95% confidence intervals for coefficients in a model using viewed answers.
Parameter Value Standard Error t p Low HighLHT 0.70 0.11 6.57 0.00 0:49 0:92LMG 0.26 0.12 2.28 0.01 0:03 0:50
6.2.6 Inter- and intra-article links
While we’re primarily interested in how well our inter-article linking works compared to othermethods, we are also interested in seeing how the use of intra-article links affected the number ofcorrect answers that a user found. We can begin answering this by proposing a regression modelin which the independent variables are LMG, LHT , and LI and the dependent variable is Ans. Forsimplicity’s sake, we will show only the model in which the constant has been fixed at 0.
This model gives us the following relationship between the three types of links and the numberof correct answers:
Ans = 0:44 �LHT +0:15 �LMG+0:06 �LI (R2 = 0:10)
As with the model discussed above, there is still a greater benefit in selecting an HT link overan MG link. The coefficient of LI although quite small, is positive, indicating some benefit fromfollowing intra-article links. The ANOVA analysis for this model, shown in table 6.11, indicatesthat our independent variables are indeed related to our dependent variables. The 95% confidenceintervals of the model coefficients in table 6.12 show that, as with the models discussed above, wecan reject our null hypothesis with respect to the inter-article links, but the probability is high thatthe coefficient of LI is 0 (p > 0:18).
Table 6.11: ANOVA analysis for a regression model including all link types.
Source of Variation Sum of Squares df Mean Square Calculated F pRegression 59.19 3 19.73 2.35 0.08Error 546.03 65 8.40
Thus we are led to conclude that intra-article links had no across-the-board effect on Ans forthis particular question-answering task. This conclusion seems to be borne out by the subjects’answers on the post-task questionnaire. The average score on the question “Were the links withinthe articles useful?” was 2.9, between “Not really” and “Somewhat”. Separate regression modelsfor the High and Low Web groups including the number of intra-article links and using Ans as thedependent variable were not significant, and in any case the probability that the coefficient of LI is0 in these models is still very high.
82

Table 6.12: 95% confidence intervals for coefficients in a model using all three link types.
Parameter Value Standard Error t p Low HighLHT 0.44 0.08 5.55 0.00 0:28 0:60LMG 0.15 0.09 1.70 0.05 �0:03 0:32LI 0.06 0.06 0.92 0.18 �0:07 0:18
When we consider AnsV as our dependent variable, the model for the High Web group is stillnot significant, and there is still a high probability that the coefficient of LI is 0. For our Low Webgroup, who followed significantly more intra-article links than the High Web group, the modelthat results is significant (as we can see from table 6.13) and has the following equation:
AnsV = 0:58 �LHT +0:21 �LMG+0:21 �LI (R2 = 0:41)
Table 6.14 shows the 95% confidence intervals for this model. We see that the coefficient ofLI is always positive, indicating some effect on AnsV from intra-article links. We also see that theprobability that this coefficient is 0 is less than 0.02. We note, however, that for this model wecannot claim that the coefficient of LHT is always greater than the coefficient of LMG. This is not toosurprising in light of the fact that the High Web group chose significantly more HT links than didthe Low Web group.
Table 6.13: ANOVA analysis for Low Web group including all link types.
Source of Variation Sum of Squares df Mean Square Calculated F pRegression 240.59 3 80.20 6.71 0.00Error 346.37 29 11.94
Table 6.14: 95% confidence intervals for coefficients in a model using all three link types andviewed answers.
Parameter Value Standard Error t p Low HighLHT 0.58 0.13 4.37 0.00 0:31 0:85LMG 0.21 0.13 1.62 0.06 �0:05 0:47LI 0.21 0.10 2.19 0.02 0:01 0:40
In addition to the number of intra-article links that subjects followed, we also recorded thescrolling motions that they made, using either the scroll bar or the page up and down keys. Thenumber of scrolling motions (15075) far exceeded the number of intra-article links taken (343),indicating that the subjects were browsing the articles using the scrollbars rather than by using theintra-article links.
83

6.3 Other results
While the models that we have been discussing in this chapter were the main objectives for whichwe conducted this study, some of the data that were collected lead us to some interesting discov-eries. In this section, we will present some of the things that we discovered, although we will notbe making any claims about the statistical significance of these artifacts.
6.3.1 Size of the database
Earlier in this chapter we mentioned that our database consisted of some 30,000 articles, most ofwhich were not relevant to the questions that we gave to the subjects. In fact, the subjects only eversaw 591 of the articles. The size of the database that we used may, in fact, have been a confoundingfactor in the experiment, as the main complaint from the subjects was that the system was “tooslow”. The speed at which articles were retrieved may have affected how many links a subjectcould traverse in the 15 minutes allotted for each question, and therefore limited the number ofanswers that they could find.
6.3.2 Preference for early links
The subjects showed a great preference for links in the “first page” of links to other articles. Each“page” showed 13 links, and the average link position selected by the users was 11.4. In table 6.15we show the number of links followed by the page on which they occurred.
Table 6.15: Distribution of the position of selected links.
Page Links used Percentage1 724 79.62 112 12.33 42 4.64 13 1.4
> 4 19 2.1Total 910 100
So it might not matter what the recall of a link generator is (i.e., whether it linked to all relevantarticles) as long as the most related articles appear at the top of the list. In fact, the above tablesuggests that some relatively time-intensive post-processing should be done on the retrieved setof articles to move the most-relevant ones to the top.
6.4 Discussion
The most important conclusion that we can draw from the study is that the inter-article hypertextlinks generated by the method described in this thesis were not ignificantly better than links gen-erated by a competing methodology for a question-answering task such as the one we posed toour subjects.
Having said this, however, we note that the probability of results such as those we achievedoccurring by chance are less than 0.1. In addition, we can demonstrate at least one partition ofour subjects (the Low and High Web groups) such that the only significant differences between
84
them were the number of HT links followed and the number of answers found. This would seemto indicate some benefit from following HT links over MG links. For these reasons, we thereforeconclude that it is necessary to replicate this evaluation in order to gain more evidence about therelationships between the number and kinds of inter-article links followed and the number ofcorrect answers found.
Another interesting conclusion we draw is that, in general, the intra-article links did not haveany benefit for the question-answering task that we designed. Only the Low Web group showeda significant benefit from using intra-article links, and then only when considering the numberof viewed answers. This result is probably an indication of the novice’s need for tools that makeusing unfamiliar information systems easier.
We believe that there were several factors that affected the study, some of which might havereduced the effectiveness of our methods, leading to our inconclusive results.
6.4.1 Implementation factors
We believe that there are several problems with the implementation of the current system that, whenfixed, would allow our method to perform even more effectively.
The evaluation system
Foremost among these factors was the speed of the system. Even though we could generate linksfrom an article in less than two seconds, many of the subjects felt that the system was “too slow.”The speed of the system tended to limit the number of articles that a user could actually read inthe 15 minutes alloted for each question. This factor was mitigated by the fact that once an articlehad been visited, the hypertext links leading from it were stored so that subsequent visits wouldbe almost instantaneous.
Several subjects noted after they had finished their tasks that they did not feel that they couldjudge where an intra-article link would take them. Clearly, some more study is needed as to whatwould constitute good intra-article link anchors. As we discussed in section 4.2.6, using the firstfew words of the target paragraph as the anchor text is a compromise position. One possibility isto allow the user a way to “peek” at more of the target paragraph. This would be relatively easyto implement.
The lexical chainer
The current implementation of the lexical chainer, upon which all of our work is based, has somedeficiencies, as we noted in section 2.2.1. Of these, probably the most damaging is that wordsthat do not appear in WordNet can never be included in a chain. This excludes a large class ofwords that are important in the newspaper domain, namely proper nouns. These words can neverbe used in a lexical-chain-based comparison of document similarity, even if they appear in bothdocuments. We do believe, however that this difficulty can be remedied, as we shall discuss in thenext chapter.
Perhaps a more subtle problem is that we rely on the lexical disambiguation performed by thechainer to solve the problem of polysemy. There are two ways in which a failure in this mechanismwill negatively affect our document-linking capabilities. First, the chainer can incorrectly disam-biguate a word, choosing a single, incorrect synset to represent it. This incorrect synset is then usedin building the weighted synset vectors used for document comparison. When the vector for thedocument containing the incorrect synset is compared to other document vectors, some portionof the similarity of the documents will be missed. Unfortunately, there is no way to tell whether
85

the chainer has incorrectly disambiguated a word, and we have no data on the average number ofincorrect disambiguations per document.
The second kind failure of the disambiguation mechanism is when it does not work at all (orworks very badly), leaving a word that is represented by several synsets, each of which is countedwhen building the weighted synset vectors. This can result in spurious document connections.For example, during the evaluation, the “starter” document for question 1 contained the wordpiece, a word that is in 11 WordNet synsets. This word was not disambiguated at all. Another,totally unrelated article, suffered the same fate. On the basis of the weights of these 11 synsets, themember-member similarity of these articles was 0.477. This led to these articles being linked witha highly ranked connection!
Clearly we would like to avoid this sort of spurious connection. It is less obvious how wecould avoid such things happening, but it is interesting to note that, in this particular case at least,the member-linked similarities for the two articles were both 0. A threshold on the two member-linked similarities, in addition to the threshold of 0.15 on the member-member similarities maybe enough to solve this problem. In the longer term, we believe that a more cautious approach tolexical chaining may be needed, that is, an approach that may take more time, but is less likely tomake these sorts of errors.
6.4.2 Task factors
Question-answering is a very “fuzzy” task to choose for an evaluation such as we have performed.In the IR community, the process of evaluation is generally carried out in a totally automatedfashion, using collections of documents and queries with known sets of relevant articles. Of course,we could perform similar evaluations (as we have shown in section 5.4), but we are more interestedin seeing how the hypertexts that we build can be used by people to perform a specific task.
Designing the questions for a task to be performed by people is not an exact science, and so wehave to assume that the subjects had at best an imperfect understanding of the questions that theywere supposed to answer, even though the average response on the questionnaire to “I understoodthe questions I was supposed to answer” lay between “Agree” and “Strongly agree.” This varia-tion in understanding would obviously cause a variation in the answers that the subjects recorded.The way to avoid this seems to be to pose questions that require as little interpretation as possibleon the part of the subject.
The subjects performed best on question 2, where the idea was simply to find the names ofterrorists. This is a relatively straightforward task, and requires little interpretation, since mostof the names in the database are actually identified as terrorists in the articles. In the case of theother two questions, however, some subjects seemed to have some real difficulty. For example, inmore than one case, subjects answering question 3 reported only the name of the biotechnologycompany involved in a merger, rather than the names of all companies involved. In other cases,some subjects seemed to have difficulty distinguishing the name of a drug manufacturer fromthe name of the drug that they manufacture. This underscores the need for pilot testing in suchevaluations.
6.4.3 The influence of the domain
As we noted in section 2.1, newspaper articles are written so that one can stop reading them at theend of any particular paragraph. This property of news articles may account for the performanceof our intra-article links in this evaluation. If news articles are written to be skimmed, then it islikely that people will skim them. Since people will be more familiar with a newspaper than witha hypertext system and since the subjects were aware that they were reading newspaper articles,
86

they likely read them as they would read articles in the paper. This might not have been a winningstrategy for the task that we asked the subjects to perform, because if it had been, then we wouldprobably not have found a significant difference between the number of correct answers and thenumber of viewed answers (although the time restrictions would account for part of this). We did,however, find that the Low Web group had some benefit from the intra-article links. This indicatesthat we should not just abandon the idea of intra-article links: rather we should investigate howthese links could be used in longer texts that are not intended to be skimmed.
87

Chapter 7Deploying a system for a Web newspaper
While we have described the process of generating intra- and inter-article links, and have describeda system used for performing a test of our linking methodology, we have still not discussed howsuch a system could be deployed over the World Wide Web. This chapter will detail the construc-tion of the software infrastructure necessary to perform the tasks that we have described in theprevious chapters. For the most part, the system, which we call HyperTect, is written in C++, al-though a few AWK scripts are used for simple tasks such as cleaning up the format of the newsarticles. Our goal in building this demonstration system has been to produce software that iscapable of dealing with a reasonably large amount of text in a reasonable amount of time. By “rea-sonably large” we mean a year of a major newspaper such as the Globe and Mail. This seems like auseful measure, since this is far more text than is usually available on a newspaper Web site.
Although we are describing a system for use on the Web, it should be noted that most of thesoftware described could easily be re-targeted to another hypertext system.
7.1 Preparing the database
The first step in the construction of our system is the extraction of the lexical chains from the articlesand the generation of the weighted synset vectors. Figure 7.1 shows the connection between theseprocesses.
7.1.1 Lexical chaining
We begin with a file containing a collection of articles. The first stage of processing is to lexicallychain these articles. The lexical chainer produces two files from an input file of articles. The firstis the chain file, which contains all of the lexical chains from the documents. The format of a singlechain is shown in figure 7.2. The chain file contains not only the words contained in the chains butalso the synsets of which the chained words are members and the synsets that are linked to these.The second file is the chain-by-paragraph file, which describes the paragraphs of the articles in termsof the chains that they contain.
The chain file is used in the construction of inter-article links, while the chain-by-paragraph fileis used to construct intra-article links. Currently, the chain file is quite large, approximately twicethe size of the original input data. This is mostly due to the fact that we store all of the linkedsynsets in the chain file, in order to make the computation of the synset vectors more efficient,since it is then not necessary to look up all the linked synsets in WordNet. If this information wereleft out, the size of this file would drop dramatically.
88

ChainerLexical
File ofArticles
SynsetVector
Weighting
Member Vectors
Linked Vectors
Chain-by-paragraphFile
Chain File
Figure 7.1: Preprocessing a file of articles.
7.1.2 Building weighted synset vectors
The weighted synset vectors are built using the information contained in the chain file. This isa two-pass process. In the first pass, the number of documents that a particular synset occurs in(i.e., the document frequency) is calculated for both the member and linked synsets. In the secondpass, for each document the number of times that a particular synset appears in a set of memberor linked synsets (i.e., the synset frequency) is calculated. When all of the term weights for themember and linked synsets have been calculated using the function shown in section 5.3.2, themember and linked weighted synset vectors are output to separate files.
While the member vector file is approximately one-third of the size of the original articles, thelinked vector file is approximately 1.5 times this size. This difference is due to the fact that there isgenerally a much larger number of linked synsets than there are member synsets in a set of lexicalchains. For example, in the database used for our evaluation, the average length of a membervector is 100.2 synsets, and the average length of a linked vector is 541.0. The sizes of both of thesefiles could be reduced by compression techniques, but at a cost of speed. For the purposes of the
89

Number ofMemberSynsets
MemberSynsets
Number ofLinked
Synsets
LinkedSynsets
Word Count
interest 2 2 72746 72753 9 72745 72754 72755
store 1 1 73115 4 73113 73114 73116 73117
19
ChainNumber
5
Number ofWords
Overallchain information
elementsIndividual chain
Figure 7.2: The format of a chain from the chain file.
evaluation described in the previous chapter, we have left them uncompressed.
7.1.3 Database updates
Updating the database of articles is slightly more difficult for a system such as the one that we havedescribed than for a simpler system, such as one that uses inverted files. The difficulty arises fromthe fact that the weight for a synset in a particular document is based not only on the frequency ofthat synset in the document, but also on the frequency of that synset across all documents. Thus,adding a single document will change the weighting for all synsets in that document across all ofthe other documents.
Of course, adding a single document will not change the weights by a significant amount, butadding an entire day of a newspaper to an existing collection may. Thus, the best course seems tobe to regenerate the weight vectors at each addition, especially if the amount of data kept online isrelatively small.
7.1.4 Efficiency considerations
The chainer that we used to build the database for our evaluation is substantially faster than pre-vious efforts. For our evaluation database of approximately 30,000 articles (about 85 MB), the timefor chaining was approximately 6.6 hours on a Sun UltraSparc workstation with 256 MB of mainmemory. We should note, however, that the memory image of the program while running was only20 MB in size, most of which is accounted for by a full copy of the WordNet graph and indices thatare held in memory during chaining.
At this rate, a full year of the Globe and Mail (which we estimate to be approximately 75,000articles) would take approximately 16.5 hours to chain. This is certainly a reasonable amount oftime, amounting to about 3.5 minutes per issue of the paper. Also note that the work can be spreadamong as many machines as are available, since there is no dependence between articles at thisstage.
More precisely, if we consider the description of the chaining algorithm given in section 2.2.1,
90

we see that the majority of the work done during chaining is in building the strong and regularrelations between synsets. In both cases, if n is the number of chains, then we must calculate O(n2)
relations between pairs of chains for each iteration so that we can decide which chains to merge.These iterations continue until no more chains can be merged. In the worst case, we could expectthat there would be n such iterations, since the number of initial chains is equal to the number ofunique words in an article. This gives us a worst-case complexity for lexical chaining of O(n3).
In practice, however, we find that the complexity is approximately O(n2). Figure 7.3 shows aplot of the number of words chained (w) versus the time (in seconds) required for chaining (t) forapproximately 25,000 articles. The plotted line corresponds to the best fitting (in the least squaressense) parabola for the data. We believe that this is a reasonable average-case estimate of thechainer’s complexity.
t = 5:2�10�6 �w2+0:44Data
w
t
300025002000150010005000
45
40
35
30
25
20
15
10
5
0
Figure 7.3: Graph of number of words chained versus Time to chain.
Notice that the constant for the parabola is quite small, indicating that an article must be rela-tively large before it begins to take a large amount of time to chain it. For our evaluation database,the average number of words chained per article is approximately 127.
The building of the weighted synset vectors is quite fast, requiring approximately 40 minutesto process the articles from our evaluation database. At this pace, the system would require about1 hour and 40 minutes to process the chains from a full year of the Globe and Mail.
7.2 Serving articles over the Web
As we have mentioned, we would like to use the World Wide Web as our hypertext medium. Thus,we need a straightforward way to serve articles to a user’s browser. Figure 7.4 shows the processby which this could take place.
91

Member Vectors
of the documentwith intra- and inter-article links
Output HTML version
HyperTectServer
Articles
Linked Vectors
Computedocument similarities
HyperTectClient
N
HTML Document
Retrieve article
User request
Article request
Return document location to browser
WWW Browser
Figure 7.4: HyperTect client-server model.
7.2.1 The HyperTect client
We begin by supposing that a user has come to a newspaper’s Web site and has clicked on a linkthat will take her to the text of an article. We can view this click as a request for a particular article.Associated with this request will be the article number from the database, the set of parametersfor building intra-article links, and the threshold to use when calculating inter-article links. Theparameter set and threshold used to generate the hypertext could be different for each user, if theWeb site supports user authentication.
The article request is handled by a simple CGI script running on a Web server. We call this scriptthe HyperTect client. The HyperTect client passes this document request to a HyperTect server viaa TCP/IP connection, so that the server may be running on any computer on the Internet. Wemake this distinction between the client and server because the process of building inter-articlelinks is quite compute and I/O intensive and so is probably best handled by a dedicated server,rather than a Web server prone to load fluctuations.
7.2.2 The HyperTect server
The HyperTect server performs several actions when it receives a document request from the client:
1. The requested article, along with its chain-by-paragraph description and its weighted synset
92

vectors are retrieved from their various places.
2. The parameter set passed in the article request is used to generate a set of intra-article links.The main body of the article is written to an HTML file using the procedure described insection 4.2.6.
3. The weight vectors for the requested article are read in and compared against the rest ofthe vectors in the file. The first stage of the comparison is to compute the member-membersimilarity. If this similarity exceeds the threshold set by the user, then the member-linkedsimilarities are calculated. The document is then added to the list of documents to return tothe user. This document list is ranked by the sum of the three similarities and written to theend of the HTML file. The headlines of the related articles are used as anchor text.
4. The location of the HTML file is returned to the HyperTect client, who returns it to thebrowser, using the HTTP Location directive.
7.2.3 Efficiency issues
Generating a set of intra-article links for a single article, given a set of parameters, takes approxi-mately 0.03 seconds. This is certainly fast enough for our target environment of the Web, since thisamount of time will be completely overshadowed by network lag.
The computation of inter-article links is also reasonably fast. For our evaluation database of30,000 articles, using a threshold of 0.15, testing a single article’s vectors against all others takeson the order of 1.2 CPU seconds on a Sun UltraSparc workstation. This implies that the system iscapable of making approximately 25,000 vector similarity computations per second. At this rate,comparing a single document against a full year of a paper would take approximately 2.5 CPUseconds. This performance is comparable to the SMART system.
We believe that this is a reasonable amount of time for such a search to take, and indeed, whenusing the system, the wait time does not seem overly long. The server is very “light-weight”,with resident set size of only 1 MB when running document comparisons, so that for our currentdatabase, the amount of real time required for performing document comparisons is almost thesame as the amount of CPU time required.
We decided that, for efficiency reasons, the server should output an HTML file and return itslocation, rather than simply send HTML to the browser. While our search times are reasonable, wefelt that it would be unwise to overload the server with requests that are simply due to the userhitting the “Back” button on their browser.
93

Chapter 8Contributions and suggestions for future work
We believe that there are several valuable contributions in the work that we have done. In addition,we will provide some indications of future work that may be derived from the thesis.
8.1 Contributions
8.1.1 Inter-linker consistency
Our first contribution is the replication of Ellis et al.’s (1994a) study on inter-linker consistency.While their results were quite conclusive, the conditions under which their task was performedleft open questions as to how humans would fare on shorter, better structured texts. Our use ofnewspaper articles addresses these issues and shows that the conclusions that they reached areequally valid for short, well structured texts.
Of course, it may be possible that if a large number of human linkers were employed to buildhypertext links within articles then we could “average out” the links to a stable, consistent set.Unfortunately, it seems that this is too much to hope for in current online newspaper efforts wherethe online edition is prepared by a small number of people. In addition, the costs in time andmoney to perform such a task are prohibitive. Thus, we conclude that if we need to providehypertext links in online newspapers, then these links will need to be generated automatically.
8.1.2 Linking methodology
Most efforts at hypertext generation have focused on generating a hypertext from a single largedocument. Often these efforts focused on building purely structural links to sections and subsec-tions along with links to subject indices and some keyword search facility. Few have attemptedto build semantic links, and fewer still have attempted to build such links in large unrestrictedcollections of documents. Aside from this consideration, most of these systems are based on thetraditional IR notions of document similarity, that similar documents will tend to use the samewords. These systems are plagued by the problems of synonymy and polysemy. Although at-tempts have been made to cope with these difficulties, these attempts are often made when tryingto retrieve documents, rather than when representing them for retrieval.
Allan (1995) was among the first to attempt unrestricted hypertext generation, using the vectorspace methodology of the SMART information retrieval system. While this is important work, it ishampered by the necessity of term repetition for links to be built. As we showed in chapter 5, thisrequirement can affect the quality of the results obtained. To avoid this problem, it is necessary toconsider the fact that articles that are about the same or related topics will tend to use words thatare related by synonymy and other relations such as IS-A and INCLUDES.
94

Our representation of the contents of a document as a pair of weighted synset vectors accountsfor these problems as a side-effect of the representation. Because of this, we are able to considerdocument similarity in a new light, namely that similar documents will tend to use similar words.By using a synset-based representation, we abstract the documents from the word level to the con-cept level. The member synset vector that represents a document allows us to capture relationsbetween documents due to synonymy as well as term repetition. The linked synset vector allowsus to capture other relations. As a useful side effect, by building vectors of synsets, we need notconcern ourselves with the problem of word sense ambiguity, since a synset represents a singlesense of a word.
Despite building a more complicated representation for the documents, we were able to demon-strate that document linking could be done in real-time, and that pre-processing documents for usein the system could be done in a reasonable amount of time. Within a document, the lexical chainsgive us a much richer representation of the content, and to some extent, the structure of a docu-ment, so building links between the paragraphs becomes a much simpler task. To our knowledge,we are the first to apply lexical chaining techniques to such a task, and the first to attempt buildinghypertext links within smaller documents.
8.1.3 Evaluation
Our evaluation showed that we cannot reject the null hypothesis that there are no differences inthe two linking methodologies. Even so, the probability of a chance result such as those that weachieved is less than 0.1. In addition, we showed that for a particular partition of the subjects,the only significant differences were the number of HT links followed and the number of answersfound. We believe that there are several implementation factors that, when remedied, will producea significant result for our system.
We were somewhat surprised by the lackluster showing of the intra-article links in our eval-uation. The best that we can say about them is that, in general, they probably had no effect onhow well the subjects did in their question-answering tasks. It may be the case that the anchors forthe intra-article links simply did not provide enough information about where a link was leading.Another factor may have been the set of parameters that we selected to generate the intra-articlelinks during the evaluation. This set was one that we had used to test the system and we felt thatthe links generated were “good enough”.
The fact remains, however, that the Low Web group in our evaluation followed significantlymore intra-article links that the High Web group and the model shown in section 6.2.6 demon-strates that these links probably had some benefit for these subjects. Thus, such links should beprovided so that the novice users can have them, but an experienced user should be able to turnthem off, or modify how they are generated.
8.1.4 Large-scale lexical chaining
One of the less obvious contributions of our work is that we have shown that the technique oflexical chaining can be used on a much larger scale than had previously been attempted. Thisis especially gratifying in light of the fact that the extra work required to do lexical chaining (asopposed to keyword extraction) seemed to be repaid when our concept level representation oftexts performed better than the traditional representation during the evaluation.
The database that we built for our evaluation showed that at least one of the claims made forlexical chaining is valid. In the evaluation database selected from the TREC corpus, before chainingthe average number of senses associated with each word was 3.4. After chaining, the number of
95

senses dropped to 1.2, showing that the lexical chainer is performing lexical disambiguation, albeitimperfectly.
This thesis also shows that techniques drawn from the field of Computational Linguistics —techniques that are relatively complicated compared to traditional IR document processing — canbe used to successfully perform IR tasks in a wide domain on a large number of documents.
8.2 Suggestions for future work
8.2.1 Further evaluation
We believe that the somewhat inconclusive results of our evaluation indicate that it is necessary toreplicate our evaluation in order to gain more evidence.
The evaluation that we conducted was somewhat contrived, in the sense that by testing onlythe differences between linking methodologies, we have not exactly answered the question ofwhether our methodology produces good links in general. That is, we must consider whetherwe can claim that our methodology is useful if it has not been fully used. We are willing to defendour method on the basis that if we added the links that the methods agreed upon, then our methodwould perform at least as well as, and possibly better than, the competing methodology operatingon its own. Even so, this is exactly the sort of question that is amenable to evaluation and so wemust conduct experiments to test this hypothesis.
Furthermore, we need to test our methodology on a wider range of tasks, such as a broaderquestion-answering task, where the subjects must integrate information from several articles intotheir answers.
8.2.2 Lexical chaining
As we mentioned in section 6.4.1, there were several problems with the implementation of the lex-ical chainer that may have lead to less-than-optimal performance during our evaluation. Clearly,these problems need to be fixed in the next version of the lexical chaining software.
The first thing we need to add to improve the lexical chaining is proper-noun recognition.Even a simple version of this, such as collecting words that begin with upper-case characters,would improve the capabilities of the chainer. More importantly, we can add proper names toWordNet as a sort of pseudo-synset. These pseudo-synsets would consist of all of the variationsthat we can find on a person or entity’s name. For example, the proper noun Steve Martin andthe form of address Mr. Martin could be referring to the same individual, and should thereforebe together in a synset. This would also work for company names and their abbreviations, suchas International Business Machines and IBM. Although we would expect there to be many “Mr.Martin”s, the disambiguation properties of the lexical chainer will select the right one, at least in anewspaper domain. After each set of articles have been processed, the new pseudo-synsets couldbe written to a file to be used in successive runs. Of course, these synsets will not be linked intothe WordNet hierarchy, but they will allow us to build synset-based representations using wordsnot in WordNet.
Another problem with using WordNet is that it was intended as a very general lexical resource,and therefore lacks the kinds of domain-specific lexical items that we would like to be able to rec-ognize, even in a general domain such as newspapers. In the short term, we can do this simplyby representing unknown terms as a single new concept. In essence, the representation of a docu-ment would be based on weighted synset vectors and weighted term vectors. It may, however, bepossible to go a step further than this.
96

One of the useful features of Latent Semantic Indexing is that it is possible to calculate term-term similarities. We could use these similarities to determine how a new, unknown term could beincluded in existing lexical chains. In the extreme, we may be able to build lexical chains using onlythese term-term similarities. On a more reasonable level, we want to investigate how LSI could beused to infer relationships between people and the positions that they hold (e.g., recognizing thatJean Chretien is the Prime Minister of Canada). This would be very useful in a newspaper domain.
We need to work on the lexical chainer’s disambiguation ability, since our linking methodologydepends on well-disambiguated text. Others have been building lexical chainers (see, for example,Barzilay and Elhadad, 1997) that take much more care in attempting to disambiguate words. Thedownside of this is that doing so may increase the amount of time necessary to chain an article.
The final area of improvement for the chainer is its efficiency. The algorithm that we are cur-rently using is O(n3) in the worst case, although it only begins to slow down when processinglarge articles. There are some obvious changes that can be made in the current implementation toremedy these problems, at the expense of making the chainer code more complex.
It may be possible, however, to avoid the complexity problem altogether. WordNet is a rela-tively stable resource, and so we can consider determining all of the possible lexical chains thateach WordNet synset could appear in. Since how the chains are built does not depend on the text,we could then compute the lexical chains in a document as some subset of the possible chains inWordNet. There is no doubt that computing this set of chains would require a lot of time andspace, but it only needs to be done once and the benefit is that computing the lexical chains in adocument could then be done in constant time.
8.2.3 Typing links
One of the advantages of Allan’s work (1995) is that the links between portions of two texts canbe given a type that reflects what sort of link is about to be followed (e.g., revision or contrast).Although Allan could not show that users would have assigned these link types themselves, thisis still very interesting work. We currently have no method for producing such typed links, but itmay be the case that the relations between synsets could be used to build these links, once we haveused our synset weight vectors to determine whether two articles are related.
For example, consider two articles A1 and A2. If the member-member similarity of these twoarticles exceeds the threshold, then we will consider placing a link between them. By looking atthe member-linked similarities we can get some idea of how the synsets in A1 are related to thesynsets in A2. If the member vector of A1 and the linked vector of A2 show sufficient similarity,then we know that terms in A1 are one link away from those in A2, perhaps indicating that thecontent of A1 is a generalization or specialization of the content of A2.
More generally, once we have made our determination about linking two articles, we couldresort to a full comparison of the chains in the two documents, similar to the comparison that weshowed in section 5.2, our starting point for building inter-article links. If we can make the lexicalchainer more efficient, we should be able to make this comparison for a relatively small number ofdocuments in real time. If the result in section 6.3.2 is valid, then it would seem that it would bemost useful to type the links on the “first page” of the links shown to the user.
8.2.4 Efficiency
Although the system that we have proposed and built is sufficient to deal with a year of a newspa-per, we would need to make some changes in order to cope with larger amounts of text (i.e., in thegigabyte range). Clearly, having access to faster workstations will provide some relief in this area,but there are other optimizations that can be made.
97

For example, in the SMART vector space system, the vectors representing documents can beclustered so that a first pass can be made, determining which document clusters are most similarto a query document. More detailed computations can be made once a subset of the documentcollection has been selected in this way. A similar technique could be used for our weighted synsetvectors.
8.2.5 A wider range of texts
As we proceeded with the research on inter-article linking, we became more and more convincedthat this methodology should work reasonably well, given any well-written text. The preliminarytest of our linking methodology that we discussed in section 5.4 and the database that we used forour evaluation (see section 6.1.2) provide us with some support for this conviction. Some of thearticles from the Ziff corpus are long magazine articles (some more than 70 paragraphs in length).Their length did not seem to stop them from being included in clusters or linked to other articles.
It seems that there are some reasonable intra-article links generated in these longer magazine-style articles, although the number of links generated per paragraph appears to be much larger.The number of links drops when normalization is used on the chain density vectors for the para-graphs. This seems to be natural, given the longer paragraphs in such articles.
For example, appendix A shows the hypertext that resulted from applying the methodologydescribed in chapter 4 to an article from Maclean’s magazine (Chidley, 1997) about the amalgama-tion of the Greater Toronto Area into a “megacity”. This article is much larger than the virtualparenting article that we presented earlier. There are approximately twice the number of para-graphs, and the paragraphs are substantially longer. Because the article is much larger, it willcover more topics, and it’s structure will be more complicated than the one shown in table 4.2.
The hypertext links shown in appendix A were generated using the Mean Euclidean distancemetric, no weighting function, and normalization of the chain density vectors to a unit length. Az-score of 1.0 was used and all links are shown.
As you can see, the method generates some very useful links. For example, paragraph 5, de-scribing the expected savings from amalgamating is linked to paragraph 17, which describes howthe costs of amalgamation soared when Halifax and Dartmouth, Nova Scotia merged. Of course,this is only a single example, meant to demonstrate the process on a longer text. We would suggestthat an evaluation like the one that we carried out be attempted using longer, more diverse sourcesof texts. We believe that in these instances, the use of intra-article links will have more effect ondetermining how successful the subjects will be.
8.2.6 Applying lexical-chaining techniques to traditional IR
In a more speculative vein, we are considering ways that lexical chaining could be incorporatedinto more traditional IR systems. Such systems show a remarkable advantage when given only afew words as a query. Lexical chaining is not effective on such small pieces of text, since there isnot enough context to build good chains and disambiguate the words.
It may be possible, however, to build a set of lexical chains for a single user over a period oftime, incorporating each query into a representation of a particular user’s interests. These lexicalchains could then be used to modify the retrieval behaviour of the IR system by selecting articlesthat use only a particular sense of a word, as opposed to all senses.
Such a set of lexical chains may also be useful in our own hypertext generation system, wherethey could be used to modify the process of producing both intra- and inter-article links.
98

Bibliography
(Allan, 1995) James Allan. Automatic hypertext construction. PhD thesis, Cornell University, 1995.
(Barzilay and Elhadad, 1997) Regina Barzilay and Michael Elhadad. Using lexical chains for textsummarization. In ACL Workshop on Intelligent Scalable Text Summarization. ACL, July 1997.
(Beckwith et al., 1991) Richard Beckwith, Christiane Fellbaum, Derek Gross, and George A. Miller.WordNet: A lexical database organized on psycholinguistic principles. In Uri Zernik, editor,Lexical acquisition: Exploiting on-line resources to build a lexicon, pages 211–231. Lawrence ErlbaumAssociates, 1991.
(Bernstein, 1990) Mark Bernstein. An apprentice that discovers hypertext links. In N. Streitz,A. Rizk, and J. Andre, editors, Hypertext: Concepts, systems and applications: Proceedings of theEuropean conference on hypertext, pages 212–223. Cambridge University Press, 1990.
(Berry et al., 1995) M. W. Berry, S. T. Dumais, and G. W. O’Brien. Using linear algebra for intelli-gent information retrieval. SIAM Review, 37(4):573–595, 1995.
(Budanitsky, 1998) Alexander Budanitsky. Forthcoming thesis. Master’s thesis, University ofToronto, 1998. Expected.
(Chapman, 1992) Robert. L Chapman, editor. Roget’s International Thesaurus. HarperCollins, 5thedition, 1992.
(Chidley, 1997) Joe Chidley. A proposed merger draws cries of outrage from rich and poor, rightand left. Maclean’s, March 17 1997.
(Chignell et al., 1990) Mark H. Chignell, Bernd Nordhausen, J. Felix Valdez, and John A. Water-worth. Project HEFTI: Hypertext Extraction From Text Incrementally. Technical report, Instituteof Systems Science, 1990.
(Cumming and McKercher, 1994) Carmen Cumming and Catherine McKercher. The Canadian Re-porter: News writing and reporting. Harcourt Brace, 1994.
(Deerwester et al., 1990) S. Deerwester, S. T. Dumais, T. K. Landauer, G. W. Furnas, and R. A.Harshman. Indexing by latent semantic analysis. Journal of the Society for Information Science,41(6):391–407, 1990.
(Ellis et al., 1994a) David Ellis, Jonathan Furner-Hines, and Peter Willett. The creation of hypertextlinkages in full-text documents: Parts I and II. Technical Report RDD/G/142, British LibraryResearch and Development Department, April 1994.
99

(Ellis et al., 1994b) David Ellis, Jonathan Furner-Hines, and Peter Willett. On the creation of hy-pertext links in full-text documents: Measurement of inter-linker consistency. The Journal ofDocumentation, 50(2):67–98, 1994.
(Ellis et al., 1996) David Ellis, Jonathan Furner, and Peter Willett. On the creation of hypertext linksin full-text documents: Measurement of retrieval effectiveness. Journal of the American Society forInformation Science, 47(4):287–300, 1996.
(Forsyth, 1986) Allen Forsyth. A dictionary/thesaurus for a document retrieval system. Master’s thesis,University of Toronto, 1986.
(Furnas et al., 1987) G. W. Furnas, T. K. Landauer, L. M. Gomez, and S. T. Dumais. The vocab-ulary problem in human-system communication. Communications of the ACM, 30(11):964–971,November 1987.
(Furuta et al., 1989) Richard Furuta, Catherine Plaisant, and Ben Shneiderman. A spectrum ofautomatic hypertext constructions. Hypermedia, 1(2):179–195, 1989.
(Gadd, 1995a) Jane Gadd. Child aid “on double-edged sword”. The Globe and Mail, page A14,December 5 1995.
(Gadd, 1995b) Jane Gadd. Children’s aid societies plan staff, services cuts. The Globe and Mail,page A10, September 8 1995.
(GLOBEnet, 1997) GLOBEnet. GLOBEnet. The Globe and Mail, 1997. http://www.theglobeandmail.com/.
(Golovchinsky, 1997) Gene Golovchinsky. From information retrieval to hypertext and back again: Therole of interaction in the information exploration interface. PhD thesis, University of Toronto, 1997.
(Gotlieb and Kumar, 1968) C.C Gotlieb and S. Kumar. Semantic clustering of index terms. Journalof the ACM, 15(4):493–513, October 1968.
(Halliday and Hasan, 1976) M.A.K. Halliday and Ruqaiya Hasan. Cohesion in English. Longman,1976.
(Harman, 1994) Donna Harman. Overview of the third Text Retrieval Conference (TREC-3). InProceedings of the third Text Retrieval Conference, November 1994.
(Hertzum and Frøkjær, 1996) Morten Hertzum and Frøkjær. Browsing and querying in onlinedocumentation: A study of user interfaces and the interaction process. ACM Transactions onComputer-Human Interaction, 3(2):136–161, June 1996.
(Kominek and Kazman, 1997) John Kominek and Rick Kazman. Accessing multimedia throughconcept clustering. In Proceedings of CHI 97. ACM, 1997.
(Lehto et al., 1995) Mark R. Lehto, Wenli Zhu, and Bryan Carpenter. The relative effectiveness ofhypertext and text. International Journal of Human-Computer Interaction, 7(4):293–313, 1995.
(Marchionini et al., 1993) Gary Marchionini, Sandra Dwiggins, Andrew Katz, and Xia Lin. Infor-mation seeking in full-text end-user-oriented search systems: The roles of domain and searchexpertise. Library and Information Science Research, 15(1):35–69, 1993.
100

(Marchionini, 1989) Gary Marchionini. Making the transition from print to electronic encyclope-dia: Adaptation of mental models. International journal of man-machine studies, 30(6):591–618,1989.
(Mauldin, 1991) Michael L. Mauldin. Conceptual information retrieval: A case study in adaptive partialparsing. Kluwer Academic Publishers, 1991.
(Meadow, 1992) Charles T. Meadow. Text Information Retrieval Sytems. Academic Press, 1992.
(Morris and Hirst, 1991) Jane Morris and Graeme Hirst. Lexical cohesion computed by thesauralrelations as an indicator of the structure of text. Computational Linguistics, 17(1):21–48, 1991.
(Nordhausen et al., 1991) Bernd Nordhausen, Mark H. Chignell, and John Waterworth. The miss-ing link? Comparison of manual and automated linking in hypertext engineering. In Proceedingsof the Human Factors Society 35th annual meeting, 1991.
(Outing, 1996) Steve Outing. Newspapers online: The latest statistics. Editor and Publisher In-teractive [Online], May 13 1996. Available at: http://www.mediainfo.com/ephome/news/newshtm/stop/stop513.htm.
(Outing, 1997) Steve Outing. Online newspapers statistics. Editor and Publisher Interactive [Online],May 15 1997. Available at: http://www.mediainfo.com/ephome/npaper/nphtm/stats.htm.
(Rada and Diaper, 1991) R. Rada and D. Diaper. Converting text to hypertext and vice versa. InHeather Brown, editor, Hypermedia/Hypertext and object-oriented databases, chapter 9, pages 167–200. Chapman and Hall, 1991.
(Rada and Murphy, 1992) Roy Rada and Clare Murphy. Searching versus browsing in hypertext.Hypermedia, 4(1):1–30, 1992.
(Rau and Jacobs, 1991) Lisa F. Rau and Paul S. Jacobs. Creating segmented databases from free textfor text retrieval. In 14th Annual International ACM/SIGIR Conference on Research and Developmentin Information Retrieval, pages 337–346, Oct. 1991.
(Rau et al., 1989) Lisa F. Rau, Paul S. Jacobs, and Uri Zernik. Information extraction and textsummarization using linguistic knowledge acquisition. Information Processing and Management,25(4):419–428, 1989.
(Salton and Allan, 1993) Gerard Salton and James Allan. Selective text utilization and text traver-sal. In Proceedings of Hypertext ’93, pages 131–144. ACM, ACM, November 1993.
(Salton et al., 1990) Gerard Salton, Chris Buckley, and Maria Smith. On the application of syntacticmethodologies in automatic text analysis. Information Processing and Management, 26(1):73–92,1990.
(Salton et al., 1993) Gerard Salton, James Allan, and Chris Buckley. Approaches to passage re-trieval in full text information systems. In Proceedings of sixteenth annual international ACM SIGIRconference on research and development in information retreival, pages 49–58, Pittsburgh, 1993.
(Salton, 1989) Gerard Salton. Automatic text processing. Addison-Wesley, 1989.
(Shellenbarger, 1995) Sue Shellenbarger. High-tech parenting virtually a finger tip away. The Globeand Mail, page A10, December 12 1995.
101

(Simon and Schuster, 1997) Simon and Schuster. College NewsLink. Simon and Schuster, 1997.http://www.ssnewslink.com/.
(Sparck Jones, 1991) Karen Sparck Jones. The role of artificial intelligence in information retrieval.Journal of the American Society for Information Science, 42(8):558–565, 1991.
(St-Onge, 1995) David St-Onge. Detecting and correcting malapropisms with lexical chains. Master’sthesis, University of Toronto. Published as technical report CSRI-319, 1995.
(Stairmand, 1994) Mark Stairmand. Lexical chains, WordNet and information retrieval. Con-densed version of Master’s Thesis, 1994.
(Tarr and Borko, 1974) Daniel Tarr and Harold Borko. Factors influencing inter-indexer consis-tency. In Proceedings of the ASIS 37th Annual Meeting, volume 11, pages 50–55, 1974.
(Tenopir and Shu, 1989) Carol Tenopir and Man Evena Shu. Magazines in full text: Uses andsearch strategies. Online Review, 13(2):107–118, 1989.
(Voorhees, 1994) Ellen M. Voorhees. Query expansion using lexical-semantic relations. In Proceed-ings of SIGIR 94. ACM, 1994.
(Washington Post, 1997) Washington Post. washingtonpost.com. Washington Post, 1997. http://www.WashingtonPost.com.
(Westland, 1991) J. Christopher Westland. Economic constraints in hypertext. Journal of the Ameri-can Society for Information Science, 42(3):178–184, 1991.
(Wilson, 1990) Eve Wilson. Links and structures in hypertext databases for law. In N. Streitz,A. Rizk, and J. Andre, editors, Hypertext: Concepts, systems and applications: Proceedings of theEuropean conference on hypertext, pages 194–211. Cambridge University Press, 1990.
(Witten et al., 1994) Ian H. Witten, Alistair Moffat, and Timothy C. Bell. Managing Gigabytes: Com-pressing and indexing documents and images. Van Nostrand Reinhold, 1994.
102

Index
Aadjacency matrix, 45
Cchain density vector, 40
normalization, 42similarity, 42weighting, 40
Ddensity, 40document clustering, 60document ranking, 59document structure, 37
Hhypertext
constructionautomatic, 20manual, 7, 18
economic factors, 8representative, 49
Iindex
back of the book, 21, 23information retrieval, 14
latent semantic indexing, 16, 97performance measures
precision, 14recall, 14
vector space model, 15inter-linker consistency, 18inverted pyramid style, 10
Llatent semantic indexing, 16lead, 10
hard, 10soft, 10
lexical chain, 10, 37implementation drawbacks, 12
linkapprentice, 22inter-article, 51
computing, 59intra-article, 37
computing, 44semantic, 9, 21structural, 9, 20
link set, 19
Ppolysemy, 9precision, 14
Rrecall, 14
Ssearcher behaviour, 25
domain experts, 26in electronic systems, 26in paper systems, 26search experts, 26, 27search novices, 27search trainees, 27
sense disambiguation, 12similarity
chain density vector, 42coefficients of, 42cosine measure of, 15matrix, 42member-linked, 57member-member, 57
103

synset vector, 57synonymy, 9synset, 11
link directions, 11links between, 11relations
extra strong, 11regular, 11strong, 11
synset vectorlinked, 57member, 57similarity, 57, 58weighting, 58
Tterm weighting function, 15tf�idf, 15, 23
WWordNet, 10, 17
deficiencies, 14
104

Appendix AThe Toronto amalgamation article in hypertext format
This appendix contains the text of the Toronto amalgamation article discussed in chapter 81. Thehypertext links between the paragraphs were built using the Mean Euclidean distance metric, noweighting function, normalization to a unit length, and a z-score threshold of 1.0. All generatedlinks are shown. The format of the links is as follows:
Anchor Paragraph Number / Page
Opposition to the bill, scheduled for final reading in the provincial... { 4 / next page
A proposed merger draws cries of outragefrom rich and poor, right and left
byJoe Chidley
1. It is an unwritten code of conduct for big-city life: avoid speaking to strangers on the public transit system–and if talking to a friend, keep it down, please. So ingrained is that protocol that when a group of Torontoteenagers started talking loudly on the Gerrard streetcar one late-February afternoon, the discomfort amongother passengers was almost palpable. It was only heightened when one of the kids, a long-haired girl in a greenbomber jacket, actually addressed an older stranger. “How are you going to vote on megacity? You gotta voteNo, man,” she remarked, unbidden. Before he could respond, another teen piped in: “I dunno. It’s gonna happenanyway–Scarborough’s going to get sucked up by Toronto. Scarborough’s so small.” The stranger, getting aword in edgewise, pointed out that Scarborough and Toronto are, in fact, about the same size. “Really?” saidthe second teen, her nose-ring twitching with curiosity. “I dunno, around my subway station, Kennedy–” “Thatstation sucks,” interjected Teen No. 1. “Yeah,” continued Teen No. 2. “Anyway, around there, it’s pretty small.”
Opposition to the bill, scheduled for final reading in the provincial... { 4 / next page
Still, few who have seriously studied the problems facing Toronto say...{ 9 / page 107
Unfortunately, there is no consensus on the best way to address those...{ 10 / page 107
It was a hardball tactic that, to many critics, seemed both... { 15 / page 108
During provincial hearings on the megacity bill that culminated last... { 16 / page 108
Like many others, City of Toronto Mayor Hall predicts dire... { 21 / page 109
2. For once, strangers are talking to one another in Toronto. And what’s got them talking–even the teenagers–ismunicipal politics, something Torontonians usually find so unenthralling that only about a third of them vote incivic elections. But in Toronto–that somewhat arrogant metropolis the rest of the country loves to hate–theseare unusual times. The city is in the grip of Mega-Madness, and a rivetting drama is being played out on thecivic stage. To the provincial Conservatives and their supporters, it is a tale of solid municipal policy and soundfiscal management. But to many Torontonians, who fear that the province’s reforms will destroy their city, it hastaken on the proportions of a horror movie–Megacity: The Tory Monster that Ate Toronto.
1The text of this article is copyright c Macleans, 1997. Used with permission.
105

Still, few who have seriously studied the problems facing Toronto say...{ 9 / next page
Like many others, City of Toronto Mayor Hall predicts dire... { 21 / page 109
3. The plot goes something like this. Last December, the provincial government introduced Bill 103, which as ofnext year will unify the area’s six municipalities, along with the regional government of Metropolitan Toronto,into a single city of about 2.3 million people–Toronto the Good becomes Toronto the Huge. It might seem arelatively innocuous bit of legislative tinkering, but with the proposed amalgamation, the provincial governmentstepped boldly –some say blindly–into a political minefield.
But the real trouble for the Tories is that few Torontonians think... { 7 / this page
Unfortunately, there is no consensus on the best way to address those...{ 10 / next page
It was a hardball tactic that, to many critics, seemed both... { 15 / page 108
Like many others, City of Toronto Mayor Hall predicts dire... { 21 / page 109
4. Opposition to the bill, scheduled for final reading in the provincial legislature next month, was immediate.And the cries of outrage–remarkably loud for such a politically staid city–have come from rich and poor, leftand right. The protests could be heard at any of the 20 or so community meetings at which amalgamationhas been discussed every week for the past three months, or seen on the myriad “Vote No to megacity” signsoutside homes and businesses. Last week, in referendums sponsored by the six municipalities–all of whosemayors oppose the megacity–the opposition culminated in a rejection of amalgamation by Toronto residents.Three-quarters of participating voters (turnout was, again, about one-third) said No to the megacity. Provincialofficials, who charged that the referendum questions were biased and that the voters’ lists were unreliable, hadrepeatedly vowed to ignore the results. But last week’s No vote still sent them scrambling for damage control,even as they vowed that amalgamation will continue.
Unfortunately, there is no consensus on the best way to address those...{ 10 / next page
In the wake of last week’s referendum results, the Conservatives had...{ 20 / page 108
Like many others, City of Toronto Mayor Hall predicts dire... { 21 / page 109
5. The provincial plan for Toronto is, in fact, a radical piece of legislation, and its effects will transcend the bordersof the new city. The unified Toronto will be a virtual city-state, outpacing the populations of six provinces andrivalling that of Alberta (population 2.7 million). The new Toronto will be bigger than any American city exceptNew York, Los Angeles and Chicago. Ostensibly, the new city will also be leaner and more efficient than theold one: the government projects cost savings of $865 million by the year 2000, thanks to less waste, fewerpoliticians–and the elimination of as many as 4,500 civil service jobs. An amalgamated Toronto will “have astrong, unified voice to sell itself internationally” in the global marketplace, boasts Municipal Affairs MinisterAl Leach. “We have the potential to take a great city and make it even greater.”
One miscalculation was the process. These days, amalgamation is all... { 13 / next page
Other critics, like federal NDP Leader Alexa McDonough, questioned the...{ 17 / page 108
6. Many Torontonians, however, clearly do not buy Leach’s argument. They fear that amalgamation, by reducingthe number of councillors to 44 from the current 106, will dilute their political voices and make local governmentless responsive. Others are concerned that property taxes will rise–not only because of amalgamation, but alsobecause of separate provincial plans to reform the tax system and to off-load the cost of social services onto themunicipalities. Still others simply do not like the way the Tories have gone about implementing change–and useloaded words like “tyranny” and “dictatorship” to prove their point.
7. But the real trouble for the Tories is that few Torontonians think about the city in terms of the “global market-place.” Sure, they are smugly satisfied when, as Forbes magazine did last November, Toronto is rated as the bestplace in the world to balance work and family. But they remain tied not so much to the idea of city as to theidea of neighborhood: communities like Cabbagetown or Baby Point or the Beaches; street designations likethe Kingsway or the Danforth; even–as with the teenager from Scarborough–the subway stop near their homes.To them, amalgamation seems a threat to their sense of community, to the places they call home. “If it wasn’tso destructive, it would be funny,” says City of Toronto Mayor Barbara Hall. “It makes no sense, they’ve notthought it through, and yet it has the potential to seriously damage a community that is the envy of the world.”
106

Still, few who have seriously studied the problems facing Toronto say...{ 9 / this page
Unfortunately, there is no consensus on the best way to address those...{ 10 / this page
It was a hardball tactic that, to many critics, seemed both... { 15 / next page
Like many others, City of Toronto Mayor Hall predicts dire... { 21 / page 109
8. That worry is echoed by North York Mayor Mel Lastman, a passionate civic booster who gets visibly upsetwhen he talks about the megacity. At a recent anti-amalgamation rally–one of many at which he and the othermayors have spoken out–he waved around the province’s map of the new municipal boundaries. “You won’tfind North York anywhere on the map! North York is gone!” Lastman half-yelled, his face turning red. “They’recarving us up like a turkey and it isn’t even Thanksgiving!”
9. Still, few who have seriously studied the problems facing Toronto say that the status quo is acceptable. In thecurrent division of powers, the Municipality of Metropolitan Toronto provides about 70 per cent of services,including police, ambulances, sewage, water and public transit, across the entire area. But the rest of themunicipal structure is a complex network of individual city bylaws governing roads, health, garbage collectionand planning. And there is redundancy: the Toronto area has six different fire departments, each with its ownfire chief and training facilities. Further confusion results from the fact that some services are provided bothby the Metro government and by the individual cities. Some roads are owned by Metro, others by the localmunicipality. “People don’t know what’s going on, people get confused and angry and afraid, because it’scomplicated,” says Patricia Petersen, director of the urban studies program at the University of Toronto and asupporter of amalgamation. “The current system is not conducive to developing any reasonable discussion onissues that really matter to us.”
It was a hardball tactic that, to many critics, seemed both... { 15 / next page
Like many others, City of Toronto Mayor Hall predicts dire...{ 21 / page 109
10. Unfortunately, there is no consensus on the best way to address those problems. Last winter, a provincialtask force, led by local United Way president Anne Golden, suggested that the Metro level of government bedissolved and that the other municipal-ities, reduced in number to four, become part of a wider government–the Greater Toronto Area, or GTA, encompassing Toronto and its outlying areas. Then, the Who Does WhatAdvisory Panel, chaired by former Toronto mayor and federal Tory cabinet minister David Crombie, endorseda strong urban core for the GTA and some degree of consolidation in the metropolitan area–but not specificallyamalgamation. Another scheme, developed last year by Toronto-area mayors, opted for the abolition of regionalgovernments, including Metro, with municipalities co-ordinating services among themselves.
It was a hardball tactic that, to many critics, seemed both... { 15 / next page
During provincial hearings on the megacity bill that culminated last... { 16 / next page
In the minds of many Torontonians, amalgamation, property tax reform...{ 19 / next page
Like many others, City of Toronto Mayor Hall predicts dire... { 21 / page 109
11. The Conservatives had, as part of their cost-cutting platform, promised in the last election to get rid of at leastone level of Toronto government. And according to Municipal Affairs Minister Leach, they at first considereddissolving Metro–but decided last fall that it would be too complicated. “How do you dissolve down the servicesthat are provided by Metro?” he asks. “The longer we looked at it, the more obvious it was that with the majorityof major services already at the upper tier, the right option was a single city.”
12. And then the trouble really started for the Tories in Toronto.
13. One miscalculation was the process. These days, amalgamation is all the rage in Ontario, where about 350municipalities are now negotiating mergers. In Kingston, for instance, city and county municipalities have beenworking towards amalgamation for the past two years. And in Hamilton, a constituent assembly has developedan amalgamation plan that would replace existing municipalities with one Hamilton-Wentworth authority. Al-though those schemes have not been uniformly popular (Hamilton-area residents voted against amalgamation ina February referendum), they at least involved extensive local input.
14. But not in Toronto. The Tories sent Bill 103 straight to first reading–without releasing a position paper, as wouldhave been usual for such a major reform. And in the legislation itself, the government gave much of the controlover existing municipalities to an appointed interim board of trustees, whose decisions would be final. Those
107

trustees would be followed by another appointed body–a transition team to assist in the implementation of themegacity–with many of the same powers.
15. It was a hardball tactic that, to many critics, seemed both dictatorial and undemocratic. And it is what par-ticularly sticks in the craw of John Sewell, the former Toronto mayor and local newspaper columnist who hasgalvanized anti-amalgamation forces as a leader of Citizens for Local Democracy. “I live in a democracy, and Iwant control over people who make decisions for me,” said Sewell, whose group’s weekly meetings have regu-larly attracted more than 1,000 concerned Torontonians for the past three months. “The Tories are saying, ‘Youcan’t have it any more, we’ve got a better idea’—which is putting autocrats in charge.” (The trustees questioncreated a political embarrassment for the government last month when an Ontario Court judge ruled that theirappointment by executive order, before Bill 103 had passed, had no standing in law.)
Like many others, City of Toronto Mayor Hall predicts dire...{ 21 / next page
16. During provincial hearings on the megacity bill that culminated last week, speaker after speaker voiced theirconcern over the Tory reforms. Among the most articulate was Jane Jacobs, the American-born architect andauthor of the influential The Death and Life of Great American Cities. “Anyone who supposes harmony willprevail and efficiency reign after whole-hog amalgamation,” said Jacobs, a Toronto resident for the past 30 years,“has taken leave of common sense.”
17. Other critics, like federal NDP Leader Alexa McDonough, questioned the government’s claim that amalgama-tion will save money. McDonough pointed out that in her home town of Halifax, which joined in 1996 withDartmouth and two other municipalities, transition costs have soared to $22 million–more than double what theNova Scotia government projected. Still others claimed that amalgamation in Toronto will also drive up long-term costs. A megacity, they argued, would eliminate competition among municipalities, add the expense ofproviding equal services to a wider area, and result in higher labor costs thanks to larger, more powerful unions.
18. The Conservatives’ timing, meanwhile, also fuelled public opposition. A month after introducing Bill 103, theprovince announced a sweeping package of other municipal reforms over a seven-day period dubbed Mega-Week. Those included adopting a new property tax formula, called actual value assessment. Tax reform haslong been a contentious issue in Toronto, and some downtown homeowners will probably see their propertytaxes rise substantially under the new scheme. At the same time, the province unveiled plans to remove $5.4billion in education bills from municipal property taxes–but then download $6.4 billion in service costs to themunicipalities, with the difference made up by a $1-billion reserve fund. The most controversial change wasthat municipalities would share the costs of welfare equally with the province, where before they paid only 20per cent. The City of Toronto estimated that, together with other social-service costs, the welfare shift wouldcost property taxpayers $202 million annually. Even the Board of Trade of Metropolitan Toronto and Crombie,a Conservative, found the downloading hard to swallow. “It is an egregious error,” said Crombie, who supportsamalgamation. “It’s just as though they went to a baseball game and tried to score a hockey goal.”
In the wake of last week’s referendum results, the Conservatives had...{ 20 / this page
19. In the minds of many Torontonians, amalgamation, property tax reform and downloading all added up to nothingless than a Conservative conspiracy to ruin the city. “They’re driven by two people who resent the big city–[Finance Minister] Ernie Eves and Mike Harris,” declared Sewell. “They’re both small-town guys, they’re outof their depth in the city, they resent it, and they’re going to go out and get it.” Leach, a lifelong Torontonian,acknowledges that had the government not been under a self-imposed time constraint to enact municipal reformby the end of 1997, “I would have kept the issues separate–dealt with amalgamation, and done that separatelywithout some of the other things.”
20. In the wake of last week’s referendum results, the Conservatives had to address the scale–and volume–of op-position to their municipal reform package. First, they delayed the deadline for amendments to Bill 103 untilthe end of March–an indication that substantial changes are in the works. Those could include curtailing thepowers of the trustees and transition team, and possibly guaranteeing that property taxes will not rise as a resultof amalgamation. More important, Harris has broadly hinted that the government will rethink its downloadingscheme. One option, which Crombie and other Tory supporters have been pressuring the province to adopt:leaving some capital costs of education, like busing and building maintenance, with the municipalities, whilemaintaining the traditional 80-20 provincial-municipal split on welfare funding. But Leach and Harris have alsomade it clear–referendum or not–that the megacity will go ahead more or less as planned.
108

21. Like many others, City of Toronto Mayor Hall predicts dire consequences for downtown neighborhoods likeCabbagetown, where she has lived for the past 30 years: a flight of the middle class, declining infrastructure,more poor people on the streets. Yet, sitting over a cappuccino in a small, trendy caf recently–as patronsregularly come up to say “Hi”–Hall foresees something positive arising from the megacity debate. “Whateverhappens, big change will come from it,” she says. “People have seen their communities at risk, and have puttime and energy into organizing and talking about things. I don’t believe that will disappear–people will stayinvolved, and find ways to take responsibility in civic life.” If that prediction turns out to be true, there might behope for the megacity after all.
109
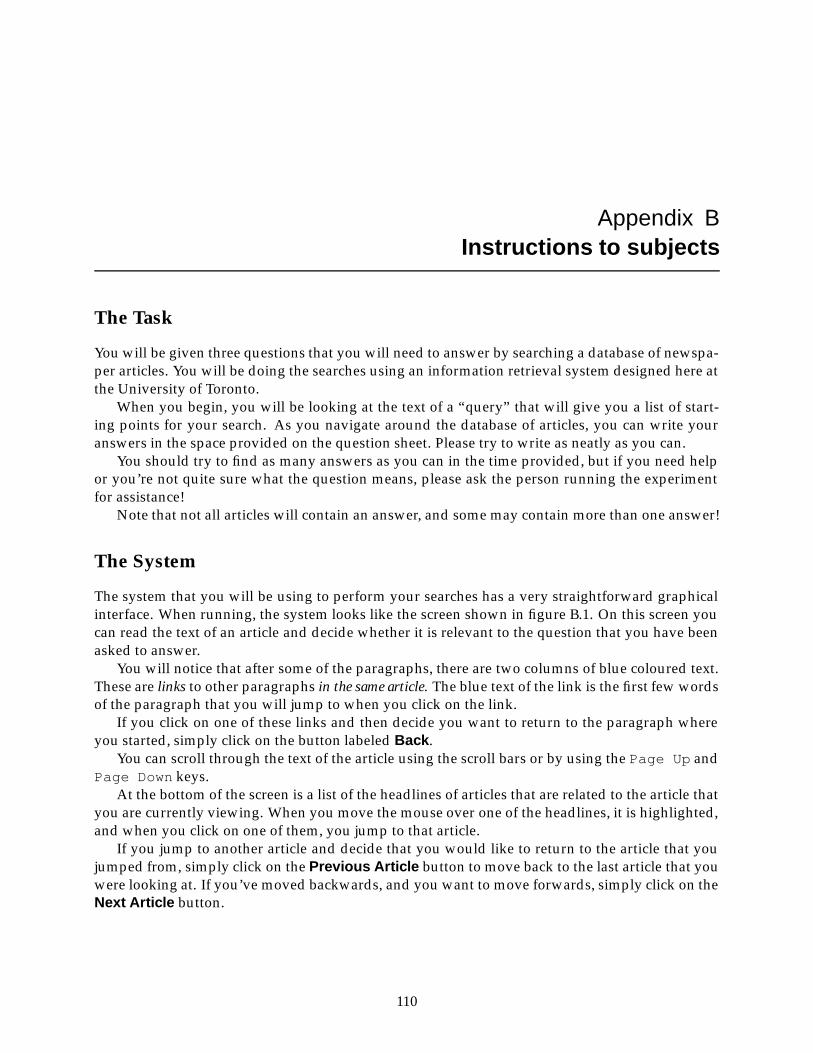
Appendix BInstructions to subjects
The Task
You will be given three questions that you will need to answer by searching a database of newspa-per articles. You will be doing the searches using an information retrieval system designed here atthe University of Toronto.
When you begin, you will be looking at the text of a “query” that will give you a list of start-ing points for your search. As you navigate around the database of articles, you can write youranswers in the space provided on the question sheet. Please try to write as neatly as you can.
You should try to find as many answers as you can in the time provided, but if you need helpor you’re not quite sure what the question means, please ask the person running the experimentfor assistance!
Note that not all articles will contain an answer, and some may contain more than one answer!
The System
The system that you will be using to perform your searches has a very straightforward graphicalinterface. When running, the system looks like the screen shown in figure B.1. On this screen youcan read the text of an article and decide whether it is relevant to the question that you have beenasked to answer.
You will notice that after some of the paragraphs, there are two columns of blue coloured text.These are links to other paragraphs in the same article. The blue text of the link is the first few wordsof the paragraph that you will jump to when you click on the link.
If you click on one of these links and then decide you want to return to the paragraph whereyou started, simply click on the button labeled Back .
You can scroll through the text of the article using the scroll bars or by using the Page Up andPage Down keys.
At the bottom of the screen is a list of the headlines of articles that are related to the article thatyou are currently viewing. When you move the mouse over one of the headlines, it is highlighted,and when you click on one of them, you jump to that article.
If you jump to another article and decide that you would like to return to the article that youjumped from, simply click on the Previous Article button to move back to the last article that youwere looking at. If you’ve moved backwards, and you want to move forwards, simply click on theNext Article button.
110

Jump toRelatedArticles
Here is a link that will...
Back
Next Article
Previous Article
Here is the Headline of the ArticleHere is a subheading
Here is the headline of an article that you can jump to.Try clicking on me to jump to a new article!
Help
it and you decide that it’s relevant to the query that you’re trying toThe text of the article that you’re viewing goes here. If you’re looking at
This is another link...
Headline
File Article
answer, then you should write down the answer!
Figure B.1: The System
How to tell where you’ve been
As you search for articles that are relevant to your question, you should be aware that the lists ofrelated articles at the bottom of each article are colour coded to help you remember what articlesyou’ve already seen.
Articles that you have seen are magenta coloured when shown in a list of links. Also, when youfollow a link within an article that you are browsing, any links to that paragraph are then magentacoloured.
111

Appendix CPost-task questionnaire
Name:
Education:
Occupation:
If student, field of study:
1. I understood the questions I was supposed to answer.
1 2 3 4 5
Strongly Disagree Neutral Agree Stronglydisagree agree
2. I am confident that all the answers that I found were correct.
1 2 3 4 5
Strongly Disagree Neutral Agree Stronglydisagree agree
3. Were the links within the articles useful?
1 2 3 4 5
Not at all Not really Somewhat Useful Very useful
4. Did the links between articles connect articles that were related?
1 2 3 4 5
Never Almost never Sometimes Usually Always
5. How often do you browse the World Wide Web?
1 2 3 4 5
Never Once or twice Once or twice Three or four Everya month a week times a week day
112

6. Did you like the system?
Yes No
113
Copyright © 2022 FDOKUMEN