On systematic errors in parametrized calculations of longwave radiation transfer (1985)
18
Quart. J. R. Met. SOC. (1985), 111, pp. 691-708 551.521.3 On systematic errors in parametrized calculations of longwave radiation transfer By JEAN-JACQUES MORCRETTE and YVES FOUQUART Laboraroire d’Optique Atmosphtrique, Uniuersitk des Sciences er Techniques de Lille, 59655-Villeneuue d’Ascq Cedex, France (Received 18 July 1984; revised 6 March 1985. Communicated by Dr A. Hollingsworth) SUMMARY A detailed narrow band model of longwave radiation transfer in a clear-sky atmosphere is used to study the impact on cooling rate profiles and radiative fluxes of some approximations commonly used in GCM-type radiation codes. Systematic errors in the results arise when economies are made in the vertical and spectral resolution. A coarse discretization of the vertical profiles of temperature and humidity overestimates atmospheric absorption (by as much as +5 W m-2), as does (by as much as +5 Wnr2) the use of mean values of the temperature and humidity in each model layer. Overestimation of the absorption (up to +7 W m-’) also results from the use of the strong line approximation for H20 and C02, or of the weak line approximation for 03. Decreasing the order of the vertical quadrature used for the vertical integration tends to decrease the absorption. Effects of the water vapour continuum absorption outside the 800-1250 cm-’ window region cannot be neglected, as this absorption accounts respectively for 21 and 8 W m-2 of the downward radiation at the surface for a tropical and a subarctic winter atmosphere, and decreases the corresponding outgoing radiation at the top of the atmosphere by 5 and 0.3 W m-’ respectively. Neglecting N 2 0 and CHI decreases absorption by about 5 W m-’. Restricting C02 absorption to the 500-800 cm-’ interval, and O3 absorption to the 970- 11 IOcm-] interval further decreases by 5 W m-* the absorption in the tropical atmosphere. For transmission functions described by statistical models, a widening of the spectral intervals reinforces the influence of the strong lines and leads to an overestimation of the absorption, which is partly compensated by a weaker temperature dependence. 1. INTRODUCTION The effects of systematic errors in radiation computations on the climate generated by a large-scale numerical model of the atmosphere have been studied by Fels and Kaplan (1975), Wu et al. (1978) and Ramanathan et al. (1983). In these experiments involving general circulation models (GCMs) running successivelywith different radiation codes but the same parametrizations of the other physical processes and the same representations for the dynamics, all authors have reported large impacts on the temperature field and the dynamics of their models, thus indicating the need for precise radiation computations. However, the accuracy needed to compute the radiative components of the energy budget of the atmosphere as simulated in GCMs is not easy to determine a priori. While the exchange of radiation in the earth-atmosphere system can be evaluated from a limited set of variables (namely temperature and the distributions of the radiatively active constituents) through equations established for years, the needed accuracy depends on the time scale considered by the numerical experiment and it cannot be assessed independently of that of the other diabatic processes. For the purpose of climate modelling, an error of 0.05 K day-’ per scale height in the vertical profile of the radiative cooling (i.e. 1K per scale height over a period of 20 days, corresponding to the mean radiative response time) has been considered as an acceptable level for systematic errors in radiative calculations (WMO-ICSU 1974). In order to assess the state-of-the-art concerning the calculation of the radiation transfer in climate models, and the effects of errors in these radiation calculations upon the generated climate, the WMO-ICSU Joint Scientific Committee, the U.S. Department of Energy, and the IAMAP Radiation Commission have recently launched a programme for the intercomparison of radiation codes used in climate models (given the acronym ICRCCM). The adopted three-step strategy includes: (i) comparison of radiation codes in ‘stand alone’ mode with each other 69 1
Transcript of On systematic errors in parametrized calculations of longwave radiation transfer (1985)
Quart. J . R. Met. SOC. (1985), 111, pp. 691-708 551.521.3
On systematic errors in parametrized calculations of longwave radiation transfer
By JEAN-JACQUES MORCRETTE and YVES FOUQUART Laboraroire d’Optique Atmosphtrique, Uniuersitk des Sciences er Techniques de Lille, 59655-Villeneuue d’Ascq
Cedex, France
(Received 18 July 1984; revised 6 March 1985. Communicated by Dr A. Hollingsworth)
SUMMARY A detailed narrow band model of longwave radiation transfer in a clear-sky atmosphere is used to study
the impact on cooling rate profiles and radiative fluxes of some approximations commonly used in GCM-type radiation codes.
Systematic errors in the results arise when economies are made in the vertical and spectral resolution. A coarse discretization of the vertical profiles of temperature and humidity overestimates atmospheric absorption (by as much as +5 W m-2), as does (by as much as + 5 W n r 2 ) the use of mean values of the temperature and humidity in each model layer. Overestimation of the absorption (up to +7 W m-’) also results from the use of the strong line approximation for H20 and C 0 2 , or of the weak line approximation for 03.
Decreasing the order of the vertical quadrature used for the vertical integration tends to decrease the absorption. Effects of the water vapour continuum absorption outside the 800-1250 cm-’ window region cannot be neglected, as this absorption accounts respectively for 21 and 8 W m-2 of the downward radiation at the surface for a tropical and a subarctic winter atmosphere, and decreases the corresponding outgoing radiation at the top of the atmosphere by 5 and 0.3 W m-’ respectively. Neglecting N 2 0 and CHI decreases absorption by about 5 W m-’. Restricting C 0 2 absorption to the 500-800 cm-’ interval, and O3 absorption to the 970- 11 IOcm-] interval further decreases by 5 W m-* the absorption in the tropical atmosphere.
For transmission functions described by statistical models, a widening of the spectral intervals reinforces the influence of the strong lines and leads to an overestimation of the absorption, which is partly compensated by a weaker temperature dependence.
1. INTRODUCTION
The effects of systematic errors in radiation computations on the climate generated by a large-scale numerical model of the atmosphere have been studied by Fels and Kaplan (1975), Wu et al. (1978) and Ramanathan et al. (1983). In these experiments involving general circulation models (GCMs) running successively with different radiation codes but the same parametrizations of the other physical processes and the same representations for the dynamics, all authors have reported large impacts on the temperature field and the dynamics of their models, thus indicating the need for precise radiation computations. However, the accuracy needed to compute the radiative components of the energy budget of the atmosphere as simulated in GCMs is not easy to determine a priori. While the exchange of radiation in the earth-atmosphere system can be evaluated from a limited set of variables (namely temperature and the distributions of the radiatively active constituents) through equations established for years, the needed accuracy depends on the time scale considered by the numerical experiment and it cannot be assessed independently of that of the other diabatic processes. For the purpose of climate modelling, an error of 0.05 K day-’ per scale height in the vertical profile of the radiative cooling (i.e. 1 K per scale height over a period of 20 days, corresponding to the mean radiative response time) has been considered as an acceptable level for systematic errors in radiative calculations (WMO-ICSU 1974). In order to assess the state-of-the-art concerning the calculation of the radiation transfer in climate models, and the effects of errors in these radiation calculations upon the generated climate, the WMO-ICSU Joint Scientific Committee, the U.S. Department of Energy, and the IAMAP Radiation Commission have recently launched a programme for the intercomparison of radiation codes used in climate models (given the acronym ICRCCM). The adopted three-step strategy includes: (i) comparison of radiation codes in ‘stand alone’ mode with each other
69 1
692 J.-J. MORCRETTE and Y. FOUQUART
and reference calculations on the basis of a small number of defined atmospheric profiles, to provide an ‘absolute error calibration’; (ii) the intercomparison of global fields of radiative fluxes and parameters generated instantaneously by radiation codes acting on a field of atmospheric profiles from a selected FGGE data set, to get a ‘relative error calibration’ on a statistical basis; (iii) some sensitivity tests, using different radiation codes in the same GCM to assess the evolution of radiative fields as the integration proceeds, and the sensitivity of climate simulations to different radiation codes. This paper is a contribution to the first part of the ICRCCM programme: another paper (Morcrette and Geleyn 1985) deals with the other aspects. In this paper, we discuss some systematic errors linked to the approximations that one commonly uses to save computational time when designing a longwave radiation code suitable for use in large- scale models of the atmosphere. In the following section, we present a detailed narrow band model of the longwave radiation transfer in a clear atmosphere. Then, different approximations are successively introduced in degraded versions of the model to test the impact of the simplifying assumptions both on radiative fluxes and the resultant cooling rate profiles calculated in the standard atmospheres of McClatchey et al. (1972). Section 3 is concerned with integration over the height coordinate. The line profile and absorption regimes are studied in section 4. Integration over wavenumber is considered in section 5. In a forthcoming paper we hope to describe a new parametrization of the longwave radiation transfer suitable for GCMs, based on the conclusions of the study reported herein.
Though uncertainties on the radiative properties of clouds are known to give rise to errors in computed radiation fields that can be much larger than those related to intrinsic deficiencies in the treatment of molecular absorption, the results presented herein concern only the longwave radiation transfer in a clear-sky atmosphere as temperature and humidity are the only two parameters relevant to radiation calculations that are predicted realistically by current GCMs. The effect of cloudiness on radiation in GCMs cannot be analysed independently of the cloud generation schemes and will not be discussed here. Variations in surface emissivity and/or in the aerosol load of the atmosphere can induce modifications in the longwave radiation transfer, but these parameters are presently not interactive with radiation in the actual GCMs, and are used only for tuning the models. Therefore it is essential, as a first step in a process aimed at understanding the cause of systematic errors in radiation calculations, and their effects on the climate generated by a GCM, to study the impact of the approximations on the radiative fluxes calculated for clear-sky conditions in order to be able to analyse clearly the compensating mechanisms introduced by cloudiness on the radiative fluxes.
2. THE NARROW BAND MODEL OF THE LONGWAVE RADIATION TRANSFER
A detailed model of the longwave radiation transfer was developed to be used for accurate computations of the radiative budget of the atmosphere and to serve as reference for more parametrized schemes such as those suitable for radiative computations in GCMs. This model is fully documented in Morcrette (1984); only its principal features are described here.
We have adopted the approach originally developed by Rodgers and Walshaw (1966), i.e. the entire longwave spectrum is divided into a number of spectral intervals (365 in the most detailed version of the model) over which spectral fluxes are evaluated with the help of statistical band models for the transmission functions using the Curtis- Godson approximation to deal with the temperature and pressure dependence of absorp- tion along the optical paths. Over a given spectral interval, the upward and downward
ERRORS IN RADIATION TRANSFER CALCULATIONS 693
fluxes are written as
dT F + ( z ) = {nB(s) - nB(O)}t(z, 0; r ) + n B ( 2 ) - JOZ ng(2f)z(2’) t ( 2 , 2 ’ ; r )dz’
J \ ’
d T F - ( z ) = {nB(Z) - n B ( w ) } t (Z , z ; r ) - n B ( z ) - jz’ n$(z’) &z‘ ) t ( z , z ‘ ; r ) d z ’
where nB is the frequency-integrated Planck function (in units of flux: Wm-2), Z the height of the upper limit of the atmosphere, s and 0 respectively refer to the surface and to the air just above. In ( l ) , t ( z , z ’ ; r ) is the transmission function of flux through a slab between z and z ‘ , and is evaluated as the radiance transmission in a direction 6’ to the vertical such that r = sec6’ is the radiative diffusivity factor (Elsasser 1942). Such an approximation for the integration over the angle is usual in radiative transfer calculations, and tests on the validity of this approximation are not reported here, as they have been presented by numerous authors (Rodgers and Walshaw 1966; Ellingson 1972; Hunt and Mattingly 1976; Chou and Arking 1980; Wang 1983). According to these different studies, the use of the diffusivity factor gives cooling rates within 2% of those obtained by a 4- point Gaussian quadrature.
As will be discussed in section 3 , fluxes and cooling rates are particularly sensitive to integration over the height coordinate. Although the Curtis matrix method is widely accepted as an elegant technique for dealing with the height integration and the tem- perature interpolation, we have preferred a standard method of quadrature which allows full account to be taken of the temperature dependence of the absorption. Thus, we have retained a Gaussian quadrature which easily allows us to test the effect of changing the order of the quadrature. Values of temperature and mass mixing ratios of the different absorbers at the sub-levels in a given layer are calculated from values of temperature and mixing ratios at the model levels bordering the layer using a linear interpolation with scale height for temperature and a linear interpolation with pressure for mixing ratios.
Absorption by H20, CH4 and N 2 0 is dealt with using the statistical model of Goody (1952), while the model of Malkmus (1967) is used for the absorption by C 0 2 and 03. At high altitudes, those transmission models are modified according to Fels (1979) to account for the Voigt profile of the lines of H,O, C 0 2 and 03. Absorption parameters in a form suitable for the statistical band models are calculated ab znitio from the compilation of spectroscopic data of McClatchey et al . (1973) revised by Rothman (1981). The effect of the water vapour absorption continuum is taken into account over the entire spectrum following the analysis of Clough et al . (1980).
As our model is GCM-oriented, it first computes net fluxes at each model level, then evaluates the cooling rate profile from the flux divergence for each layer between two consecutive levels in a finite difference form. This approach is particularly simple to use, conserves energy, directly supplies fluxes at the surface, at the tropopause or at the top of the atmosphere where a radiation budget is required. It also enables the effects of clouds to be eventually incorporated in a relatively simple manner.
This narrow band model was validated through comparisons with the ‘4A’ model of Scott and Chedin (1981), and was shown to give total fluxes within 1% of the results of the line-by-line model (Morcrette 1984).
3. INTEGRATION OVER THE HEIGHT COORDINATE
( a ) Number of layers The degree of refinement in the vertical structure of the atmospheric parameters
694 J.-J. MORCRETTE and Y . FOUQUART
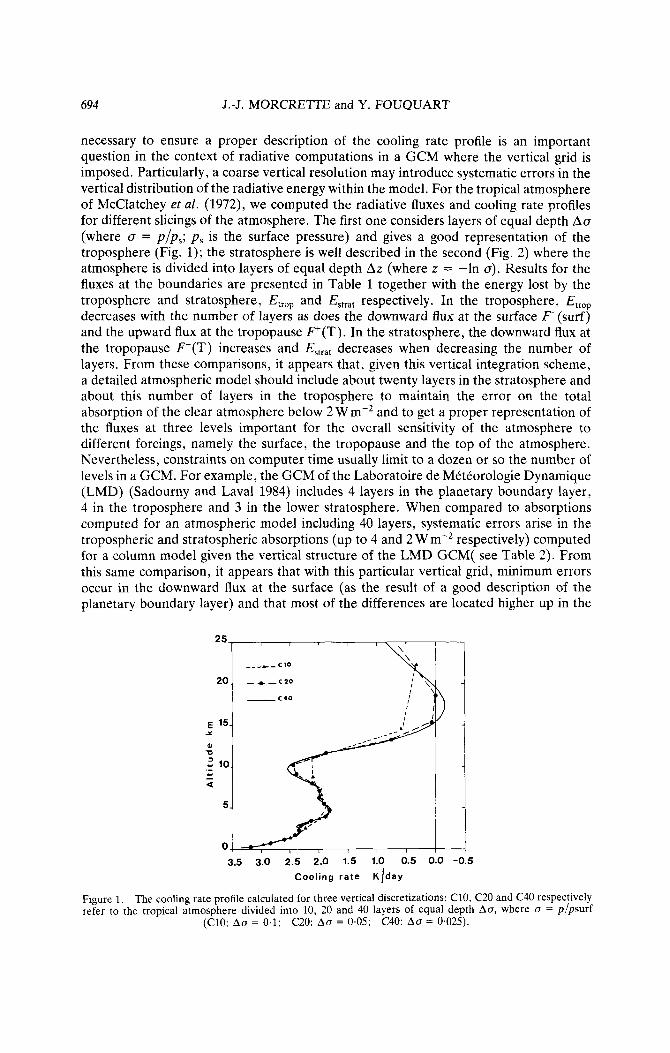
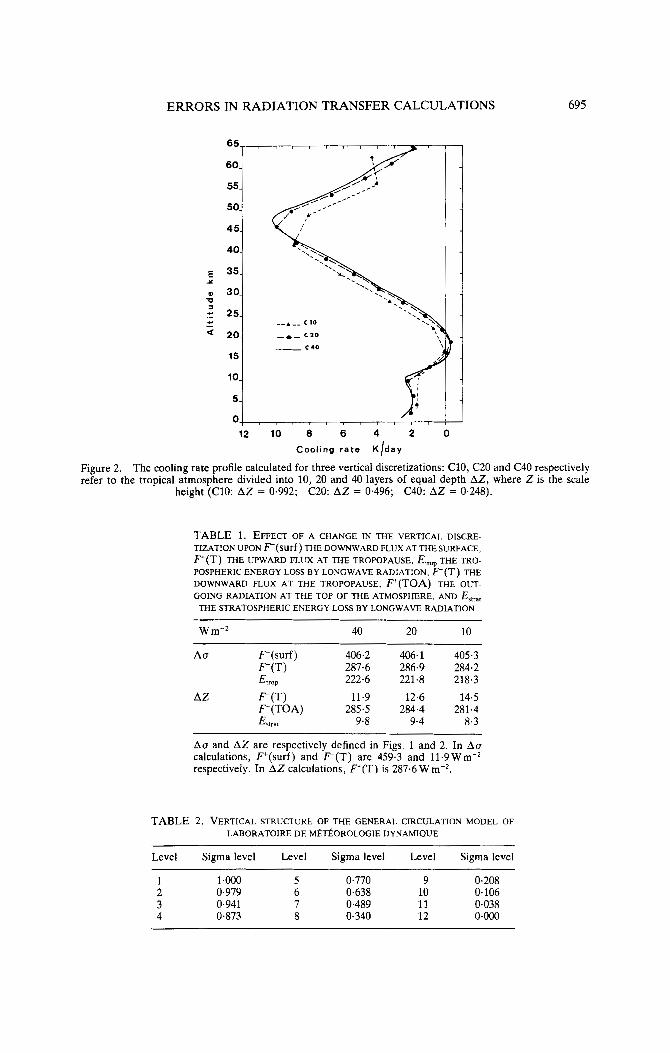
necessary to ensure a proper description of the cooling rate profile is an important question in the context of radiative computations in a GCM where the vertical grid is imposed. Particularly, a coarse vertical resolution may introduce systematic errors in the vertical distribution of the radiative energy within the model. For the tropical atmosphere of McClatchey et al. (1972), we computed the radiative fluxes and cooling rate profiles for different slicings of the atmosphere. The first one considers layers of equal depth A o (where a = p / p , ; p s is the surface pressure) and gives a good representation of the troposphere (Fig. 1); the stratosphere is well described in the second (Fig. 2) where the atmosphere is divided into layers of equal depth Az (where z = -In a). Results for the fluxes at the boundaries are presented in Table 1 together with the energy lost by the troposphere and stratosphere, Etrop and E,,,,, respectively. In the troposphere, Etrop decreases with the number of layers as does the downward flux at the surface F-(surf) and the upward flux at the tropopause Ff(T). In the stratosphere, the downward flux at the tropopause F ( T ) increases and E,,,,, decreases when decreasing the number of layers. From these comparisons, it appears that, given this vertical integration scheme, a detailed atmospheric model should include about twenty layers in the stratosphere and about this number of layers in the troposphere to maintain the error on the total absorption of the clear atmosphere below 2 W mP2 and to get a proper representation of the fluxes at three levels important for the overall sensitivity of the atmosphere to different forcings, namely the surface, the tropopause and the top of the atmosphere. Nevertheless, constraints on computer time usually limit to a dozen or so the number of levels in a GCM. For example, the GCM of the Laboratoire de MCteorologie Dynamique (LMD) (Sadourny and Lava1 1984) includes 4 layers in the planetary boundary layer, 4 in the troposphere and 3 in the lower stratosphere. When compared to absorptions computed for an atmospheric model including 40 layers, systematic errors arise in the tropospheric and stratospheric absorptions (up to 4 and 2 W rnS2 respectively) computed for a column model given the vertical structure of the LMD GCM( see Table 2). From this same comparison, it appears that with this particular vertical grid, minimum errors occur in the downward flux at the surface (as the result of a good description of the planetary boundary layer) and that most of the differences are located higher up in the
0 u 3.5 3.0 2.5 2.0 1.5 1.0 0.5 0.0 -0.5
Cooling r a t e K f d a y
Figure 1. The cooling rate profile calculated for three vertical discretizations: C10, C20 and C40 respectively refer to the tropical atmosphere divided into 10, 20 and 40 layers of equal depth Au, where u = p/psurf
(C10: A U = 0.1; C20: A U = 0.05; C40: AU = 0.025).
ERRORS IN RADIATION TRANSFER CALCULATIONS 695
1 2 1 0 8 6 4 2 0 Cooling r a t e K l d a y
Figure 2. The cooling rate profile calculated for three vertical discretizations: C10, C20 and C40 respectively refer to the tropical atmosphere divided into 10, 20 and 40 layers of equal depth AZ, where Z is the scale
height (C10: AZ = 0.992; C20: AZ = 0.496; C40: AZ = 0.248).
TABLE 1. EFFECT OF A CHANGE IN THE VERTICAL DISCRE- TIZATION UPON F ( su r f ) THE DOWNWARD FLUX AT THE SURFACE, F ( T ) THE UPWARD FLUX AT THE TROPOPAUSE, Elrop THE TRO- POSPHERIC ENERGY LOSS BY LONGWAVE RADIATION, F ( T ) THE DOWNWARD FLUX AT THE TROPOPAUSE, F ( T 0 A ) THE. OUT- GOING RADIATION AT THE TOP OF THE ATMOSPHERE, AND &,,,
THE STRATOSPHERIC ENERGY LOSS BY LONGWAVE RADIATION
Wm-2 40 20 10
A o F (surf) 406.2 406.1 405.3 F+m 287.6 286.9 284.2 Emp 222.6 221.8 218.3
AZ F ( T ) 11.9 12.6 14.5 F+(TOA) 285.5 284.4 281.4 ESl,,, 9.8 9.4 8.3
~
A o and AZ are respectively defined in Figs. 1 and 2. In A o calculations, F+(surf) and F ( T ) are 459.3 and 11.9Wm-2 respectively. In AZ calculations, F ( T ) is 287.6 W m-2.
TABLE 2. VERTICAL STRUCTURE OF THE GENERAL CIRCULATION MODEL OF LABORATOIRE DE M e ~ O R O L O G I E DYNAMIQUE
Level Sigma level Level Sigma level Level Sigma level
1 1.000 5 0.770 9 0.208 2 0.979 6 0.638 10 0.106 3 0.941 7 0.489 11 0-038 4 0.873 8 0.340 12 0.000
J.-J. MORCRE'ITE and Y. FOUQUART
atmosphere (-3.3 W m-2 in the net flux at the tropopause and -5-3 W m-2 in the outgoing flux at the top of the atmosphere). Therefore, when the number of grid points is limited, their position must be optimized to give the best trade-off between errors in fluxes at the surface, at the tropopause, and at the top of the atmosphere.
As the ultimate goal of this study is to provide sound foundations for a highly parametrized longwave radiation scheme for the LMD GCM, all the results presented in subsequent sections refer to calculations performed using this vertical structure.
( b ) Order of the numerical quadrature Integrals in (1) take into account the radiation exchange between level z and all
other levels but the boundaries. They are evaluated numerically using a standard NG- point Gaussian quadrature (Carnahan et al. 1969) and are written as
where the summation over j is related to the integration over the different layers of the atmospheric model located between z1 and z2 , and the summation over 1 is the Gaussian
TABLE 3. THE HEATING RATES AND FLUXES AT THE BOUNDARIES CALCULATED WITH A VERTICAL INTEGRATION USING EITHER A 8-POINT OR AN %POINT GAUSSIAN QUAD-
RATURE IN EACH MODEL LAYER
HZO + COZ + 0 3 HZO
8 2 8 2
TRO 1 -3.77 -3.76 -3.34 -3.32 2 -3.51 -3.51 -2.99 -2.98 3 -3.47 -3.50 -2.72 -2.73 4 -3.62 -3.67 -2.39 -2.40 5 -3.24 -3.21 -2.18 -2.16
K day-' 6 -2.07 -2.08 -1.88 -1.90 7 -1.85 -1.89 -1.95 -1.99 8 -2.17 -2.19 -2.31 -2.34 9 -0.65 -0-63 -0.63 -0.62
10 -0.29 -0.30 -0.11 -0.10 11 -0.51 -0.50 -0.99 -0.99
W m-' F+ 326.4 328.0 280.2 281.6 F 400.7 400.4 406.2 406.0
SAW 1 2 3 4 5
K day-' 6 7 8 9
10 11
-0.44 -0.44 -0.56 -0.56 -0.80 -0.79 -0.95 -0.95 -1.06 -1.07 -1.19 -1.20 -1.16 -1.16 -0.85 -0.85 -0.61 -0.60 -0.42 -0.43 -0.46 -0.45
-0.35 -0.49 -0.76 -0.94 -1.08 -1-28 -1.21 -0.85 -0.68 -0.92 -1.62
-0.36 -0.49 -0.75 -0.93 -1.09 - 1.29 -1.23 -0.85 -0.67 -0.91 -1.63
W m-' F+ 219.9 220.3 195.8 196.2 F 135.3 135.2 171.6 171.6
F is the outgoing flux at the top of the atmosphere, F is the downward flux at the surface
ERRORS IN RADIATION TRANSFER CALCULATIONS 697
quadrature (2) is the ordinate connected with the Ith root and wI is the corresponding weight).
Cooling rates and fluxes at the boundaries (Ft is the outgoing flux at the top, F- is the downward flux at the surface) are presented in Table 3 for the tropical and subarctic winter atmospheres (hereafter TRO and SAW) of McClatchey et al. (1972). Quantities are computed using either the 8-point or the 2-point formula. Computations were also carried out using the 32-point formula but gave negligible differences from the results obtained with the 8-point formula. Differences between 8-point and 2-point calculations are lower than 0-05Kday-' for the cooling rate in any layer, 1.6WmP2 for F+, the outgoing radiation, and 0.3Wm-2 for F, the downward radiation at the surface.
(c ) Contribution of the adjacent layers Wu (1980) has clearly demonstrated the importance of a careful treatment of the
layers adjacent to the level where the net flux is evaluated. In spectral regions where a strong absorption predominates (most of the longwave spectrum except the 8-13 ym window), the absorption lines are saturated for very short optical paths and the energy is exchanged over very short distances. For a given layer, the usual overall cooling is the result of the imbalance between the intense internal cooling of the layer and the almost as intense heating from the adjacent layers. In order to fulfill the consequent requirement of a precise treatment of the effect of the nearby layers, Rodgers and Walshaw (1966), Katayama (1972) and Fels and Schwarzkopf (1975) have introduced various refinements in their radiative schemes. In Table 4, we compare cooling rates, Ft and F - , for three different ways of accounting for nearby layers: A uses a 2-point quadrature for all the layers, B uses a 2-point quadrature for the adjacent layers and the trapezoidal rule for the distant layers, C uses the trapezoidal rule for all the layers. Important errors arise in C as the rapid variation of the transmission function within the adjacent layers is not taken into account, the larger the error in the cooling rate profile, the stronger the absorption. B and A results are within 0405Kday-' except for layer 8 located near the change of temperature gradient at the tropopause level where the fraction of energy
TABLE 4. THE HEATING RATES AND FLUXES AT THE BOUNDARIES FOR THREE VERTICAL INTEGRATIONS
TRO SAW
A B C A B C
1 -3.36 -3.36 -4.55 -0.36 2 -3.03 -3.01 -3.98 -0.50
-0.76 3 -2.75 4 -2.43 -2.43 -2.82 -0.94
-2.37 -1.11 5 -2.11 -2.11 K day-' 6 -1.89 -1.91 -1.91 -1.27
7 -1.93 -1.96 -1.63 -1.15 -1.69 -0.86 8 -2.18 -2.24
9 -0.55 -0.69 -0.01 -0.65 10 -0.17 -0.15 -0.04 -0.97 11 -0.91 -0.92 -1.03 -1.55
-2.74 -3.41
-0.37 -0.52 -0.76 -0.94 -1.11 -1.27 -1.17 -0.90 -0.64 -0.96 -1.55
-0.25 -0.42 - 1.04 -1.24 -1.36 -1.38 -0.86 -0.59 -0.62 -0.93 -1.52
W m-* F+ 277.6 281.2 281.2 195.2 196.1 196.1 F 405.5 405.2 403.7 171.5 171.4 171.5
A uses a 2-point Gaussian quadrature for all layers; B uses a 2-point Gaussian quadrature for the adjacent layers, and the trapezoidal rule for the other layers; C uses the trapezoidal rule for all layers. F+ is the outgoing flux at the top of the atmosphere, F is the downward flux at the surface
698 J.-J. MORCRETTE and Y. FOUQUART
exchanged with distant layers is increasing. Moreover, F ( B ) is larger than F ( A ) , F ( B ) is smaller than F ( A ) , indicating a decrease of atmospheric absorption.
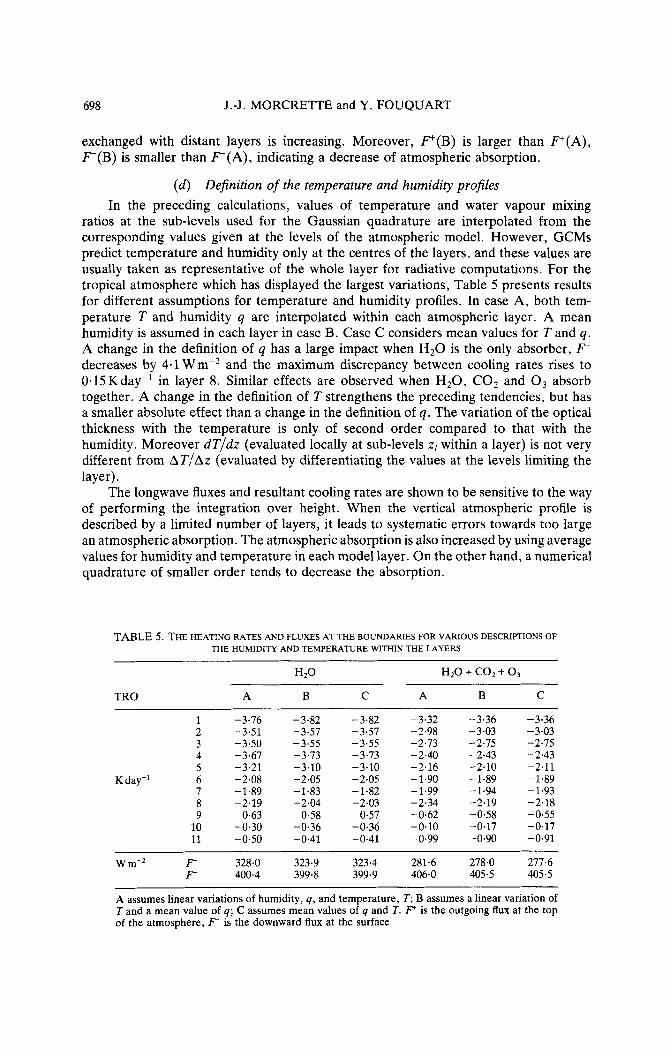
( d ) Definition of the temperature and humidity profiles In the preceding calculations, values of temperature and water vapour mixing
ratios at the sub-levels used for the Gaussian quadrature are interpolated from the corresponding values given at the levels of the atmospheric model. However, GCMs predict temperature and humidity only at the centres of the layers, and these values are usually taken as representative of the whole layer for radiative computations. For the tropical atmosphere which has displayed the largest variations, Table 5 presents results for different assumptions for temperature and humidity profiles. In case A, both tem- perature T and humidity q are interpolated within each atmospheric layer. A mean humidity is assumed in each layer in case B. Case C considers mean values for T and q . A change in the definition of q has a large impact when H 2 0 is the only absorber, F decreases by 4.1 W m-2 and the maximum discrepancy between cooling rates rises to 0.15Kday-' in layer 8. Similar effects are observed when H 2 0 , C 0 2 and O3 absorb together. A change in the definition of T strengthens the preceding tendencies, but has a smaller absolute effect than a change in the definition of q. The variation of the optical thickness with the temperature is only of second order compared to that with the humidity. Moreover dT/d.z (evaluated locally at sub-levels zI within a layer) is not very different from AT/A.z (evaluated by differentiating the values at the levels limiting the layer).
The longwave fluxes and resultant cooling rates are shown to be sensitive to the way of performing the integration over height. When the vertical atmospheric profile is described by a limited number of layers, it leads to systematic errors towards too large an atmospheric absorption. The atmospheric absorption is also increased by using average values for humidity and temperature in each model layer. On the other hand, a numerical quadrature of smaller order tends to decrease the absorption.
TABLE 5. THE HEATING RATES AND FLUXES AT THE BOUNDARIES FOR VARIOUS DESCRIPTIONS OF THE HUMIDITY AND TEMPERATURE WITHIN THE LAYERS
H20 H20 + CO2 + 0 9
TRO A B C A B C
1 2 3 4 5
K day-' 6 7 8 9
10 11
-3.76 -3.51 -3.50 -3.67 -3.21 -2.08 -1.89 -2.19 -0.63 -0.30 -0.50
-3.82 -3.57 -3.55 -3.73 -3.10 -2.05 -1.83 -2.04 -0.58 -0.36 -0.41
-3.82 -3.32 -3.57 -2.98 -3.55 -2.73 -3.73 -2.40 -3.10 -2.16 -2.05 -1.90 -1.82 -1.99 -2.03 -2.34 -0.57 -0.62 -0.36 -0.10 -0.41 -0.99
-3.36 -3.03 -2.75 -2.43 -2.10 -1.89 -1.94 -2.19 -0.58 -0.17 -0.90
-3.36 -3.03 -2.75 -2.43 -2.11 -1.89 -1.93 -2.18 -0.55 -0.17 -0.91
w m-' F+ 328.0 323.9 323.4 281.6 278.0 277.6 F 400.4 399.8 399.9 406.0 405.5 405.5
__ A assumes linear variations of humidity, q , and temperature, T; B assumes a linear variation of T and a mean value of q; C assumes mean values of q and T. I" is the outgoing flux at the top of the atmosphere, F is the downward flux at the surface
ERRORS IN RADIATION TRANSFER CALCULATIONS 699
4. LINE PROFILE AND ABSORPTION REGIME
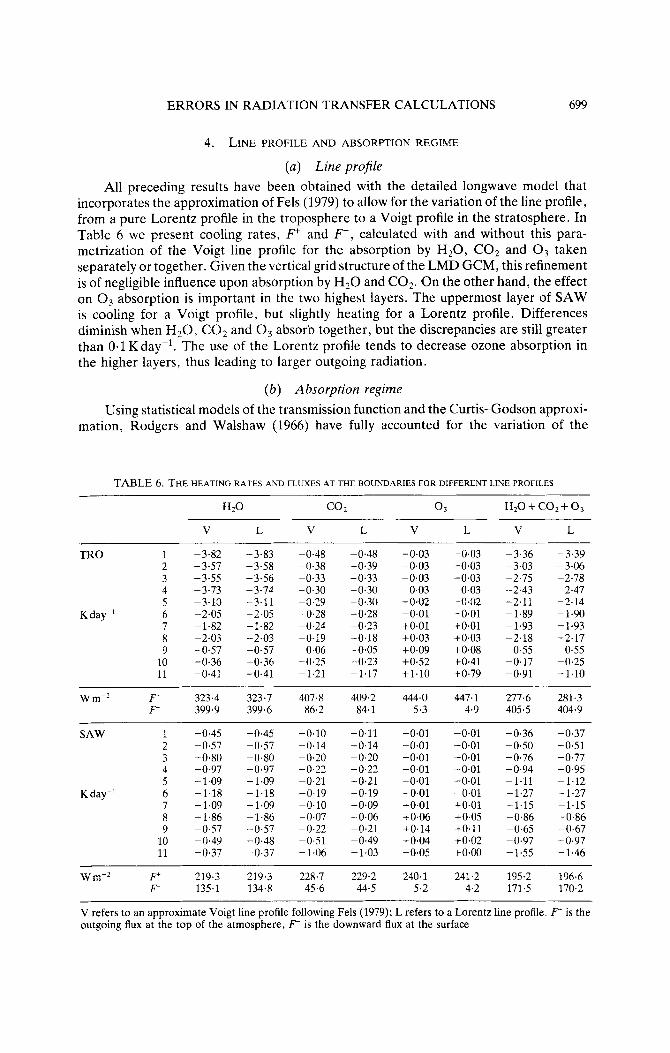
(a) Line profile All preceding results have been obtained with the detailed longwave model that
incorporates the approximation of Fels (1979) to allow for the variation of the line profile, from a pure Lorentz profile in the troposphere to a Voigt profile in the stratosphere. In Table 6 we present cooling rates, F+ and F- , calculated with and without this para- metrization of the Voigt line profile for the absorption by HzO, COz and O3 taken separately or together. Given the vertical grid structure of the LMD GCM, this refinement is of negligible influence upon absorption by H20 and COz. On the other hand, the effect on O3 absorption is important in the two highest layers. The uppermost layer of SAW is cooling for a Voigt profile, but slightly heating for a Lorentz profile. Differences diminish when H20, C 0 2 and O3 absorb together, but the discrepancies are still greater than 0.1 K day-'. The use of the Lorentz profile tends to decrease ozone absorption in the higher layers, thus leading to larger outgoing radiation.
(6) Absorption regime Using statistical models of the transmission function and the Curtis-Godson approxi-
mation, Rodgers and Walshaw (1966) have fully accounted for the variation of the
TABLE 6. THE HEATING RATES AND FI-UXES AT THE BOUNDARIES FOR DIFFERENT LINE PROFILES
H2O 2 0 3 HZO + C02 + 0,
V L V L V L V L ~~~
TRO 1 -3.82 -3.83 -0.48 -0.48 -0.03 -0.03 -3.36 -3.39 2 -3.57 -3.58 -0.38 -0.39 -0.03 -0.03 -3.03 -3.06 3 -3.55 -3.56 -0.33 -0.33 -0.03 -0.03 -2.75 -2.78 4 -3.73 -3.74 -0.30 -0.30 -0.03 -0.03 -2.43 -2.47 5 -3.10 -3.11 -0.29 -0.30 -0.02 -0-02 -2.11 -2.14
K day-' 6 -2.05 -2.05 -0.28 -0.28 -0.01 -0.01 -1.89 -1.90 7 -1.82 -1.82 -0.24 -0.23 +O.O1 +O.O1 -1.93 -1.93 8 -2.03 -2.03 -0.19 -0.18 +0.03 +0.03 -2.18 -2.17 9 -0.57 -0.57 -0.06 -0.05 +0.09 +O.O8 -0.55 -0.55
10 -0.36 -0.36 -0.25 -0.23 +0.52 +0.41 -0.17 -0.25 11 -0.41 -0.41 -1.21 -1.17 +1.10 +0.79 -0.91 -1.10
w rn-' F+ 323.4 323.7 407.8 409.2 444.0 447'1 277.6 281.3 4.9 405.5 404.9 F 399.9 399.6 86.2 84.1 5.3
SAW 1 -0.45 -0.45 -0.10 -0.11 -0.01 -0.01 -0.36 -0.37 2 -0.57 -0.57 -0.14 -0.14 -0.01 -0.01 -0.50 -0.51 3 -0.80 -0.80 -0.20 -0.20 -0.01 -0.01 -0.76 -0.77 4 -0.97 -0.97 -0.22 -0.22 -0.01 -0.01 -0.94 -0.95 5 -1.09 -1.09 -0.21 -0.21 -0.01 -0.01 -1.11 -1.12
K day-' 6 -1.18 -1.18 -0.19 -0.19 -0.01 -0.01 -1.27 -1.27 7 -1.09 -1.09 -0.10 -0.09 +0.01 +O.O1 -1.15 -1.15 8 -1.86 -1.86 -0.07 -0.06 +0.06 +0.05 -0.86 -0.86 9 -0.57 -0.57 -0.22 -0.21 +0.14 +O.ll -0.65 -0.67
10 -0.49 -0.48 -0.51 -0.49 +0.04 +O.02 -0.97 -0.97 11 -0.37 -0.37 -1.06 -1.03 -0.05 +0.00 -1.55 -1.46
W m-' F 219.3 219.3 228.7 229.2 240.1 241.2 195-2 196.6 4.2 171.5 170.2 F 135.1 134.8 45.6 44.5 5.2
v refers to an approximate Voigt line profile following Fels (1979); L refers to a Lorentz line profile. F+ is the outgoing flux at the top of the atmosphere, F is the downward flux at the surface
700 J.-J. MORCRETTE and Y. FOUQUART
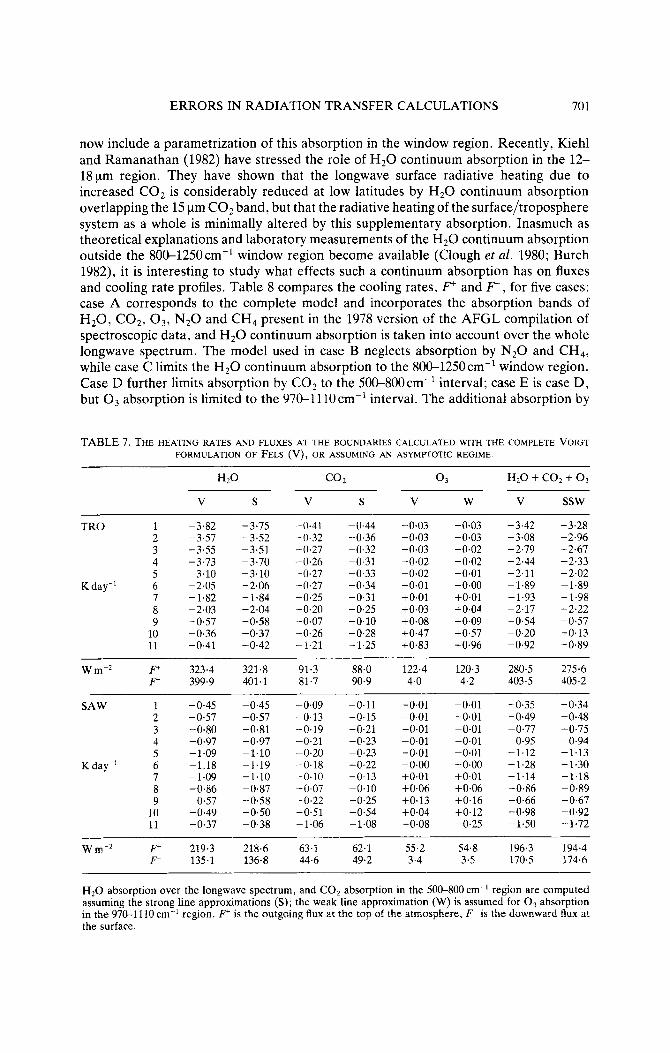
absorption coefficients with temperature and pressure. Previously, the temperature effect on the absorption was neglected and longwave radiation transfer was usually evaluated using radiation charts based upon emissivity functions. All those radiation charts assume a strong line approximation (SLA) for absorption by H 2 0 , i.e. line centres are saturated, line wings are the only contributors to the energy exchange. This assumption allows the emissivity function to depend on one parameter only, namely the pressure-scaled amount of water vapour. According to Rodgers (1967), Coakley and Briegleb (1978), Wu (1980), the SLA introduces only small errors on the profile of cooling by the water vapour absorption. However, Garand (1983) points out that this result is due to compensating errors in upward and downward fluxes. These errors are linked to the spectral intervals where a weaker absorption by water vapour (between 550 and 1350cm-', and beyond 1950cm-') is overestimated by the SLA. In Table 7 we compare cooling rates, F+ and F- , computed with the SLA to those resulting from a full calculation. The differences are lower than 0.07 K day-' for cooling rates and lower than 1.6 W rn-, for flux densities. A similar comparison is also shown in Table 7 for CO, absorption in the 50&800cm-' spectral range, that displays a poorer agreement than for H 2 0 absorption. The SLA overestimates the absorption at all levels thus leading to larger cooling rates (up to 0.06 K day-'), larger F (by 10%) and smaller Ft . These systematic differences decrease when the overlap by H20 is taken into account. The increased absorption enhances the contribution of the adjacent layers where the energy is mainly exchanged through the line wings, i.e. following a regime closer to the SLA.
Given the vertical distribution of ozone and the low pressure at the levels where the maximum of its absorption is located, the weak line approximation (WLA), which considers the energy exchange to occur through the line cores, is sometimes adopted for dealing with the ozone absorption in parametrized schemes (Liou and Ou 1981). Table 7 presents cooling rates, F+ and F- , in the 97&1110cm-' spectral interval resulting from a full calculation and computed assuming the WLA. This assumption leads to an overestimation of the absorption, and it gives too large a heating in the two highest layers of the tropical atmosphere, and too large a cooling, by 0*17Kday-', in the uppermost layer of the subarctic atmosphere. Unlike the 15 pm band of CO,, the 9.6 pm band of O3 is not overlapped by any band of another absorber, so that the differences displayed when ozone is the only absorber remain when the absorptions by H20, C 0 2 and O3 are taken into account simultaneously. In this latter case, Table 7 shows an overestimation of the total absorption when using the SLA for absorption by H20 and C02, and the WLA for the absorption by 03. This translates into too large F- (0.4% for TRO; 2.4% for SAW) and too small Ff (1.7% for TRO; 1% for SAW).
5 . SPECTRAL INTEGRATION
The detailed model presented in section 2 accounts for the absorption by the main bands of H20, COz, 03, N 2 0 and CH4 with the help of statistical models of the transmission function the parameters of which are calculated over narrow spectral intervals ( 5 to 20cm-') in order to take into account the maximum of details of the absorption bands. In order to save computer time, potential simplifications are possible in two ways: either by limiting the absorption bands to the most important, or by decreasing the number of spectral intervals.
(a) Number of absorption bands Water vapour continuum absorption has long been recognized as an important
contributor to the energy budget of the tropical atmosphere, and most radiation schemes
ERRORS IN RADIATION TRANSFER CALCULATIONS 701
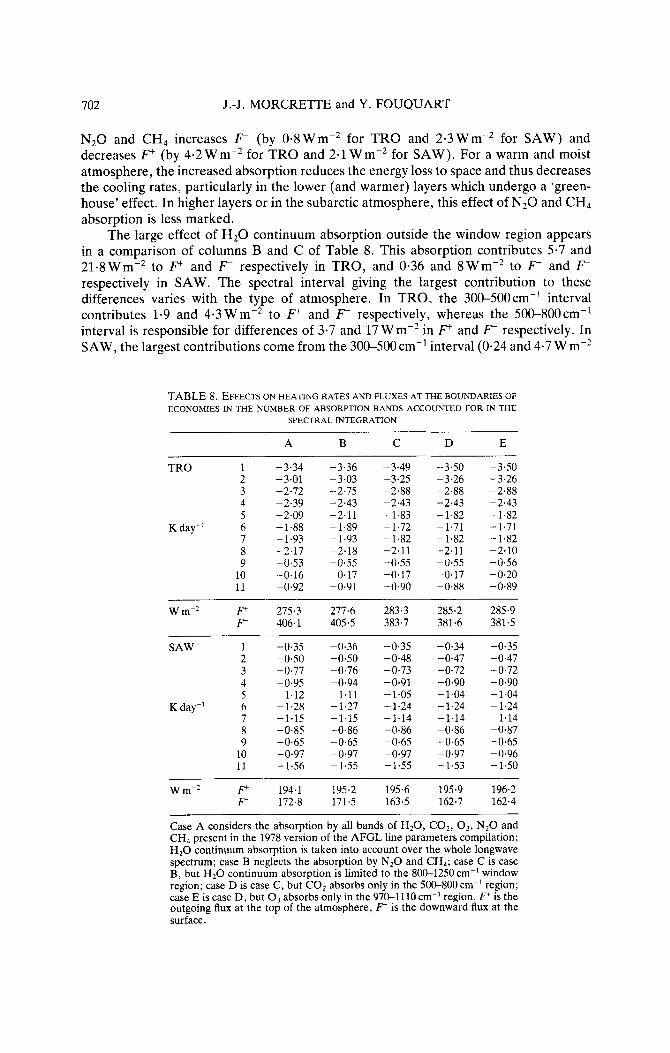
now include a parametrization of this absorption in the window region. Recently, Kiehl and Ramanathan (1982) have stressed the role of H20 continuum absorption in the 12- 18pm region. They have shown that the longwave surface radiative heating due to increased C 0 2 is considerably reduced at low latitudes by H 2 0 continuum absorption overlapping the 15 pm C 0 2 band, but that the radiative heating of the surface/troposphere system as a whole is minimally altered by this supplementary absorption. Inasmuch as theoretical explanations and laboratory measurements of the H20 continuum absorption outside the 800-1250cm-' window region become available (Clough et al. 1980; Burch 1982), it is interesting to study what effects such a continuum absorption has on fluxes and cooling rate profiles. Table 8 compares the cooling rates, F+ and F , for five cases: case A corresponds to the complete model and incorporates the absorption bands of H20, C02 , 03, N 2 0 and CH4 present in the 1978 version of the AFGL compilation of spectroscopic data, and H 2 0 continuum absorption is taken into account over the whole longwave spectrum. The model used in case B neglects absorption by N 2 0 and CH4, while case C limits the H 2 0 continuum absorption to the 800-1250 cm-' window region. Case D further limits absorption by C 0 2 to the 500-800cm-' interval; case E is case D, but O3 absorption is limited to the 970-1110cm-' interval. The additionai absorption by
TABLE 7. THE HEATING RATES AND FLUXES AT THE BOUNDARIES CALCULATED WITH THE COMPLETE VOIGT FORMULATION OF FELS (V), OR ASSUMING AN ASYMPTOTIC REGIME.
TRO 1 2 3 4 5
K day-' 6 7 8 9
10 11
-3.82 -3.57 -3.55 -3.73 -3.10 -2.05 -1.82 -2.03 -0.57 -0.36 -0.41
-3.75 -3.52 -3.51 -3.70 -3.10 -2.06 -1.84 -2.04 -0.58 -0.37 -0.42
-0.41 -0.32 -0.27 -0.26 -0.27 -0.27 - 0.25 -0.20 -0.07 -0.26 - 1.21
-0-44 -0.36 -0.32 -0-31 -0.33 -0.34 -0.31 -0.25 -0.10 -0.28 -1.25
-0.03 -0.03 -0.03 -0.02 -0.02 -0.01 +0.01 +0.03 +0.08 +0.47 +0.83
-0-03 -0.03 -0.02 -0.02 -0.01 -0.00 +0.01 +0.04 +0.09 +0.57 +0.96
-3.42 -3.08 -2.79 -2.44 -2.11 -1.89 - 1.93 -2.17 -0.54 -0.20 -0.92
-3.28 -2.96 -2.67 -2.33 -2.02 -1.89 -1.98 -2.22 -0.57 -0.13 -0.89
~~
F+ 323.4 321.8 91.3 88.0 122.4 120.3 280.5 275.6 403.5 405.2 F 399.9 401.1 81.7 90.9 4.0 4.2
w m-*
SAW 1 -0.45 -0.45 -0.09 -0.11 -0.01 -0.01 -0.35 -0.34 2 -0.57 -0.57 -0.13 -0.15 -0.01 -0.01 -0.49 -0.48 3 -0.80 -0.81 -0.19 -0.21 -0.01 -0.01 -0.77 -0.75 4 -0.97 -0.97 -0.21 -0.23 -0.01 -0.01 -0.95 -0.94 5 -1.09 -1.10 -0.20 -0.23 -0.01 -0.01 -1.12 -1.13
K day-' 6 -1.18 -1.19 -0.18 -0.22 -0.00 -0.00 -1.28 -1.30 7 -1.09 -1.10 -0.10 -0.13 +0,01 +0.01 -1.14 -1.18 8 -0.86 -0.87 -0.07 -0.10 +0.06 +0.06 -0.86 -0.89 9 -0.57 -0.58 -0.22 -0.25 +0.13 +0.16 -0.66 -0.67
10 -0.49 -0.50 -0.51 -0.54 +0.04 +0.12 -0.98 -0.92 11 -0.37 -0.38 -1.06 -1.08 -0.08 -0.25 -1.50 -1.72
w m-* F+ 219.3 218.6 63.1 62.1 55.2 54.8 196.3 194-4 F 135.1 136.8 44.6 49.2 3.4 3.5 170.5 174.6
H 2 0 absorption over the longwave spectrum, and C 0 2 absorption in the 500-800 cm-' region are computed assuming the strong line approximations (S); the weak line approximation (W) is assumed for O3 absorption in the 970-1110 cm-' region. Ft IS the outgoing flux at the top of the atmosphere, F is the downward flux at the surface.
702 J.-J. MORCRETTE and Y. FOUQUART
N 2 0 and CH4 increases F (by 043Wm-2 for TRO and 2 ~ 3 W m - ~ for SAW) and decreases F+ (by 4.2 W mP2 for TRO and 2.1 W m-2 for SAW). For a warm and moist atmosphere, the increased absorption reduces the energy loss to space and thus decreases the cooling rates, particularly in the lower (and warmer) layers which undergo a 'green- house' effect. In higher layers or in the subarctic atmosphere, this effect of N 2 0 and CH4 absorption is less marked.
The large effect of H20 continuum absorption outside the window region appears in a comparison of columns B and C of Table 8. This absorption contributes 5.7 and 21-8Wm-2 to Ft and F respectively in TRO, and 0.36 and 8Wm-* to F+ and F- respectively in SAW. The spectral interval giving the largest contribution to these differences varies with the type of atmosphere. In TRO, the 300-500cm-' interval contributes 1.9 and 4.3 Wm-2 to FY and F respectively, whereas the 500-800cm-' interval is responsible for differences of 3.7 and 17 W m-2 in Ft and F- respectively. In SAW, the largest contributions come from the 300-500 cm-' interval (0.24 and 4.7 W m-2
TABLE 8. EFFECTS ON HEATING RATES AND FLUXES AT THE BOUNDARIES OF ECONOMIES IN THE NUMBER OF ABSORPTION BANDS ACCOUNTED FOR IN THE
SPECTRAL INTEGRATION
A B C D E
TRO 1 -3.34 -3.36 -3.49 -3.50 -3.50 2 -3.01 -3.03 -3.25 -3.26 -3.26 3 -2.72 -2.75 -2.88 -2.88 -2.88 4 -2.39 -2.43 -2.43 -2.43 -2.43 5 -2.09 -2.11 -1.83 -1.82 -1.82
K day-' 6 -1.88 -1.89 -1.72 -1.71 -1.71 7 -1.93 -1.93 -1.82 -1.82 -1.82 8 -2.17 -2.18 -2.11 -2.11 -2.10 9 -0.53 -0.55 -0.55 -0.55 -0.56
10 -0.16 -0.17 -0.17 -0.17 -0.20 11 -0.92 -0.91 -0.90 -0.88 -0.89
W m-' F+ 275.3 277.6 283.3 285.2 285.9 F 406.1 405.5 383.7 381.6 381.5
SAW 1 -0.35 -0.36 -0.35 -0.34 -0.35 2 -0.50 -0.50 -0.48 -0.47 -0.47 3 -0.77 -0.76 -0.73 -0.72 -0.72 4 -0.95 -0.94 -0.91 -0.90 -0.90 5 -1.12 -1.11 -1.05 -1.04 -1.04
K day-' 6 -1.28 -1.27 -1.24 -1.24 -1.24 7 -1.15 -1.15 -1.14 -1.14 -1.14 8 -0.85 -0.86 -0.86 -0.86 -0.87 9 -0.65 -0.65 -0.65 -0.65 -0.65
10 -0.97 -0.97 -0.97 -0.97 -0.96 11 -1.56 -1.55 -1.55 -1.53 -1.50
W m-* F+ 194.1 195.2 195.6 195.9 196.2 F 172.8 171.5 163.5 162.7 162.4
Case A considers the absorption by all bands of HzO, COz, 03, NzO and CHI present in the 1978 version of the AFGL line parameters compilation; H 2 0 continuum absorption is taken into account over the whole longwave spectrum; case B neglects the absorption by N 2 0 and CH,; case C is case B, but H 2 0 continuum absorption is limited to the 800-1250 cm-' window region; case D is case C , but C 0 2 absorbs only in the 500-800 cm-l region; case E is case D, but O3 absorbs only in the 97F1110 cm-' region. F+ is the outgoing flux at the top of the atmosphere, F is the downward flux at the surface.
ERRORS IN RADIATION TRANSFER CALCULATIONS 703
on Fe and F respectively, compared to 0.12 and 3.3 W m-2 on Ff and F- from the 500- 800 cm-' interval). The effect of H 2 0 continuum absorption in the vibration-rotation band is smaller and almost negligible. In the tropical atmosphere, where transmission functions in the lower layers are saturated, H20 continuum absorption outside the window region cools higher layers and heats lower layers by preventing some energy from escaping to space. In SAW, it slightly cools all layers below 500mb.
The fourth and fifth calculations, which neglect respectively some bands of C 0 2 of smaller importance (weak bands at 9.4 and 10.4 pm, and the 4.3 pm bands located far from the maximum of the blackbody function at atmospheric temperatures), and the 14 pm band of O3 give results similar to neglecting N 2 0 and CH4 absorption: a decrease in F- , an increase in Fe and in the cooling rates of the lower layers of the tropical atmosphere due to the decrease of the overall absorption in the atmosphere.
We also can notice the 'better' agreement between column 1 in Table 8 and column SSW in Table 7, illustrating the role of the compensating errors in the parametrized radiation schemes. A radiation scheme including only absorption by H20, the 15 pm band of C 0 2 , and the 9.6 pm band of 03, with the SLA for H,O and C 0 2 , and the WLA for 03, gives results that are closer to the results of the complete model than any radiation scheme incorporating only one of these different simplifying assumptions. This last remark is not made to advocate the use of such a scheme which could give, in some circumstances, the right answer for the wrong reason, but is likely to fail for all sensitivity experiments where radiation forcings play an important part (variations in the C 0 2 concentration for example). We rather think of this remark as a reminder of the need for checking not only the fluxes and cooling rates, but also their derivatives relative to all their controlling parameters, when developing a parametrized scheme.
( b ) Width of the spectral intervals Hunt and Mattingly (1976) have evaluated the effect on the cooling rates of the
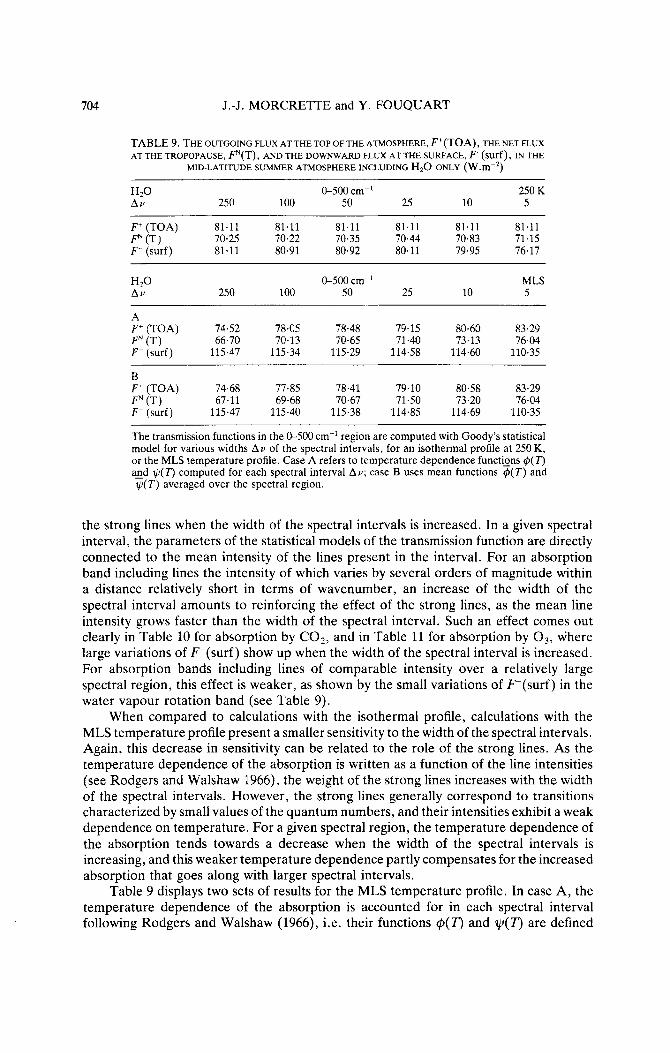
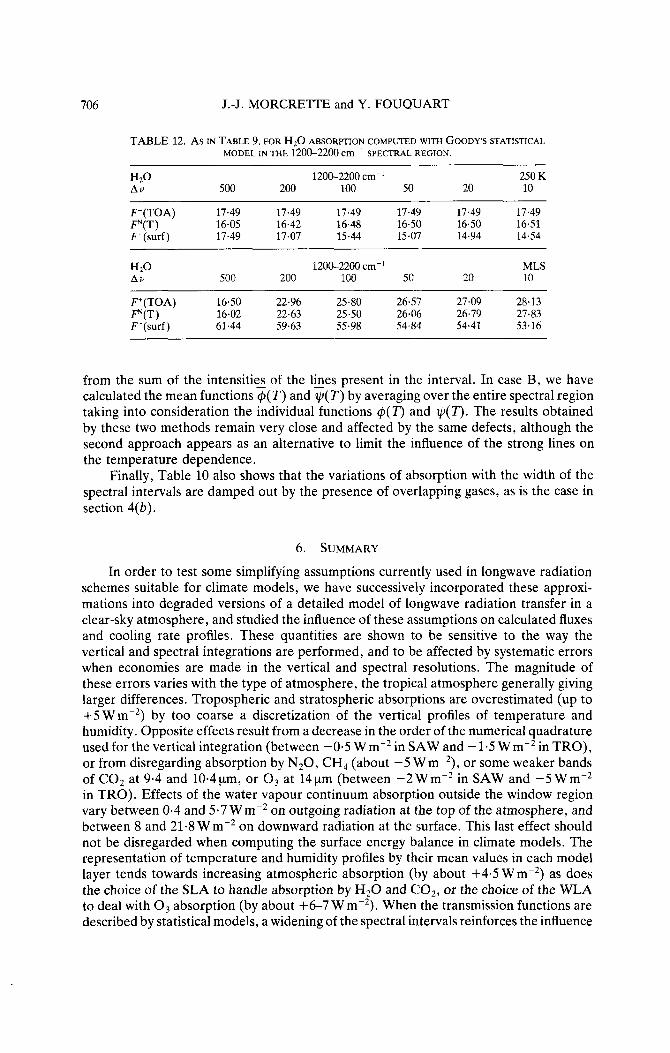
major absorption bands (H20 rotation and vibration-rotation bands, 15 pm C 0 2 band, 9 . 6 p O3 band) of varying the spectral intervals between 50 and 200cm-'. However, for the 15 pm C 0 2 band, Kiehl and Ramanathan (1983) have shown that absorptances calculated with the Malkmus statistical model are in good agreement (better than 10%) with measured absorptances provided that the model be applied to spectral intervals not larger than 10cm-l. In this subsection, we extend this study and show that similar results hold for the major absorption bands. Results are presented in Tables 9 to 12 for four spectral regions, respectively 0-500cm-' in Table 9, 500-800cm-' in Table 10, 970- 1llOcm-' in Table 11, and 1200-2200cm-' in Table 12. The outgoing radiation at the top of the atmosphere F+(TOA), the net flux at the tropopause FN(T), and the downward flux at the surface F-(surf) are calculated for the mid-latitude summer atmosphere of McClatchey et al. (1972) assuming either the original temperature profile (MLS) or an isothermal profile at 250 K. These latter calculations concentrate upon the differences linked to the variation of the width of the spectral intervals, as the former allow us to analyse the influence of the varying width on the temperature dependence of the absorption. Generally speaking, we notice an overestimation of absorption increasing with the width of the spectral intervals, which appears through the increase in F-(TOA), the decrease in FN(T) in the isothermal and MLS calculations, and through the decrease in Ff(T0A) in the MLS calculations. In all calculations, the blackbody functions of ( l ) , over a given spectral region, do not vary with the width of the spectral intervals, so that the variations of the overall absorptivity of the atmospheric column is to be related to variations of the transmission functions, the smaller the transmission, the larger the absorptivity. The behaviour of the absorptivity can be explained by the growing role of
704 J.-J. MORCRETI'E and Y. FOUQUART
TABLE 9. THE OUTGOING FLUX AT THE TOP OF THE ATMOSPHERE, F'(TOA), THE NET FLUX AT THE TROPOPAUSE, FN(T), AND THE DOWNWARD FLUX AT THE SURFACE, F(surf) , IN THE
MID-LATITUDE SUMMER ATMOSPHERE INCLUDING HzO ONLY (W .m-')
H2O 0-500 cm-' 250 K Av 250 100 50 25 10 5
F+ (TOA) 81.11 81.11 81.11 81.11 81.11 81.11 FN (T) 70.25 70.22 70.35 70.44 70.83 71.15
81.11 80.91 80.92 80.11 79.95 76.17 F- (surf)
0-500 cm-' MLS Av 250 100 50 25 10 5 H*O
A F' (TOA) 74.52 78.05 78.48 79.15 80.60 83.29
66.70 70.13 70-65 71.40 73.13 76.04 115.47 115.34 115-29 114.58 114.60 110.35
FN 0 ) F- (surf)
B F' (TOA) 74.68 77.85 78.41 79.10 80.58 83.29
67.11 69.68 70.67 71.50 73.20 76.04 115.47 115.40 115.38 114.85 114.69 110.35
FN (TI F- (surf)
The transmission functions in the 0-500 cm-' region are computed with Goody's statistical model for various widths Av of the spectral intervals, for an isothermal profile at 250 K, or the MLS temperature profile. Case A refers to temperature dependence functkns +(r) a4d V(T) computed for each spectral interval Av; case B uses mean functions @(T) and ~(7') averaged over the spectral region.
the strong lines when the width of the spectral intervals is increased. In a given spectral interval, the parameters of the statistical models of the transmission function are directly connected to the mean intensity of the lines present in the interval. For an absorption band including lines the intensity of which varies by several orders of magnitude within a distance relatively short in terms of wavenumber, an increase of the width of the spectral interval amounts to reinforcing the effect of the strong lines, as the mean line intensity grows faster than the width of the spectral interval. Such an effect comes out clearly in Table 10 for absorption by COz, and in Table 11 for absorption by 03. where large variations of F(surf) show up when the width of the spectral interval is increased. For absorption bands including lines of comparable intensity over a relatively large spectral region, this effect is weaker, as shown by the small variations of F(surf) in the water vapour rotation band (see Table 9).
When compared to calculations with the isothermal profile, calculations with the MLS temperature profile present a smaller sensitivity to the width of the spectral intervals. Again, this decrease in sensitivity can be related to the role of the strong lines. As the temperature dependence of the absorption is written as a function of the line intensities (see Rodgers and Walshaw 1966), the weight of the strong lines increases with the width of the spectral intervals. However, the strong lines generally correspond to transitions characterized by small values of the quantum numbers, and their intensities exhibit a weak dependence on temperature. For a given spectral region, the temperature dependence of the absorption tends towards a decrease when the width of the spectral intervals is increasing, and this weaker temperature dependence partly compensates for the increased absorption that goes along with larger spectral intervals.
Table 9 displays two sets of results for the MLS temperature profile. In case A, the temperature dependence of the absorption is accounted for in each spectral interval following Rodgers and Walshaw (1966), i.e. their functions @(T) and q(T) are defined

ERRORS IN RADIATION TRANSFER CALCULATIONS 705
TABLE 10. AS IN TABLE 9, FOR HI0 ABSORPTION (GOODY'S MODEL) AND COz ABSORPTION (MALKMUS'S MODEL) IN THE 500-800 cm-' SPECTRAL REGION.
H20 500-800 cm-' 250 K Au 300 100 50 25 10 5
F+(TOA) 73.60 73.60 73.60 73.60 73.60 73.60 73.16 73.15 73.16 73.16 73.17 73.19 49.78 44.12 43.65 43.35 42.05 36.90 F-(surf)
co2 500-800 cm-I 250 K Av 300 100 50 25 10 5
FN(T)
F+(TOA) 73.60 73.60 73.60 73.60 73.60 73.60 22.69 41.77 44.76 46.50 4766 48.41 73.51 51.54 44.71 42.31 40.81 40.10
FN(T) F-(surf)
H20 + COZ 500-800 cm-' 250 K Av 300 100 50 25 10 5
F + (TO A) 73.60 73.60 73.60 73.60 73.60 73.60 22.55 41.43 44.41 46.65 47.31 48.07 73.57 69.56 65.21 63.70 62.61 59.95
FN(T) F- (surf )
H20 500-800 cm-' MLS Av 300 100 50 25 10 5
F'(T0A) 110.30 112.92 113.18 113.31 113.72 115.51 110.12 112.74 112.99 113.11 113.53 113.33
F-(surf) 98.95 85.54 84.60 84.01 81.83 71.53 FN(T)
co 2 500-800 cm-' MLS Av 300 100 50 25 10 5
~
F+(TOA) 53.00 81.71 87.36 89.84 91.34 92.72 27.04 6461 72- 11 75.63 77.91 79-99
129.62 95.35 82.16 77.67 75.03 73.62 F"T) F-(surf)
H2O + CO, 500-800 cm-' MLS AV 300 100 50 25 10 5
F+(TOA) 52.66 73.75 78.57 81.14 82.15 83.64 26.52 56.36 63.06 67.02 68.45 70.41
130.19 125.11 117.57 115.23 113.78 109.57 FN(T) F-(surf)
TABLE 11. AS IN TABLE 9, FOR 0 3 ABSORPTION COMPUTED WITH MALKMUS'S STATISTICAL MODEL IN THE 970-1110 Cm-' SPECTRAL REGION
0 3 970-1110 cm- ' 250 K Av 140 70 35 20 10 5
F'(T0A) 14.93 14.93 14.93 14.93 14.93 14.93 9.17 9.15 10.05 10.23 10.33 10.38 7.72 7.73 6.16 5.88 5.73 5.64
FN(T) F-(surf)
0 3 970-1110cm-' MLS Av 140 70 35 20 10 5
F'(T0A) 23.77 23.78 26.37 26.82 27.11 27.27 30-16 30.26 30.94 31.09 31.22 31.27 5.66 5.65 4.74 4.63 4.54 4.49
FN(T) F-(surf )
706 J.-J. MORCRETTE and Y. FOUQUART
TABLE 12. A S IN TABLE 9. FOR H2O ABSORPTION COMPUTED WITH GOODY'S STATISTICAL MODEL IN THE 1200-2200 cm-' SPECTRAL REGION.
H20 1200-2200 cm-' 250 K Av 500 200 100 50 20 10
F+(TOA) 17.49 17.49 17.49 17.49 17.49 17.49 16.05 16.42 16.48 16.50 16.50 16.51 17.49 17.07 15.44 15.07 14.94 14.54
FN(T) F-(surf)
1200-2200 cm-' MLS Av 500 200 100 50 20 10 H20
F'(T0A) 16.50 22.96 25.80 26.57 27.09 28.13 16.02 22.63 25.50 26.06 26.79 27.83 61.44 59.63 55.98 54.84 54.41 53.16
FN(T) F-(surf)
from the sum of the intensities of the lines present in the interval. In case B, we have calculated the mean functions 3( T ) and $( T ) by averaging over the entire spectral region taking into consideration the individual functions @(T) and zy(T). The results obtained by these two methods remain very close and affected by the same defects, although the second approach appears as an alternative to limit the influence of the strong lines on the temperature dependence.
Finally, Table 10 also shows that the variations of absorption with the width of the spectral intervals are damped out by the presence of overlapping gases, as is the case in section 4(b).
6 . SUMMARY
In order to test some simplifying assumptions currently used in longwave radiation schemes suitable for climate models, we have successively incorporated these approxi- mations into degraded versions of a detailed model of longwave radiation transfer in a clear-sky atmosphere, and studied the influence of these assumptions on calculated fluxes and cooling rate profiles. These quantities are shown to be sensitive to the way the vertical and spectral integrations are performed, and to be affected by systematic errors when economies are made in the vertical and spectral resolutions. The magnitude of these errors varies with the type of atmosphere, the tropical atmosphere generally giving larger differences. Tropospheric and stratospheric absorptions are overestimated (up to +5Wm-2) by too coarse a discretization of the vertical profiles of temperature and humidity. Opposite effects result from a decrease in the order of the numerical quadrature used for the vertical integration (between -0.5 W m-2 in SAW and -1.5 W m-2 in TRO), or from disregarding absorption by N 2 0 , CH4 (about -5 Wm-2), or some weaker bands of C 0 2 at 9.4 and 10.4 pm, or O3 at 14 pm (between -2 Wm-' in SAW and -5 W m-2 in TRO). Effects of the water vapour continuum absorption outside the window region vary between 0.4 and 5.7 W mP2 on outgoing radiation at the top of the atmosphere, and between 8 and 21.8 W m-2 on downward radiation at the surface. This last effect should not be disregarded when computing the surface energy balance in climate models. The representation of temperature and humidity profiles by their mean values in each model layer tends towards increasing atmospheric absorption (by about +4.5 W m-2) as does the choice of the SLA to handle absorption by H20 and C02, or the choice of the WLA to deal with O3 absorption (by about +6-7 W m-2). When the transmission functions are described by statistical models, a widening of the spectral intervals reinforces the influence
ERRORS IN RADIATION TRANSFER CALCULATIONS 707
of the strong lines upon the absorption, the wider the spectral intervals, the larger the atmospheric absorption, although the role of the strong lines in the temperature dependence of the absorption partly counteracts this effect. The amplitude of this effect depends on the initial width of the spectral intervals, and can reach 40 W m-2.
All the systematic errors pointed out in this paper often combine and partly com- pensate within some highly parametrized schemes used in climate models, allowing those schemes to present fair agreement with more detailed and less approximate radiation models.
ACKNOWLEDGMENTS
This work was supported by Centre National de la Recherche Scientifique, and is part of the first author’s doctoral thesis. We thank the anonymous referees whose comments helped us improve the paper.
REFERENCES Burch, D. E. 1982 ‘Continuum absorption by HzO’. AFGL-TR-81-0300, Final
Carnahan, B., Luther, H. A . and Applied Numerical Methods, J. Wiley and Sons, Inc.
Chou, M. D. and Arking, A. Computation of infrared cooling rates in the water vapor bands. J . Atmos. Sci., 37, 855-867
Clough, S. A,, Kneizys, F. X . , Davies, 1980 ’Theoretical line shape for H,O vapor. Applicatiorl to continuum’. In Atmospheric water vapor. A. Deeuak. T.
Report Contract F19628-79-C-0041, Bedford, Mass. 1969
1980 Wilkes, J. 0.
R . , Gamache, R. and Tipping, R.
Coakley, J . A , , Jr and Briegleb, B. P
Ellingson, R. G .
Elsasser, W. M.
Fels, S. B.
Fels, S. B. and Kaplan, L. D.
Fels, S. B. and Schwarzkopf, M. D.
Garand, L.
Goody, R. M.
Hunt, G . E. and Mattingly, S. R
Katayama, A.
Kiehl, J. T. and Ramanathan, V.
Liou, K.-N. and Ou, S. C. S
1978
1972
1942
1979
1975
1975
1983
1952
1976
1972
1982
1983
1981
D. Wilkerson and L. H. Ruhnke, Eds., Academic Press ‘Accurate calculations of fluxes and cooling rates using emiss-
ivities’. Preprints 3rd Conf. on Atmos. Radiation, Amer. Meteor. SOC., Boston, Mass., 179-181
’A new longwave radiative transfer model. Calibration and application to the tropical atmosphere’. Ph.D. thesis, Dept. of Meteorology, Florida State University, Rep.
’Heat transfer by infrared radiation in the atmosphere’. Har- vard Meteorological Studies 6, Harvard University, Milton, Mass.
Simple strategies for inclusion of Voigt effects in infrared cooling rate calculations. Appl. Opt . , 18, 2634-2637
A test of the role of longwave radiative transfer in a general circulation model. J . Amos. Sci., 32, 779-789
The simplified exchange approximation: A new method for radiative transfer calculations. ibid. 32, 1475-1488
Some improvements and complements to the infrared emiss- ivity algorithm including a parameterization of the absorption in the continuum region. ibid., 40, 230-244
A statistical model for water vapour absorption. Quart. J . R. Met. SOC., 78, 165-169
Infrared radiative transfer in planetary atmospheres: 1. Effects of computational and spectroscopic economies on thermal heating/cooling rates. J . Quanr. Specfrosc. Radiat. Trans- fer. 16, 505-520
‘A simplified scheme for computing radiative transfer in the troposphere’ Techn. Rep. 6, Dept. of Meteorology, UCLA, Calif.
Radiative heating due to increased CO,: The role of H,O continuum absorption. J . A m o s . Sci., 39, 2923-2926
CO, radiative parameterization used in climate models: com- parison with narrow-band models and with laboratory data. J . Geophys. Res., 88, 5191-5202
Parameterization of infrared radiative transfer in cloudy atmos- pheres. J . Atmos. Sci., 38, 2707-2716
72-4
708 J.-J. MORCRE’TTE and Y. FOUQUART
McClatchey, R. A., Fenn, F. W., Selby, J. E. A., Volz, F. E. and Garing, J . S.
McClatchey, R . A., Benedict, W. S . , Clough, S. A., Burch, D. E., Calfee, R. F. , Fox, K., Rothman, L. S. and Garing, J. S.
Malkmus, W.
Morcrette, J. -J.
Morcrette, J.-J. and Geleyn, J.-F.
Ramanathan, V., Pitcher, E. J., Malone, R. C. and Blackmon, M. L.
Rodgers, C. D .
Rodgers, C. D. and Walshaw, C. D.
Rothman, L. S.
Sadourny, R. and Laval, K.
Scott, N. A. and ChCdin, A.
Wang, W.-C.
WMO-ICSU JOC,
Wu, M.-L.C., Kaplan, L. D. and Godbole, R.
WU. M.-L.C.
1972
1973
1967
1984
1985
1983
1967
1966
1981
1984
1981
1983
1974
1978
1980
‘Optical properties of the atmosphere’, 3rd ed., AFCRL-TR- 72-0497, Environment Research Paper 411, Bedford, Mass.
‘AFCRL atmospheric absorption line parameters compilation’. AFCRL-TR-73-0096, Environment Research Paper 434, Bedford, Mass.
Random Lorentz band model with exponential tailed S-’ line intensity. J . Opt. SOC. A m . , 57, 323-329
‘Sur la paramttrisation du rayonnement dans les modtles de la circulation gCntrale atmosphkrique’ . Thtse de Doctorat d’Etat, UniversitC des Sciences et Techniques de Lille, 630
On the influence of different radiation parametrizations on model-generated radiation fields. Quart. J . R . Met. SOC. , 111, 569-590
The response of a spectral general circulation model to refine- ment in radiative processes. J . Atmos. Sci., 40, 605-630
The use of emissivity in atmospheric radiation calculations. Quart. J . R. Met. SOC., 93, 43-54
The computation of infrared cooling rate in planetary atmos- pheres. ibid., 92, 67-92
AFGL atmospheric absorption line parameters compilation: 1980 version. Appl. Opt. , 20, 791-795
‘January and July performance of the LMD general circulation model’. In Recent Advances in Climate Modelling, A. Berger and C. Nicolis, Eds., Elsevier, Amsterdam, 173- 197
A fast line-by-line method for atmospheric absorption com- putations: The Automatized Atmospheric Absorption Atlas. J . Appl. Meteor., 20, 802-812
‘Effects of approximate radiation treatments used in climate models on the clear sky thermal radiation flux and its perturbation due to C 0 2 increase’. DOE/ER/60023-1, Contract DE-AC 02-81 ER 60023, Atmospheric and Environmental Research, Inc., Cambridge, Mass.
Physical Basis of Climate and Climate Modelling, GARP Publ. Ser., 16, Geneva
‘Influence of systematic radiation differences on the dynamics of a model atmosphere’. Preprints 3rd Conf. on Atmos. Radiation, Amer. Meteor. SOC., Boston, Mass., 293-302
The exchange of infrared radiative energy in the troposphere. J . Geophys. Res., 85, 40854090