Overcoming Students' Misconceptions on Forces in Equilibrium: An Action Research Study
Upload
khangminh22Category
view
1download
0
Master of Science – Mathematics Education
USING ERRORS AND MISCONCEPTIONS AS A RESOURCE TO
TEACH FUNCTIONS TO GRADE 11 LEARNERS
Moloko Victor Malahlela
Student Number: 692718
Protocol Number: 2015ECE021M
A research report submitted to the Wits School of Education and the Faculty of Science,
University of the Witwatersrand in partial fulfilment of the requirements for the degree of
Master of Science by combination of coursework and research
Johannesburg, 5 June 2017

ii
ABSTRACT
This research report focussed on the teaching of the function concept directed at the errors
the learners make as well as the misconceptions which could be associated with those
errors. The study was conducted at a secondary school in Johannesburg, South Africa. This
was a qualitative error analysis study which also had a form of interventional or remedial
teaching. The research was driven by the following research questions: (1) What errors and
misconceptions do grade 11 learners show on functions?, (2) What learning affordances
and constraints can be created if teaching is directed at learners’ errors and
misconceptions? and, (3) To what extent can the learners’ achievement on the topic
functions be boosted if teaching is directed at learners’ errors and misconceptions?
The study used a purposive sample of six grade 11 mathematics learners from a group of 34
learners. To answer these questions, I structured the study to encompass numerous phases
of data collection using different instruments. Firstly, I constructed a test instrument and
used it on this group of grade 11 learners. These learners had been taught functions earlier
in the year, so the test was diagnostic to measure the cognitive levels of the learner on the
concept and also to establish the errors made and misconceptions they carried onto the
section from other sections or picked up from the function concept. The study was mainly
based on the constructivism theory of learning and teaching, but also had other theories to
link to it such at the socio-cultural theory, the APOS (actions, process, object and schema)
theory, the concept image and concept definition as well as the variation theory. The errors
I picked up from the pre-test I classified and analysed using the conceptual framework
grounded on the abovementioned theories. It was this analysis which enabled me to
structure the desired intervention program together with the teacher after which I
conducted a post-test with the subjects. Other forms of data collection such as the interview
and observation were employed during the study. I used the interview to get clarity from
the learners’ pre-test questions responses, whilst the observation I used during the
intervention lessons the teacher had with the learners. Indeed the findings were that, while
there was a substantial improvement on learner performance on the post-test, it appeared
clearly that cognitive levels of the learners on the function concept had been enhanced. This
improvement of performance was a result of the teaching that was directed at the errors,
which also interprets to having created a favourable environment which could be
interpreted as learning affordances to boost the learners’ understanding of the function
concept.
iii
KEYWORDS
Constructivism
Functions
Errors
Misconceptions
Remediation
Intervention
Schema

iv
DECLARATION
I declare that the content of this thesis is my own unaided work. It is being submitted for the
degree of Master of Science at the University of the Witwatersrand, Johannesburg. It has not
been submitted before for any degree or examination at any other University.
______________________________________________________________
Moloko Victor Malahlela
5th day of June in the year 2017

v
DEDICATION
This work is dedicated to my late sister Stephina Malahlela whom I would have loved to be with when
I receive this degree but unfortunately we cannot be together in person although I believe that we are
in spirit. We will always love you Mekadi ‘a Mmazwi á Phaahla! The kindness and love you have always
shown me from my childhood is now rewarded by this achievement to the family.

vi
ACKNOWLEDGEMENTS
Firstly, I would like to express my deepest gratitude to my supervisor, Dr Judah Makonye for his
unconditional support and encouragement throughout the study and the reporting period. I appreciate
deeply, the various ways in which you contributed to the work presented in this document as well as
to my own personal development.
My coursework lecturers, Prof. Jill Adler, Prof. Hamsa Venkat and Prof Karin Brodie, whose work
involved engaging me thoroughly with literature, which immeasurably contributed to this product,
thanks a lot. Being a Masters student in the Wits school of education has been an honor and a privilege.
I also thank the teacher, the learners, the principal and the school governing body of the school where
I conducted the research. The Gauteng Department of Education for letting me use one of their schools
to do the research for which the findings are reported on this paper.
My wife Nomonde Malahlela, my two sons Oatile and Tshegofatso Malahlela, thank you so much for the
enduring love and support you have shown me throughout this process.
The last but not least heartfelt gratitude goes to the National Research Foundation (NRF) for their
provision of a partial funding towards the completion of this course.

vii
CONTENTS CHAPTER 1: STUDY BACKGROUND .................................................................................................................... 1
1.1 Introduction ....................................................................................................................................... 1
1.2 Studies done on Mathematics performance in South Africa ............................................................. 1
1.3 Context of the research ..................................................................................................................... 3
1.4 Research Problem .............................................................................................................................. 5
1.5 Purpose of the research ..................................................................................................................... 6
1.6 Research questions ............................................................................................................................ 6
1.7 Significance of the study and justification ......................................................................................... 6
1.8 Conclusion and the structure of the report ....................................................................................... 9
1.8.1 Organization of the thesis .......................................................................................................... 9
CHAPTER 2: LITERATURE REVIEW AND THEORETICAL FRAMEWORK .............................................................. 11
2.1 Introduction ..................................................................................................................................... 11
2.2 Research on Mathematical Errors and Misconceptions .................................................................. 11
2.3 The function concept and difficulties in learning it ......................................................................... 14
2.4 Theoretical Framework .................................................................................................................... 16
2.4.1 Constructivist Learning Theory ................................................................................................ 17
2.4.2 Socio-Cultural Theory ............................................................................................................... 19
2.4.3 How I explain errors and misconceptions using constructivism and socio-cultural theory .... 20
2.4.4 Errors and misconceptions as the essential part of a constructivist framework ..................... 22
2.4.4.1 Variation Theory ...................................................................................................................... 24
2.4.4.2 Affordances and Constraints in Learning ................................................................................. 26
2.4.5 Conceptual Framework ............................................................................................................ 26
2.5 Remedial Teaching/Intervention ..................................................................................................... 29
2.6 Conclusion ........................................................................................................................................ 30
CHAPTER 3: METHODOLOGY AND RESEARCH DESIGN .................................................................................... 31
3.1 Introduction ..................................................................................................................................... 31
3.2 Qualitative study .............................................................................................................................. 31
3.3 Research design ............................................................................................................................... 32
3.4 Participants ...................................................................................................................................... 33

viii
3.5 Procedure ......................................................................................................................................... 33
3.6 Research Instruments ...................................................................................................................... 35
3.6.1 The Written Test (Pre-test & Post-test) ................................................................................... 36
3.6.2 The Interview with the Learners .............................................................................................. 41
3.6.3 The Class Observation of the Intervention .............................................................................. 42
3.7 Reliability and Validity ...................................................................................................................... 43
3.8 Ethical Considerations ...................................................................................................................... 44
3.9 Data Analysis Strategy ...................................................................................................................... 45
3.10 Conclusion ........................................................................................................................................ 47
CHAPTER 4: DATA ANALYSIS ............................................................................................................................ 48
3.1 Introduction ..................................................................................................................................... 48
4.2 Analysis of Learner Responses to the Pre-test ................................................................................ 48
4.2 Error identification, classification and analysis ................................................................................ 49
4.3 The Intervention Lesson ................................................................................................................... 70
4.4 Analysis of the Post-test in Comparison with the Pre-test Learner Responses ............................... 76
4.5 Discussion ......................................................................................................................................... 85
4.5.1 Types of errors identified ......................................................................................................... 86
4.5.2 What is implied by the errors identified .................................................................................. 88
CHAPTER 5: CONCLUSIONS, FINDINGS AND RECOMMENDATIONS ................................................................ 92
5.1 Limitations of the Study ................................................................................................................... 99
5.2 Recommendations and Implications for Theory, Research and Practice ...................................... 100
REFERENCES ................................................................................................................................................... 101
ANNEXURES ................................................................................................................................................... 107
ANNEXURE A: Pre-test ............................................................................................................................... 107
ANNEXURE B: Post-test .............................................................................................................................. 111
ANNEXURE C: Letter to the Principal ......................................................................................................... 115
ANNEXURE D: Participant Information Sheet ............................................................................................ 117
ANNEXURE E: Participant Information Sheet for the Teacher ................................................................... 118
ANNEXURE F: Participant Information Sheet for the Parents and Guardians ........................................... 119
ANNEXURE G: Participant Information Sheet for the Parents and Learners ............................................. 120
ANNEXURE H: Consent form for Audio-taping the Teacher During the Lesson ........................................ 121
ANNEXURE I: Consent Form for Teacher’s Lesson Observation ................................................................ 122

ix
ANNEXURE J: Consent Form for Learner Observation during the Lesson ................................................. 123
ANNEXURE K: Learner Consent Form for Written Assessment ................................................................. 124
ANNEXURE L: Learner Consent Form for Audio-taping during Lesson ...................................................... 125
ANNEXURE M: Learner Consent Form for Observation during Lesson ..................................................... 126
ANNEXURE N: Parent Consent Form for Child Writing Tests ..................................................................... 127
ANNEXURE O: Parent Consent Form for Child Interview........................................................................... 128
ANNEXURE P: Learner Consent Form for Interview .................................................................................. 129
ANNEXURE Q: Observation Schedule ........................................................................................................ 130
ANNEXURE R: Interview Schedule ............................................................................................................. 131
ANNEXURE S: Ethics Clearance Letter ........................................................................................................ 133

x
LIST OF FIGURES
Figure 1: The Zone of Proximal Development (ZPD)………………………………………………………….19
Figure 2: Learner response to Pre-test question 3 (Case 1)……………………………………………..…49
Figure 3: Learner response to Pre-test question 3 (Case 2)..………………………………………..……..50
Figure 4: Learner graphical representation of solution to Q 3 of the pre-test (Case 2)…………50
Figure 5: Learner response to question 3 of the pre-test (Case 3)………………………………………53
Figure 6: Learner response to question 3 of the pre-test (Case 4)………………………………………56
Figure 7: Learner response to question 2 of the pre-test (Case 5)………………………………………57
Figure 8: Learner response to question 2 of the pre-test (Case 6)………………………………………60
Figure 9: Learner response to question 1 of pre-test (Case 8)……………………………………………63
Figure 10: Learner response to question 2.1 of pre-test (Case 9) ……………………………………....65
Figure 11: Question 4 from the pre-test…………………………………………………………………………….66
Figure 12: Learner response to question 4.1 of pre-test (Case 10) ...……………………………….….66
Figure 13: Learner response to question 4.2 of pre-test (Case 11)……………………………………..67
Figure 14: Learner response to question 4.4 of pre-test (Case 12)……………………………………..68
Figure 15: Diagram for question 5 of the pre-test ……………………………………………………………...69
Figure 16: A schematic representation of the approach used for remediation……………………..75
Figure 17: Graphical representation of learner performance (Line graph)………………………..…85
Figure 18: Graphical representation of learner performance (Bar graph)………………………..…..85

xi
LIST OF TABLES
Table 1: Overview of the topic of functions as per CAPS requirements (DBE, 2011)……………14
Table 2: Types of errors and their descriptions…………………………………………………………..……. 26
Table 3: Limitations and advantages of a written test ………………………………………………………..39
Table 4: Analysis of the written test using the Bloom’s Taxonomy………………………………………40
Table 5: Different types of errors……………………………………………………………………………………….46
Table 6: Question 1 for the pre-test (Case 7)…………..…….………………………………………………..…..63
Table 7: Question 1 for the pre-test and post-test……………………………………………………………….77
Table 8: Question 1 for the post-test………………………………………………………………………..…………78
Table 9: Learner responses to question 1 of pre-test and post-test……………………………………...78
Table 10: Question 3 of pre-test and post-test…………………………………………………………………….79
Table 11: Question 3 learner responses for pre-test and post-test………………………………………90
Table 12: Question 4 for pre-test and post-test…………………………………………………………………..81
Table 13: Question 4.1 and 4.2 learner responses for the pre-test and the post-test…………….82
Table 14: Question 4.4 (pre-test) & 4.3 (post-test) learner responses ………………………………...83

1
CHAPTER 1: STUDY BACKGROUND
1.1 Introduction
In this chapter I discuss in detail the background of the study. I did this by breaking it down
into a variety of subsections. I explain the empirical settings’ context, the research problem
(whereby I introduce the research questions), the purpose of the study as well as its
significance. This gives an outline of the South African context versus other countries on the
performance of learner on Mathematics in general, and narrowing it further to the concept of
functions in particular. The chapter deals with aspects that necessitated the pursuing of this
study as well as how the findings might be of use to mathematical education theory and
practice.
1.2 Studies done on Mathematics performance in South Africa
The quality of learner performance in South Africa on Mathematics has been poor over the
years (Department of Basic Education (DBE), 2011). This is evident from various international
and local studies conducted to establish the level of performance of learners on mathematics
and other subjects such as science. The Trends in Mathematics and Science Study (TIMSS)
conducted in 1999 as discussed in Howie (2001), aimed at establishing trends of learner
performance in Mathematics and Science between different countries. Another study with
similar objective is the TIMSS-R (discussed in Reddy, 2004) and was conducted in 2003. Both
studies revealed successive poor learner performance of South African children on
mathematics. Participating countries for the TIMSS include South Africa, Indonesia, Morocco,
as well as other developing countries. This poor performance can be attributed to poor
understanding of basic mathematics concepts (Sasman, 2011), and have dire long run
consequences as South Africa may end up not being in a position to produce a sufficient number
of matriculants who pursue STEM (Science, Technology, Engineering and Mathematics) careers
at institutions of higher learning (Howie, 2003). These are careers which provide crucial
manpower for economic development. The Annual National Assessment (ANA) results also
2
reflect a consistent poor performance of Grade 9 learners on Mathematics from 2012 to 2014
despite the upward shift of scores of Grade 1 to 6 learners. In the South African schooling
system, Grade 9 is the exit level of the General Education and Training (GET) Band. It is a grade
just before the Further Education and Training (FET) band which includes Grades 10, 11 and
12 (exit level). This steady decline in Grade 9 Mathematics performance from 2012 to 2014
poses a big challenge to the future of the subject in the country as the work covered at Grade 9
is the building block of the basis for the FET band content.
The Mathematics curriculum is divided into a number of topics or chapters each of which
contributes to a pool of mathematical concepts which must be learnt and be mastered for
promotional purposes from one grade to the next. Among the many topics learners are
expected to master in the Mathematics curriculum, functions and graphs happen to be one of
the most challenging concepts (DBE, 2011; Sasman, 2011; DBE, 2014b & DBE, 2015).
In the Department of Basic Education’s Curriculum and Assessment Policy Statement (DBE
CAPS) (2011), the function concept is introduced at grade 10 level in the form of a straight line
[𝑔(𝑥) = 𝑚𝑥 + 𝑐]. The basic exponential [ℎ(𝑥) = 𝑎𝑥𝑛], basic parabola [𝑦 = 𝑎𝑥2 + 𝑐] and basic
hyperbolic [𝑓(𝑥) =𝑎
𝑥+ 𝑞] are also introduced at this level and are learnt in both graphical and
symbolic forms. The functions and algebra build up further into relatively advanced versions
as well as trigonometric function at grades 11 and 12. The topic further develops into cubic
function and inverse functions at grade 12 level. In general, as evident from the 2014 final
examination paper, the grade 12 curriculum percentage contribution of this topic content was
at least 37% (about 110 marks out of 300) which was distributed over both papers one and
two. Considering the significant weight this concept has on the curriculum, I believe that if
better ways of teaching it are established, learners are likely to do well on the subject in general.
This can aid their performance even further at the institutions of higher learning since the
concept of functions appears to carry a fundamental value and it’s essential for related learning
areas at school level, at institutions of higher learning as well as to operations in industry (Okur,
2013).
In trying to deal with the problem at hand, it is worth noting that the process of teaching
mathematics has over the decades been under scrutiny and has drawn enormous attention

3
from various educational reformers and education specialists all over the world (for example
Okur, 2013; Smith, Disessa & Roschelle, 1994; etc.). The aim of the investigations on the
learning and the teaching of the subject would be mainly exploring and establishing better
instructional approaches for its delivery. This refers to ways which provide learners with
opportunities or affordances to learn mathematics better for proper mastery of mathematical
concepts taught.
1.3 Context of the research
South Africa as a whole is in a situation whereby learner performance in Mathematics has
raised a concern amongst educationists and the entire academia (Howie, 2003; Howie, 2001;
Mji & Makgato, 2006).
The Third International Mathematics and Science Study-Repeat (TIMSS -R) conducted in 1998
and 1999 revealed that South African pupils performed last among a total of 38 countries which
participated in the study (Howie, 2003). The study also revealed that grade 8 learner
performance scored poorly at 275 which was significantly below the mean of 487. The results
of another TIMSS study conducted in 2003 showed no improvement on Mathematics among
South African pupils (Mji & Makagatho, 2006).
Consistent with the abovementioned findings, grade 12 Mathematics results in the country
have been poor over the years. While diagnostic reports compiled on performance of learners
revealed poor performance on Mathematics, one of the topics highlighted consecutively from
year to year as problematic is functions (National Diagnostic Report on Learner Performance,
2012, 2013, 2014). This has been consistently the case over many years.
It is important to note that, although I conducted my study at grade 11 level, I thought I should
use grade 12 final examination results as an appropriate reference frame since they (results)
emanate from standardised and endorsed promotional examinations. Another reason is that a
substantial percentage of work covered at grade 11 is examined at grade 12 level.
The performance of learners on Mathematics from 2010 to 2014 ranges between 47% and
59.1% (DBE, 2014b).

4
It is worth noting also that although the above figures are on overall performance of learners
on Mathematics as a subject, among other components of the Mathematics curriculum learners
have been grabbling through from year to year is functions. Sasman (2011) covered the concern
stated above in her analysis of the 2009 NCS examination as follows:
“Many candidates did not have a clear understanding of the characteristics of various
families of functions and are unable to sketch graphs...Candidates also lack an
understanding of the behavior of functions. The notation embedded in functions and
the transformations of functions were poorly understood in 2008 and 2009” (p. 7).
The situation did not get better as a few years later (i.e. in 2012), functions was still a topic on
which learners had dire challenges as displayed by their performance from the end of year
National Senior Certificate examination (DBE, 2012). The report echoes as suggestions for
improvement, in line with Sasman (2011) that, “Functions need much more attention in the
teaching process. Learners should be able to understand the different characteristics of the
various functions…Many candidates find working with functions challenging” (p. 127). This
was due to the fact that questions which tested learners/candidates’ knowledge directly on
functions were answered poorly by the candidates, nationally. One of the issues raised by
Sasman (2011) was that while learners/candidates had huge challenges interpreting graphs,
some had problems with understanding the basic relationship between functions and function
equations.
While the findings of this study may provide some recommendations for dealing with the
learners’ poor performance on functions, it also aims to find out if the poor understanding of
the topic by learners may be attributed to errors and misconceptions which learners carry over
from certain mathematical domains to this topic, and how teachers can deal with them.
According to the constructivist theory, learning is the construction of knowledge which
happens within an individual. It is a process which allows interaction of numerous processes
in the mind of an individual (Hatano, 1996), which would make it not so easy to figure out
without involving the learner himself/herself in the research.

5
1.4 Research Problem
Learners’ relational understanding of the mathematics content is the big issue in this study, and
it results from learners’ inability to cope with the subject among other factors. It is for this
reason that I decided to carry out this research.
The process of teaching mathematics has over the decades drawn enormous attention from
various educational reformers and education specialists all over the world, for example, Smith
et. al, (1994), Nesher (1987) and Hatano (1996). The main aim of the inquiry on the learning
and the teaching of the subject would be exploring ways which provide learners with
opportunities to learn mathematics relationally, i.e. improving opportunities for learners to
acquire more the conceptual understanding and mastery than just the procedural fluency
(Kilpatrick, Swafford & Findell, 2001).
As one of the concepts which are a requirement for learners to master in order to progress to
the next level of mathematics learning at a secondary school, the concept of function appears
to be one of the fundamental mathematical features not only in South African curriculum as I
have stated above, but also in other parts of the world. For example, the Malaysian curriculum
among others also puts so much value on the function concept as it is found to play a vital role
in algebra and trigonometry and leads to the teaching and learning of calculus (Abdullah &
Saleh, 2005).
Applications of the function concept go beyond mathematics as a discipline. Decision sciences,
economic sciences, geographical sciences are some of the areas in which functions are applied
as means of communicating information (Okur, 2013), and thus makes sense as to why it
contributes a great deal of content to the South African education system (curriculum).
Learners are thus expected to be at mastery level of the concept when they exit a secondary
school system despite the fact that it is a requirement for the learners to pass the subject
mathematics.

6
1.5 Purpose of the research
Firstly, the research aims to establish the types of errors which learners make on the topic
functions at grade 11. From the identified errors, the study seeks to investigate the possible
misconceptions which might have lead the learners to making these errors. Secondly, this study
critiques the learning affordances and/or constraints when a teaching approach is used to
address the identified errors and misconceptions. Lastly this research aims to determine the
extent of cognitive growth if any of learners as a result of this teaching intervention. This I shall
achieve by carrying out a qualitative study whose findings will provide answers to the
questions which follow in the next section.
1.6 Research questions
The study is organized to provide answers to the following three interrelated questions:
1.6.1 What errors and misconceptions do grade 11 learners show on functions?
1.6.2 What learning affordances and/or constraints can be created if teaching is
directed at learners’ errors and misconceptions?
1.6.3 To what extent can the learners’ achievement on the topic functions be boosted if
teaching is directed at learners’ errors and misconceptions?
While there could be several ways of researching on learning on this topic, I decided to start
from the angle of learner errors and misconceptions on functions because errors can be
traced to incorrect or correct learning which happened before (Olivier, 1996) and can be
pathways for constructing knowledge. Therefore, they need not be eradicated, but instead
be capitalised on and used as ‘springboards for inquiry’ (Borasi, 1994).
1.7 Significance of the study and justification
In South Africa, tests and examinations are used as measures for learner attainment of learning
outcomes (Makonye, 2010). From standardized assessments conducted on South African
learners, locally and internationally, it is evident that the country is not coping with the
demanding nature of mathematics from both ends (i.e. from the teachers to the learners). For

7
example, (TIMSS-R, 2013) results illustrate no improvement whatsoever on South African
learners’ performance in mathematics as compared to another study by TIMMS conducted in
1999 when South Africa scored way below the international mean score (Reddy, 2004). Locally,
mathematics learner performance on the Annual National Assessment (ANA) DBE (2014a) has
also been poor since its inception in 2012. The ANA served as “a landmark assessment tool that
annually measured progress in learner achievement in Literacy and Numeracy at entry and exit
grades of a phase up to grade 9, focussing on the government’s prioritised goal of improving
the quality of basic education” (DBE, 2011). For example, grade 9 learner performance (in
mathematics) in 2012 was averaged at 13% whereas for 2013 and 2014 it was at 14% and 11%
respectively. Yet on the other hand and similarly, the overall performance of grade 12 learners
on mathematics from the DBE common promotional examination ranged between 47.4% and
59.1% from 2010 to 2014.
Poor as they are, these results puzzled and motivated me to pursue this study, which I believe
may contribute to the mathematics education body of knowledge by revealing the possible
causes of this predicament, as well as getting trends and patterns which may assist with making
recommendations for improving instruction. This leads to what is referred to as the Pedagogic
Content Knowledge (PCK) of the teachers who are entrusted with the work of educating these
learners. Shulman (1986) argued that the PCK is the field on which the mathematics teachers
are struggling with and is a very important aspect of education system. Mji and Makgato (1996)
also alluded to the same problem that while some of the teachers who teach the subject are
under-qualified, a percentage of those qualified as teachers are not qualified to teach the
subject. This increases the complexity of the situation. Thus, the outcomes of this study will also
contribute to the PCK of the mathematics teachers as it somewhat focuses on the reaction of
teachers to learners’ errors and misconceptions (on the topic function).
Consistent with the complexity of the teaching and learning process, errors and misconceptions
are defined differently by numerous authors. For example, according to Olivier (1989),
misconceptions are over-generalizations of previous knowledge onto the domain where it does
not apply (Olivier, 1989). According to Baker, McGaw and Peterson (2007), misconceptions are
seen as being among the persistent and hard to change core ideas learners generate during the
process of constructing knowledge. These are the ideas which are inconsistent with the

8
scientifically accepted ideas. On the other hand, learning is seen as a process through which
learners transform and refine prior knowledge into more sophisticated forms (Smith et al.,
1994), through the processes of assimilation and accommodation (Hatano, 1996). It is during
these processes whereby learners tend to get lost in the midst of trying to cope with learning.
Learners who do not manage to make it through these processes, tend to lose interest on the
concept and unfortunately, their lack of understanding of the concept grows as they progress
from grade to grade as the cognitive demand of the concept increases.
Throughout my career as a teacher for mathematics at secondary school, I also did not have a
good strategy of dealing with learners’ errors and misconceptions. It was however possible for
me to see that some learners experienced challenges moving from one level of understanding
a concept to the next, but did not really know how to approach the situation. It was also evident
from my involvement in the education system that as the learners I taught progressed from
working with a straight line graph to other forms of functions (and their graphs), they seemed
to lose interest on the function concept. This loss of interest I observed result with poor
conceptual understanding and poor performance on assessment tasks. This is one of the things
which encouraged me to base this study on functions.
Instead of attempting to eradicate misconceptions, a teacher needs to incorporate in their
teaching, strategies which enable them to become aware of learners’ errors and misconceptions
(Borasi, 1994; Brodie, 2007 & Olivier, 1989). The authors posit that being aware of, and paying
attention to learners’ errors and misconceptions can be used to shape up, guide and enhance
learning.
The findings of this study are to assist in getting to the bottom of the predicament the
mathematics community of practice is facing in the form of identifying the causes and making
recommendations for improvement of the teaching practice.

9
1.8 Conclusion and the structure of the report
The section dealt with poor performance of learners on Mathematics locally and
internationally. These I have drawn from various studies done on learners from South Africa
and other countries with the function concept being the central point. The concept is found to
be of high fundamental value to the subjects as it is through it that mathematical and other
forms of information can be communicated. One of the aspects contributing to this poor
performance in South Africa was found to be the concept of functions among others (Sasman,
2011). Thus the study will attempt to get insights into the use of errors and misconceptions as
a resource to the teaching of functions since errors and misconceptions are key to construction
of knowledge rather than things which must be prevented (Olivier, 1996).
1.8.1 Organization of the thesis
I have organised this thesis into five interrelated chapters.
Chapter one outlines the background to the study. The chapter is broken down into a series of
sections which individually treats in detail, aspects to do with the background of the study. The
sections include a brief examination of the study done on the mathematics performance in
South Africa as a way to contextualise the problem. The chapter also serves to introduce the
research problem, the purpose of the study, the research questions as well as the significance
of the study.
Chapter two is designed to explore a variety of literature and theory which underpins my study.
The chapter commences with the introduction and extends to establishing the link between the
objectives of the study and its theoretical basis.
Chapter three discusses the methodological constructs employed to conduct this research. The
discussion encompasses a brief presentation of the study paradigms, the research design, the
participants, the procedure, the instruments used to collect data, the validity and reliability, the
ethical considerations as well as the strategy I used to analyse the data collected.

10
Chapter four presents the analysis and findings of the study. The chapter reports on the analysis
of the learner’s responses to the pre-test questions, identifies and analyses the errors; and
locates the misconceptions attributed to the errors. It also presents a detailed itemised
comparison of the learner performance on the pre-test and on the post-test.
Chapter five reports on what the findings interpret to, the limitations of the study as well as the
recommendations for theory, future research and practice.

11
CHAPTER 2: LITERATURE REVIEW AND THEORETICAL
FRAMEWORK
2.1 Introduction
In this chapter I use elaboration from literature on the analysis of errors made by learners as
well as misconceptions which may have led to these errors. The main basis of this discussion
is the theory of constructivism which I link with other theories such as socio-cultural theory,
the APOS theory. I also discuss the variation theory to explain how teaching and learning
unfolds if the teaching process is directed at the errors learners make.
2.2 Research on Mathematical Errors and Misconceptions
Among studies done on learning mathematics in general, there are those which point to the
same direction as this study. In further relation to this study, there is also some research which
has been conducted on learners’ errors and misconceptions displayed while trying to cope
with mathematics (Olivier, 1996). Drawing also from Sarwadi and Shahrill (2014) who argue
that some existence of errors and misconceptions dates back to early learning and makes it
difficult for learners to cope with the subsequent demands of mathematics, hence affect their
performance in tests or assessment tasks. This problem persists and prevails throughout the
learners’ period of schooling if not dealt with and thus end up affecting their general attitude
towards the subject (Dowker, 2004).
Literature which serves to identify errors and misconceptions from learners’ verbal and
written work exists, but more needs to be suggested on what then to do. It is not sufficient just
to identify the errors and misconceptions (Smith et al., 1994). In light of the need raised by
Smith et al. that future research should focus on using the misconceptions and errors to build
on learners’ conceptions, Sarwadi and Shahrill (2014) make a contribution towards the
instruction from a teacher’s end. The authors posit that teachers need to be ‘made’ aware of
how these errors and misconceptions come about and accordingly device pedagogical means

12
to incorporate them in their teaching. They should develop diagnostic expertise so as to be
able to deal with errors and misconceptions from learners’ written and verbal work
constructively Prediger (2010). This special skill required of a teacher because constructivism
accounts for the fact that errors and misconceptions are pathways for constructing knowledge,
and must not be eradicated, but instead be capitalised on and used as ‘springboards for
inquiry’ (Borasi, 1994). This is all because learners are viewed by constructivism as NOT
passive recipients of imposed facts and information/opinions, but rather as active participants
in the construction of their own knowledge (Hatano, 1996). It is through this process whereby
learners engage with new information and process it to what eventually becomes knowledge.
Misconceptions tend to emanate from this process as by-products. These lead to learners
making errors which are persistent and resistant to change. Teachers also find it difficult to
convince learners that what they know (which might be incorrectly structured but making
sense to them) are wrong mathematical conceptions (Brodie & Berger, 2010).
Learners’ thinking abilities can also be recognised from the mathematical conversations they
participate in. It is from this platform whereby teachers can pick up ideas from learners and
use them to facilitate the learners’ process of constructing knowledge despite it being a
discouraging process (Brodie, 2007).
Despite the issues acknowledged and raised by authors some of whom I have referred to in
this review of the literature, it is expected of a teacher to ensure that s/he is able to create a
learning environment which embraces the above mentioned teaching strategies so that
learners’ ideas/thinking can be integrated in the learning process to enhance knowledge
construction Jacobs, Lamb & Phillips’s (2010).
Still on learning through acknowledgement of errors and misconceptions, Bray and Santagata
(2013) also maintain a very strong view that for teaching to result with learning of actual
mathematical concepts, teachers need to implement an instructional strategy to expose
learners’ errors and misconceptions, and deal with them openly. Since this is a complex
phenomenon which involves both the teacher and the learner, it is also vital to bear in mind

13
what it commands of the teacher up and above what I have mentioned in the preceding
sentence.
The concept of hearing and listening are also vital in the process of teaching-and-learning as
part of the teacher’s role. This is because the teaching and learning processes encompass lots
of other sub-processes. Coles (2002) established a valuable link between the concepts of
hearing and listening, and their implications on the teaching strategies. Her findings emanated
from her analysis of classroom interactions where she used the three forms of listening from
Davis (1997). Due to the thin line that seems to exist between the two concepts (i.e. listening
and hearing), it makes it easy for teachers to confuse one with the other. Hearing needs a full
and conscious effort to tune into the ‘how’ and the ‘what’ of the student’s idea, and thereby
enabling understanding of the students’ meanings and thinking (Coles, 2002). But the extent
to which a teacher can understand the students’ meanings and thinking is somewhat
dependent on the form of listening and the teaching strategies they employ. This implies that
a teacher also needs to carefully look into his/her teaching strategies, which Coles (2002)
refers to as any activity undertaken by a teacher in relation to organising his/her teaching and
learning space, the teaching resources, the assessment procedures and the nature problems
he/she chooses. This does not leave out a teacher’s personal view of the Mathematics subject
and the manner in which he/she chooses to interact with the learners. Coles (2002) brings
about the fact that, of the three forms of listening by (Davis, 1997), transformative listening
was found to carry some special feature of enabling the slowing down and opening up of
discussions, affording students with opportunities to ask questions and work with their own
questions, thereby allowing a teacher to engage with learners’ thinking. This form of listening
enables a teacher to get insights if learners ideas, which may in turn enable him/her to pick up
conceptions and misconceptions through a learning and teaching process.
In addition to the mere identification of errors and misconceptions, Makonye and Luneta
(2013) explain their possible roots with their focus specifically on the function concept. My
study is aiming to go slightly beyond Makonye and Luneta (2013)’s work. That is, establishing
if capitalising on the identified errors and misconceptions on teaching functions and using
them to shape up the teaching can enhance the teaching and learning process and enable a
better understanding and mastery of the concept. The study also takes into consideration the

14
constructivist theory of learning and how closely related it is to learners’ errors and
misconceptions as they (Makonye & Luneta, 2013) write of other scholars who argue of a
strong link between constructivism and learners’ mathematical misconceptions (Smith et al.,
1994; & Nesher, 1987).
2.3 The function concept and difficulties in learning it
The function concept is considered to have fundamental value in Mathematics. While in
graphical representation form it also serves as a means of communication (Okur, 2013), it
finds its way into a wide variety of branches of mathematics which include algebra,
trigonometry, calculus and many more (Abdulla & Saleh, 2005). Application of the function
concept extent beyond Mathematics as subject learnt at school and at institutions of higher
learning to economic and management sciences, decision sciences, geographical sciences, as
well as in other disciplence (Okur, 2013). Its nature of being broadly compatible with many
disciplines and practices apart fron Mathematics could be the reason why it is found
abundantly throughout the curriculum from elementary to tertiary education (Cansız, Küçük,
& İşleyen, 2011).
The difficulties which learners come to experience and have to deal with when learning
functions (which in most cases are represented graphically) include both sketcking of graphs
(Dubinsky & Wilson, 2013) and interpreting graphs (Eraslan, 2008). This does not leave out
basic understanding of the function concept itself right from identification (which enables
classification of functions) from understanding the algebraic arguments linked with each type
of function. For example, the secondary school curriculum in South Africa is structured in a
way that it covers a considerably broad family of functions. Relevant to this study, in the
Further Education and Training (FET) phase alone, learners are expected to acquire a full
understandung of all functions and their graphs as prescribed (Department of Basic
Education, CAPS, 2011). These include linear, quadratic, cubic, hyperbolic, exponential,
logarithmic and trigonometric functions whereby learners are expected to know how to
sketch graphs of these functions and interprete them. The table below gives a summary of the
topic overview as per the Department of Basic Education (2011) CAPS document
requirements (p.12).

15
Table 1: Overview of the topic functions as per CAPS requirements DBE (2011)
Functions
Grade 10 Grade 11 Grade 12
Work with relationships
between variables in terms of
numerical, graphical, verbal
and symbolic
representations of functions
and convert flexibly between
these representations
(tables, graphs, words and
formulae). Include linear and
some quadratic polynomial
functions, exponential
functions, some rational
functions and trigonometric
functions.
Extend Grade 10 work on the
relationships between
variables in terms of
numerical, graphical, verbal
and symbolic representations
of functions and convert
flexibly between these
representations (tables,
graphs, words and formulae).
Include linear and quadratic
polynomial functions,
exponential functions, some
rational functions and
trigonometric functions.
Introduce a more formal definition
of a function and extend Grade 11
work on the relationships between
variables in terms of numerical,
graphical, verbal and symbolic
representations of functions and
convert flexibly between these
representations (tables, graphs,
words and formulae). Include
linear, quadratic and some cubic
polynomial functions, exponential
and logarithmic functions, and
some rational functions.
While the above requirements clearly indicate how demanding the concept is of learners, the
process of learning it can be explained using Leinhardt, Zastavsky and Stein (1990)’s
approach. The authors use the concept of intuitions and misconceptions. They define
intuitions as features of the knowledge possessed by a learner/student that exist prior to
specific formal instruction. These are forms of knowledge which arise from the
learner’s/student’s everyday experiences. Leinhardt et al. (1990)’s view on intuitions is
consistent with that of Piaget (1967) in which he uses the word schema (or schemata in
plural) instead. Piaget defines a schema as a set of cognitive structures which exist in an
individual’s mind and represent certain aspects of the world. These he says result from pre-
conceived ideas humans have about the world generally. In line with these two concepts and
what they actually are about, Hatano (1996) posits that these cognitive structures differ from
individual to the next. These mental structures develop in accordance with an individual’s
social, religious, cultural background, and general life experiences which are not the all the
same for different people.

16
Apart from intuitions, learning of Mathematics is also characterised by misconceptions
according to Smith et al. (1994). They define misconceptions as features of a students’
knowledge about a specific piece of mathematics knowledge that may or may not have been
instructed.
Some of the errors on functions from research include the learners’ inability to differentiate
between types of functions, inability to interpret graphs of functions, inability to represent
functions graphically, converting flexibly between different representations of functions, and
more (Sasman, 2011). This is consistent with Markovits, Eylon and Bruckheimer (1986)’s
view of learning functions since good understanding of the concept requires two stages, the
passive stage and the active stage. The passive stage they say pertains to classification,
identification, etc. whereas the active stage (which they regard more complex) is about giving
examples of functions which satisfy some give constraints, ability to convert flexibly between
different forms and representations of functions, i.e. numerical, graphical, verbal and symbolic
representations. Markovits et al. (1986) revealed that among other difficulties learners have
when working with functions is the transfer from graphical to algebraic, technical
manipulations of functions, more adherence to linearity every time examples of functions are
required, etc. (p.24). While the findings by Markovits et al. (1986) are consistent with the
South African curriculum statement requirement (DBE CAPS, 2011), they also match the DBE
(2011, 2014 & 2015)’s findings on grade 12 learner’s inability to cope with functions.
2.4 Theoretical Framework
In this section, I outline the theoretical framework that enlightens this study on using learners’
errors and misconceptions on grade 11 functions topic as a resource to learn the topic. I
discuss constructivism (Piaget, 1967 & Von Glaserfeld, 1995) and the socio-cultural theory of
learning (Vygotsky, 1978) as they impinge on my study. Another theory of teaching and
learning I draw from is the variation theory, which I discuss in details in latter sub-sections.
Piaget’ (1967)’s theory of epistemology (i.e. Constructivism) is the basis for my study as well
as Vygotsky (1978)’s socio-cultural theory of learning. I use both theories to discuss how
learning mathematics and in particular how learners may have misconceptions which lead to

17
making errors as they learn the topic functions. I also discuss the need for teacher mediation
to help learners resolve their errors and misconceptions using the socio-cultural theory in
learners’ zones of proximal development (ZPD) (Vygotsky, 1978).
2.4.1 Constructivist Learning Theory
Piaget (1967)’s view of constructivism was brought to light after early deliberations on the
theory in the 17th century. This view was that, what is in the mind of a human being, is what is
made or constructed by the human mind. Throughout the process of interpretation, the theory
was disseminated into different categories two of which being radical constructivism and
social constructivism. Notwithstanding their differences, both these types of constructivism
point out to cognitive constructivism.
Unlike Radical constructivism, social constructivism is based on postulates about reality,
knowledge and learning (Kim, 2001). In this perspective knowledge is constructed based on
the culture and the context of the society and environment in which individuals live (Kim,
2001). Social constructivists believe that learning is a social process (Ernest, 1998). At the
same time they believe that reality is invented by members of a society or community.
General perspectives of social constructivism on learning include the cognitive tools, idea-
based pragmatic approach and situated cognitive perspectives. Hatano (1996) points out that
constructivists with the pragmatic/emergent approach believe that understanding of the
world can be made possible in a classroom (within a group) from the views of the learners,
teachers and the collective views of the other members of the group.
The different views of constructivism which I have alluded to above are a clear indication that
over the years of educational reform, the theory has been interpreted and re-interpreted.
During these processes of interpretation and re-interpretation, it has also been understood
and misunderstood by some educational reformers.
In explaining the learning process in terms of constructivism, Piaget introduced the concept of
schema (or schemata in plural), which he referred to as something that helps individuals to
understand the world they live in. He defines it as a set of cognitive structures that represent
certain aspects of the world. They result from pre-conceived ideas which individuals have. Due

18
to different social, religious, cultural background, and general life experiences, different people
have different schemata (Hatano, 1996). This leads to the concepts of assimilation and
accommodation. Assimilation involves taking in new information and fitting it into the pre-
existing schema. What is newly absorbed loses most of its original meaning and acquires new
meaning due to the pre-existing schema. Accommodation happens when a completely new
schema forms due to newly acquired information not matching with the pre-existing schema
(Hatano, 1996; Sarwadi & Shahrill, 2014; & Smith et al., 1994).
In line with the Piagetian view of learning, I strongly agree with Hatano, (1996) who also
strongly believes that human beings have different and unique ways in which they construct
knowledge. While Hatano argues that, construction of knowledge is more conceptual by
nature, she also believes that construction of knowledge is from experiences of solving
problems from those they create rather than those they are imposed with. In the context of
this investigation, the problems individuals create or rather the misconceptions which
emanate from the process are due to them attempting to cope with mathematics (Olivier,
1989).
Baker, McGaw and Peterson (2007) have also introduced what they refer to as the core ideas
in constructivist learning as follows: (a) Knowledge is actively constructed by the learner, not
passively received from the outside. It is something done by the learner, not something
imposed on the learner. (b) Learners come to the learning situation with existing ideas about
many phenomena. Some of these ideas are deeply rooted and well developed whilst others are
temporary and unstable. (c) Learners have their own individual ideas about the world, but
there are also many similarities and common patterns in their ideas. Some of these ideas are
socially and culturally accepted and shared, and they are also part for the languages supported
by the metaphors. (d) These ideas are often at odds with accepted scientific ideas, and some
of them may be persistent and hard to change. (e) Knowledge is represented in the brain’s
conceptual structures and it is possible to model and describe it in some detail. (f)Teaching
has to take learner’s existing ideas seriously if it is to be changed or challenged. (g) Although
knowledge in one sense is personal and individual, the learners construct their knowledge
through their interactions with the physical world, collaboratively in social settings and in
cultural and linguistic environment.

19
Constructivism explains how learners come to make errors which result from misconceptions
they acquire in the process of learning mathematics (see a latter subsection).
Vygotsky, a Russian educationist who in most cases appeared to be in opposition with Piaget
(1967)’s views put forward his own theory of learning, namely, the socio-cultural theory.
2.4.2 Socio-Cultural Theory
I believe that another lens to use in looking at and explaining the process of error and
misconceptions formation (which happen through the process of teaching and learning) could
be the socio-cultural theory (Vygotsky, 1978). In this theory Vygotsky presented a relationship
between learning and development from a psychological perspective. He proposed what he
referred to as the Zone of Proximal Development (ZPD) which he defined as the distance
between what an individual can be able to do independently (the actual developmental level)
and what they cannot do even when with guidance (the level of potential development).
The theory also incorporates the notions of tools, signs, mediators and scaffolding which are
important to explaining learning. According to Vygotsky (1978), mediators can be in the form
of a teacher, or a parent or an experienced fellow to the learner. Mediators use tools (for
example, language of learning and teaching or symbols) to scaffold. Scaffolding is the provision
of support and unpacking of the social nature of participatory teaching and learning which
takes place within the ZPD, with the aim of initiating effective learning.
Figure 1: The Zone of Proximal Development (ZPD)
Source: https://en.wikipedia.org/wiki/Zone_of_proximal_development

20
In attempting to merge Piaget (1967)’s cognitive constructivism with Vygotsky (1978)’s socio-
cultural theory, for a learner to construct knowledge (or for learning and development to
happen), he/she must be moved by a mediator from the innermost ring of the diagram above
to the outermost ring. The ring in between the innermost and the outer rings could be
associated with a level of disequilibrium (Hatano, 1996). At this level a learner is stuck with a
misunderstanding (or an error or a misconception) but needs a mediator or a more
knowledgeable other to be moved through to the next level of development but still within the
ZPD.
Learning occurs firstly on the social plane (i.e. within the interaction between the learners and
the mathematical tasks) and later on the psychological plane. It starts with learners acquiring
information from the environment, and then allowing it to engage with his/her cognitive
structures in his/her mind (Smith et al., 1994). This long procession of activities makes a
learner to be more prone to misinterpretations and hence development of misconceptions
which in turn lead them to making errors.
2.4.3 How I explain errors and misconceptions using constructivism and socio-
cultural theory
In this sub-section, I look at learners’ errors and misconceptions in a constructivist perspective
but also through the lens of social-cultural theory. I reveal how the two theories together
explain how misconceptions can emanate from a learning process and how they lead to
learners’ errors.
According to constructivists (Smith et al., 1994) learning is the gradual re-crafting of existing
knowledge that despite many intermediate difficulties, it eventually becomes successful. It
takes place in the form of constructing knowledge. It is from this learning process whereby
errors and misconceptions emanate as a result of learners’ intelligent constructions based on
correct or incomplete previous knowledge, and the learners’ rational and meaningful efforts
to cope with mathematics (Olivier, 1989).

21
Hatano (1996) considers knowledge to be constructed through a spontaneous reaction which
takes place in a learner’s mind as a result of what they are observing or the information they
are presented with. In that process misconceptions as well as what Hatano (1996) refers to as
procedural bugs emanate. A constructivist then capitalizes on the emerging misconception as
in his terms, misconceptions are the strongest pieces of evidence for the constructive nature
of knowledge acquisition. Humans have a tendency of interpreting and enriching what is
presented to them or what they are observing through construction and restructuring
(Hatano, 1996).
In mathematics, misconceptions are said to emanate from overgeneralization of previous
knowledge among other things as due to the subject’s cumulative nature, any new learning
depends on the previous learning (Olivier, 1989). On the other hand, Mason, Graham and
Johnston-Wilder (2005) posit that for any learning to happen there has to be some form of
generalization. It just so happens that more often than not, learners tend to over generalize,
and that results with misconceptions which drive them into making mathematical errors.
Misconceptions are difficult to eradicate because humans do not easily accommodate new
ideas when necessary, but rather assimilate new ideas into existing schema (Hatano, 1996).
Many people have difficulty relinquishing misconceptions because the false concepts may be
deeply ingrained/rooted in the mental map of an individual, and also because later teaching
emphasizes computational and manipulative skill than conceptual understanding (Olivier,
1989). Learners learn through transforming and refining prior knowledge into more
sophisticated forms (Smith et al., 1994).
As discussed above, the processes which take place as a learner construct knowledge result
with “procedural bugs” (Hatano. 1996) which teachers and educationists need to take
advantage of and build up knowledge from (Borasi, 1994). As such the following points are
vital according to the constructivist perception of the learning process (Smith et al., 1994 &
Olivier, 1998): While misconceptions cannot be avoided, they need to be tolerated and be
regarded as part of learning. Misconceptions must be exploited by a teacher as opportunities
to enhance learning and knowledge construction. Thus, there is a strong interrelation between
cognitive development and the constructivist framework for learning.

22
2.4.4 Errors and misconceptions as the essential part of a constructivist framework
The accuracy of transformed knowledge is compromised by possible ambiguity and different
interpretations by different people. This is because, when information is received by what
Hatano (1996), refers to as active humans, it gets interpreted and enriched, or rather
supplemented, which result with a newly constructed knowledge. The process of enrichment
leads to reorganising and reconstruction of knowledge. That happens when a human being
gains more insight in a particular aspect. The unfortunate part of this process is that to a
certain extent, what is received does not always remain the same. These processes of learning
and knowledge construction and reorganisation unintentionally and undesirably tend to the
building up of misconceptions which leads to making errors. Olivier (1989) defines errors as
the systemic wrong answers which emanate from underlying conceptual structures. Although
some literature conflicts misconceptions with constructivism, I find a very strong and
interesting correlation between the two (Olivier, 1989, 1996; Hatano, 1996; etc.). Olivier’s
definition of the relationship comes from understanding knowledge construction from the
constructivist perspective. This means considering all the processes mentioned above in
relation to the construction of knowledge. From understanding that a learner is not seen as a
passive recipient of knowledge from the environment and those more knowledgeable;
constructivists see a learner as an active participant in the process of constructing his or her
own knowledge. Due to the interaction of what the learners already know and what they are
acquiring, conceptions and unfortunately misconceptions form. However, according to the
constructivism perceptive of learning and knowledge formation/acquiring, this should be
taken as a normal process of learning for it enables the construction of new legitimate
knowledge (Olivier, 1989; Nesher, 1987). Olivier argues that it starts with the learner
attempting to incorporate a new idea into an existing schema. Due to the diversity of what
needs to be learnt, it is not always possible to link every new idea with an existing schema.
This means that assimilation or accommodation may not be possible. That would result with
a learner creating a new “box” by which he or she will try to memorise the new idea. The urge
to the creation of this new idea emanates from the state of disequilibrium due to the inability
to match the new idea with any existing schema. The learner’s attempt to memorise the new
idea results with what is called rote learning - isolated knowledge which is difficult to

23
remember. This isolated knowledge then results with misconceptions, which in turn cause
errors. This is learning from a constructivist perspective.
To add on Olivier (1989)’s view of the relationship between constructivism and
misconceptions, Borasi (1994) also presents a reconciliation stance between constructivism
and learning through misconceptions and errors. This is a complex aspect which requires a
teacher to regard learners and thinkers up and above listeners and participants in a classroom
discussion.
The implication of constructivism to learning has been a component of literature from many
authors (Brodie & Berger, 2010; Lobato, Clarke & Ellis, 2005). Kazemi and Stipek (2001) also
had interest in this perspective of learning. These are some of the authors whose perception
and acknowledgement of learners as thinkers I found to be relatively clear, and as they assert
that learners’ errors and misconceptions need to be taken as a “normal part of the process of
constructing knowledge and in fact may be a necessary step in the construction of certain
ideas” (Brodie, 2007; p170).
I have also drawn from Makonye and Luneta (2013) as they also established a connection
between learners’ errors and misconceptions with constructivism. The researchers did that
by bringing about the other two supporting theories, namely, the APOS (Actions, Process,
Object and Schema) theory by Dubinsky, Assiala, Schwingendorf, and Contrill (1997) and the
concept image and concept definition theory by Tall and Vinner (1981). The former is all about
the processes involved in the learning of a concept and it involves four steps. These are the
initial stage where a learner views a concept as an external activity to which minimal meaning
he/she can attach, followed by the stage in which the learner views a concept as more closer
to him/her but still external though partially appearing as a process. The third stage of
conceptualisation according to the APOS theory is whereby a learner internalises the concept.
The fourth and final stage is where a learner incorporates the concept in her or his broader
mental picture referred to in constructivist terms, as schema. A schema (or schemata in plural)
is defined by many in different ways but all definitions converge or point to the same thing
which is knowledge organised into structures which are large units of interrelated concepts
(Olivier, 1989), (Makonye & Luneta , 2013) and (Hatano, 1996).

24
Makonye and Luneta (2013) also bring about the theory by Tall and Vinner (1981), which is
also linked with learners’ errors and misconceptions. A concept image is more or less similar
to schema, as the researchers define it as “a cognitive chunk of ideas that a learner has formed
in his/her mind regarding all aspects of a specific concepts” (Makonye & Luneta, p. 919). While
the APOS theory suggest that errors and misconceptions result with failed attempt to
assimilate or accommodate new ideas, this theory of concept imaging and definition suggest
that errors and misconceptions come about as a result of concept images constructed by a
learner being in conflict with what is believed in and endorsed by a wider mathematical
community. Similarly, a concept definition which is likely to be in conflict cognitively with
another concept definition is a potential conflict factor and may result with misconceptions.
2.4.4.1 Variation Theory
To better understand a concept, it is more often than not easier to understand it in contrast.
This would be taking it in contrast to what it is not. The theory is simply about the fact that for
an individual to discern a certain feature of a phenomenon, they might need to be taken through
an experience which allows them to make a meaningful deduction out of the phenomena which
is presented to them in contrast (Mhlolo, 2013).
Like constructivism and other theories of learning I have already alluded to, variation theory
as well breaks down the process of learning right from the beginning to the end using the
patterns: contrast, generalisation, separation, fusion and the space of learning.
Contrast is the pattern of variation which suggests that learning takes place from creating a
contrast of what the learner has to learn between what it is and what it is not. It is with this
pattern of variation that a learner is enabled to compare the critical features of the object of
learning and what they are not (Runesson, 2005). For example, in the function concept, a
teacher can introduce a simple quadratic function by using the knowledge learners already
have on linear functions so as for them to easily compare and differentiate what a quadratic
function is with what it is not based on the characteristics of a linear function.

25
Separation pattern suggests that learning takes place through the learners’ ability to see the
characteristics of a concept in order to be able to differentiate it from others (Mhlolo, 2013). It
suggests that learning happens in a situation whereby a learner is enabled to see critical
features of a concept and subsequently create a distinction between this concept and others.
Generalisation pattern suggests that learners make conjectures or make conclusions from
dealing with similar but many activities (Runesson, 2005). For example, in determining the
behaviour of an inequality sign when the inequality is multiplied or divided through by a
negative number, a number of investigative activities can be given to a learner to the extent
they eventually get to making a generalisation of what to expect whenever such is operated on
an inequality. Also exposing learners to numerous examples of a similar nature aids their
understanding of the concept through generalisation.
Learning through generalization involves being exposed to tasks of similar nature which are
featured by various examples which illustrate critical features of the object of learning
(Runesson, 2005).
Fusion is the pattern of variation which also takes into cognisance the learners’ background
and their previous experiences. It matches the concepts of errors that they develop from
correct or incorrect learning that has happened (Olivier, 1989). It is the pattern of variation
through which learners are given an opportunity to simultaneously discern a variety of critical
features of the object of learning; hence it is also referred to a synchronic simultaneity (Marton,
Runesson, & Tsui, 2004). It is key that before the fusion pattern of variation can be applied,
learners are able to identify and differentiate and discern critical features of the object of
learning.
The above patterns are key to the objectives of this study in that the remediation approach to
teaching functions was planned in cognisance with variation theory. It was through this
approach that the teaching that was focused or rather directed at the incorrectly constructed
knowledge could take place to create an enabling environment for the learners to discern what
they were taught by being given exposure to the critical features of what it is not (Mhlolo,
2013), hence exploit affordance to learning.

26
2.4.4.2 Affordances and Constraints in Learning
An affordance in learning is a contrast of what is referred to as a constraint. These two concepts
emanate from what teachers do during their interaction with the learners and the object of
learning in a learning environment. The two can serve as a tool to determine the degree to
which a mathematical learning concept is made available to learners (Watson, 2007). It is up to
the teacher to create an environment which either enables or disables learning to occur.
However, for the teacher to have created an enabling environment, it does not necessarily mean
that learners can discern the object of learning (Marton & Pang, 2006). Thus the concept of
affordance is better explained in contrast to that of a constraint. Both concepts can generate
what Watson (2004) refers to as the ecology of participation.
2.4.5 Conceptual Framework
This research seeks to establish if directing the teaching to learners’ errors and misconceptions
in the topic of functions could enhance their understanding and further mastery of the topic. It
involves establishing the nature of errors learners make and the nature of misconceptions
evident in their work while learning functions. The table below summarises some of the
categories of errors and misconceptions which I may establish from the learners’ work (Olivier,
1989; Luneta & Makonye, 2010). It is worth noting that there may be other categories of errors
and misconceptions emanating from the responses of the learners as I will be doing the analysis.
Table 2: Types of errors and misconceptions and their descriptions
Type of error/misconception Description
Random Non-systematic
Generalization over number Disregarding the different properties of
different numbers
Generalization over operations Disregarding the different properties of
different operations
Ignorance of rule restriction Applying a rule where it does not apply
Incomplete application of rule Ability to apply a rule but not able to proceed
Interference of existing learning/knowledge Existing schema in conflict with the new
schema

27
2.4.5.1 Random errors
These would be errors or misconceptions with no traceable or cognitive mathematical reference.
These are what Luneta and Makonye (2010) refer to as lapses or unintended mistakes.
2.4.5.2 Generalisation
As it has been established that mathematics learning involves some form of generalisation
(Kieran, 2004; Mason et al., 2005), it so happens that learners over-generalise. Over-
generalisation happens in at least two ways. These would be over numbers and over operations
(Olivier, 1989).
Generalisation over number (and number properties)
This according to Olivier (1989) is regarded as the deep level procedure from the two levels
which guide cognitive functioning. An example of this form of over-generalisation could emanate
from a situation whereby a learner is asked to find a solution to an equation which may perhaps
be presented in the form 𝑎 × 𝑏 = 0. Indeed with this form of an equation it does allow for one
to proceed by saying 𝑎 = 𝑜 𝑜𝑟 𝑏 = 0, due to a property of a zero as opposed to that of any other
number. Building up to a level at which this study is conducted; this applies prevalently in
solutions to quadratic equations. The knowledge that a quadratic equation which factorises to
(𝑥 − 3)(𝑥 + 5) = 0 would yield two linear equations 𝑥 − 3 = 0 and 𝑥 + 5 = 0 may be generalised
over to a situation whereby the right hand side of the equation is not a zero. A learner may
presume that because the above is true and mathematically justifiable, another equation which
may appear as (𝑥 − 1)(𝑥 + 4) = 6 for example should similarly work out to 𝑥 − 1 = 6 𝑜𝑟 𝑥 +
4 = 6 incorrectly resulting with 𝑥 = 7 𝑜𝑟 𝑥 = 2. This is an example of generalisation which
disregards the difference in properties of numbers.
Generalisation over operations
This may be seen at a stage when a negative number is introduced. For example with a correct
statement (+7) + (+2) = (+9), which bears no different answer to (+2) + (+7) due to addition

28
having a commutative property, a learner may erroneously think that (+9) − (+7) = (+7) −
(+9). This would be taking the commutative property of the addition operation and over-
generalising it to the subtraction operation, which may also apply buy treating the subtraction
operation before the 7 as detached from the number. The error is normally caused by the comfort
we have when writing a positive number with no plus sign in front of it. Learners tend to transfer
the same convention to the process of working with negative numbers, in which it applies slightly
different, hence (+9 − (+7) is incorrectly taken as equalling to (+ 7) − (+9).
2.4.5.3 Interference
It is generally believed that errors and misconceptions tend to be difficult to eradicate due to the
existence of phenomenon learnt at an earlier stage (Smith, et al., 1994). When a new idea is
introduced, it has to be accommodated or assimilated into the existing schema. In some cases the
process turns out to be unsuccessful, and that’s when a learner gets faced with interference. For
example, a learner may take 42 which in essence equals to 4 × 4 which equals to 16, and rewrite
it as 4 × 2 = 8 due to the frustration which may emanate from interference.
2.4.5.4 Ignorance of rule restriction
This would be applying a rule where it does not apply. For example, taking a rule which was
applicable in one domain and force it to apply in a different domain. The example of this may be
found from ordering of decimals (Olivier, 1989). The knowledge that the more the digits in a
number, the bigger the number is a conception in the whole number domain, but a misconception
in a fractional domain, and produces an error that: 0,345 > 0,5.
2.4.5.5 Incomplete application of rule
This would be seen from where a learner applies a rule correctly, and then not be able to proceed
to the next step of the solution.

29
2.5 Remedial Teaching/Intervention
To achieve the objective of this study, I need to focus on three components of the process of
teaching and learning. These are the teacher, the learner, the interaction between the two as well
as the learners’ interaction with the subject. This is despite the fact that my primary focus will be
the learners and the way they learn functions. This remedial or interventional teaching as mainly
influenced by Smith et al. (1994) as they argue that, while research should identify errors and
misconceptions, it should propose appropriate instructional approach to engage learners in a
process of examining and refining their conceptions. Instruction should be designed in a way
that it creates an environment whereby learners are able to internalise the competition between
conceptions and misconceptions.
The approach should also incorporate instructional aspects whereby a teacher can pay attention
to learners’ thinking. Teachers can achieve this through the following (Prediger, 2010):
• Develop interest in students thinking
• Develop interpretative attitude of understanding from the inner perspective
• Develop general knowledge on learning processes
• Develop domain-specific mathematical knowledge for teaching and analysing
In acknowledging a learner as a thinker in relation to constructivism, it is important for a teacher
to focus on learners’ process of thinking while teaching or listening to the learners’ input or even
reading text produced by a learner in an attempt to provide a solution to a mathematics problem.
I have explained the process of constructing knowledge in constructivist’s terms above, and now
I link that process to a learner’s process of thinking. Brodie and Berger (2010) posit that the role
of a teacher in facilitating the learners’ process of constructing knowledge needs to be way more
than just explaining only correct ideas and procedures to learners. The teacher needs to
incorporate in his/her teaching, some complexity which enables her/him to develop strategies
of becoming aware of learners’ errors and misconceptions, which can be used to shape up, guide
and enhance learning (Borasi, 1994; Brodie, 2007 and Olivier, 1989).

30
It is through this role that a teacher involved in this situation is able to make the most of his/her
students’ thinking. In doing this, a teacher needs to acknowledge the fact that it is a learner who
constructs the mathematical knowledge, and develop from interacting with the information they
receive. This can be achieved by creating an environment that enables and supports maximum
classroom participation, which provides a platform for conceptual learning (Kazemi and Stipek,
2001).
2.6 Conclusion
I began this chapter by discussing earlier studies done on mathematics errors and
misconceptions by learners which revealed that much as errors were identified by some
literature, it remained the increasing need to find out if much can be done with them. The
chapter goes on to reveal the difficulties learners experience when dealing with the function
concept. That is, a great deal of literature identifies the errors made and misconceptions
displayed by learners on functions and on other sections of the mathematics curriculum such
as logarithms. However, not much is said on how to deal with the situation whereby errors and
misconceptions are displayed by learners. Hence my proposed study seeks to establish if
teaching focusing at the errors and misconceptions could be one of the ways of dealing with this
predicament. I discussed these issues from the constructivist’s perspective and also introducing
other theories of learning such as the APOS and the Socio-cultural theory. I used these theories
to discuss how learning takes place and also roped in the variation theory to design the
intervention which was focused at the errors made by the learners as well as the
misconceptions which may have resulted with these errors. I further went onto the conceptual
framework which introduced the lens I used in looking at the data collected.

31
CHAPTER 3: METHODOLOGY AND RESEARCH DESIGN
3.1 Introduction
In this section I present, discuss and explain the constructs of the methodology I employed in a
variety of stages throughout the data collection process. In addition to that, I discuss the validity
and reliability of the methods whereby I address the risks that come with the methods I chose. I
also explain clearly the procedures I used to sample the subjects, the instruments and tools I used
to sample the data, as well as the ethical considerations I adhered to during my study.
The purpose of this study is to firstly identify the errors which grade 11 learners make and
misconceptions they display from the function concept. After identifying the errors and
misconceptions, I establish if teaching the concept focusing at the errors made and the
misconception displayed by learners from their written work would yield possible learning
affordances or opportunities to learning the concept. This is a qualitative study on the topic of
functions.
3.2 Qualitative study
The qualitative paradigm I employed for this study is constructivist in nature. Its epistemological
view is that knowledge is a product of a human mind, and that understanding about knowledge
and the world happens as a result of collaboration between the researcher and the participants
(Hatch, 2002).
Structured as a case study, this research is regarded as one of the main methodologies in a
research design (Goldin, 2008). It is of interpretive nature and seeks to gather data from a small
sample of a population for descriptions using the analysis of text in order to obtain a bigger
abstract meaning of the findings (Creswell, 2012). Sampling for this study need not be a
representative of the population; hence I did a purposive sampling. All I needed to ensure when
doing this non-probability sampling was covering the main groups of the area of interest. That is
the group from which I am likely to get more credible data for the purposes of this study. This
been said, it is worth noting that although I conducted pre and post-test on a convenience sample

32
of 24 grade 11 learners at a secondary school. I went further to get a non-proportional purposive
sampled group of 6 learners for qualitative analytical purposes. To widen the data collection
spectrum while ensuring that indeed I get data to work with in line with the problem statement,
I used the top two learners, the average two, as well as the bottom two in terms of their
performance on the pre-test.
Another aspect to consider is that my study mainly seeks to discover patterns which would assist
me in answering questions such as ‘what’, ‘how’, and ‘why’. Nevertheless, I will at the end, in
passing, talk about the overall comparison of learner performance between the two tests (i.e. the
pre-test and the post-test) which will also certainly serve to answer the research questions. The
analysis will still be qualitative as it resorts mainly to describing variations, relationships and
individual experiences of the subjects (Creswell, 1998).
3.3 Research design
This is a case study which involves a pre-test, the remedial teaching by the mathematics teacher
at the school while I observe him giving two lessons (each lasting for four hours with two 15
minute breaks in between), and conducting a post-test thereafter. I have conducted an interview
with the learners in order to establish what their overall perception of the situation and the
findings is, as well as to close the possible gaps which may emanate from their unclear attempts
to carrying out the problems in the written tests.
I have chosen this method because I needed the findings of my study to meet research
requirements with study reliability as well as validity (to be discussed in details later). The two
features of assessment are defined in various forms by a variety of authors. However, Opie (2004)
has adopted Wellington (2000)’s definition of reliability as “the extent to which a test, or a
method or a tool gives consistent results across a range of settings, and if used by a range of
observers” (p 66). On the contrary, he defines validity as the degree to which a procedure, or an
assessment/evaluation or a test measures what it is supposed to measure. I adhere to these two
measures in order to strengthen the trustworthiness of my study.

33
3.4 Participants
The sample of subjects I used for this study was based on the principle of convenience. It was a
group of six learners from a secondary school in the Gauteng province (i.e. a province where I
live and work). The sample was obtained from a class group of 31 grade 11 mathematics learners
taught by a teacher I once worked with in another project. Through ethical considerations, the
participants were also granted an opportunity to decide whether they wanted or did not want to
take part in this study. The entire class group was invited to write a pre-test, to attend the
remedial teaching sessions and to sit for the post-test although the focal point of this qualitative
study was the six learners I sampled purposively to meet the needs and objectives of my study.
These were the learners whose performance ranged from top to bottom in the sense that two of
them obtained the highest mark from the pre-test, two got average marks and the other two got
the lowest marks from the pre-test. It is also important to note that although the entire class
group was invited for the abovementioned class meetings, 31 learners were available for the pre-
test and for day one of the intervention, whereas 24 learners pitched for day two of the
intervention as well as for the post-test. The six learners I sampled were available throughout
the study period which include even for the interviews.
3.5 Procedure
I have conducted my research in South Africa, at a secondary school in the Gauteng province
involving one teacher and a convenient sample of between 31 learners (who were available for
pre-test) and 24 learners (who came for the post-test). These learners wrote a one and half hour
knowledge test on functions. Thereafter I marked the test and applied a non-probability
purposive sampling in selecting six scripts with learners’ responses on the pre-test which I have
analysed. This purposive sampling is non-probability because the results of this study are to
generate theory rather than to test or to prove an existing theory. I chose this particular school
and this very grade 11 class group due to convenience in that I worked with the class teachers in
a different project without hassles.
Consistent with these sampling techniques, Palys (2008) suggests that at times cases of extreme
nature are of high level of interest because they tend to represent a most clear-cut instance of a
phenomenon a researcher might have interest in. In attempting to align theses chosen sampling

34
techniques with the objectives of my study, I also employed the maximum variation sampling. A
combination of these sampling techniques assisted in maximising the probability of finding
errors throughout the entire learner performance spectrum in this class group. It enabled me to
identify errors made by learners at different levels of performance which gave me a wide spectra
of performance to work within.
This sampling procedure involved taking the top two performers, average two according to the
class performance as the last two learners were those at the bottom end. After analysing the
errors and misconceptions from the responses of the 6 learners, then I conducted a coaching
session with the teacher whereby I presented to him the nature of errors and misconceptions
which I have picked up from the initial analysis and also the possible misconceptions which may
have led to the learners committing the said errors. As someone who is highly experienced in
teaching the subject at Further Education and Training level, the teacher also made his
contributions during my discussion of the learners’ errors with him. This conference with the
teacher I did with the purpose of creating some awareness with him, which assisted him with the
approach when preparing for the remedial teaching. The meeting enabled him to pay attention
to specific errors made and also linking them with misconceptions from which the errors are
possibly rooted, bringing in the theory of variation in the teaching. Some of the other aspects I
discussed with the teacher was the importance of paying attention to the learners’ strategies
when conducting remedial teaching as it is also possible to get the roots of the misconceptions
from learners’ verbal responses and address them as they come (Coles, 2002; Nicol, 1998; Davis,
1997 & Chamberlin, 2005). Because it was not so easy for me to trace and ascertain the rationale
behind some of the ways in which the learners responded to the test questions, I had to conduct
the interview with a few of them. I interviewed the purposive selection of six learners to
interrogate the details regarding their responses and made affirmations of some of what I
suspected was the case when it came to the possible caused of the errors they made. The
interviews I also used as means to collect data mainly to close possible gaps which emanated
from the data I have captured from the analysis of the learners’ test responses. Although the
selection of the learners to interview was dependent on the nature of written responses I got
from their test scripts, I preferred to use the same six learners whose test papers I had selected
to work with in identifying the errors and misconceptions. Indeed the interview phase went on

35
successfully whereby I got some insights to do with the strategies the learners used in answering
the questions.
Thereafter, I went on to observe the teacher teaching the concept of functions to the same
learners focusing at the errors and misconceptions which I have identified and discussed with
him. After observing the intervention, I conducted a post-test with the learners. The same
learners whose responses to the pre-test I used for identification of errors and misconceptions, I
used once again for the analysis of the post-test responses and for comparisons thereof between
their performance on the pre-test and post-test.
It is of high importance to once again note that the research aims to establish the errors that
learners make and misconceptions which learners may have on the topic functions at grade 11
level. Secondly, the research explores the learning opportunities and/or limitations to learning
when a teaching intervention is used to address the identified errors and misconceptions. Lastly,
the research aims to determine the cognitive growth if any of learners as a result of this teaching
intervention. It is for this reason that I had to use a variety of research instruments so that I am
able to gather data sufficient to assist in answering the research questions.
3.6 Research Instruments
As I have mentioned above, I used written tests, interviews and observation schedules. I resorted
to using various research instruments for various purposes. Just as Opie (2004) would posit that
questionnaires are those tools or instruments which can be used to answer questions ‘what’,
‘where’, ‘when’ but not so easy to answer a question ‘why’. This makes questionnaires to be
insufficient for when one intends to explore information in more details. On the other hand
interviews may be structured in a way that they can provide an answer to the question ‘why’,
which the questionnaire is not able to answer (Opie, 2004). My study on the other hand is not
concerned with what the subjects think they can do, instead it seeks to discover what they can
and cannot do. My intention is to measure their capabilities, i.e. what they can actually do and
what they have difficulties doing, as well as why they did what they did. Thus the kind of data I
would like to collect is more cognitive as opposed to the affective or emotional nature of data
(McMillan & Schumacher, 2010). My research questions as mentioned above are strictly

36
concerned with the learners’ mathematical conceptual knowledge of functions. Below I discuss
and critique the instruments I have chosen to use for my study.
3.6.1 The Written Test (Pre-test & Post-test)
I conducted a pre-test on functions to determine the errors learners might make when answering
questions on this topic as well as the misconceptions the errors may be attributed to. After
identifying their errors and misconceptions using the pre-test, I together with the teacher, put
together an interventional teaching approach which is designed to be directed at the identified
errors and misconceptions. After the interventional teaching of the function concept, I conducted
a post-test with the same learners who wrote the pre-test in order to find out the nature of
opportunities afforded by the teaching which is focused or directed at the errors and
misconceptions. I thereafter made an analytical comparison of learners’ performance between
the pre-test and the post-test to validate the answers to the third question while to a certain
degree that also added more justification to the answering my second research question.
McMillan and Schumacher (2010) present a wide variety of tests by which they raise the critical
key aspects when it comes to a researcher deciding on the nature of test he/she would like to
employ in their study. As much as I have chosen to use a written test as my main data collection
instrument, I needed to know what kind of test I was to use and why this particular kind. First of
all, as I have mentioned above, to answer the research questions for this study, I needed to design
and conduct a cognitive written test. A test which measures what the learners know, understand
and can do on the topic of functions, instead of what they think they know, believe they
understand and think they can do. I avoided a more affective kind of test as my research questions
or my study in general has its interest lying on conceptual knowledge and understanding.
Within the family of tests, there is still what is referred to as standardized tests. These are tests
which are set to test general content and administered under specific set instructions. These tests
may be administered nationally or over a large scale to establish or measure general learning
acquired. Due their nature of design or development standards, the standardized tests tend to be
adequately valid and reliable. Still in that case I could not use them as I needed to develop or
compile the test in line with the content of interest for my study. However, to maintain some
element of reliability and validity for the test, I designed it using past National Senior Certificate

37
(NSC) examination papers (which are standardized and used for learner promotions). I have
made certain that the test items measure learning of what is stipulated as examinable by the
National Curriculum Statement (NCS – CAPS, 2011). I also made certain that I administer the first
test (i.e. the pre-test) after the learners had been taught the topic by their teacher at normal
contact time as guided by the provincial pace setters/ Annual Teaching Plan (ATP) from the
Gauteng Department of Education (GDE). However, this initial stage during which the learners
were taught the concept of function by their teacher earlier in the year was not part of this study.
What matters was that it was evident from the learner’s workbooks that they have been taken
through functions earlier in the year, hence I pitched my pre-test at the level relevant to the grade.
What was also very important to me was paying attention to the paradigm in which I based my
study. Certain research paradigms go hand in hand with particular research tools or data
collections instruments. Hatch (2002) argues of various research paradigms. In his work he
defines the five research paradigms in terms of ontology, epistemology, methodology and
products. The five research paradigms he discusses are Positivist, Postpositivist, Constructivist,
Feminist and Postculturalist. As I have mentioned above, certain research instruments may be
more suitable for particular paradigms than for others. For example, with its known limitations,
a questionnaire is good at collecting data which have something to do with people’s feelings
(and/or attitudes). It is therefore more suitable to a Feminist paradigm. Similarly I found a
knowledge (cognitive) test more suitable for the research that is done in a constructivist
paradigm, and the nature of data collected. I needed it to be more about the knowledge than the
attitude. This however does not mean that a study done in a constructivist paradigm may not
employ a questionnaire.
For my study, I have decided to use a test as the primary tool for data collection as I have earlier
on mentioned. Designing a good test may be a daunting process as up and above its validity and
reliability, there are other factors which need to be taken into consideration such as the
relevance, the level of difficulty, the nature, the length of the test, etc. There are standardized tests
and locally developed tests (McMillan & Schumacher, 2010) as well. The authors also allude to
cognitive and non-cognitive types of tests. A non-cognitive test they refer to as affective test,
which is based on the feelings of the subjects towards a certain aspect on which the research is
based, whereas the cognitive test is more knowledge based. Thus, it was important for me to
38
determine the type of test likely to be more appropriate in assisting me to answer the research
questions. Within the different types of tests there is also what is referred to as constructed
response tests, multiple choice tests, etc. (McMillan & Schumacher, 2010). In my research I have
chosen to avoid multiple choice and matching test items due to the following reasons (Burton,
Merrill, Sudweeks & Wood, 1991):
Multiple choice test items are not adaptable - they cannot be adapted to measure certain
learning outcome such as the candidate’s or subject’s ability to display thought processes,
perform specific task, etc.
They are not as reliable as the construct response test but better compared to the true or
false questions
Their reliability is weakened by their susceptibility to guessing
While they are not easy to construct, coming up with good optional answers for the
candidates to choose from consumes a great deal of time
Tests also have some limitations as well as advantages. However, in paying attention to the two
aspects, I have found ways of capitalizing on the advantages and dealt with the limitations in
order to improve their validity and reliability. The table below summarizes the advantages and
limitations of using a knowledge test as a data collection instrument.

39
Table 3: Limitations and advantages of a written test
Advantages Limitations
Generally people are used to writing tests – it may not be a new activity for the subjects
Tests are normally conducted in a controlled environment
Authenticity – the researcher would know exactly
that the test was taken by the person it was meant for
Time economy – time limits are normally set for
test completion Can be constructed to match a certain section of
the curriculum or to measure a certain skill Can be scored in straight forward manner Provides an objective information about what the
candidate knows and can do Tests are generally accepted as a credible
indicators for learning
Good tests are difficult to develop and consume time
Some subjects/candidates may
leave some questions unanswered
May be subject to corruption
through cheating May be simplified and superficial May be biased against certain
groups of test takers
So, when designing the test for research purposes one had to bear in mind the pros and cons,
and find better ways of dealing with the limitations.
3.6.1.1 How I dealt with the limitations of the written test
To ensure the test validity and reliability, I have firstly made sure that it covered three types of
functions dealt with up to grade 11 as per the National Curriculum Statement, i.e. the straight line
function, the hyperbola and the parabola as well as some algebraic arguments associated with
these types of functions. This covers a wide range of functions dealt with up to this level. As there
is no readily available test to be used in identifying learners’ errors and misconceptions, I had to
compile a new instrument using various past examination papers and my mathematical
knowledge as a teacher. This I structured in such a way that it would assist me in achieving the
aims of this proposed study.

40
I have also ensured that the test items used cover a wide range of cognitive demand from
knowledge, understanding to application according to the modified version of Bloom’s Taxonomy
As an example, the table below summarizes how the pre-test items are classified in terms of the
(modified) taxonomy of Benjamin Bloom (Bloom et.al., 1956). I have only analysed the pre-test as
the items are similar to those of a post-test.
Table 4: Analysis of the written test using the Bloom’s Taxonomy
Bloom’s Taxonomy Category
Description of Category Pre-Test & Post-test Items/Questions
Mark Allocation
%
Knowledge Exhibition of previously leaned material b recalling fundamental facts, terms, basic concepts, etc.
Q’s 1, 2.1, 2.2 10 22
Understanding Ability to grasp meaning of learned material. Example, of translation of material from one form to another
Q’s 4.1, 4.2, 4.3, 5.1, 5.2 and 5.3
19 42
Application Ability to use learned material in new and concrete situations
Q’s 2.3, 3, 4.4, 5.4 & 5.5
12 27
Analysis Identification of parts of material, analysis of their relationship and the organizational structure of the material
Q’s 4.4 & 5.5 4 9
The test also covers the three types of functions dealt with up to grade 11. These are straight line
and the equation defining it as 𝑦 = 𝑚𝑥 + 𝑐; the hyperbola generally defined by 𝑔(𝑥) =𝑎
𝑥+𝑝+ 𝑞 as
well as the quadratic function whose general form may be ℎ(𝑥) = 𝑎𝑥2 + 𝑏𝑥 + 𝑐.
I also gave the test instrument to an experienced mathematics teacher to quality assure in terms
of the relevance, the standard and the quality. Issues picked up during the quality assurance I
took into consideration when I finalized the tests. The same structure I used to construct the post-
test (refer to Annexure B).

41
3.6.2 The Interview with the Learners
It is important to consider the nature of your research questions so that the data collection
method used is appropriate and can assist in answering the research questions. Some questions
may easily be answered by data collected using certain instruments than others. Questions such
as, what is the learners’ attitude towards mathematics? , may simply be answered by an interview
or a questionnaire. As Opie (2004) argues that while a questionnaire may not be good at
answering the ‘why’ questions, an interview on the other hand can be structured to collect data
which answers the ‘why’ question. Therefore, it was important for me to have a full
understanding of my research questions before deciding on the appropriate data collection tool
to use.
There are various types of interviews which serve different purposes. Researchers employ
certain types of interviews to suit their research needs and to dig out possible answers to their
research questions. Among a variety of types of interviews, there are one-on-one interviews,
focus group interviews, telephone interviews, email interviews (Creswell, 2012), which can
further be classified as structured, semi-structured and unstructured interviews (Basit, 2010).
Like any other data collection method, interviews have their own disadvantages and advantages.
Basit (2010)’s view of an interview (especially the structured interview) is that it only differs
with a questionnaire by that with the interview, the respondent answers questions orally and the
researcher is the one writing the answers, whereas with a questionnaire, everything is done on
paper. She argues that as one of the advantages of interviews, there are very high chances that
100% of questions can be answered in an interview than in a questionnaire as the interview
involves personal interaction between the interviewee and the interviewer. Thus, to avoid issues
of having some questions unanswered, I chose to propose the use of an interview in this study.
I decided to employ the semi-structured interview which I did on the one-on-one basis with the
respondents. Unlike with the structured interview, the semi-structured interview enabled me to
probe and ask follow-up questions depending on what the initial response of the interviewee is,
relative to the question. Although the interview was audio-recorded, and then transcribed later,
I have strictly observed the requirement of anonymity throughout the process as a way of being
ethically considerate.

42
To deal with the issues of possible bias, as it is impossible to eliminate biasness in interviews
(Basit, 2010), I was as open minded as possible about the questions and repeatedly requested
the respondents to cite examples and even expatiate their responses further so as dig out as much
insights as possible.
3.6.3 The Class Observation of the Intervention
Although the lessons presented by the teacher in the form of an intervention were not my main
focus in this study, I still had to touch slightly on them in my report to ensure that the approach
the teacher used was indeed focused at the errors which were picked up from the pre-test as
well as the misconceptions which I managed to link them with. The observation process also
afforded me an opportunity to gather some information in relation to the errors and
misconceptions from the learners’ verbal interaction with the teacher.
The three methods of collecting data together serve to close any possible gap from that data.
Using three methods in the same study is named triangulation and supported by Denzin
(1978) who defines it as a combination of three different methods in the study of the same
phenomenon. It is believed that accuracy can be improved by using multiple methods of
collecting data for the study of the same phenomenon. The multiple methods I employed also
served to validate the data collected (Denzin, 1978).
There are other aspects of high consideration for when a researcher opts for an observation.
These are issues of ensuring the naturalness of the empirical setting. Descombe (2014) puts
forward that the researcher needs to position himself in a way that he does not interfere with
the proceedings through obstructing the learners’ view. Another aspect he raises is that of
ensuring that there is not interaction whatsoever with the subjects during the observation
process.
While bearing in mind the above considerations, I found the advantages of using an
observation a plus to this study. Observations yield direct data, they are systematic and
rigorous by nature, and can be reliable (Descombe, 2014).

43
3.7 Reliability and Validity
This I discuss as one of the most important considerations for my study. As indicated above,
the ways in which I planned to collected data for this study was vital in maximizing the degree
to which the data collection methods can be relied on and be trusted.
Reliability is the degree to which the instrument used in the collection lf data can be trusted to
yield consistent results if used in different research settings (with similar conditions) , and
following the same procedure and if used by different researchers (Opie, 2004). In my study
this would mean that if a similar instrument is used on the same subjects by a different
researcher, it should produce the same results, or results with not much deviation.
Creswell (2012) discusses the following five types of reliability: The test-retest, the alternate
forms reliability, the test-re-test and alternate forms reliability, interrater reliability and
internal consistency reliability. The first three forms of reliability apply when the researcher
is using one version of the data collection instrument. On the contrary, the latter two
approaches apply when two versions of the same concepts are used. Further to the
abovementioned differences, alternate forms of reliability approach apply to a situation
whereby two similar instruments are used to measure the same aspect. For this study I chose
to use a pre-test and a post-test which are similar to one another, both aiming at revealing to
the researcher the learners’ errors and misconceptions on functions as well as the extent to
which the teaching focused at the errors and misconceptions aid cognitive gains on the
function concept. The two similar tests I set at the same level of difficulty and out of the same
number of marks.
I began by administering the pre-test on day one1 of the data collection process. I marked the
pre-test and analysed it, had a coaching meeting with the teacher to discuss the errors made
and the teaching approach. We thereafter invited the learners for interventional teaching
sessions which lasted for 8 hours spread over two days. Thereafter I administered the post-
test within a reasonable time gap (i.e. on day two of the intervention). Minimizing the time gap
between the intervention and the post-test administration also improves the reliability level
of the process.

44
On the other hand, validity is a property of research which is regarded by some researchers as
being inapplicable or irrelevant to a qualitative study (Maxwell, 1992). However, the issue was
left with individual researchers to decide what features or criteria they can implement to
determine the validity of their different qualitative studies.
As defined by Opie (2004), validity is the extent to which a research instrument measures
what it is designed to measure. It is more related to the research questions, the findings and
the interpretation of the findings. To achieve the requirements of validity, the three research
questions were set to be answered by the research instruments as follows:
The first question was to be answered by the learner responses from the pre-test, the second
research question was to be answered by the findings from the observation together with the
post-test, whereas the third question was to be answered by the comparison of the learners’
responses from the post-test with those from the pre-test. Both tests I set using the National
Curriculum Statement and the newly introduced (NCS)’s Curriculum for Assessment and
Policy Statement (CAPS, 2011) document as a reference and grade level alignment purpose, as
well as the previous grade 12 standardized examination papers as sources for some test items.
All the learners were in the same grade and were taught mathematics by the same teacher. I
also gave the test to a mathematics teacher to quality assure it against the standard, the grade
relevance as well as its balance over the four criteria of Bloom’s Taxonomy.
3.8 Ethical Considerations
To cover the issues of ethical requirements, I have ensured that the empirical settings for my
study have been identified and cleared appropriately. Ethical clearance requirements were
dealt with at all levels. By this I mean that all ethical needs and requirements were adhered to
in totality. To start with, I have applied for ethics clearance to the Wits Ethics Committee and
was granted a permission to proceed with the study. Since I conducted this research in a
school, I have obtained permission thereof from the provincial education office as well as from
the school’s management team (SMT). Apart from that, I also obtained consent from the
parents of the learners whom I have had taking part in my study, from the learners themselves
as well as from the teacher. I have stated it clearly on the consent forms as well as on the
participants information sheets that none of the participants would be advantaged or

45
disadvantaged by taking part in this study, whereas the participants were also made aware
that they have all the right of withdrawing from this study at any time. All the participants have
as well been assured of the fact that pseudonyms would be used throughout the study and that
strict measures of confidentiality were to be adhered to.
I locked away any data collected from this research. I saved the e-version of it on a USB flash
disc with a password known only by me. I also sworn not mention anything which may have
transpired during the process of collecting data to any person. Confidentiality and anonymity
was maintained in any reporting on this study.
3.9 Data Analysis Strategy
Data analysis is a process of taking raw data, examining and converting it into meaningful
information (Hatch, 2002). It is something like a discussion between the researcher, the data
collected and the theory employed by the researcher to guide the process (Backman & Kungas,
1999). The process is complex in that it involves what Miles and Huberman (1994) describe
as the reduction of data, display of data and the drawing of conclusion from data (p10-14).
Data reduction is regarded as the main activity within the data analysis process, and referred
to as the process of selecting, abstracting and simplifying the data collected (p.11). This
process of condensing data requires all documentation used to collect data in the empirical
settings. The documents may include written test responses, observation notes, interview
notes, transcripts etc. As the follow up step from data condensation, data display is an
organised assembly of information that allows conclusion drawing” (p.12). The last step
would involve the process of drawing conclusions from the condensed and displayed data
(Miles & Huberman, 1994).
In order to perform the processes above, there needs to be an underlying legitimised approach
which is determined according to the nature of the study. For example, Thomas (2006) points
out the difference between two data analysis approaches mainly used in qualitative studies.
Those are the deductive approach and the inductive approach. A deductive approach involves
the analysis of data to test if the findings are consistent with prior postulates, theories or
hypotheses which the researcher structured before the commencement of their study. On the
other hand, the Inductive approach is the data analysis approach in which specific research

46
objectives serve as a guideline through the entire data analysis process. This is the approach
whereby readings and examinations of raw data is used to determine concepts or themes from
the researcher’s interpretation of data (Thomas, 2006).
In this study I have employed a hybrid of both approaches as I have used the conceptual
framework I developed to categorise data and did not limit the data collected to the
framework. Instead I left my data analysis strategies open to deductive analysis so as to
accommodate any possible finding which might fall outside of the framework. This strategy I
employed is consistent with Hatch (2002) who posits that in social sciences qualitative
studies, the two approaches may be used jointly.
The findings derived from the data analysed shall attempt to identify errors made by grade 11
learners when working out mathematics sums under the topic functions as well as establish
the misconceptions associated with the errors made. I would also like to establish if directing
the teaching towards the identified errors and misconceptions would in turn create learning
affordances and hence boost learners’ achievement on the topic functions or otherwise.
In an attempt to answer the research questions, I use the framework below as a guide
throughout the entire data analysis process.
Table 5: Different types of errors
Type of error/misconception Description
Random Non-systematic
Generalization over number Disregarding the different properties of different
numbers
Generalization over operations Disregarding the different properties of different
operations
Ignorance of rule restriction Applying a rule where it does not apply
Incomplete application of rule Ability to apply a rule but not able to proceed
Interference Existing schema in conflict with the new schema

47
3.10 Conclusion
This qualitative study consisted of different phases through which I collected data using a wide
variety of instruments. The study is on the errors that learners make, hence I had to conduct a
written test from which I used to identify the errors and also link them with probable
misconceptions. In linking the errors to misconceptions, I needed to validate what I thought
was the case by conducting interviews with the learners. This first phase I used to plan the
next phase which was the intervention. I met with the teacher to discuss the errors identified
and together mapped the way forward with respect to the remedial teaching or the
interventional teaching. The next phase was of observing the teacher teach and focusing
mainly on the six learners sampled although the entire class was still invited for the remedial
teaching. Thereafter the learners were given the post-test which then revealed the differences
in performance from the pre-test.

48
CHAPTER 4: DATA ANALYSIS
3.1 Introduction
The process data analysis involves taking raw data, examining, processing it and transforming
it into meaningful information (Hatch, 2002). The process is structured to flow systematically
and in line with the theoretical and conceptual frameworks the study is grounded on. For this
study, data was collected using various tools, viz. the written test, the observation sheets as
well as the interview schedule.
In this chapter, I present the analysis of the sampled learner responses to the pre-test
questions. I applied my conceptual framework to do the analysis, thereby identifying and
classifying the learners’ errors and misconceptions accordingly. In the analysis I have drawn
from the interviews which strengthened the links between the errors made and the
misconceptions the learners had and carried over to this topic of functions. In some cases the
interviews revealed the opposite of what I thought was to be the case. The chapter also covers
the discussion of how the coaching session with the teacher went by (although it was not the
main focus of this study), as well as the discussion of the actual intervention. I also present in
this chapter, the analysis of the learner responses to the post-test in comparison with their
pre-test responses, thereby getting a clear distinction between the two test responses per
question. The general comparison of leaner performance I did to establish the cognitive gaps
learners had before and after this special interventional teaching. I drew some of my findings
from comparing the learner responses on the pre-test and the post-test. The findings also
include further insights from the learners’ responses which I obtained from interviewing
some of the learners.
4.2 Analysis of Learner Responses to the Pre-test
This section outlines what was done in analysing the data collected throughout the research
period. As indicated earlier on, I used a variety of methods to collect data and analysed it in
accordance with the sequence I determined in line with the objectives of this study. Guided by

49
the research questions as well as the conceptual framework, I started by classifying the errors
which I picked up from the learners’ responses to the pre-test questions. While grouping and
classifying the errors I had to bring in the results of the interview to clarify the learners’
intentions in their responses, and determine the misconceptions to which I attributed the errors.
I therefore analysed the learners’ responses to the post-test questions to determine the answers
to the following questions:
4.1.1 What errors and misconceptions do grade 11 learners show on functions?
4.1.2 What learning affordances and/or constraints can be created if teaching is directed
at learners’ errors and misconceptions?
4.1.3 To what extent can the learners’ achievement on the topic functions be boosted if
teaching is directed at learners’ errors and misconceptions?
4.2 Error identification, classification and analysis
Question 3 Case 1:
Solve for 𝑥 and represent your solution using correct notation as well as graphically
if (𝑥 − 1)(𝑥 + 4) ≥ 6
Learner’s Response:
Figure 2: Learner response to pre-test question 3 (Case 1)
Error/Misconception Type: Generalization over number
This type of error results from the learner’s understanding of the rule to solving quadratic
equations that if we have factors a and b whose product equals 0, i.e. if 𝑎𝑏 = 0, then 𝑎 = 0
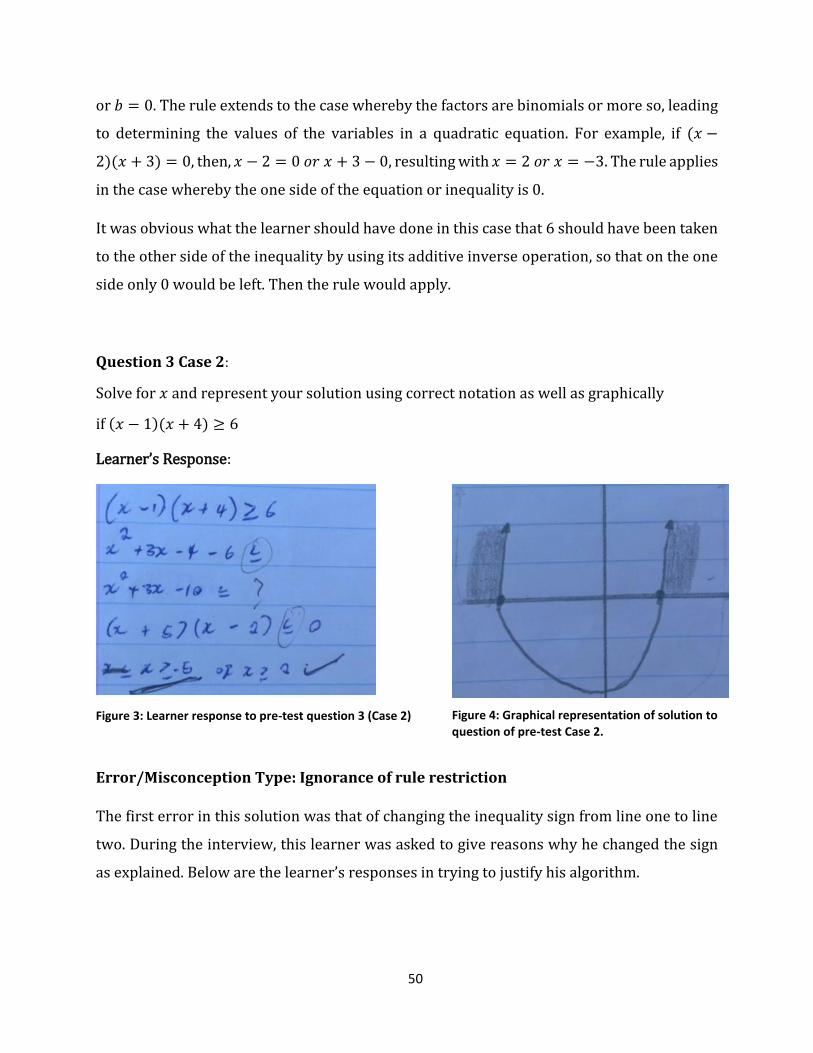
50
or 𝑏 = 0. The rule extends to the case whereby the factors are binomials or more so, leading
to determining the values of the variables in a quadratic equation. For example, if (𝑥 −
2)(𝑥 + 3) = 0, then, 𝑥 − 2 = 0 𝑜𝑟 𝑥 + 3 − 0, resulting with 𝑥 = 2 𝑜𝑟 𝑥 = −3. The rule applies
in the case whereby the one side of the equation or inequality is 0.
It was obvious what the learner should have done in this case that 6 should have been taken
to the other side of the inequality by using its additive inverse operation, so that on the one
side only 0 would be left. Then the rule would apply.
Question 3 Case 2:
Solve for 𝑥 and represent your solution using correct notation as well as graphically
if (𝑥 − 1)(𝑥 + 4) ≥ 6
Learner’s Response:
Figure 3: Learner response to pre-test question 3 (Case 2)
Error/Misconception Type: Ignorance of rule restriction
The first error in this solution was that of changing the inequality sign from line one to line
two. During the interview, this learner was asked to give reasons why he changed the sign
as explained. Below are the learner’s responses in trying to justify his algorithm.
Figure 4: Graphical representation of solution to question of pre-test Case 2.

51
Researcher: Oriah, Look at question three of your answer sheet. Initially we had the
inequality sign as implying that the product of these two binomials (𝑥 − 1)(𝑥 + 4) is
greater or equal to 6. Can you see that?
Oriah: Yes sir.
Researcher: On the second line I noticed that you have changed the direction of the
inequality sign…why was that?
Oriah1: Because I took the 6 to the left.
Researcher: Is that how it is supposed to be done?
Oriah: Yes sir, every time we change the sign we must change the inequality as well.
Researcher: What sign did you change?
Oriah: When I took the 6 to the left, it was positive, and I made it negative.
Researcher: I see….but this is not how it should be done.
In this situation, the error emanates from a rule of inequalities that when you divide or
multiply an inequality by a negative number, the sign of the inequality has to change the
direction. The learner here generalized the rule over a different scenario where it does not
apply. The learner stated it clearly that he changed the sign of the inequality because the rule
says that must be done anytime the sign of anything (variable or constant) changes in the
inequality. This seems to be an error associated with a learner’s misunderstanding of what
the teacher said when he dealt with this rule of changing the direction of an inequality sign
due to a multiplication or a division by a negative number.
Another error I picked up on the learner’s graphical representation of the solution and the
interpretation thereof (see figure 4 above). In his response the learner justified the last line
of the solution as follows:
1 Names used in this report are pseudonyms.

52
Researcher: Please let’s look at your graph now…and compare it with your solution
statement. You have 𝑥 ≥ −5 𝑜𝑟 𝑥 ≥ 2.
Oriah: Yes sir.
Researcher: As you look at your graph, I am happy with the 𝑥 ≥ 2 part but I am not
happy with the 𝑥 ≥ −5.
Oriah: Why sir?
Researcher: The graph does not agree with your statement that 𝑥 ≥ −5.
Oriah: Why sir? I think it does. Because I shaded above the x-axis, which means is
bigger.
Researcher: Do you know that the Cartesian plane is made up of two number lines
drawn perpendicularly…I mean at right angles to each other meeting at point zero?
Oriah: Number lines?
Researcher: Yes. It is just that one number line which we call the y-axis is not
horizontal, the usual way we draw a number line.
Oriah: Oh, I didn’t realize that. Now I see.
Researcher: Now, let’s draw one number line and call it the x-axis.
I then drew the number line and asked the learner to identify the numbers which are bigger
and those smaller than -5, which he managed to get right. The root of this error could be
associated with mixing up the y-values and the x-values on the Cartesian plane. What he said
that he wrote the one part of the solution as 𝑥 ≥ −5 because he shaded above the x-axis
suggests clearly that he confused the two (x and y-values). This is also just another error
which I have noted and discussed with the learner.
Question 3 Case 3:
Solve for 𝑥 and represent your solution using correct notation as well as graphically
if (𝑥 − 1)(𝑥 + 4) ≥ 6

53
Learner’s Response:
Figure 5: Learner response to question of pre-test 3 case 3
Error/Misconception Type: Ignorance of rule restriction
It is not clear what the learner’s intention was on line four of this solution. When he was
asked to explain what his aim was, the learner indicated that he was trying to remove the
sign. This was the first error noted in this attempted solution. The learner does have some
awareness that a radical sign can be applied somewhere in order to remove something. This
the error committed also because of having some algorithmic knowledge which is misplaced.
An example of the appropriate way in which this rule applies would be in the case below.
Solve for 𝑥 if 𝑥2 = 25. Learners are normally taught to solve it by applying a radical sign on
both sides of the equation in order to free the 𝑥 from the square on the left hand side as
follows:
√𝑥2 = ±√25
∴ 𝑥 = ±5
In this case the learner used the application of the radical sign to remove an inequality sign,
which was inappropriate.

54
Another error is picked up from between lines three and four of the solution whereby the
middle term on the left, 3𝑥, was changed to 5𝑥 without any explanation. When the learner
was asked to explain the logic between the steps his response was noted as on the following
dialogue:
Researcher: Thabo, please let’s have a look at lines three and four. There are two
things I would like us to talk about there. The first one is, how did the 3𝑥 in line three
change to the 5𝑥 in line four?
Thabo2: Sir…
Researcher: can you see what I am talking about Thabo? In line three, the middle term
on the left hand side is 3𝑥. But as we move down to line four, the same term is written
as 5𝑥. Why is that?
Thabo: It was a mistake sir.
Researcher: So, you wanted to write 3𝑥 as in line three?
Thabo: Yes sir.
Researcher: okay. Now let’s look again at line four. The root sign on the right hand
side. Why did you put it there?
Thabo: I saw this sign that I wanted to remove.
Researcher: Which sign?
Thabo: This one sir (as the learner points at the sign on his copy of the answer sheet).
Researcher: Okay, it is called an inequality sign Thabo. Why did you use the root sign?
Thabo: Sometimes when we solve for 𝑥 we use it.
Researcher: Okay, there are actually situations whereby you have to apply this rule
you applied here. In this case you were not supposed to apply the rule. Your teacher
will talk more about it in class but that sign you do not remove. It is the integrated
2 Names used in this report are pseudonyms.
55
part of this inequality statement. All you had to was take the 6 to the other side of the
inequality sign by its additive inverse as follows:
𝑥2 + 3𝑥 − 4 − 6 ≥ 6 − 6
𝑥2 + 3𝑥 − 10 ≥ 0
…then you factorize and solve the inequality.
Thabo: Oooh, okay sir. But was I not supposed to take the six to the left and change
the sign?
Researcher: Yes Thabo, that’s exactly what we did here. It is the same algorithm but
here we did it in detail. Taking the six to the left and changing the sign of the six is
short version if what we did.
Thabo: Okay.
Researcher: Another thing I am picking up is from the question paper. Let us look at
the question Thabo. It says you need to also represent your solution graphically after
presenting it using correct notation. Why did you not have a graph or a number line
on your solution?
Thabo: Sir, I didn’t know how to do it.
The reasoning provided by the learner on the dialogue above lead to what I have mentioned
earlier that the learner did not want to work with the inequality sign. He wanted to remove
the inequality sign and continue working on this sum as an equation as his knowledge of
solving quadratics was limited to equations. And going down with the solution, the learner
indeed continued working out the sum as an equation. The same error of avoiding to working
out the sum as an inequality was also picked up from Themba3 whose solution to question
three is below.
Question 3 Case 4:
Solve for 𝑥 and represent your solution using correct notation as well as graphically
3 All names of persons used in this report are pseudonyms.
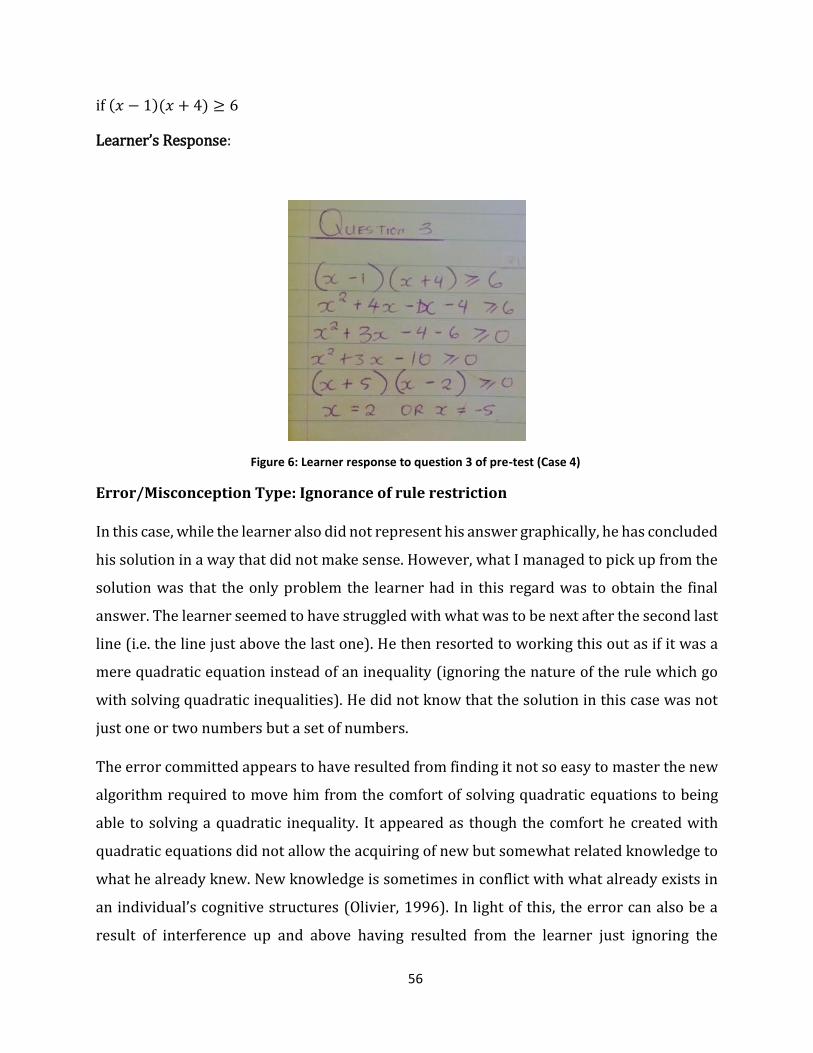
56
if (𝑥 − 1)(𝑥 + 4) ≥ 6
Learner’s Response:
Figure 6: Learner response to question 3 of pre-test (Case 4)
Error/Misconception Type: Ignorance of rule restriction
In this case, while the learner also did not represent his answer graphically, he has concluded
his solution in a way that did not make sense. However, what I managed to pick up from the
solution was that the only problem the learner had in this regard was to obtain the final
answer. The learner seemed to have struggled with what was to be next after the second last
line (i.e. the line just above the last one). He then resorted to working this out as if it was a
mere quadratic equation instead of an inequality (ignoring the nature of the rule which go
with solving quadratic inequalities). He did not know that the solution in this case was not
just one or two numbers but a set of numbers.
The error committed appears to have resulted from finding it not so easy to master the new
algorithm required to move him from the comfort of solving quadratic equations to being
able to solving a quadratic inequality. It appeared as though the comfort he created with
quadratic equations did not allow the acquiring of new but somewhat related knowledge to
what he already knew. New knowledge is sometimes in conflict with what already exists in
an individual’s cognitive structures (Olivier, 1996). In light of this, the error can also be a
result of interference up and above having resulted from the learner just ignoring the

57
restrictions posed by inequality sign and carries on as though he was working on an equation
instead.
Question 2.1 (Case 5):
Solve for 𝑥 in the following equation: 2𝑥2 + 7𝑥 = 4
Learner’s Response:
The question needed the x-values for the function.
Figure 7: Learner response to question 2 of pre-test case 5
Error/Misconception Type: Interference
In this case, Bontle’s errors are very subtle. However from step 1 to step 2, she lost the equal
sign, and apparently the positive 4 which was on the right hand side of the equal sign is now
together with the other two terms. From step 2 to step 3, the 2𝑥2suddenly became 4𝑥. The
only way to move from 2𝑥2to 4𝑥 is only through differentiation. There is no way I can say
that differentiation may be the source of misconception here which may have resulted with
the error because this learner is currently doing grade 11, whereas differentiation is only
introduced at grade 12 level.
Because it was not possible for me to identify the root of this error from the answer alone, I
had to attempt to get some clarity from the learner as to where exactly this interference was
rooted from by interviewing the learner.
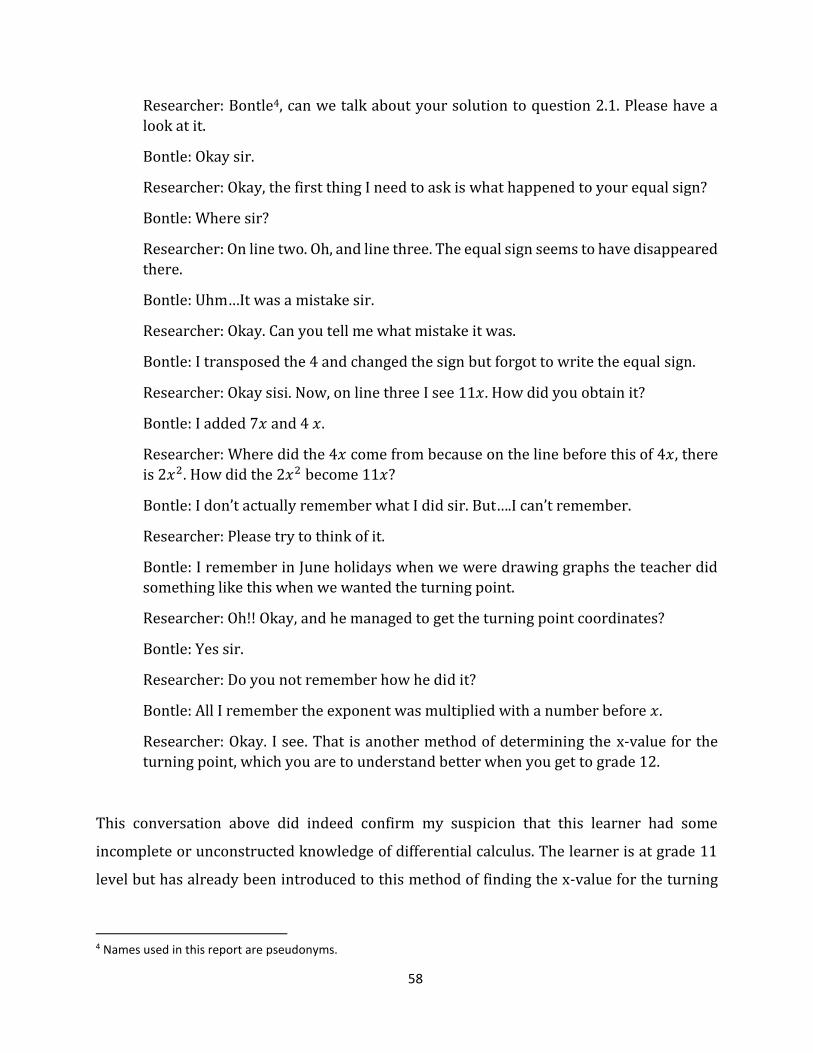
58
Researcher: Bontle4, can we talk about your solution to question 2.1. Please have a
look at it.
Bontle: Okay sir.
Researcher: Okay, the first thing I need to ask is what happened to your equal sign?
Bontle: Where sir?
Researcher: On line two. Oh, and line three. The equal sign seems to have disappeared
there.
Bontle: Uhm…It was a mistake sir.
Researcher: Okay. Can you tell me what mistake it was.
Bontle: I transposed the 4 and changed the sign but forgot to write the equal sign.
Researcher: Okay sisi. Now, on line three I see 11𝑥. How did you obtain it?
Bontle: I added 7𝑥 and 4 𝑥.
Researcher: Where did the 4𝑥 come from because on the line before this of 4𝑥, there
is 2𝑥2. How did the 2𝑥2 become 11𝑥?
Bontle: I don’t actually remember what I did sir. But….I can’t remember.
Researcher: Please try to think of it.
Bontle: I remember in June holidays when we were drawing graphs the teacher did
something like this when we wanted the turning point.
Researcher: Oh!! Okay, and he managed to get the turning point coordinates?
Bontle: Yes sir.
Researcher: Do you not remember how he did it?
Bontle: All I remember the exponent was multiplied with a number before 𝑥.
Researcher: Okay. I see. That is another method of determining the x-value for the
turning point, which you are to understand better when you get to grade 12.
This conversation above did indeed confirm my suspicion that this learner had some
incomplete or unconstructed knowledge of differential calculus. The learner is at grade 11
level but has already been introduced to this method of finding the x-value for the turning
4 Names used in this report are pseudonyms.

59
point of a graph, which in turn created a situation whereby new knowledge interfered with
existing and somewhat incomplete knowledge about a concept.
Question 2.2 and 2.3 (Case 6)
2.2 If 𝑓(𝑥) = 2𝑥2 + 7𝑥 − 4, find the coordinates of the Turning Point of 𝑓
2.3 Sketch the graph of f
Learner’s Response:
The learner attempted to answer the question as follows:
Figure 8: Learner response to questions 1.2 and 2.3 of pre-test (Case 6)
60
Error/Misconception Type: Interference
As the question clearly states, the learner was supposed to determine the coordinates of the
turning points. Instead, the learner determined the y-intercept of the graph of 𝑓, and used
the value thereof as the y-value for the turning point. It remained unclear how she obtained
the x-value for the turning point as there was no working out thereof, and neither the
interview was able to reveal the reason. However, the reason why the learner used the y-
intercept as the ordinate for the turning point has been established from the interview with
the learner. I found it vital to first discuss the possible root of this error.
The learner probably remembered or had knowledge that when sketching a graph, one
needs to determine the coordinates of the graph’s intercepts with the axes by substituting y
with 0 to obtain the x-values and similarly replacing x by 0 to obtaining the y intercept. As
mentioned above, it was unclear why she regarded the y-intercept she calculated above as
the y-value for the turning point of the graph of 𝑓. The subtleness from the way the learner
answered the question was clarified by the following dialogue between myself and the
learner:
Researcher: Lucky, please let’s look at question 2.2 on the paper and how your
response for it was structured.
Learner: Yes sir.
Researcher: The question required that you determine the coordinates of the turning
point for the graph of 𝑓. Why did your work it out the way you did?
Learner: How sir?
Researcher: Did you see that you made 𝑥 zero?
Learner: Yes sir.
Researcher: Why was that?
Learner: Because I was looking for the value of 𝑦.
Researcher: And….:
Learner: If I want the value of 𝑦 I must make the 𝑥 naught.
Researcher: And does that give you the y-value for the turning point?

61
Learner: Yes sir.
From the dialogue above, it appears as though the learner’s level of knowledge was still stuck
in the domain of lower order. In other words, there was no successful transition from the
grade 10 content to the grade 11 content in terms of the knowledge required to sketch
quadratic graphs. The learner’s knowledge was still at the level whereby the standard
formula of a quadratic graph is 𝑦 = 𝑎𝑥2 + 𝑐, which is the graph for which the y-intercept is
the same as a the ordinated for the turning point. This is the way in which a quadratic
function is introduced and dealt with at grade 10 level as per accordance with the South
African Mathematic curriculum. The error might have resulted from a poor or an
unsuccessful transition between the graph generally defined by 𝑦 = 𝑎𝑥2 + 𝑐 as mentioned
above, the graph whose general form is 𝑦 = 𝑎𝑥2 + 𝑏𝑥 + 𝑐, whose procedure for determining
the coordinates of the turning point is slightly different from that of the function in the form
𝑦 = 𝑎𝑥2 + 𝑐.
The learner carried over the knowledge which was correct and applicable for the graph
defined in general by is 𝑦 = 𝑎𝑥2 + 𝑐 and applied it on the graph defined by 𝑦 = 𝑎𝑥2 + 𝑏𝑥 + 𝑐
as a general form, where it is not applicable. The rule she applied is applicable in a certain
domain but does not apply in another domain of higher cognitive order.
The learners still has knowledge of the quadratic graphs from grade 10 that the y-intercept
is also the y-value for the turning point. This is the schema which needs to be improved by
acquiring knowledge of graphs of the form 𝑦 = 𝑎𝑥2 + 𝑏𝑥 + 𝑐 which have the turning point
away from the y-axis.

62
Question 1: Case 7
Complete the table below:
Table 6: Question 1 of the pre-test (Case 7)
General Form Type of Function
What information does each Letter give?
𝑦 = 𝑚𝑥 + 𝑐 1. 𝑐 4.
𝑔(𝑥) =𝑎
𝑥 + 𝑝+ 𝑞 2. 𝑝 5.
ℎ(𝑥) = 𝑎𝑥2 + 𝑏𝑥 + 𝑐 or
ℎ(𝑥) = (𝑥 − 𝑝)2 + 𝑞
3. 𝑎 6.
𝑝 7.
My intention here was to establish a level of learners’ conceptual understanding of algebraic
arguments determined by symbolic representations of various functions. I also wanted to
find out if learners can identify types of functions from their general symbolic forms.
Learner’s response:
Figure 9: Learner response to question 1 of pre-test (Case 8)
Error/Misconception Type: Random Errors
These are the type of errors which are not easy to associate with any prior knowledge and
hence difficult to classify. Some of them are what is referred to as unintended mistakes
(Luneta and Makonye, 2010).

63
As evident from the learner’s response above, most learners were able to identify standard
forms of each function. This is excluding just a few learners who did not even know the
difference between various forms of functions from their symbolic forms, like the learner
response above.
Sub-questions 4 to 7, the learners were not able to tell the implications of the letters in the
functions’ standard symbolic form. For example, one of the learners referred to the letter 𝑐
in 𝑦 = 𝑚𝑥 + 𝑐 as the turning point, whereas the other learner referred to it as the y-intercept,
but of a parabola. With learner 2, he was able to see that the letter c represents the y-
intercept in a graph but the problem was that she indicated that it is for a parabola whereas
the equation 𝑦 = 𝑚𝑥 + 𝑐 represents a straight line graph. With this learner, it may seems as
though the concept of a straight line graph does no longer exist as the last time she did
anything to do with a straight line graph was when she was in grade 10. The following is the
interview snippet with Ratanang:
Researcher: Ratanang5, in your answers for question 1, there is nowhere, where you
spoke of a straight line graph. Any reasons why?
Ratanang: Sir, I didn’t know we do straight lines.
Researcher: So you never did straight line graphs?
Ratanang: We did, but this year we didn’t do straight lines. In grade 11 there is no
straight line. It is only parabola, hyperbola and exponential.
Despite the fact that the errors made in this question are not easy to classify, it looks as
though the learner here thought what was done in the previous grade stays there, i.e. what
is to be learnt in a subsequent grade has nothing to do with what was learnt in the preceding
grade. One of the aspects to highlight when re-teaching the concept will have to be the
cumulative nature of the mathematics subject.
5 All names of people used in this research report are pseudonyms.

64
The learner also refers to letter 𝑎 as the x-value in ℎ(𝑥) = 𝑎𝑥2 + 𝑏𝑥 + 𝑐 and letter p as the y-
value in ℎ(𝑥) = (𝑥 − 𝑝)2 + 𝑞. As I have mentioned earlier, these types of errors are not easy
to classify as they seem to have emanated from random responses.
Question 2.1 (Case 9):
Solve for 𝑥 in the following equation: 2𝑥2 + 7𝑥 = 4
Learner’s response to the question
Figure 10: Learner response to question 2.1 of pre-test (Case 9)
Error/Misconception Type: Random
It was not clear what the learner’s reasoning was influenced by in this case, whilst not even
the interview could reveal it. However, it looked like the learner attempted to take out 2 as a
common factor but still it did not help as she did not do it correctly.
From the second line of the solution, 2𝑥2 + 7𝑥 − 4 = 0….was correctly rewritten from 2𝑥2 +
7𝑥 = 4. However, getting to 2(𝑥 + 4) (𝑥 −1
8) has no mathematical sense in it, hence my
classification of the error as random.

65
Question 4
The question was presented as follows:
Learner E’s response to Questions 4.1
Learner response to question 4.1 of pre-test (Case 10)
In the diagram below are the sketches of 𝑓(𝑥) =2
3𝑥 + 2 𝑎𝑛𝑑 𝑔(𝑥) =
𝑎
𝑥+𝑝+ 𝑞. The graph of 𝑔 passes
through (0; 4) and its 𝑥-intercept is at point𝐴.
4.1 Calculate the values of 𝑝 𝑎𝑛𝑑 𝑞. (3)
4.2 Calculate the value of 𝑎 (2)
4.3 Determine the coordinates of point 𝐴. (2)
4.4 If the value of p is increased by 1 unit, what effect will that have on the graph of 𝑔? (2)
Figure 12: Learner response to question 4 of pre-test (Case 10)
Figure 11: Question 4 from the pre-test

66
Type: Random Error/Misconception
Being one of the questions which were not responded to so well from the pre-test, question 4
also presented errors which appeared to not seem to have any form of classification. It was also
not easy or possible to get any valuable information from the interviews with the learners in as
far as this question is concerned.
Learner’s response to Question 4.2 (Case 11)
Error/Misconception Type: Generalization over operations
For question 4.2, the learner’s response display some interesting information (the last three
lines in figure 12 above). Notwithstanding what the learner did on preceding steps, the three
last lines appear as follows in the figure above:
2𝑎 = 3 + 0 + 4
2𝑎 = 7
𝑎 = 7 − 2
𝑎 = 5
Figure 13: Learner response to question 4.2 of pre-test

67
The learner left the solution at this point but she could have continued to wrongly find that her
value of 𝑎 is 5. This learner here applied the additive inverse rule where it does not apply
instead of using the multiplicative inverse. Notwithstanding the errors made before this one,
the learner could have proceeded by working out the sum as follows:
2𝑎
2=
7
2
𝑎 =7
2
(Although it still wasn’t going to be the correct value of a because of other errors made
before)
Question 4.4 (Case 12)
If the value of p is increased by 1 unit, what effect will that have on the graph of 𝑔?
Learner’s response
Figure 14: Learner response to question 4.4 of pre-test (Case 12)
Error/Misconception Type: Over-generalisation of concepts
The learner’s response in this case could be a desperate way to ensure she provides an answer
to the question. Whether the answer was correct or wrong was not an issue.
On the contrary the error here could simply be a result of generalization, which comes in a
different form from the ones listed in chapter 2. This is also considerate of the fact that
generalization is a vital aspect of learning mathematics. However, the way the learner
generalised in this case is at odds with the scientifically or mathematically accepted forms of
generalisation.

68
The graph of g is a function, which makes it insufficient to just say: “The graph of 𝑔(𝑥) will be
positive.” This however could be associated with the fact that when the graph is increasing at a
certain point, or between two points, the gradient of the graph there is positive. From that
domain the learner might have married the word ‘increasing’ with the word ‘positive’. That is
overgeneralization of concepts which are not mathematically compatible with one another due
to different domains in which they are applied.
Learner responses to question 5
The question involved interpretation of a function which was represented graphically with
partial information provided by the question statement. It was presented on the pre-test
paper as follows:
The graph below, which is not drawn to scale, shows a parabola with x-intercepts
at 𝐴(−3; 0) and 𝐵. The axis of symmetry has equation 𝑥 = −1 and the 𝑦 − 𝑖𝑛𝑡𝑒𝑟𝑐𝑒𝑝𝑡 is at
𝐶(0; −6).
Determine:
5.1 The coordinates of 𝐵. (3)
5.2 The equation of the parabola. (5)
5.3 The equation of the straight line passing through 𝐴 𝑎𝑛𝑑 𝐶. (4)
5.4 The length of 𝐴𝐶. (3)
5.5 The values of x for which 0xf . (2)
Figure 15: Diagram for question 5 of pre-test

69
This is the question which was very poorly responded to by the learners. This was for both
top end and bottom end learners, also including those whose performance was average. The
overall performance improvement on this question between the pre-test and the post-test
was very marginal, from 14.7% to 16.7%. This might have resulted from the following
reasons:
The parabola is normally taught last in the ATP, whilst the teacher also taught it last
when doing the remedial teaching
Interpretation of the parabola is more demanding cognitively as compared to
sketching of the parabola
Apparently it was because of this that whilst most learners left the question unanswered,
some just gave answers only with no working out, hence the it was not possible to analyse
the responses of learners to this question. Nonetheless, the learner responses from questions
1 to 4 were sufficient to provide insights for answering my research questions.
The Coaching session with the teacher
I met with the teacher outside the school premises whereby I first presented to him the
errors which I have picked up, and explained what I thought the roots of the errors were. We
further had a discussion on the misconceptions which end up making learners commit errors
while working out mathematical problems. We also discussed and strategized on the
teaching approach he was to use for remediation that its main feature needs to be that it is
directed at the errors which are picked up from the learners’ responses to the pre-test
questions. The teaching needed to also focus at the possible misconceptions which are
associated with those errors. There was also a deeper discourse we had on the theories of
teaching and learning which impinge the objectives if this study, namely, the variation
theory, constructivism, socio-cultural theory, the APOS theory and the concept image and
concept definition theory by Tall and Vinner (1981).

70
At the end of the session, the teacher went on to prepare a memorandum for the pre-test
paper and used both the memo and my presentation of the errors I picked up from the
learner’s responses to prepare a lesson to teach the concepts.
4.3 The Intervention Lesson
Referring back to the data collection process I explained in the research methodology, I
began with conducting a pre-test on a group of 34 grade 11 learners who had already been
taught algebraic functions. After the test was conducted, 6 learner scripts were purposively
sampled according to their performance (i.e. the top two performers, average two according
to the class performance, and the bottom end two). The errors picked up from these sampled
scripts are the ones presented, analyzed and discussed. An interview was also set up and
done with some of the six learners to get more clarity on their mathematical reasoning. After
the interview was conducted, notes were used to beef up the discussion and the analysis of
the errors and misconceptions picked up from the pre-test. The next stage from there was to
have a review, feedback and coaching meeting with the teacher who was to take up the
remediation session with the learners. I took him through the findings from the learners’
responses to the pre-test questions and also discussed with him the errors picked up and the
misconceptions which could be associated with the errors as well as the general theoretical
framework the remediation should adhere to.
Indeed the mini coaching session was conducted. After the mini workshop was conducted,
the teacher went on to prepare for the intervention/remediation session. The learners were
invited and the sessions were conducted over two days.
Session 1(Day one)
The teacher started by talking about what differentiates a person from the other in terms of
the country’s security system as a form of analogy. The learners were at first not really able
to relate but when he continued by mentioning the Home Affairs department then the
learners mentioned an Identity Document. The introductory conversation between the
teacher and the learner led to them talking about fingerprints. The teacher then referred to
the symbolical representation of functions as fingerprints that, the symbols chosen to

71
represent the functions are a way of making the mathematicians being able to distinguish
one function from the other in a family of functions. The teacher indicated that before they
can know the difference between functions, they will have a problem answering questions
relating to sketching the functions and interpreting graphs of functions as the curriculum
policy document requires.
The teacher went on to talk about how as people we tend to learn from our own mistakes,
and that in most cases, if we do not admit we are wrong, we shall have a problem learning
things correctly. In mathematics particularly, any wrong answer to a question has a root.
Teacher: Our aim is to identify the wrong answer, and then talk about the possible root of that
answer. That is, we have to dig out what may had caused you as a learner to writing that wrong
answer through discussing with you or through examining your answers. So, in these lessons,
when you suspect it is your answer I am happen to make an example with, please do not feel
bad because the idea is to ensure that you and others learn from the errors you made. I will
certainly not mention that the error was made by you.
This is how the teacher made learners feel at ease about the approach he was going to use
throughout the remediation lessons.
As the teacher carried on to talk about the symbols used in equations of functions, he
indicated that while some of the learners were not able to label the types of functions the
various general equations were representing, he indicated that the for example, in the
formula 𝑦 = 𝑚𝑥 + 𝑐, some learners did not correctly say what information the symbols or
the parameters communicate. The teacher also managed to present to the learners how
some of them confused the naming/identification of functions.
The teacher then gave a first task to the learners to work out whereby they were asked to
identify the wrong answers from the ones he wrote on the chalkboard. For the short time the
learners were given, only a few of them were able to pick some errors up. As the discussion
went on, the teacher wrote down the three examples of equations below and instructed the
learners to use the table method to sketch accurately on separate sets of axes.
Equation 1: 𝑦 = 2𝑥 + 1; {−3 ≤ 𝑥 ≤ 3, 𝑥 ∈ 𝑅}

72
Equation 2: 𝑓(𝑥) = 𝑥2 + 7𝑥 − 8; {−4 ≤ 𝑥 ≤ 4, 𝑥 ∈ 𝑅}
Equation 3: 𝑔(𝑥) = −1
𝑥+1+ 1; {−3 ≤ 𝑥 ≤ 3, 𝑥 ∈ 𝑅}
The teacher asked the learners to identify for him the shapes of the functions they had drawn.
Some were able to get definite shapes especially in the case of a linear function, whereas
some could not get all the three graphs correctly. When he went through the working groups
of learners to quickly check how they did, he indicated to them that some were not able to
get the correct values of y for the values of x they substituted into the equations. However,
he carried on to talk about what his expectations of the answers were like. From this exercise
the teacher was able to conclude with the learners the symbolic appearances of various
functions as well as their graphical appearances, and thus attach a shape (in graphical form)
to a symbolic representation of a function.
When the teacher moved on to the solutions to quadratic inequalities and representing them
in the form of graphs, he once again listed the errors that some of the learners made and
what could have led them to making the errors. He then gave a simple investigative activity
to get the learners to explore the instances (or rather operations) which command the
change of the inequality sign versus those that do not need the sign to change. The activity
was structured as follows:
Task one: Write down this inequality: 4 > 2 and tell if it is true or false
The learners wrote the inequality and most indicated it was true because indeed 4 is greater
than 2.
Task two: Multiply both sides of the inequality sign by the number 2 and write down the
answer, and tell if your statement is still true.
Within a short space of time some of the learners had already said their new statement after
performing the operation as per the teacher’s instruction was 8 > 4 and was true.
Task three: Divide both sides of the inequality by 2 and tell if your statement is true.
Some learners indicated within a short space of time that they obtained 2 > 1, and that it was
still a true statement.

73
Task four: Add the number 2 to both sides of the inequality sign and tell if the statement still
true or it is false.
They added the 2 as per the task instruction and got 6 > 4 , which was still a true statement.
Task five: Subtract 2 from both sides of the inequality sign and tell if the statement was still
true or false.
The learners without hassles mentioned that they got 2 > 0 and that it was a true statement.
For tasks 6 to 10 the teacher asked the learners to apply the same operations as from task 1
to task 5 above, but use the number −2 instead of the 2 they have used before. The learners
carried on with the operations and realising that when they divided and multiplied by −2 as
per the teacher’s instruction they got a false statement and thus had to change the direction
of the inequality sign. For example,
−2 × 4 > 2 × −2
…yielded…
−8 > −4,
…which was a false statement. They then had to change the direction of the inequality sign
to correct the statement and rewrote the statement as −8 < −4.
The above was an investigative task which got the learners to understand the basics of
working with inequalities and why sometimes the direction of the sign should be changed
after performing certain operations. The teacher then made asked the learners to make a
conclusive statement about when and when not to change the direction of the inequality sign.
As the teacher moved onto the actual grade relevant work, i.e. whereby learners had to find
the roots of quadratic inequalities and equations which lead to graphical representation of
functions, he used an approach of giving three similar questions which had to be answered
as follows:
Task one: Solve for 𝑥 in 2𝑥2 + 7𝑥 = 4
74
The teacher used the pre-test as the source of the first task all the time so that as he highlighted the
errors which the learners made, they could easily relate and see where and how they went wrong in
their attempts to respond to the pre-test questions.
Task two: Calculate the values of 𝑥 for the function represented by the equation below at
the point 𝑦 = 0.
3𝑥2 − 5𝑥 + 1 = 0
Task three: Find the roots of the equation: 𝑥2 − 𝑥 = 20
The task instructions were as follows:
For task one the teacher first presented the errors and the misconceptions to the learners
and guided the learners on how to work out the problem. The teacher then instructed the
learners to work out two in groups as he walked around to provide assistance where needed.
On successful completion of task two, the teacher instructed the learners to do task three
individually.
The teacher carried on with the same approach even on day two of the intervention. The
approach used by the teacher is schematically represented next:

75
Figure 16: A Schematic representation of the approach used for remediation
Session 2 (Day two)
On the second day of the intervention, only 24 out of the 30 learners attended the lesson. In
spite of poor attendance, the teacher started the lesson with presenting an overview of what
was covered on day one of the intervention, and went on to talking about more errors picked
up from their responses to the pre-test questions.
The teacher continued on day two by taking the learners through more ways of sketching
types of functions if they were provided with symbolic representations thereof. He gave
them a variety of examples with different levels of difficulty to attempt formatively as he was
going through the lesson with them.
The teacher also emphasized the implications of the algebraic arguments in relation to the
vertical and horizontal shifts of the two types of functions (i.e. the hyperbola and the
parabola) in graphical representation. The approach the teacher used on this day is the same

76
as the one he used on the first day. The session lasted for four hours (with two 15 minute
breaks in between) and followed by a post-test which lasted for one and a half hours.
The teacher presented the lesson over two days as mentioned above. In his presentations for
the two days, he was following the same approach as I discussed above, picking on the errors
which the learners made and addressing them with the learners while at the same time going
deeper into the concept matter to try and make the learners understand it better. These
lessons were spread over two days and took the form of a revision. I could also pick it up
from the teacher-learner interaction that the learners’ confidence levels were increasing as
the teacher went from discussing with the learners characteristics and behavior of various
functions to the actual ways of sketching graphs of functions.
Because of the limited time available, the teacher was not able to go in-depth into the
interpretation of functions which are represented in graphical form. That is, to take the
learners through a flexible conversion between symbolic and the graphical representation
of functions. However, with the content the teacher was able to cover, I was in a better
position to collect a substantial amount from data in line with the research objectives.
As I indicated in the methodology section, on day two, the teacher conducted a post-test with
the learners. Because of the ways in which I collected my data, I have divided my findings
into two parts whereby part one deals with identification of the errors, classifying and
analyzing them. Part two of the findings deals with the outcomes of the post test, i.e. the
learners’ responses on the post-test looking at the improvement from the pre-test.
4.4 Analysis of the Post-test in Comparison with the Pre-test Learner
Responses
Pre-test Question 1
Task: Pre-test Question
Complete the table below

77
Table 7: Question 1 the pre-test
General Form Type of
Function
What information does each Letter give?
𝑦 = 𝑚𝑥 + 𝑐 1. 𝑐 4.
𝑔(𝑥) =𝑎
𝑥 + 𝑝+ 𝑞 2. 𝑝 5.
ℎ(𝑥) = 𝑎𝑥2 + 𝑏𝑥 + 𝑐
or
ℎ(𝑥) = (𝑥 − 𝑝)2 + 𝑞
3. 𝑎 6.
𝑝 7.
Post-test Question 1
Complete the table below
Table 8: Question 1 for the post-test
General Form Type of
Function
What information does each Letter give?
𝑦 = 𝑚𝑥 + 𝑐 1. 𝑚 4.
𝑔(𝑥) =𝑎
𝑥 + 𝑝+ 𝑞 2. 𝑞 5.
ℎ(𝑥) = 𝑎𝑥2 + 𝑏𝑥
+ 𝑐
or
ℎ(𝑥) = (𝑥 − 𝑝)2 + 𝑞
3. 𝑐 6.
𝑞 7.

78
Learner Responses for Question 1 Pre-test and Post-test
At first these learners didn’t seem to have even the conceptual knowledge of functions. It
struck me as though they only did them superficially with not much emphasis by the teacher.
However, that was not the focal point of this study. From the two responses above, it is clear
that this learner had not much knowledge in as far as functions are concerned. Both the pre-
test and post-test questions were attempting to find out if the learners knew the difference
between various function graphs and their equations, as well as what each letter/parameter
in the equation represents. As picked up from the pre-test, the learners did not seem to know
what a hyperbola is for example and how it differs from a parabola and so on. For this
question I would not dwell much on as the error made thereof were just simple and could
easily be associated with lack of general conceptual knowledge pertaining to functions. What
is more important for this study is that the learner responses made the teacher aware of
where exactly they lack knowledge, and enabled the teacher to prepare his lesson based on
that. In his teaching of the concepts, the teacher had to start functions from scratch with a
bit of revision from grades 9 and 10 work as I mentioned in detail earlier under the remedial
teaching analysis section. His reason for doing this was the level of performance of the
learners on the pre-test and that if they do not have this basic conceptual knowledge of
functions, there would have problems answering correctly the questions asked thereafter.
As mentioned, key to this study is that the performance of the learner improved drastically
Pre-test Response Post-test Response
Table 9: Learners’ responses to question 1 of pre-test and post-test

79
pertaining to this concept question from the pre-test to the post-test as evident from the
table above that the number of errors made reduces substantially from the pre-test to the
post-test.
Pre-test and post-test Question 3
Table 10: Question 3 of and pre-test and post-test
Pre-test Question Post-test Question
Solve for 𝑥 and represent your solution using correct notation as well as graphically if (𝑥 − 1)(𝑥 + 4) ≥ 6
Solve for 𝑥 and represent your solution using correct notation as well as graphically if 𝑥(𝑥 + 7) < 8.
Learner responses for Pre-test and Post-test
Table 11: Question 3 learner responses for pre-test and post-test
From comparing the learner’s pre-test and post-test responses to this question, it is evident
that there was a cognitive shift in that her post-test response proved a better understanding
of the question, hence the correct solution with the correct graphical representation thereof.
The learner’s misconception that any piece of a graph that appears above the x-axis means
Pre-test Response Post-test Response

80
it is greater was clarified and yielded results as shown by her response on the post-test
question. In her pre-test response, the learner also changed the direction of the inequality
sign when collecting the terms to one side (i.e. moving the 6 to the left had side of the
inequality). That was an error noted and discussed with the teacher before he could re-teach
the lesson on functions. From the post-test question the learner’s response was in such a way
that when moving the 8 from the right hand side to the left, the inequality sign stayed the
same, which proves some form of clarification of the misconception the learner had. This
does not necessarily imply that the learner’s misconception was eradicated but for that
moment, the learner was afforded an opportunity for understanding the manipulation of
inequalities better.
Table 12: Question 4 for pre-test and post-test
Pre-test Question Post-test Question
In the diagram below are the sketches of
𝑓(𝑥) =2
3𝑥 + 2 𝑎𝑛𝑑 𝑔(𝑥) =
𝑎
𝑥+𝑝+ 𝑞. The graph
of 𝑔 passes through (0; 4) and its 𝑥-intercept is at point𝐴.
4.1 Calculate the values of 𝑝 𝑎𝑛𝑑 𝑞.
4.2 Calculate the value of 𝑎
4.3 Determine the coordinates of point 𝐴.
4.4 If the value of p is increased by 1 unit,
what effect will that have on the graph
of 𝑔?
Sketched below is the graph of 𝑔(𝑥) =𝑎
𝑥−𝑝+ 𝑞.
C (2; 6) is the point of intersection of the
asymptotes of g. 𝐵 (5
2; 0) is the x-intercept of g.
4.1 Calculate the values of a, 𝑝 𝑎𝑛𝑑 𝑞 and
write the equation of g in the form
𝑔(𝑥) =𝑎
𝑥−𝑝+ 𝑞.
4.2 If the graph of g intersects the y-axis at
point A, determine the coordinates
of point 𝐴.

81
Pre-test Question Post-test Question
4.3 If the value of p is increased by 1 unit,
what effect will that have o the graph
of 𝑔?
Question 4.1 and 4.2 Learner responses for pre-test and post-test
Table 13: Question 4.1 and 4.2 learner response for the pre-test and the post-test
In the pre-test, questions 4.1 was on determining the values of p and q as algebraic
arguments for the graph provided (see Appendix A) Question 4.2 was on determining the
value of a. On the other hand, the post-test had a similar question but all the values of a, p
and q were asked for in question 4.2
From the learner’s pre-test response for question 4.1, it was not clear whatsoever what her
intention was. The same applies to her response to question 4.2. However, when the learner
was presented with a similar question in the post-test, after the teacher used her pre-test
solution as an example when re-teaching the section, she did very well. When I interviewed
the learner in this case to attempt to establish the rationale behind working out solutions to
questions 4.1 and 4.2 the way she did, she could not remember what she did or she actually
just didn’t know why she did that. Nonetheless, that did not stop the teacher from showing
Pre-test Response Post-test Response

82
the rest of the class this solution anonymously as an example of errors which did not seem
to have any traceable root, and showing them how the solution could have been worked out.
This just shows that although in some cases errors were easy to classify, whilst I could also
easily associate them with a misconception which was built up or rooted from some either
incorrectly captured concept or incomplete mastery of a concept or even a wrongly taught
concept, it is still possible to teach learners for understanding even if the error committed
was not easy to trace back to a misconception.
Learner responses to Question 4.4 (Pre-test) & 4.3 (Post-test)
Table 14: Question 4.4 (pre-test) and 4.3 (post-test) learner responses
The question was testing the learners’ understanding of the transformation concepts on
functions. On the pre-test, the following was the question:
If the value of p is increased by 1 unit, what effect will that have on the graph of 𝑔?
The learner’s response as it can be seen from the table above was that the graphs will be
positive. It seemed as if the learner associated the word ‘increased’ in the question with
something positive. This was without any understanding of what the question was asking. The
remedial teaching addressed the matter generally by teaching transformations, whereby the
teacher stressed that when the graph shifts to the left or upwards, it does not always mean that
something is added to the graph equation. The teacher made use of several examples to explain
transformations and crushing strongly the learners’ incorrect view that when a graph is moved
to the left it means something is subtracted. This notion the learners had might emanate from
the everyday life of using the words decrease with negative and increase with positive, hence
Pre-test Response Post-test Response

83
learning involves the interaction of received information with what already exists in the
learner’s mind.
Question 5
The performance of learners barely improved from the pre-test to the post-test. During the
intervention, the section on interpretation of parabola graphs was treated last and not in-depth.
The following might be the reasons associated with non-improvement of performance thereof:
Teaching/learning all the three types of functions over 8 hours (even if it was spread
over two days) was daunting – learners got tired and could not acquire much
knowledge from the last section
Much as the interventional teaching was also serving as a revision lesson for the
learners in preparation for the end of year examination, the lessons were conducted
over the weekend
When the teacher was treating the parabola, most of the learners seemed exhausted
and not following
The next part of the data analysis I utilized to answer the third research question which was
phrased as follows:
To what extent can the learners’ achievement on the topic functions be boosted if teaching is
directed at learners’ errors and misconceptions?
Firstly it would be important to discuss the overall performance shift from the pre-test to
the post-test before I go on to the errors which were still picked up from the post-test. This
was also based only on the six learners whose scripts were used to analyze the errors picked
up from the pre-test responses.
The graphs below indicate the percentage shift per question in terms of the learners’
performance between the pre-test and post-test.

84
Figure 17: Graphical illustration of learner performance (Line Graph)
Figure 18: Graphical representation of learner performance (Bar graph)
I have represented the overall performance of the learners above on two different forms of
graphs for easier interpretation by the reader. The two graphs I obtained from comparing
the performance/responses of the six learners’ whose scripts I used for both the pre-test
analysis and the post-test.
The general view is that there is an improvement of performance from the pre-test to the
post-test on all the 5 questions asked, which also talks to the reduced number of errors made
38.3
29.620
27.814.7
81.7
30
53.3
44.4
16.7
0102030405060708090
100
Question 1 Question 2 Question 3 Question 4 Question 5
Ave
rage
%
Line Graph on Learner Performance per Question
Pre-test Post-test
38.3
29.6
2027.8
14.7
81.7
30
53.3
44.4
16.7
0
10
20
30
40
50
60
70
80
90
100
Question 1 Question 2 Question 3 Question 4 Question 5
Ave
rage
%
Bar Graph on Learner Performance per Question
Pre-test Post-test
Both the Pre-test and Post-test
papers were set suing the
Bloom’s Taxonomy with the
knowledge, understanding,
application and analysis
categories. Question 1 consists
mostly of knowledge
questions, question 3 and 4
are mainly composed of
understanding, application
and analysis questions,
whereas question 2 was
mainly testing the learners’
knowledge and application.
The graphs alongside
illustrate the performance
comparison between the pre-
test and post-test conducted
with clear indication of
performance gains thereof
especially on questions 1, 3
and 4. Although there was
some improvement of
performance, some learners
still struggled with application
and analysis questions.

85
on the post-test. The improvement of performance on average ranges from a gain of 0.4%
obtained in question 2, to that of 43.4% obtained in question 1. In this section of the findings
and their analysis I will discuss by comparison the nature of errors made by a learner when
answering the pre-test with the very same learner’s post-test response.
4.5 Discussion
The central objective of this study was to explore students’ errors and misconceptions, and
determine if the results of their analysis can aid the process of learning the function concept
by grade 11 learners provided the approach used is directed at those errors and
misconceptions. The study was proposed with the assumption that from the learners’
responses to the pre-test questions, there were going to be errors which could be linked with
misconceptions rooted from elsewhere. There is a challenge I came across when attempting
to carry out the analysis of the errors the learners made due to the difficulty of understanding
the rationale behind their ways of approaching and solving the questions the way they did.
However, I had an interview scheduled to validate whatever ideas I had come up with when I
did the analysis of the learners’ written work. The study furthermore had intentions to find
out if by any chance could the teaching directed at errors made by learners and the
misconceptions these errors might be rooted from could afford better learning opportunities
which in turn could make it easier for the learners to understand and master the function
concept.
In this research, I intended to explore answers to the following three research questions
What errors and misconceptions do grade 11 learners show on functions?
What learning affordances and constraints can be created if teaching is directed at
learners’ errors and misconceptions?
To what extent can the learners’ achievement on the topic functions be boosted if
teaching is directed at learners’ errors and misconceptions?

86
Indeed the outcomes of the study point out to information that I could use to answer
abovementioned research questions. The errors identified using the conceptual framework
and the linkages thereof the errors and the misconceptions from which they might be
emanating, were an eye opener to the learners as they were then able to direct that
knowledge which was not appropriately constructed into a better shape. The process of
identifying the errors and the likes also assisted with the design of the intervention which
was also aided by the patterns of variation to ensure that learners learn through first
identifying what they did not have to learn as part of the ligitimised concept of functions.
Despite the challenges I experienced when attempting to figure out the misconceptions
associated with certain errors the learners had made, I managed to identify a few errors
which I classified using the categories below (as in the conceptual framework).
4.5.1 Types of errors identified
In line with the focus of this study, I have identified four types of errors from the learners’
responses to the pre-test.
Generalisation
This type of error exists in at least two forms, namely generalisation over number and
generalisation over rule restriction. Mostly the errors I identified in this category were under
generalisation over number. This was evident from question 3 for the pre-test whereby a
learner took over his knowledge of working with zero and applied it into a domain where it
was not applicable. From this study, I also discovered another form of generalisation from a
learner’s response to question 4.4. The response seemed somewhat random but could also
be classified as overgeneralisation of concepts.
Ignorance of rule restriction
This also has something to do with application of a mathematical rule into a domain where
it does not apply. The example I could give from the analysis was that from question 3 once
again where learners were requested to solve a quadratic inequality and represent the
solution graphically. There the learner in question forcibly treated an inequality sign like it
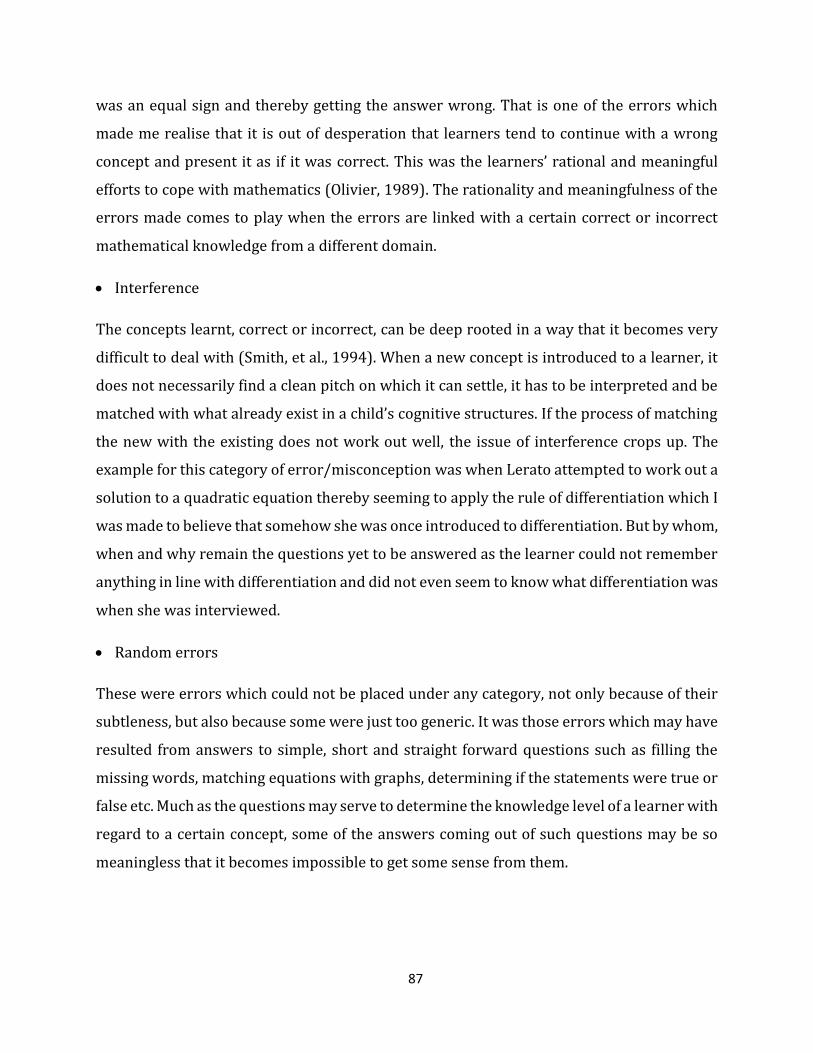
87
was an equal sign and thereby getting the answer wrong. That is one of the errors which
made me realise that it is out of desperation that learners tend to continue with a wrong
concept and present it as if it was correct. This was the learners’ rational and meaningful
efforts to cope with mathematics (Olivier, 1989). The rationality and meaningfulness of the
errors made comes to play when the errors are linked with a certain correct or incorrect
mathematical knowledge from a different domain.
Interference
The concepts learnt, correct or incorrect, can be deep rooted in a way that it becomes very
difficult to deal with (Smith, et al., 1994). When a new concept is introduced to a learner, it
does not necessarily find a clean pitch on which it can settle, it has to be interpreted and be
matched with what already exist in a child’s cognitive structures. If the process of matching
the new with the existing does not work out well, the issue of interference crops up. The
example for this category of error/misconception was when Lerato attempted to work out a
solution to a quadratic equation thereby seeming to apply the rule of differentiation which I
was made to believe that somehow she was once introduced to differentiation. But by whom,
when and why remain the questions yet to be answered as the learner could not remember
anything in line with differentiation and did not even seem to know what differentiation was
when she was interviewed.
Random errors
These were errors which could not be placed under any category, not only because of their
subtleness, but also because some were just too generic. It was those errors which may have
resulted from answers to simple, short and straight forward questions such as filling the
missing words, matching equations with graphs, determining if the statements were true or
false etc. Much as the questions may serve to determine the knowledge level of a learner with
regard to a certain concept, some of the answers coming out of such questions may be so
meaningless that it becomes impossible to get some sense from them.

88
4.5.2 What is implied by the errors identified
The outcomes of this study point out to the fact that directing the intervention towards these
identified errors and also using the variation theory as the vehicle for reaching out to the
learners created an environment in which learners were better enabled to construct new
knowledge. This was evident from the comparison of learners’ responses to the pre-test and
post-test questions.
From Hatano (1996)’s argument that construction of knowledge is from individuals’
experiences of solving problems from those they (individuals) create rather than those they
are imposed with. Teaching the learners functions while pointing out clearly throughout the
lessons the errors they made as well as what misconceptions they may have carried over to
this section exposed the learner to learning from their own experiences. This was one way
in which the intervention/remedial teaching made the concept of learning concept available
to learners (Watson, 2007).
Much as there was a noticeable improvement of performance from the pre-test to the post-
test some of the misconceptions the learners had could not be addressed successfully by this
intervention. For example, in line with the constructivist school of thought, Baker et al.
(2007) points out eight core ideas with which they define the process of learning. One of
them states that human beings have their own ideas about the world which are often
inconsistent with accepted scientific ideas and some of them may be persistent and hard to
change. This could be the reason why for example, for some of the questions, especially those
towards the end of the question paper, learners repeatedly displayed errors in the responses
to the post-test.
Consistent with Baker et al. (2007)’s ideas alluded to in the preceding paragraph, the
outcomes of this study also reveal through learners’ responses, some persistent ideas that
are often at odds with accepted scientific ideas, hence the improvement of performance in
some cases is insignificant. On the same account, Olivier (1989) argues that learning starts
with the learner attempting to incorporate a new idea into an existing schema. Due to the

89
diversity of what needs to be learnt, it is not always possible to link every new idea with an
existing schema.
As Smith et al. (1994) have pointed out that more needed to be done with errors and
misconceptions identified to build on learners’ conceptions, indeed the research reveals that a
teaching intervention whose approach is on errors identified cannot only enhance the
performance of learners, but can also serve as a general resource towards performance gains
on the subject. This was evident from the improved performance of learners from the pre-test
to the post-test as well as the number of errors made in the pre-test as opposed to those in the
post-test. Incorporating the awareness of errors into the pedagogic approach to the teaching of
functions in this case proved significance towards the enhancement of knowledge construction
(Sarwadi & Sharhill, 2014).
On the other hand, as from the constructivist’s point of view, knowledge cannot be transferred
form one individual to the next, instead, knowledge is constructed by an individual through
active participation in the process (Hatano, 1996). Making learners aware of their own errors
is one of the ways of involving them directly in their process of constructing knowledge.
Throughout the intervention, the teacher kept asking the learners probing questions as to how
the errors made can be rectified, whilst at the same time he openly spoke about the probable
causes of the errors. Indeed that ensured learner participation, which in return contributed
towards an instructional strategy which created an enabling environment which integrated the
learners’ ideas into the process, hence aiding their process of constructing knowledge (Jacobs
et al., 2010).
While it was evident from the reduced number of errors made in the post-test as compared to
those picked up from the pre-test responses, it was also apparent that indeed learning was
enhanced by focusing on the errors and misconceptions.
Another interesting revelation was that the nature in which performance was boosted differed
from one learner to the other. Although the aim of this study was not necessarily to establish
and discuss how each individual learner did, I find the difference in individual learner
performance being consistent with Baker, McGaw and Peterson (2007)’s view of
constructivism learning that:

90
Learners come to the learning situation with existing ideas about many phenomena.
Some of these ideas are deeply rooted and well developed whilst others are temporary
and unstable.
Learners have their own individual ideas about the world, but there are also many
similarities and common patterns in their ideas.
These ideas are often at odds with accepted scientific ideas, and some of them may be
persistent and hard to change.
Knowledge is represented in the brain’s conceptual structures and it is possible to
model and describe it in some detail.
Teaching has to take learner’s existing ideas seriously if it is to be changed or challenged
While the approach of first making learners aware of the errors made and the misconceptions
those errors can be associated with was the point of departure for the lessons, the teacher’s
processes of presenting the object of learning to the learners also was in line in line with the
four stages of learning by Tall & Vinner (1981). Figure 14 under the subsection 4.3 (the
teaching intervention), shows that the three stages the teacher followed were consistent with
the concept image and concept definition theory of teaching and learning. Stage one of the
model the teacher employed in his intervention involved the discussion of the errors and
misconceptions between the teacher and the learners. At this stage, the concept is still external
to the learners. It is only when the learner starts realising through the interaction between the
errors and misconceptions presented that the learner starts attaching a meaning to the concept.
This happens when the learner realises how the solution could have been worked out properly.
Stage two is whereby the teacher poses a problem similar to the one carried out in stage one
and instructing the learners to work it out in groups. By this the teacher brings the concept
even closer to the learner as he steps back slightly to leave the learners to interact with the
problem amongst themselves. This combines stages two and three of the concept image and
the concept definition theory by Tall and Vinner (1981). This is the stage whereby while a
learner sees the concept as a process, she/he conceptualises and internalises it. The last stage
where the learner is also to deal with a similar problem is whereby she/he incorporates the
concept in his/her broader metal picture. While this lengthy processes served as an aid to the
process of constructing knowledge, it also contributed largely to the creating of learning

91
affordances as it brought the object of learning even closer to the learner. The processes also
encompasses the patterns of the theory of variation. By exposing the learners to examples of
similar nature aids their understanding of the object of learning through the generalisation
pattern of the variation theory (Runesson, 2005).
On the other hand it was through the contrast pattern of variation that the teacher was able to
get the learners create a distinction between various types of functions in both symbolic and
graphical form. This he did through bringing forward the meanings of various parameters (or
symbols) in general forms of equations of functions. For example, the learners were thus
eventually able to differentiate what letter/parameter ‘c’ stands for in the function represented
in the form, 𝑦 = 𝑚𝑥 + 𝑐 and what letter/parameter ‘q’ stands for in a function generally defined
by the equation 𝑦 = 𝑎(𝑥 + 𝑝)2 +.

92
CHAPTER 5: CONCLUSIONS, FINDINGS AND RECOMMENDATIONS
As stated in the literature review chapter earlier, misconceptions are so deeply rooted in a way
that eradicating them may not be such a simple, let alone the best exercise. This is because
while they come in different forms, they are rooted within an individual’s schema and have
been incorrectly captured and recorded as legitimate knowledge. It is also for this reason that
if treated well, they can be used as tools for constructing knowledge (Borasi, 1997).
As explained in the previous chapters, this qualitative research consisted of numerous phases
of data collection processes.
Phase 1: A pre-test on algebraic functions was conducted on a group of grade 11 learners. I
marked the pre-test and analysed the errors that the learners (sampled) made when
responding to the test questions.
Phase 2: Processes in this phase was to get more clarity on some of the not so easy to
understand errors which the learners made from the pre-test. This is the stage whereby I was
interviewing the leaners to obtain clarity on why they answered some of the pre-test questions
the way they did. The outcomes of this process also aided my approach to the coaching meeting
I had with the teacher.
Phase 3: I had a seminar with the teacher who was to re-teach the function concept to the same
learners. It was at this meeting whereby I discussed with the teacher all the errors that I have
picked up, as well as the possible misconceptions the errors might have emanating from as
discussed in chapter 4 above. This meeting also resulted with the teacher strategizing on how
to approach the lessons as they were also going to serve as revision lessons in preparation for
the end of year examinations.
Phase 4: This phase of my study consisted of the process of conducting a post-test with the
learners, marking the test and comparing the learner performance on the post-test with that
of their pre-test on specific questions where errors and misconceptions had been picked up
from the pre-test. This was only done with the scripts of learners who have been sampled for

93
the pre-test. This means the same subjects used for the pre-test were also used for the post-
test analysis.
The above-mentioned phases of data collection were employed mainly to ensure that sufficient
data is collected to give responses to the three interrelated research questions.
What errors and misconceptions do grade 11 learners display on functions?
The errors I found from learners’ responses to the pre-test were not only due to them not
knowing correct answers, but also emanating from previously learnt concepts. I have classified
the errors in different categories in line with the conceptual framework for this study, and
found out that in some categories there were fewer errors than in others. Analysing these
errors and was important in that it assisted largely with the approach used for the re-teaching
of the concept to the learners, as having been able to trace their roots and further interviewing
the learners resulted with my understanding of the learners’ reasoning in some cases. I have
discovered the following types of errors:
Random errors
These as indicated were errors which were not classifiable under any category. An example of
them I drew from question 1. The question was mostly on identification and classification of
functions with their algebraic arguments represented by alphabetic parameters. Most of the
errors made in that question were random and could not be accounted for by the learners
themselves.
Generalization over number
For example, question 3 was stated as follows:
Solve for 𝑥 and represent your solution using correct notation as well as graphically
if (𝑥 − 1)(𝑥 + 4) ≥ 6
One of the learners’ attempts to answer the question was as follows:
(𝑥 − 1)(𝑥 + 4) ≥ 6

94
(𝑥 − 1) ≥ 6 𝑜𝑟 (𝑥 + 4) ≥ 6
𝑥 ≥ 6 + 1 𝑜𝑟 𝑥 ≥ 6 − 4
𝑥 ≥ 7 𝑜𝑟 𝑥 ≥ 2
The learner in question generalised over the number 6 in that he applied the property of
quadratic factors that if the product of a and b is zero (i.e. 𝑎 × 𝑏 = 0, 𝑡ℎ𝑒𝑛 𝑎 = 0 𝑝𝑟𝑜𝑣𝑖𝑑𝑒𝑑 𝑏 ≠
0 𝑜𝑟 𝑏 = 0 𝑖𝑓 𝑎 ≠ 0. This however does not apply in cases whereby instead of zero the right
hand side of the equation in the form 𝑎 × 𝑏 = 0 is any number other than zero. This comes
from a property of zero that zero divided by any number (except for zero itself) equal zero.
This was correct knowledge in the domain whereby the right hand side of and equation is
zero. This correct knowledge was then transferred to the domain where it does not apply.
Generalization over operations
This is an error whereby a learner ignores different properties of operations. For example,
question 4.2 from the pre-test whereby a learner was expected to determine the coordinates
of the x intercept of a hyperbola (see annexure A).
Notwithstanding other errors the learner displayed when she started answering the question,
her response to the question involved the following lines:
2𝑎 = 3 + 0 + 4
2𝑎 = 7
𝑎 = 7 − 2
The learner left the solution at this point but she could have continued to wrongly find that
her value of 𝑎 is 5. This learner here applied the additive inverse rule where it does not apply
instead of using the multiplicative inverse. Notwithstanding the errors made before this one,
the learner could have proceeded by working out the sum as follows:
2𝑎
2=
7
2

95
𝑎 =7
2
(Although it still wasn’t going to be the correct value of a because of other errors made
before)
By doing this, the learner generalised the rule for additive inverse (which is only applicable
when addition and subtraction operations are used) over the multiplicative inverse rule
(which is only applicable as a way to reverse the division process).
Ignorance of rule restriction
Another learner’s attempt to answer question 3 on the pre-test was as follows:
(𝑥 − 1)(+4) ≥ 6
𝑥2 + 3𝑥 − 4 − 6 ≤
In this case the learner changed the sign as he applied the additive inverse rule to get the 6
from the right hand side of the inequality to the left hand side. This error emanates from the
every introductory part of inequalities whereby learners have to be taken through and
investigation to determine when and when not to change the direction of the inequality sign.
The learner carried on and made more errors by leaving the place on the right hand side of
the inequality blank, factorised the left hand side of the inequality correctly but changed the
sign of the inequality once again when he wrote the last line of his solution.
(𝑥 + 5)(𝑥 − 20 ≤ 0
𝑥 ≥ −5 𝑜𝑟 𝑥 ≥ 2
In the very same question 3 of the pre-test, another learner committed an error by ignoring
rules which come with inequality signs. The fact that the learner changed the direction of the
sign in the last line of the solution might mean that the learner had some knowledge that at
time when working out solutions to inequalities, the direction of the sign changes. But to say
what mathematical conditions warrants the change of sign, the learner may have not been

96
aware. In his attempt to cope with the challenges and demands of the subject, the learner
randomly changed the direction of the sign.
Interference with existing learning
This was for example picked up from question 2 whereby the learner was attempting to
answer a question whereby values of 𝑥 were sought from a quadratic equation below.
2𝑥2 + 7𝑥 = 4
This type of misconception results from the new knowledge not being compatible with the
existing schema (Hatano, 1996). The error made was in question 2 pre-test response by one
of the learners. Much as this learner is not expected to have been taught differential calculus
before, there is some flair of the skills that I can associate with differential calculus. This was
evident from the learner’s transition from line two of her solution to like three as follows (not
withstanding other errors made):
2𝑥2 + 7𝑥 − 4……………Line 2
4𝑥 + 7𝑥 − 4…………….Line 3
The transition from line 2 to line 3 resulted with 2𝑥2 being rewritten as 4𝑥 which is consistent
with the laws of differentiation. Another way to look at the error is that the learner used the
index from the variable x in the ‘equation’ to square the coefficient of 𝑥2, which makes it a
different error altogether.
What learning affordances and constraints can be created if teaching is directed at
learners’ errors and misconceptions?
The findings interpret to various forms of knowledge acquisition and some minor issues which
I can reasonably consider to be constraints although there were no noticeable circumstances
under which learners’ processes of constructing knowledge was hampered by this focused
teaching approach. The errors studied were varying and I have associated them with
individual performance gains which also varied from question to question.

97
The nature of errors identified brought about ideas which were used to structure the lesson.
Among other aspects which were incorporated into the intervention were a correction item
prepared as a task for the learners. The task was made up of some of the errors which learners
made from the pre-test whereby the learners themselves had to sit is groups to identify the
errors made, write the answers correctly and critiques the answers which were wrong. Just by
doing this, creating an enabling environment for learners to critically have a look at some of
the errors picked up from the pre-test responses exposes the object of learning to the learners.
On the other hand, Vygotsky (1978) allude to learners learning from their social interactions
with one other. On the same note, he points out the concept of scaffolding which can be done
by a teacher or a more knowledgeable other (who acts as a mediator) to the learner. Within
his parameters of looking at the process of teaching and learning, even a learner
himself/herself can be a mediator to another learner. Thus having learners freely working in
groups when dealing with errors made could in essence bring about opportunities to learn,
which in turn create an enabling environment to learning.
The teacher also ensured that for each and every error made, he designs for the intervention
lessons, a set of activities and treated them with the learners in ascending order of cognitive
demand. This in itself brought about factors which enabled learning through various aspect of
the object whereby learners learnt through exposing them to characteristics of a concept in
order enable them to differentiate it from others (Mhlolo, 2013).
From the findings I deduced that the learning affordances provided by this approach of
teaching which was focused at the identified errors, was more inclined to the knowledge type
and understanding type questions (Bloom et al., 1956). It was only to a minimal degree that
there was also some improvement when it came to application questions and analysis
questions. With the limited time allocated to the remedial intervention, I was still able to
collect sufficient data which enabled me to arrive at this conclusion.
What can also be attributed to the affordance of learning opportunities by focusing the
teaching to errors and misconception could be the number of errors and misconceptions

98
picked up and brought to the learners’ attention. There were more errors in the pre-test as
opposed to the number of errors picked up from the pre-test.
To what extent can the learners’ achievement on the topic functions be boosted if
teaching is directed at learners’ errors and misconceptions?
Marton and Pang (2006) argue that creating an enabling environment does not necessarily
mean that students can discern the object of learning. It was for this reason that I had to
determine the actual performance gains in the post-test, which may be an indication that the
affordances created as I explained above, contributed to boosting the learner performance.
From the findings chapter earlier, I presented the graphical representation of the learner
achievement from the pre-test compared to that of the post-test. From that analysis it was
evident that indeed there were some improvement registered ranging from 0.4% to 43.4%.
More interestingly was the percentage gains difference from question to question, with
question 1 being the one with the highest performance improvement. The next question with
a substantial performance gain from the pre-test to the post-test were questions 3 and 4 with
respective percentage improvements of 33.3% and 16.6%. These were questions structured
mainly to assess the learners’ knowledge, understanding and to a very minimal degree,
application of the concept taught. In light of these findings, I would conclude by saying that for
this group of learners, under the said conditions, focusing the teaching at the errors and
misconceptions which were picked up from the pre-test conducted resulted with reasonable
improvements in performance of learners, specifically in questions related to learners’
understanding, knowledge construction as well as briefly on application of the knowledge
acquired. There were also some improvement noted with questions 3 and 5 which were mainly
on application and analysis according to the Bloom’s Taxonomy. This might have been the
result of the amount of time available to treating the function concept which according to the
CAPS instructional document required more time than the 8 hours allocated for this research.
I am convinced that with more time and more practice activities for the learners, there could
be even more substantial gains in performance throughout the test content with all the varying
cognitive demand levels.

99
The research findings attempted to answer the three research questions posed by the
researcher. The first question was if there would be any errors the learners would make in this
section of functions and if it would be possible to classify some of these errors made. The
question also was indirectly asking of the misconceptions which the errors are linked with
could be brought to surface. Indeed I managed to categorize the errors picked according to the
conceptual framework in chapter 2. That aided the process of preparing the coaching session
with the teacher, as well as the re-teaching session in the sense that the teacher was made to
understand the roots of these errors before he re-delivered a lesson on functions.
It is worth mentioning also that as much as there is evidence that learners acquired some
conceptual knowledge of functions from the teaching that was directed at the errors picked up
as well as the misconceptions the errors emanated from, there are areas of the section
whereby there was no significant improvement when the learners’ pre-test performance was
compared with their post-test performance.
5.1 Limitations of the Study
I would like to acknowledge that the study whose findings are presented in this document
clearly has its limitations. I have presented in this report, the findings from a case study of one
teacher and six learners who were sampled from a group of 31 learners and certainly cannot
be generalized to other learners. Although the rest of the learner component were to a certain
degree part of the empirical settings, these findings can still not be generalized over them. The
findings are obtained from this small group of learners with unique conditions of learning in
their unique learning space.
Another aspect which might have to be considered is the load of content in the topic functions
(at grade 11 level) versus the amount of time I allocated for the remedial teaching. Perhaps the
improvement of learner performance could have even been better if more time was allocated
for the remedial teaching.

100
5.2 Recommendations and Implications for Theory, Research and Practice
In light of the findings of this study, I would like to make the following recommendations:
Recommendations for policy makers
In the field of policy development, I would like to recommend that the developers take into
cognizance the fact that learning is knowledge constructed emanating from the matching of
cognitive structures in the mind of the learner with what is being introduced to this learner.
This in return meaning that the interpretation of what is being introduced to the learner
results from those processes and it is likely to differ from one learner to the other. These
different interpretations need to be taken as normal and be considered as part of the
methodological practices commissioned by the education policies.
Recommendation for further research
Much as my findings have confirmed that for this group of learners who participated on
this study there were performance gains from this focused instructional approach, I
hypothetically believed that had there been enough time, improvements of performance
could have been evident on all types of questions as I classified them according to the
Bloom’s Taxonomy. It is still worth some studying, on more sound reasons why there was
no substantial improvement of performance on analytical and applications questions as
compared to other types of questions. Thus, more study needs to be conducted on errors
related to certain types of questions such as analytical and application. I also strongly
recommend that more studies can be done focusing only on one type of function in order
to get much deeper into the problems learners have with constructing knowledge around
a specific function concept.
Because misconceptions are deep-rooted and are persistent while also resistant to change
(Hatano, 1996), further studies can also be done on the various levels of resistance posed
by types of errors as it appeared from this research that even in the post-test learners still
made errors (although they were not as many as those in the pre-test responses).

101
REFERENCES
Abdullah, S. A. S., & Saleh, F. (2005). Difficulties in comprehending the concept of functions:
Implication to instructions. In CosMED International Conference, SEAMEO RECSAM.
Gelugor Pulau Pinang Malaysia.
Backman, K., & Kyngäs, H. A. (1999). Challenges of the grounded theory approach to a novice
researcher. Nursing & Health Sciences, 1(3), 147-153.
Baker, E., McGaw, B., & Peterson, P. (2007). Constructivism and learning. In International
encyclopaedia of education. Retrieved on January 19th, 2017.
Basit, T. N. (2010). Conducting Research in Educational Contexts. (1st ed.). New York:
Continuum International Publishing Group.
Bloom, B. S. (1956). Taxonomy of educational objectives: Cognitive domain. New York:
Longman, (1), 20-24.
Borasi, R. (1994). Capitalizing on errors as" springboards for inquiry": A teaching experiment.
Journal for Research in Mathematics Education, 25, 166-208.
Bray W. S., & Santagata, R. (2013). Developing Teaching Capacity for Making Productive Use of
Mathematics Errors. Paper presented at Annual Meeting for the Association of Mathematics
Teacher Education, Orlando, Florida.
Brodie, K. (2007). Teaching with conversations: Beginnings and endings. For the learning of
Mathematics, 27(1), 17-23.
Brodie, K., & Berger, M. (2010). Toward a discursive framework for learner errors in
mathematics. In V. Mudaly (Ed.), Proceedings of the 18th annual meeting of the Southern
African Association for Research in Mathematics, Science and Technology Education (pp.
169–181). Durban: University of KwaZulu-Natal.
Burton, S. J., Sudweeks, R. R., Merrill, P. F., & Wood, B. (1991). How to prepare better multiple-
choice test items: Guidelines for university faculty. Brigham: Brigham Young University
Testing Services and the Department of Instructional Science.
Cansız, Ş., Küçük, B., & İşleyen, T. (2011). Identifying the secondary school students’
misconceptions about functionns. Procedia-Social and Behavioral Sciences, 15, 3837-3842.

102
Chamberlin, M. T. (2005). Teachers’ discussions of students’ thinking: Meeting the challenge
of attending to students’ thinking. Journal of Mathematics Teacher Education, 8(2), 141-
170.
Coles, A. (2002). Teaching strategies related to listening and hearing in two secondary
classrooms. Research in mathematics education, 4(1), 21-34.
Creswell, J. W. (1998). Qualitative inquiry and research design: Choosing among five traditions.
Thousand Oaks, CA: Sage.
Creswell, J.W. (2012). Educational research: Planning, conducting, and evaluating quantitative
and qualitative research. (4th Ed.). Boston: Pearson.
Davis, B. (1997). Listening for differences: An evolving conception of mathematics teaching.
Journal for research in mathematics education, 28(3), 355–376.
Denscombe, M. (2014). The good research guide: for small-scale social research projects.
McGraw-Hill Education (UK).
Denzin, N. K. (1978). The research act: A theoretical orientation to sociological methods.
McGraw-Hill, New York.
Department of Basic Education (2011). Further Education and Training Phase. Curriculum and
Assessment Policy Statement. DBE: Pretoria.
Department of Basic Education (2012). National Senior Certificate Examination: Diagnostic
Report. DBE: Pretoria.
Department of Basic Education (2014). Further Education and Training Phase. Report on the
National Annual Assessment of 2014. DBE: Pretoria.
Department of Basic Education (2014). National Senior Certificate Examination: School
Performance Report. DBE: Pretoria.
Department of Basic Education (2015). National Senior Certificate Examination: Diagnostic
Report. DBE: Pretoria.
Department of Basic Education (2015). National Senior Certificate Examination: National
Diagnostic Report on Learner Performance. DBE: Pretoria.
Dowker, A. (2004). What works for children with mathematical difficulties? (Vol. 554). London:
DfES Publications.
Dubinsky, E., & Wilson, R. T. (2013). High school students’ understanding of the function
concept. The Journal of Mathematical Behavior, 32(1), 83-101.

103
Dubinsky, E., Assiala, M., Cottrill, J., & Schwingendorf, K. E. (1997).The Development of
Students' Graphical Understanding of the Derivative. Journal of Mathematical Behaviour,
16, 399-431.
Eraslan, A. (2008). The notion of reducing abstraction in quadratic functions. International
Journal of Mathematical Education in Science & Technology, 39(8), 1051-1060.
Ernest, P. (1998). Social constructivism as a philosophy of mathematics. New York: Suny Press.
Goldin, G. (2008). Perspectives on representation in mathematical learning and problem
solving. In L. D. English (Ed.), Handbook of international research in mathematics education,
second edition (pp. 176-201). New York: Routledge.
Hatano, G. (1996). A conception of knowledge acquisition and its implications for mathematics
education. In L. Steffe, P. Nesher, P. Cobb, G. Goldin & B. Greer (Eds). Theories of
mathematical learning. New Jersey: Lawrence Erlbaum (pp.197 – 217). New Jersey:
Laurence Erlbaum.
Hatch, A. J. (2002). Doing qualitative research in education settings. Albany: Suny Press.
Howie, S. J. (2001). Mathematics and science performance in grade 8 in South Africa 1998/99:
TIMMS-R 1999 South Africa. Pretoria: Human Sciences Research Council.
Howie, S. J. (2003). Language and other background factors affecting secondary pupils'
performance in Mathematics in South Africa. African Journal of Research in Mathematics,
Science and Technology Education, 7(1), 1-20.
Jacobs, V. R., Lamb, L. L., & Philipp, R. A. (2010). Professional noticing of children's
mathematical thinking. Journal for research in mathematics education, 41(2), 169-202.
Kazemi, E., & Stipek, D. (2001). Promoting conceptual thinking in four upper-elementary
mathematics classrooms. The Elementary School Journal, 102(1), 59-80.
Kieran, C. (2004). Algebraic thinking in the early grades: What is it? The Mathematics Educator,
8(1), 139-151.
Kilpatrick, J., Swafford, J., & Findell, B (Eds.). (2001). Adding it up: Helping children learn
mathematics. Washington DC: National Academy Press.
Kim, B. (2001). Social constructivism. Emerging perspectives on learning, teaching, and
technology, 1(1), 16.
Leinhardt, G., Zaslavsky, O., & Stein, M. K. (1990). Functions, graphs, and graphing: Tasks,
learning, and teaching. Review of educational research, 60(1), 1-64.

104
Lobato, J., Clarke, D., & Ellis, A. B. (2005). Initiating and eliciting in teaching: A reformulation
of telling. Journal for research in mathematics education, 101-136.
Luneta, K., & Makonye, P. J. (2010). Learner errors and misconceptions in elementary analysis:
A case study of a Grade 12 class in South Africa. Acta Didactica Napocensia, 3(3), 35-46.
Makonye, J. P., & Luneta, K. (2013). Learner mathematical errors in introductory differential
calculus tasks: A study of misconceptions in the senior school certificate examinations.
Education as Change, 18(1), 119-136.
Markovits, Z., Eylon, B. S., & Bruckheimer, M. (1986). Functions today and yesterday. For the
learning of mathematics, 6(2), 18-28.
Marton, F. & Pang, M. F. (2006). On some necessary conditions of learning. The Journal of the
Learning sciences, 15(2), 193-220.
Marton, F., Runesson, U. and Tsui, A.B.M. (2004) The space of learning. Classroom Discourse and
the Space of Learning. New Jersey, Lawrence Erlbaum Associates, INC, Publishers.
Mason, J., Graham, A., & Johnston-Wilder, S. (2005). Developing thinking in algebra. London:
Paul Chapman Publishing.
Maxwell, J. (1992). Understanding and validity in qualitative research. Harvard educational
review, 62(3), 279-301.
McMillan, J. H. & Schumacher, S. (2010). Research in education: Evidence-based inquiry (7th
ed.). Boston: Pearson.
Mhlolo, M. (2013). The merits of teaching mathematics with variation: original research.
Pythagoras, 34(2), 1-8.
Miles, M. B., & Huberman, A. M. (1994). Qualitative data analysis: An expanded sourcebook.
Beverly Hills: Sage Publications.
Mji, A., & Makgato, M. (2006). Factors associated with high school learners' poor performance:
a spotlight on mathematics and physical science. South African journal of education, 26(2),
253-266.
Nesher, P. (1987). Towards an instructional theory: the role of student's misconceptions. For
the learning of mathematics, 7(3), 33-39.
Nicol, C. (1998). Learning to teach mathematics: Questioning, listening, and responding.
Educational Studies in Mathematics, 37(1), 45-66.
105
Okur, M. (2013). Learning difficulties experienced by students and their misconceptions of the inverse
function concept. Educational Research and Reviews, 8(12), 901–910.
Olivier, A. (1996). Handling pupils' misconceptions. Pythagoras, 21, 10-19.
Olivier, A. (1989). Presidential address delivered at the Thirteenth National Convention on
Mathematics, Physical Science and Biology Education, Pretoria, 3 – 7 July.
Opie, C. (2004). Doing educational research – a guide to first time researchers. London: Sage
Publications.
Palys, T. (2008). Purposive sampling. The Sage encyclopaedia of qualitative research methods,
2, 697-698.
Piaget, J. (1964). Part I: Cognitive development in children: Piaget development and learning.
Journal of research in science teaching, 2(3), 176-186.
Prediger, S. (2010). How to develop mathematics-for-teaching and for understanding: the case
of meanings of the equal sign. Journal of Mathematics Teacher Education, 13(1), 73-93.
Reddy, V. (2004). TIMSS 2013, South Africa: Media briefing, Pretoria: Human Sciences Research
Council.
Runesson, U. (2005). Beyond discourse and interaction. Variation: a critical aspect for teaching
and learning mathematics. Cambridge journal of education, 35(1), 69-87.
Sarwadi, H. R. H., & Shahrill, M. (2014). Understanding students’ mathematical errors and
misconceptions: The case of year 11 repeating students. Mathematics Education Trends and
Research, 1-10.
Sasman, M. (2011). Insights From NSC Mathematics Examinations. Proceedings of the
seventeenth national congress of the association for mathematics education of South Africa.
Johannesburg . University of the Witwatersrand.
Shulman, L. S. (1986). Those who understand: Knowledge growth in teaching. Educational
researcher, 15(2), 4-14.
Smith III, J. P., Disessa, A. A., & Roschelle, J. (1994). Misconceptions reconceived: A
constructivist analysis of knowledge in transition. The journal of the learning sciences, 3(2),
115-163.
Tall, D. O. & Vinner, S. (1981). Concept image and concept definition in mathematics, with
special reference to limits and continuity. Educational Studies in Mathematics, 12, 151 –
169.

106
Thomas, D. R. (2006). A general inductive approach for analysing qualitative evaluation data.
American journal of evaluation, 27(2), 237-246.
Von Glaserfeld, E.N. (1995). A constructivist approach to teaching, In L. Steffe & J. Gale (Eds),
Constructivism in education (p. 3 – 16). Hillsdale, NJ: Lawrence Erlbaum.
Vygotsky, L.S. (1978). Mind in society: The development of higher psychological processes.
Cambridge, MA: Harvard University Press.
Watson, A. (2004). Affordances, constraints and attunements in mathematical activity.
Research in mathematics education, 6(1), 23-34.
Watson, A. (2007). The nature of participation afforded by tasks, questions and prompts in
mathematics classrooms. Research in mathematics education, 9(1), 111-126.
Wellington, J. (2000). Educational Research: Contemporary issues and practical approaches.
Continuum, London.

107
ANNEXURES
ANNEXURE A: Pre-test
Instructions
1. This question paper consists of 5 compulsory questions. Answer all of them. 2. Number the answers correctly according to the numbering system used in this question
paper. 3. Clearly show ALL calculations, diagrams, graphs, et cetera that you have used in
determining your answers. 4. You may use an approved scientific calculator (non-programmable and non-graphical),
unless stated otherwise. 5. If necessary, round off answers to TWO decimal places, unless stated otherwise. 6. Diagrams are NOT necessarily drawn to scale. 7. It is in your best interest to ensure that your work is neatly and legibly presented.
Thank you once again for taking part in this assessment.
Name of Learner:_______________________________________________________________________________________ Gender: ___________________________Grade:_____________________________Age:____________________________ Name of Subject Teacher:_____________________________________________________________________________ Name of School: ________________________________________________________________________________________ Date of Assessment:____________________________________________________________________________________
MATHEMATICS GRADE 11- FUNCTIONS
45 Marks 1.5 hours

108
Question 1
Complete the table below
General Form Type of
Function
What information does each Letter give?
𝑦 = 𝑚𝑥 + 𝑐 1. 𝑐 4.
𝑔(𝑥) =𝑎
𝑥 + 𝑝+ 𝑞 2. 𝑝 5.
ℎ(𝑥) = 𝑎𝑥2 + 𝑏𝑥 + 𝑐
or
ℎ(𝑥) = (𝑥 − 𝑝)2 + 𝑞
3. 𝑎 6.
𝑝 7.
[5]
Question 2
2.4 Solve for 𝑥 in the following equation: 2𝑥2 + 7𝑥 = 4 (3)
2.5 If 𝑓(𝑥) = 2𝑥2 + 7𝑥 − 4, find the coordinates of the Turning Point of 𝑓 (2)
2.6 Sketch the function of 𝑓 showing its intercepts with the axes and the
turning point, if 𝑓(𝑥) = 2𝑥2 + 7𝑥 − 4 (4)
_________________________________________________________________________________________________[9]____
Question 3 Solve for 𝑥 and represent your solution using correct notation as well as graphically
if (𝑥 − 1)(𝑥 + 4) ≥ 6 [5]
Question 4
In the diagram below are the sketches of 𝑓(𝑥) =2
3𝑥 + 2 𝑎𝑛𝑑 𝑔(𝑥) =
𝑎
𝑥+𝑝+ 𝑞. The graph of
𝑔 passes through (0; 4) and its 𝑥-intercept is at point𝐴.

109
4.5 Calculate the values of 𝑝 𝑎𝑛𝑑 𝑞. (3)
4.6 Calculate the value of 𝑎 (2)
4.7 Determine the coordinates of point 𝐴. (2)
4.8 If the value of p is increased by 1 unit, what effect will that have on the graph
of 𝑔? (2)
[9]
Question 5
The graph below, which is not drawn to scale, shows a parabola with x-intercepts
at 𝐴(−3; 0) and 𝐵. The axis of symmetry has equation 𝑥 = −1 and the 𝑦 − 𝑖𝑛𝑡𝑒𝑟𝑐𝑒𝑝𝑡 is at
𝐶(0; −6).

110
Determine:
5.6 The coordinates of 𝐵. (3)
5.7 The equation of the parabola. (5)
5.8 The equation of the straight line passing through 𝐴 𝑎𝑛𝑑 𝐶. (4)
5.9 The length of 𝐴𝐶. (3)
5.10 The values of x for which 0xf . (2)
[17]
_____________________________________________The End_______________________________________________

111
ANNEXURE B: Post-test
FUNCTIONS
Instructions
1. This question paper consists of 4 compulsory questions. 2. Number the answers correctly according to the numbering system used in this question paper. 3. Clearly show ALL calculations, diagrams, graphs, et cetera that you have used in determining your
answers. 4. You may use an approved scientific calculator (non-programmable and non-graphical), unless
stated otherwise. 5. If necessary, round off answers to TWO decimal places, unless stated otherwise. 6. Diagrams are NOT necessarily drawn to scale. 7. It is in your best interest to ensure that your work is neatly and legibly presented.
Thank you once again for taking part in this assessment.
Name of Learner:________________________________________________________________________________ Gender: _____________________________Grade:______________________Age:___________________________ Name of Subject Teacher:_______________________________________________________________________ Name of School: _________________________________________________________________________________ Date of Assessment:_____________________________________________________________________________
MATHEMATICS GRADE 11
Post -Test
45 Marks 1.5 hours

112
Question 1
Complete the table below
General Form Type of
Function
What information does each Letter give?
𝑦 = 𝑚𝑥 + 𝑐 1. 𝑚 4.
𝑔(𝑥) =𝑎
𝑥 + 𝑝+ 𝑞 2. 𝑞 5.
ℎ(𝑥) = 𝑎𝑥2 + 𝑏𝑥 + 𝑐
or
ℎ(𝑥) = (𝑥 − 𝑝)2 + 𝑞
3. 𝑐 6.
𝑞 7.
[5]
Question 2
2.1 Solve for 𝑥 in the following equation: 3𝑥 +1
𝑥= 4 (3)
2.2 If 𝑓(𝑥) = 3𝑥 +1
𝑥− 4, find the coordinates of the Turning Point of 𝑓 (3)
2.3 Sketch the function of 𝑓 showing its intercepts with the axes and the
turning point. (4)
[10]
Question 3
Solve for 𝑥 and represent your solution using correct notation as well as graphically
if 𝑥(𝑥 + 7) < 8. [5]
Question 4
Sketched below is the graph of 𝑔(𝑥) =𝑎
𝑥−𝑝+ 𝑞. C (2; 6) is the point of intersection of the
asymptotes of g. 𝐵 (5
2; 0) is the x-intercept of g.

113
4.4 Calculate the values of a, 𝑝 𝑎𝑛𝑑 𝑞 and write the equation of g in the form 𝑔(𝑥) =𝑎
𝑥−𝑝+
𝑞. (5)
4.5 If the graph of g intersects the y-axis at point A, determine the coordinates
of point 𝐴. (2)
4.6 If the value of p is increased by 1 unit, what effect will that have o the graph
of 𝑔? (2)
[9]
Question 5
On the diagram below, S(-2; 0) and T(6;0) are the x-intercepts of the graph of 𝑓(𝑥) = 𝑎𝑥2 +
𝑏𝑥 + 𝑐 and R is the y-intercept. The straight line through R and T represents the graph of
𝑔(𝑥) = −2𝑥 + 𝑑.

114
5.1 Determine the value of d and write the equation of g in the form
𝑔(𝑥) = 𝑚𝑥 + 𝑐 (2)
5.2 Determine the equation of f in the form 𝑓(𝑥) = 𝑎𝑥2 + 𝑏𝑥 + 𝑐. (5)
5.3 Write down the coordinates of R. (1)
5.4 Calculate the length of RT. (3)
5.5 For which value(s) of x will 𝑓(𝑥) ≥ 𝑔(𝑥)? (3)
5.6 For which values of k will 𝑓(𝑥) = 𝑘 have two distinct roots? (2)
[16]
_____________________________________________The End_______________________________________________

115
ANNEXURE C: Letter to the Principal

116

117
ANNEXURE D: Participant Information Sheet

118
ANNEXURE E: Participant Information Sheet for the Teacher

119
ANNEXURE F: Participant Information Sheet for the Parents and Guardians

120
ANNEXURE G: Participant Information Sheet for the Parents and Learners

121
ANNEXURE H: Consent form for Audio-taping the Teacher During the Lesson

122
ANNEXURE I: Consent Form for Teacher’s Lesson Observation

123
ANNEXURE J: Consent Form for Learner Observation during the Lesson

124
ANNEXURE K: Learner Consent Form for Written Assessment

125
ANNEXURE L: Learner Consent Form for Audio-taping during Lesson

126
ANNEXURE M: Learner Consent Form for Observation during Lesson

127
ANNEXURE N: Parent Consent Form for Child Writing Tests

128
ANNEXURE O: Parent Consent Form for Child Interview

129
ANNEXURE P: Learner Consent Form for Interview

130
ANNEXURE Q: Observation Schedule

131
ANNEXURE R: Interview Schedule

132

133
ANNEXURE S: Ethics Clearance Letter

134
Copyright © 2022 FDOKUMEN