Immune responses of mussel hemocyte subpopulations are differentially regulated by enzymes of the PI...
42
Immune responses of mussel hemocyte subpopulations are differentially regulated by enzymes of the PI 3-K, PKC, and ERK kinase families. Erick García-García 1 , Maria Prado-Álvarez 2 , Beatriz Novoa 2 , Antonio Figueras 2 , and Carlos Rosales 1* 1 Department of Immunology, Instituto de Investigaciones Biomédicas, Universidad Nacional Autónoma de México, Mexico City, MEXICO, and 2 Instituto de Investigaciones Marinas, CSIC, Spanish National Reference Laboratory for Mollusc Diseases, 36208 Vigo, SPAIN. * Corresponding author: Carlos Rosales, Department of Immunology, Instituto de Investigaciones Biomédicas - UNAM, Apdo. Postal 70228, Cd. Universitaria, México D.F. - 04510, MEXICO. Phone: 52 - 55 - 5622 – 8951 FAX: 52 - 55 - 5622 – 9212. Email: [email protected] * Manuscript
Transcript of Immune responses of mussel hemocyte subpopulations are differentially regulated by enzymes of the PI...
Immune responses of mussel hemocyte subpopulations are
differentially regulated by enzymes of the PI 3-K, PKC, and
ERK kinase families.
Erick García-García1, Maria Prado-Álvarez2, Beatriz Novoa2, Antonio Figueras2,
and Carlos Rosales1*
1Department of Immunology, Instituto de Investigaciones Biomédicas, Universidad
Nacional Autónoma de México, Mexico City, MEXICO, and 2Instituto de
Investigaciones Marinas, CSIC, Spanish National Reference Laboratory for Mollusc
Diseases, 36208 Vigo, SPAIN.
* Corresponding author: Carlos Rosales, Department of Immunology, Instituto de
Investigaciones Biomédicas - UNAM, Apdo. Postal 70228, Cd. Universitaria, México
D.F. - 04510, MEXICO. Phone: 52 - 55 - 5622 – 8951 FAX: 52 - 55 - 5622 – 9212.
Email: [email protected]
* Manuscript
2
Immune functions of mussel hemocyte subpopulations are differentially
regulated by enzymes of the PI 3-K, PKC and ERK kinases families
Abstract.
Various hemocyte cell types have been described in invertebrates, but for most
species a functional characterization of different hemocyte cell types is still lacking. In
order to characterize some immunological properties of mussel (Mytilus
galloprovincalis) hemocytes, cells were separated by flow cytometry and their capacity
for phagocytosis, production of reactive oxygen species (ROS), and production of nitric
oxide (NO), was examined. PI 3-K, PKC and ERK inhibitors were also used to
biochemically characterize these cell responses. Four morphologically distinct
subpopulations, designated R1 to R4, were detected. R1, R2, and R3 cells presented
different levels of phagocytosis towards zymosan, latex beads, and two bacteria species.
Similarly, R1 to R3, but not R4 cells produced ROS, while all subpopulations produced
NO, in response to zymosan. Internalisation of all phagocytic targets was blocked by PI
3-K inhibition. In addition, internalisation of latex particles, but not of bacteria, was
partially blocked by PKC or ERK inhibition. Interestingly, phagocytosis of zymosan
was impaired by PKC, or ERK inhibitors only in R2 cells. Zymosan-induced ROS
production was blocked by PI 3-K inhibition, but not by PKC, or ERK inhibition. In
addition, zymosan-stimulated NO production was affected by PI 3-K inhibition in R1
and R2, but not in R3 or R4 cells. NO production in all cell types was unaffected by
PKC inhibition, but ERK inhibition blocked it in R2 cells. These data reveal the
existence of profound functional and biochemical differences in mussel hemocytes, and
indicate that M. galloprovinciallis hemocytes are specialized cells fulfilling specific
tasks in the context of host defence.
3
Key words: mollusc, signal transduction, innate immunity, phagocytosis,
respiratory burst, wortmannin, staurosporine, PD98059, professional phagocytes.
1. Introduction.
Despite the lack of an adaptive immune system, invertebrates are able to survive
among potentially pathogenic viruses, bacteria, and fungi [1, 2], and respond to
infection by activating various defence mechanisms [2, 3]. This suggests a key role for
their apparently limited innate immune system, in protecting these invertebrates from
infections. Among the defence mechanisms described in invertebrates are phagocytosis,
activation of the phenoloxydase system, encapsulation, the respiratory burst, nitric oxide
production, and the production and release of various microbicidal molecules [3]. It is
however unclear which of the different cells integrating the invertebrate innate immune
system, usually named hemocytes, are responsible for these cell responses.
Different types of hemocytes have been described in various invertebrate
species, but an accurate universal classification of invertebrate hemocytes is still
lacking. A consensus hemocyte classification is not available yet, due in part to intrinsic
differences in the immune systems of even closely related invertebrate species [4-6],
and also to differences in the experimental methods used to study them [7-11].
Depending on the species, and the experimental methodology, hemocytes have been
classified in as few as two, or up to eleven categories [7, 11, 12]. In molluscs, hemocyte
classification has largely depended on cell granularity, determined either by microscopy
or by flow cytometry [6, 13-16]. However, as in most invertebrate phyla, no definitive
mollusc hemocyte classification exists.
Extensive studies have shown that blood cells appear to have conserved roles in
vertebrate organisms ranging from fish to mammals [17-19]. In contrast, few attempts
4
have been made to functionally characterize the different hemocyte subtypes of most
invertebrate organisms. For example, while little doubt exists regarding the phagocytic
and microbicidal abilities of macrophages [19], even in lower vertebrates such as fish
[18], the information regarding the specific defence mechanisms displayed by different
hemocyte subtypes is scarce, and has largely focused only on phagocytic capacity [8-10,
20-22].
In mammals, phagocytosis and the respiratory burst are fundamental defence
mechanisms of professional phagocytes, that often take place simultaneously [23-26].
Phagocytosis is the physical internalisation of microbes or cellular debris [25, 26]. The
respiratory burst on the other hand, is a series of biochemical reactions that produce
highly microbicidal reactive oxygen species (ROS), such as superoxide (O2-), hydrogen
peroxide (H2O2), and hydroxyl radical (OH.) [23, 24]. Phagocytosis and activation of
the respiratory burst have been observed in hemocytes of various mollusc species [8,
27-33]. However, the specific hemocyte subtypes that present these cell responses are
still unknown.
In the mammalian immune system, the production of nitric oxide (NO) is part of
the defence mechanisms displayed by professional phagocytes such as macrophages
[34, 35]. NO is a highly cytotoxic and microbicidal molecule [34, 35], also capable of
activating other leukocytes [36]. The expression of a nitric oxide synthase, and the
production of NO by hemocytes has been reported in various mollusc species [37-43].
Yet, no information is available on the capacity of specific hemocyte subtypes to
produce NO.
In mammalian leukocytes, the signalling pathways regulating immune
responses, such as phagocytosis, differ depending on the type of phagocyte involved
[44], the specific nature of the receptor involved [45], and the differentiation and
5
activation state of the phagocytic cells [44, 46, 47]. Kinases of the phosphatidylinositol
3-kinase (PI 3-K), and protein kinase C (PKC) families are key regulators of
phagocytosis mediated through various membrane receptors [25, 26]. In addition, the
extracellular signal-regulated kinase (ERK) is an enzyme involved in phagocytosis
regulation, depending on the phagocytic receptor involved [25], and also on the
phagocytic cell type [44, 48, 49]. The role of these signalling molecules in the
regulation of hemocyte phagocytosis is unclear. Similarly, the participation of these
signalling enzymes in the regulation of the respiratory burst or NO production in
invertebrate organisms is poorly defined.
In order to characterize some immunological properties of the mussel M.
galloprovincialis hemocyte subtypes, cells were separated by flow cytometry and their
capacity for phagocytosis, production of reactive oxygen species (ROS), and production
of nitric oxide (NO), was examined. PI 3-K, PKC and ERK inhibitors were used to
biochemically characterize these cell functions. Four morphologically distinct
subpopulations, designated Large granular (R1), Large semigranular (R2), Small
semigranular (R3), and Small hyaline (R4) hemocytes, were detected in mussel
hemolymph. While Large granular (R1), Large semigranular (R2), and Small
semigranular (R3) cells were phagocytic, and capable of activating the respiratory burst,
Small hyaline (R4) cells lacked these two capabilities. Nevertheless, all hemocyte
subpopulations were capable of NO production. Biochemical characterization of
hemocyte functions showed a clear role for PI 3-K in phagocytosis and the respiratory
burst, and also for NO production in some cell types. PKC or ERK participated in
phagocytosis regulation, depending on the hemocyte subtype and the phagocytic target,
but had no role in the regulation of zymosan-induced respiratory burst. While zymosan-
induced NO production was independent of PKC, this cell response required ERK, but
6
only in some cell types. These data revealed the existence of critical functional and
biochemical differences in mussel hemocytes, and indicate that M. galloprovinciallis
hemocytes are specialized cells fulfilling specific tasks in the context of host defence.
2. Materials and Methods.
2.1 Reagents
Sea water was obtained from the Ría de Vigo (NW Spain). It was filtered
sequentially through 0.45 μm and 0.22 μm porous membranes before use. Flourescein-
labelled 1μm latex beads (catalogue number F8823), flourescein-labelled zymosan
bioparticles (catalogue number Z-284), flourescein-labelled E. coli bacteria (catalogue
number E-2861), the reactive oxygen species (ROS)-specific intracellular indicator
chloromethyl-H2DCFDA (catalogue number C6827), and the nitric oxide (NO)-specific
intracellular indicator DAF-FM/ DAF-FM diacetate (catalogue number D-23844), were
all from Molecular Probes (Eugene, OR). Fluorescein-labelled Vibrio alginolyticus
bacteria were prepared as described previously [50]. PD98059 (catalogue number
V1191) was from Promega, (Madison, WI). Wortmannin (catalogue number 19545-26-
7), phorbol myristate acetate (PMA) (catalogue number P8139), staurosporine
(catalogue number 55921), and all other chemicals were from Sigma Chemical
Company (St. Louis, MO).
2.2 Mussel hemocytes
Mussels (Mytilus galloprovincialis) were obtained from the Ría de Vigo (NW
Spain). They were maintained in filtered sea water tanks at 15 ºC with aeration, and fed
daily with the alga Tetraselmis svecica. Mussel shells were notched, and one to three ml
of hemolymph per individual were withdrawn from the adductor muscle. All
7
experiments were performed with hemolymph pools from a minimum of three
individuals.
2.3 Flow cytometry analysis of hemocyte subpopulations
Freshly isolated hemocytes diluted two fold with cold filtered sea water, or fixed
for 20 minutes with cold 2 % paraformaldehyde in sea water, were analysed in a
FACScalibur flow cytometer (Becton Dickinson; Franklin Lakes, NJ) equipped with
cell sorting and cell concentrator modules. Cell size (Forward light Scatter, FSC) and
cellular complexity (Side light Scatter, SSC) parameters were used to distinguish
different hemocyte subpopulations in dot-plots. Instrument settings were as follows:
FSC set in log scale at E-1, SSC set in log scale at 287, the primary parameter for
threshold was FSC set at 217. Ten thousand events were recorded for each hemolymph
sample. No differences were observed in dot-plots between fresh or 2 %
paraformaldehyde-fixed hemolymph samples (data not shown).
2.4 Morphological analysis of hemocyte subpopulations.
Cell sorting of paraformaldehyde-fixed cells was performed using sea water as
sheath fluid. Cells were recovered from the concentrator module, centrifuged at 300 x g
in Eppendorf tubes for 10 minutes, resuspended in 3.5 μl 10 % bovine serum albumin in
PBS, and placed on glass slides. Cells were then either placed under glass cover-slips,
and observed directly with a Nikon Optiphot phase-contrast microscope (Nikon
Instruments; Melville, NY), or air-dried and stained with hemacolor (catalogue
numbers: Red 1.11956.2500, Blue 1.11957.2500; Merk KGaA, Darmstadt, Germany)
for observation in a Nikon Optiphot light transmission microscope (Nikon Instruments;
Melville, NY).
2.5 Phagocytosis assays
8
Five hundred μl of hemolymph were placed into individual wells of tissue-
culture 24-well plates. Hemocyte number in each sample was estimated by counting
cells in a hemocytometer. Hemocytes were allowed to adhere to the well bottom by
incubating them for 30 minutes at 15 ºC in the dark. Hemolymph supernatant was then
removed by blotting onto paper towels. Five hundred μl of filtered sea water were then
added to each well. Flourescein-labelled 1μm latex beads, flourescein-labelled zymosan
bioparticles, flourescein-labelled E. coli bacteria, or fluorescein-labelled Vibrio
alginolyticus bacteria were added at a 10:1 target:hemocyte ratio. After a two hour
incubation at 15 ºC in the dark, uninternalised particles were removed by washing wells
twice with 500 μl PBS. Cells were finally resuspended in 500 μl PBS by gently
detaching them from the well bottom, using a rubber cell scraper. Fifty μl of 0.8 %
trypan blue in PBS were added to each sample to quench external fluorescence. Ten
thousand cells were then analysed by flow cytometry. Cell fluorescence was analysed
through the FL-1 channel set at log scale. FL-1 was adjusted for each phagocytic target,
so that positive cells (cells that internalised al least one particle) fell within the same
fluorescence range, independently of the phagocytic target used. Phagocytosis was
expressed as the percentage of cells that internalised at least one fluorescent particle
(positive cells). In selected experiments PI 3-K, PKC, or ERK inhibitors, or only the
DMSO solvent, were added to the cells and incubated at 15 ºC in the dark for 30
minutes before mixing them with the fluorescent particles.
2.5 Analysis of the respiratory burst and nitric oxide production
Two hundred and fifty μl of hemolymph pools were placed into individual wells
of tissue-culture U-bottom 96-well plates. After 30 minutes at 15 ºC in the dark, the
hemolymph supernatant was removed, and 200 μl filtered sea water, containing 0.4 %
DMSO and 5 μg/ml of chloromethyl-H2DCFDA, or DAF-FM/ DAF-FM diacetate were
9
added per well. In some experiments PI 3-K, PKC, or ERK inhibitors were added
together with the ROS or NO indicators. After 30 minutes at 15 ºC in the dark, the
supernatant was removed, and wells washed twice with filtered sea water. Zymosan (1
mg/ml), or PMA (1-1000 ng/ml) were then added in 200 μl sea water. Cells were
incubated for 1 hour at 15 ºC in the dark, washed twice with PBS, and finally
resuspended in 200 μl PBS. Cell fluorescence was analysed by flow cytometry through
the FL-1 channel, set at log scale. The mean fluorescence intensity (MFI) values of the
different hemocyte subpopulations in the resting state, was considered to be 100%. The
change in MFI value, induced by zymosan or PMA stimulation, was then plotted as a
percentage of the resting state value for each hemocyte subpopulation..
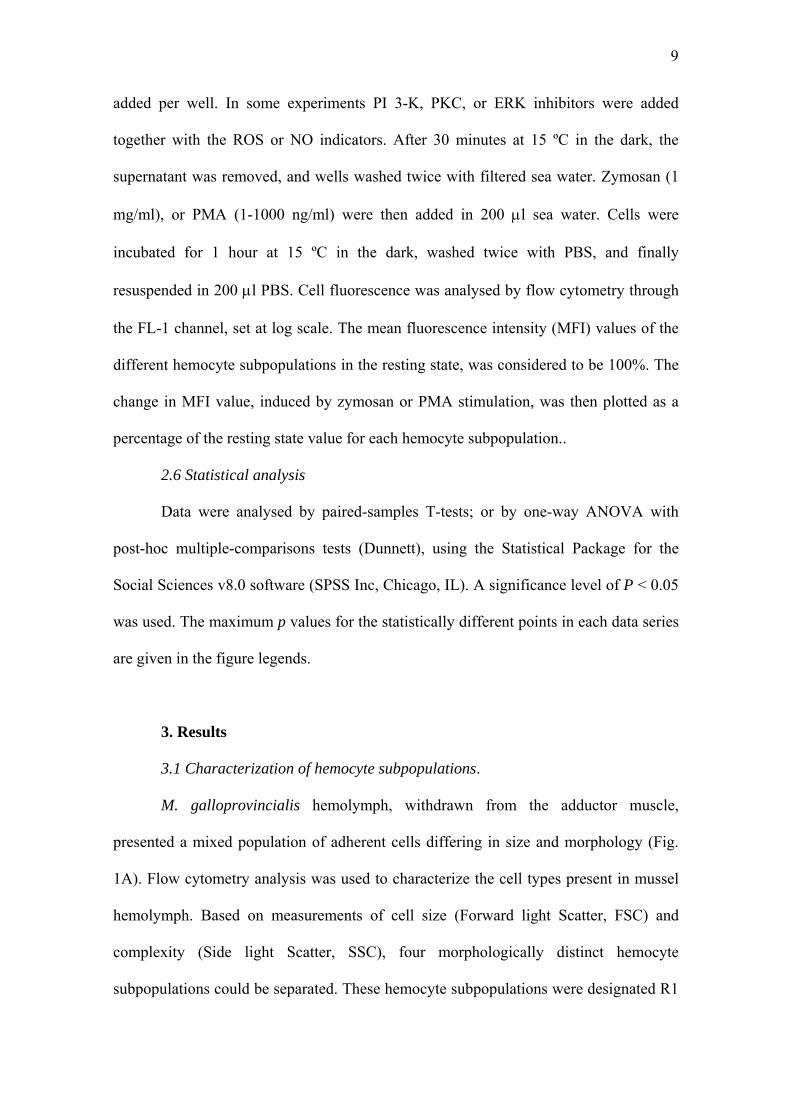
2.6 Statistical analysis
Data were analysed by paired-samples T-tests; or by one-way ANOVA with
post-hoc multiple-comparisons tests (Dunnett), using the Statistical Package for the
Social Sciences v8.0 software (SPSS Inc, Chicago, IL). A significance level of P < 0.05
was used. The maximum p values for the statistically different points in each data series
are given in the figure legends.
3. Results
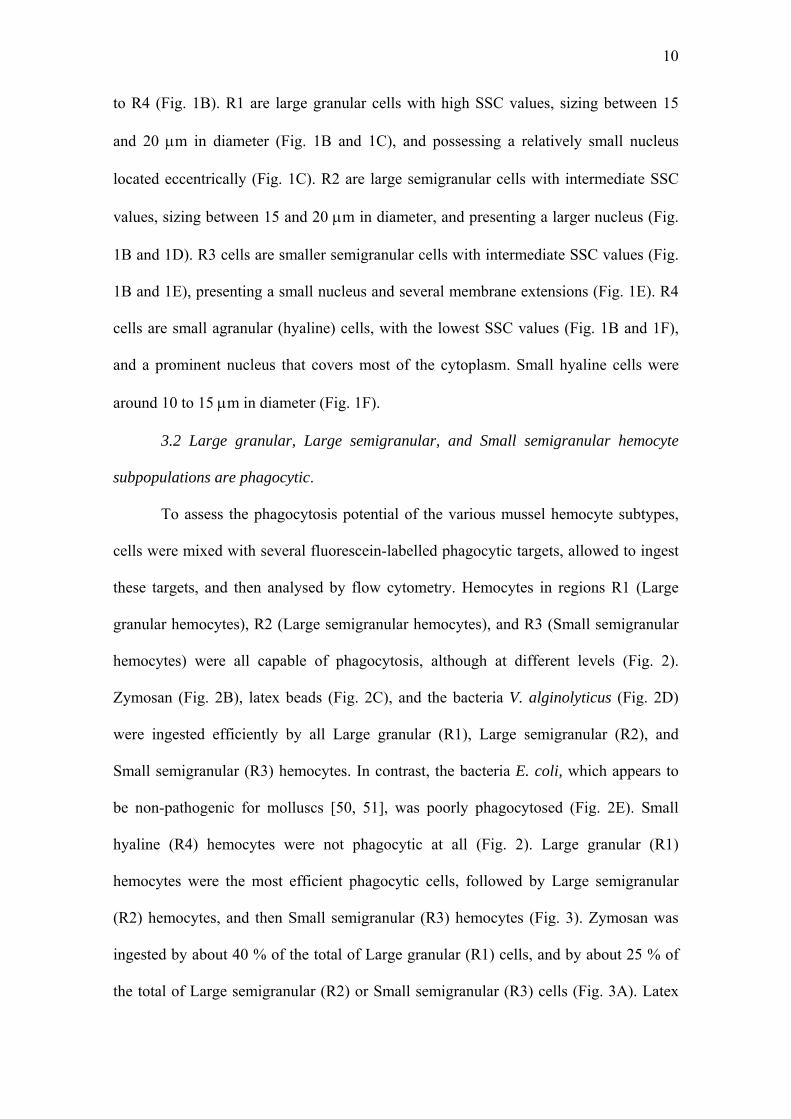
3.1 Characterization of hemocyte subpopulations.
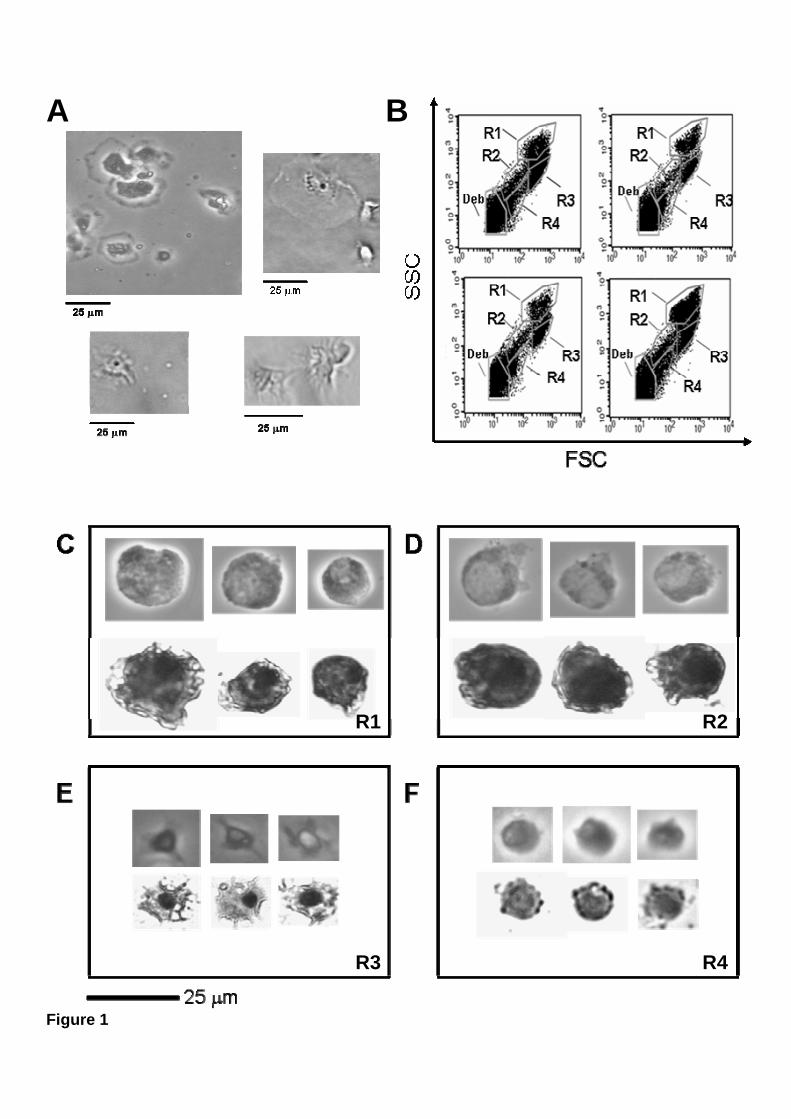
M. galloprovincialis hemolymph, withdrawn from the adductor muscle,
presented a mixed population of adherent cells differing in size and morphology (Fig.
1A). Flow cytometry analysis was used to characterize the cell types present in mussel
hemolymph. Based on measurements of cell size (Forward light Scatter, FSC) and
complexity (Side light Scatter, SSC), four morphologically distinct hemocyte
subpopulations could be separated. These hemocyte subpopulations were designated R1
10
to R4 (Fig. 1B). R1 are large granular cells with high SSC values, sizing between 15
and 20 μm in diameter (Fig. 1B and 1C), and possessing a relatively small nucleus
located eccentrically (Fig. 1C). R2 are large semigranular cells with intermediate SSC
values, sizing between 15 and 20 μm in diameter, and presenting a larger nucleus (Fig.
1B and 1D). R3 cells are smaller semigranular cells with intermediate SSC values (Fig.
1B and 1E), presenting a small nucleus and several membrane extensions (Fig. 1E). R4
cells are small agranular (hyaline) cells, with the lowest SSC values (Fig. 1B and 1F),
and a prominent nucleus that covers most of the cytoplasm. Small hyaline cells were
around 10 to 15 μm in diameter (Fig. 1F).
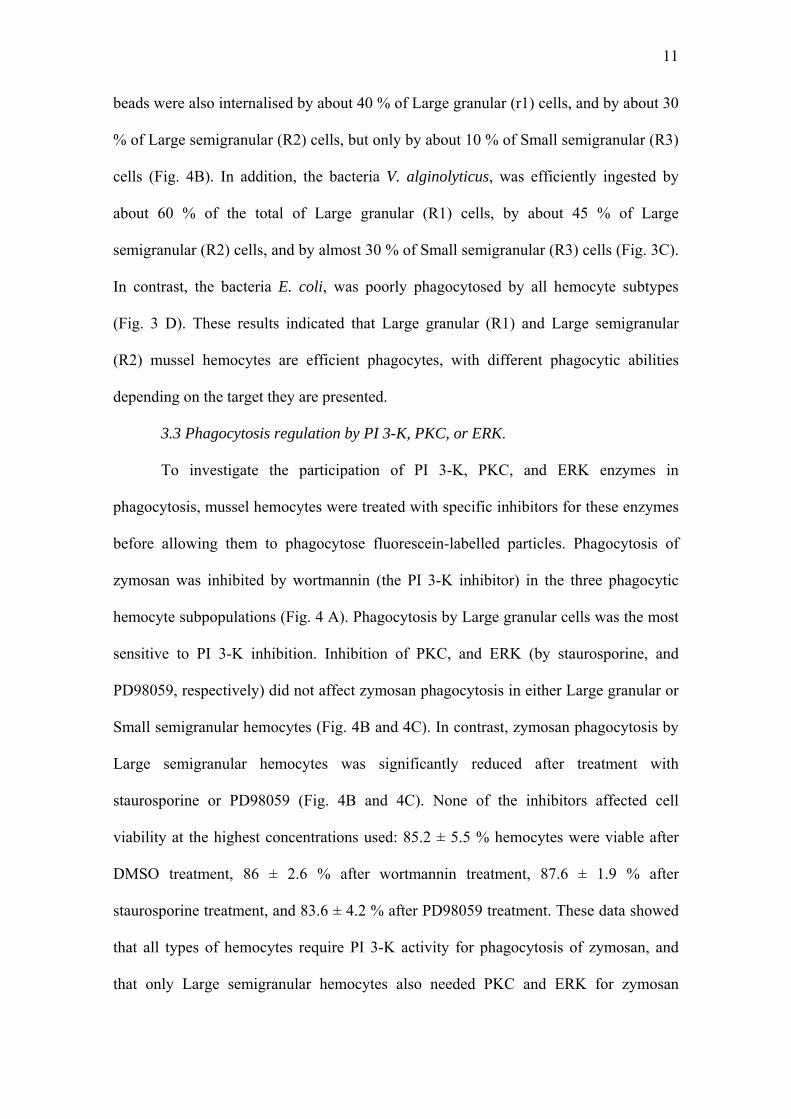
3.2 Large granular, Large semigranular, and Small semigranular hemocyte
subpopulations are phagocytic.
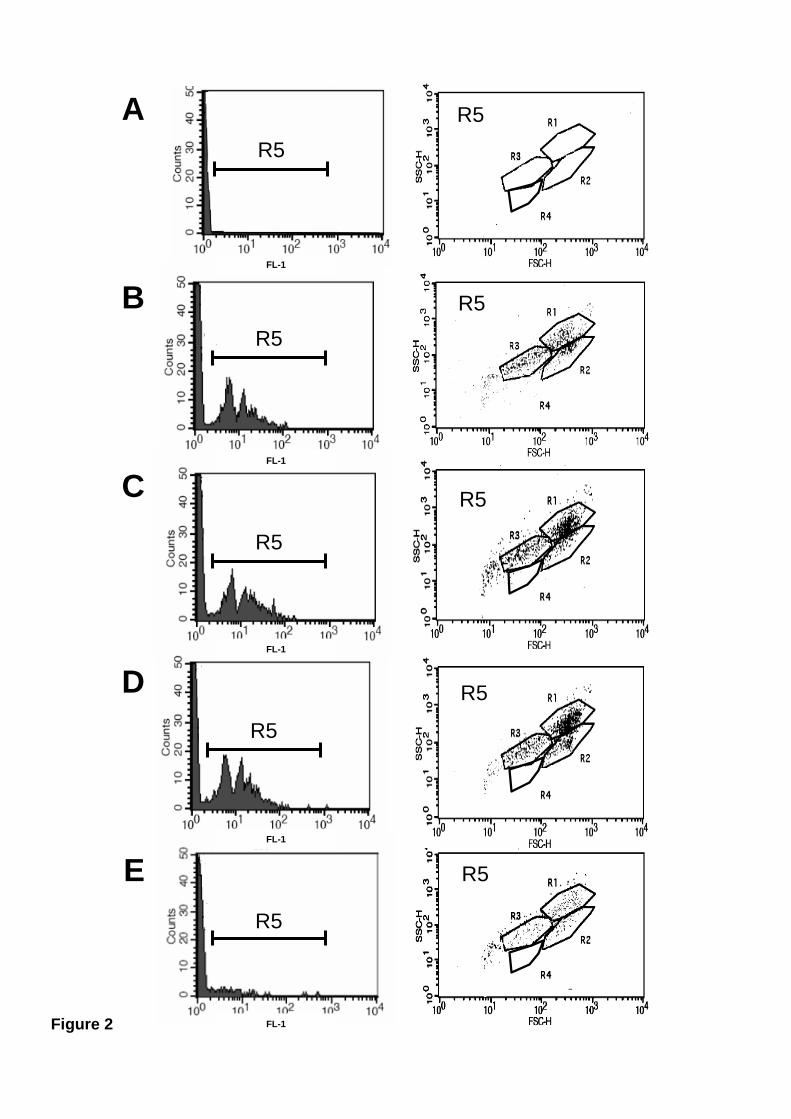
To assess the phagocytosis potential of the various mussel hemocyte subtypes,
cells were mixed with several fluorescein-labelled phagocytic targets, allowed to ingest
these targets, and then analysed by flow cytometry. Hemocytes in regions R1 (Large
granular hemocytes), R2 (Large semigranular hemocytes), and R3 (Small semigranular
hemocytes) were all capable of phagocytosis, although at different levels (Fig. 2).
Zymosan (Fig. 2B), latex beads (Fig. 2C), and the bacteria V. alginolyticus (Fig. 2D)
were ingested efficiently by all Large granular (R1), Large semigranular (R2), and
Small semigranular (R3) hemocytes. In contrast, the bacteria E. coli, which appears to
be non-pathogenic for molluscs [50, 51], was poorly phagocytosed (Fig. 2E). Small
hyaline (R4) hemocytes were not phagocytic at all (Fig. 2). Large granular (R1)
hemocytes were the most efficient phagocytic cells, followed by Large semigranular
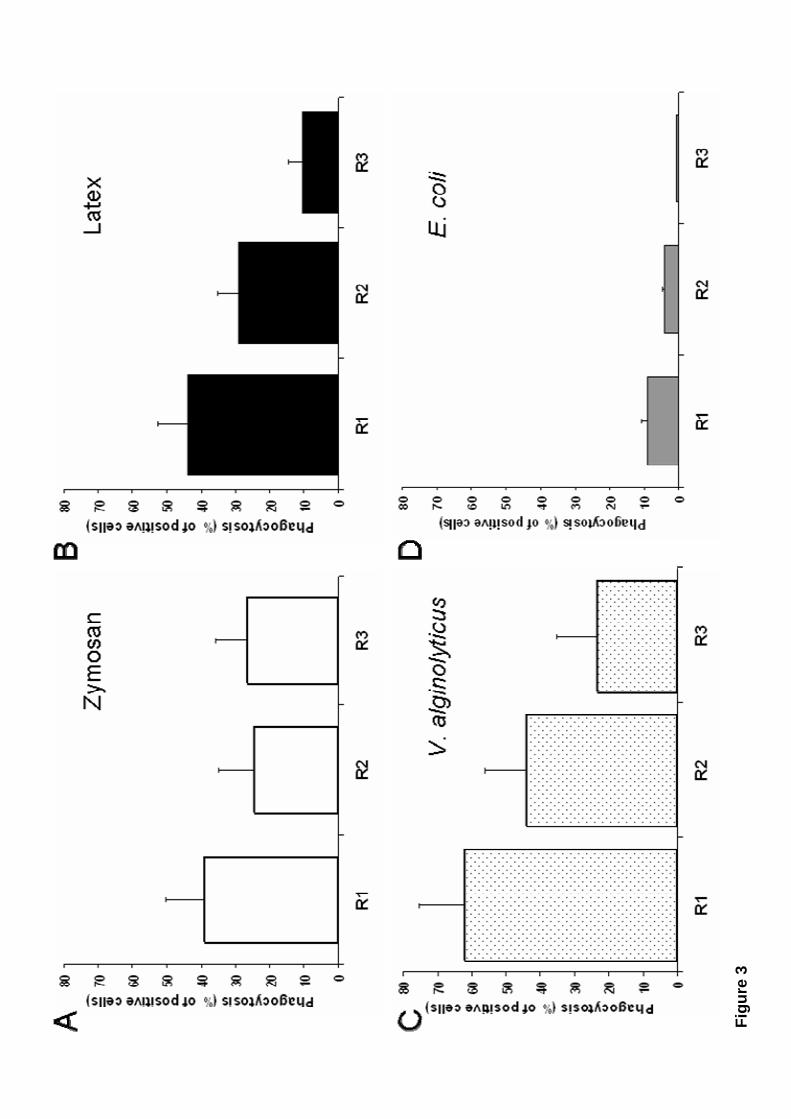
(R2) hemocytes, and then Small semigranular (R3) hemocytes (Fig. 3). Zymosan was
ingested by about 40 % of the total of Large granular (R1) cells, and by about 25 % of
the total of Large semigranular (R2) or Small semigranular (R3) cells (Fig. 3A). Latex
11
beads were also internalised by about 40 % of Large granular (r1) cells, and by about 30
% of Large semigranular (R2) cells, but only by about 10 % of Small semigranular (R3)
cells (Fig. 4B). In addition, the bacteria V. alginolyticus, was efficiently ingested by
about 60 % of the total of Large granular (R1) cells, by about 45 % of Large
semigranular (R2) cells, and by almost 30 % of Small semigranular (R3) cells (Fig. 3C).
In contrast, the bacteria E. coli, was poorly phagocytosed by all hemocyte subtypes
(Fig. 3 D). These results indicated that Large granular (R1) and Large semigranular
(R2) mussel hemocytes are efficient phagocytes, with different phagocytic abilities
depending on the target they are presented.
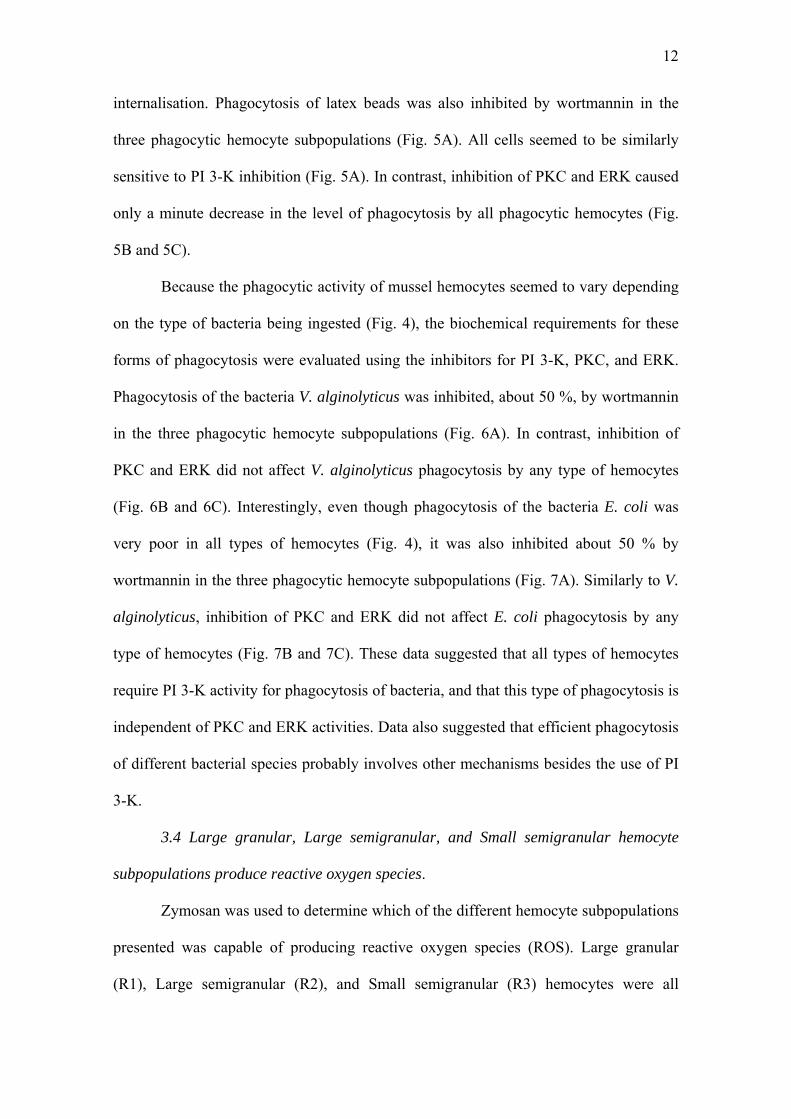
3.3 Phagocytosis regulation by PI 3-K, PKC, or ERK.
To investigate the participation of PI 3-K, PKC, and ERK enzymes in
phagocytosis, mussel hemocytes were treated with specific inhibitors for these enzymes
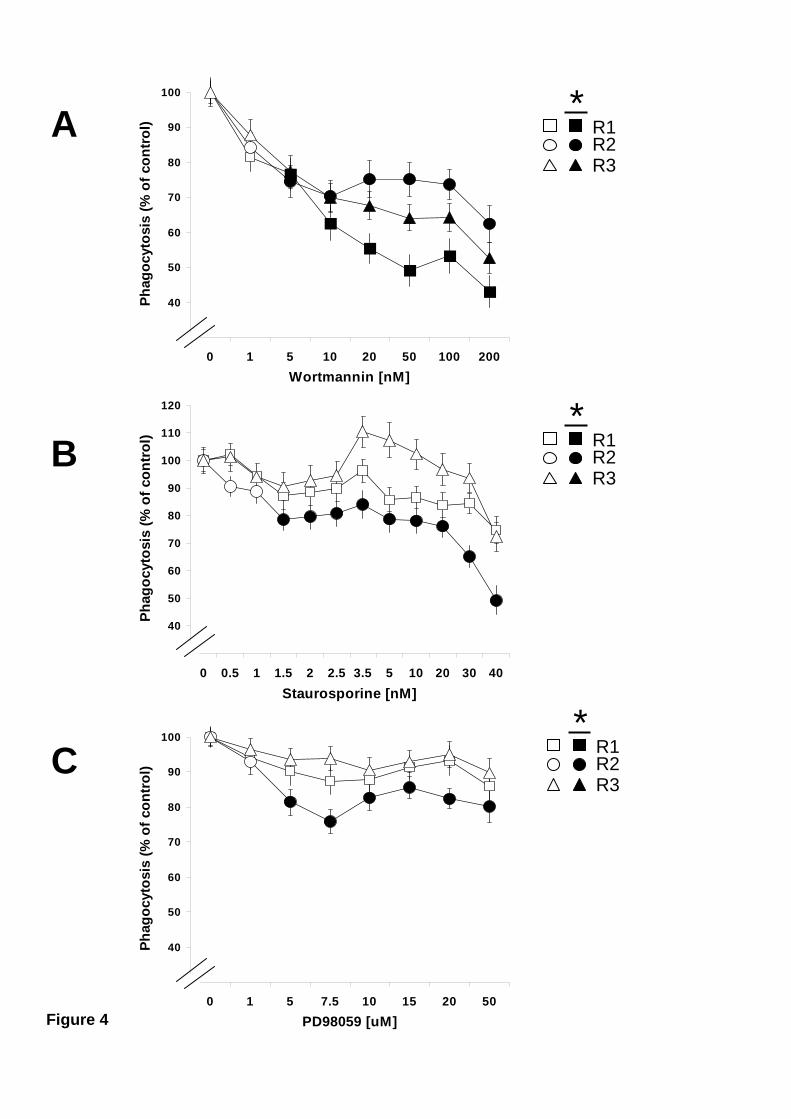
before allowing them to phagocytose fluorescein-labelled particles. Phagocytosis of
zymosan was inhibited by wortmannin (the PI 3-K inhibitor) in the three phagocytic
hemocyte subpopulations (Fig. 4 A). Phagocytosis by Large granular cells was the most
sensitive to PI 3-K inhibition. Inhibition of PKC, and ERK (by staurosporine, and
PD98059, respectively) did not affect zymosan phagocytosis in either Large granular or
Small semigranular hemocytes (Fig. 4B and 4C). In contrast, zymosan phagocytosis by
Large semigranular hemocytes was significantly reduced after treatment with
staurosporine or PD98059 (Fig. 4B and 4C). None of the inhibitors affected cell
viability at the highest concentrations used: 85.2 ± 5.5 % hemocytes were viable after
DMSO treatment, 86 ± 2.6 % after wortmannin treatment, 87.6 ± 1.9 % after
staurosporine treatment, and 83.6 ± 4.2 % after PD98059 treatment. These data showed
that all types of hemocytes require PI 3-K activity for phagocytosis of zymosan, and
that only Large semigranular hemocytes also needed PKC and ERK for zymosan
12
internalisation. Phagocytosis of latex beads was also inhibited by wortmannin in the
three phagocytic hemocyte subpopulations (Fig. 5A). All cells seemed to be similarly
sensitive to PI 3-K inhibition (Fig. 5A). In contrast, inhibition of PKC and ERK caused
only a minute decrease in the level of phagocytosis by all phagocytic hemocytes (Fig.
5B and 5C).
Because the phagocytic activity of mussel hemocytes seemed to vary depending
on the type of bacteria being ingested (Fig. 4), the biochemical requirements for these
forms of phagocytosis were evaluated using the inhibitors for PI 3-K, PKC, and ERK.
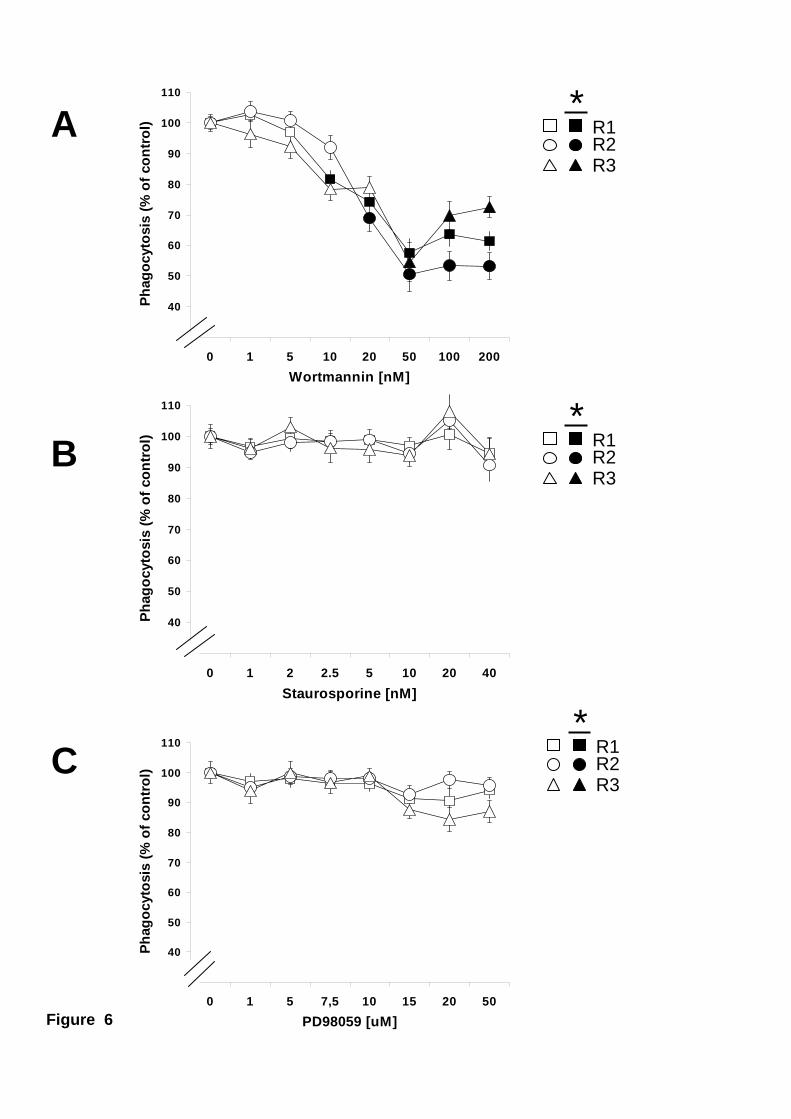
Phagocytosis of the bacteria V. alginolyticus was inhibited, about 50 %, by wortmannin
in the three phagocytic hemocyte subpopulations (Fig. 6A). In contrast, inhibition of
PKC and ERK did not affect V. alginolyticus phagocytosis by any type of hemocytes
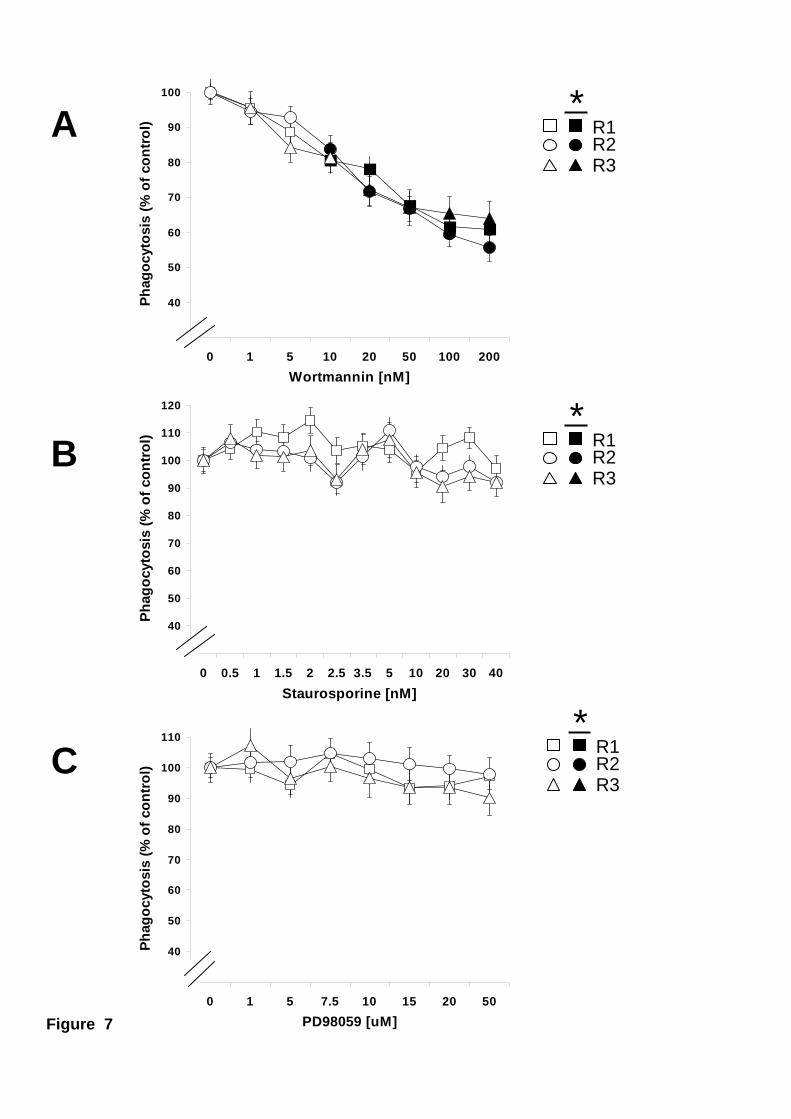
(Fig. 6B and 6C). Interestingly, even though phagocytosis of the bacteria E. coli was
very poor in all types of hemocytes (Fig. 4), it was also inhibited about 50 % by
wortmannin in the three phagocytic hemocyte subpopulations (Fig. 7A). Similarly to V.
alginolyticus, inhibition of PKC and ERK did not affect E. coli phagocytosis by any
type of hemocytes (Fig. 7B and 7C). These data suggested that all types of hemocytes
require PI 3-K activity for phagocytosis of bacteria, and that this type of phagocytosis is
independent of PKC and ERK activities. Data also suggested that efficient phagocytosis
of different bacterial species probably involves other mechanisms besides the use of PI
3-K.
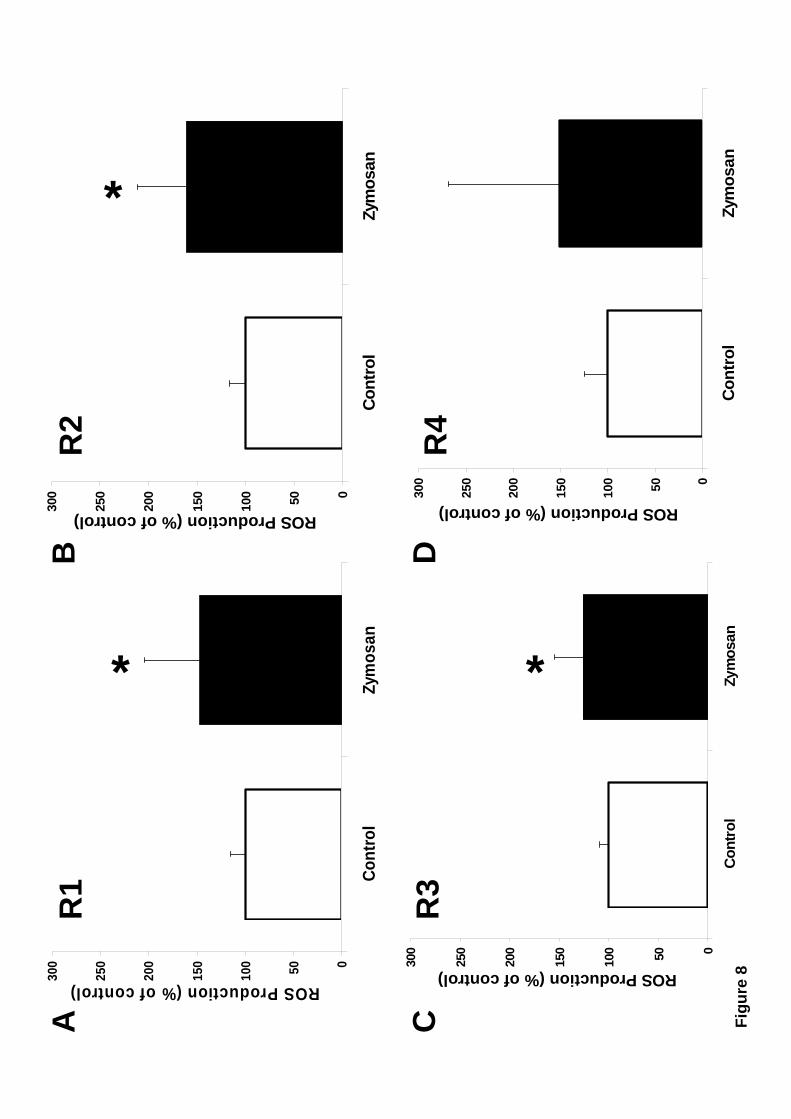
3.4 Large granular, Large semigranular, and Small semigranular hemocyte
subpopulations produce reactive oxygen species.
Zymosan was used to determine which of the different hemocyte subpopulations
presented was capable of producing reactive oxygen species (ROS). Large granular
(R1), Large semigranular (R2), and Small semigranular (R3) hemocytes were all
13
capable of ROS production at comparable levels (Fig. 8). Small hyaline (R4) hemocytes
showed a modest increase in ROS, but this increment was not statistically different from
control (unstimulated) cells (Fig.8).
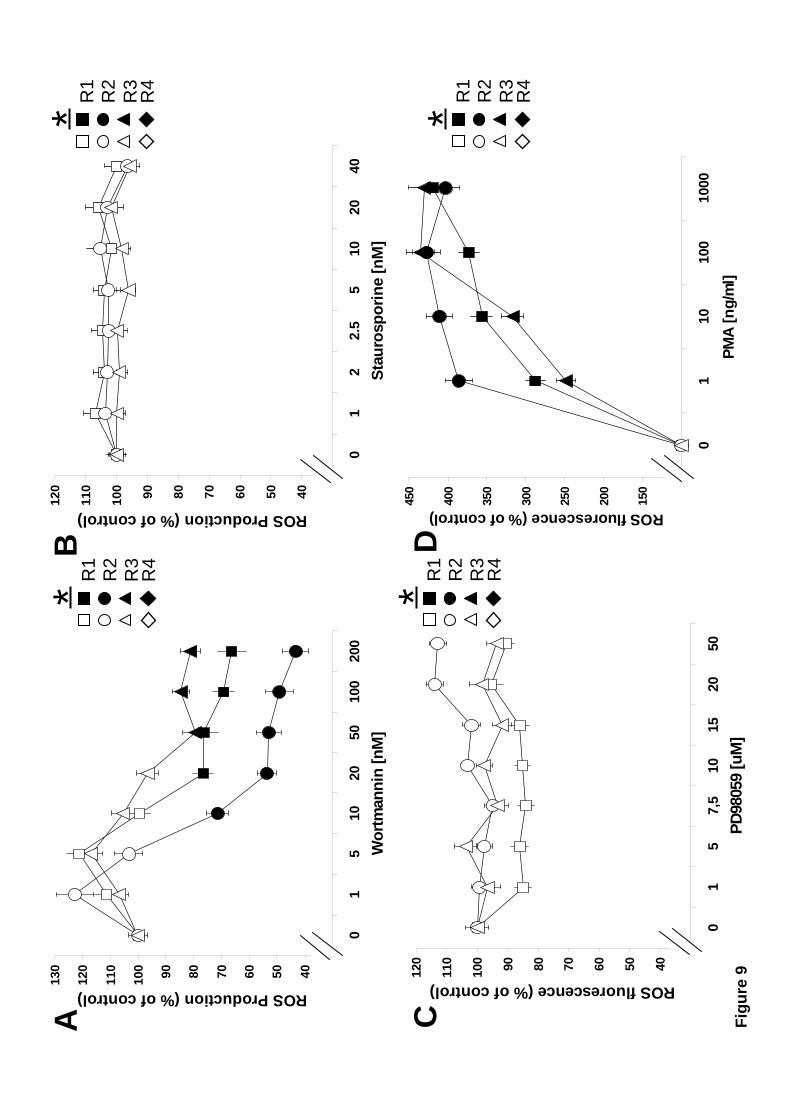
3.5 Regulation of reactive oxygen species production by PI 3-K or PKC.
Similarly to phagocytosis, the participation of certain enzymes, such as PI 3-K,
PKC, and ERK, in ROS production was investigated with the use of pharmacological
inhibitors. Zymosan-induced ROS production was inhibited by wortmannin in the three
phagocytic hemocyte subpopulations (Fig. 9A). Large semigranular cells were the most
sensitive to PI 3-K inhibition. Inhibition of PKC, and ERK did not affect ROS
production by any of the hemocyte subpopulations (Fig. 9B and 9C). Although, PKC
inhibition by staurosporine did not affect zymosan-induced ROS production, it has been
reported in other cell types that PKC is in fact a good activator of the respiratory burst
[52, 53]. Treatment of mussel hemocytes with the phorbol ester PMA, a well known
activator of PKC, indeed resulted in strong ROS production independently of any other
stimulus. This increase in ROS production was three to four-fold in the phagocytic
hemocyte subpopulations (Fig. 9D). In Small hyaline (R4) cells, PMA-induced
activation of PKC caused only a small increment in ROS production (not shown). These
data showed that Large granular (R1), Large semigranular (R2), and Small semigranular
(R3) hemocyte subtypes require PI 3-K activity for zymosan-induced ROS production,
and that neither PKC, nor ERK, participate in this cell response. However, PKC seems
to participate in other pathways that lead to an even stronger activation of the
respiratory burst.
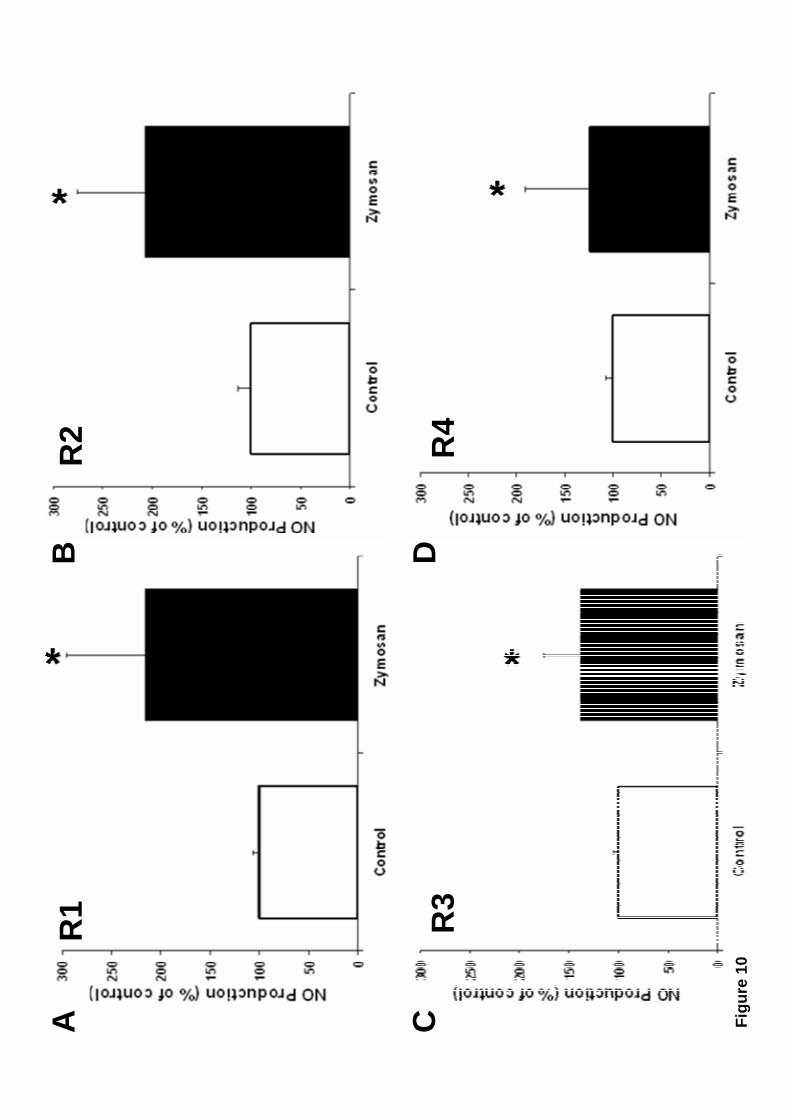
3.6 All hemocyte subpopulations produce nitric oxide.
All hemocyte subpopulations were capable of producing nitric oxide (NO) in
response to zymosan (Fig. 10). Large granular (R1), and Large semigranular (R2)
14
hemocytes presented NO production that doubled the basal NO levels of unstimulated
cells (Fig. 10A and 10B). Small semigranular (R3) and Small hyaline (R4) hemocytes
showed a smaller increase in NO production, but this increment was statistically
different from control (unstimulated) cells (Fig. 10C and 10D).
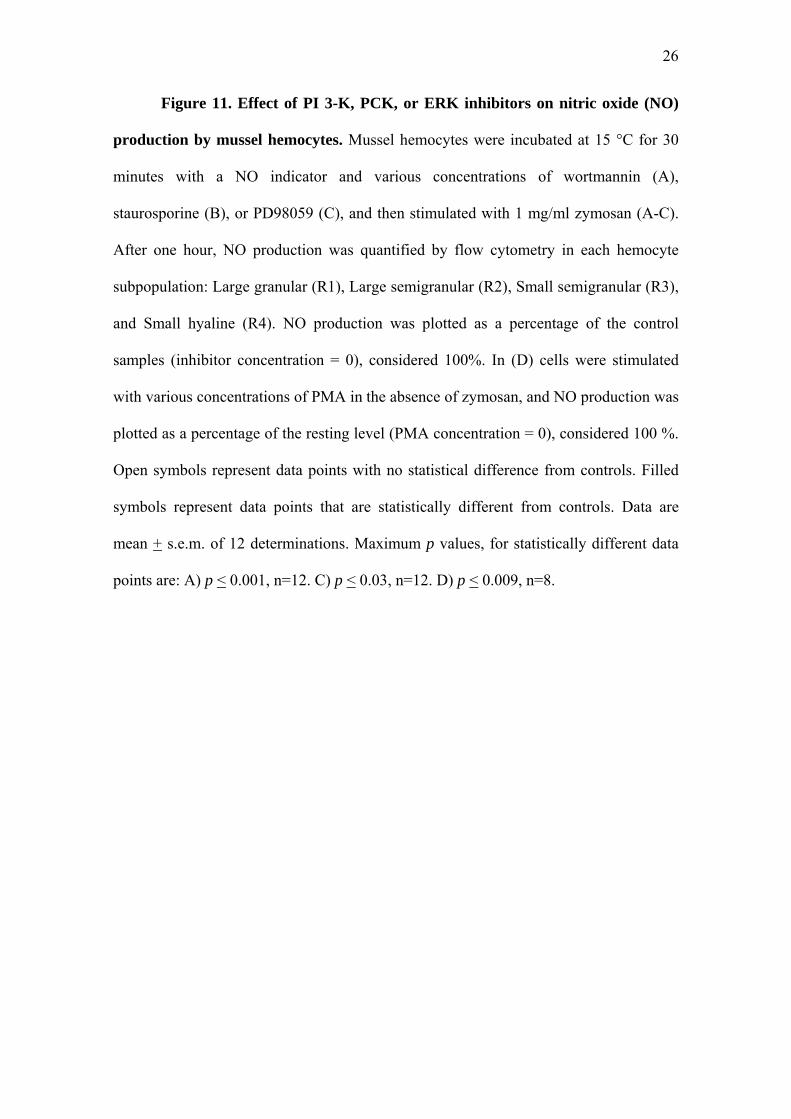
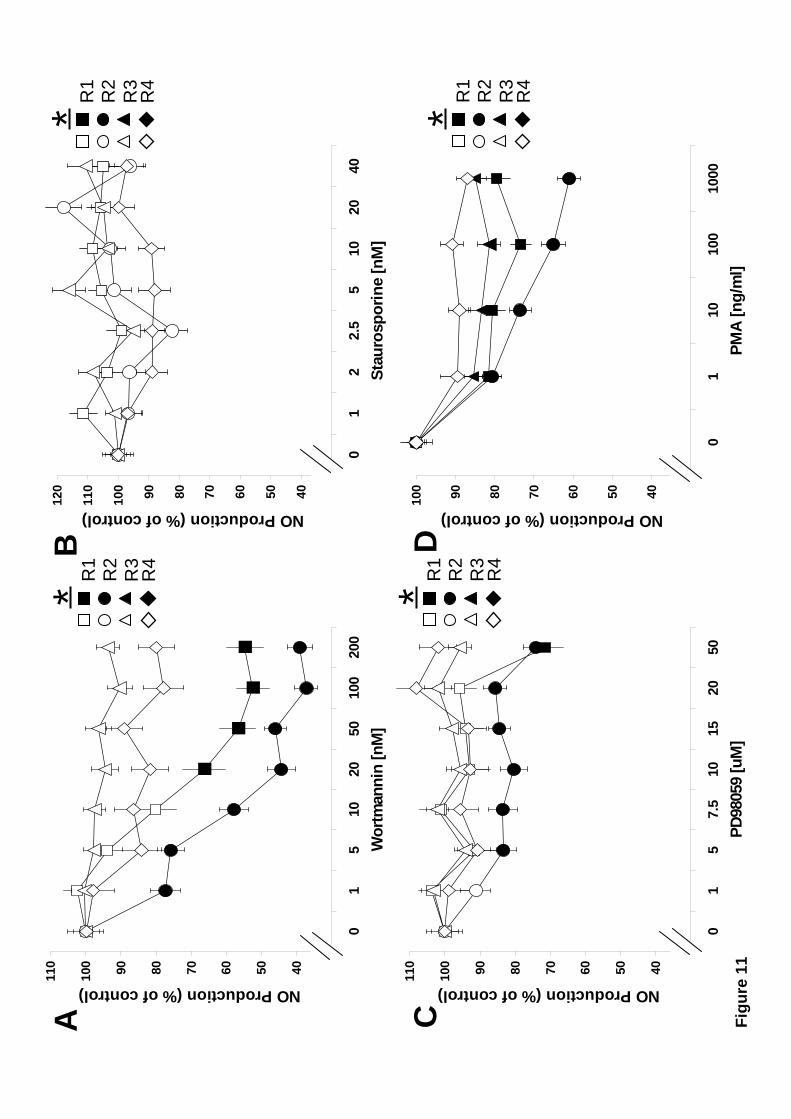
3.7 Regulation of NO production by PI 3-K, PKC, or ERK.
Similarly to ROS production, the participation of PI 3-K, PKC, and ERK, in NO
production was investigated with the use of pharmacological inhibitors. Zymosan-
induced NO production was inhibited by wortmannin in the Large granular and Large
semigranular hemocyte subpopulations (Fig. 11A). Large semigranular cells were also
the most sensitive to PI 3-K inhibition. The small zymosan-induced increase in NO
production by Small semigranular and Small hyaline hemocytes was not affected by
wortmannin (Fig. 11A). Inhibition of PKC, did not affect NO production in any of the
hemocyte subpopulations (Fig. 11B), suggesting that PKC is not used for zymosan-
induced NO production. Similarly to phagocytosis (Fig. 4C) NO production was only
affected by EKR inhibition in Large semigranular hemocytes (Fig. 11C). Interestingly,
in absence of any other stimulus, PKC activation by PMA resulted in diminished levels
of NO in phagocytic hemocytes (Fig. 11D). These data suggest that efficient NO
production requires PI 3-K (in Large granular and Large semigranular cells), and
possibly ERK (in Large semigranular cells) activities.
15
4. Discussion.
The information regarding cell functions in invertebrate hemolymph has
increased substantially over the last decade, but still hemocyte classification remains
controversial. This is partially due to dissimilar classification criteria adopted for each
species. Classifications have been based on morphology and cytochemical properties for
the most part, and to a lesser extent on cell functions. Using flow cytometry techniques,
we have identified four morphologically distinct hemocyte subpopulations in the mussel
M. galloprovincialis: Large granular cells (R1), Large semigranular cells (R2), Small
semigranular cells (R3), and Small Hyaline cells (R4). Through the use of flow
cytometry we were able to show, for the first time, the capacity for phagocytosis, ROS
production, and NO production, of clearly defined hemocyte subpopulations in a
mollusc species. From the four M. galloprovincialis hemocyte subpopulations, we
identified two professional phagocytes: Large granular cells (R1), and Large
semigranular cells (R2). As in mammals [19, 23, 24, 34, 35], the two M.
galloprovincialis professional phagocytes present high phagocytic capacity, and
produce high levels of ROS and NO upon activation. M. galloprovincialis Small
semigranular (R3) hemocytes appear to play a minor role in phagocytosis, and ROS and
NO production, and it is possible that they participate in other immune functions, such
as coagulation, encapsulation, or defence against viruses. M. galloprovincialis Small
hyaline hemocytes (R4) present no phagocytic capacity, and is very likely that these
cells are specialized for coagulation or encapsulation, as has been suggested for
hyalinocytes of other invertebrates [10]. It is thus clear that M. galloprovinciallis
hemocytes are specialized cells fulfilling specific tasks in the context of host defence.
In agreement with our finding that M. galloprovincialis Large granular and
Large semigranular hemocytes are highly phagocytic, others have reported in various
16
invertebrates that granulocytes are efficient phagocytes [9, 20, 21, 30, 32]. M.
galloprovincialis Small hyaline M. galloprovincialis hemocytes were, on the other
hand, non-phagocytic. Contradictory information exists regarding the phagocytic
capacity of hyaline hemocytes. While some reports indicate a lack of phagocytic
potential in these cells [9, 32], other reports indicate a low phagocytic potential in
hyaline hemocytes [21, 30]. Considering that hyaline hemocytes are reported to posses,
at the best, a low level of phagocytosis, we are inclined to believe that these cells
perform defence mechanisms other than phagocytosis.
Many marine molluscs posses great economical importance as a source of
nourishment for humans; and also as possible sources of microbicidal molecules that
could be used to treat human diseases [54]. Therefore, the interest in understanding the
basic mechanisms that govern invertebrate immune systems has risen in the last few
years. In mammalian leukocytes, enzymes of the PI 3-K, PKC, and ERK families
appear to be central in the regulation of host defence mechanism including
phagocytosis, the respiratory burst, and NO production [25, 44, 52, 53, 55-61]. The
participation of PI 3-K, PKC, and ERK families of kinases in invertebrate defence
mechanisms is just starting to be explored. The existence of enzymes of these families
in mollusc species is mostly inferred from experiments in which cell responses are
blocked by pharmacological inhibitors [33, 62-65]. In a few species, including M.
galloprovincialis, the existence of enzymes of these families has been demonstrated by
Western-blotting techniques, using antibodies directed against enzymes of mammalian
origin [64, 66-68]. Thus it appears that PI 3-K, PCK, and ERK enzymes have been
conserved through evolution.
Here we show for the first time that, as in vertebrates [25, 44], the regulation of
hemocyte phagocytosis by enzymes of the PI 3-K, PKC, and ERK families is subjected
17
to the nature of the cell subtype, and to the nature of the particle triggering the
phagocytic process. In M. galloprovincialis PI 3-K appears to have a conserved role in
phagocytosis regulation, independently of the hemocyte subtype, or the nature of the
phagocytic target. In mammals, PI 3-K also participates in the regulation of
phagocytosis mediated by various membrane receptors [25]. The role of PI 3-K in the
regulation of phagocytosis thus appears to be evolutionarily conserved. The role of ERK
and PKC in phagocytosis regulation, on the other hand, is less generalized, and is
possibly restricted to specific targets (e.g. yeast, or bacteria), or to specific hemocyte
subtypes (e.g. Large semigranular cells). It is possible that, as has been suggested in
mammals [25], these differences in the utilisation of PKC, or ERK for phagocytosis are
due to differential stimulation of phagocytic receptors. However, phagocytic receptors
in most invertebrates, including molluscs, are yet to be characterised.
PI 3-K played an important role in role in the regulation of ROS production by
different M. galloprovincialis hemocyte subtypes. This enzyme has also been reported
to regulate ROS production in vertebrates [57, 58], which suggests that regulation of the
respiratory burst by PI 3-K is an evolutionarily-conserved mechanism. Zymosan-
induced ROS production by M. galloprovincialis hemocytes was, on the other hand,
independent of PKC, or ERK. In agreement with our data, other reports suggest that, in
mussels, ERK is not required for bacterial killing mechanisms possibly related to ROS
production [63, 67]. So, it seems that ERK is not used by any type of mussel hemocytes
for ROS production. These observations also suggest the existence of alternative ERK-
and PKC-independent signalling pathways regulating the respiratory burst in M.
galloprovincialis hemocytes. In contrast, it has been reported that in snails, ERK is
required for the respiratory burst [65], and for regulation of ROS production [69]. One
possible explanation for this is that differences in ERK and PKC utilisation for the
18
regulation of ROS production are species-specific. The analysis of ROS production
among closely-related species will probably help to clarify this issue.
Participation of PI 3-K in the regulation of NO production was restricted to M.
galloprovincialis hemocytes presenting the highest levels of NO production: the
professional phagocytes Large granular, and Large semigranular hemocytes. It is thus
very likely that, in M. galloprovincialis professional phagocytes, PI 3-K is central in the
regulation of pathogen killing, by coordinating efficient phagocytosis with efficient
ROS and NO production. ERK, on the other hand, regulated NO production only in
Large semigranular hemocytes. In snails ERK was also reported to be required for NO
production [43], but the methodology used did not allow for the identification of the
hemocyte subtypes producing NO. Our data support the idea that ERK utilisation for the
regulation of NO production is hemocyte subtype-specific, since only one type of
hemocytes showed ERK participation in this cell response. However, ERK utilization
for NO production might still exist for other types of stimuli. This is to say, that ERK
participation may be just the result of differential membrane receptor stimulation. We
only tested NO production in response to zymosan. Other stimuli need to be tested in
order to decide whether ERK is used for NO production by only one type of hemocyte
as we show here, or whether ERK is needed depending on the receptor engaged on the
hemocyte plasma membrane. Both possibilities seem at the moment equally possible.
PKC played no role in the regulation of zymosan-induced NO production in any
of the M. galloprovincialis hemocyte subtypes, suggesting the existence of PKC
independent mechanisms for NO production. By measuring NO metabolites, rather than
NO itself, others have suggested that PKC indeed participates in the regulation of NO
production [38, 41-43]. Interestingly, we observed that direct activation of PKC with
PMA actually reduces the basal levels of NO in the ROS-producing Large granular,
19
Large semigranular, and Small semigranular hemocytes. This effect of PMA was more
marked in the Large granular and Large semigranular hemocytes. the cell types that also
presented the strongest respiratory burst. The formation of peroxynitrite, from
respiratory burst-derived superoxide anions and NO, has been recorded in M.
galloprovincialis hemocytes after PMA stimulation [38]. It is thus possible that the
PMA-induced reduction in NO levels is due to peroxynitrite formation; which would
consume the available NO required for the oxidation of the NO-specific indicator. If this
is the case, hemocyte-pathogen interactions that resulted in PKC activation would be
predicted to promote the production of large amounts peroxynitrite, and rapid pathogen
killing.
Lack of a consensus criterion for mollusc hemocyte classification makes it
difficult to integrate the information on the basic mechanisms of invertebrate host
defence, obtained by different research groups. See for example: [6, 14, 70, 71].
Unifying criteria for hemocyte classification is thus urgent, and should involve a
standardised methodology for the separation of hemocyte subtypes, as well as for their
morphological and functional characterization. Due to its fast and powerful analytic
capacity, allowing for accurate cell separation, we propose that flow cytometry could be
used as standard methodology for the classification of invertebrate hemocytes. Given
the availability of a wide variety of fluorescent phagocytic particles, and a wide array of
cellular probes tailored for the measurement of various cellular functions, flow
cytometry easily allows for the functional characterization of hemocyte subtypes. The
strong potential of flow cytometry for hemocyte classification is therefore illustrated by
our results, as we were able to specifically record phagocytosis, ROS production, and
NO production, in clearly defined hemocyte subpopulations.
20
It is important to bear in mind that the gating and separation of complex cell
mixtures requires careful selection of FSC and SSC amplification, and threshold
settings [72]. Failure to accurately adjust these critical flow cytometry parameters may
preclude the visualization of discernible cell subpopulations in dot-plots. For example, a
previous attempt to study M. galloprovincialis hemocytes by flow cytometry reported
only one hemocyte population visualized in dot-plots [73]. This is clearly at odds with
the large differences in hemocyte size and shape observed in mussel hemolymph
preparations under the microscope. Contradictory results, when using flow cytometry,
have also been reported in the American oyster Crassostrea virginica [71, 74]. The
selection of FSC and SSC amplification, and threshold settings is thus critical for the
identification of cell subpopulations. Fortunately, most flow cytometers are now
equipped with software containing tools that aid in the identification and gating of
separate cell populations. It is therefore very likely that flow cytometry can easily be
applied to the morphological and functional characterization of hemocytes of many
invertebrate species.
In conclusion, the immune system of M. galloprovinciallis is composed of at
least four hemocyte subtypes, specialized to fulfil specific tasks in the context of host
defence. Two out of these four hemocyte subtypes, Large granular and Large
semigranular cells, are professional phagocytes, that share features with mammalian
professional phagocytes. PI 3-K appears to have an evolutionarily-conserved role in the
regulation of phagocytosis, and in ROS and NO production. Differential utilisation of
PKC, or ERK for the regulation of phagocytosis of diverse targets, and for the
regulation of ROS and NO production, reveals hemocyte subtype-specific variations in
signalling mechanisms, which could be due to the differential expression of membrane

21
receptors. The search for these invertebrate “immune receptors” shall be an exciting
quest in the near future.
22
5. Figure Legends.
Figure 1. Four hemocyte subpopulations are present in mussel hemolymph.
(A) Mussel hemolymph was observed directly by phase-contrast microscopy at 40 X
magnification. (B) Dot-plots of hemolymph from four individual mussels, analysed by
size (FSC) vs. cellular complexity (SSC), reveal four distinct cellular subpopulations,
desiganted R1 through R4. Particles detected in the lower left corner of the dot-plots
were cell debris and unidentified material (Deb). C-F) Mussel hemocyte subpopulations
R1 to R4 were physically separated by flow cytometry. (C) R1 cells, (D) R2 cells, (E)
R3 cells, (F) R4 cells. Cells in each region were observed directly by phase-contrast
microscopy (upper panels), or stained with Hemacolor and observed by light
transmission microscopy (lower panels).
Figure 2. Mussel Large granular (R1), Large semigranular (R2), and Small
semigranular (R3) hemocyte subpopulations present phagocytic capacity. Mussel
hemocytes were incubated at 15 ºC for two hours with nothing (A), or with different
fluorescein-labelled phagocytic targets: (B) zymosan, (C) latex beads, (D) V.
alginolyticus, (E) E. coli. Left panels show fluorescence histograms of hemolymph
samples after phagocytosis. Right panels show dot-plots of cells within the fluorescence
gate (R5) in the corresponding left-hand histogram.
Figure 3. Mussel hemocyte subpopulations have different phagocytic
efficiency. Mussel hemocytes were incubated at 15 ºC for two hours with different
fluorescein-labelled phagocytic targets: (A) zymosan, (B) latex beads, (C) V.
alginolyticus, (D) E. coli. Phagocytosis is expressed as % of positive cells (cells
internalising at least one fluorescent particle) from the total number of cells within each
hemocyte region (R1, R2, or R3). Data are mean + S.D. of over 10 determinations.
23
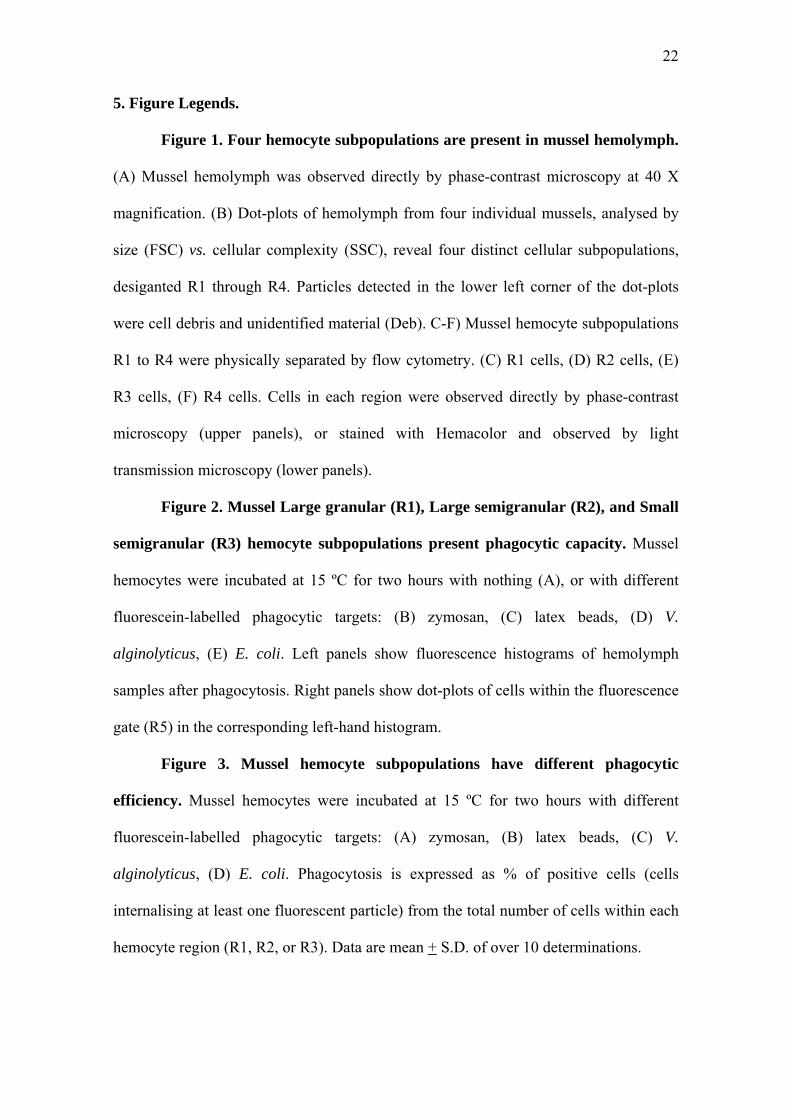
Figure 4. Effect of PI 3-K, PCK, or ERK inhibitors on phagocytosis of
zymosan. Mussel hemocytes were incubated at 15 ºC for 30 minutes with various
concentrations of wortmannin (A), staurosporine (B), or PD98059 (C) before allowing
them to phagocytose fluorescein-labelled zymosan. Phagocytosis for the different
hemocyte subpopulations, Large granular (R1), Large semigranular (R2), and Small
semigranular (R3) is expressed as a percentage of control samples (inhibitor
concentration = 0), considered 100 %. Open symbols represent data points with no
statistical difference from controls. Filled symbols represent data points that are
statistically different from controls. Data are mean + s.e.m of 12-16 determinations.
Maximum p values, for statistically different data points are: A) p < 0.04, n=12. B) p <
0.03, n=16. C) p < 0.012, n=16.
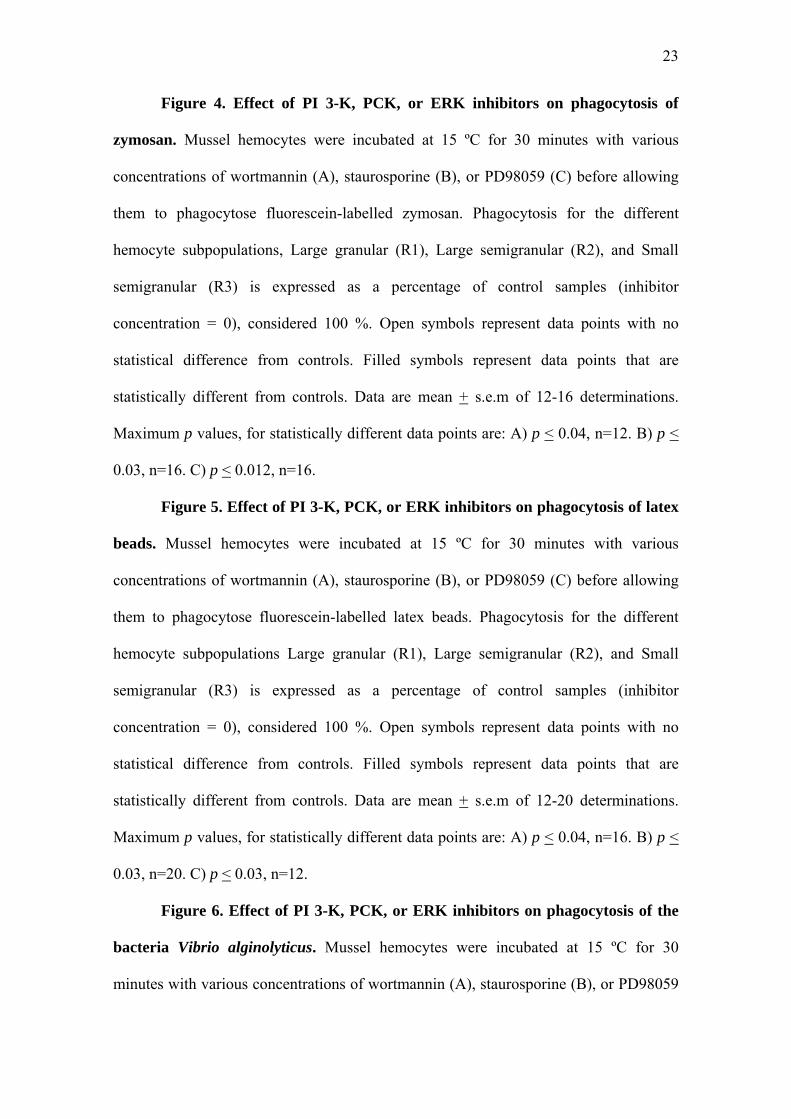
Figure 5. Effect of PI 3-K, PCK, or ERK inhibitors on phagocytosis of latex
beads. Mussel hemocytes were incubated at 15 ºC for 30 minutes with various
concentrations of wortmannin (A), staurosporine (B), or PD98059 (C) before allowing
them to phagocytose fluorescein-labelled latex beads. Phagocytosis for the different
hemocyte subpopulations Large granular (R1), Large semigranular (R2), and Small
semigranular (R3) is expressed as a percentage of control samples (inhibitor
concentration = 0), considered 100 %. Open symbols represent data points with no
statistical difference from controls. Filled symbols represent data points that are
statistically different from controls. Data are mean + s.e.m of 12-20 determinations.
Maximum p values, for statistically different data points are: A) p < 0.04, n=16. B) p <
0.03, n=20. C) p < 0.03, n=12.
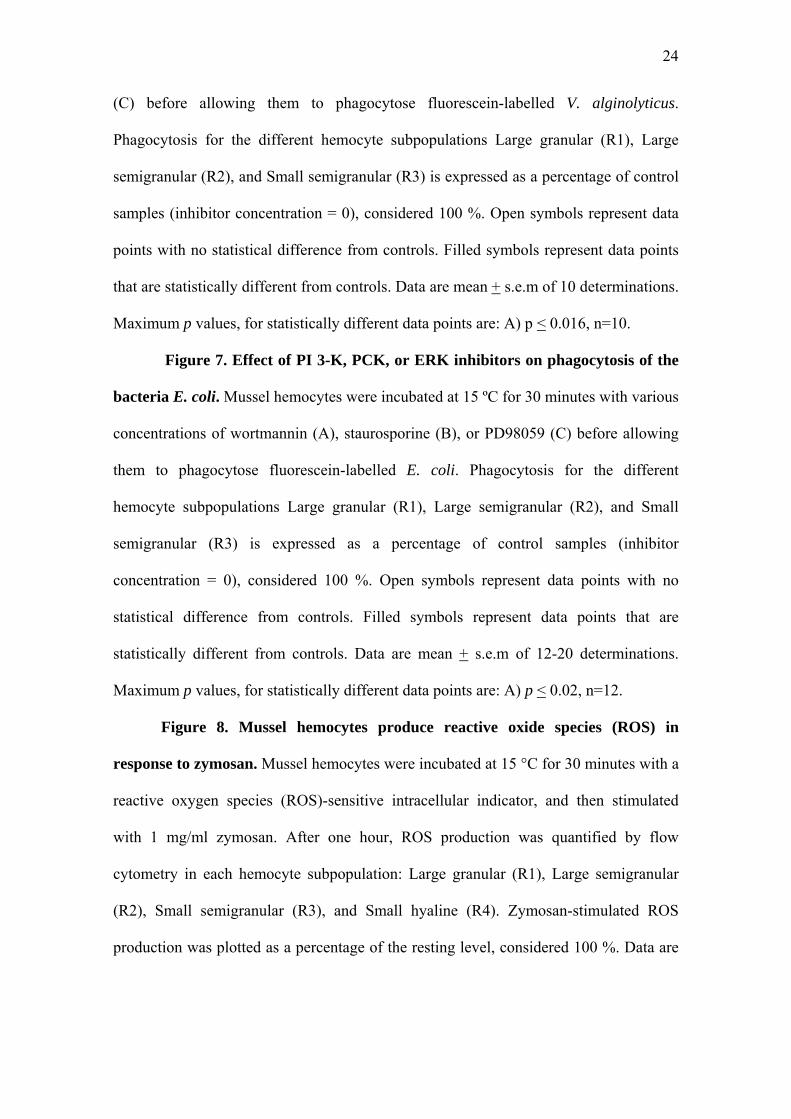
Figure 6. Effect of PI 3-K, PCK, or ERK inhibitors on phagocytosis of the
bacteria Vibrio alginolyticus. Mussel hemocytes were incubated at 15 ºC for 30
minutes with various concentrations of wortmannin (A), staurosporine (B), or PD98059
24
(C) before allowing them to phagocytose fluorescein-labelled V. alginolyticus.
Phagocytosis for the different hemocyte subpopulations Large granular (R1), Large
semigranular (R2), and Small semigranular (R3) is expressed as a percentage of control
samples (inhibitor concentration = 0), considered 100 %. Open symbols represent data
points with no statistical difference from controls. Filled symbols represent data points
that are statistically different from controls. Data are mean + s.e.m of 10 determinations.
Maximum p values, for statistically different data points are: A) p < 0.016, n=10.
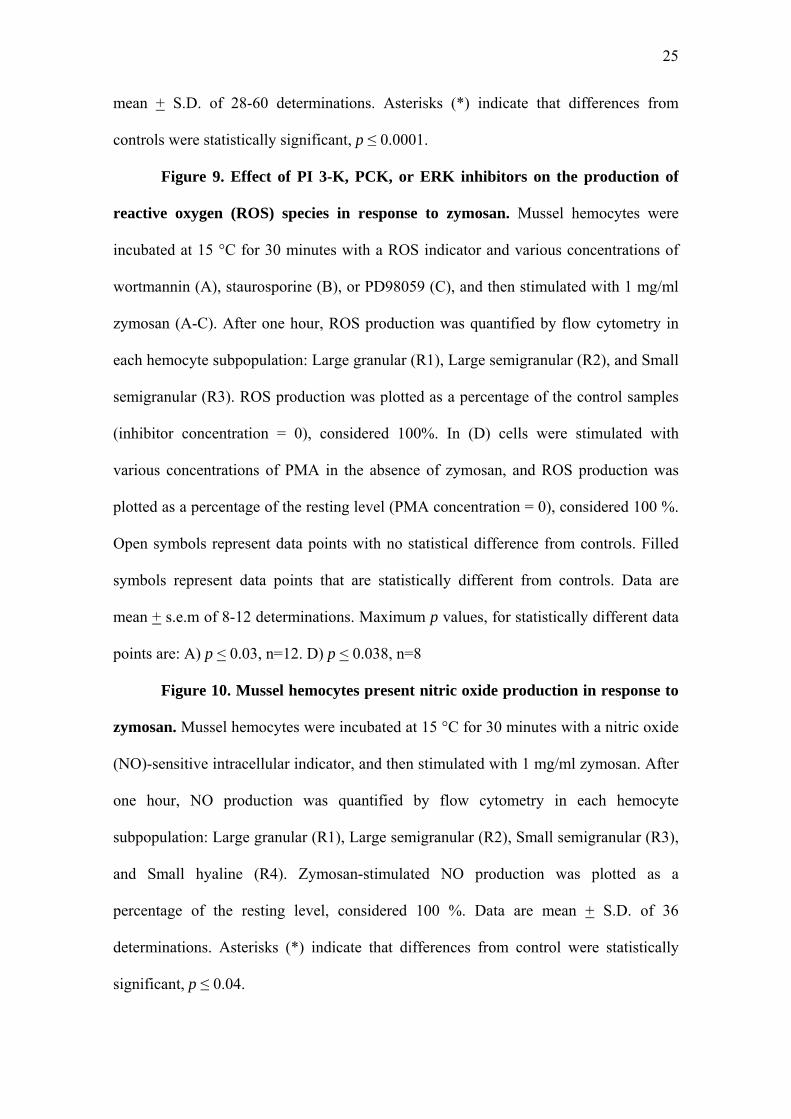
Figure 7. Effect of PI 3-K, PCK, or ERK inhibitors on phagocytosis of the
bacteria E. coli. Mussel hemocytes were incubated at 15 ºC for 30 minutes with various
concentrations of wortmannin (A), staurosporine (B), or PD98059 (C) before allowing
them to phagocytose fluorescein-labelled E. coli. Phagocytosis for the different
hemocyte subpopulations Large granular (R1), Large semigranular (R2), and Small
semigranular (R3) is expressed as a percentage of control samples (inhibitor
concentration = 0), considered 100 %. Open symbols represent data points with no
statistical difference from controls. Filled symbols represent data points that are
statistically different from controls. Data are mean + s.e.m of 12-20 determinations.
Maximum p values, for statistically different data points are: A) p < 0.02, n=12.
Figure 8. Mussel hemocytes produce reactive oxide species (ROS) in
response to zymosan. Mussel hemocytes were incubated at 15 °C for 30 minutes with a
reactive oxygen species (ROS)-sensitive intracellular indicator, and then stimulated
with 1 mg/ml zymosan. After one hour, ROS production was quantified by flow
cytometry in each hemocyte subpopulation: Large granular (R1), Large semigranular
(R2), Small semigranular (R3), and Small hyaline (R4). Zymosan-stimulated ROS
production was plotted as a percentage of the resting level, considered 100 %. Data are
25
mean + S.D. of 28-60 determinations. Asterisks (*) indicate that differences from
controls were statistically significant, p ≤ 0.0001.
Figure 9. Effect of PI 3-K, PCK, or ERK inhibitors on the production of
reactive oxygen (ROS) species in response to zymosan. Mussel hemocytes were
incubated at 15 °C for 30 minutes with a ROS indicator and various concentrations of
wortmannin (A), staurosporine (B), or PD98059 (C), and then stimulated with 1 mg/ml
zymosan (A-C). After one hour, ROS production was quantified by flow cytometry in
each hemocyte subpopulation: Large granular (R1), Large semigranular (R2), and Small
semigranular (R3). ROS production was plotted as a percentage of the control samples
(inhibitor concentration = 0), considered 100%. In (D) cells were stimulated with
various concentrations of PMA in the absence of zymosan, and ROS production was
plotted as a percentage of the resting level (PMA concentration = 0), considered 100 %.
Open symbols represent data points with no statistical difference from controls. Filled
symbols represent data points that are statistically different from controls. Data are
mean + s.e.m of 8-12 determinations. Maximum p values, for statistically different data
points are: A) p < 0.03, n=12. D) p < 0.038, n=8
Figure 10. Mussel hemocytes present nitric oxide production in response to
zymosan. Mussel hemocytes were incubated at 15 °C for 30 minutes with a nitric oxide
(NO)-sensitive intracellular indicator, and then stimulated with 1 mg/ml zymosan. After
one hour, NO production was quantified by flow cytometry in each hemocyte
subpopulation: Large granular (R1), Large semigranular (R2), Small semigranular (R3),
and Small hyaline (R4). Zymosan-stimulated NO production was plotted as a
percentage of the resting level, considered 100 %. Data are mean + S.D. of 36
determinations. Asterisks (*) indicate that differences from control were statistically
significant, p ≤ 0.04.
26
Figure 11. Effect of PI 3-K, PCK, or ERK inhibitors on nitric oxide (NO)
production by mussel hemocytes. Mussel hemocytes were incubated at 15 °C for 30
minutes with a NO indicator and various concentrations of wortmannin (A),
staurosporine (B), or PD98059 (C), and then stimulated with 1 mg/ml zymosan (A-C).
After one hour, NO production was quantified by flow cytometry in each hemocyte
subpopulation: Large granular (R1), Large semigranular (R2), Small semigranular (R3),
and Small hyaline (R4). NO production was plotted as a percentage of the control
samples (inhibitor concentration = 0), considered 100%. In (D) cells were stimulated
with various concentrations of PMA in the absence of zymosan, and NO production was
plotted as a percentage of the resting level (PMA concentration = 0), considered 100 %.
Open symbols represent data points with no statistical difference from controls. Filled
symbols represent data points that are statistically different from controls. Data are
mean + s.e.m. of 12 determinations. Maximum p values, for statistically different data
points are: A) p < 0.001, n=12. C) p < 0.03, n=12. D) p < 0.009, n=8.
27
6. References
1. Little, TJ, Hultmark, D, Read, AF. Invertebrate immunity and the limits of mechanistic immunology. Nat Immunol 2005; 6: 651-654.
2. Nicholas, HR, Hodgkin, J. Responses to infection and possible recognition strategies in the innate immune system of Caenorhabditis elegans. Mol Immunol 2004; 41: 479-493.
3. Iwanaga, S, Lee, BL. Recent advances in the innate immunity of invertebrate animals. J Biochem Mol Biol 2005; 38: 128-150.
4. de Azambuja, P, Garcia, ES, Ratcliffe, NA. Aspects of classification of Hemiptera hemocytes from six triatomine species. Mem Inst Oswaldo Cruz 1991; 86: 1-10.
5. Hirose, E, Shirae, M, Saito, Y. Ultrastructures and classification of circulating hemocytes in 9 botryllid ascidians (chordata: ascidiacea). Zoolog Sci 2003; 20: 647-656.
6. Allam, B, Ashton-Alcox, KA, Ford, SE. Flow cytometric comparison of haemocytes from three species of bivalve molluscs. Fish Shellfish Immunol 2002; 13: 141-158.
7. Battison, A, Cawthorn, R, Horney, B. Classification of Homarus americanus hemocytes and the use of differential hemocyte counts in lobsters infected with Aerococcus viridans var. homari (Gaffkemia). J Invertebr Pathol 2003; 84: 177-197.
8. Dikkeboom, R, Tijnagel, JM, van der Knaap, WP. Monoclonal antibody recognized hemocyte subpopulations in juvenile and adult Lymnaea stagnalis: functional characteristics and lectin binding. Dev Comp Immunol 1988; 12: 17-32.
9. Gargioni, R, Barracco, MA. Hemocytes of the palaemonids Macrobrachium rosenbergii and M. acanthurus, and of the penaeid Penaeus paulensis. J Morphol 1998; 236: 209-221.
10. Hose, J, Martin, G, Gerard, S. A decapod hemocyte classification scheme integrating morphology, cytochemistry, and function. Biol Bull 1990; 178: 33-45.
11. Hypsa, V, Grubhoffer, L. Two hemocyte populations in Triatoma infestans: ultrastructural and lectin-binding characterization. Folia Parasitol (Praha) 1997; 44: 62-70.
12. Suresh, K, Mohandas, A. Number and types of hemocytes in Sunetta scripta and Villorita cyprinoides var. cochinensis (Bivalvia), and leukocytosis subsequent to bacterial challenge. J Invertebr Pathol 1990; 55: 312-318.
13. Pipe, R, Farley, S, Coles, J. The separation and characterisation of haemocytes from the mussel Mytilus edulis. Cell Tissue Res 1997; 289: 537-545.
14. Carballal, MJ, Lopez, MC, Azevedo, C, Villalba, A. Hemolymph cell types of the mussel Mytilus gallopro vincialis. Dis Aqat Org 1997; 29: 127-135.
15. Bigas, M, Durfort, M, Poquet, M. Cytological response of hemocytes in the European flat oyster, Ostrea edulis, experimentally exposed to mercury. Biometals 2006; 19: 659-673.
16. Soares-da-Silva, IM, Ribeiro, J, Valongo, C, Pinto, R, Vilanova, M, Bleher, R, Machado, J. Cytometric, morphologic and enzymatic characterisation of haemocytes in Anodonta cygnea. Comp Biochem Physiol A Mol Integr Physiol 2002; 132: 541-553.
28
17. Du Pasquier, L. Origin and evolution of the vertebrate immune system. Apmis 1992; 100: 383-392.
18. Neumann, NF, Stafford, JL, Barreda, D, Ainsworth, AJ, Belosevic, M. Antimicrobial mechanisms of fish phagocytes and their role in host defense. Dev Comp Immunol 2001; 25: 807-825.
19. Rabinovitch, M. Professional and non-professional phagocytes: an introduction. Trends Cell Biol 1995; 5: 85-87.
20. Giulianini, PG, Bertolo, F, Battistella, S, Amirante, GA. Ultrastructure of the hemocytes of Cetonischema aeruginosa larvae (Coleoptera, Scarabaeidae): involvement of both granulocytes and oenocytoids in in vivo phagocytosis. Tissue Cell 2003; 35: 243-251.
21. Giulianini, PG, Bierti, M, Lorenzon, S, Battistella, S, Ferrero, EA. Ultrastructural and functional characterization of circulating hemocytes from the freshwater crayfish Astacus leptodactylus: cell types and their role after in vivo artificial non-self challenge. Micron 2007; 38: 49-57.
22. Lee, YK, Soh, BS, Wu, JH. Quantitative assessment of phagocytic activity of hemocytes in the prawn, Penaeus merguiensis, by flow cytometric analysis. Cytometry 2001; 43: 82-85.
23. Morel, F, Doussiere, J, Vignais, PV. The superoxide-generating oxidase of phagocytic cells. Physiological, molecular and pathological aspects. Eur J Biochem 1991; 201: 523-546.
24. Cross, AR, Segal, AW. The NADPH oxidase of professional phagocytes--prototype of the NOX electron transport chain systems. Biochim Biophys Acta 2004; 1657: 1-22.
25. Garcia-Garcia, E. Diversity in Phagocytic Signaling: A Story of Greed, Sharing, and Exploitation. In: C Rosales, editor. Molecular Mechanisms of Phagocytosis. Georgetown, Texas: Landes Biosciences/Eurekah.com and Springer Science+Business Media, 2005. p. 1-22
26. Garcia-Garcia, E, Rosales, C. Signal transduction during Fc receptor-mediated phagocytosis. J Leukoc Biol 2002; 72: 1092-1108.
27. Adema, CM, van Deutekom-Mulder, EC, van der Knaap, WP, Sminia, T. NADPH-oxidase activity: the probable source of reactive oxygen intermediate generation in hemocytes of the gastropod Lymnaea stagnalis. J Leukoc Biol 1993; 54: 379-383.
28. Bender, RC, Broderick, EJ, Goodall, CP, Bayne, CJ. Respiratory burst of Biomphalaria glabrata hemocytes: Schistosoma mansoni-resistant snails produce more extracellular H2O2 than susceptible snails. J Parasitol 2005; 91: 275-279.
29. Cima, F, Matozzo, V, Marin, M, Ballarin, L. Haemocytes of the clam Tapes philippinarum (Adams & Reeve, 1850): morphofunctional characterisation. Fish Shellfish Immunol 2000; 10: 677–693.
30. Goedken, M, De Guise, S. Flow cytometry as a tool to quantify oyster defence mechanisms. Fish Shellfish Immunol 2003; 10: 677-693.
31. Pipe, RK. Generation of reactive oxygen metabolites by the haemocytes of the mussel Mytilus edulis. Dev Comp Immunol 1992; 16: 111-122.
32. Carballal, MJ, Lopez, C, Azevedo, C, Villalba, A. In vitro study of phagocytic ability of Mytilus galloprovincialis Lmk. haemocytes. Fish Shellfish Immunol 1997; 7: 403-416.
33. Plows, LD, Cook, RT, Davies, AJ, Walker, AJ. Activation of extracellular-signal regulated kinase is required for phagocytosis by Lymnaea stagnalis haemocytes. Biochim Biophys Acta 2004; 1692: 25-33.
29
34. Albina, JE, Reichner, JS. Role of nitric oxide in mediation of macrophage cytotoxicity and apoptosis. Cancer Metastasis Rev 1998; 17: 39-53.
35. MacMicking, J, Xie, QW, Nathan, C. Nitric oxide and macrophage function. Annu Rev Immunol 1997; 15: 323-350.
36. Armstrong, R. The physiological role and pharmacological potential of nitric oxide in neutrophil activation. Int Immunopharmacol 2001; 1: 1501-1512.
37. Conte, A, Ottaviani, E. Nitric oxide synthase activity in molluscan hemocytes. FEBS Lett 1995; 365: 120-124.
38. Arumugam, M, Romestand, B, Torreilles, J, Roch, P. In vitro production of superoxide and nitric oxide (as nitrite and nitrate) by Mytilus galloprovincialis haemocytes upon incubation with PMA or laminarin or during yeast phagocytosis. Eur J Cell Biol 2000; 79: 513-519.
39. Gourdon, I, Guerin, MC, Torreilles, J, Roch, P. Nitric oxide generation by hemocytes of the mussel Mytilus galloprovincialis. Nitric Oxide 2001; 5: 1-6.
40. Tafalla, C, Gomez-Leon, J, Novoa, B, Figueras, A. Nitric oxide production by carpet shell clam (Ruditapes decussatus) hemocytes. Dev Comp Immunol 2003; 27: 197-205.
41. Tafalla, C, Novoa, B, Figueras, A. Production of nitric oxide by mussel (Mytilus galloprovincialis) hemocytes and effect of exogenous nitric oxide on phagocytic functions. Comp Biochem Physiol B Biochem Mol Biol 2002; 132: 423-431.
42. Villamil, L, Gomez-Leon, J, Gomez-Chiarri, M. Role of nitric oxide in the defenses of Crassostrea virginica to experimental infection with the protozoan parasite Perkinsus marinus. Dev Comp Immunol 2007.
43. Wright, B, Lacchini, AH, Davies, AJ, Walker, AJ. Regulation of nitric oxide production in snail (Lymnaea stagnalis) defence cells: a role for PKC and ERK signalling pathways. Biol Cell 2006; 98: 265-278.
44. Garcia-Garcia, E, Rosales, R, Rosales, C. Phosphatidylinositol 3-kinase and extracellular signal-regulated kinase are recruited for Fc receptor-mediated phagocytosis during monocyte-to-macrophage differentiation. J Leukoc Biol 2002; 72: 107-114.
45. Garcia-Garcia, E, Rosales, C. Nuclear factor activation by FcgammaR in human peripheral blood neutrophils detected by a novel flow cytometry-based method. J Immunol Methods 2007; 320: 104-118.
46. Rosales, C, Brown, EJ. Two mechanisms for IgG Fc-receptor-mediated phagocytosis by human neutrophils. J Immunol 1991; 146: 3937-3944.
47. Melendez, A, Floto, RA, Cameron, AJ, Gillooly, DJ, Harnett, MM, Allen, JM. A molecular switch changes the signalling pathway used by the Fc gamma RI antibody receptor to mobilise calcium. Curr Biol 1998; 8: 210-221.
48. Zhong, B, Jiang, K, Gilvary, DL, Epling-Burnette, PK, Ritchey, C, Liu, J, Jackson, RJ, Hong-Geller, E, Wei, S. Human neutrophils utilize a Rac/Cdc42-dependent MAPK pathway to direct intracellular granule mobilization toward ingested microbial pathogens. Blood 2003; 101: 3240-3248.
49. Song, X, Tanaka, S, Cox, D, Lee, SC. Fcgamma receptor signaling in primary human microglia: differential roles of PI-3K and Ras/ERK MAPK pathways in phagocytosis and chemokine induction. J Leukoc Biol 2004; 75: 1147-1155.
50. Tubiash, HS. Soft-shell clam, Mya arenaria, a convenient laboratory animal for screening pathogens of bivalve mollusks. Appl Microbiol 1971; 22: 321-324.
51. Selegean, JP, Kusserow, R, Patel, R, Heidtke, TM, Ram, JL. Using zebra mussels to monitor Escherichia coli in environmental waters. J Environ Qual 2001; 30: 171-179.
30
52. Morgan, D, Cherny, VV, Finnegan, A, Bollinger, J, Gelb, MH, DeCoursey, TE. Sustained activation of proton channels and NADPH oxidase in human eosinophils and murine granulocytes requires PKC but not cPLA2 alpha activity. J Physiol 2007; 579: 327-344.
53. Larsen, EC, DiGennaro, JA, Saito, N, Mehta, S, Loegering, DJ, Mazurkiewicz, JE, Lennartz, MR. Differential requirement for classic and novel PKC isoforms in respiratory burst and phagocytosis in RAW 264.7 cells. J Immunol 2000; 165: 2809-2817.
54. Kasanah, N, Hamann, MT. Development of antibiotics and the future of marine microorganisms to stem the tide of antibiotic resistance. Curr Opin Investig Drugs 2004; 5: 827-837.
55. Zhang, B, Hirahashi, J, Cullere, X, Mayadas, TN. Elucidation of molecular events leading to neutrophil apoptosis following phagocytosis: cross-talk between caspase 8, reactive oxygen species, and MAPK/ERK activation. J Biol Chem 2003; 278: 28443-28454.
56. El Benna, J, Han, J, Park, JW, Schmid, E, Ulevitch, RJ, Babior, BM. Activation of p38 in stimulated human neutrophils: phosphorylation of the oxidase component p47phox by p38 and ERK but not by JNK. Arch Biochem Biophys 1996; 334: 395-400.
57. Chen, Q, Powell, DW, Rane, MJ, Singh, S, Butt, W, Klein, JB, McLeish, KR. Akt phosphorylates p47phox and mediates respiratory burst activity in human neutrophils. J Immunol 2003; 170: 5302-5308.
58. Liu, J, Liu, Z, Chuai, S, Shen, X. Phospholipase C and phosphatidylinositol 3-kinase signaling are involved in the exogenous arachidonic acid-stimulated respiratory burst in human neutrophils. J Leukoc Biol 2003; 74: 428-437.
59. Koo, HN, Hong, SH, Seo, HG, Yoo, TS, Lee, KN, Kim, NS, Kim, CH, Kim, HM. Inulin stimulates NO synthesis via activation of PKC-alpha and protein tyrosine kinase, resulting in the activation of NF-kappaB by IFN-gamma-primed RAW 264.7 cells. J Nutr Biochem 2003; 14: 598-605.
60. Pham, TN, Brown, BL, Dobson, PR, Richardson, VJ. Protein kinase C-eta (PKC-eta) is required for the development of inducible nitric oxide synthase (iNOS) positive phenotype in human monocytic cells. Nitric Oxide 2003; 9: 123-134.
61. Thomas, SR, Chen, K, Keaney, JF, Jr. Hydrogen peroxide activates endothelial nitric-oxide synthase through coordinated phosphorylation and dephosphorylation via a phosphoinositide 3-kinase-dependent signaling pathway. J Biol Chem 2002; 277: 6017-6024.
62. Plows, LD, Cook, RT, Davies, AJ, Walker, AJ. Phagocytosis by Lymnaea stagnalis haemocytes: a potential role for phosphatidylinositol 3-kinase but not protein kinase A. J Invertebr Pathol 2006; 91: 74-77.
63. Canesi, L, Scarpato, A, Betti, M, Ciacci, C, Pruzzo, C, Gallo, G. Bacterial killing by Mytilus hemocyte monolayers as a model for investigating the signaling pathways involved in mussel immune defence. Mar Environ Res 2002; 54: 547-551.
64. Canesi, L, Lorusso, LC, Ciacci, C, Betti, M, Zampini, M, Gallo, G. Environmental estrogens can affect the function of mussel hemocytes through rapid modulation of kinase pathways. Gen Comp Endocrinol 2004; 138: 58-69.
65. Zelck, UE, Gege, BE, Schmid, S. Specific inhibitors of mitogen-activated protein kinase and PI3-K pathways impair immune responses by hemocytes of trematode intermediate host snails. Dev Comp Immunol 2007; 31: 321-331.
31
66. Crow, T, Xue-Bian, JJ, Siddiqi, V, Neary, JT. Serotonin activation of the ERK pathway in Hermissenda: contribution of calcium-dependent protein kinase C. J Neurochem 2001; 78: 358-364.
67. Canesi, L, Betti, M, Ciacci, C, Scarpato, A, Citterio, B, Pruzzo, C, Gallo, G. Signaling pathways involved in the physiological response of mussel hemocytes to bacterial challenge: the role of stress-activated p38 MAP kinases. Dev Comp Immunol 2002; 26: 325-334.
68. Plows, LD, Cook, RT, Davies, AJ, Walker, AJ. Carbohydrates that mimic schistosome surface coat components affect ERK and PKC signalling in Lymnaea stagnalis haemocytes. Int J Parasitol 2005; 35: 293-302.
69. Lacchini, AH, Davies, AJ, Mackintosh, D, Walker, AJ. Beta-1, 3-glucan modulates PKC signalling in Lymnaea stagnalis defence cells: a role for PKC in H2O2 production and downstream ERK activation. J Exp Biol 2006; 209: 4829-4840.
70. Cajaraville, MP, Pal, SG. Morphofunctional study of the haemocytes of the bivalve mollusc Mytilus galloprovincialis with emphasis on the endolysosomal compartment. Cell Struct Funct 1995; 20: 355-367.
71. Friedl, F, Alvarez, M, Johnson, J, Gratzner, H. Cytometric investigations on hemocytes of the American oyster Crassostrea virginica. Tissue and Cell 1988; 20: 933-939.
72. Sucic, M, Kolevska, T, Kopjar, B, Kosanovic, M, Drobnjak, M, Zalud, I, Marusic, M. Accuracy of routine flow-cytometry bitmap selection for three leukocyte populations. Cytometry 1989; 10: 442-447.
73. Ottaviani, E, Franchini, A, Barbieri, D, Klestas, D. Comparative and morphofunctional studies on Mytilus galloprovincialis hemocytes: presence of two age-related hemocyte stages. Ital J Zool 1998; 65: 349-354.
74. Fisher, W, Ford, S. Flow cytometry: a tool for cell research in bivalve pathology. American Fisheries Society Special Publication 1988; 18: 286-292.
A B
R1 R2
R3 R4
Figure 1
R5
R5
R5
R5
R5
R5
R5
R5
R5
R5
A
B
C
D
E
R5
FL-1
FL-1
FL-1
FL-1
FL-1Figure 2
Figu
re 3
30
40
50
60
70
80
90
100
0 1 5 7.5 10 15 20 50PD98059 [uM]
Phag
ocyt
osis
(% o
f con
trol
)
30
40
50
60
70
80
90
100
110
120
0 0.5 1 1.5 2 2.5 3.5 5 10 20 30 40Staurosporine [nM]
Phag
ocyt
osis
(% o
f con
trol
)
30
40
50
60
70
80
90
100
0 1 5 10 20 50 100 200Wortmannin [nM]
Phag
ocyt
osis
(% o
f con
trol
)A
B
C
R1R2R3
*
R1R2R3
*
R1R2R3
*
Figure 4

30
40
50
60
70
80
90
100
110
120
0 0.5 1 1.5 2 2.5 3.5 5 10 20 30 40Staurosporine [nM]
Phag
ocyt
osis
(% o
f con
trol
)
30
40
50
60
70
80
90
100
110
120
0 1 5 7.5 10 15 20 50PD98059 [uM]
Phag
ocyt
osis
(% o
f con
trol
)
30
40
50
60
70
80
90
100
0 1 5 10 20 50 100 200Wortmannin [nM]
Phag
ocyt
osis
(% o
f con
trol
)A
B
C
R1R2R3
*
R1R2R3
*
R1R2R3
*
Figure 5
30
40
50
60
70
80
90
100
110
0 1 5 7,5 10 15 20 50PD98059 [uM]
Phag
ocyt
osis
(% o
f con
trol
)
30
40
50
60
70
80
90
100
110
0 1 2 2.5 5 10 20 40Staurosporine [nM]
Phag
ocyt
osis
(% o
f con
trol
)
30
40
50
60
70
80
90
100
110
0 1 5 10 20 50 100 200Wortmannin [nM]
Phag
ocyt
osis
(% o
f con
trol
)A
B
C
R1R2R3
*
R1R2R3
*
R1R2R3
*
Figure 6
30
40
50
60
70
80
90
100
110
0 1 5 7.5 10 15 20 50PD98059 [uM]
Phag
ocyt
osis
(% o
f con
trol
)
30
40
50
60
70
80
90
100
110
120
0 0.5 1 1.5 2 2.5 3.5 5 10 20 30 40Staurosporine [nM]
Phag
ocyt
osis
(% o
f con
trol
)
30
40
50
60
70
80
90
100
0 1 5 10 20 50 100 200Wortmannin [nM]
Phag
ocyt
osis
(% o
f con
trol
)A
B
C
R1R2R3
*
R1R2R3
*
R1R2R3
*
Figure 7
050100
150
200
250
300
Cont
rol
Zym
osan
ROS Production (% of control)050100
150
200
250
300
Cont
rol
Zym
osan
ROS Production (% of control)
R2
R4
*
050100
150
200
250
300
Cont
rol
Zym
osan
ROS Production (% of control)050100
150
200
250
300
Cont
rol
Zym
osan
ROS Production (% of control)
R1
R3
* *
A C
B D
Figu
re 8
100
150
200
250
300
350
400
450
01
1010
010
00
PMA
[ng/
ml]
ROS fluorescence (% of control)
30405060708090100
110
120
01
57,
510
1520
50PD
9805
9 [u
M]
ROS fluorescence (% of control)
30405060708090100
110
120
01
22.
55
1020
40St
auro
spor
ine
[nM
]
ROS Production (% of control)
30405060708090100
110
120
130
01
510
2050
100
200
Wor
tman
nin
[nM
]
ROS Production (% of control)
A C
B D
R1
R2
R3
* R4
R1
R2
R3
* R4
R1
R2
R3
* R4
R1
R2
R3
* R4
Figu
re 9
R1
R2 R4
R3
A C
B D
Figu
re 1
0
30405060708090100
110
01
57.
510
1520
50PD
9805
9 [u
M]
NO Production (% of control)
30405060708090100
01
1010
010
00PM
A [n
g/m
l]
NO Production (% of control)
30405060708090100
110
120
01
22.
55
1020
40St
auro
spor
ine
[nM
]
NO Production (% of control)
30405060708090100
110
01
510
2050
100
200
Wor
tman
nin
[nM
]
NO Production (% of control)
R1
R2
R3
* R4
R1
R2
R3
* R4
R1
R2
R3
* R4
R1
R2
R3
* R4
A C
B D
Figu
re 1
1