SLC39A14, a LZT protein, is induced in adipogenesis and transports zinc
Upload
independentCategory
view
2download
0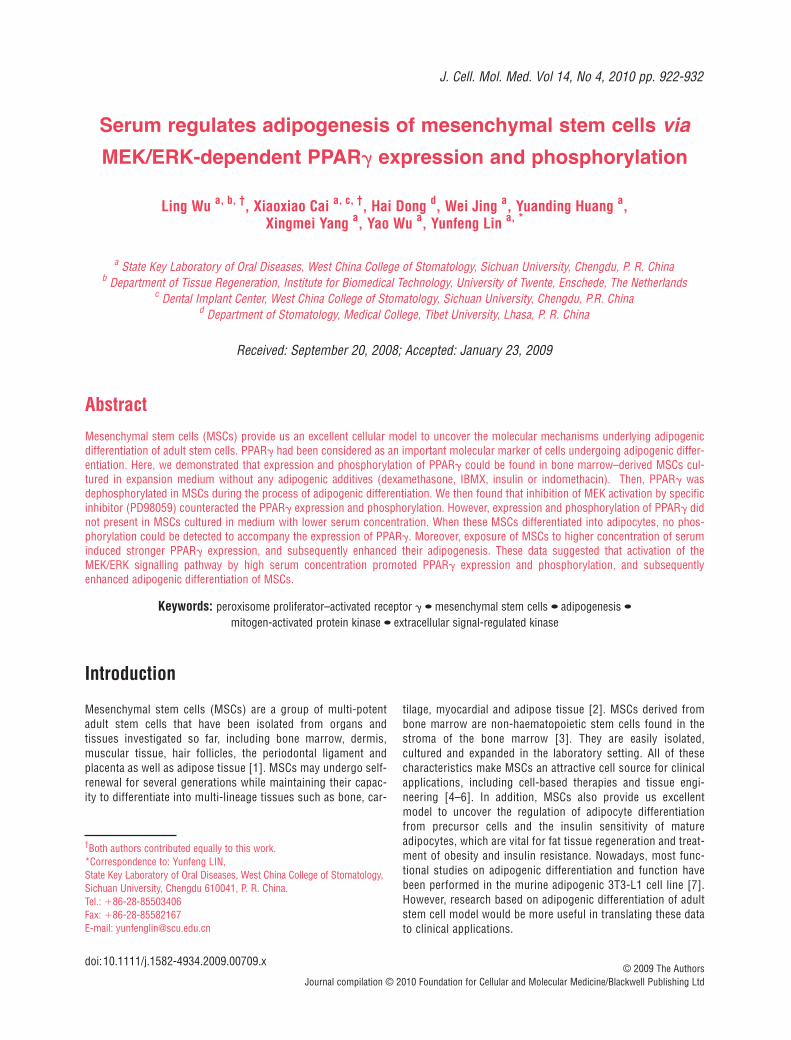
Introduction
Mesenchymal stem cells (MSCs) are a group of multi-potentadult stem cells that have been isolated from organs and tissues investigated so far, including bone marrow, dermis,muscular tissue, hair follicles, the periodontal ligament andplacenta as well as adipose tissue [1]. MSCs may undergo self-renewal for several generations while maintaining their capac-ity to differentiate into multi-lineage tissues such as bone, car-
tilage, myocardial and adipose tissue [2]. MSCs derived frombone marrow are non-haematopoietic stem cells found in thestroma of the bone marrow [3]. They are easily isolated, cultured and expanded in the laboratory setting. All of thesecharacteristics make MSCs an attractive cell source for clinicalapplications, including cell-based therapies and tissue engi-neering [4–6]. In addition, MSCs also provide us excellentmodel to uncover the regulation of adipocyte differentiationfrom precursor cells and the insulin sensitivity of matureadipocytes, which are vital for fat tissue regeneration and treat-ment of obesity and insulin resistance. Nowadays, most func-tional studies on adipogenic differentiation and function havebeen performed in the murine adipogenic 3T3-L1 cell line [7].However, research based on adipogenic differentiation of adultstem cell model would be more useful in translating these datato clinical applications.
Serum regulates adipogenesis of mesenchymal stem cells via
MEK/ERK-dependent PPAR� expression and phosphorylation
Ling Wu a, b, †, Xiaoxiao Cai a, c, †, Hai Dong d, Wei Jing a, Yuanding Huang a, Xingmei Yang a, Yao Wu a, Yunfeng Lin a, *
a State Key Laboratory of Oral Diseases, West China College of Stomatology, Sichuan University, Chengdu, P. R. Chinab Department of Tissue Regeneration, Institute for Biomedical Technology, University of Twente, Enschede, The Netherlands
c Dental Implant Center, West China College of Stomatology, Sichuan University, Chengdu, P.R. Chinad Department of Stomatology, Medical College, Tibet University, Lhasa, P. R. China
Received: September 20, 2008; Accepted: January 23, 2009
Abstract
Mesenchymal stem cells (MSCs) provide us an excellent cellular model to uncover the molecular mechanisms underlying adipogenicdifferentiation of adult stem cells. PPAR� had been considered as an important molecular marker of cells undergoing adipogenic differ-entiation. Here, we demonstrated that expression and phosphorylation of PPAR� could be found in bone marrow–derived MSCs cul-tured in expansion medium without any adipogenic additives (dexamethasone, IBMX, insulin or indomethacin). Then, PPAR� wasdephosphorylated in MSCs during the process of adipogenic differentiation. We then found that inhibition of MEK activation by specificinhibitor (PD98059) counteracted the PPAR� expression and phosphorylation. However, expression and phosphorylation of PPAR� didnot present in MSCs cultured in medium with lower serum concentration. When these MSCs differentiated into adipocytes, no phos-phorylation could be detected to accompany the expression of PPAR�. Moreover, exposure of MSCs to higher concentration of seruminduced stronger PPAR� expression, and subsequently enhanced their adipogenesis. These data suggested that activation of theMEK/ERK signalling pathway by high serum concentration promoted PPAR� expression and phosphorylation, and subsequentlyenhanced adipogenic differentiation of MSCs.
Keywords: peroxisome proliferator–activated receptor � • mesenchymal stem cells • adipogenesis •mitogen-activated protein kinase • extracellular signal-regulated kinase
J. Cell. Mol. Med. Vol 14, No 4, 2010 pp. 922-932
†Both authors contributed equally to this work. *Correspondence to: Yunfeng LIN, State Key Laboratory of Oral Diseases, West China College of Stomatology,Sichuan University, Chengdu 610041, P. R. China.Tel.: �86-28-85503406Fax: �86-28-85582167E-mail: [email protected]
© 2009 The AuthorsJournal compilation © 2010 Foundation for Cellular and Molecular Medicine/Blackwell Publishing Ltd
doi:10.1111/j.1582-4934.2009.00709.x
J. Cell. Mol. Med. Vol 14, No 4, 2010
923© 2009 The AuthorsJournal compilation © 2010 Foundation for Cellular and Molecular Medicine/Blackwell Publishing Ltd
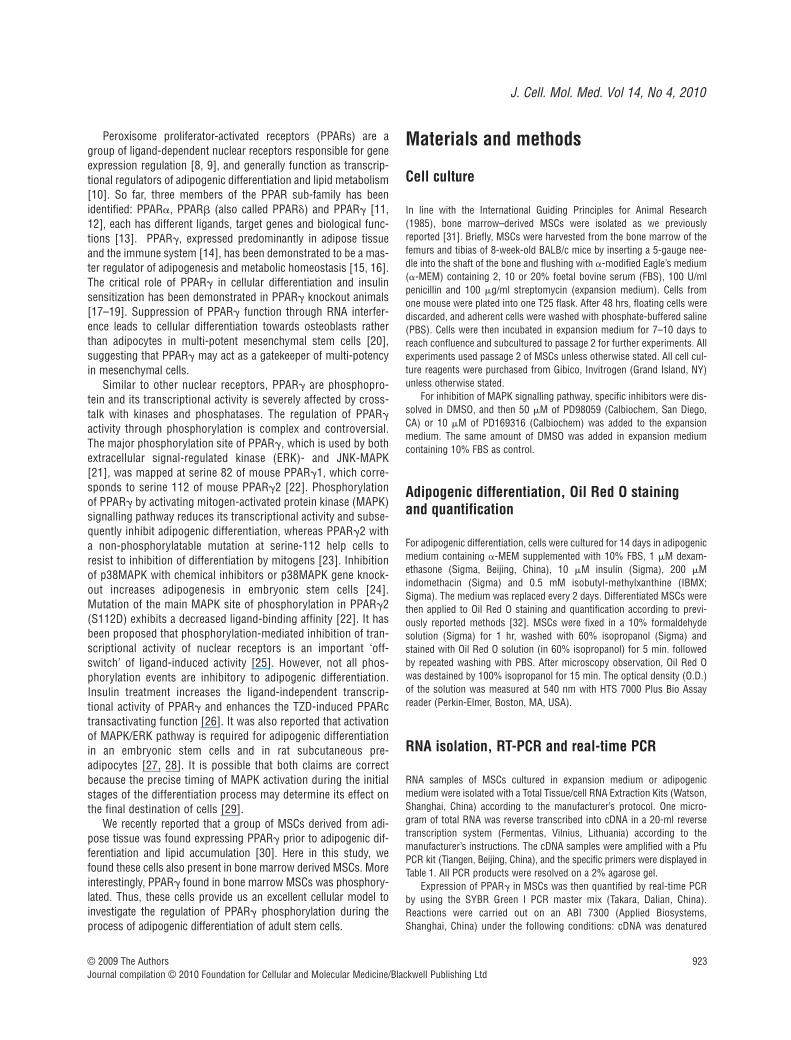
Peroxisome proliferator-activated receptors (PPARs) are agroup of ligand-dependent nuclear receptors responsible for geneexpression regulation [8, 9], and generally function as transcrip-tional regulators of adipogenic differentiation and lipid metabolism[10]. So far, three members of the PPAR sub-family has beenidentified: PPAR�, PPAR� (also called PPAR�) and PPAR� [11,12], each has different ligands, target genes and biological func-tions [13]. PPAR�, expressed predominantly in adipose tissueand the immune system [14], has been demonstrated to be a mas-ter regulator of adipogenesis and metabolic homeostasis [15, 16].The critical role of PPAR� in cellular differentiation and insulinsensitization has been demonstrated in PPAR� knockout animals[17–19]. Suppression of PPAR� function through RNA interfer-ence leads to cellular differentiation towards osteoblasts ratherthan adipocytes in multi-potent mesenchymal stem cells [20],suggesting that PPAR� may act as a gatekeeper of multi-potencyin mesenchymal cells.
Similar to other nuclear receptors, PPAR� are phosphopro-tein and its transcriptional activity is severely affected by cross-talk with kinases and phosphatases. The regulation of PPAR�
activity through phosphorylation is complex and controversial.The major phosphorylation site of PPAR�, which is used by bothextracellular signal-regulated kinase (ERK)- and JNK-MAPK[21], was mapped at serine 82 of mouse PPAR�1, which corre-sponds to serine 112 of mouse PPAR�2 [22]. Phosphorylationof PPAR� by activating mitogen-activated protein kinase (MAPK)signalling pathway reduces its transcriptional activity and subse-quently inhibit adipogenic differentiation, whereas PPAR�2 witha non-phosphorylatable mutation at serine-112 help cells toresist to inhibition of differentiation by mitogens [23]. Inhibitionof p38MAPK with chemical inhibitors or p38MAPK gene knock-out increases adipogenesis in embryonic stem cells [24].Mutation of the main MAPK site of phosphorylation in PPAR�2(S112D) exhibits a decreased ligand-binding affinity [22]. It hasbeen proposed that phosphorylation-mediated inhibition of tran-scriptional activity of nuclear receptors is an important ‘off-switch’ of ligand-induced activity [25]. However, not all phos-phorylation events are inhibitory to adipogenic differentiation.Insulin treatment increases the ligand-independent transcrip-tional activity of PPAR� and enhances the TZD-induced PPARctransactivating function [26]. It was also reported that activationof MAPK/ERK pathway is required for adipogenic differentiationin an embryonic stem cells and in rat subcutaneous pre-adipocytes [27, 28]. It is possible that both claims are correctbecause the precise timing of MAPK activation during the initialstages of the differentiation process may determine its effect onthe final destination of cells [29].
We recently reported that a group of MSCs derived from adi-pose tissue was found expressing PPAR� prior to adipogenic dif-ferentiation and lipid accumulation [30]. Here in this study, wefound these cells also present in bone marrow derived MSCs. Moreinterestingly, PPAR� found in bone marrow MSCs was phosphory-lated. Thus, these cells provide us an excellent cellular model toinvestigate the regulation of PPAR� phosphorylation during theprocess of adipogenic differentiation of adult stem cells.
Materials and methods
Cell culture
In line with the International Guiding Principles for Animal Research(1985), bone marrow–derived MSCs were isolated as we previouslyreported [31]. Briefly, MSCs were harvested from the bone marrow of thefemurs and tibias of 8-week-old BALB/c mice by inserting a 5-gauge nee-dle into the shaft of the bone and flushing with �-modified Eagle’s medium(�-MEM) containing 2, 10 or 20% foetal bovine serum (FBS), 100 U/mlpenicillin and 100 �g/ml streptomycin (expansion medium). Cells fromone mouse were plated into one T25 flask. After 48 hrs, floating cells werediscarded, and adherent cells were washed with phosphate-buffered saline(PBS). Cells were then incubated in expansion medium for 7–10 days toreach confluence and subcultured to passage 2 for further experiments. Allexperiments used passage 2 of MSCs unless otherwise stated. All cell cul-ture reagents were purchased from Gibico, Invitrogen (Grand Island, NY)unless otherwise stated.
For inhibition of MAPK signalling pathway, specific inhibitors were dis-solved in DMSO, and then 50 �M of PD98059 (Calbiochem, San Diego,CA) or 10 �M of PD169316 (Calbiochem) was added to the expansionmedium. The same amount of DMSO was added in expansion mediumcontaining 10% FBS as control.
Adipogenic differentiation, Oil Red O staining and quantification
For adipogenic differentiation, cells were cultured for 14 days in adipogenicmedium containing �-MEM supplemented with 10% FBS, 1 �M dexam-ethasone (Sigma, Beijing, China), 10 �M insulin (Sigma), 200 �Mindomethacin (Sigma) and 0.5 mM isobutyl-methylxanthine (IBMX;Sigma). The medium was replaced every 2 days. Differentiated MSCs werethen applied to Oil Red O staining and quantification according to previ-ously reported methods [32]. MSCs were fixed in a 10% formaldehydesolution (Sigma) for 1 hr, washed with 60% isopropanol (Sigma) andstained with Oil Red O solution (in 60% isopropanol) for 5 min. followedby repeated washing with PBS. After microscopy observation, Oil Red Owas destained by 100% isopropanol for 15 min. The optical density (O.D.)of the solution was measured at 540 nm with HTS 7000 Plus Bio Assayreader (Perkin-Elmer, Boston, MA, USA).
RNA isolation, RT-PCR and real-time PCR
RNA samples of MSCs cultured in expansion medium or adipogenicmedium were isolated with a Total Tissue/cell RNA Extraction Kits (Watson,Shanghai, China) according to the manufacturer’s protocol. One micro-gram of total RNA was reverse transcribed into cDNA in a 20-ml reversetranscription system (Fermentas, Vilnius, Lithuania) according to the manufacturer’s instructions. The cDNA samples were amplified with a PfuPCR kit (Tiangen, Beijing, China), and the specific primers were displayed inTable 1. All PCR products were resolved on a 2% agarose gel.
Expression of PPAR� in MSCs was then quantified by real-time PCRby using the SYBR Green I PCR master mix (Takara, Dalian, China).Reactions were carried out on an ABI 7300 (Applied Biosystems,Shanghai, China) under the following conditions: cDNA was denatured
924 © 2009 The AuthorsJournal compilation © 2010 Foundation for Cellular and Molecular Medicine/Blackwell Publishing Ltd
for 15 min. at 94�C, followed by 40 cycles, consisting 30 sec. at 94�C, 30 sec. 58�C and 1 min. at 72�C. For each reaction, a melting curve wasgenerated to test the primer dimmer formation and false priming. Theprimers for real-time PCR were as follows: PPAR�: 5-TTTTCAAGGGT-GCCAGTTTC-3 (forward) and 5-AATCCTTGGCCCTCTGAGAT-3
(reverse); �-actin: 5-TGTTACCAACTGGGACGACA-3 (forward) and 5-GGGGTGTTGAAGGTCTCAAA-3 (reverse). Relative quantification ofPPAR� was carried out according to Ct method [33].
Immunofluorescence and image analysis
MSCs either cultured in expansion medium or adipogenic medium wereplated on glass cover slips in six-well plates 24 hrs before staining. Cellswere washed briefly with PBS, fixed in 4% paraformaldehyde for 30 min.at room temperature and then permeabilized and blocked in 0.5% Triton-X
100 and 0.5% bovine serum albumin (BSA) for 15 min. at room tempera-ture. Slips were subsequently incubated overnight at 4�C with rabbit polyclonal antibodies against PPAR� (AbCam, Cambridge, UK) or rabbitmonoclonal antibody against PPAR� with phosphoserine at residue 82(Upstate, Lake Placid, NY). Sequentially, slides were incubated with sec-ondary antibodies conjugated to Rhodamine or FITC (Pierce, Rockford, IL),and nuclei were stained with 4,6-diamidino-2-phenylindole (DAPI;Molecular Probes, Eugene, OR). For MSCs differentiated into adipocytes,Oil Red O staining was then performed to visualize fat drop. After rinsingin PBS, cells were observed and imaged with DMi 6000 B fluorescentmicroscope (Leica, Bensheim, Germany).
To determine the percentage of PPAR� and pho-PPAR� expressingcells, the numbers of positive cells and total cells were counted manually.For each condition, at least three slides were stained and examined. Foreach slide, one to two fields (100� magnifications) were randomly chosento make sure at least 100 of total cells were analyzed.
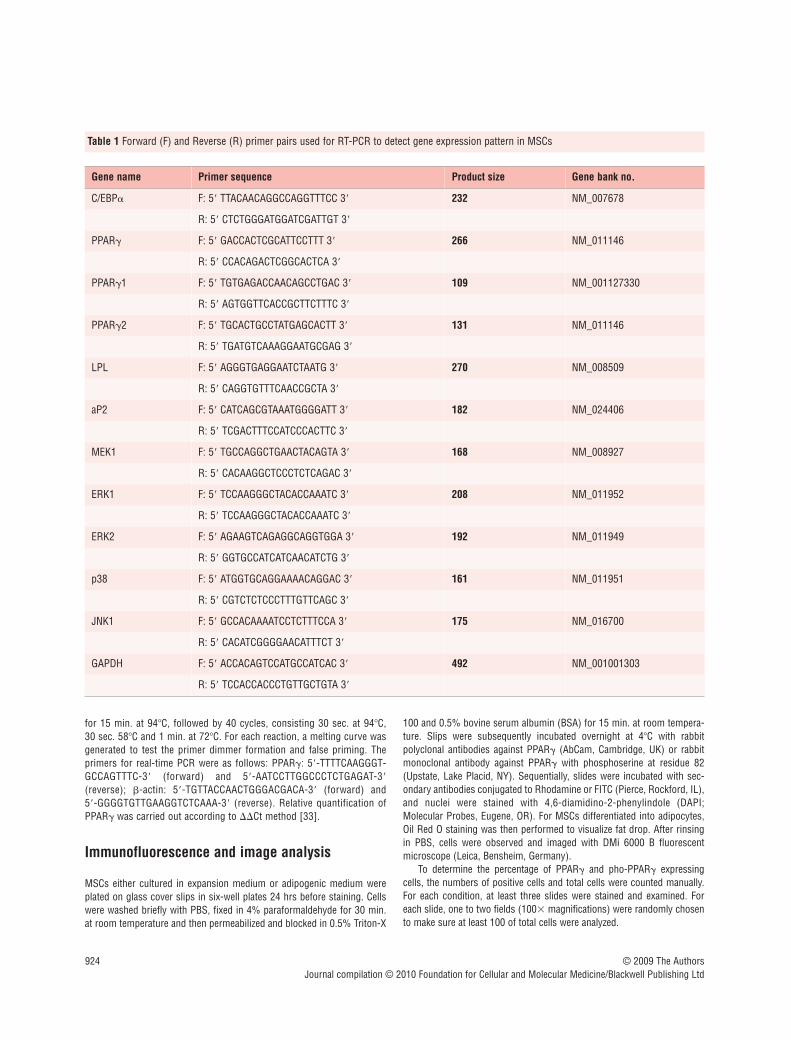
Table 1 Forward (F) and Reverse (R) primer pairs used for RT-PCR to detect gene expression pattern in MSCs
Gene name Primer sequence Product size Gene bank no.
C/EBP� F: 5 TTACAACAGGCCAGGTTTCC 3 232 NM_007678
R: 5 CTCTGGGATGGATCGATTGT 3
PPAR� F: 5 GACCACTCGCATTCCTTT 3 266 NM_011146
R: 5 CCACAGACTCGGCACTCA 3
PPAR�1 F: 5 TGTGAGACCAACAGCCTGAC 3 109 NM_001127330
R: 5 AGTGGTTCACCGCTTCTTTC 3
PPAR�2 F: 5 TGCACTGCCTATGAGCACTT 3 131 NM_011146
R: 5 TGATGTCAAAGGAATGCGAG 3
LPL F: 5 AGGGTGAGGAATCTAATG 3 270 NM_008509
R: 5 CAGGTGTTTCAACCGCTA 3
aP2 F: 5 CATCAGCGTAAATGGGGATT 3 182 NM_024406
R: 5 TCGACTTTCCATCCCACTTC 3
MEK1 F: 5 TGCCAGGCTGAACTACAGTA 3 168 NM_008927
R: 5 CACAAGGCTCCCTCTCAGAC 3
ERK1 F: 5 TCCAAGGGCTACACCAAATC 3 208 NM_011952
R: 5 TCCAAGGGCTACACCAAATC 3
ERK2 F: 5 AGAAGTCAGAGGCAGGTGGA 3 192 NM_011949
R: 5 GGTGCCATCATCAACATCTG 3
p38 F: 5 ATGGTGCAGGAAAACAGGAC 3 161 NM_011951
R: 5 CGTCTCTCCCTTTGTTCAGC 3
JNK1 F: 5 GCCACAAAATCCTCTTTCCA 3 175 NM_016700
R: 5 CACATCGGGGAACATTTCT 3
GAPDH F: 5 ACCACAGTCCATGCCATCAC 3 492 NM_001001303
R: 5 TCCACCACCCTGTTGCTGTA 3
J. Cell. Mol. Med. Vol 14, No 4, 2010
925© 2009 The AuthorsJournal compilation © 2010 Foundation for Cellular and Molecular Medicine/Blackwell Publishing Ltd
Protein extraction and Western blot
Before cell dissolving, cell layers were washed three times with PBS buffer,then total proteins were extracted by protein extract reagents (Pierce), fol-lowed by centrifugation (13,000 � g for 15 min.) to remove cellular debris.Protein concentration was assessed by BCA kit (Pierce) according to themanufacturer’s instructions. Twenty-five microgram of total proteins wasanalyzed by Western blotting using polyclonal anti-PPAR� antibody (AbCam)or anti-PPAR� (phosphor 112) antibody (AbCam). Immunocomplexeswere visualized using enhanced chemiluminescence reagent (Pierce)according to the manufacturer’s instructions.
Statistical analysis
We performed three or more independent sets of the experiments, and eachexperiment was run at least 3 times. Data were shown as average with indi-cated standard deviation. Means � S.D. and P values were calculated usingStudent’s t-test. P 0.05 was considered as statistically significant.
Results
PPAR� expressed and phosphorylated in undifferentiated MSCs
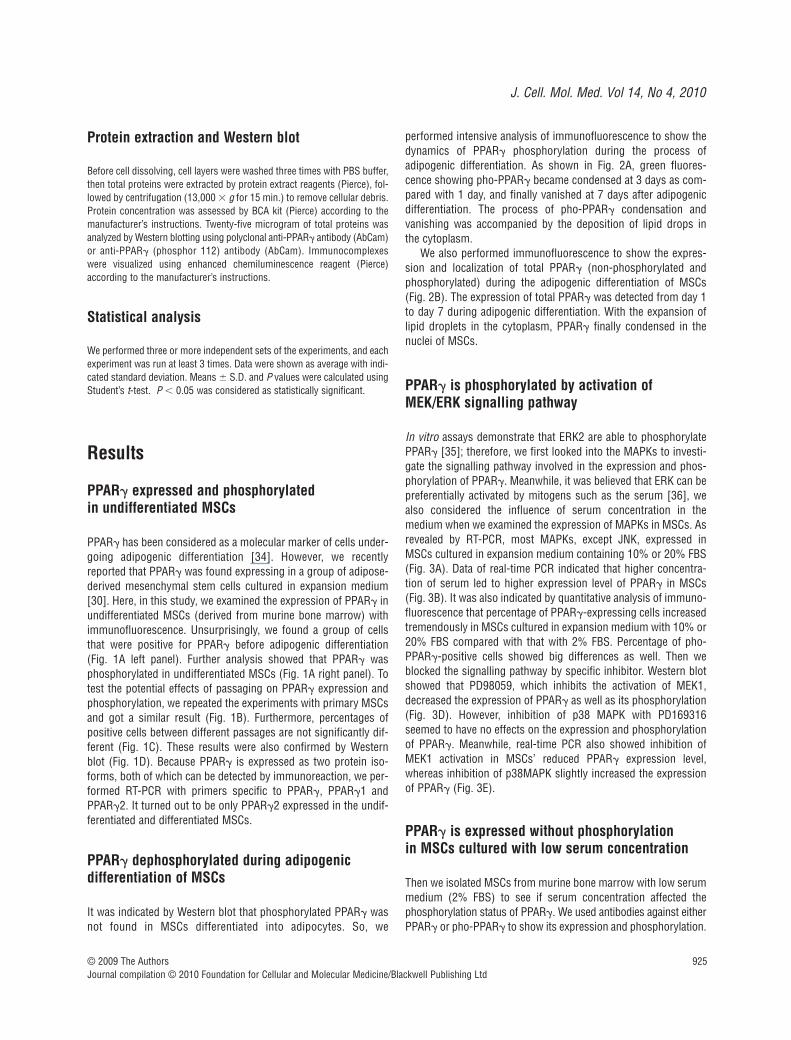
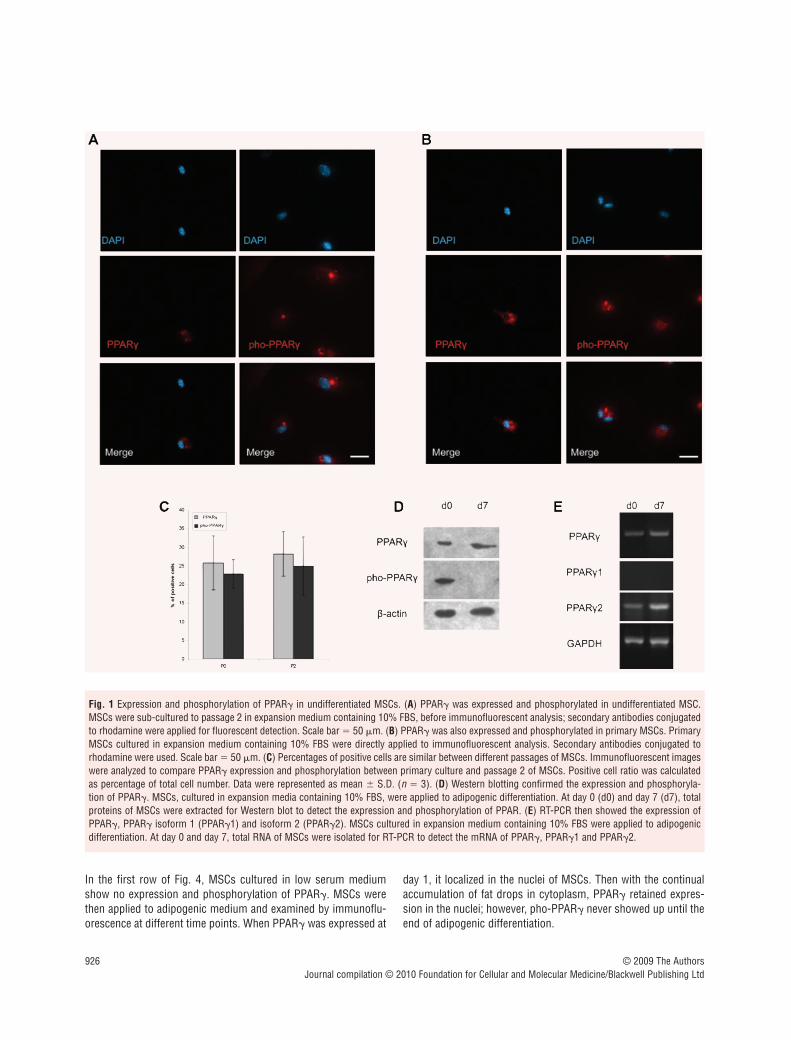
PPAR� has been considered as a molecular marker of cells under-going adipogenic differentiation [34]. However, we recentlyreported that PPAR� was found expressing in a group of adipose-derived mesenchymal stem cells cultured in expansion medium[30]. Here, in this study, we examined the expression of PPAR� inundifferentiated MSCs (derived from murine bone marrow) withimmunofluorescence. Unsurprisingly, we found a group of cellsthat were positive for PPAR� before adipogenic differentiation(Fig. 1A left panel). Further analysis showed that PPAR� wasphosphorylated in undifferentiated MSCs (Fig. 1A right panel). Totest the potential effects of passaging on PPAR� expression andphosphorylation, we repeated the experiments with primary MSCsand got a similar result (Fig. 1B). Furthermore, percentages ofpositive cells between different passages are not significantly dif-ferent (Fig. 1C). These results were also confirmed by Westernblot (Fig. 1D). Because PPAR� is expressed as two protein iso-forms, both of which can be detected by immunoreaction, we per-formed RT-PCR with primers specific to PPAR�, PPAR�1 andPPAR�2. It turned out to be only PPAR�2 expressed in the undif-ferentiated and differentiated MSCs.
PPAR� dephosphorylated during adipogenic differentiation of MSCs
It was indicated by Western blot that phosphorylated PPAR� wasnot found in MSCs differentiated into adipocytes. So, we
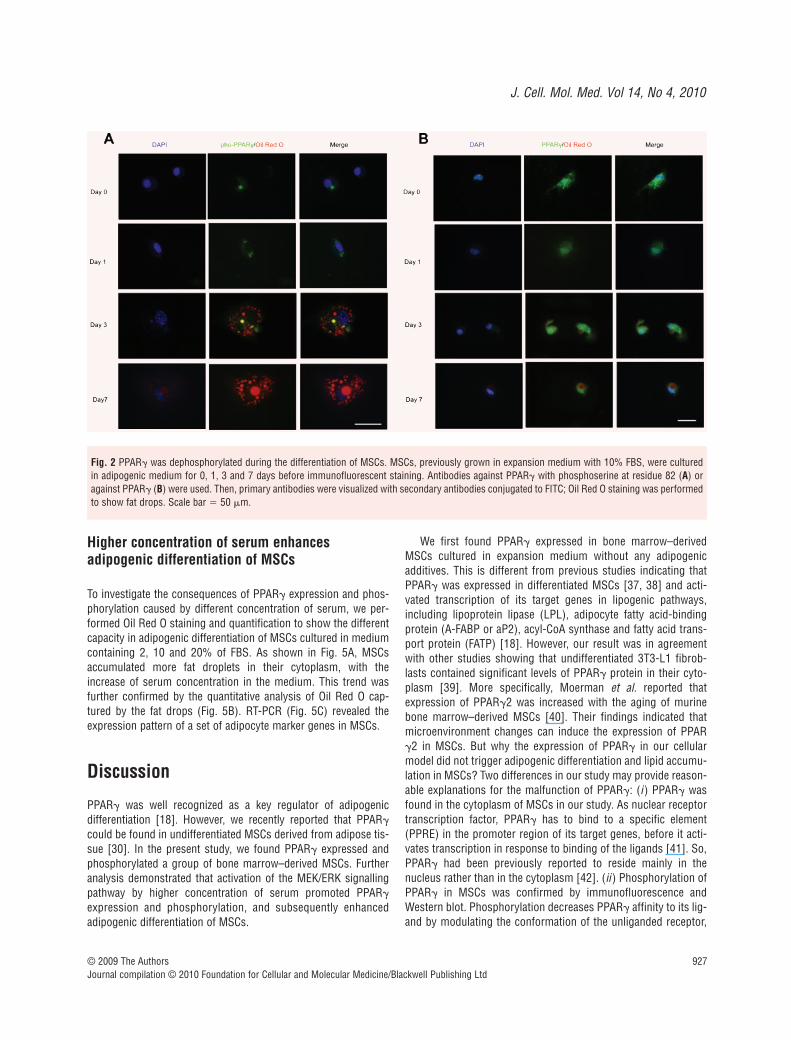
performed intensive analysis of immunofluorescence to show thedynamics of PPAR� phosphorylation during the process of adipogenic differentiation. As shown in Fig. 2A, green fluores-cence showing pho-PPAR� became condensed at 3 days as com-pared with 1 day, and finally vanished at 7 days after adipogenicdifferentiation. The process of pho-PPAR� condensation and vanishing was accompanied by the deposition of lipid drops in the cytoplasm.
We also performed immunofluorescence to show the expres-sion and localization of total PPAR� (non-phosphorylated andphosphorylated) during the adipogenic differentiation of MSCs(Fig. 2B). The expression of total PPAR� was detected from day 1to day 7 during adipogenic differentiation. With the expansion oflipid droplets in the cytoplasm, PPAR� finally condensed in thenuclei of MSCs.
PPAR� is phosphorylated by activation ofMEK/ERK signalling pathway
In vitro assays demonstrate that ERK2 are able to phosphorylatePPAR� [35]; therefore, we first looked into the MAPKs to investi-gate the signalling pathway involved in the expression and phos-phorylation of PPAR�. Meanwhile, it was believed that ERK can bepreferentially activated by mitogens such as the serum [36], wealso considered the influence of serum concentration in themedium when we examined the expression of MAPKs in MSCs. Asrevealed by RT-PCR, most MAPKs, except JNK, expressed inMSCs cultured in expansion medium containing 10% or 20% FBS(Fig. 3A). Data of real-time PCR indicated that higher concentra-tion of serum led to higher expression level of PPAR� in MSCs(Fig. 3B). It was also indicated by quantitative analysis of immuno-fluorescence that percentage of PPAR�-expressing cells increasedtremendously in MSCs cultured in expansion medium with 10% or20% FBS compared with that with 2% FBS. Percentage of pho-PPAR�-positive cells showed big differences as well. Then weblocked the signalling pathway by specific inhibitor. Western blotshowed that PD98059, which inhibits the activation of MEK1,decreased the expression of PPAR� as well as its phosphorylation(Fig. 3D). However, inhibition of p38 MAPK with PD169316seemed to have no effects on the expression and phosphorylationof PPAR�. Meanwhile, real-time PCR also showed inhibition ofMEK1 activation in MSCs’ reduced PPAR� expression level,whereas inhibition of p38MAPK slightly increased the expressionof PPAR� (Fig. 3E).
PPAR� is expressed without phosphorylation in MSCs cultured with low serum concentration
Then we isolated MSCs from murine bone marrow with low serummedium (2% FBS) to see if serum concentration affected thephosphorylation status of PPAR�. We used antibodies against eitherPPAR� or pho-PPAR� to show its expression and phosphorylation.
926 © 2009 The AuthorsJournal compilation © 2010 Foundation for Cellular and Molecular Medicine/Blackwell Publishing Ltd
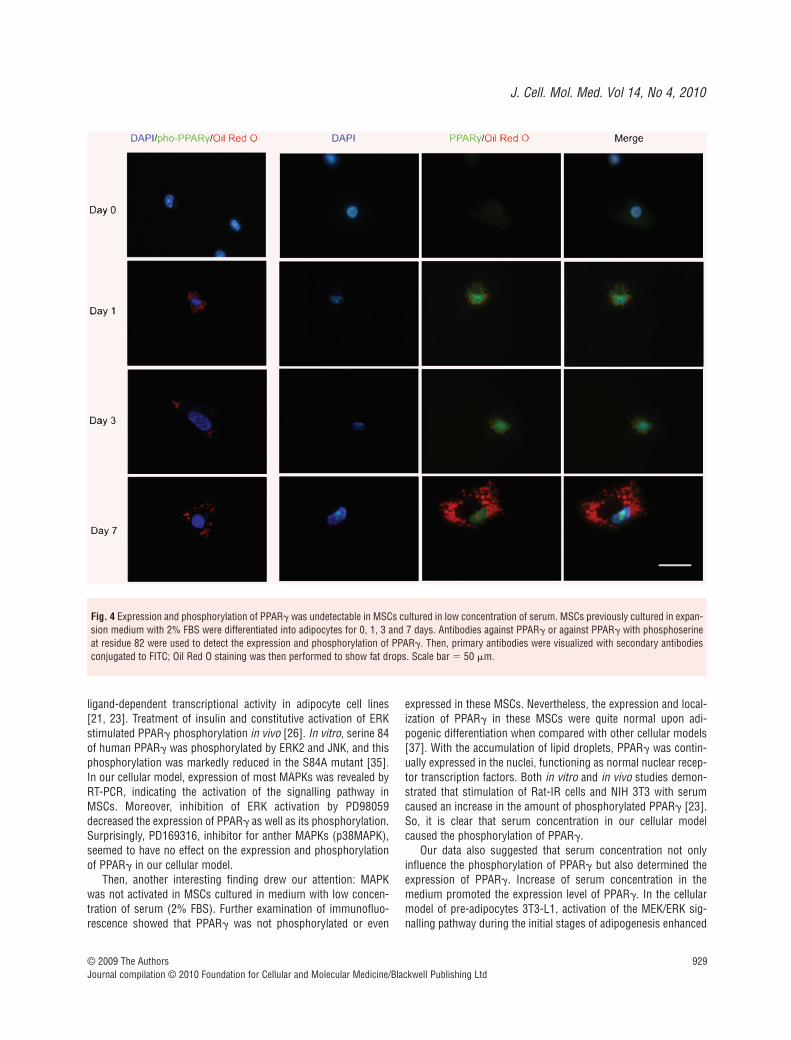
In the first row of Fig. 4, MSCs cultured in low serum mediumshow no expression and phosphorylation of PPAR�. MSCs werethen applied to adipogenic medium and examined by immunoflu-orescence at different time points. When PPAR� was expressed at
day 1, it localized in the nuclei of MSCs. Then with the continualaccumulation of fat drops in cytoplasm, PPAR� retained expres-sion in the nuclei; however, pho-PPAR� never showed up until theend of adipogenic differentiation.
Fig. 1 Expression and phosphorylation of PPAR� in undifferentiated MSCs. (A) PPAR� was expressed and phosphorylated in undifferentiated MSC.MSCs were sub-cultured to passage 2 in expansion medium containing 10% FBS, before immunofluorescent analysis; secondary antibodies conjugatedto rhodamine were applied for fluorescent detection. Scale bar � 50 �m. (B) PPAR� was also expressed and phosphorylated in primary MSCs. PrimaryMSCs cultured in expansion medium containing 10% FBS were directly applied to immunofluorescent analysis. Secondary antibodies conjugated torhodamine were used. Scale bar � 50 �m. (C) Percentages of positive cells are similar between different passages of MSCs. Immunofluorescent imageswere analyzed to compare PPAR� expression and phosphorylation between primary culture and passage 2 of MSCs. Positive cell ratio was calculatedas percentage of total cell number. Data were represented as mean � S.D. (n � 3). (D) Western blotting confirmed the expression and phosphoryla-tion of PPAR�. MSCs, cultured in expansion media containing 10% FBS, were applied to adipogenic differentiation. At day 0 (d0) and day 7 (d7), totalproteins of MSCs were extracted for Western blot to detect the expression and phosphorylation of PPAR. (E) RT-PCR then showed the expression ofPPAR�, PPAR� isoform 1 (PPAR�1) and isoform 2 (PPAR�2). MSCs cultured in expansion medium containing 10% FBS were applied to adipogenicdifferentiation. At day 0 and day 7, total RNA of MSCs were isolated for RT-PCR to detect the mRNA of PPAR�, PPAR�1 and PPAR�2.
J. Cell. Mol. Med. Vol 14, No 4, 2010
927© 2009 The AuthorsJournal compilation © 2010 Foundation for Cellular and Molecular Medicine/Blackwell Publishing Ltd
Higher concentration of serum enhances adipogenic differentiation of MSCs
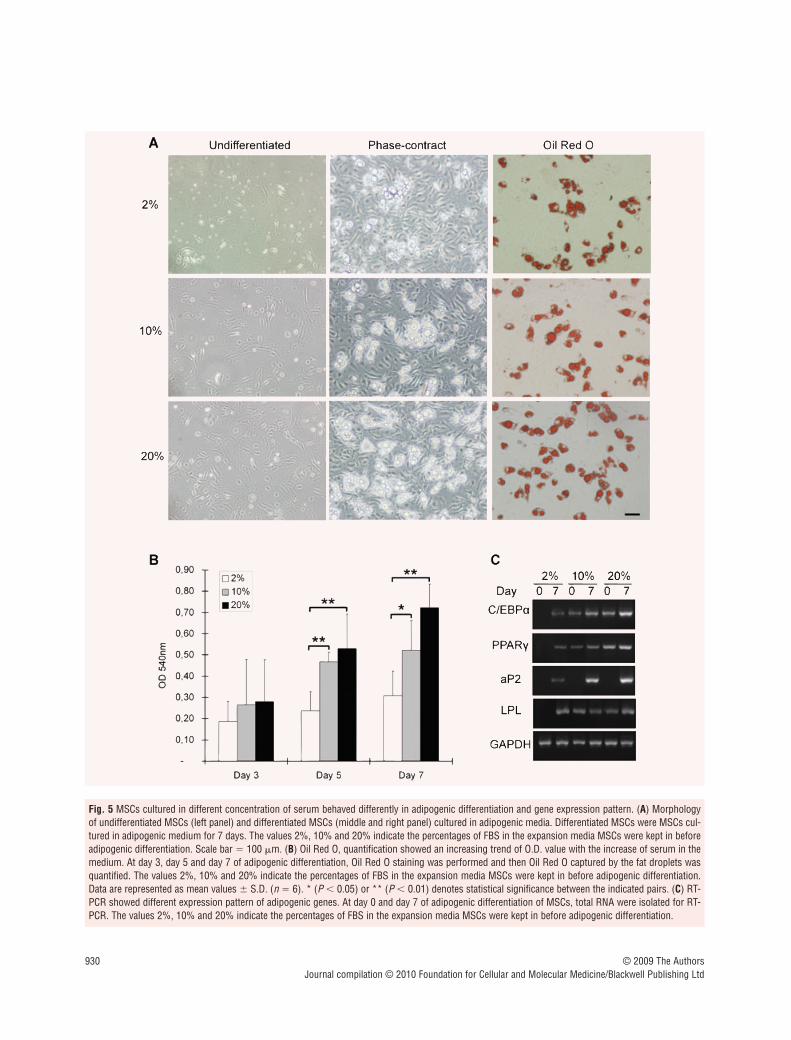
To investigate the consequences of PPAR� expression and phos-phorylation caused by different concentration of serum, we per-formed Oil Red O staining and quantification to show the differentcapacity in adipogenic differentiation of MSCs cultured in mediumcontaining 2, 10 and 20% of FBS. As shown in Fig. 5A, MSCsaccumulated more fat droplets in their cytoplasm, with theincrease of serum concentration in the medium. This trend wasfurther confirmed by the quantitative analysis of Oil Red O cap-tured by the fat drops (Fig. 5B). RT-PCR (Fig. 5C) revealed theexpression pattern of a set of adipocyte marker genes in MSCs.
Discussion
PPAR� was well recognized as a key regulator of adipogenic differentiation [18]. However, we recently reported that PPAR�
could be found in undifferentiated MSCs derived from adipose tis-sue [30]. In the present study, we found PPAR� expressed andphosphorylated a group of bone marrow–derived MSCs. Furtheranalysis demonstrated that activation of the MEK/ERK signallingpathway by higher concentration of serum promoted PPAR�
expression and phosphorylation, and subsequently enhanced adipogenic differentiation of MSCs.
We first found PPAR� expressed in bone marrow–derivedMSCs cultured in expansion medium without any adipogenicadditives. This is different from previous studies indicating thatPPAR� was expressed in differentiated MSCs [37, 38] and acti-vated transcription of its target genes in lipogenic pathways,including lipoprotein lipase (LPL), adipocyte fatty acid-bindingprotein (A-FABP or aP2), acyl-CoA synthase and fatty acid trans-port protein (FATP) [18]. However, our result was in agreementwith other studies showing that undifferentiated 3T3-L1 fibrob-lasts contained significant levels of PPAR� protein in their cyto-plasm [39]. More specifically, Moerman et al. reported thatexpression of PPAR�2 was increased with the aging of murinebone marrow–derived MSCs [40]. Their findings indicated thatmicroenvironment changes can induce the expression of PPAR�2 in MSCs. But why the expression of PPAR� in our cellularmodel did not trigger adipogenic differentiation and lipid accumu-lation in MSCs? Two differences in our study may provide reason-able explanations for the malfunction of PPAR�: (i ) PPAR� wasfound in the cytoplasm of MSCs in our study. As nuclear receptortranscription factor, PPAR� has to bind to a specific element(PPRE) in the promoter region of its target genes, before it acti-vates transcription in response to binding of the ligands [41]. So,PPAR� had been previously reported to reside mainly in thenucleus rather than in the cytoplasm [42]. (ii ) Phosphorylation ofPPAR� in MSCs was confirmed by immunofluorescence andWestern blot. Phosphorylation decreases PPAR� affinity to its lig-and by modulating the conformation of the unliganded receptor,
Fig. 2 PPAR� was dephosphorylated during the differentiation of MSCs. MSCs, previously grown in expansion medium with 10% FBS, were culturedin adipogenic medium for 0, 1, 3 and 7 days before immunofluorescent staining. Antibodies against PPAR� with phosphoserine at residue 82 (A) oragainst PPAR� (B) were used. Then, primary antibodies were visualized with secondary antibodies conjugated to FITC; Oil Red O staining was performedto show fat drops. Scale bar � 50 �m.

928 © 2009 The AuthorsJournal compilation © 2010 Foundation for Cellular and Molecular Medicine/Blackwell Publishing Ltd
thus reducing its transcriptional activity and inhibiting adipogenicdifferentiation [22].
It is believed that the phosphorylation status of proteins caninfluence their nuclear translocation. For example, phosphoryla-tion of carbohydrate response element binding protein (ChREBP),a transcription factor involved in the regulation of gene transcrip-tion by glucose, impairs its translocation into the nucleus[43].Whether such a mechanism regulates PPAR� localization andtranscriptional activity remains unclear. Data from the presentstudy revealed that there was a dephosphorylation process ofPPAR� during the adipogenic differentiation of MSCs. It was
reported that genomic activity of PPAR� was reduced by a rapidMEK1�dependent export of PPAR� from the nucleus to the cyto-plasm upon stimulation of mitogens (TPA, EGF) and PPAR��
ligands [44]. Although MEK1-mediated PPAR� translocation wasindependent of phosphorylation according to their results, PPAR�
did exist in the nucleus of MSCs after the dephosphorylationprocess of PPAR� in our study.
There are piles of documents demonstrating PPAR� are phosphorylated by MAPK. Epidermal growth factor (EGF) andplatelet-derived growth factor (PDGF) increased phosphorylationof PPAR� through MAPK signalling, thus decreasing its
Fig. 3 Inhibition of MEK activation reduced the expression and phosphorylation of PPAR�. (A) RT-PCR demonstrated the activation of MAPK signallingpathway. Total RNA of MSCs cultured in expansion medium was isolated for RT-PCR using the specific primers listed in Table 1. The values 2%, 10%and 20% indicate the percentages of FBS in the expansion media MSCs were kept in before RNA isolation. (B) Relative gene expression of PPAR� inMSCs cultured in different concentration of FBS. The values 2%, 10% and 20% indicate the percentages of FBS in the expansion media MSCs were keptin before RNA isolation. Data were normalized to �-actin and represented as mean � S.D. (n � 3). * (P 0.05) denotes statistical significance betweenthe indicated pairs. (C) Percentages of PPAR� expressing and phosphorylating cells in MSCs. Immunofluorescent images were analyzed to comparePPAR� expression and phosphorylation in MSCs cultured in the expansion media with 2%, 10% or 20% FBS. Positive cell ratio was calculated as per-centage of total cell number. Data were represented as mean � S.D. (n � 3). (D) Inhibitor PD98059 reduced the expression and phosphorylation ofPPAR�. Upon isolation of MSCs, 50 �M of PD98059 or 10 �M of PD169316 were added to the expansion medium containing 10% FBS. At the end ofprimary culture (7 days), total proteins of MSCs were extracted for Western blot to detect the expression and phosphorylation of PPAR. (E) Quantitativeanalysis of PPAR� expression when MEK and MAPK p38 was inhibited by specific inhibitor. Upon isolation of MSCs, 50 �M of PD98059 or 10 �M ofPD169316 were added to the expansion medium containing 10% FBS. At the end of primary culture (7 days), total RNA of MSCs were extracted forreal-time PCR. Data were normalized to �-actin and represented as mean � S.D. (n � 3).
J. Cell. Mol. Med. Vol 14, No 4, 2010
929© 2009 The AuthorsJournal compilation © 2010 Foundation for Cellular and Molecular Medicine/Blackwell Publishing Ltd
ligand-dependent transcriptional activity in adipocyte cell lines[21, 23]. Treatment of insulin and constitutive activation of ERKstimulated PPAR� phosphorylation in vivo [26]. In vitro, serine 84of human PPAR� was phosphorylated by ERK2 and JNK, and thisphosphorylation was markedly reduced in the S84A mutant [35].In our cellular model, expression of most MAPKs was revealed byRT-PCR, indicating the activation of the signalling pathway inMSCs. Moreover, inhibition of ERK activation by PD98059decreased the expression of PPAR� as well as its phosphorylation.Surprisingly, PD169316, inhibitor for anther MAPKs (p38MAPK),seemed to have no effect on the expression and phosphorylationof PPAR� in our cellular model.
Then, another interesting finding drew our attention: MAPKwas not activated in MSCs cultured in medium with low concen-tration of serum (2% FBS). Further examination of immunofluo-rescence showed that PPAR� was not phosphorylated or even
expressed in these MSCs. Nevertheless, the expression and local-ization of PPAR� in these MSCs were quite normal upon adi-pogenic differentiation when compared with other cellular models[37]. With the accumulation of lipid droplets, PPAR� was contin-ually expressed in the nuclei, functioning as normal nuclear recep-tor transcription factors. Both in vitro and in vivo studies demon-strated that stimulation of Rat-IR cells and NIH 3T3 with serumcaused an increase in the amount of phosphorylated PPAR� [23].So, it is clear that serum concentration in our cellular modelcaused the phosphorylation of PPAR�.
Our data also suggested that serum concentration not onlyinfluence the phosphorylation of PPAR� but also determined theexpression of PPAR�. Increase of serum concentration in themedium promoted the expression level of PPAR�. In the cellularmodel of pre-adipocytes 3T3-L1, activation of the MEK/ERK sig-nalling pathway during the initial stages of adipogenesis enhanced
Fig. 4 Expression and phosphorylation of PPAR� was undetectable in MSCs cultured in low concentration of serum. MSCs previously cultured in expan-sion medium with 2% FBS were differentiated into adipocytes for 0, 1, 3 and 7 days. Antibodies against PPAR� or against PPAR� with phosphoserineat residue 82 were used to detect the expression and phosphorylation of PPAR�. Then, primary antibodies were visualized with secondary antibodiesconjugated to FITC; Oil Red O staining was then performed to show fat drops. Scale bar � 50 �m.
930 © 2009 The AuthorsJournal compilation © 2010 Foundation for Cellular and Molecular Medicine/Blackwell Publishing Ltd
Fig. 5 MSCs cultured in different concentration of serum behaved differently in adipogenic differentiation and gene expression pattern. (A) Morphologyof undifferentiated MSCs (left panel) and differentiated MSCs (middle and right panel) cultured in adipogenic media. Differentiated MSCs were MSCs cul-tured in adipogenic medium for 7 days. The values 2%, 10% and 20% indicate the percentages of FBS in the expansion media MSCs were kept in beforeadipogenic differentiation. Scale bar � 100 �m. (B) Oil Red O, quantification showed an increasing trend of O.D. value with the increase of serum in themedium. At day 3, day 5 and day 7 of adipogenic differentiation, Oil Red O staining was performed and then Oil Red O captured by the fat droplets wasquantified. The values 2%, 10% and 20% indicate the percentages of FBS in the expansion media MSCs were kept in before adipogenic differentiation.Data are represented as mean values � S.D. (n � 6). * (P 0.05) or ** (P 0.01) denotes statistical significance between the indicated pairs. (C) RT-PCR showed different expression pattern of adipogenic genes. At day 0 and day 7 of adipogenic differentiation of MSCs, total RNA were isolated for RT-PCR. The values 2%, 10% and 20% indicate the percentages of FBS in the expansion media MSCs were kept in before adipogenic differentiation.
J. Cell. Mol. Med. Vol 14, No 4, 2010
931© 2009 The AuthorsJournal compilation © 2010 Foundation for Cellular and Molecular Medicine/Blackwell Publishing Ltd
the activity of factors that regulate PPAR� expression [29].Janderova et al. reported that inhibition of ERK1/2 phosphoryla-tion by PD98059 increase the adipogenesis of human MSCs [45].
As early as the 1980s, scientists had already noted that humanserum effectively promote the terminal differentiation of pre-adipocytes 3T3-L1 cell [46, 47]. In vitro study on adipogenesis ofrat stromal-vascular cells demonstrated that initial concentrationof FBS increased the rate of adipocyte differentiation [48]. Oreffoet al. reported that continuous treatment of human serum wasrequired for an adipogenic differentiation model of human MSCs.Their results demonstrate that human serum contains factors thatexert dramatic effects on human bone marrow cell differentiationto adipocytes [49]. It was reported that chick serum contains fac-tors for adipocyte induction not only in vitro but also in vivo, andthat the adipogenic potential does not depend on the supplementsused during the cell culture [50]. Our data also indicated thatMSCs showed stronger capacity in adipogenic differentiation ifthey were previously cultured in medium containing higher con-centration of serum.
Taken together, our results indicated the expression and phos-phorylation of PPAR� in undifferentiated MSCs. Then our data
indicated that phosphorylation of PPAR� is dependent on the acti-vation of MEK/ERK signalling pathway. Finally, we demonstratedthat it was serum that caused the expression and phosphorylationof PPAR�, and subsequently promoted adipogenic differentiationof MSCs. These data sum up to suggest a dual effect of serum onthe adipogenic differentiation of MSCs that determines the expres-sion of PPAR� and at the same time induced its phosphorylationthus preventing it from translocation into nucleus to function astranscription factors.
Acknowledgements
We are grateful to Hao Yang, Key Laboratory of Transplant Immunology(Sichuan University) for helpful discussion. We also thank Ms. Ivy Wangfor critical reading of the manuscript. This work was funded by the NationalNatural Science Foundation of China (No. 30801304), Specialized ResearchFund for the Doctoral Program of Higher Education (No. 20070610062),Opening Funding of the State Key Laboratory of Oral Diseases, SichuanUniversity (No. SKLODKF200701) and Applied Fundamental Project ofSichuan Province (2008JY0028-2).
References
1. Turksen K. Adult stem cells. 1st ed.Totowa: Humana Press; 2004.
2. Le Blanc K, Pittenger M. Mesenchymalstem cells: progress toward promise.Cytotherapy. 2005; 7: 36–45.
3. Gronthos S, Zannettino AC, Hay SJ, et al.Molecular and cellular characterisation ofhighly purified stromal stem cells derivedfrom human bone marrow. J Cell Sci.2003; 116: 1827–35.
4. Minguell JJ, Erices A, Conget P.Mesenchymal stem cells. Exp Biol Med.2001; 226: 507–20.
5. Cortesini R. Stem cells, tissue engineeringand organogenesis in transplantation.Transpl Immunol. 2005; 15: 81–9.
6. Conrad C, Huss R. Adult stem cell lines inregenerative medicine and reconstructivesurgery. J Surg Res. 2005; 124: 201–8.
7. Biddinger SB, Kahn CR. From mice tomen: insights into the insulin resistancesyndromes. Annu Rev Physiol. 2006; 68:123–58.
8. Lehrke M, Lazar MA. The many faces ofPPARgamma. Cell. 2005; 123: 993–9.
9. Kota BP, Huang TH, Roufogalis BD. Anoverview on biological mechanisms ofPPARs. Pharmacol Res. 2005; 51: 85–94.
10. Fernyhough ME, Okine E, Hausman G, et al. PPARgamma and GLUT-4 expres-sion as developmental regulators/markers
for preadipocyte differentiation into anadipocyte. Domest Anim Endocrinol. 2007;33: 367–78.
11. Gurnell M. Peroxisome proliferator-acti-vated receptor gamma and the regulationof adipocyte function: lessons from humangenetic studies. Best Pract Res ClinEndocrinol Metab. 2005; 19: 501–23.
12. Kiec-Wilk B, Dembinska-Kiec A,Olszanecka A, et al. The selected patho-physiological aspects of PPARs activation.J Physiol Pharmacol. 2005; 56: 149–62.
13. Chinetti G, Fruchart JC, Staels B.Peroxisome proliferator-activated receptors(PPARs): nuclear receptors at the cross-roads between lipid metabolism and inflammation. Inflamm Res. 2000; 49:497–505.
14. Fajas L, Auboeuf D, Raspe E, et al. Theorganization, promoter analysis, andexpression of the human PPARgammagene. J Biol Chem. 1997; 272: 18779–89.
15. Rosen ED, Spiegelman BM. PPARgamma:a nuclear regulator of metabolism, differ-entiation, and cell growth. J Biol Chem.2001; 276: 37731–4.
16. Knouff C, Auwerx J. Peroxisome prolifera-tor-activated receptor-gamma calls foractivation in moderation: lessons fromgenetics and pharmacology. Endocr Rev.2004; 25: 899–918.
17. Kubota N, Terauchi Y, Miki H, et al. PPARgamma mediates high-fat diet-inducedadipocyte hypertrophy and insulin resist-ance. Mol Cell. 1999; 4: 597–609.
18. Rosen ED, Sarraf P, Troy AE, et al. PPARgamma is required for the differentiation ofadipose tissue in vivo and in vitro. Mol Cell.1999; 4: 611–7.
19. Barak Y, Nelson MC, Ong ES, et al. PPARgamma is required for placental, cardiac,and adipose tissue development. Mol Cell.1999; 4: 585–95.
20. Hong JH, Hwang ES, McManus MT, et al. TAZ, a transcriptional modulator of mesenchymal stem cell differentiation.Science. 2005; 309: 1074–8.
21. Camp HS, Tafuri SR, Leff T. c-Jun N-ter-minal kinase phosphorylates peroxisomeproliferator-activated receptor-gamma1and negatively regulates its transcriptionalactivity. Endocrinology. 1999; 140: 392–7.
22. Shao D, Rangwala SM, Bailey ST, et al.Interdomain communication regulating ligand binding by PPAR-gamma. Nature.1998; 396: 377–80.
23. Hu E, Kim JB, Sarraf P, et al. Inhibition of adipogenesis through MAP kinase-mediated phosphorylation of PPARgamma.Science. 1996; 274: 2100–3.
24. Aouadi M, Laurent K, Prot M, et al. Inhibition of p38MAPK increases
932 © 2009 The AuthorsJournal compilation © 2010 Foundation for Cellular and Molecular Medicine/Blackwell Publishing Ltd
adipogenesis from embryonic to adultstages. Diabetes. 2006; 55: 281–9.
25. Rochette-Egly C. Nuclear receptors: inte-gration of multiple signalling pathwaysthrough phosphorylation. Cell Signal.2003; 15: 355–66.
26. Zhang B, Berger J, Zhou G, et al. Insulin-and mitogen-activated protein kinase-medi-ated phosphorylation and activation of per-oxisome proliferator-activated receptorgamma. J Biol Chem. 1996; 271: 31771–4.
27. Bost F, Caron L, Marchetti I, et al.Retinoic acid activation of the ERK path-way is required for embryonic stem cellcommitment into the adipocyte lineage.Biochem J. 2002; 361: 621–7.
28. Machinal-Quelin F, Dieudonne MN,Leneveu MC, et al. Proadipogenic effectof leptin on rat preadipocytes in vitro: activation of MAPK and STAT3 signalingpathways. Am J Physiol Cell Physiol. 2002;282: C853–63.
29. Prusty D, Park BH, Davis KE, et al.Activation of MEK/ERK signaling promotesadipogenesis by enhancing peroxisomeproliferator-activated receptor gamma(PPARgamma) and C/EBPalpha geneexpression during the differentiation of3T3-L1 preadipocytes. J Biol Chem. 2002;277: 46226–32.
30. Lin YF, Jing W, Wu L, et al. Identificationof osteo-adipo progenitor cells in fat tissue. Cell Prolif. 2008; 41: 803–12.
31. Li ZY, Chen L, Liu L, et al. Odontogenicpotential of bone marrow mesenchymalstem cells. J Oral Maxillofac Surg. 2007;65: 494–500.
32. Sen A, Lea-Currie YR, Sujkowska D, et al. Adipogenic potential of human adipose derived stromal cells from multi-ple donors is heterogeneous. J CellBiochem. 2001; 81: 312–9.
33. Livak KJ, Schmittgen TD. Analysis of rel-ative gene expression data using real-timequantitative PCR and the 2(-Delta DeltaC(T)) Method. Methods. 2001; 25: 402–8.
34. Prawitt J, Niemeier A, Kassem M, et al.Characterization of lipid metabolism ininsulin-sensitive adipocytes differentiatedfrom immortalized human mesenchymalstem cells. Exp Cell Res. 2008; 314:814–24.
35. Adams M, Reginato MJ, Shao DL, et al.Transcriptional activation by peroxisomeproliferator-activated receptor gamma isinhibited by phosphorylation at a consen-sus mitogen-activated protein kinase site.J Biol Chem. 1997; 272: 5128–32.
36. Bost F, Aouadi M, Caron L, et al. The roleof MAPKs in adipocyte differentiation andobesity. Biochimie. 2005; 87: 51–6.
37. Choi YS, Park SN, Suh H. Adipose tissueengineering using mesenchymal stemcells attached to injectable PLGA spheres.Biomaterials. 2005; 26: 5855–63.
38. Guilak F, Lott KE, Award HA, et al. Clonalanalysis of the differentiation potential ofhuman adipose-derived adult stem cells. J Cell Physiol. 2006; 206: 229–37.
39. Thuillier P, Baillie R, Sha X, et al.Cytosolic and nuclear distribution ofPPARgamma2 in differentiating 3T3-L1preadipocytes. J Lipid Res. 1998; 39:2329–38.
40. Moerman EJ, Teng K, Lipschitz DA, et al.Aging activates adipogenic and sup-presses osteogenic programs in mes-enchymal marrow stroma/stem cells: therole of PPAR-gamma2 transcription factorand TGF-beta/BMP signaling pathways.Aging Cell. 2004; 3: 379–89.
41. Kersten S, Desvergne B, Wahli W. Rolesof PPARs in health and disease. Nature.2000; 405: 421–4.
42. Berger J, Patel HV, Woods J, et al.A PPARgamma mutant serves as a domi-nant negative inhibitor of PPAR signalingand is localized in the nucleus. Mol CellEndocrinol. 2000; 162: 57–67.
43. Kabashima T, Kawaguchi T, WadzinskiBE, et al. Xylulose 5-phosphate mediatesglucose-induced lipogenesis by xylulose5-phosphate-activated protein phos-phatase in rat liver. Proc Natl Acad SciUSA. 2003; 100: 5107–12.
44. Burgermeister E, Chuderland D, HanochT, et al. Interaction with MEK causesnuclear export and downregulation of per-oxisome proliferator�activated receptorgamma. Mol Cell Biol. 2007; 27: 803–17.
45. Janderova L, McNeil M, Murrell AN, et al. Human mesenchymal stem cells asan in vitro model for human adipogenesis.Obes Res. 2003; 11: 65–74.
46. Hauner H, Loffler G. Adipogenic factors inhuman serum promote the adipose con-version of 3T3-L1 fibroblasts. Int J Obes.1986; 10: 323–30.
47. Nixon T, Green H. Contribution of growth hormone to the adipogenic activityof serum. Endocrinology. 1984; 114:527–32.
48. Richardson RL, Campion DR, HausmanGJ. Adhesion, proliferation, and adipogen-esis in primary rat cell cultures: effects ofcollagenous substrata, fibronectin, andserum. Cell Tissue Res. 1988; 251: 123–8.
49. Oreffo RO, Virdi AS, Triffitt JT. Modulationof osteogenesis and adipogenesis byhuman serum in human bone marrow cultures. Eur J Cell Biol. 1997; 74: 251–61.
50. Ishizeki K, Takahashi N, Nawa T.Induction of adipogenesis by theintrasplenic transplantation of chick serumclots. Arch Histol Cytol. 2004; 67: 21–30.
Copyright © 2022 FDOKUMEN