Imaging of the Peripheral Nervous System: Evaluation ... - NCBI
13
Imaging of the Peripheral Nervous System: Evaluation of Peripheral Neuropathy and Plexopathy Kenneth R. Maravilla and Brian C. Bowen Over the past decade, technical advances in MR imaging of the CNS have resulted in improved diag- nosis and evaluation of encephalopathy, myelopathy, and cranial neuropathy. Parallel advances in imaging of the peripheral nervous system have not occurred, and the evaluation of peripheral neuropathy or plex- opathy has relied principally on the patient’s clinical history and the neurologic examination, with rela- tively few requests for imaging studies. Routine CT and MR imaging have been useful to exclude mass lesions in the vicinity of a peripheral nerve, but there has not been an effective method for directly imaging the nerve (1, 2). Also, in the last decade, neurologic and orthopedic surgeons have become skilled in newer, more sophis- ticated microsurgical procedures to repair damaged nerves, and many of these surgeons have chosen to specialize in peripheral nerve treatment. For these reasons, noninvasive techniques are needed that im- prove the diagnostic accuracy of peripheral neuropa- thy and facilitate preoperative planning when surgery is contemplated. Currently, electrophysiological stud- ies are widely used and have high sensitivity for de- tecting a conduction abnormality; however, they lack specificity and cannot display the anatomic detail needed for precise localization and treatment plan- ning. High-resolution imaging of peripheral nerves potentially overcomes these limitations and, conse- quently, recent interest has focused on improved MR imaging techniques that use phased-array radiofre- quency (RF) coil technology and rapid acquisition of imaging data (3–5). Anatomy Peripheral Nerves The basic unit of the peripheral nerve is the axon, which may be myelinated or unmyelinated, and carry efferent (motor) or afferent (sensory) electrical im- pulses. Isolated peripheral nerves in the extremities, as well as nerves composing the brachial and lumbo- sacral plexus, are a mixture of such axons. Myelinated axons are enclosed by many layers of compacted Schwann cell membranes, which form the myelin sheath, whereas “unmyelinated” axons merely invag- inate into grooves in the Schwann cell cytoplasm. The fluid-containing periaxonal space between the axon membrane and the apposed Schwann cell membrane is less than 20 nm wide. For both myelinated and unmyelinated axons, there is a basement membrane (or basal lamina) that surrounds the external surface of the Schwann cell–axon complex. The largest peripheral nerves have three connec- tive tissue sheaths that support and protect the com- plex (6). The innermost sheath is the endoneurium. It consists of loose vascular connective tissue and extra- cellular fluid. The endoneurium invests the Schwann cell–axon complex. Its inner border is thus the Schwann cell basement membrane, and its outer bor- der is the second connective tissue sheath, the peri- neurium. The axons, Schwann cells, and endoneurium are bundled together into fascicles, each of which is encompassed by a dense perineurial sheath (Fig 1). The endoneurial fluid within each fascicle is isolated from the general extracellular space by tightly adher- ent epithelial-like cells of the perineurium and from the circulating blood by the tight junctions between endothelial cells of the endoneurial capillaries. The perineurium acts as a protective barrier to infectious or toxic agents; however, once this barrier is pene- trated, there is the potential for spread of disease along the fascicle. The epineurium is the outermost connective tissue sheath. It envelops the nerve and has extensions that encompass each of the perineurial-lined fascicles, providing mechanical support for the axons when they are subjected to stretching forces. The epineurium consists of dense, irregular connective tissue, with thick collagen and elastin fibers. Variable amounts of interfascicular adipose tissue are present within the larger nerves (Fig 1). For example, the sciatic nerve contains appreciable quantities of fat, whereas the nerves of the upper limb have relatively little fat (7). Nutrient vessels penetrate the nerve at frequent intervals along its course, communicating with the longitudinally oriented epineurial, interfas- cicular, perineurial, and intrafascicular arteries and arterioles. At the central or proximal end of the spinal Supported in part by a Dana Foundation Grant for Clinical Hypotheses in the Neurological Sciences (K.R.M.). From the Departments of Radiology and Neurological Surgery, University of Washington, Seattle, WA (K.R.M.); and the Departments of Radiology and Neurological Surgery, University of Miami School of Medicine, Miami, FL (B.C.B.). Address reprint requests to Kenneth R. Maravilla, MD, Department of Radiology, University of Washington, Box 357115, Seattle, WA 98195. © American Society of Neuroradiology Review Article 1011
-
Upload
khangminh22 -
Category
Documents
-
view
1 -
download
0
Transcript of Imaging of the Peripheral Nervous System: Evaluation ... - NCBI

Review Article
Imaging of the Peripheral Nervous System: Evaluation of PeripheralNeuropathy and Plexopathy
Kenneth R. Maravilla and Brian C. Bowen
Over the past decade, technical advances in MRimaging of the CNS have resulted in improved diag-nosis and evaluation of encephalopathy, myelopathy,and cranial neuropathy. Parallel advances in imagingof the peripheral nervous system have not occurred,and the evaluation of peripheral neuropathy or plex-opathy has relied principally on the patient’s clinicalhistory and the neurologic examination, with rela-tively few requests for imaging studies. Routine CTand MR imaging have been useful to exclude masslesions in the vicinity of a peripheral nerve, but therehas not been an effective method for directly imagingthe nerve (1, 2).
Also, in the last decade, neurologic and orthopedicsurgeons have become skilled in newer, more sophis-ticated microsurgical procedures to repair damagednerves, and many of these surgeons have chosen tospecialize in peripheral nerve treatment. For thesereasons, noninvasive techniques are needed that im-prove the diagnostic accuracy of peripheral neuropa-thy and facilitate preoperative planning when surgeryis contemplated. Currently, electrophysiological stud-ies are widely used and have high sensitivity for de-tecting a conduction abnormality; however, they lackspecificity and cannot display the anatomic detailneeded for precise localization and treatment plan-ning. High-resolution imaging of peripheral nervespotentially overcomes these limitations and, conse-quently, recent interest has focused on improved MRimaging techniques that use phased-array radiofre-quency (RF) coil technology and rapid acquisition ofimaging data (3–5).
Anatomy
Peripheral NervesThe basic unit of the peripheral nerve is the axon,
which may be myelinated or unmyelinated, and carryefferent (motor) or afferent (sensory) electrical im-pulses. Isolated peripheral nerves in the extremities,as well as nerves composing the brachial and lumbo-sacral plexus, are a mixture of such axons. Myelinatedaxons are enclosed by many layers of compactedSchwann cell membranes, which form the myelin
Supported in part by a Dana Foundation Grant for Clinical HypotFrom the Departments of Radiology and Neurological Surgery, Un
of Radiology and Neurological Surgery, University of Miami SchoolAddress reprint requests to Kenneth R. Maravilla, MD, Departme
98195.
© American Society of Neuroradiology
10
sheath, whereas “unmyelinated” axons merely invag-inate into grooves in the Schwann cell cytoplasm. Thefluid-containing periaxonal space between the axonmembrane and the apposed Schwann cell membraneis less than 20 nm wide. For both myelinated andunmyelinated axons, there is a basement membrane(or basal lamina) that surrounds the external surfaceof the Schwann cell–axon complex.
The largest peripheral nerves have three connec-tive tissue sheaths that support and protect the com-plex (6). The innermost sheath is the endoneurium. Itconsists of loose vascular connective tissue and extra-cellular fluid. The endoneurium invests the Schwanncell–axon complex. Its inner border is thus theSchwann cell basement membrane, and its outer bor-der is the second connective tissue sheath, the peri-neurium. The axons, Schwann cells, and endoneuriumare bundled together into fascicles, each of which isencompassed by a dense perineurial sheath (Fig 1).The endoneurial fluid within each fascicle is isolatedfrom the general extracellular space by tightly adher-ent epithelial-like cells of the perineurium and fromthe circulating blood by the tight junctions betweenendothelial cells of the endoneurial capillaries. Theperineurium acts as a protective barrier to infectiousor toxic agents; however, once this barrier is pene-trated, there is the potential for spread of diseasealong the fascicle.
The epineurium is the outermost connective tissuesheath. It envelops the nerve and has extensions thatencompass each of the perineurial-lined fascicles,providing mechanical support for the axons whenthey are subjected to stretching forces. Theepineurium consists of dense, irregular connectivetissue, with thick collagen and elastin fibers. Variableamounts of interfascicular adipose tissue are presentwithin the larger nerves (Fig 1). For example, thesciatic nerve contains appreciable quantities of fat,whereas the nerves of the upper limb have relativelylittle fat (7). Nutrient vessels penetrate the nerve atfrequent intervals along its course, communicatingwith the longitudinally oriented epineurial, interfas-cicular, perineurial, and intrafascicular arteries andarterioles. At the central or proximal end of the spinal
heses in the Neurological Sciences (K.R.M.).iversity of Washington, Seattle, WA (K.R.M.); and the Departments
of Medicine, Miami, FL (B.C.B.).nt of Radiology, University of Washington, Box 357115, Seattle, WA
11

1012 MARAVILLA AJNR: 19, June 1998
FIG 1. A, Schematic drawing of peripheral nerve anatomy. Fascicles within large peripheral nerves are interspersed with variableamounts of adipose tissue and surrounded by epineurium. Each fascicle (enlarged segment ) is enclosed by a ring of dense perineuriumand contains myelinated and unmyelinated axons supported by loose endoneurial connective tissue.
B, Axial fat-suppressed T2-weighted (5000/102/2; echo train length 5 8) MR image of a sciatic nerve (arrow) shows the samefascicular pattern illustrated in A. The fascicles display a honeycomblike appearance of hyperintense signal interspersed with adiposetissue and connective tissue, which appear dark.
nerves, the epineurium is continuous with the duramater. At the distal or peripheral end of the periph-eral nerves, the epineurium is progressively reducedin thickness, eventually being incorporated into theperineurium.
The largest peripheral nerves are approximately 1to 10 mm in diameter (up to 20 mm for the sciaticnerve), and contain on the order of 10 fascicles(range, 1 to 100) (7). Each fascicle is usually com-posed of motor, sensory, and sympathetic fibers. Thenumber and size of fascicles vary from nerve to nerveand along the length of any single nerve. The longi-tudinal variation occurs because fascicles repeatedlyunite and divide along the course of the nerve, allow-ing the passage of axons from one fascicle to another.Sunderland (7) has reported that the largest fasciclesin formalin-fixed nerves are 3.5 mm in diameter,while the smallest are about 0.05 mm. He also iden-tified the average number of fascicles and the per-centage of cross-sectional area of the nerve occupiedby them at different locations along the median, ul-nar, and radial nerves, as well as in the tibial andcommon peroneal divisions of the sciatic nerve.
As indicated in Figure 1B, MR imaging can depictfascicles on high-resolution sequences in vivo. TheMR signal characteristics of normal, large peripheralnerves have been described in previous reports (3–5)and have recently been verified by Ikeda et al (8) in astudy comparing MR imaging findings in cadaverswith histopathologic specimens. The clustered dotlikestructures seen on high-resolution, cross-sectionalMR images represent the fascicles, and it has beensuggested that their signal characteristics are due toendoneurial fluid (4, 5, 9).
Neural PlexusProper interpretation of MR imaging studies of the
nerves requires a detailed knowledge of the regional
anatomy of the neural plexus and/or isolated periph-eral nerves of interest, as well as the location of themuscle(s) innervated by the nerve(s). This knowledgehelps to locate the site of abnormality of the nerve inquestion and to avoid pitfalls in nerve identification.Incorrect identification of a nerve can occur either bymistaking one nerve for another, where two or morenerves run in proximity, or by mistaking a linearstructure, such as a small blood vessel, tendon, ormuscular bundle, for a nerve.
The brachial and lumbosacral plexus are networksof peripheral nerves, and thus the components ofeach network have the basic endoneurium-perineuri-um-epineurium organization and fascicular structuredescribed above for an isolated peripheral nerve. Acomponent nerve can be identified on MR nerveimages if the observer is familiar with the intrinsicanatomy of the plexus and the relationship of thecomponent of interest to adjacent muscles, vessels,and osseous landmarks.
Each plexus is formed from the ventral rami of a setof spinal nerves. The brachial plexus is formed fromthe ventral rami of the C5-T1 spinal nerves. Theventral rami are the roots of the plexus. They form theupper, middle, and lower trunks in or near the cleftbetween the anterior and middle scalene muscles,known as the interscalene triangle (1) (plane A in Fig2; Fig 3A–D). More laterally, the trunks divide intoanterior and posterior divisions just distal to the in-terscalene triangle (plane B in Fig 2; Fig 3E and F).Subsequently, these divisions join to form three cordsdistal to the lateral margin of the first rib (sagittalplane C in Fig 2). The subclavian artery travelsthrough the interscalene triangle with the plexuswhile the subclavian vein courses anterior to the an-terior scalene muscle. In the axilla, the neurovascularcomplex within the axillary sheath consists of theaxillary artery, the adjacent lateral, posterior, andmedial cords, and the axillary vein. At sagittal plane C

AJNR: 19, June 1998 REVIEW ARTICLE 1013
FIG 2. Schematic representation of brachial plexus: The C5–T1ventral rami are called roots. These form three trunks near theanterolateral margins of the anterior and middle scalene muscles(interscalene triangle, plane A). The trunks divide into anteriorand posterior divisions more laterally, and then join to form thethree cords near the lateral margin of the first rib (plane B). Thesubclavian artery travels through the interscalene triangle withthe plexus, while the subclavian vein courses anterior to theanterior scalene muscle. In the axilla, the neurovascular complexconsists of the axillary artery and vein and the cords of theplexus. At plane B, the complex is bordered anteriorly by thepectoralis major muscle and posteriorly by the serratus anteriormuscle. At plane C (approximate level of coracoid process), theanterior and posterior borders are the pectoralis minor and thesubscapularis muscles, respectively. Each cord ends in twoterminal branches. Reprinted with permission from (1).
(coracoid process), the anterior and posterior bordersare the pectoralis minor and the subscapularis mus-cles, respectively. Each cord ends in two major termi-nal branches.
The lumbosacral plexus consists of two separateplexus, the lumbar and the sacral (2) (Fig 4). Thelumbar plexus is formed from the L1-L3 ventral rami,with contributions from T12 and L4. The rami, orroots, divide into anterior and posterior divisions. Theanterior divisions combine to form the anteriorbranches (iliohypogastric, ilioinguinal, genitofemoral,and obturator nerves) of the plexus, and the posteriordivisions combine to form the posterior branches(femoral and lateral femoral cutaneous nerves) withinthe psoas major muscle. The anterior and posteriorbranches are distributed to the embryonic anterior(ventral) and posterior (dorsal) skin and musculatureof the lower limb, respectively. In the adult, the an-teroposterior relationships are altered primarily be-cause of the medial rotation that the lower limb un-dergoes during development. Thus, the femoralnerve, which is a posterior branch of the plexus, in-nervates muscles and skin on the front of the thigh(sartorius, quadriceps) and skin on the medial aspectof the thigh and leg (saphenous branch of femoralnerve). In general, the lumbar plexus innervates themuscles of the anterior and medial thigh while thesacral plexus innervates the muscles of the buttockand posterior thigh and all those below the knee.
The sacral plexus is formed from the ventral ramiof L4–L5 (lumbosacral trunk) and S1–S4. Again, an-
FIG 3. MR images of the brachial plexus.A and B, Coronal T1-weighted (600/10/2) (A ) and STIR (4000/34/160/2; echo train length 5 4) (B ) images of the brachial plexus show
the major nerve roots originating from the cervical spine that subsequently join to form trunks within the interscalene triangle (A). Thesecontinue distally to form divisions (B) and then subsequently cords (C).
C and D, Sagittal images at the level of the interscalene triangle (roughly corresponding to the plane denoted A in A and B ) show theC5 and C6 nerve roots as they come together to form the upper trunk as well as the middle and lower trunks within the interscalenetriangle. Note the position of these trunks superior to the subclavian artery.
E and F, Sagittal images at a plane approximately corresponding to that labeled by B in A and B. At this level, the divisions of thebrachial plexus can be seen. Note their position forming a trianglelike configuration just above the subclavian artery. The posteriormargin of the brachial plexus divisions is bordered by the serratus anterior muscle (SA).

AJNR: 19, June 1998
terior and posterior divisions give rise to anterior andposterior branches. The anterior branches include thetibial part of the sciatic nerve, pudendal nerve, andmedial part of the posterior femoral cutaneous nerve,whereas the posterior branches include the commonperoneal part of sciatic nerve, superior and inferiorgluteal nerves, lateral part of the posterior femoralcutaneous nerve, and the nerve to the piriformis mus-cle. Located anterior to the piriformis muscle and thesacroiliac joint, the sacral plexus is a broad triangularnetwork whose apex is the sciatic nerve (Fig 4; Fig 5).The sciatic nerve (L4–S3) exits the pelvis through thegreater sciatic foramen along with the piriformis mus-cle and the superior and inferior gluteal vessels andnerves. The sciatic nerve courses laterally in the glu-teal region, approaches the middle, posterior portionof the upper thigh, and then continues inferiorly untildividing into the common peroneal and tibial nervesin the region of the lower third of the femur.
The internal iliac vessels are located anteromedialto the lumbosacral trunk at the level of the sacralpromontory. The superior gluteal branches pass be-
FIG 4. Schematic representation of lumbar and sacral plexus:the lumbar plexus is formed from the L1–L3 ventral rami, withcontributions from T12 and L4. The sacral plexus is formed fromthe ventral rami of L4, L5 (lumbosacral trunk), and S1–S4. Thesciatic nerve (L4–S3) exits the pelvis through the greater sciaticforamen ventral to the piriformis muscle. The common peronealand tibial branches of the sciatic nerve separate in the lowerthigh. Anterior divisions of the rami forming the sacral plexusgive rise to the tibial part of the sciatic nerve, while posteriordivisions give rise to the common peroneal part of sciatic nerve.Reprinted with permission from (2).
1014 MARAVILLA
tween the lumbosacral trunk and S1 (or between S1and S2), turning laterally immediately inferior to thesacroiliac joint and exiting the pelvis along with thesuperior gluteal nerve. The inferior gluteal vesselsusually pass between S1 and S2 or between S2 and S3.These vessels lie posteromedial to the sciatic nerveand accompany it through the greater sciatic foramen.The internal pudendal vessels are located betweenthe ischial part of the spine and the pudendal nerveand follow its course through the greater and lessersciatic foramina.
Methods
RF CoilsTo obtain highly detailed images of peripheral
nerves, specialized RF receiver coils are used. Al-though one of the authors has used custom-designedphased-array coils exclusively, commercially pro-duced surface coils can be substituted and can pro-duce adequate images. Each set of custom phased-array coils is specifically designed to optimize imagingof a specific body region. Phased-array RF coil tech-nology integrates signal data from multiple small coilsto produce a single image, mimicking a single largercoil. The RF signal from each small coil is collectedindependently of the other coils in the phased array,and each contributes signal from a small field-of-view(FOV) with high signal-to-noise ratio (SNR). By com-bining the signals from the multiple small coils, animage can be produced that has the high SNR of eachsmall coil yet encompasses a composite FOV similarto that of a single larger surface coil (10, 11). Inaddition to these advantages, the phased-array assem-bly is flexible and can be shaped to fit the curvedcontours of the body in regions such as the side of theneck and the supraclavicular area (12). The imageproduced from the phased-array configuration is thusmarkedly improved relative to the image produced byusing a single larger surface coil or a whole-body coil.Because only a relatively small FOV can be imagedwith high spatial resolution, it is necessary to clinicallyestablish the site of a suspected neuropathic lesion asaccurately as possible before the MR study.
Pulse Sequences and Fat SuppressionEvaluation of the peripheral nervous system, like
that of the CNS, involves the acquisition of flow-compensated, T1- and T2-weighted images. Standardspin-echo sequences are used to generate the T1-weighted images. These images display regional anat-omy, including the various muscles, blood vessels, andnerves outlined by tissue fat planes.
Fast spin-echo sequences are used to generate theT2-weighted images. These images help to detectpathologic signal changes within a nerve; however,since nerves are small, the abnormal signal within anerve is easily obscured by signal from surroundingfat. To overcome this problem, various methods of fatsuppression are used in conjunction with the fastspin-echo sequence. The two most common methods

AJNR: 19, June 1998 REVIEW ARTICLE 1015
FIG 5. MR imaging appearance of the normal sacral plexus.A and B, Coronal T1-weighted (A ) and STIR (B ) images of the normal sacral plexus show the course of the lumbosacral trunk (upper
three arrows) as these nerves course obliquely inferiorly and laterally, anterior to the sacral wings within the pelvis. They then exit thepelvis through the greater sciatic foramen (long white arrows) as the sciatic nerve (lower three arrows). Note the linear striatedappearance of the nerves on both the T1-weighted and STIR images, which is believed to reflect the individual nerve fasciclesconstituting the lumbosacral trunk and sciatic nerves.
C, Axial T1-weighted image at the level of the sacral wings shows the lumbosacral trunks as they course anterior to these structures(arrows).
D, Axial T1-weighted image at the level of the greater sciatic foramen shows the left sacral plexus components (lumbosacral trunk andS1–S3) as clustered linear segments (closed arrows) anterior to the piriformis muscle (p), posterior to the ischium (i), and lateral to theinferior gluteal vessels (open arrow). Slightly inferior to this section, the obliquely oriented components come together to form the sciaticnerve, which exits the pelvis through the greater sciatic foramen.
E, Corresponding fast spin-echo T2-weighted image with fat suppression shows the normal slight hyperintensity of the plexuscomponents.
are frequency-selective saturation of the fat reso-nance and short-inversion-time inversion recovery(STIR) with nulling of the signal contribution fromfat. Each method has its advantages and disadvan-tages.
In general, the STIR method has proved to bemore reliable, since it provides uniform and consis-tent suppression of fat signal from patient to patientwhile maintaining excellent T2 contrast. There are,however, two disadvantages to the STIR method. Thefirst is relatively low SNR. The second is greatersensitivity to blood-flow artifacts. Consequently, flowsaturation bands are used in an attempt to eliminate,or to greatly attenuate, these phase shift-artifacts thatdegrade the resulting STIR image.
The frequency-selective fat-saturation method hashigher SNR and fewer blood-flow related artifacts;however, the major disadvantage of this method isinhomogeneous fat suppression across the FOV. Thevariable fat suppression is mainly due to field inho-mogeneity caused by variation in magnetic suscepti-bility differences across the body. Because of theseeffects, T2-weighted (or T1-weighted) images may
contain some areas with incomplete suppression or“bleed-through” of fat signal as well as other areaswith suppression of the water signal rather than thefat signal. This results in poor visualization of nervesand sometimes of adjacent anatomic landmarks. Theobserved inhomogeneity of fat saturation may be fur-ther accentuated by nonuniformity in signal receptionof the surface coils. Because of the difficulty in over-coming bulk susceptibility artifacts (13), especially inareas with high susceptibility differences, such as thebase of the neck, or when imaging a larger FOV, theSTIR method is preferred for T2-weighted imaging atthis time.
Image Orientation and FOVWhenever possible, images are obtained in at least
two planes. Usually, images approximately parallel to(in-plane images) and perpendicular to (cross-sec-tional images) the long axis of the nerve are obtained.The in-plane images show the long axis of the nerve,allowing one to scrutinize the course of the nerve fordisplacement or focal enlargement. These images,

AJNR: 19, June 1998
however, suffer from partial-volume artifacts, whichcan result in inaccurate assessment of signal intensitywithin a nerve on T2-weighted acquisitions. Cross-sectional images, on the other hand, avoid this par-tial-volume problem and allow assessment of the rel-ative size and cross-sectional shape of the nerve.Images obtained perpendicular to the nerve also al-low better assessment of the fascicular pattern, andfocal areas of expansion or compression can still beevaluated on cross-sectional nerve images by compar-ing successive sections.
Brachial and Sacral PlexusIn the evaluation of the brachial plexus, image
orientation parallel to the sagittal plane of the bodymay be preferred by some investigators to true cross-sectional views of the plexus, because anatomic land-marks are identified more easily with the sagittalorientation (Fig 3C–F). True sagittal images, though,are not perpendicular to the axis of plexus compo-nents, such as the cords, and this can cause occasionaldifficulty with identification and evaluation of thesecomponents. An alternative approach is to useoblique sagittal images, which are more nearly per-pendicular to the plexus components, for cross-sec-tional evaluation of the brachial plexus. In addition,axial images can be used to evaluate the sacral plexus.The FOV for imaging the brachial and sacral plexus is24 to 26 cm, and a 512 3 256 or 512 3 512 matrix isused. Section thickness is 4 mm with contiguous im-ages in the coronal plane and a gap of 50% to 100%(2 to 4 mm) in the cross-sectional plane of nerveimaging (sagittal brachial plexus or axial sacralplexus) to obtain sufficient length of coverage.
Peripheral NervesA complete description of the technical parameters
involved in imaging all peripheral nerves is beyondthe scope of this discussion; however, we can offersome general guidelines for performing these studies.T1- and T2-weighted images of a nerve are obtainedin precisely the same plane and location and with asimilar FOV so that the images are directly compa-rable. This congruity is necessary because the fat-suppressed T2-weighted images usually will not ade-quately show normal tissue planes (usually outlinedby fat) and anatomic landmarks. Thus, the radiologistmust rely on a comparison of the T1- and T2-weighted images to identify and spatially locate anerve or critical landmarks. The FOV that is useddepends on which area of the body is to be imaged.The FOV ranges from approximately 10 to 12 cmwhen examining small body parts, such as the wrist(for example, in patients with carpal tunnel compres-sive neuropathy) to approximately 14 to 16 cm whenexamining larger body areas, such as nerves in theupper arm or the sciatic nerve in the thigh. Highspatial resolution is achieved by using as large a datamatrix as possible while still maintaining adequateSNR. Matrix size ranges from 256 3 256 for the
1016 MARAVILLA
smaller FOV to 512 3 256 or 512 3 512 for largerFOVs. Section thickness is between 3 and 4 mm. Forsmall regions of interest, contiguous sections are ob-tained. For larger regions of interest, such as thesciatic nerve in the thigh, only the in-plane views arecontiguous, whereas cross-sectional views (axialplane) often have a 50% to 100% gap (2 to 4 mm)between sections. The use of such a gap when imagingthe nerve in cross section permits greater lengthof coverage of a peripheral nerve in a reasonablescan time.
Contrast MediaAt present, there is limited utility for gadolinium-
based intravenous contrast material in peripheralnerve imaging. For most cases, including traumaticnerve injury, compressive neuropathy, or unexplainedneuropathy, a noncontrast examination is sufficient.Nevertheless, contrast material has proved useful fora few indications, such as in examinations of patientswith suspected neoplasm, inflammation, or abscessformation, and in postoperative evaluations. A stan-dard dose of 0.1 mmol/kg is used and is administeredas an intravenous bolus. T1-weighted spin-echo im-ages, with frequency-selective fat saturation, are ac-quired within 3 to 5 minutes after injection. As analternative, out-of-phase T1-weighted spoiled gradi-ent-echo imaging appears promising, because it showsmore homogeneous fat suppression (Maravilla KR,unpublished results).
Imaging Appearance
Normal NervesThe techniques outlined above provide reliable im-
ages of peripheral nerves measuring at least 2 to 3mm in diameter. These include the following: nervesof the brachial and sacral plexus; the ulnar, median,and radial nerves in the arm and forearm; the medianand ulnar nerves in the wrist; the sciatic nerve in thethigh; and the proximal tibial and peroneal nerves inthe thigh, popliteal fossa, and leg (4, 5). MR evalua-tion of peripheral nerves is performed in two ways.The first and most important way is by direct high-resolution imaging of the nerve. The second way is byimaging the major muscle groups innervated by thenerve, looking for changes in signal intensity indica-tive of denervation (14–16).
T1-weighted images show the size and location ofthe nerve. In some cases, all or part of the course ofthe nerve may be obscured by surrounding muscletissue, because of a lack of intervening fat. In thesecases, comparison of T1- and T2-weighted images isdone to trace the course of the nerve and to monitorits appearance. The normal nerve is oval or round.The size of a particular nerve, such as a sciatic ormedian nerve, varies along its length and from personto person. Corresponding normal nerves on the twosides of the body in the same person and at the samelevel, though, are of similar size. The rodlike fascicleswithin the nerve are visible on high-resolution, cross-
AJNR: 19, June 1998 REVIEW ARTICLE 1017
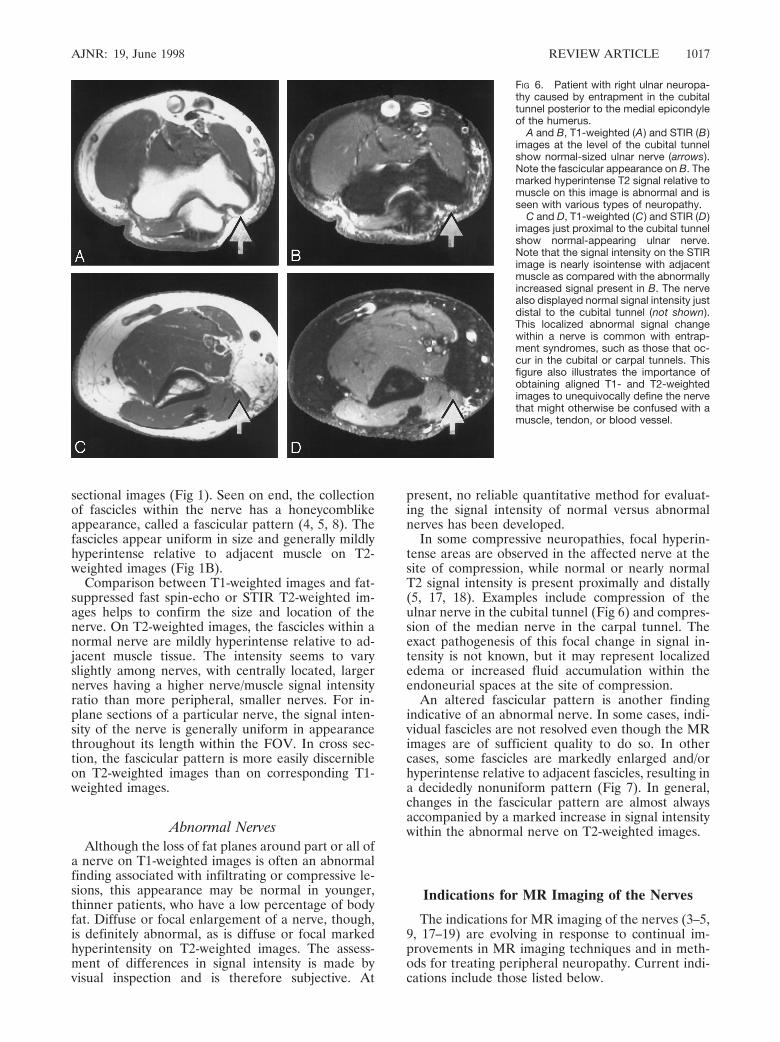
FIG 6. Patient with right ulnar neuropa-thy caused by entrapment in the cubitaltunnel posterior to the medial epicondyleof the humerus.
A and B, T1-weighted (A ) and STIR (B )images at the level of the cubital tunnelshow normal-sized ulnar nerve (arrows).Note the fascicular appearance on B. Themarked hyperintense T2 signal relative tomuscle on this image is abnormal and isseen with various types of neuropathy.
C and D, T1-weighted (C ) and STIR (D )images just proximal to the cubital tunnelshow normal-appearing ulnar nerve.Note that the signal intensity on the STIRimage is nearly isointense with adjacentmuscle as compared with the abnormallyincreased signal present in B. The nervealso displayed normal signal intensity justdistal to the cubital tunnel (not shown).This localized abnormal signal changewithin a nerve is common with entrap-ment syndromes, such as those that oc-cur in the cubital or carpal tunnels. Thisfigure also illustrates the importance ofobtaining aligned T1- and T2-weightedimages to unequivocally define the nervethat might otherwise be confused with amuscle, tendon, or blood vessel.
sectional images (Fig 1). Seen on end, the collectionof fascicles within the nerve has a honeycomblikeappearance, called a fascicular pattern (4, 5, 8). Thefascicles appear uniform in size and generally mildlyhyperintense relative to adjacent muscle on T2-weighted images (Fig 1B).
Comparison between T1-weighted images and fat-suppressed fast spin-echo or STIR T2-weighted im-ages helps to confirm the size and location of thenerve. On T2-weighted images, the fascicles within anormal nerve are mildly hyperintense relative to ad-jacent muscle tissue. The intensity seems to varyslightly among nerves, with centrally located, largernerves having a higher nerve/muscle signal intensityratio than more peripheral, smaller nerves. For in-plane sections of a particular nerve, the signal inten-sity of the nerve is generally uniform in appearancethroughout its length within the FOV. In cross sec-tion, the fascicular pattern is more easily discernibleon T2-weighted images than on corresponding T1-weighted images.
Abnormal NervesAlthough the loss of fat planes around part or all of
a nerve on T1-weighted images is often an abnormalfinding associated with infiltrating or compressive le-sions, this appearance may be normal in younger,thinner patients, who have a low percentage of bodyfat. Diffuse or focal enlargement of a nerve, though,is definitely abnormal, as is diffuse or focal markedhyperintensity on T2-weighted images. The assess-ment of differences in signal intensity is made byvisual inspection and is therefore subjective. At
present, no reliable quantitative method for evaluat-ing the signal intensity of normal versus abnormalnerves has been developed.
In some compressive neuropathies, focal hyperin-tense areas are observed in the affected nerve at thesite of compression, while normal or nearly normalT2 signal intensity is present proximally and distally(5, 17, 18). Examples include compression of theulnar nerve in the cubital tunnel (Fig 6) and compres-sion of the median nerve in the carpal tunnel. Theexact pathogenesis of this focal change in signal in-tensity is not known, but it may represent localizededema or increased fluid accumulation within theendoneurial spaces at the site of compression.
An altered fascicular pattern is another findingindicative of an abnormal nerve. In some cases, indi-vidual fascicles are not resolved even though the MRimages are of sufficient quality to do so. In othercases, some fascicles are markedly enlarged and/orhyperintense relative to adjacent fascicles, resulting ina decidedly nonuniform pattern (Fig 7). In general,changes in the fascicular pattern are almost alwaysaccompanied by a marked increase in signal intensitywithin the abnormal nerve on T2-weighted images.
Indications for MR Imaging of the Nerves
The indications for MR imaging of the nerves (3–5,9, 17–19) are evolving in response to continual im-provements in MR imaging techniques and in meth-ods for treating peripheral neuropathy. Current indi-cations include those listed below.
1018 MARAVILLA AJNR: 19, June 1998
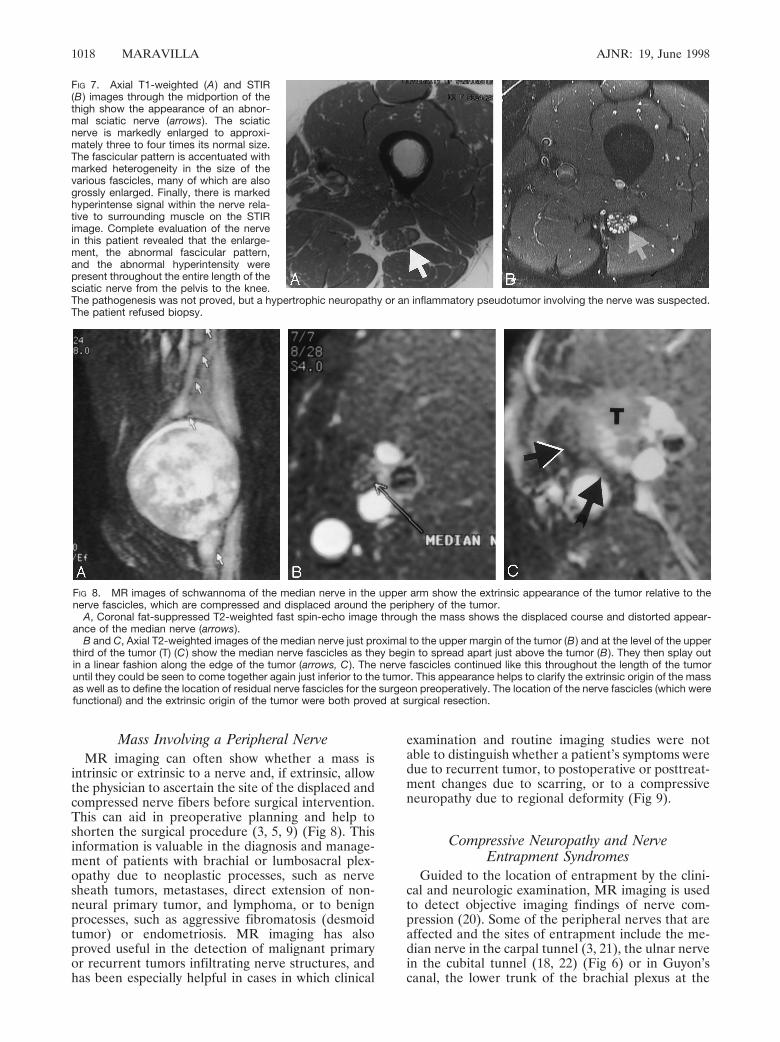
FIG 8. MR images of schwannoma of the median nerve in the upper arm show the extrinsic appearance of the tumor relative to thenerve fascicles, which are compressed and displaced around the periphery of the tumor.
A, Coronal fat-suppressed T2-weighted fast spin-echo image through the mass shows the displaced course and distorted appear-ance of the median nerve (arrows).
B and C, Axial T2-weighted images of the median nerve just proximal to the upper margin of the tumor (B ) and at the level of the upperthird of the tumor (T) (C ) show the median nerve fascicles as they begin to spread apart just above the tumor (B ). They then splay outin a linear fashion along the edge of the tumor (arrows, C ). The nerve fascicles continued like this throughout the length of the tumoruntil they could be seen to come together again just inferior to the tumor. This appearance helps to clarify the extrinsic origin of the massas well as to define the location of residual nerve fascicles for the surgeon preoperatively. The location of the nerve fascicles (which werefunctional) and the extrinsic origin of the tumor were both proved at surgical resection.
FIG 7. Axial T1-weighted (A ) and STIR(B ) images through the midportion of thethigh show the appearance of an abnor-mal sciatic nerve (arrows). The sciaticnerve is markedly enlarged to approxi-mately three to four times its normal size.The fascicular pattern is accentuated withmarked heterogeneity in the size of thevarious fascicles, many of which are alsogrossly enlarged. Finally, there is markedhyperintense signal within the nerve rela-tive to surrounding muscle on the STIRimage. Complete evaluation of the nervein this patient revealed that the enlarge-ment, the abnormal fascicular pattern,and the abnormal hyperintensity werepresent throughout the entire length of thesciatic nerve from the pelvis to the knee.The pathogenesis was not proved, but a hypertrophic neuropathy or an inflammatory pseudotumor involving the nerve was suspected.The patient refused biopsy.
Mass Involving a Peripheral NerveMR imaging can often show whether a mass is
intrinsic or extrinsic to a nerve and, if extrinsic, allowthe physician to ascertain the site of the displaced andcompressed nerve fibers before surgical intervention.This can aid in preoperative planning and help toshorten the surgical procedure (3, 5, 9) (Fig 8). Thisinformation is valuable in the diagnosis and manage-ment of patients with brachial or lumbosacral plex-opathy due to neoplastic processes, such as nervesheath tumors, metastases, direct extension of non-neural primary tumor, and lymphoma, or to benignprocesses, such as aggressive fibromatosis (desmoidtumor) or endometriosis. MR imaging has alsoproved useful in the detection of malignant primaryor recurrent tumors infiltrating nerve structures, andhas been especially helpful in cases in which clinical
examination and routine imaging studies were notable to distinguish whether a patient’s symptoms weredue to recurrent tumor, to postoperative or posttreat-ment changes due to scarring, or to a compressiveneuropathy due to regional deformity (Fig 9).
Compressive Neuropathy and NerveEntrapment Syndromes
Guided to the location of entrapment by the clini-cal and neurologic examination, MR imaging is usedto detect objective imaging findings of nerve com-pression (20). Some of the peripheral nerves that areaffected and the sites of entrapment include the me-dian nerve in the carpal tunnel (3, 21), the ulnar nervein the cubital tunnel (18, 22) (Fig 6) or in Guyon’scanal, the lower trunk of the brachial plexus at the

AJNR: 19, June 1998 REVIEW ARTICLE 1019
FIG 9. MR examination of the left brachial plexus in a patient who had had a mastectomy for breast cancer several years earlier andwho presented with a new onset of symptoms of plexopathy in the left upper extremity. The differential diagnosis included recurrenttumor and radiation plexopathy.
A and B, Coronal T1-weighted (A ) and STIR (B ) images of the distal brachial plexus show marked diffuse enlargement of the medialcord of the brachial plexus (arrows).
C, Oblique sagittal fat-suppressed T1-weighted image at the level of the acromial clavicular joint shows the enlarged, contrast-enhancing medial cord (solid arrow). The position of the axillary artery is designated by the open arrow. Imaging appearance is that ofdiffuse tumor infiltration of the medial cord, which was proved by positron emission tomography and subsequent clinical follow-up.
insertion of the anterior scalene muscle on the firstrib (scalenus anticus syndrome) or at the crossing of acervical rib (cervical rib syndrome) (23), the sciaticnerve at the greater sciatic foramen (piriformis syn-drome), and the lateral femoral cutaneous nerve nearthe attachment of the inguinal ligament to the ante-rior superior iliac spine (meralgia paresthetica) (7).Compressive neuropathy or plexopathy may also re-sult from hematoma or aneurysmal formation in cer-tain locations: iliopsoas hematoma causing femoralneuropathy or lumbar plexopathy, depending on theextent of hemorrhage, and aneurysm of the abdomi-nal aorta, internal iliac, or gluteal arteries causinglumbosacral plexopathy. Currently, the presence oflocalized abnormal T2 signal of the involved nerve onMR images has been the most reliable finding and isuseful to confirm the clinical diagnosis, to eliminatethe possibility of a mass lesion, and to help withsurgical planning and postsurgical follow-up.
Unexplained Neuropathy or PlexopathyIn cases in which the clinical examination does not
reveal the cause of a neuropathy, MR imaging mayidentify a focal or diffuse nerve abnormality that mayindicate a structural abnormality, such as may be seenwith hereditary hypertrophic neuropathies (eg, Dejer-ine-Sottas disease) or an inflammatory pseudotumorof the nerve (24, 25) (Fig 7). Demonstration of anormal-appearing nerve is also useful because it nar-rows the differential diagnosis and may obviate inter-ventional therapy. Not uncommonly, patients whoundergo MR imaging for unexplained plexopathy willhave idiopathic, probably postviral, inflammatoryconditions, such as brachial or lumbosacral plexitis(neuritis).
Traumatic Nerve InjuryMR imaging is useful for examining patients in
whom surgical intervention is being contemplated torepair nerve injury. Demonstration of the exact siteand severity of injury is used to determine whethersurgery is warranted and, if it is, to plan the surgicalapproach. Nerve injury can range from disruption ofaxonal conduction with preservation of anatomic con-tinuity of all components comprising the nerve trunk(neurapraxic injury) to complete loss of continuity ofthe nerve trunk (severed nerve) with a neurotmeticinjury (26, 27) (Fig 10). By depicting the morphologyof the injured nerve, MR imaging complements elec-trophysiological studies to help determine the exactsite and type of nerve injury and the potential forsurgical treatment (Fig 11). In addition, it can showthe relationship of the intact nerve to posttraumaticlesions, such as spindle, lateral, and stump neuromas,as well as focal or diffuse perineural fibrosis.
Posttreatment EvaluationAfter surgical or medical treatment for peripheral
neuropathy, MR imaging may show resolution of ab-normal imaging findings, such as T2 hyperintensityand nerve swelling, weeks or months before there isclinical evidence of functional recovery (28) (Fig 12).Patients with a history of cancer and clinical signs ofplexopathy after radiation therapy may have recur-rent tumor or radiation-induced plexopathy. Imagingfeatures that favor postradiation injury of the brachialplexus are abnormal swelling and increased T2 hyper-intensity of the brachial plexus on the side of involve-ment. The increased size and signal intensity abnor-malities diffusely and uniformly involve the plexusnerves within the radiation field (Fig 13). The absence
1020 MARAVILLA AJNR: 19, June 1998
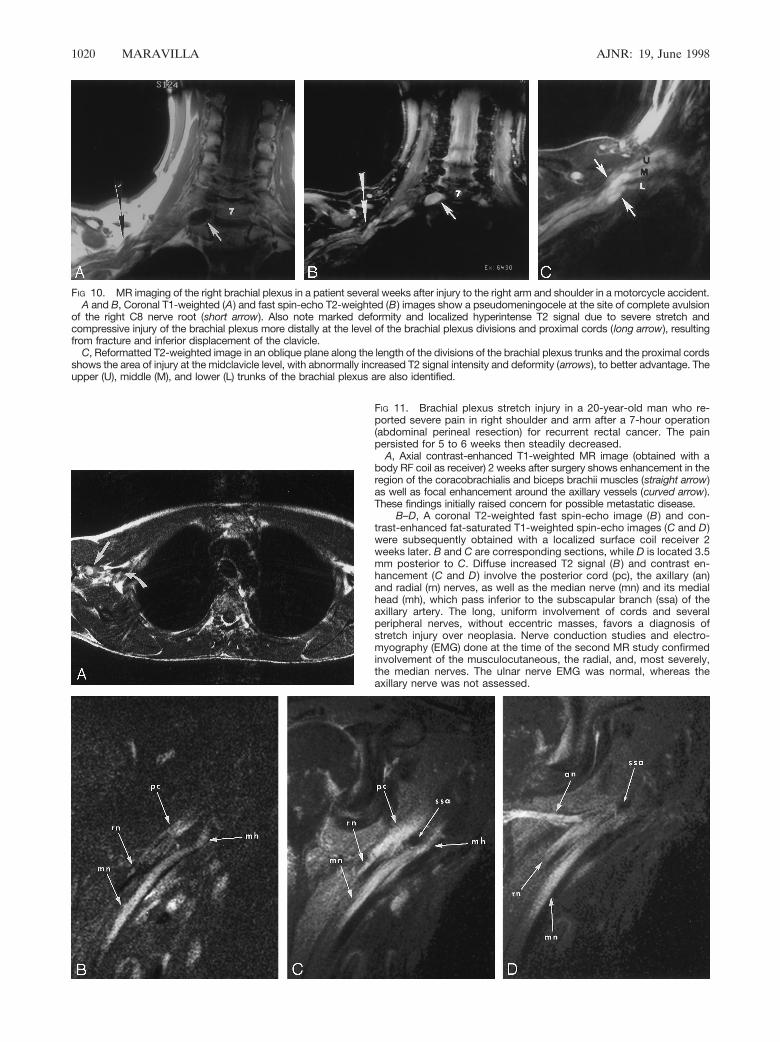
FIG 10. MR imaging of the right brachial plexus in a patient several weeks after injury to the right arm and shoulder in a motorcycle accident.A and B, Coronal T1-weighted (A) and fast spin-echo T2-weighted (B) images show a pseudomeningocele at the site of complete avulsion
of the right C8 nerve root (short arrow). Also note marked deformity and localized hyperintense T2 signal due to severe stretch andcompressive injury of the brachial plexus more distally at the level of the brachial plexus divisions and proximal cords (long arrow), resultingfrom fracture and inferior displacement of the clavicle.
C, Reformatted T2-weighted image in an oblique plane along the length of the divisions of the brachial plexus trunks and the proximal cordsshows the area of injury at the midclavicle level, with abnormally increased T2 signal intensity and deformity (arrows), to better advantage. Theupper (U), middle (M), and lower (L) trunks of the brachial plexus are also identified.
FIG 11. Brachial plexus stretch injury in a 20-year-old man who re-ported severe pain in right shoulder and arm after a 7-hour operation(abdominal perineal resection) for recurrent rectal cancer. The painpersisted for 5 to 6 weeks then steadily decreased.
A, Axial contrast-enhanced T1-weighted MR image (obtained with abody RF coil as receiver) 2 weeks after surgery shows enhancement in theregion of the coracobrachialis and biceps brachii muscles (straight arrow)as well as focal enhancement around the axillary vessels (curved arrow).These findings initially raised concern for possible metastatic disease.
B–D, A coronal T2-weighted fast spin-echo image (B ) and con-trast-enhanced fat-saturated T1-weighted spin-echo images (C and D )were subsequently obtained with a localized surface coil receiver 2weeks later. B and C are corresponding sections, while D is located 3.5mm posterior to C. Diffuse increased T2 signal (B ) and contrast en-hancement (C and D ) involve the posterior cord (pc), the axillary (an)and radial (rn) nerves, as well as the median nerve (mn) and its medialhead (mh), which pass inferior to the subscapular branch (ssa) of theaxillary artery. The long, uniform involvement of cords and severalperipheral nerves, without eccentric masses, favors a diagnosis ofstretch injury over neoplasia. Nerve conduction studies and electro-myography (EMG) done at the time of the second MR study confirmedinvolvement of the musculocutaneous, the radial, and, most severely,the median nerves. The ulnar nerve EMG was normal, whereas theaxillary nerve was not assessed.

AJNR: 19, June 1998 REVIEW ARTICLE 1021
FIG 12. Patient with laceration in the popliteal fossa region resulting in transection injury of the tibial nerve, which was treated by meansof a nerve graft bridging the site of nerve transection. MR imaging was done approximately 2 months after surgical repair.
A and B, Axial T1-weighted (A ) and STIR (B ) images just proximal to the site of the graft show localized deformity and scarringsurrounding the tibial and peroneal nerves, best seen on A. The tibial (T) and peroneal (P) branches of the sciatic nerve are visible. Notemarkedly hyperintense T2 signal within the injured tibial nerve just proximal to the graft. There is mild enlargement and somehyperintense fascicles within the peroneal branch as well, probably reflecting slight injury to this nerve and/or changes resulting fromthe previous surgery.
C and D, T1-weighted (C ) and STIR (D ) images at the level of the nerve graft (Gr). Hyperintense signal, resulting from postsurgicalscarring, surrounds the area of the nerve graft on the STIR image. No recognizable fascicular structure is identified within the graft.
E and F, T1-weighted (E ) and STIR (F ) images at the level of the knee, just below the nerve graft site, again show scarring anddeformity in the region of the tibial nerve stemming from postoperative changes after the previous injury. Abnormal hyperintense swollenfascicles are also identified within the distal tibial nerve (T). In our experience, this persistent hyperintense pattern is seen before axonalregrowth and return of function. In several cases that we have followed, the hyperintense signal appears to decrease with nerveregeneration and has preceded functional recovery to a variable degree. The distal common peroneal nerve (P) is also identified. Thehyperintense signal within this nerve may represent changes related to the surgery and postoperative scarring.
FIG 13. Patient with signs and symp-toms of progressive left brachial plexopa-thy 2 years after radiation to the left supra-clavicular region and axilla for treatment ofbreast carcinoma. Differential diagnosisincluded recurrent tumor and radiationplexitis.
A and B, Coronal T1-weighted (A ) andSTIR (B ) images of the brachial plexus onboth sides show enlargement of the roots,trunks, and divisions of the brachial plexuson the left side. Note uniform and diffuseinvolvement of all visualized componentsof the left brachial plexus within the radi-ation field. Also note the marked differ-ence in size and signal intensity of thestructures of the left brachial plexus ascompared with the right side. The findingsin this case contrast sharply with those in Figure 9, of a patient with a similar clinical history and presentation but with focal enlargementof only a single cord of the brachial plexus. By comparison, the diffuse distribution of changes throughout all the neural structures withinthe radiation field distinguishes this case of brachial plexopathy from that of recurrent tumor infiltration in Figure 9, in which a single cordwas enlarged with sparing of the adjacent neural structures.
AJNR: 19, June 1998
of a focal or eccentric mass distinguishes radiationplexopathy from recurrent tumor (29). One should beaware, however, that radiation fibrosis often results inincreased rather than decreased signal intensitywithin and around the nerves on T2-weighted images,and it can show postcontrast enhancement (30).
Current Limitations of MRImaging of the Nerves
The most common causes of poor-quality images ofperipheral nerves are inhomogeneous fat suppres-sion, motion artifacts, and poor SNR due to inade-quate RF coils. The variability of fat suppressiondepends on which region of the body is imaged andwhich technique is used. Variability is greatest onimages of the brachial plexus in the shoulder region,because of the change in the size of the body partsbetween the neck and shoulders and because of thelarge amount of air present within the lungs and alongthe surface of the neck and shoulders—factors thataffect magnetic susceptibility. The STIR technique isless sensitive to these factors than is the frequency-selective method and therefore is more likely toprovide uniform fat suppression. For postcontrast T1-weighted acquisitions, frequency-selective fat satura-tion rather than STIR sequences must be used.Newer fat-suppression techniques have recently beendeveloped, and these may prove more robust than thecurrently used methods (31, 32).
As is the case for most MR studies, motion artifactsgenerally result from two sources. The first is patientmovement, usually due to the patient’s inability tohold still for a long examination. This is especiallyproblematic when studying nerves within the upperextremity, since it may be necessary to put the arm ina difficult or uncomfortable position in order to ob-tain optimal images. The second source is physiolog-ical motion due to respiration, cardiac pulsation, orblood flow. Phase-shift artifacts resulting from mis-registered signal or from incompletely suppressed sig-nal from intravascular flowing blood are propagatedalong the phase-encoded direction. These can causesignificant degradation of T2-weighted images. Whilethe artifacts can be reduced by suppressing the bloodflow signal with spatially localized saturation pulsesoutside the FOV, the saturation pulses are often lesseffective in reducing artifacts from vessels with slowlyflowing blood, such as small veins. The deleteriouseffects of flow artifacts can sometimes be avoided byinterchanging the phase- and frequency-encodinggradient axes. Postcontrast T1-weighted images mayalso have prominent flow-related artifacts, owing tothe shortened T1 relaxation time of gadolinium-con-taining blood. The intensity of flow-related artifacts isreduced on both T1- and T2-weighted sequencesthrough a combination of gradient moment–nulledmotion compensation and spatially localized RF flow-suppression pulses.
The availability of adequate phased-array coils is lim-ited, particularly for evaluating the brachial plexus andfor imaging certain peripheral nerves within the extrem-
1022 MARAVILLA
ities. This problem will be overcome as manufacturersdevelop optimized coil designs that better address theimaging difficulties in specific areas of the body.
Conclusion
The preliminary results of high-resolution MR im-aging presented here are promising. They show thatindividual normal nerves can be imaged, and thatfeatures of intraneural topography can be displayed.The morphology and signal intensity characteristicsthat distinguish abnormal from normal nerves aredepicted; however, the accuracy, sensitivity, and clin-ical utility of these findings remain to be established.Potentially, additional morphologic findings, such asfascicle/nerve area ratios (7) or alterations in physicalproperties, such as water diffusion, will also help tocharacterize peripheral nerves and improve diagnos-tic specificity and sensitivity.
Advances in peripheral nerve imaging will ofcourse depend on further improvements in RF coiltechnology and pulse sequence design that allowhigher-quality T1- and T2-weighted images to be ob-tained in shorter scan times. Improvements in pulsesequence design may also make possible the applica-tion of physiological or functional imaging tech-niques. Diffusion-weighted imaging, for example, hasbeen shown to depict subtle abnormalities withinwhite matter tracts of the brain due to loss or reduc-tion of diffusion anisotropy and to changes in diffu-sion along the axons. This method has also beenapplied to peripheral nerve imaging in an animalmodel, and feasibility has been demonstrated (33). Itis anticipated that abnormalities may be detectablealong the axons within peripheral nerves; however,their depiction in human subjects is complicated bythe small size of peripheral nerves and by the suscep-tibility artifacts noted earlier. Finally, increased SNRcan be achieved by imaging at higher field strengths.With the use of specialized RF transmitter and re-ceiver coils, it may be feasible to image the peripheralnerves within the extremities at 3.0 to 4.0 T withoutexceeding the limit for RF-generated heat depositionwithin the whole body.
Acknowledgments
We thank Betsy Munk and Patricia Garland for their assis-tance in manuscript preparation and Paul Schwartz and JanetSchuker for their help with photography. Pradip Pattany andGreg Weaver provided technical advice and assistance, andMary Bunge critically reviewed the discussion of peripheralnerve anatomy.
References
1. Bowen B. Brachial plexus. In: Bradley WG, Stark DD, ed. MagneticResonance Imaging. 3rd ed. Philadelphia: Mosby-Year Book; 1998:3(in press)
2. Bowen B. Lumbosacral plexus. In: Bradley WG, Stark DD, ed.Magnetic Resonance Imaging. 3rd ed. Philadelphia: Mosby-YearBook; 1998:3 (in press)

AJNR: 19, June 1998 REVIEW ARTICLE 1023
3. Britz G, West G, Dailey A, et al. Magnetic resonance imaging inevaluating and treating peripheral nerve problems. Perspect NeurolSurg 1995;6:53–66
4. Filler A, Kliot M, Howe F, et al. Application of magnetic resonanceneurography in the evaluation of patients with peripheral nervepathology. J Neurosurg 1996;85:299–309
5. Aagaard B, Maravilla K, Kliot M. MR neurography: MR imaging ofperipheral nerves. Magn Reson Imaging Clin N Am 1998;6:179–194
6. Fawcett D. In: Bloom and Fawcett, eds. A Textbook of Histology.12th ed. New York: Chapman & Hall; 1994:336–339
7. Sunderland S. In: Nerves and Nerve Injuries. Baltimore: Williams &Wilkins; 1968:25–57, 733–1112
8. Ikeda K, Haughton V, Ho K-C, Nowicki B. Correlative MR-ana-tomic study of the median nerve. AJR Am J Roentgenol 1996;167:1233–1236
9. Kuntz C, Blake L, Britz G, et al. Magnetic resonance neurographyof peripheral nerve lesions in the lower extremity. Neurosurgery1996;39:750–756
10. Roemer P, Edelstein W, Hayes C, et al. The NMR phased array.Magn Reson Med 1990;16:192–225
11. Hayes C, Hattes N, Roemer P. Volume imaging with MR phasedarrays. Magn Reson Med 1991;18:309–319
12. Hayes C, Tsuruda J, Mathis C, Maravilla K, Kliot M, Filler A.Brachial plexus: MR imaging with a dedicated phased array ofsurface coils. Radiology 1997;203:286–289
13. Cox I, Dillon W. Low-cost device for avoiding bulk susceptibilityartifacts in chemical-selective fat saturation MR of the head andneck. AJNR Am J Neuroradiol 1995;16:1367–1369
14. Polak J, Jolesz F, Adams D. Magnetic resonance imaging of skel-etal muscle: prolongation of T1 and T2 subsequent to denervation.Invest Radiol 1988;23:365–369
15. Fleckenstein J, Watumull D, Conner K, et al. Denervated humanskeletal muscle: MR imaging evaluation. Radiology 1993;187:213–218
16. West G, Haynor D, Goodkin R, et al. Magnetic resonance imagingsignal changes in denervated muscles after peripheral nerve injury.Neurosurgery 1994;35:1077–1086
17. Britz G, Haynor D, Kuntz C, Goodkin R, Gitter A, Kliot M. Carpaltunnel syndrome: correlation of magnetic resonance imaging, elec-trodiagnostic, and intraoperative findings. Neurosurgery 1995;37:1097–1103
18. Britz G, Haynor D, Kuntz C, et al. Ulnar nerve entrapment at the
Please see the Editorial on
elbow: correlation of magnetic resonance imaging, clinical, elect-rodiagnostic, and intraoperative findings. Neurosurgery 1996;38:458–465
19. Dailey A, Tsuruda J, Goodkin R, et al. Magnetic resonance neu-rography for cervical radiculopathy: a preliminary report. Neuro-surgery 1996;38:488–492
20. Beltran J, Rosenberg Z. Diagnosis of compressive and entrapmentneuropathies of the upper extremity: value of MR imaging. AJRAm J Roentgenol 1994;163:525–531
21. Middleton W, Kneeland J, Kellman G, et al. MR imaging of thecarpal tunnel: normal anatomy and preliminary findings in thecarpal tunnel syndrome. AJR Am J Roentgenol 1987;148:307–316
22. Rosenberg Z, Beltran J, Cheung Y, Ro S, Green S, Lenzo S. Theelbow: MR features of nerve disorders. Radiology 1993;188:235–240
23. Panegyres P, Moore N, Gibson R, Rushworth G, Donaghy M.Thoracic outlet syndromes and magnetic resonance imaging. Brain1993;116:823–841
24. Tachi N, Kozuka N, Ohya K, Chiba S, Naganuma M. MRI ofperipheral nerves and pathology of sural nerves in hereditarymotor and sensory neuropathy type III. Neuroradiology 1995;37:496–499
25. Weiland T, Scheithauer B, Rock M, Sargent J. Inflammatorypseudotumor of nerve. Am J Surg Pathol 1996;20:1212–1218
26. Seddon H. Three types of nerve injury. Brain 1943;66:238–28327. Sunderland S. A classification of peripheral nerve injuries produc-
ing loss of function. Brain 1951;74:491–51628. Dailey A, Tsuruda J, Filler A, Maravilla K, Goodkin R, Kliot M.
Magnetic resonance neurography of peripheral nerve degenerationand regeneration. Lancet 1997;350:1221–1222
29. Thyagarajan D, Cascino T, Harms G. Magnetic resonance imagingin brachial plexopathy of cancer. Neurology 1995;45:421–427
30. Bowen B, Verma A, Brandon A, et al. Radiation-induced brachialplexopathy: MR and clinical findings. AJNR Am J Neuroradiol1996;17:1932–1936
31. Szumowski J, Coshow W, Li F, et al. Double-echo three-point Dixonmethod for fat suppression MRI. Magn Reson Med 1995;34:120–124
32. Xiang Q-S, An L. Water-fat imaging with direct phase encoding.J Magn Reson Imaging 1997;7:1002–1015
33. Howe F, Filler A, Bill B, Griffiths J. Magnetic resonance neurog-raphy. Magn Reson Med 1992;28:328–338
page 1001 in this issue.