Identification of NFAT binding sites that mediate stimulation of cathepsin K promoter activity by...
10
This article appeared in a journal published by Elsevier. The attached copy is furnished to the author for internal non-commercial research and education use, including for instruction at the authors institution and sharing with colleagues. Other uses, including reproduction and distribution, or selling or licensing copies, or posting to personal, institutional or third party websites are prohibited. In most cases authors are permitted to post their version of the article (e.g. in Word or Tex form) to their personal website or institutional repository. Authors requiring further information regarding Elsevier’s archiving and manuscript policies are encouraged to visit: http://www.elsevier.com/copyright
-
Upload
independent -
Category
Documents
-
view
0 -
download
0
Transcript of Identification of NFAT binding sites that mediate stimulation of cathepsin K promoter activity by...

This article appeared in a journal published by Elsevier. The attachedcopy is furnished to the author for internal non-commercial researchand education use, including for instruction at the authors institution
and sharing with colleagues.
Other uses, including reproduction and distribution, or selling orlicensing copies, or posting to personal, institutional or third party
websites are prohibited.
In most cases authors are permitted to post their version of thearticle (e.g. in Word or Tex form) to their personal website orinstitutional repository. Authors requiring further information
regarding Elsevier’s archiving and manuscript policies areencouraged to visit:
http://www.elsevier.com/copyright

Author's personal copy
Identification of NFAT binding sites that mediate stimulation of cathepsin K promoteractivity by RANK ligand
Wayne Balkan 1, Ariel F. Martinez 1, Isabel Fernandez, Maria A. Rodriguez, Manhui Pang, Bruce R. Troen ⁎Geriatrics Research, Education and Clinical Center and Research Service, Miami Veterans Affairs Healthcare System, Miami, FL 33125, USAGeriatrics Institute, Department of Medicine, Miller School of Medicine, University of Miami, Miami, FL 33136, USA
a b s t r a c ta r t i c l e i n f o
Article history:Received 14 May 2009Received in revised form 19 June 2009Accepted 23 June 2009Available online 27 June 2009
Received by A.J. van Wijnen
Keywords:OsteoclastsNFATc1 transcription factorResponse elementsCathepsin KRANK ligand
The receptor activator of NFκB ligand (RANKL) is a critical mediator of osteoclastogenesis and regulatescathepsin K (CTSK) expression, which is essential for normal bone resorption. RANKL acts, in part, via the Ca2+/calmodulin/calcineurin signaling pathway, which in turn, activates NFATc1 (nuclear factor of activated T-cells)and downstream gene expression. We investigated the signals and promoter elements that regulate CTSK geneexpression in RAW 264.7 cells, which can be differentiated to osteoclasts by RANKL. Disrupting Ca2+ signaling,by blocking Ca2+ channels, thus inhibiting calcineurin or chelation of intracellular Ca2+, prevented thestimulation of CTSK expression by RANKL. Both RANKL treatment and overexpression of NFATc1 dramaticallyenhanced CTSK promoter activity, but not in an identical manner. NFATc1 regulates CTSK promoter activity, butthe motifs have not been explicitly identified. We found that as few as 238 bp of the CTSK promoter weresufficient to elicit a marked response to both RANKL and NFATc1, truncations of the CTSK promoter illustrateddifferences in regional responsiveness. Transfection analysis of CTSK promoter-luciferase plasmids revealed thatNFATc1 binding sites at 85, 289 and 345 bp upstream of the transcriptional start site mediated responses toRANKL and NFATc1. Deletion of a 4-bp core element from the site at−85 bp dramatically reduced the responseof the CTSK promoter to both RANKL andNFATc1, whereas a similar deletion at−345 bp decreasedNFATc1- butnot RANKL-mediated responses. Mutation of the site at −289 bp did not affect NFAT-mediated stimulation ofCTSKon its own, but did decrease responsiveness in combinationwith either or both of the other two deletions.Electrophoretic mobility shift assays demonstrated NFATc1 binding to oligonucleotides containing the−85-bpand −345-bp sites, while chromatin immunoprecipitation assays demonstrated enhanced in situ binding byNFATc1 to twoanalogous sites in themouseCTSKpromoter in response toRANKL treatment. Therefore, proximalNFATbinding sites playa significant role in theNFATc1-mediated stimulationof CTSK geneexpressionbyRANKL.
Published by Elsevier B.V.
1. Introduction
Receptor activator of NFκB ligand (RANKL) initiates a cascade ofintracellular signaling, including pathways involving TRAF6 (Troen,
2003; Pang et al., 2007), changes in calcium transients (Takayanagi etal., 2002; Komarova et al., 2003) and Ca2+/calmodulin/calcineurin(Zhang et al., 2005). The relative importance and interaction of eachof these pathways have not yet been completely elucidated, buttogether they trigger the differentiation and subsequent activation ofosteoclasts (Simonet et al., 1997; Lacey et al., 1998; Yasuda et al.,1998) and stimulation of osteoclast gene expression (Shalhoub et al.,1999; Corisdeo et al., 2001; Matsumoto et al., 2004; Pang et al., 2005;Yang et al., 2008).
Signaling via the Ca2+/calmodulin/calcineurin pathway culmi-nates in the activation of nuclear factor of activated T-cells (NFAT), inparticular NFATc1 (Troen, 2003; Teitelbaum, 2004; Takayanagi,2005), which plays a central role in osteoclast formation (Feng,2005; Takayanagi, 2005; Zhang et al., 2005). Inhibition of calcineurinactivation by FK506 (Sun et al., 2007) or cyclosporine (Ishida et al.,2002; Hirotani et al., 2004) dramatically suppresses NFATc1upregulation and osteoclast formation. NFATc1-null embryonicstem cells fail to differentiate into osteoclasts (Takayanagi et al.,2002; Yang et al., 2008), whereas overexpression of NFATc1stimulates osteoclast formation and activation (Takayanagi et al.,
Gene 446 (2009) 90–98
Abbreviations: RANKL, RL, receptor activator of NFκB ligand; CTSK, cathepsin K;NFATc1, nuclear factor of activated T-cells c1; bp, base pair(s); EMSAs, electrophoreticmobility shift assays; TRAF6, TNF receptor activating factor-6; caNFATc1, constitutivelyactive form of human NFATc1; TRAcP, tartrate-resistant acid phosphatase; CTR,calcitonin receptor; pKLPE1, plasmid containing 1628 bp of the promoter region ofthe rat CTSK gene upstream of the luciferase reporter gene; pGL3Basic, parent vector forpKLPE1 and the other luciferase containing plasmids; Δ85, missing the NFAT bindingmotif at−85 bp; N1, NFAT binding motif at−85 bp of the rat CTSK promoter; N2, NFATbinding motif at−289 bp of the rat CTSK promoter; N3, NFAT binding motif at−345 bpof the rat CTSK promoter; ΔΔCT, (treatment ΔCT−controlΔCT); TBS-T, 5% nonfat milk inTBS–0.05% Tween-20; siRNA, short interfering RNA; ChIP, chromatin immunoprecipita-tion; TBE, 0.1 M Tris–HCl, 0.09 M boric acid, 1 mM EDTA; IgG, Immunoglobulin G; CsA,cyclosporine A; qRT-PCR, quantitative reverse transcription polymerase chain reaction;kDa, kilodaltons.⁎ Corresponding author. BruceW. Carter VAMCGRECC (11GRC),1201 NW16th Street,
Miami, FL 33125, USA. Tel.: +1 305 575 3388; fax: +1 305 575 3365.E-mail address: [email protected] (B.R. Troen).
1 These authors contributed equally to this work.
0378-1119/$ – see front matter. Published by Elsevier B.V.doi:10.1016/j.gene.2009.06.013
Contents lists available at ScienceDirect
Gene
j ourna l homepage: www.e lsev ie r.com/ locate /gene

Author's personal copy
2002; Hirotani et al., 2004). NFATc1 stimulates many osteoclast-specific genes such as tartrate-resistant acid phosphatase (TRAcP),β3 integrin, calcitonin receptor (CTR), and cathepsin K (CTSK)(Asagiri and Takayanagi, 2007).
Cathepsin K (CTSK) is an acid-activated cysteine protease that isan essential mediator of bone resorption and plays a critical role inthe development and maintenance of the skeleton (Troen, 2004;Troen, 2006). CTSK is a potent collagenase that exhibits unique bone-specific degradative activity (Garnero et al., 1998; Li et al., 2002). Inactively resorbing osteoclasts, CTSK is found at the ruffled border(Littlewood-Evans et al., 1997). Nonsense, missense, and stop codonmutations in the CTSK gene have been identified in humans withpycnodysostosis, an autosomal recessive osteochondrodysplasiacharacterized by osteosclerosis and short stature (Gelb et al., 1996;Johnson et al., 1996; Hou et al., 1999). CTSK null osteoclasts exhibitimpaired bone resorption in vitro (Saftig et al., 1998), and CTSK nullmice develop osteopetrosis, display features characteristic of pycno-dysostosis, and exhibit significantly diminished matrix degradation(Gowen et al., 1999). Furthermore, CTSK plays a major role in theremodeling of mineralized tissue (Boskey et al., 2009), and CTSK-dependent collagen degradation modulates osteoclastic resorption(Wilson et al., 2009).
One of the best model systems for studying osteoclastogenesis isRAW 264.7 cells, which is a murine monocytic/preosteoclastic cellline that differentiates into osteoclastic cells after exposure toRANKL (Vincent et al., 2001). Microarray analysis of RAW 264.7 cellstreated with RANKL revealed increased expression of NFATc1(Ishida et al., 2002; Zhu et al., 2005; Yang et al., 2008), whilesuppression of NFATc1 expression reduced osteoclast formation(Ishida et al., 2002). RAW cells have been used to study the regu-lation of both the mouse and human CTSK promoter activity(Kawaida et al., 2003; Matsumoto et al., 2004), and we have utilizedRAW cells to investigate the regulation of the rat CTSK promoter byinterferon and AP-1 (Pang et al., 2005, 2007). In addition, RAW cellswere used to validate the osteoclastogenic activity of rat RANKL (Xuet al., 2000).
While it is well established that NFATc1 stimulates CTSK geneexpression, the specific motifs within the CTSK promoter that res-pond to NFATc1 have not been directly identified. We show thatcompounds that specifically inhibit Ca2+ signaling block RANKLactivation of CTSK expression and that siRNA targeted againstNFATc1 inhibits the stimulation of CTSK mRNA expression byRANKL. Using a combination of transfection analysis, nuclear factorbinding assays, and chromatin immunoprecipitation assays, we alsodemonstrate that two NFAT binding sites (cis-acting elements)located 85 bp and 345 bp upstream of the transcription initiation siteof the CTSK promoter mediate the NFATc1-dependent stimulation ofCTSK promoter activity.
2. Materials and methods
2.1. Cell culture
The murine RAW 264.7 cell line was kindly provided by Dr. A. IanCassady (University of Queensland, Australia). The cells weremaintained in high glucose DMEM (Invitrogen, Carlsbad, CA)supplemented with 10% heat-inactivated fetal bovine serum(Hyclone, Provo, UT), 100 μg/ml streptomycin, 100 U/ml penicillinG, and glutamine, in a humidified atmosphere of 5% CO2/95% air at37 °C. Subculturing was performed in non-tissue culture treated Petridishes (Greiner Bio-One Inc., Longwood, FL), wherein the cells grewin suspension. This tissue culture method, while not a standardtechnique for growing RAW 264.7 cells, retains these cells in anundifferentiated state (A. Cassady, personal communication). For allexperiments, cells were plated in standard 12-well tissue cultureplates, which enabled osteoclastogenesis to occur.
2.2. Isolation and cloning of the rat cathepsin K promoter-exon1fragments
We have previously constructed a CTSK promoter-luciferasereporter plasmid containing 1628 bp of the promoter region of therat CTSK gene (prKLPE1) (Pang et al., 2005). Truncations of prKLPE1were generated by progressive unidirectional 3' to 5' nucleotideremoval using a combined digestionwith exonuclease III/S1 nuclease,according tomanufacturer's instructions for the Erase-a-Base® system(Promega, Madison, WI). The 395-bp promoter fragment plasmid wasgenerated by BsrDI digestion of prKLPE1, followed by XhoI partialdigestion and cloning into pGL3-Basic.
Single- and multiple-site mutations in the putative NFATc1binding motifs within the CTSK promoter-luciferase plasmidscontaining 1628 bp and 238 bp of the promoter were created byusing the QuikChange® II XL Site-Directed Mutagenesis Kit (Strata-gene, La Jolla, CA) according to the manufacturer's instructions. Weutilized sense and antisense oligonucleotides lacking the putativeNFAT site core-binding element (CTTT) upstream of the CTSK genetranscription initiation site at−85 bp,−289 bp, and−345 bp (NFATΔ85, NFAT Δ289, NFAT Δ345, respectively; see Table 1 for all primersequences). Plasmid DNA was purified from individual bacterialcolonies and sequenced (Sequetech Corp., Mountain View, CA) toverify the mutations.
2.3. Transfection and luciferase assays
Dr. Neil Clipstone generously provided a plasmid (pBJ-caNFATc1)that expresses a constitutively active form of human NFATc1(caNFAT1) that was cloned into the pBJ5 vector (Hirotani et al.,2004). For all transfections, 5×10⁴ RAW 264.7 cells were plated perwell in a 12-well dish. The next day, cells were transfected using theTransIT-Keratinocyte reagent (Mirus Bio Corporation, Madison, WI)according to the manufacturer's instructions and harvested 24 h after
Table 1Primer and deoxyoligonucleotide sequences.
Sequence (sense, antisense) Use
PrimerNFAT Δ85 5′-CCCTTTCTTATCCAGATCAGCCACTGCTGGAG-3′ Mutagenesis
5′-CTCCAGCAGTGGCTGATCTGGATAAGAAAGGG-3′NFAT Δ289 5′-GTGGGACTGTGTTCTTGCCCCCCCCCCCAA-3′ Mutagenesis
5′-TTGGGGGGGGGGGCAAGAACACAGTCCCAC-3′NFAT Δ345 5′-AAGGGTTGAAAAGATACTGTCAGTAAGACG-3′ Mutagenesis
5′-CGTCTTACTGACAGTATCTTTTCAACCCTT-3′Mouse CTSK 5′-CAGCAGAGGTGTGTACTATG-3′ qRT-PCR
5′-GCGTTGTTCTTATTCCGAGC-3′Mouse GAPDH 5′-TGCGACTTCAACAGCAACTC-3′ qRT-PCR
5′-CTTGCTCAGTGTCCTTGCTG-3′N1 site in the mCTSK
promoter5′-CCCCCAAAGTCAGTCAGATG-3′ ChIP assay5′-GGTAAGGATTGCGGAAGTCA-3′
N3 site in the mCTSKpromoter
5′-CTAGCCTTTCCTCCCCTCTC-3′ ChIP assay5′-CCCTAGTTGTCTCCATTCTTCC-3′
OligonucleotidesWT N1 (50-mer) 5′-CATCCTATCTCTGACTCCCTTTCTTATCCAG
ATTTTCCAGCCACTGCTGG-3′EMSA
5′-CCAGCAGTGGCTGGAAAATCTGGATAAGAAAGGGAGTCAGAGATAGGATG-3′
EMSA
WT N1 5′-TCCAGATTTTCCAGCCACTG-3′ EMSA5′-CAGTGGCTGGAAAATCTGGA-3′ EMSA
WT N3 5′-GAAAAGATGGAAACTGTCAG-3′ EMSA5′-CTGACAGTTTCCATCTTTTC-3′ EMSA
WT N2 5′-ACTGTGTTCTTTCCTGCCCC-3′ EMSA5′-GGGGCAGGAAAGAACACAGT-3′ EMSA
ΔN1 5′-TCCAGAT|CAGCCACTG-3′ EMSA5′-CAGTGGCTG|ATCTGGA-3′ EMSA
ΔN3 5′-TTGAAAAGATG|CTGTCAGTA-3′ EMSA5′-TACTGACAG|CATCTTTTCAA-3′ EMSA
In ΔN1 and ΔN3, “|” indicates the location of the deleted NFAT core-binding element.
91W. Balkan et al. / Gene 446 (2009) 90–98

Author's personal copy
transfection. Stable transfectants were created as described by uspreviously (Pang et al., 2005). After transiently or stably transfectedcells were harvested, luciferase assays were performed according tothe manufacturer's instructions (Promega). Luciferase activity wasnormalized against total protein concentration (stable and transienttransfections; see (Pang et al., 2005)). Each transfection was repeateda minimum of 3 times.
2.4. RNA and protein isolation
For RNA, cells were harvested and lysed with TRIzol reagent(Invitrogen) according to the manufacturer's instructions. For protein,the cells were washed with PBS and incubated with RIPA buffer plusprotease cocktail inhibitor (both from Sigma-Aldrich Corp., St. Louis,MO) following the manufacturer's protocol.
2.5. First-strand cDNA synthesis from total RNA and quantitativeRT-PCR analysis
Reverse transcription using 1 μg of RNA was performed using theSuperScript™ First-Strand Synthesis System for RT-PCR (Invitrogen)according to the manufacturer's instructions and described by uspreviously (Pang et al., 2005). Real-time PCR analysis was performedusing the LightCycler DNA Master SYBR Green I kit (Roche AppliedScience, Indianapolis, IN) in a 20-μl reaction containing 0.5 μM of eachprimer, 3 mM MgCl2, and 2 μl of cDNA. Murine CTSK (positions 770–950) and GAPDH (positions 890–1089) were amplified using appro-priate primers (Table 1). The cumulative fluorescence for eachamplicon was normalized to that seen with GAPDH amplificationusing the ΔΔCT (treatment ΔCT−control ΔCT) (Pfaffl, 2001). Resultswere expressed as the fold increase, at each time point, over therespective GAPDH controls (calculated as 2ΔΔCT). Means±standarddeviations were calculated from a minimum of three separateexperiments, each with triplicate replicates. Amplified productswere identified as distinct single bands after electrophoresis onagarose gels.
2.6. Western blotting
10 μg of cytoplasmic proteins and 1 μg of nuclear proteins wereisolated, run on a 12% denaturing polyacrylamide gel, and electro-transferred to Immobilon-P membranes (Sigma-Aldrich). Membraneswere blocked in 5% nonfat milk in TBS-0.05% Tween-20 (TBS-T)overnight at 4 °C and then incubated with anti-NFATc1 monoclonalantibody (Affinity BioReagents, Golden, CO) for 1 h at room tempe-rature, followed by incubating in secondary goat anti-mouse IgG1-HRP (Santa Cruz Biotechnology, Santa Cruz, CA) for 1 h. Both anti-bodies were diluted in blocking buffer. Membranes were washed inTBS-T 3×10 min between each step. ECL plus Western BlottingDetection System (Amersham Bioscience Corp, Piscataway, NJ) wasused to detect bands. After exposure to X-ray film, membranes werewashed and then exposed to anti-actin antibody (Sigma-Aldrich) andsubsequently processed as above to assess actin expression.
2.7. siRNA transfection
RAW264.7 cells were transfected with either NFATc1 siRNA (a poolof four siRNAs — Dharmacon, Lafayette, CO) or a nontargeting controlsiRNA (siControl 1 — Dharmacon). Cells were transfected at 50 to 70%confluence with a final concentration of 100 nM SMARTpool siRNA ornontargeting control siRNA using Trans-IT siQuest transfectionreagent (Mirus Bio Corp.) according to the manufacturer's instruc-tions. After 24 h, the medium was replaced and cells were treated foran additional 48 h with RANKL (Santa Cruz Biotechnology, #sc-4618)or left untreated. We then harvested protein or RNA for Western blotor quantitative real-time PCR analyses, respectively.
2.8. Electrophoretic mobility shift assays (EMSAs)
RAW 264.7 cells were washed with PBS, and the nuclear proteinfraction was isolated using NE-PER Nuclear and Cytoplasmic Extrac-tion Reagents Kit (Thermo Fischer Scientific Corp., Rockford, IL)according to themanufacturer's protocol. The electrophoretic mobilityshift assays (EMSAs) were performed using the LightShift Chemilu-minescent EMSA Kit (Thermo Fischer Corp.) according to themanufacturer's protocol. The competitors were added to the reactionat 200-fold molar excess compared to the biotinylated oligonucleo-tide. For the supershift, the nuclear proteins were incubated withNFATc1 antibody (Affinity BioReagents) for 30 min on ice beforeincubation with the oligonucleotides. Samples were then run on a 5%polyacrylamide gel in 0.5×TBE buffer.
2.9. Chromatin immunoprecipitation (ChIP) assays
The ChIP assay was carried out essentially as described by Sharmaet al. with some minor modifications (Sharma et al., 2007). Briefly,RAW264.7 cells were plated at a density of 1×10⁶ cells per 10-cmtissue culture dish and treatedwith 50 ng/ml RANKL for 48 h and thencross-linked with 1% formaldehyde for 10 min at room temperaturebefore harvest. The cross-linked chromatinwas sheared via sonicationwith a Misonix 3000 sonifier (Misonix, Farmingdale, NY) to anaverage length of 200–1000 bp. Approximately 1×10⁶ cells equivalentof the sheared soluble chromatin was pre-cleared with Protein GAgarose/Salmon Sperm DNA (Millipore Corp., Bedford, MA) at 4 °C for1 h with rotation, and 1% of the pre-cleared chromatinwas set aside asthe input control. Immunoprecipitation was carried out with 5 μg ofantibody overnight at 4 °C against the following antibodies: NFATc1(Santa Cruz Biotechnology, #sc-13033), Normal Rabbit IgG (SantaCruz Biotechnology, #sc-2027), and acetyl-Histone H3 (MilliporeCorp., #07-593). Immune complexes were pulled down using ProteinG Agarose/Salmon Sperm DNA, washed, and eluted twice with 125 μlof elution buffer (0.1 M NaHCO3, 1% SDS). Cross-linking was reversedin 200 mM NaCl at 65 °C for 4 h. DNA was subjected to proteinase Kdigestion (Sigma-Aldrich) and phenol–chloroform extraction(Applied Biosystems, Foster City, CA). Samples were analyzed byquantitative real-time PCR. Results were normalized to the inputcontrol. ChIP DNA data were expressed as a percentage of input DNAusing the followingmethod. PCR calibration curves were generated foreach primer pair from a serial dilution of mouse genomic DNA. Thevalues for the input and experimental samples were calculated fromthe standard curve (R-squared best fit) and expressed as percentage ofinput. Primer sets used to amplify the specific regions of the mousecathepsin K promoter are listed in Table 1.
2.10. Bioinformatics analysis
The Genomatix software package (Genomatix Software, München,Germany) was used. Identification of transcription factor binding siteswas performed with MatInspector (Quandt et al., 1995).
2.11. Statistics
Comparisonsbetween luciferaseexpression levelswereanalyzedusingStudent's t-tests or ANOVA with Bonferroni correction as appropriate.
3. Results
3.1. Inhibitors of Ca2+ signaling block the stimulation of endogenousCTSK by RANKL
While many of the effects of RANKL are mediated throughactivation of the TRAF6 pathway (Troen, 2003; Pang et al., 2007),signaling via Ca2+ also plays an important role (Hirotani et al., 2004).
92 W. Balkan et al. / Gene 446 (2009) 90–98

Author's personal copy
Komarova et al. demonstrated that RANKL induces changes in calciumflux or transients (Komarova et al., 2003). Therefore, we blocked Ca2+
signaling in RAW 264.7 cells in multiple ways to determine if each hada different effect on endogenous CTSK expression. Cells were treatedwith RANKL plus either A23187, a calcium channel ionophore, cyclo-sporine A (CsA), a specific inhibitor of calcineurin, or BAPTA-AM, alipid soluble chelator of intracellular calcium (Fig. 1). None of thesecompounds used alone (1 μM A23187, 0.1 or 0.05 μg/ml CsA, 4.5 μMBAPTA-AM) altered endogenous CTSK expression compared to controlcells (data not shown). However, all three compounds markedlyreduced the ability of RANKL to promote CTSK expression (Fig. 1).
3.2. RANKL stimulates NFATc1 expression, and NFATc1 mediates thestimulation of CTSK expression by RANKL
To assess the timing of NFATc1 upregulation by RANKL we per-formedwestern blot analysis on vehicle- or RANKL-treated RAW264.7
cells. The cytoplasm lanes contained ten-fold more protein (10 μg)than the nucleus lanes (1 μg) (Fig. 2A). Our studies indicated thatthere is much more NFATc1 in the nucleus than in the cytoplasm andthat the increase in NFATc1 protein expression occurred within 24 h inboth the cytoplasm and the nucleus (Fig. 2A). At the 48-hour timepoint, multiple isoforms of NFATc1 were seen in the nucleus.
To verifymore directly that this increase in NFATc1was responsiblefor CTSK upregulation, we examined whether depleting NFATc1 couldmodify the RANKL-mediated stimulation of CTSK expression. Trans-fection with siRNA targeting NFATc1 mRNA significantly reduced boththe constitutive and RANKL-stimulated levels of total cellular NFATc1protein (Fig. 2B) and virtually eliminated the upregulation ofendogenous CTSK mRNA expression in response to RANKL (Fig. 2C).
3.3. Only 238-bp of the rat CTSK promoter are required for responseto RANKL and NFATc1
We previously demonstrated that RANKL treatment markedlyenhanced CTSK promoter activity in RAW 264.7 cells stably trans-fected with a rat CTSK promoter-luciferase plasmid containing1628 bp of the promoter region, and this increase occurred within12 to 24 h (Pang et al., 2005, 2007). To delineate more precisely theregion of the rat CTSK promoter that is responsive to RANKL, wecreated a series of truncations of the original CTSK promoter-luciferase plasmid containing progressively shorter fragments ofthe region immediately upstream of the transcription initiation site(Fig. 3). RAW 264.7 cells stably transfected with these constructs wereexposed to RANKL for 24 h, and all of them generated significantlymore luciferase expression than the pGL3 Basic parent plasmid, whichexhibited minimal or no response to RANKL treatment. Truncatedpromoter regions with as few as 238-bp upstream of the transcriptioninitiation site responded to RANKL treatment (Fig. 3A). The promoterregions that exhibited the greatest response to RANKL containedeither 1097 bp or 395 bp. Next most active were the 689- and 238-bpregions, all of which were significantly more active than the 1628-bpregion. A 64-bp region of the promoter exhibited no significantresponse to RANKL, similar to the lack of response observed with theparent plasmid pGL3Basic (data not shown).
We subsequently transiently cotransfected RAW 264.7 cells withthe same set of luciferase constructs, containing progressive trunca-tions of the CTSK promoter, plus a constitutively active NFATc1
Fig. 1. Inhibitors of Ca2+ transients block RANKL-mediated stimulation of endogenousCTSK expression. RAW 264.7 cells were treated with 40 ng/ml of RANKL (RL) plus theindicated Ca2+ inhibitor for 48 h. Quantitative RT-PCR was performed, and CTSK mRNAexpression was normalized to GAPDH mRNA expression in the same sample. Cellstreated with RANKL (RL) alone were assigned a value of 100%. The graph represents acomposite of all the experiments performed (N=7). Error bars represent the standarddeviation. CsA: cyclosporine A; ⁎⁎pb0.01 and ⁎⁎⁎pb0.001 compared to RL plus vehicle.
Fig. 2. RANKL stimulates NFATc1 expression, andNFATc1mediates the stimulation of CTSK expression by RANKL. (A) RAW264.7 cells were treatedwith vehicle alone (control) or withRANKL (40 ng/ml) for 24 and 48 h, and cytoplasmic and nuclear protein extracts were subjected toWestern blot analysis with antibody to NFATc1. Molecular weight standards (kDa)are on the left. Below the Western blot is the same membrane after Coomassie blue staining. (B) RAW 264.7 cells were transfected with nontargeting siRNA (control) or with siRNAtargeting NFATc1 (NFAT) and 24 h later were treated with either vehicle or RANKL (RL; 40 ng/ml) for 48 h. Western blot analysis for NFATc1 and actin expressionwas performed. (C)Quantitative RT-PCR was performed to assess CTSK mRNA expression following the same protocol as above with nontargeting siRNA (siControl) or siRNA against NFATc1 (siNFATc1).Experiments were performed in triplicate and a representative experiment is shown. Error bars represent the standard deviation of triplicate samples. ⁎pb0.05 compared to siControl.
93W. Balkan et al. / Gene 446 (2009) 90–98

Author's personal copy
(caNFATc1) (Hirotani et al., 2004). Overexpression of caNFATc1markedly stimulated CTSK promoter activity compared to cotransfec-tions with the parent pBJ5 expression vector lacking the NFATc1 cDNA(Control in Fig. 3B). Similar to RANKL treatment of stably transfectedcells, 238 bp of the region immediately upstream of the transcriptioninitiation site were sufficient to respond to NFATc1 in the transienttransfection. The results were similar to the RANKL treatment of thestably transfected cells (Fig. 3A) except that the 238-bp construct wassignificantly more responsive than any of the other constructs, whilethose containing 1097 or 395 bp exhibited significantly greateractivity than the 1628- and 689-bp regions. The 64-bp and pGL3Basicplasmids exhibited no significant responses to the NFATc1 (data notshown).
3.4. NFATc1 binds to motifs in the CTSK promoter
Wenext searched for potential NFATc1 binding sites in the rat CTSKpromoter using MatInspector. We identified three putative motifs inthe proximal region of the promoter at positions 85, 289, and 345 bpupstream of the transcriptional start site and labeled these N1, N2, andN3, respectively. Based on the promoter mapping studies in which238 bp of the rat CTSK promoter were sufficient for both RANKL andNFATc1 activation (Fig. 3), we investigated the role of the N1 motif inthe regulation of CTSK promoter activity. We generated a 50-bp
oligonucleotide spanning this putative NFATc1 binding site andperformed EMSAs (Table 1; Fig. 4). Nuclear extracts from untreatedRAW 264.7 cells bound to the oligonucleotide (Fig. 4, lane 2), and thisbinding was eliminated by competition with excess unlabeledoligonucleotide (lane 3). Incubation with an antibody to NFATc1resulted in a supershift of the band, thereby identifying the protein asNFATc1 (lane 4). Cells treated with RANKL (lanes 5–7) revealedsimilar results, except that the band associated with the nuclearextract alone (lane 5) appeared to have a lower molecular mass thanthe nuclear extracts from untreated cells (lane 2).
3.5. Sites at−85 bp and−345 bp of the CTSK promoter mediate activityin response to NFATc1
In order to assess the functional significance of the putative NFATc1binding sites in the CTSK promoter, we performed transientcotransfections with the caNFATc1 vector plus a series of CTSKpromoter-luciferase constructs containing deletions of the 4-bp coreelement. As seen above (Fig. 3B), overexpression of NFATc1 markedlyenhanced CTSK promoter activity in the wild-type 1628-bp CTSKpromoter-luciferase construct (Fig. 5). However, deletion of the coreelement at either the N1 or N3 site significantly reduced the responseto NFATc1. In contrast, deletion of the core element at the N2 site alonedid not alter the response to NFATc1. However, deletion of the N2 sitein conjunction with either or both of the other two mutations furtherdiminished the responsiveness of the other two sites to NFATc1.
3.6. NFATc1 binds to the N1 and N3 motifs
We next investigated NFATc1 binding to the N1 and N3 motifs inresponse to RANKL treatment (Fig. 6). A biotinylated 20-bp oligonu-cleotide spanning the N1 NFAT binding site was used for the EMSAsdepicted in Fig. 6A and B, and unlabeled oligonucleotides spanning N1,N2, or N3were used as competitors (see Table 1). A biotinylated 20-bpoligonucleotide spanning the potential N3 NFAT binding site (at
Fig. 3. RANKL treatment or NFATc1 alone stimulates CTSK promoter activity. (A) RAW264.7 cells stably cotransfected with the CTSK promoter-luciferase plasmids weretreated for 24 h with vehicle or 40 ng/ml of RANKL. The length of each CTSK promotertruncation is depicted by the number of base pairs in the respective constructs.Luciferase activity was normalized against total protein concentration of the sample.Results are presented as the stimulation of luciferase activity in the transfected cells(±RANKL) relative to the luciferase activity in the cells transfected with the parentalvector pGL3-Basic (±RANKL). All of the promoter constructs generated significantlymore luciferase expression (pb0.001) compared to pGL3-Basic. Experiments werecarried out in triplicate and a representative experiment is shown. Error bars representthe standard deviation of triplicate samples. ⁎⁎⁎pb0.001 and ⁎⁎pb0.01 compared to the1628-bp promoter region; apb0.01 versus 689-bp construct and bpb0.05 versus 238-bpconstruct. (B) RAW 264.7 cells were transiently cotransfected with the reporterplasmids described in A plus a plasmid expressing a constitutively active (ca) NFATc1(pBJ-caNFATc1) or its parental counterpart lacking the caNFATc1 cDNA (pBJ5). The cellswere harvested 24 h after transfection and assayed for luciferase activity. Luciferaseactivity was normalized against total protein concentration of the sample and isexpressed as relative stimulation by NFATc1 compared to the parental pBJ5 plasmid(labeled “Control”). A representative experiment is shown. Error bars represent thestandard deviation of triplicate samples. ⁎⁎pb0.01 compared to the 1628- and 689-bpfragments and apb0.01 compared to the 1097- and 395-bp constructs.
Fig. 4. NFATc1 binds to the CTSK promoter. An electrophoretic mobility shift assay(EMSA) was performed with nuclear extracts of RAW 264.7 cells treated with vehicle(∅) (lanes 2–4) or with 40 ng/ml RANKL (RL) for 48 h (lanes 5–7). The position of the50-bp biotinylated oligonucleotide containing the putative NFAT N1 binding site isshown. Samples that underwent incubation with either the unlabeled oligonucleotide(Competitor) or antibody to NFATc1 (Antibody) are marked.
94 W. Balkan et al. / Gene 446 (2009) 90–98

Author's personal copy
−345 bp) was used for the EMSA depicted in Fig. 6C, and theunlabeled oligonucleotide spanning N3 was used as competitor.Unlabeled oligonucleotides lacking the 4-bp core-binding element(the 4-bp core elements are underlined in Table 1) spanning the N1binding site (ΔN1) and the N3 binding site (ΔN3) were also used ascompetitors in the EMSAs. We employed 20-bp oligonucleotides (incontrast to the EMSA depicted in Fig. 4, in which a 50-bp
oligonucleotide was used) that spanned the sites. Similar to Fig. 4,we observed that the labeled oligonucleotide spanning the N1 motifexhibited constitutive binding, enhanced binding with RANKL treat-ment, and a supershift when the extract was incubated with antibodyspecific to NFATc1 (Fig. 6A, lanes 2, 3, and 6). Competition with theunlabeled oligonucleotide ablated binding (Fig. 6A, lane 4), whereascompetitionwith a similar unlabeled oligonucleotide lacking the 4-bp
Fig. 5. Mutations at 85 bp and 345 bp upstream of the transcription initiation site reduce the stimulation of CTSK promoter activity by NFATc1. RAW 264.7 cells were transientlycotransfected with a plasmid expressing NFATc1 plus the intact 1628-bp CTSK promoter-luciferase vector or this vector containing single or multiple deletions of a 4-bp core elementlocated at −85 (N1), −289 (N2), or−345 (N3). The cells were harvested 24 h after transfection and assayed for luciferase activity. Luciferase activity was normalized against totalprotein concentration of the sample and is expressed as relative stimulation by NFATc1 versus a control plasmid lacking the NFATc1 cDNA. A representative experiment is shown.Error bars represent the standard deviation of triplicate samples. ⁎⁎⁎pb0.001 versus the wild-type (nonmutated) construct, apb0.01 versus the construct lacking the NFAT bindingcore element at N1, bpb0.05 and cp≤0.01 versus the construct containing a deletion at N3.
Fig. 6. NFATc1 binds to multiple sites in the CTSK promoter. Electrophoretic mobility shift assays (EMSAs) were performed with nuclear extracts of RAW 264.7 cells treated withvehicle or with RANKL (RL; 40 ng/ml) for 48 h. 20-bp biotinylated oligonucleotides containing the potential NFATc1 binding sites at N1 (A and B) and at N3 (C) were used. Thepositions of the biotinylated oligonucleotides (EMSA) and the unlabeled competitor oligonucleotides (comp) are shown in the diagrams above the assays. Samples that underwentincubation with either unlabeled wild-type oligonucleotides (WT N1, WT N2, WT N3), unlabeled oligonucleotides lacking the 4-bp core element of the potential NFAT binding site(ΔN1, ΔN3), or antibody to NFATc1 (NFATc1 Ab) are indicated.
95W. Balkan et al. / Gene 446 (2009) 90–98
Author's personal copy
core element did not diminish binding (ΔN1; Fig. 6A, lane 5).Competition with an unlabeled oligonucleotide spanning the N3 site(WT N3) also ablated binding to the labeled N1 oligonucleotide (Fig.6B, lane 5). However, competition with excess unlabeled oligonucleo-tide spanning the N2 site (WT N2) did not block binding to the N1 site(Fig. 6B, lane 4). The biotinylated oligonucleotide spanning the N3 sitealso exhibited binding to the RAW 264.7 extracts (Fig. 6C, lane 2).Unlabeled competitors spanning either the N3 site or the N1 sitesimilarly ablated binding of the labeled N3 oligonucleotide (Fig. 6C,lanes 3 and 5, respectively). However, oligonucleotides spanningthose two sites, but lacking the core element (ΔN1 and ΔN3), wereunable to alter binding (Fig. 6C, lanes 4 and 6). Therefore, in responseto RANKL treatment, NFATc1 avidly binds to at least two motifs in theCTSK promoter at 85 bp and 345 bp upstream of the transcriptioninitiation site. Furthermore, binding depends upon similar 4-bp coreelements in both motifs.
3.7. The N1 site at −85-bp mediates stimulation of the CTSK promoterby RANKL
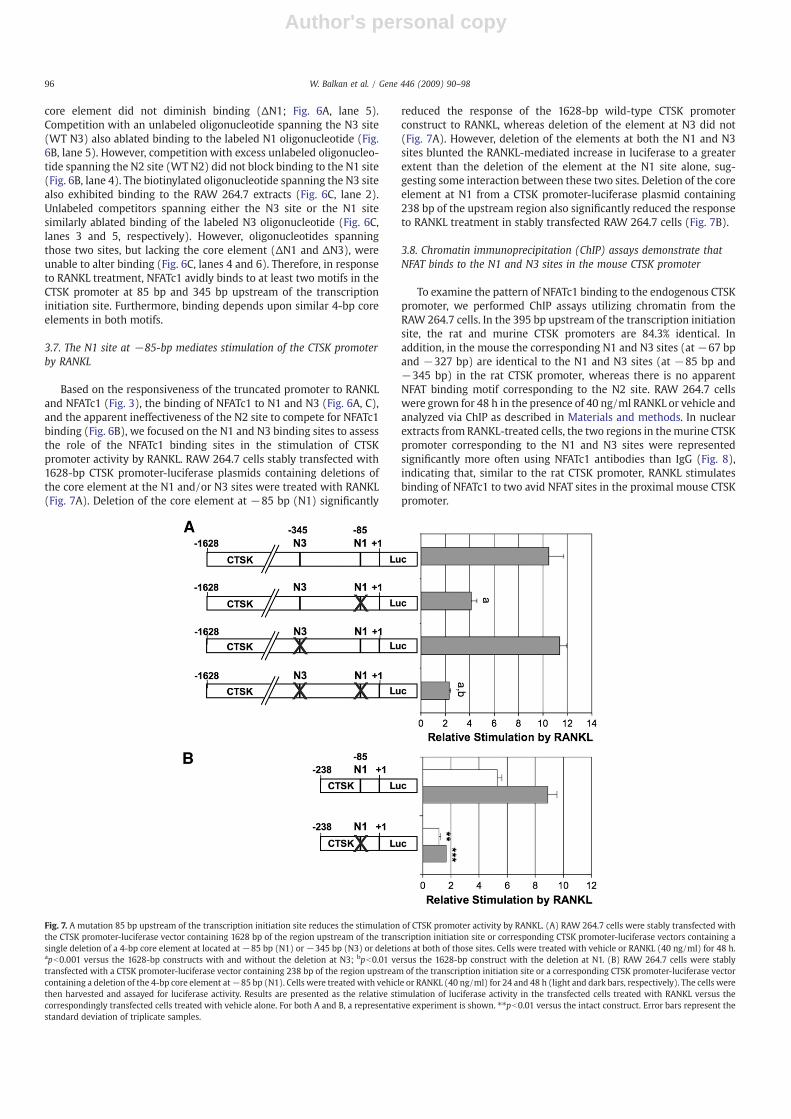
Based on the responsiveness of the truncated promoter to RANKLand NFATc1 (Fig. 3), the binding of NFATc1 to N1 and N3 (Fig. 6A, C),and the apparent ineffectiveness of the N2 site to compete for NFATc1binding (Fig. 6B), we focused on the N1 and N3 binding sites to assessthe role of the NFATc1 binding sites in the stimulation of CTSKpromoter activity by RANKL. RAW 264.7 cells stably transfected with1628-bp CTSK promoter-luciferase plasmids containing deletions ofthe core element at the N1 and/or N3 sites were treated with RANKL(Fig. 7A). Deletion of the core element at −85 bp (N1) significantly
reduced the response of the 1628-bp wild-type CTSK promoterconstruct to RANKL, whereas deletion of the element at N3 did not(Fig. 7A). However, deletion of the elements at both the N1 and N3sites blunted the RANKL-mediated increase in luciferase to a greaterextent than the deletion of the element at the N1 site alone, sug-gesting some interaction between these two sites. Deletion of the coreelement at N1 from a CTSK promoter-luciferase plasmid containing238 bp of the upstream region also significantly reduced the responseto RANKL treatment in stably transfected RAW 264.7 cells (Fig. 7B).
3.8. Chromatin immunoprecipitation (ChIP) assays demonstrate thatNFAT binds to the N1 and N3 sites in the mouse CTSK promoter
To examine the pattern of NFATc1 binding to the endogenous CTSKpromoter, we performed ChIP assays utilizing chromatin from theRAW 264.7 cells. In the 395 bp upstream of the transcription initiationsite, the rat and murine CTSK promoters are 84.3% identical. Inaddition, in the mouse the corresponding N1 and N3 sites (at −67 bpand −327 bp) are identical to the N1 and N3 sites (at −85 bp and−345 bp) in the rat CTSK promoter, whereas there is no apparentNFAT binding motif corresponding to the N2 site. RAW 264.7 cellswere grown for 48 h in the presence of 40 ng/ml RANKL or vehicle andanalyzed via ChIP as described in Materials and methods. In nuclearextracts from RANKL-treated cells, the two regions in themurine CTSKpromoter corresponding to the N1 and N3 sites were representedsignificantly more often using NFATc1 antibodies than IgG (Fig. 8),indicating that, similar to the rat CTSK promoter, RANKL stimulatesbinding of NFATc1 to two avid NFAT sites in the proximal mouse CTSKpromoter.
Fig. 7. A mutation 85 bp upstream of the transcription initiation site reduces the stimulation of CTSK promoter activity by RANKL. (A) RAW 264.7 cells were stably transfected withthe CTSK promoter-luciferase vector containing 1628 bp of the region upstream of the transcription initiation site or corresponding CTSK promoter-luciferase vectors containing asingle deletion of a 4-bp core element at located at −85 bp (N1) or −345 bp (N3) or deletions at both of those sites. Cells were treated with vehicle or RANKL (40 ng/ml) for 48 h.apb0.001 versus the 1628-bp constructs with and without the deletion at N3; bpb0.01 versus the 1628-bp construct with the deletion at N1. (B) RAW 264.7 cells were stablytransfected with a CTSK promoter-luciferase vector containing 238 bp of the region upstream of the transcription initiation site or a corresponding CTSK promoter-luciferase vectorcontaining a deletion of the 4-bp core element at−85 bp (N1). Cells were treated with vehicle or RANKL (40 ng/ml) for 24 and 48 h (light and dark bars, respectively). The cells werethen harvested and assayed for luciferase activity. Results are presented as the relative stimulation of luciferase activity in the transfected cells treated with RANKL versus thecorrespondingly transfected cells treated with vehicle alone. For both A and B, a representative experiment is shown. ⁎⁎pb0.01 versus the intact construct. Error bars represent thestandard deviation of triplicate samples.
96 W. Balkan et al. / Gene 446 (2009) 90–98

Author's personal copy
4. Discussion
The differentiation, maturation, and activation of osteoclasts occurvia distinct but tightly regulated sequences of events (see Troen(2003) and Roodman (2006) for reviews). An accumulating body ofevidence has convincingly demonstrated that nuclear factor ofactivated T-cells (NFATc1) is a crucial regulator of genes involved inthese events (Kim et al., 2008; for reviews see Feng (2005);Takayanagi (2005) and Zhang et al. (2005)). RANKL appears to actvia multiple pathways to induce NFATc1 expression (Troen, 2003;Roodman, 2006). We show that inhibition of calcium flux by threedistinct mechanisms – disrupting Ca2+ channels with A23187,chelating intracellular Ca2+ with BAPTA-AM, or inhibiting calcineurinwith CsA – markedly suppresses the stimulation of CTSK geneexpression by RANKL (Fig. 1). In addition, we demonstrate thatsuppression of NFATc1 expression markedly reduces CTSK expression(Fig. 3). Our data therefore verify that Ca2+ signaling represents animportant component of RANKL-mediated induction of CTSK expres-sion and confirm that the Ca2+/calmodulin/calcineurin/NFAT path-way is a crucial component of the RANKL signaling cascade.
Our study has further defined the role of NFATc1 in the regulationof CTSK gene expression. NFATc1 increased rat CTSK promoter activityprimarily by interacting with motifs located 85 bp (N1) and 345 bp(N3) upstream of the transcription start site (Fig. 5). A third motif, at−289 bp, (N2) also appeared to contribute, but only in concert withthe N1 and N3motifs (Fig. 5). NFATc1 binding to the N1 and N3motifs(Figs. 4 and 6) strongly supports the functional analyses of thetransfections.While both the N1 and N3motifs mediated the responseof the CTSK promoter to caNFATc1 alone (Fig. 5), only the N1 regionappeared to be important for RANKL-mediated promoter activity (Fig.
7). This difference may be due the activation of multiple signaling andtranscriptional factors in response to RANKL and is consistent withprevious studies demonstrating that other signals and nuclear factors,such as PU.1, MITF, TRAF6, Jun dimerization protein, AP-1, and Eos playa role in the stimulation of CTSK expression by RANKL (Motyckovaet al., 2001; Kawaida et al., 2003; Matsumoto et al., 2004; Pang et al.,2005; Hu et al., 2007; Sharma et al., 2007). The ChIP assays (Fig. 8)illustrate that NFATc1 interacts with the motifs in situ in the murineCTSK promoter corresponding to N1 and N3 of the rat CTSK promoterwithin 48 h of RANKL treatment (Fig. 8). The transfection analyses,EMSAs, and ChIP assays are therefore consistent with the high degreeof identity between the sequences of themouse and rat proximal CTSKpromoters, including the N1 and N3 sites.
NFATc1-binding sites in the CTSK promoter have been reported.Matsumoto et al. demonstrated NFATc1 binding to two motifs in thehuman CTSK promoter at −580 bp and −376 bp (Matsumoto et al.,2004), the latter of which may correspond to the N3 motif in the ratCTSK promoter. Interestingly, although sequence alignment of the rat,murine, and human CTSK promoters reveals a site in the humanpromoter corresponding to the N1motif at−85 bp, which contains 8/9 nucleotides found in the rat and mouse promoters, Matsumoto et al.did not identify or study this element. Sharma et al. demonstratedNFATc1 binding to the mouse CTSK promoter between −1548 bp and−1396 bp, but they did not examine the proximal promoter for NFATsites (Sharma et al., 2007). Neither of these two studies directlyassessed whether the NFATc1 binding motifs modulated CTSKpromoter activity. In contrast, we directly identified motifs in theproximal region of the rat CTSK promoter (at −85 and −345 bp) ascrucial for CTSK upregulation, since mutation of the N1 and N3 motifsin the rat CTSK promoter either ablated or markedly suppressedresponse to NFATc1. Furthermore, since truncation of the CTSKpromoter upstream of −1097 bp did not suppress response to eitherRANKL or NFATc1 (Fig. 3), the upstream region studied by Sharma etal. (Sharma et al., 2007) does not appear to significantly contribute tothe regulation of rat CTSK transcription by NFATc1.
Interestingly, RANKL treatment or cotransfection with caNFATc1stimulated CTSK promoter-luciferase plasmids containing 1628 or689 bp of the promoter region to a lesser degree than reporterplasmids containing the 1097, 395, or 238 bp of the CTSK promoter(Fig. 3). This suggests thatmotifs between−1628 and−1089 bp and/or between −689 and 395 bp may partially suppress or modulatetranscription of the CTSK gene.
Ourdata thereforedemonstrate that the regulationof rat andmurineCTSK gene expression by NFATc1 likely involves cooperation betweenNFAT binding sites as well as interactions between multiple nuclearfactors. Given that cathepsin K plays such a seminal role in osteoclasticbone resorption, understanding the nature of the protein complexesthat regulate transcription of the CTSK promoter is essential for furtherextending our knowledge of osteoclast formation and activation.
Acknowledgments
This research was supported by grants from the Department ofVeterans Affairs (Merit Review) and the Indian Trail Foundation. Weappreciate the technical assistance of Mireya Hernandez. We alsoappreciate the support of Drs. Bernard Roos and Guy Howard, theMiami VA Geriatric Research, Education, and Clinical Center andResearch Service, and the Division of Gerontology and GeriatricMedicine, Department of Medicine, at the University of Miami MillerSchool of Medicine.
References
Asagiri, M., Takayanagi, H., 2007. The molecular understanding of osteoclastdifferentiation. Bone 40, 251–264.
Boskey, A.L., et al., 2009. Ablation of cathepsin k activity in the young mouse causeshypermineralization of long bone and growth plates. Calcif. Tissue Int. 84, 229–239.
Fig. 8. ChIP assays reveal that NFATc1 binds to the N1 and N3 sites in the endogenousmouse CTSK promoter within 48 h of RANKL treatment. Two regions of the mCTSKpromoter containing putative NFAT binding motifs at A. −67 bp and B. −327 bp, wereexamined by chromatin immunoprecipitation (ChIP) assays. Chromatin isolated fromRAW 264.7 cells treated with either vehicle (open bars) or RANKL (shaded bars) for48 h was assayed as described in Materials and methods. Each DNA region wasincubated with serum (IgG) or an antiserum specific to NFATc1 or Histone H3 (H3).Results shown are the mean±the standard deviation of a representative experimentcarried out in triplicate and represents the amount of DNA bound as a percentage of theinput DNA. Error bars represent the standard deviation of triplicate samples. ⁎⁎pb0.01versus the vehicle-treated sample.
97W. Balkan et al. / Gene 446 (2009) 90–98

Author's personal copy
Corisdeo, S., Gyda, M., Zaidi, M., Moonga, B.S., Troen, B.R., 2001. New insights intoregulation of cathepsin K gene expression by osteoprotegerin ligand. Biochem.Biophys. Res. Commun. 285, 335–339.
Feng, X., 2005. RANKing intracellular signaling in osteoclasts. IUBMB Life 57, 389–395.Garnero, P., et al., 1998. The collagenolytic activity of cathepsin K is unique among
mammalian proteinases. J. Biol. Chem. 273, 32347–32352.Gelb, B.D., Shi, G.P., Chapman, H.A., Desnick, R.J., 1996. Pycnodysostosis, a lysosomal
disease caused by cathepsin K deficiency. Science 273, 1236–1238.Gowen, M., et al., 1999. Cathepsin K knockout mice develop osteopetrosis due to a deficit
in matrix degradation but not demineralization. J. Bone Miner. Res. 14, 1654–1663.Hirotani, H., Tuohy, N.A., Woo, J.T., Stern, P.H., Clipstone, N.A., 2004. The calcineurin/
nuclear factor of activated T cells signaling pathway regulates osteoclastogenesis inRAW264.7 cells. J. Biol. Chem. 279, 13984–13992.
Hou, W.S., et al., 1999. Characterization of novel cathepsin K mutations in the pro andmature polypeptide regions causing pycnodysostosis. J. Clin. Invest. 103, 731–738.
Hu, R., Sharma, S.M., Bronisz, A., Srinivasan, R., Sankar, U., Ostrowski, M.C., 2007. Eos,MITF, and PU.1 recruit corepressors to osteoclast-specific genes in committedmyeloid progenitors. Mol. Cell. Biol. 27, 4018–4027.
Ishida, N., et al., 2002. Large scale gene expression analysis of osteoclastogenesis in vitroand elucidation of NFAT2 as a key regulator. J. Biol. Chem. 277, 41147–41156.
Johnson, M.R., Polymeropoulos, M.H., Vos, H.L., Ortiz de Luna, R.I., Francomano, C.A.,1996. A nonsense mutation in the cathepsin K gene observed in a family withpycnodysostosis. Genome Res. 6, 1050–1055.
Kawaida, R., et al., 2003. Jun dimerization protein 2 (JDP2), a member of the AP-1 familyof transcription factor, mediates osteoclast differentiation induced by RANKL. J. Exp.Med. 197, 1029–1035.
Kim, K., Lee, S.H., Ha Kim, J., Choi, Y., Kim, N., 2008. NFATc1 induces osteoclast fusion viaup-regulation of Atp6v0d2 and the dendritic cell-specific transmembrane protein(DC-STAMP). Mol. Endocrinol. 22, 176–185.
Komarova, S.V., Pilkington, M.F., Weidema, A.F., Dixon, S.J., Sims, S.M., 2003. RANKligand-induced elevation of cytosolic Ca2+ accelerates nuclear translocation ofnuclear factor kappa B in osteoclasts. J. Biol. Chem. 278, 8286–8293.
Lacey, D.L., et al., 1998. Osteoprotegerin ligand is a cytokine that regulates osteoclastdifferentiation and activation. Cell 93, 165–176.
Li, Z., Hou,W.S., Escalante-Torres, C.R., Gelb, B.D., Bromme, D., 2002. Collagenase activityof cathepsin K depends on complex formation with chondroitin sulfate. J. Biol.Chem. 277, 28669–28676.
Littlewood-Evans, A., et al., 1997. Localization of cathepsin K in human osteoclasts by insitu hybridization and immunohistochemistry. Bone 20, 81–86.
Matsumoto, M., et al., 2004. Essential role of p38 mitogen-activated protein kinase incathepsin K gene expression during osteoclastogenesis through association ofNFATc1 and PU.1. J. Biol. Chem. 279, 45969–45979.
Motyckova, G., Weilbaecher, K.N., Horstmann, M., Rieman, D.J., Fisher, D.Z., Fisher, D.E.,2001. Linking osteopetrosis and pycnodysostosis: regulation of cathepsin Kexpression by the microphthalmia transcription factor family. Proc. Natl. Acad.Sci. U. S. A. 98, 5798–5803.
Pang, M., Martinez, A.F., Jacobs, J., Balkan, W., Troen, B.R., 2005. RANK ligand andinterferon gamma differentially regulate cathepsin gene expression in pre-osteoclastic cells. Biochem. Biophys. Res. Commun. 328, 756–763.
Pang, M., Martinez, A.F., Fernandez, I., Balkan, W., Troen, B.R., 2007. AP-1 stimulates thecathepsin K promoter in RAW 264.7 cells. Gene 403, 151–158.
Pfaffl, M.W., 2001. A new mathematical model for relative quantification in real-timeRT-PCR. Nucleic Acids Res. 29, e45.
Quandt, K., Frech, K., Karas, H., Wingender, E., Werner, T., 1995. MatInd andMatInspector: new fast and versatile tools for detection of consensus matches innucleotide sequence data. Nucleic Acids Res. 23, 4878–4884.
Roodman, G.D., 2006. Regulation of osteoclast differentiation. Ann. N.Y. Acad. Sci. 1068,100–109.
Saftig, P., et al., 1998. Impaired osteoclastic bone resorption leads to osteopetrosis incathepsin-K-deficient mice. Proc. Natl. Acad. Sci. U. S. A. 95, 13453–13458.
Shalhoub, V., et al., 1999. Osteoprotegerin and osteoprotegerin ligand effects on osteo-clast formation from human peripheral blood mononuclear cell precursors. J. CellBiochem. 72, 251–261.
Sharma, S.M., et al., 2007. MITF and PU.1 recruit p38 MAPK and NFATc1 to target genesduring osteoclast differentiation. J. Biol. Chem. 282, 15921–15929.
Simonet, W.S., et al., 1997. Osteoprotegerin: a novel secreted protein involved in theregulation of bone density [see comments]. Cell 89, 309–319.
Sun, L., et al., 2007. Evidence that calcineurin is required for the genesis of bone-resorbing osteoclasts. Am. J. Physiol. Renal. Physiol. 292, F285–F291.
Takayanagi, H., 2005. Mechanistic insight into osteoclast differentiation in osteo-immunology. J. Mol. Med. 83, 170–179.
Takayanagi, H., et al., 2002. Induction and activation of the transcription factor NFATc1(NFAT2) integrate RANKL signaling in terminal differentiation of osteoclasts. Dev.Cell. 3, 889–901.
Teitelbaum, S.L., 2004. RANKing c-Jun in osteoclast development. J. Clin. Invest. 114,463–465.
Troen, B.R., 2003. Molecular mechanisms underlying osteoclast formation andactivation. Exp. Gerontol. 38, 605–614.
Troen, B.R., 2004. The role of cathepsin K in normal bone resorption. Drug NewsPerspect. 17, 19–28.
Troen, B.R., 2006. The regulation of cathepsin K gene expression. Ann. N. Y. Acad. Sci.1068, 165–172.
Vincent, B.L., O'Donoghue, A.J., Glimcher, M.J., McHugh, K.P., 2001. RAW264 cellclones are transcriptional osteoclast precursors. J. Bone Min. Res. 16 (Suppl 1),S268–S269.
Wilson, S.R., Peters, C., Saftig, P., Bromme, D., 2009. Cathepsin K activity-dependentregulation of osteoclast actin ring formation and bone resorption. J. Biol. Chem. 284,2584–2592.
Xu, J., et al., 2000. Cloning, sequencing, and functional characterization of the rathomologue of receptor activator of NF-kappaB ligand [In Process Citation] J. BoneMiner. Res. 15, 2178–2186.
Yang, G., et al., 2008. Functional grouping of osteoclast genes revealed throughmicroarray analysis. Biochem. Biophys. Res. Commun. 366, 352–359.
Yasuda, H., et al., 1998. Osteoclast differentiation factor is a ligand for osteoprotegerin/osteoclastogenesis-inhibitory factor and is identical to TRANCE/RANKL. Proc. Natl.Acad. Sci. U. S. A. 95, 3597–3602.
Zhang, L., McKenna, M.A., Said-Al-Naief, N., Wu, X., Feng, X., McDonald, J.M., 2005.Osteoclastogenesis: the role of calcium and calmodulin. Crit. Rev. Eukaryot. GeneExpr. 15, 1–13.
Zhu, L.L., Zaidi, S., Moonga, B.S., Troen, B.R., Sun, L., 2005. RANK-L induces the expressionof NFATc1, but not of NFkappaB subunits during osteoclast formation. Biochem.Biophys. Res. Commun. 326, 131–135.
98 W. Balkan et al. / Gene 446 (2009) 90–98