Outbreak of Cholera Due to Cyclone Kenneth.pdf - Biblioteca ...
Order-Disorder-Order Transitions Mediate the Activation ofCholera Toxin
Ravi S. Ampapathi1, Andrea L. Creath1, Dianne I. Lou1, John W. Craft Jr.1, Steven R.Blanke2, and Glen B. Legge1
1 Department of Biology and Biochemistry, University of Houston, Houston, TX, USA
2 Department of Microbiology, Institute for Genomic Biology, University of Illinois at Urbana-Champaign,IL, USA
SummaryTo intoxicate host cells, cholera toxin (CT) holotoxin must be activated. This process requires theintracellular dissociation of the enzymatic CTA1 domain from the holotoxin components CTA2 andB5, followed by subsequent interaction with the host factor ARF6-GTP. We report the first NMR-based solution structural data for the Cholera Toxin enzymatic domain (CTA1). We show that thisfree enzymatic domain partially unfolds at the C-terminus, and binds its protein partners at both thebeginning and end of this activation process. Deviations from random coil chemical shifts (Δδcoil)indicate helix formation in the activation loop, which is essential to open the toxin’s active site, occursprior to its association with human protein ARF6. We performed NMR titrations of both free CTA1and an active CTA1:ARF6-GTP complex with NAD+, which revealed that the formation of thecomplex does not significantly enhance NAD+ binding. Partial unfolding of CTA1 is furtherillustrated by using bis-ANS fluorescence as an indicator of the exposed hydrophobic character ofthe free enzyme, which is substantially reduced when bound to ARF6-GTP. We propose that theprimary role of ARF6’s allostery is to induce refolding of the C-terminus of CTA1. Thus, as a foldedglobular toxin complex, CTA1 escapes the chaperone and proteasomal degradation machinery in thecytosol and then proceeds to ADP-ribosylate its target Gsα, triggering the downstream eventsassociated with the pathophysiology of cholera.
KeywordsNMR; cholera toxin; ARF6; partial unfolding; allostery
IntroductionCholera Toxin (CT) is an intracellular-acting toxin responsible for much of thepathophysiology associated with cholera, a pandemic disease caused by Vibrio cholerae (1;2). The massive rice-water diarrhea, which is the hallmark of cholera, occurs only after CTenters intestinal epithelial cells and ADP-ribosylates the -subunit of the adenylate cyclaseregulatory protein, Gs (3–6). Analogous to other intracellular-acting toxins (7), the αpotency
Correspondence to: Glen B. Legge.Publisher's Disclaimer: This is a PDF file of an unedited manuscript that has been accepted for publication. As a service to our customerswe are providing this early version of the manuscript. The manuscript will undergo copyediting, typesetting, and review of the resultingproof before it is published in its final citable form. Please note that during the production process errors may be discovered which couldaffect the content, and all legal disclaimers that apply to the journal pertain.
NIH Public AccessAuthor ManuscriptJ Mol Biol. Author manuscript; available in PMC 2009 March 28.
Published in final edited form as:J Mol Biol. 2008 March 28; 377(3): 748–760.
NIH
-PA Author Manuscript
NIH
-PA Author Manuscript
NIH
-PA Author Manuscript
of CT and other members of the AB5 toxin family is dependent on the activation of the toxin’senzymatic domain during the cellular entry process (8;9).
The CT holotoxin crystal structure (10) is a non-covalent AB5 complex assembled from twodistinct polypeptides, an A subunit (CTA1A2) and homo-pentameric B subunits (B5). CTA1A2is a 240 amino acid (27.2 kDa) polypeptide comprised of CTA1 (residues N1-R192), the amino-terminal ADP ribosyltransferase/NAD+ glycohydrolase enzymatic domain (3;4) and CTA2(residues S193-E240), the carboxyl-terminal helical domain. The enzymatic domain consistsof three regions: CTA11 (residues N1-N142), a globular region of mixed β-sheet and -helices;region CTA12 (residues R143-G161), that forms an extended bridge; and CTA13 (residuesY162-R192), a largely hydrophobic αregion of non-regular structure (11).
CTA1 and CTA2 are covalently linked by a protease-labile loop and a disulfide bond betweenC187 and C199 (10). Dissociation of CTA1 from CTA2 requires both proteolytic cleavagebetween R192 and S193 and reduction of the C187–C199 disulfide bond (12). The CTA2domain forms a helical structure along the interface with CTA1, with the C-terminal endprotruding through the central pore of the B5 subunits. This anchors the enzymatic CTA1domain to the B5 subunits through non-covalent interactions.
During the process of internalization into the host cell and activation, CTA1 dissociates fromthe B5 and CTA2 subunits and by retrotranslocation is then transported as the active fragmentfrom the endoplasmic reticulum (ER) to the cytosol (8;13–19). Entry of the holotoxin into thehost cell is initiated through the interaction of the B5 with the oligosaccharide domain of amembrane glycolipid receptor GM1, which triggers endocytosis and trafficking of theholotoxin to the ER (8;20). Dissociation of the B5 subunits exposes a C-terminal KDEL motifwithin CTA1A2 which is recognized by the receptor ERD2 and promotes trafficking from theGolgi apparatus to the ER (8;10). Recent studies indicate that mutations to the KDEL sequenceabolish transport of CTA1A2 into the ER (21). Reduction of the disulfide bond and dissociationof CTA1 from CTA2 in the ER is catalyzed by protein disulfide isomerase (PDI), and transportof CTA1 to the cytosol occurs via the protein-conducting channel Sec61 (22) and othercomponents of the ER-associated degradation (ERAD) pathway (18;19). Additionally, studieshave suggested that, while the free enzyme is recognized as a misfolded protein by the ERADpathway (17;23), a paucity of lysines in CTA1 minimizes its ubiquitination and subsequentproteasomal degradation (24).
CT is a member of a growing family of intracellular-acting bacterial toxins and exo-enzymeswhose activity is regulated by protein-protein interactions with host cell factors (7;9;25). TheADP-ribosyltransferase activity of CTA1 in the cytosol is enhanced by protein-proteininteractions with the GTP-bound form of eukaryotic adenosine diphosphate (ADP)-ribosylation factor 6 (ARF6) to form a CTA1:ARF6-GTP complex (23;26). The crystalstructure of the CTA1:ARF6-GTP complex shows that the ARF6-GTP binding site overlapswith the site vacated by CTA2 prior to retrotranslocation (27). Differences in the crystalstructure data for the holotoxin and the CTA1:ARF6-GTP complex (27) have led to the modelthat ARF6-GTP binding elicits dramatic changes in CTA1 loop regions, exposing the toxin’sactive site. This suggests ARF6-GTP functions as an allosteric activator of CTA1’s active site(27). However, understanding how free CTA1 functions as an intermediate species betweenthe holotoxin and the CTA1:ARF6-GTP complex will explain the activation mechanism ofCT.
The mechanism underlying ARF6-GTP stimulation of CTA1 enzymatic activity remainspoorly understood in part because of the lack of structural information for “free” CTA1 (e.g.not associated within CTA2/B5 or with ARF6-GTP). Structural studies have been challengingbecause CTA1 is prone to aggregation and resists crystallization (27;28). To circumvent these
Ampapathi et al. Page 2
J Mol Biol. Author manuscript; available in PMC 2009 March 28.
NIH
-PA Author Manuscript
NIH
-PA Author Manuscript
NIH
-PA Author Manuscript
challenges, we used nuclear magnetic resonance (NMR) spectroscopic and biophysicalmethods to probe structural features of the CTA1 enzymatic domain that underlie its activationmechanism.
ResultsRecombinant CTA1 binds both ARF6-GTP and CTA2
In order to evaluate structural differences in CTA1 in the absence and presence of ARF6-GTPand CTA2, we over-expressed recombinant forms of CTA1 (Supplementary Figure 1) asrecombinant proteins in Escherichia (E.) coli. We expressed 15N-labeled recombinant CTA1(N1-G186), which was truncated at G186 to remove the free thiol group of C187; CTA1partitioned primarily into inclusion bodies. After solubilization in 6 M guanidine (Gdm)-HCl,the protein was dialyzed against native buffer and then eluted as a monomeric peak frompreparative Gel Filtration FPLC chromatography (Figure 1a). During optimization of ourrefolding protocol, we found that a considerably larger fraction of CTA1 eluted from the gelfiltration column as a higher molecular-mass species in urea-solubilized samples(Supplementary Figure 2) than in Gdm-HCl-solubilized samples. Moreover, we consistentlydetected a dimeric shoulder peak in the urea-solubilized samples. Hence, guanidine-mediatedsolubilization was used in further studies. Notably, the use of chemical denaturants (6 M urea)and reducing agents are routinely used in the purification of active CTA1 from the nativeholotoxin produced by Vibrio cholerae (29).
We prepared a soluble form of CTA1 comprising residues N1-R192 with an N-terminal 6xHisaffinity tag sequence by co-expression with ARF6 in E. coli, followed by Ni-NTA affinitypurification of the CTA1:ARF6-GTP complex (27). Extended dialysis of the complex againsta native EDTA buffer (to chelate Mg2+ from ARF6 upon dissociation of CTA1 and ARF6-GTP) resulted in soluble free enzyme that was then affinity purified. This approach yieldedlow amounts (6 μM) of free NhisCTA1 (E110:112D), but allowed us for the first time to directlycompare a soluble form of CTA1 not subjected to chemical denaturants against a CTA1 samplewhich had been refolded from inclusion bodies. Comparative 1D NMR spectra of both thesoluble expressed and inclusion body refolded CTA1 show similar profiles within their amideregions (Supplementary Figure 3). This shows that the fold adopted by CTA1 was consistentbetween both purification protocols, indicating that refolding from inclusion bodies generatesa native-like protein analogous to the conventional method used to obtain CTA1 by dialysisof the holotoxin against 6 M urea and reducing agents (23;29).
To investigate if refolded recombinant CTA1 binds ARF6-GTP, we used an additional full-length gene construct with an N-terminal 6xHis tag (NhisCTA1, N1-R192). To form aselectively labeled CTA1:ARF6-GTP in vitro-generated active complex, we lysed unlabeledARF6 cell paste in the presence of refolded 15N/13C-labeled NhisCTA1. Following affinitypurification, gel filtration FPLC analysis of the mixture (Figure 1b) revealed a dominant specieswith a shorter retention time than observed for either free CTA1 or ARF6. SDS-PAGE analysisindicated this major peak was composed of an equimolar mixture of CTA1 and ARF6 (Figure1b). Thus, our protocol purified an active CTA1:ARF6-GTP complex without the presence ofthe inactivating (E110:112D) mutations which are required for co-expression of both CTA1and ARF6 in E. coli (27). An alternate protocol of separately purifying each component priorto mixing did not form a complex (data not shown), as the purified ARF6 was most likely inits inactive GDP-bound form (30).
To further validate the functional integrity of refolded recombinant CTA1, we measured thecapacity of CTA1 to recognize and bind CTA2, its physiological partner in the holotoxin, byperforming surface plasmon resonance studies of CTA1 (N1-G186) with a peptidecorresponding to residues D201–S229 of CTA2. Binding was identified by the increase of
Ampapathi et al. Page 3
J Mol Biol. Author manuscript; available in PMC 2009 March 28.
NIH
-PA Author Manuscript
NIH
-PA Author Manuscript
NIH
-PA Author Manuscript
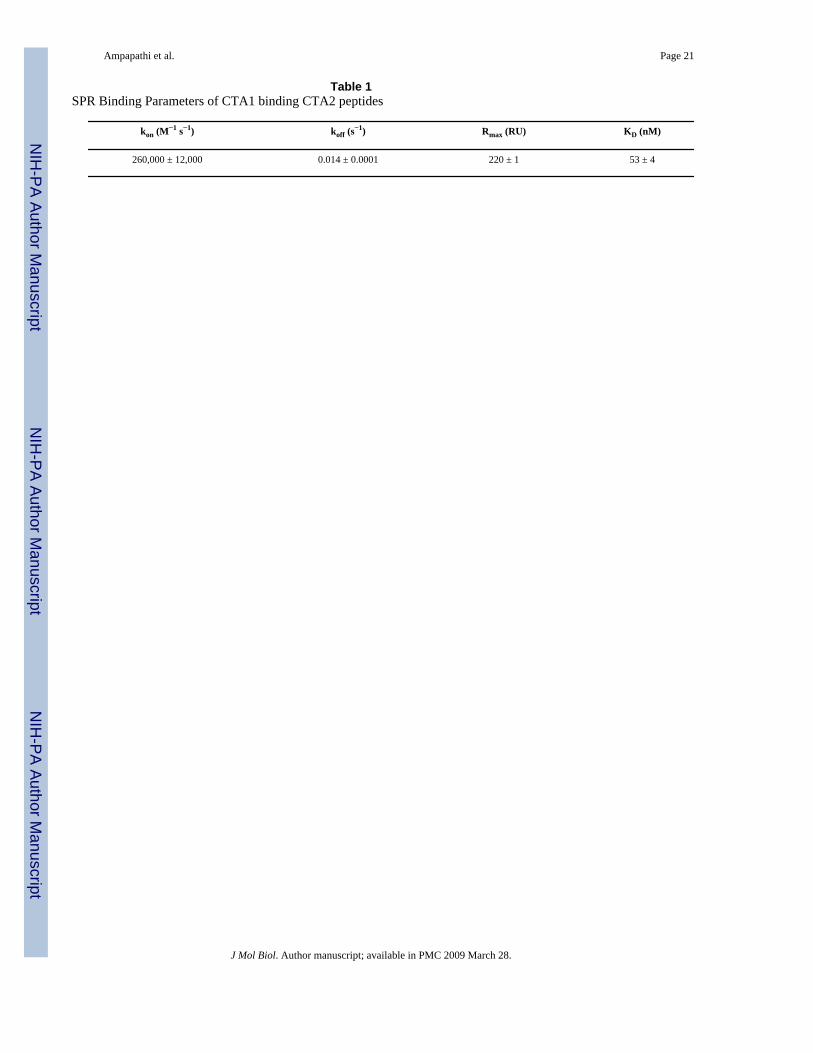
response units (RU) in the presence of the ligand (Fig. 2a); the kinetic parameters are shownin Table 1. These data indicates tight (nM Kd) binding between the two domains, even in theabsence of a disulfide bond.
Circular dichroism (CD) spectroscopy was used to estimate the secondary structure content ofboth the recombinant CTA1 (N1-G186) and CTA1A2 (N1-L240). The CTA1 spectrumrevealed a minima (singular) at 205 nm and a weak shoulder minima at 219 nm when comparedto recombinant CTA1A2 at 206 nm and 221 nm, respectively (Figure 2b). Based on the molarellipticity at 222 nm, we calculated α-helical structure (31) to be approximately 13 % for CTA1and 18 % for CTA1A2. Thus, when measured under the same conditions, the circular dichroismspectrum of CTA1 indicated a decreased helicity when compared to CTA1A2. This decreasein helical structure is consistent with the truncation of CTA2, which forms an extended α-helixin the holotoxin crystal structure (10). Our CD spectra of CTA1A2 closely resembles thepublished CD spectra for the A domain of the shiga AB5 toxin (32) and with the recentlypublished CD spectra for CTA1 and CTA1A2 (33).
Free CTA1 is partially unfolded and refolds upon ARF6-GTP bindingThe 2D NMR 1H/15N HSQC spectrum of recombinant CTA1 (N1-G186) (Figure 3a) revealedthat CTA1 is partially unfolded and displays the characteristics of a molten globule in solution[for review, see (34)]. Notably, only 20% of the total amide protons resonated either up-fieldor down-field when compared to the random coil chemical shift region between 7.5 and 8.5ppm (34–36). Moreover, there is considerable variation in peak intensity within the 1H/15NHSQC spectrum, likely due to intermediate exchange broadening.
To evaluate whether ARF6-GTP binding is sufficient to induce the transition to a fully foldedcomplex, we collected NMR spectra of the selectively-labeled CTA1 in the activeCTA1:ARF6-GTP complex to compare against both the inactive CTA1:ARF6-GTP(E110:112D) complex (27) and free CTA1 (Figure 3). The 1H/15N HSQC spectra of wild typeand mutant (E110:112D) forms of the CTA1:ARF6-GTP complex were similar, indicating thatthese active site residue mutations do not significantly affect the structural changes induced inCTA1 by the formation of a complex with ARF6-GTP. The 1H/15N HSQC spectra of thecomplex samples demonstrate better overall line shape and increased dispersion relative to thespectrum of the free CTA1 sample. Many of the resonances present in the central random-coilregion of the free enzyme are dispersed in the NMR spectrum for the active complex samplewhere CTA1 is selectively labeled. Thus, the binding of ARF6-GTP ligand to CTA1 resultsin an ordering (folding) of partially unfolded regions within the free enzymatic domain,indicating an allosteric coupling between these interaction partners (37).
Unfolding within CTA1 is largely localized to the C-terminal CTA12 and CTA13 regionsCrystal structures of CT holotoxin (10) and CTA1:ARF6-GTP complex (E110:112D) (27)revealed that the CTA1 carboxyl-terminus CTA13 region (residues Y162-R192) extends awayfrom the globular CTA11 domain. To evaluate whether the unfolded regions detected withinfull-length CTA1 are localized to the carboxyl-terminus, we generated and analyzed a mutantform of CTA1 without the carboxyl-terminal region, called CTA1-T2 (N1-F167). For CTA1-T2, the sequence was truncated between F167↓P168P169 as P168P169 make extensivecontacts with the CTA2 linker in the holotoxin crystal structure (10) and are likely to destabilizethe free enzymatic domain. Spectra of the refolded CTA1-T2 sample show similar chemicalshift (δ) values and dispersion to the CTA1 sample (Supplementary Figure 4). Most of thechanges in the 1H/15N HSQC spectrum corresponded to a decrease in the number of resonanceswithin the random coil region, while leaving unaffected the dispersed resonances, suggestingthat the structure of the catalytic core domain was unaffected by the truncation of the C-terminus. The 1H/15N HSQC spectra of CTA1-T4 (N1-G144) shows an additional decrease in
Ampapathi et al. Page 4
J Mol Biol. Author manuscript; available in PMC 2009 March 28.
NIH
-PA Author Manuscript
NIH
-PA Author Manuscript
NIH
-PA Author Manuscript
the number of resonances in the central cluster, with only small shifts in the dispersedresonances evident (Supplementary Figure 4).
As an alternate method of exploring the partial unfolding of the C-terminus and the refoldingof the CTA1 domain upon ARF6-GTP binding, we performed 4,4′-bis(1-anilinonaphthalene8-sulfonate) (bis-ANS) fluorescence experiments. The bis-ANS fluorescence reflects theextent of hydrophobic exposure (38) of CTA1 when compared to both the CTA1:ARF6-GTPcomplex and Gdm-HCl denatured samples (Figure 4). These data indicate bis-ANSfluorescence of the full length CTA1 sample is reduced in the truncated CTA1-T2 sample, andfurther reduced in the CTA1:ARF6-GTP sample or in the presence of chemical denaturants.These results indicate a loss of hydrophobic bis-ANS binding sites upon ARF6-GTP bindingto the enzymatic domain, when fully unfolded or when truncated at the C-terminus. Therefore,ARF6-GTP binding is sufficient to induce profound changes in CTA1: from a partiallydisordered state in the free enzyme to an ordered state within the CTA1:ARF6-GTP complex.
NMR sequence specific assignment of CTA1Triple resonance NMR spectra on a 0.2 mM 2H/13C/15N uniformly labeled CTA1-T2 samplewere acquired, which enabled sequential assignment of 81 % of the backbone 1H and 15Nresonances (129 out of 159 non-proline amide resonances) (Supplementary Figure 5). Sampleconcentration was limited to 200μM, as aggregation was evident in more concentrated samplesand NMR spectra were marked by enhanced line-broadening. The dispersed resonances inthe 1H/15N HSQC spectra that originate from a structured core of the protein show significantlyreduced peak volumes when compared to those from the random coil region (SupplementaryTable 1). Structural mapping of assigned crosspeaks that show increased peak volumesindicates that they predominantly localize to residues at or near the C-terminal CTA12 andCTA13 regions (Supplementary Figure 6). Most residues that lie within the CTA11 region showsignificantly reduced peak volumes, which suggest that residues within a residual structuredcore show decreased internal motions when compared to those at or near the unstructured C-terminus.
Activation loop helix is present in both the free CTA1 and CTA1:ARF6-GTP complexPrevious crystallographic data (27) suggested that ARF6-GTP may function as an allostericactivator for the CTA1 active site by inducing a loop to helix transition for residues R25-F31within the activation loop (residues R25-N40). This activation loop helix formation breaks aninteraction between R11 and H55, leading to an opening of the active site and increasedflexibility of the active site loop (28). To test this hypothesis, we evaluated secondary structurewithin CTA1-T2 by using 13Cα and 13Cβ chemical shift deviations from their statistical randomcoil values (Δδcoil) (39;40). These data indicate that the overall secondary structure of freeCTA1-T2 correlates to the CTA1 domain within CTA1:ARF6-GTP crystal structure (27).Residues R25-Y30 from the activation loop show strong helical propensity, analogous to thisregion with the CTA1:ARF6-GTP complex, while they are non-regular in the holotoxin (10)(Figure 5). Thus, CTA1 binding to ARF6-GTP is not essential for inducing a helical transitionwithin the activation loop, but instead may occur once the free enzyme is dissociated fromCTA2.
The CSI data for CTA1-T2 (N1-F167) indicates approximately 40 residues (24 %) are in β-structure and 28 residues (17 %) are in helix. These data are consistent with the CTA1 (N1-G186) circular dichroism spectra, from which we calculate 24 CTA1 residues (13 %) to behelical. One notable difference between the NMR and crystallographic data is within residuesE137-H140, which are predicted to be α-helical from the CSI plot (Figure 5), while this regionis part of a β-strand within the CT crystal structures. This suggests there is a local structuralrearrangement of these residues within the free enzyme.
Ampapathi et al. Page 5
J Mol Biol. Author manuscript; available in PMC 2009 March 28.
NIH
-PA Author Manuscript
NIH
-PA Author Manuscript
NIH
-PA Author Manuscript
Formation of the CTA1:ARF6-GTP complex does not promote NAD+ binding to CTA1To further evaluate the role of ARF6-GTP allostery in CTA1 activation, we used NMRspectroscopy to determine whether ARF6-GTP binding increases CTA1 affinity for itssubstrate, NAD+. In these experiments, we monitored changes in the chemical shifts of amideprotons in the 1H/15N HSQC spectrum of free CTA1-T2 or the CTA1:ARF6-GTP complex asa function of NAD+ concentration (Figure 6). The binding affinity of NAD+ to CTA1-T2(Kd = 2.0 ± 0.3 mM) was similar to that reported earlier for CTA1 (Kd = 4.0 ± 0.4 mM (41)),while the CTA1:ARF6-GTP complex bound NAD+ with only a modest increase in affinity(Kd = 1.2 ± 0.2 mM) (Figure 6). These data show that ARF6-GTP does not function strictly asan allosteric activator of the active site to greatly increase the affinity of CTA1 for its substrate,NAD+.
DiscussionThis work provides a conceptual framework for understanding the structural changes thataccompany the activation of cholera toxin during intoxication of host cells. Our NMR dataindicate that the free CTA1 enzymatic domain is partially unfolded, in contrast to when it iscomplexed with either CTA2 in the holotoxin or with ARF6-GTP following retrotranslocation.Further strengthening this argument was that the refolded recombinant CTA1 is catalyticallyactive (23) and, due to its thermal instability, CTA1 is a substrate for export to the cytosol viathe ERAD pathway (33).
Teter et al. showed that C-terminal CTA13 truncation decreases catalytic activity by preventingassociation of CTA1 with ARF6-GTP, but does not prevent retrotranslocation from the ER tothe cytosol (23). Our NMR analysis of the free enzyme indicates CTA1 remains partiallyunfolded, even when both the CTA13 (CTA1-T2) and the CTA12 (CTA1-T4) are truncated(Supplementary Figure 4). These data provide a rationale for why a CTA13 truncated enzymaticdomain may still act as an ERAD pathway substrate, even though binding to ARF6-GTP isdisrupted.
Our results also highlight the allosteric role of ARF6-GTP binding to CTA1. We show helixformation in the activation loop of the free enzyme, which suggests an opening of the activesite occurs upon dissociation of CTA2, and prior to association of ARF6-GTP. A preformedactive site in free enzyme also explains why NAD+ substrate binding is not greatly enhancedby the formation of a complex with ARF6-GTP (Figure 6). Additionally, binding of NAD+ didnot enhance the peak dispersion within the 1H/15N HSQC spectra (data not shown), indicatingthat substrate binding does not induce refolding of the free enzyme. Hence, CT is unlike thatof the enzymatic molten globule chorismate mutase, where substrate binding does induceconformational ordering (42). The finding that the binding affinity of NAD+ for CTA1 is nearlyidentical in the presence or absence of ARF6-GTP further indicates an alternative role for itshost factor in enhancing the activation of CTA1. We propose that the primary role of ARF6-GTP binding is in site-to-site allostery (37) that couples the refolding of the C-terminus ofCTA1 with the formation of a high-affinity CTA1:ARF6-GTP complex.
We show CTA1 displays partial unfolding, primarily at both the C-terminal CTA12 andCTA13 regions, while the active site adopts a conformation that is catalytically competent priorto ARF6-GTP binding. This allows the toxin’s free CTA1 domain to activate its catalytic sitewhile “playing dead” so that it can recruit proteins from the host cell’s ERAD pathway thatare required for retrotranslocation from the ER to the cytosol. Thus, CTA1 undergoes anordered (holotoxin) to disordered (free CTA1) to ordered (CTA1:ARF6-GTP complex)structural transition (Figure 7) to accommodate the dual requirements of retrotranslocation andactivation. This model proposes that the partially unfolded free enzyme recruits proteins fromthe ERAD pathway to promote its own retrotranslocation from the ER to the cytosol.
Ampapathi et al. Page 6
J Mol Biol. Author manuscript; available in PMC 2009 March 28.
NIH
-PA Author Manuscript
NIH
-PA Author Manuscript
NIH
-PA Author Manuscript
Subsequently, the model predicts that CTA1 forms a globular complex with ARF6-GTP, whichescapes degradation of the chaperonin/proteasomal machinery of the host cell to ADP-ribosylate its target Gsα.
This model of order–disorder–order transitions illustrates how the formation of a complex withan intracellular host factor may represent a general mechanism for the activation of AB5 toxins.These host factors for the AB5 toxin family include: ARF6, which binds CT (15;43–45); ARF3,which binds heat labile enterotoxin (46;47); and calmodulin, which binds pertussis toxin (48;49), all of which are essential in enhancing the activity of the toxin’s enzymatic domain.Notably, disorder-order structural transitions have been increasingly demonstrated toaccompany high affinity interactions between endogenous cellular protein-protein bindingpartners (50–52). Moreover, other intracellular acting toxins (such as the diphtheria andbotulinum toxins) also adopt enzymatically active partially unfolded structures toaccommodate their dual requirements of activation and membrane translocation in a host cell(7;53). Our results underscore the elegant molecular interplay that regulates the action ofintracellular bacterial toxins within a host cell.
Materials and MethodsCTA subunit gene constructs
A synthetic gene construct CTA1, which encoded residues N1-G186, was inserted into theNde I site in pET-20b(+) (Novagen, Inc.). The QuikChange® II Site-Directed Mutagenesis Kit(Stratagene) was used to generate genes encoding mutant forms of CTA1 with carboxyl-terminal truncations. CTA1-T2 and CTA1-T4 were generated by the introduction of stopcodons after the F167 and G144 codons, respectively. Additionally, a synthetic CTA1A2 gene(encoding residues N1-L240) was ligated into pET-20b(+), replacing the Nde I/Hind IIIfragment, thus encoding a recombinant protein with a carboxyl-terminal 6xHis affinity tagsequence.
CTA1 protein expression and purificationCTA1 and CTA1-T2 were over-expressed in E. coli BL21(DE3) transformed with plasmidsharboring the genes encoding these proteins. For unlabeled samples, E. coli BL21(DE3) wascultured in Luria Broth supplemented with 50 μg/mL ampicillin. 15N-labeled and 15N/13C-labeled protein samples were generated by culturing E. coli BL21(DE3) in M9 minimal mediasupplemented with 50 μg/mL ampicillin and containing 15NH4Cl, 15(NH4)2SO4 and 13C-Glucose (Sigma-Aldrich) as the sole nitrogen and carbon sources, respectively.
2H/15N/13C-labeled CTA1-T2 was generated by first culturing transformed E. coli BL21(DE3)in 10 mL of M9 minimal media supplemented with 50 μg/mL ampicillin andcontaining 15NH4Cl, 15(NH4)2SO4 and 13C-Glucose. After incubation for 4 h at 37 °C, thecells were harvested by centrifugation at 4,000 rpm in a F21B-8x50Y rotor (FIBERLite,Piramoon Technologies, Inc.); the available pellet was resuspended in M9 in 2H2O and addedto 1 L of M9 in 2H2O with 50 μg/mL ampicillin. Cells were cultured to mid log phase(OD600nm approximately 0.6), expression was induced with 0.1 mM of IPTG, and expressioncontinued overnight at 37 °C.
Cells were harvested by centrifugation at 4,000 rpm, resuspended in homogenization buffer(50 mM Tris, pH 8.0, 2 mM EDTA, 2 mM DTT, 200 μg/mL lysozyme (Sigma-Aldrich) and10 % B-PER (Thermo Fisher Scientific, Pierce Product). The resuspended cells were sonicatedon ice and centrifuged at 13,000 rpm; the pellets were washed several times withhomogenization buffer with a final wash in ultrapure water. The inclusion bodies weresolubilized by suspending the pellets in 6 M Gdm-HCl, 50 mM Tris, pH 8.0, and allowed to
Ampapathi et al. Page 7
J Mol Biol. Author manuscript; available in PMC 2009 March 28.
NIH
-PA Author Manuscript
NIH
-PA Author Manuscript
NIH
-PA Author Manuscript
incubate overnight at 4 °C with mixing. The solubilized proteins were renatured by dialysisagainst refolding buffer (20 mM Tris, pH 7.2, 100 mM NaCl, and 5 % glycerol) at 4 °C. Therefolded protein samples were centrifuged as previously described, filtered (0.45 μm) andpurified at 4 °C using the ÄKTA™ FPLC System with a HiLoad™ 16/60 Superdex™ 75 prepgrade Gel Filtration Column (GE Healthcare).
CTA1A2 affinity purification and refoldingCTA1A2 was expressed as described for CTA1, and the harvested bacterial pellet wassuspended in homogenization buffer. The cells were lysed by sonication; additional washesresulted in a clean inclusion body pellet. The pellet was solubilized in 6 M Gdm-HCl, 20 mMTris pH 7.5, 200 mM NaCl, and 1 mM EDTA. Renaturation and purification of the solubilizedproteins was achieved by on-column refolding using the HisTrap™ HP affinity column (GEHealthcare) according to the manufacturer’s instructions. The native refolding buffer was 20mM Tris, pH 7.5, 200 mM NaCl, and 1 mM EDTA; elution from the column was achievedusing 300 mM imidazole in 20 mM Tris, pH 7.5, 200 mM NaCl. Further purification of theprotein was completed using gel filtration chromatography essentially as described for CTA1.
NhisCTA1 and ARF6 constructs and in vitro CTA1:ARF6-GTP complex purificationNhisCTA1 (N1-R192), ARF6 and the NhisCTA1/ARF6 co-expression constructs were a kindgift of Dr. Randall K. Holmes (University of Colorado Health Sciences Center). The NhisCTA1construct was mutated (C187S) to enhance the stability of the recombinant protein for NMRstudies. An 1H/15N-labeled sample of inactive CTA1:ARF6-GTP (E110:112D) complex wasco-expressed in BL21(DE3) cells in M9 minimal media as previously described and purifiedby the published protocol (27). In vitro purification of the active CTA1:ARF6-GTP complexwas performed using 15N/13C-isotopically labeled NhisCTA1 protein and unlabeled ARF6protein, both expressed in BL21(DE3) cells. Supplementation of the cells with 0.1 mM IPTGwas used in the over-expression of ARF6 protein, which expressed in the soluble fraction. TheNhisCTA1 over-expressed as inclusion bodies with a yield of ~80% of the total cellular protein,which were purified and denatured as earlier described for CTA1. Following denaturation, therefolding and purification of NhisCTA1 was performed on the HisTrap column, using theÄKTA™ FPLC System for gradient buffer exchange into 20 mM Tris, pH 7.4, 500 mM NaCl,5 % glycerol, 20 mM imidazole. Following refolding, NhisCTA1 was eluted using 600 mMImidazole, 20 mM Tris, pH 7.4, 500 mM NaCl, and further dialyzed against 20 mM Tris, pH8.2, 1 mM MgCl2, and 200 mM NaCl to remove the imidazole. The refolded free NhisCTA1sample was used to resuspend the frozen ARF6 cell pellet harvested from 500 mL LB. Theresuspended cells were sonicated on ice for 10 minutes every 60 minutes and stirredcontinuously for 4 h at 4 °C. The sample was centrifuged to separate soluble proteins from thecellular debris, and the cleared lysate was harvested and filtered as previously described here.Subsequent purification of the in vitro-generated CTA1:ARF6-GTP complex was performedessentially as described (27). Purified fractions containing CTA1:ARF6-GTP complex werepooled, concentrated and buffer exchanged into 20 mM, dTris-HCl, pH 7.4, 200 mM NaCl, 1mM EDTA, 0.0 5 % NaN3 and 6 % 2H2O for NMR analysis.
NMR experimentsAll NMR spectra of CTA1, CTA1-T2 and the CTA1:ARF6-GTP complex were recorded at15°C on a Bruker Avance 800 MHz NMR spectrometer equipped with a cryogenic Z-gradienttriple-resonance TXI probe. NMR spectra acquired include 2D 15N/1H TROSY, 3D 15N/1HTROSY-HNCA, 3D 15N/1H TROSY-HN(CO)CA, 3D 15N/1H TROSY-HNCO, 3D 15N/1HTROSY-HNCACB and 3D 15N/1H TROSY-HN(CO)CACB (54;55). Spectra were typically1024 complex points in the direct 1H dimension and 35–70 and 32 complex points in the 13C
Ampapathi et al. Page 8
J Mol Biol. Author manuscript; available in PMC 2009 March 28.
NIH
-PA Author Manuscript
NIH
-PA Author Manuscript
NIH
-PA Author Manuscript
and 15N dimensions, respectively. NMRPIPE (56) and SPARKY (57) were used to processand analyze the data for sequence specific assignment of CTA1-T2.
NAD+ titrations by NMRTitration experiments were performed aliquotting NAD+ into the 15N-labeled CTA1-T2 andCTA1:ARF6-GTP complex (CTA1 15N/13C-labeled). NAD+ was dissolved in the same bufferused for the protein samples. The protein sample concentrations used for titration in theseexperiments were 0.2 mM of 15N-labeled CTA1-T2 and 0.1 mM of 15N/13C-labeled activeCTA1:ARF6-GTP complex. For each step of the titration, a 1D 1H spectrum and a2D 1H/15N HSQC or 2D 1H/15N TROSY was acquired at 15 °C for CTA1-T2 and at 37 °C forCTA1:ARF6-GTP on a Bruker Avance 800 MHz NMR spectrometer. Changes in averageamide chemical shifts (Δδavg) were calculated using Equation 1:
(Equation 1)
Where ΔδN and ΔδH are the amide nitrogen and amide proton chemical shift changes from thefree-state to the NAD+ bound states (58). NMR chemical shift changes were fit usingKaleidaGraph 3.52 (Synergy Software) to a bimolecular binding model through non-linearregression analysis.
CD experimentsThe CD spectra of both CTA1 and CTA1A2 were acquired using an Olis RSM1000 instrument,from 200 to 260 nm (CTA1A2) and from 197.5 to 260 nm (CTA1), using an integration timeof 5 seconds. Each sample, 40μM CTA1A2 and 20μM CTA1, was in 20 mM Tris pH 7.5, 200mM NaCl, and 1 mM EDTA and spectra were acquired 288 K. Each spectrum was an averageof 3 scans, smoothed over 5 data points. The % of α-helical content was estimated by thefollowing Equation 2 based on the molar ellipticity [θ] at 222 nm (31):
(Equation 2)
CTA1 binding CTA2 SPR experimentsAll SPR experiments were performed on a BIAcore 2000 instrument (GE Healthcare). 1μMsynthetic CTA2 peptide sample, D201-S229 (DEKTQSLGVKFLDEYQSKVKRQIFSGYQS) in 5 mM sodium acetate pH 5.0 was applied to a CM5 chip using theNHS/EDC amine coupling kit according to the manufacturer’s protocol. A second cell wasused as a blank to allow for baseline correction. A 200 nM CTA1 sample in HBS buffer (10mM HEPES, pH 7.4, 150 mM NaCl, 3 mM EDTA, 0.005% Surfactant P20) was injected ontothe chip at a flow rate of 10μL/min. Data was calculated from six runs, with the chip re-equilibrated between each run by washing with two 100μL injections of 10 mM glycine pH2.0. The maximal binding response (Rmax) was calculated using the following Equation 3:
(Equation 3)
where MMA=21.1 kDa, MML=4.31 kDa, Sm=1 and RU=45. Baseline corrected sensorgramsfor surface plasmon resonance measurements were processed by BIAevaluation software (GEHealthcare) and analyzed using a 1:1 Langmuir model by Scrubber (v 2.0; Center forBiomolecular Interaction Analysis, University of Utah).
Bis-ANS binding experimentsBis-ANS fluorescence experiments were performed using a Varian Cary Eclipsespectrofluorimeter with an excitation wavelength of 395 nm (slit width 2.5 nm) and an emissionwavelength of 495 nm (slit width 5 nm), scanned from 420 to 600 nm. Solution buffer was
Ampapathi et al. Page 9
J Mol Biol. Author manuscript; available in PMC 2009 March 28.
NIH
-PA Author Manuscript
NIH
-PA Author Manuscript
NIH
-PA Author Manuscript
10μM bis-ANS, 20 mM Tris pH 7.2, and 50 mM NaCl; protein concentration was 10μM; andsample size was 1 mL. Experiments samples included were CTA1 (N1-G186), CTA1-T2 (N1-F167), CTA1:ARF6-GTP, CTA1 + 2 M Gdm-HCl, and CTA1 + 6 M Gdm-HCl, and samplebuffer.
NMR assignment of CTA1The chemical shift assignments for CTA1-T2 were deposited in the BMRB under accession#15162.
Supplementary MaterialRefer to Web version on PubMed Central for supplementary material.
Acknowledgements
We thank Dr. Youlin Xia and the UH Keck/IMD NMR Center for help with the NMR experimentation, Wei-hongJin, who assisted in the assembly of the synthetic gene encoding CTA1, Dr. Ana I. Medrano for help with CTA1:ARF6-GTP and Roberto Carreño for help with the SPR experiments. We also thank Dr. Randall K. Holmes (University ofColorado Health Sciences Center) for the CT and ARF6 clones and the reviewer for suggesting the bis-ANSexperiments. This work is supported by Welch Foundation Grants and a NASA Grant to GBL and SRB. RSA wassupported by an NIH training fellowship from the Keck Center Pharmacoinformatics Training Program of the GulfCoast Consortia.
Reference List1. Sack DA, Sack RB, Nair GB, Siddique AK. Cholera. Lancet 2004;363:223–233. [PubMed: 14738797]2. Stewart-Tull DE. Vaba, Haiza, Kholera, Foklune or Cholera: in any language still the disease of seven
pandemics. J Appl Microbiol 2001;91:580–591. [PubMed: 11576291]3. Gill DM, Meren R. ADP-ribosylation of membrane proteins catalyzed by cholera toxin: basis of the
activation of adenylate cyclase. Proc Natl Acad Sci U S A 1978;75:3050–3054. [PubMed: 210449]4. Sharp GW, Hynie S. Stimulation of intestinal adenyl cyclase by cholera toxin. Nature 1971;229:266–
269. [PubMed: 4323551]5. Schafer DE, Lust WD, Sircar B, Goldberg ND. Elevated concentration of adenosine 3′:5′-cyclic
monophosphate in intestinal mucosa after treatment with cholera toxin. Proc Natl Acad Sci U S A1970;67:851–856. [PubMed: 4331724]
6. Randazzo PA, Terui T, Sturch S, Kahn RA. The amino terminus of ADP-ribosylation factor (ARF) 1is essential for interaction with Gs and ARF GTPase-activating protein. J Biol Chem 1994;269:29490–29494. [PubMed: 7961931]
7. Lemichez E, Boquet P. To be helped or not helped, that is the question. J Cell Biol 2003;160:991–992.[PubMed: 12668655]
8. Lencer WI, Tsai B. The intracellular voyage of cholera toxin: going retro. Trends Biochem Sci2003;28:639–645. [PubMed: 14659695]
9. Moss J, Vaughan M. Activation of toxin ADP-ribosyltransferases by eukaryotic ADP-ribosylationfactors. Mol Cell Biochem 1999;193:153–157. [PubMed: 10331652]
10. Zhang RG, Scott DL, Westbrook ML, Nance S, Spangler BD, Shipley GG, Westbrook EM. The three-dimensional crystal structure of cholera toxin. J Mol Biol 1995;251:563–573. [PubMed: 7658473]
11. Jobling MG, Holmes RK. Identification of motifs in cholera toxin A1 polypeptide that are requiredfor its interaction with human ADP-ribosylation factor 6 in a bacterial two-hybrid system. Proc NatlAcad Sci U S A 2000;97:14662–14667. [PubMed: 11106366]
12. Mekalanos JJ, Collier RJ, Romig WR. Enzymic activity of cholera toxin. II Relationships toproteolytic processing, disulfide bond reduction, and subunit composition. J Biol Chem1979;254:5855–5861. [PubMed: 221485]
13. Stein PE, Boodhoo A, Armstrong GD, Cockle SA, Klein MH, Read RJ. The crystal structure ofpertussis toxin. Structure 1994;2:45–57. [PubMed: 8075982]
Ampapathi et al. Page 10
J Mol Biol. Author manuscript; available in PMC 2009 March 28.
NIH
-PA Author Manuscript
NIH
-PA Author Manuscript
NIH
-PA Author Manuscript
14. Fraser ME, Fujinaga M, Cherney MM, Melton-Celsa AR, Twiddy EM, O’Brien AD, James MN.Structure of shiga toxin type 2 (Stx2) from Escherichia coli O157:H7. J Biol Chem 2004;279:27511–27517. [PubMed: 15075327]
15. De Haan L, Hirst TR. Cholera toxin: a paradigm for multi-functional engagement of cellularmechanisms (Review). Mol Membr Biol 2004;21:77–92. [PubMed: 15204437]
16. Sandvig K, van Deurs B. Transport of protein toxins into cells: pathways used by ricin, cholera toxinand Shiga toxin. FEBS Lett 2002;529:49–53. [PubMed: 12354612]
17. Hazes B, Read RJ. Accumulating evidence suggests that several AB-toxins subvert the endoplasmicreticulum-associated protein degradation pathway to enter target cells. Biochemistry 1997;36:11051–11054. [PubMed: 9333321]
18. Teter K, Allyn RL, Jobling MG, Holmes RK. Transfer of the cholera toxin A1 polypeptide from theendoplasmic reticulum to the cytosol is a rapid process facilitated by the endoplasmic reticulum-associated degradation pathway. Infect Immun 2002;70:6166–6171. [PubMed: 12379694]
19. Tsai B, Ye Y, Rapoport TA. Retro-translocation of proteins from the endoplasmic reticulum into thecytosol. Nat Rev Mol Cell Biol 2002;3:246–255. [PubMed: 11994744]
20. Lencer WI. Retrograde transport of cholera toxin into the ER of host cells. Int J Med Microbiol2004;293:491–494. [PubMed: 15149023]
21. Hagiwara Y, Kawamura YI, Kataoka K, Rahima B, Jackson RJ, Komase K, Dohi T, Boyaka PN,Takeda Y, Kiyono H, McGhee JR, Fujihashi K. A second generation of double mutant cholera toxinadjuvants: enhanced immunity without intracellular trafficking. J Immunol 2006;177:3045–3054.[PubMed: 16920941]
22. Schmitz A, Herrgen H, Winkeler A, Herzog V. Cholera toxin is exported from microsomes by theSec61p complex. J Cell Biol 2000;148:1203–1212. [PubMed: 10725333]
23. Teter K, Jobling MG, Sentz D, Holmes RK. The cholera toxin A1(3) subdomain is essential forinteraction with ADP-ribosylation factor 6 and full toxic activity but is not required for translocationfrom the endoplasmic reticulum to the cytosol. Infect Immun 2006;74:2259–2267. [PubMed:16552056]
24. Rodighiero C, Tsai B, Rapoport TA, Lencer WI. Role of ubiquitination in retro-translocation ofcholera toxin and escape of cytosolic degradation. EMBO Rep 2002;3:1222–1227. [PubMed:12446567]
25. Kahn RA, Gilman AG. ADP-ribosylation of Gs promotes the dissociation of its alpha and betasubunits. J Biol Chem 1984;259:6235–6240. [PubMed: 6327672]
26. Osborne JC Jr, Stanley SJ, Moss J. Kinetic mechanisms of two NAD:arginine ADP-ribosyltransferases: the soluble, salt-stimulated transferase from turkey erythrocytes and choleragen,a toxin from Vibrio cholerae. Biochemistry 1985;24:5235–5240. [PubMed: 3935159]
27. O’Neal CJ, Jobling MG, Holmes RK, Hol WG. Structural basis for the activation of cholera toxin byhuman ARF6-GTP. Science 2005;309:1093–1096. [PubMed: 16099990]
28. O’Neal CJ, Amaya EI, Jobling MG, Holmes RK, Hol WG. Crystal structures of an intrinsically activecholera toxin mutant yield insight into the toxin activation mechanism. Biochemistry 2004;43:3772–3782. [PubMed: 15049684]
29. Mekalanos JJ, Collier RJ, Romig WR. Purification of cholera toxin and its subunits: new methods ofpreparation and the use of hypertoxinogenic mutants. Infect Immun 1978;20:552–558. [PubMed:669812]
30. Kahn RA, Gilman AG. The protein cofactor necessary for ADP-ribosylation of Gs by cholera toxinis itself a GTP binding protein. J Biol Chem 1986;261:7906–7911. [PubMed: 3086320]
31. Woody RW. Circular dichroism. Methods Enzymol 1995;246:34–71. [PubMed: 7538625]32. LaPointe P, Wei X, Gariepy J. A role for the protease-sensitive loop region of Shiga-like toxin 1 in
the retrotranslocation of its A1 domain from the endoplasmic reticulum lumen. J Biol Chem2005;280:23310–23318. [PubMed: 15817449]
33. Pande AH, Scaglione P, Taylor M, Nemec KN, Tuthill S, Moe D, Holmes RK, Tatulian SA, TeterK. Conformational instability of the cholera toxin A1 polypeptide. J Mol Biol 2007;374:1114–1128.[PubMed: 17976649]
34. Dyson HJ, Wright PE. Equilibrium NMR studies of unfolded and partially folded proteins. Nat StructBiol 1998;5(Suppl):499–503. [PubMed: 9665178]
Ampapathi et al. Page 11
J Mol Biol. Author manuscript; available in PMC 2009 March 28.
NIH
-PA Author Manuscript
NIH
-PA Author Manuscript
NIH
-PA Author Manuscript
35. Wishart DS, Bigam CG, Yao J, Abildgaard F, Dyson HJ, Oldfield E, Markley JL, Sykes BD. 1H,13C and 15N chemical shift referencing in biomolecular NMR. J Biomol NMR 1995;6:135–140.[PubMed: 8589602]
36. Redfield C. Using nuclear magnetic resonance spectroscopy to study molten globule states of proteins.Methods 2004;34:121–132. [PubMed: 15283921]
37. Hilser VJ, Thompson EB. Intrinsic disorder as a mechanism to optimize allosteric coupling in proteins.Proc Natl Acad Sci U S A 2007;104:8311–8315. [PubMed: 17494761]
38. Smoot AL, Panda M, Brazil BT, Buckle AM, Fersht AR, Horowitz PM. The binding of bis-ANS tothe isolated GroEL apical domain fragment induces the formation of a folding intermediate withincreased hydrophobic surface not observed in tetradecameric GroEL. Biochemistry 2001;40:4484–4492. [PubMed: 11284705]
39. Spera S, Bax A. Empirical Correlation Between Protein Backbone Conformation and C-Alpha andC-Beta C-13 Nuclear-Magnetic-Resonance Chemical-Shifts. Journal of the American ChemicalSociety 1991;113:5490–5492.
40. Wishart DS, Sykes BD. The 13C chemical-shift index: a simple method for the identification ofprotein secondary structure using 13C chemical-shift data. J Biomol NMR 1994;4:171–180.[PubMed: 8019132]
41. Galloway TS, van Heyningen S. Binding of NAD+ by cholera toxin. Biochem J 1987;244:225–230.[PubMed: 2821999]
42. Vamvaca K, Vogeli B, Kast P, Pervushin K, Hilvert D. An enzymatic molten globule: efficientcoupling of folding and catalysis. Proc Natl Acad Sci U S A 2004;101:12860–12864. [PubMed:15322276]
43. Morinaga N, Kaihou Y, Vitale N, Moss J, Noda M. Involvement of ADP-ribosylation factor 1 incholera toxin-induced morphological changes of Chinese hamster ovary cells. J Biol Chem2001;276:22838–22843. [PubMed: 11279243]
44. Moss J, Vaughan M. Structure and function of ARF proteins: activators of cholera toxin and criticalcomponents of intracellular vesicular transport processes. J Biol Chem 1995;270:12327–12330.[PubMed: 7759471]
45. Spangler BD. Structure and function of cholera toxin and the related Escherichia coli heat-labileenterotoxin. Microbiol Rev 1992;56:622–647. [PubMed: 1480112]
46. Zhu X, Kim E, Boman AL, Hodel A, Cieplak W, Kahn RA. ARF binds the C-terminal region of theEscherichia coli heat-labile toxin (LTA1) and competes for the binding of LTA2. Biochemistry2001;40:4560–4568. [PubMed: 11294623]
47. Zhu X, Kahn RA. The Escherichia coli heat labile toxin binds to Golgi membranes and alters Golgiand cell morphologies using ADP-ribosylation factor-dependent processes. J Biol Chem2001;276:25014–25021. [PubMed: 11333260]
48. Guo Q, Shen Y, Lee YS, Gibbs CS, Mrksich M, Tang WJ. Structural basis for the interaction ofBordetella pertussis adenylyl cyclase toxin with calmodulin. EMBO J 2005;24:3190–3201.[PubMed: 16138079]
49. Ladant D, Ullmann A. Bordatella pertussis adenylate cyclase: a toxin with multiple talents. TrendsMicrobiol 1999;7:172–176. [PubMed: 10217833]
50. Love JJ, Li X, Chung J, Dyson HJ, Wright PE. The LEF-1 high-mobility group domain undergoes adisorder-to-order transition upon formation of a complex with cognate DNA. Biochemistry2004;43:8725–8734. [PubMed: 15236581]
51. Dyson HJ, Wright PE. Coupling of folding and binding for unstructured proteins. Curr Opin StructBiol 2002;12:54–60. [PubMed: 11839490]
52. Dyson HJ, Wright PE. Intrinsically unstructured proteins and their functions. Nat Rev Mol Cell Biol2005;6:197–208. [PubMed: 15738986]
53. Kukreja R, Singh B. Biologically active novel conformational state of botulinum, the most poisonouspoison. J Biol Chem 2005;280:39346–39352. [PubMed: 16179354]
54. Salzmann M, Pervushin K, Wider G, Senn H, Wuthrich K. TROSY in triple-resonance experiments:new perspectives for sequential NMR assignment of large proteins. Proc Natl Acad Sci U S A1998;95:13585–13590. [PubMed: 9811843]
Ampapathi et al. Page 12
J Mol Biol. Author manuscript; available in PMC 2009 March 28.
NIH
-PA Author Manuscript
NIH
-PA Author Manuscript
NIH
-PA Author Manuscript
55. Sattler M, Schleucher J, Griesinger C. Heteronuclear multidimensional NMR experiments for thestructure determination of proteins in solution employing pulsed field gradients. Prog NMR Spect1999;34:93–158.
56. Delaglio F, Grzesiek S, Vuister GW, Zhu G, Pfeifer J, Bax A. Nmrpipe - A Multidimensional SpectralProcessing System Based on Unix Pipes. Journal of Biomolecular Nmr 1995;6:277–293. [PubMed:8520220]
57. Goddard, T.; Kneller, DG. SPARKY 3 University of California; San Francisco: 2006. p. 10-13.58. Hall DA, Vander Kooi CW, Stasik CN, Stevens SY, Zuiderweg ER, Matthews RG. Mapping the
interactions between flavodoxin and its physiological partners flavodoxin reductase and cobalamin-dependent methionine synthase. Proc Natl Acad Sci U S A 2001;98:9521–9526. [PubMed:11493691]
59. Weighted CSI Program. http://nmr.uhnres.utoronto.ca/ikura/csi/
Ampapathi et al. Page 13
J Mol Biol. Author manuscript; available in PMC 2009 March 28.
NIH
-PA Author Manuscript
NIH
-PA Author Manuscript
NIH
-PA Author Manuscript
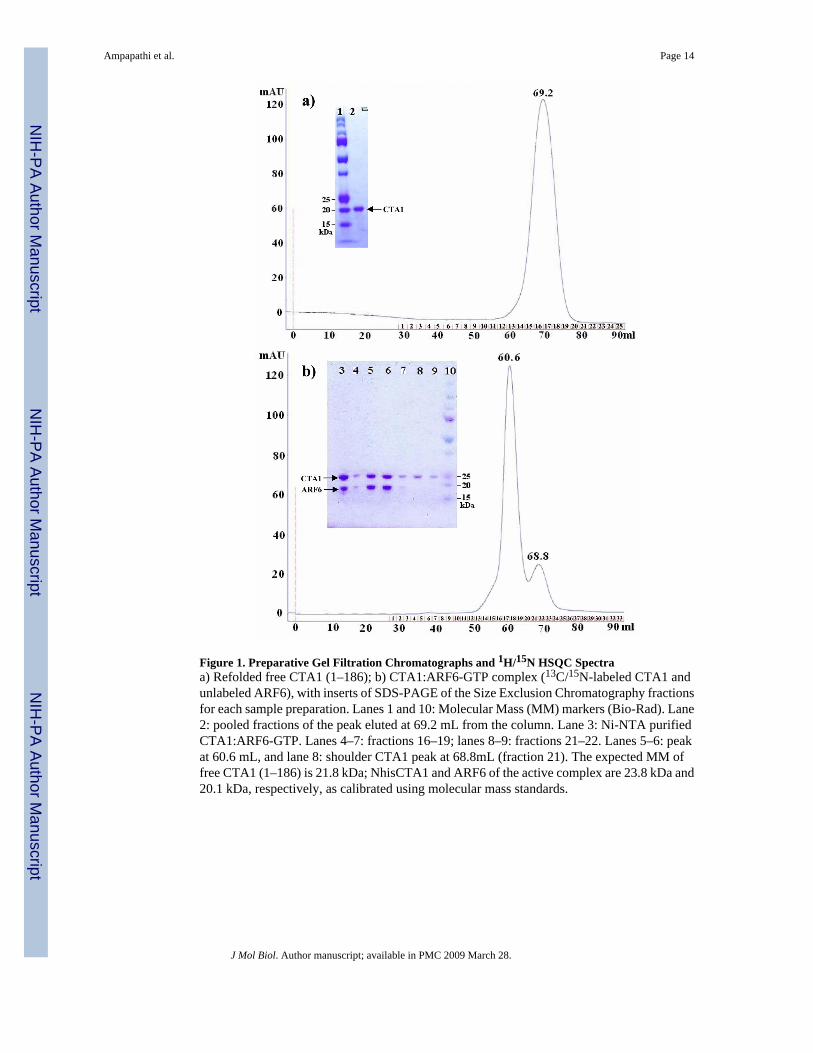
Figure 1. Preparative Gel Filtration Chromatographs and 1H/15N HSQC Spectraa) Refolded free CTA1 (1–186); b) CTA1:ARF6-GTP complex (13C/15N-labeled CTA1 andunlabeled ARF6), with inserts of SDS-PAGE of the Size Exclusion Chromatography fractionsfor each sample preparation. Lanes 1 and 10: Molecular Mass (MM) markers (Bio-Rad). Lane2: pooled fractions of the peak eluted at 69.2 mL from the column. Lane 3: Ni-NTA purifiedCTA1:ARF6-GTP. Lanes 4–7: fractions 16–19; lanes 8–9: fractions 21–22. Lanes 5–6: peakat 60.6 mL, and lane 8: shoulder CTA1 peak at 68.8mL (fraction 21). The expected MM offree CTA1 (1–186) is 21.8 kDa; NhisCTA1 and ARF6 of the active complex are 23.8 kDa and20.1 kDa, respectively, as calibrated using molecular mass standards.
Ampapathi et al. Page 14
J Mol Biol. Author manuscript; available in PMC 2009 March 28.
NIH
-PA Author Manuscript
NIH
-PA Author Manuscript
NIH
-PA Author Manuscript
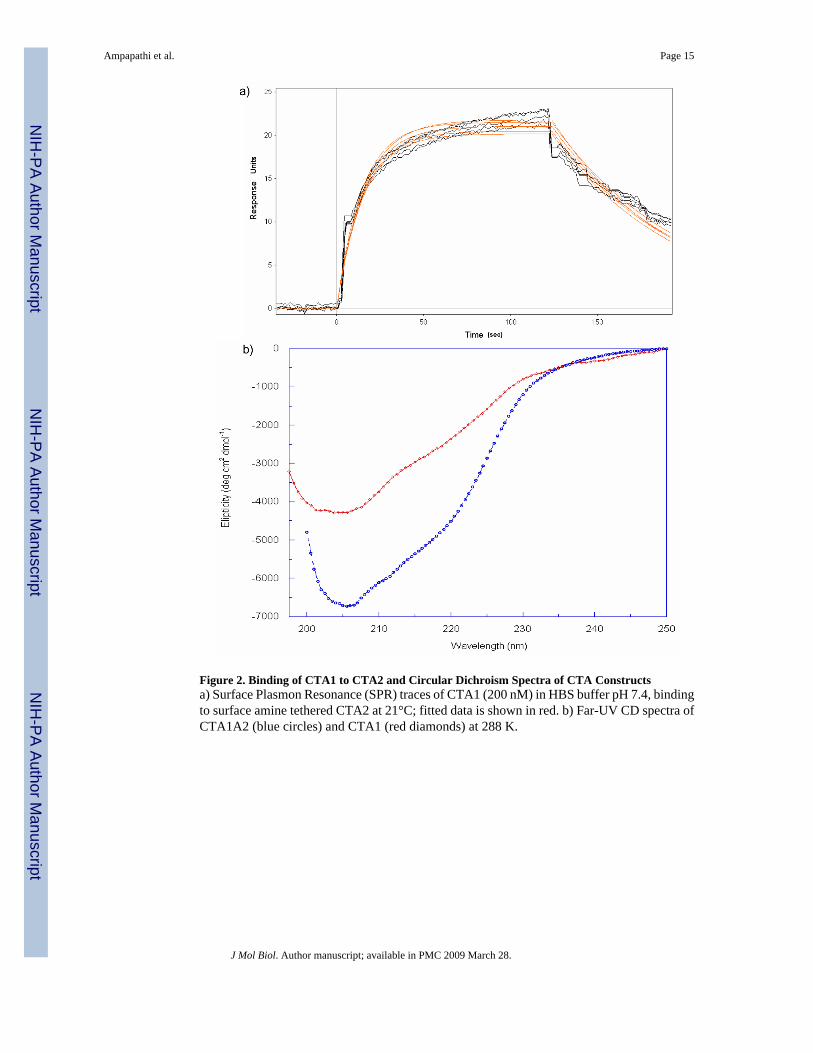
Figure 2. Binding of CTA1 to CTA2 and Circular Dichroism Spectra of CTA Constructsa) Surface Plasmon Resonance (SPR) traces of CTA1 (200 nM) in HBS buffer pH 7.4, bindingto surface amine tethered CTA2 at 21°C; fitted data is shown in red. b) Far-UV CD spectra ofCTA1A2 (blue circles) and CTA1 (red diamonds) at 288 K.
Ampapathi et al. Page 15
J Mol Biol. Author manuscript; available in PMC 2009 March 28.
NIH
-PA Author Manuscript
NIH
-PA Author Manuscript
NIH
-PA Author Manuscript
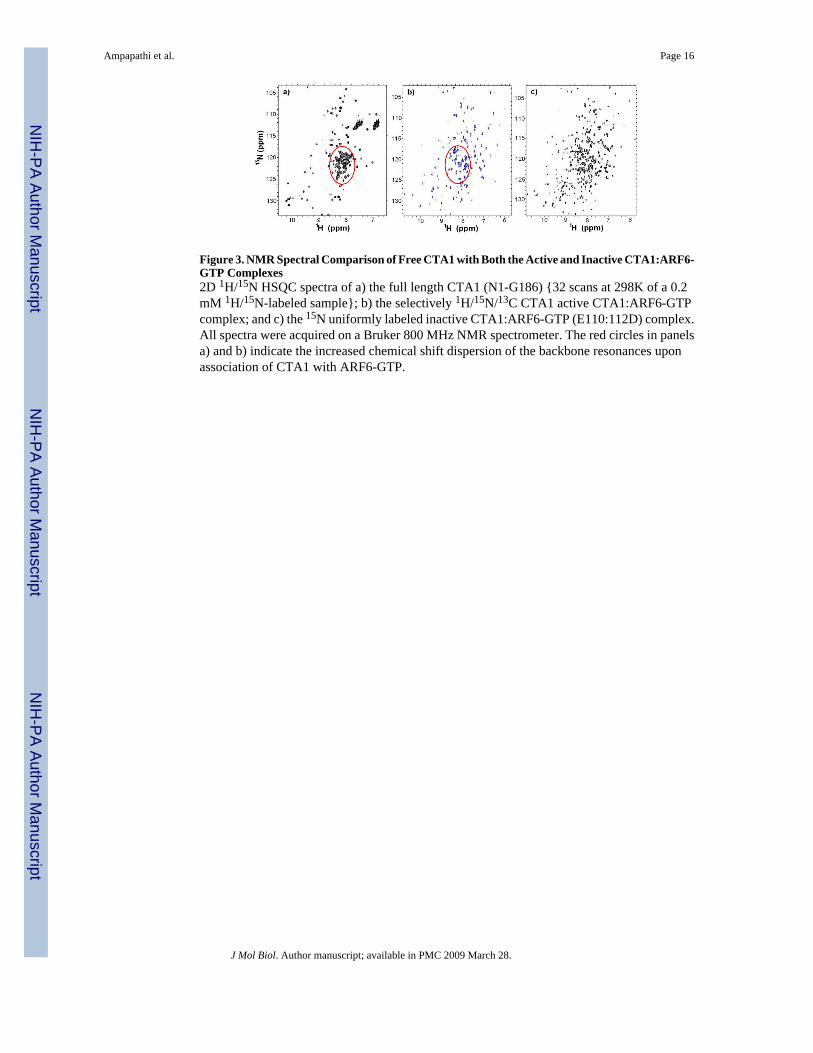
Figure 3. NMR Spectral Comparison of Free CTA1 with Both the Active and Inactive CTA1:ARF6-GTP Complexes2D 1H/15N HSQC spectra of a) the full length CTA1 (N1-G186) {32 scans at 298K of a 0.2mM 1H/15N-labeled sample}; b) the selectively 1H/15N/13C CTA1 active CTA1:ARF6-GTPcomplex; and c) the 15N uniformly labeled inactive CTA1:ARF6-GTP (E110:112D) complex.All spectra were acquired on a Bruker 800 MHz NMR spectrometer. The red circles in panelsa) and b) indicate the increased chemical shift dispersion of the backbone resonances uponassociation of CTA1 with ARF6-GTP.
Ampapathi et al. Page 16
J Mol Biol. Author manuscript; available in PMC 2009 March 28.
NIH
-PA Author Manuscript
NIH
-PA Author Manuscript
NIH
-PA Author Manuscript
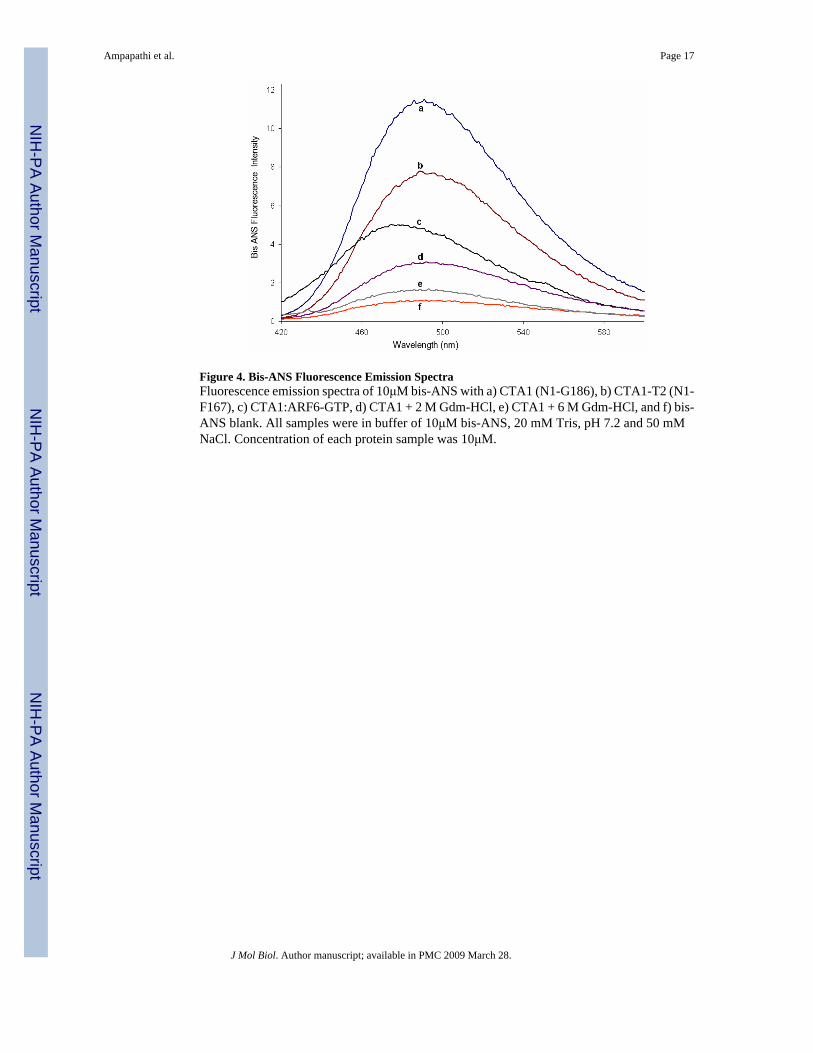
Figure 4. Bis-ANS Fluorescence Emission SpectraFluorescence emission spectra of 10μM bis-ANS with a) CTA1 (N1-G186), b) CTA1-T2 (N1-F167), c) CTA1:ARF6-GTP, d) CTA1 + 2 M Gdm-HCl, e) CTA1 + 6 M Gdm-HCl, and f) bis-ANS blank. All samples were in buffer of 10μM bis-ANS, 20 mM Tris, pH 7.2 and 50 mMNaCl. Concentration of each protein sample was 10μM.
Ampapathi et al. Page 17
J Mol Biol. Author manuscript; available in PMC 2009 March 28.
NIH
-PA Author Manuscript
NIH
-PA Author Manuscript
NIH
-PA Author Manuscript
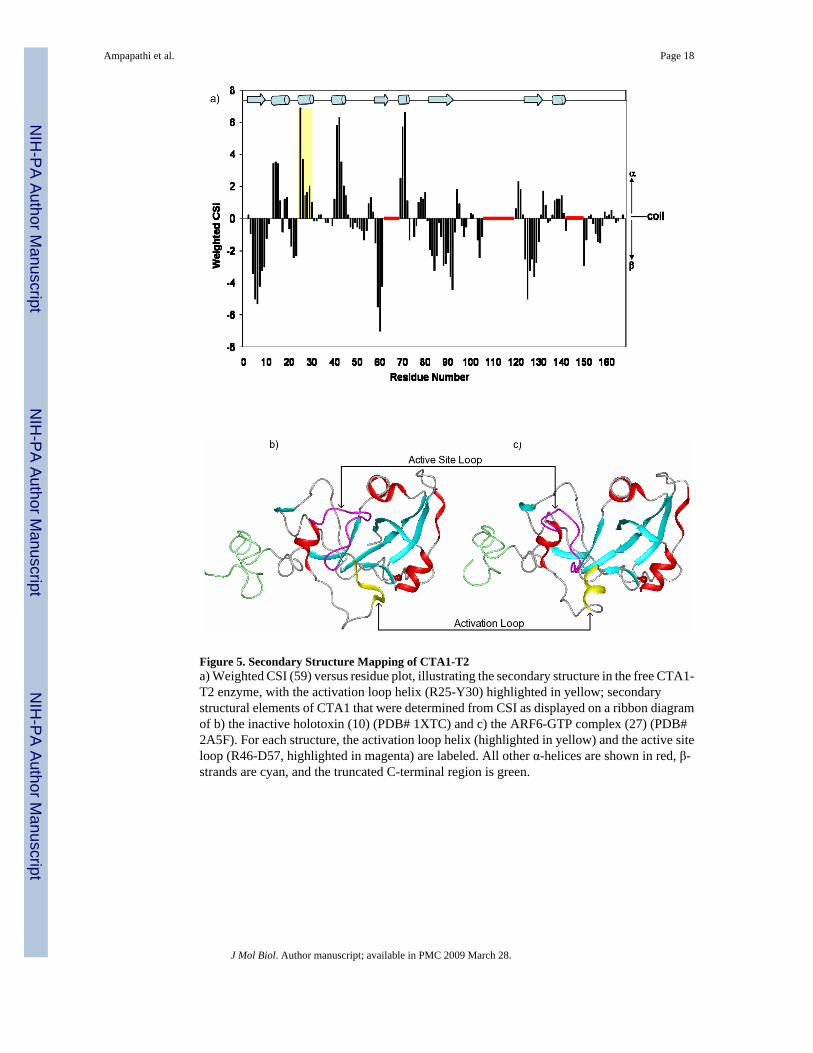
Figure 5. Secondary Structure Mapping of CTA1-T2a) Weighted CSI (59) versus residue plot, illustrating the secondary structure in the free CTA1-T2 enzyme, with the activation loop helix (R25-Y30) highlighted in yellow; secondarystructural elements of CTA1 that were determined from CSI as displayed on a ribbon diagramof b) the inactive holotoxin (10) (PDB# 1XTC) and c) the ARF6-GTP complex (27) (PDB#2A5F). For each structure, the activation loop helix (highlighted in yellow) and the active siteloop (R46-D57, highlighted in magenta) are labeled. All other α-helices are shown in red, β-strands are cyan, and the truncated C-terminal region is green.
Ampapathi et al. Page 18
J Mol Biol. Author manuscript; available in PMC 2009 March 28.
NIH
-PA Author Manuscript
NIH
-PA Author Manuscript
NIH
-PA Author Manuscript
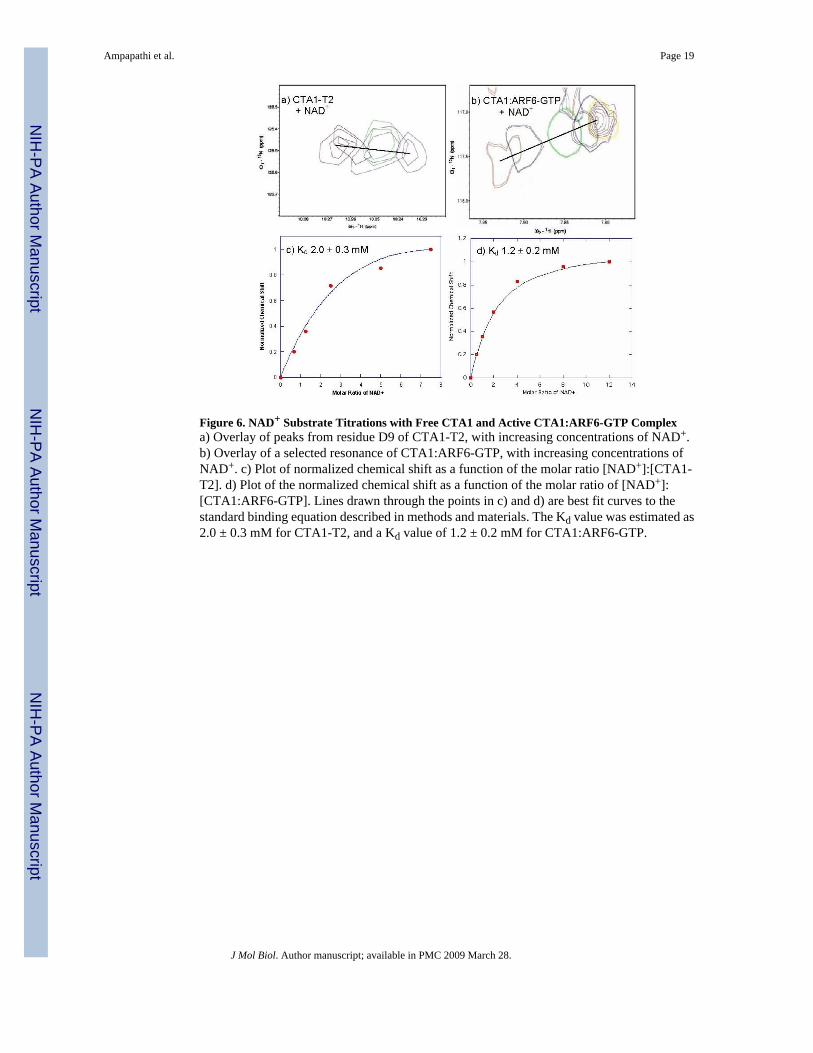
Figure 6. NAD+ Substrate Titrations with Free CTA1 and Active CTA1:ARF6-GTP Complexa) Overlay of peaks from residue D9 of CTA1-T2, with increasing concentrations of NAD+.b) Overlay of a selected resonance of CTA1:ARF6-GTP, with increasing concentrations ofNAD+. c) Plot of normalized chemical shift as a function of the molar ratio [NAD+]:[CTA1-T2]. d) Plot of the normalized chemical shift as a function of the molar ratio of [NAD+]:[CTA1:ARF6-GTP]. Lines drawn through the points in c) and d) are best fit curves to thestandard binding equation described in methods and materials. The Kd value was estimated as2.0 ± 0.3 mM for CTA1-T2, and a Kd value of 1.2 ± 0.2 mM for CTA1:ARF6-GTP.
Ampapathi et al. Page 19
J Mol Biol. Author manuscript; available in PMC 2009 March 28.
NIH
-PA Author Manuscript
NIH
-PA Author Manuscript
NIH
-PA Author Manuscript
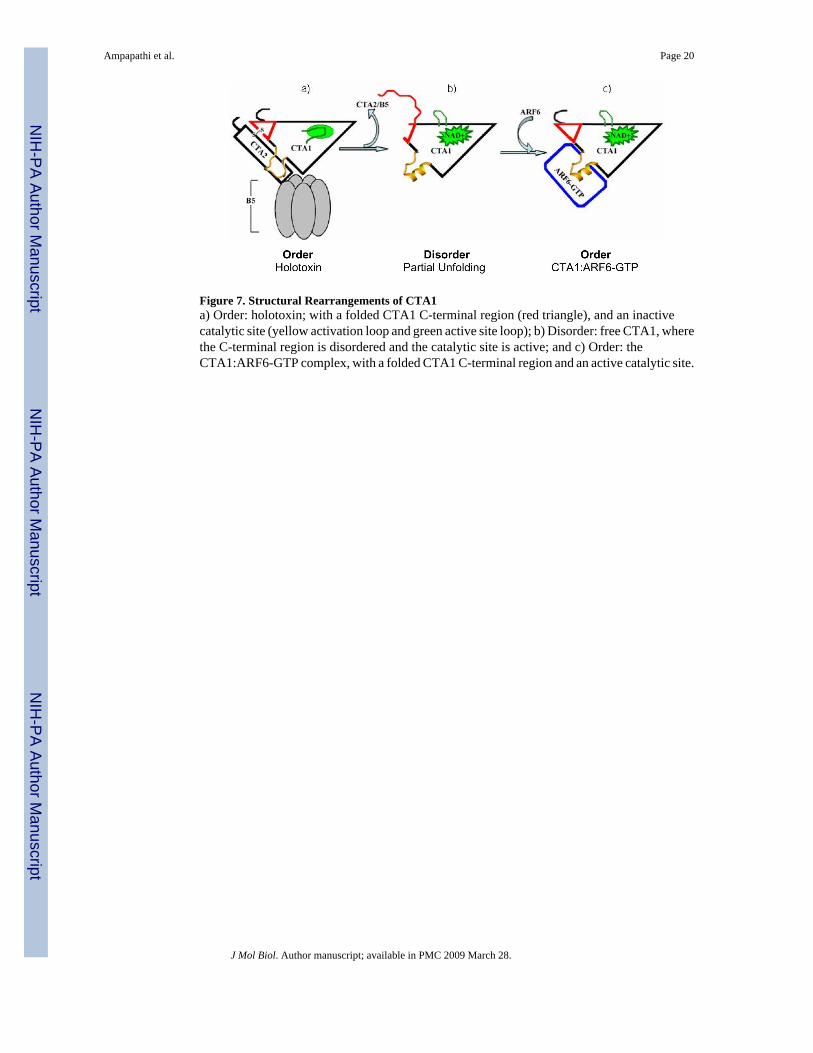
Figure 7. Structural Rearrangements of CTA1a) Order: holotoxin; with a folded CTA1 C-terminal region (red triangle), and an inactivecatalytic site (yellow activation loop and green active site loop); b) Disorder: free CTA1, wherethe C-terminal region is disordered and the catalytic site is active; and c) Order: theCTA1:ARF6-GTP complex, with a folded CTA1 C-terminal region and an active catalytic site.
Ampapathi et al. Page 20
J Mol Biol. Author manuscript; available in PMC 2009 March 28.
NIH
-PA Author Manuscript
NIH
-PA Author Manuscript
NIH
-PA Author Manuscript
NIH
-PA Author Manuscript
NIH
-PA Author Manuscript
NIH
-PA Author Manuscript
Ampapathi et al. Page 21
Table 1SPR Binding Parameters of CTA1 binding CTA2 peptides
kon (M−1 s−1) koff (s−1) Rmax (RU) KD (nM)
260,000 ± 12,000 0.014 ± 0.0001 220 ± 1 53 ± 4
J Mol Biol. Author manuscript; available in PMC 2009 March 28.
Copyright © 2022 FDOKUMEN