Endemic and epidemic dynamics of cholera - BMC Infectious ...
14
BMC Infectious Diseases (2001) 1:1 http://www.biomedcentral.com/1471-2334/1/1 BMC Infectious Diseases (2001) 1:1 Research article Endemic and epidemic dynamics of cholera: the role of the aquatic reservoir Cláudia Torres Codeço* Address: Programa de Computação Científica Fundação Oswaldo Cruz, Rio de Janeiro, Brazil E-mail: Cláudia Torres Codeço* - [email protected] *Corresponding author Abstract Background: In the last decades, attention to cholera epidemiology increased, as cholera epidemics became a worldwide health problem. Detailed investigation of V. cholerae interactions with its host and with other organisms in the environment suggests that cholera dynamics is much more complex than previously thought. Here, I formulate a mathematical model of cholera epidemiology that incorporates an environmental reservoir of V. cholerae. The objective is to explore the role of the aquatic reservoir on the persistence of endemic cholera as well as to define minimum conditions for the development of epidemic and endemic cholera. Results: The reproduction rate of cholera in a community is defined by the product of social and environmental factors. The importance of the aquatic reservoir depends on the sanitary conditions of the community. Seasonal variations of contact rates force a cyclical pattern of cholera outbreaks, as observed in some cholera-endemic communities. Conclusions: Further development on cholera modeling requires a better understanding of V. cholerae ecology and epidemiology. We need estimates of the prevalence of V. cholerae infection in endemic populations as well as a better description of the relationship between dose and virulence. Background Since Snow's seminal work (1855), when cholera epi- demics were first associated with a contaminated water supply, this disease has been the focus of intense study. Cholera is a waterborne disease characterized by severe diarrhea. The etiological agent is V. cholerae O1 (more recently also V. cholerae O139), which colonizes the small intestine and produces an enterotoxin responsible for a watery diarrhea. Without prompt treatment, a per- son with cholera may die of dehydration in a matter of hours after infection. Cholera outbreaks are generally as- sociated to contaminated food and water supplies. Ap- propriate sanitation and safe water are the main weapons against this disease. Until the 19 th century, cholera was confined to the Indian sub-continent [1]. There, cholera outbreaks are seasonal with one or two peaks per year [2]. From this region, cholera has spread throughout the world seven times since 1817 [3]. The last pandemics began in 1961 in Indo- nesia, spread through the Asian continent during the 60's, reached Africa in 1970 [4] and Latin America in 1991. The occurrence of successive cholera outbreaks throughout Africa and Latin America during the 90's raised the concern that cholera had established itself in these regions as an endemic disease. Once cholera arrives into a new region, either carried by an infected person or by contaminated water and food, Published: 2 February 2001 BMC Infectious Diseases 2001, 1:1 This article is available from: http://www.biomedcentral.com/1471-2334/1/1 (c) 2001 Codeço, licensee BioMed Central Ltd. Received: 13 July 2000 Accepted: 2 February 2001
-
Upload
khangminh22 -
Category
Documents
-
view
2 -
download
0
Transcript of Endemic and epidemic dynamics of cholera - BMC Infectious ...

BMC Infectious Diseases (2001) 1:1 http://www.biomedcentral.com/1471-2334/1/1
BMC Infectious Diseases (2001) 1:1Research articleEndemic and epidemic dynamics of cholera: the role of the aquatic reservoirCláudia Torres Codeço*
Address: Programa de Computação Científica Fundação Oswaldo Cruz, Rio de Janeiro, Brazil
E-mail: Cláudia Torres Codeço* - [email protected]
*Corresponding author
AbstractBackground: In the last decades, attention to cholera epidemiology increased, as choleraepidemics became a worldwide health problem. Detailed investigation of V. cholerae interactionswith its host and with other organisms in the environment suggests that cholera dynamics is muchmore complex than previously thought. Here, I formulate a mathematical model of choleraepidemiology that incorporates an environmental reservoir of V. cholerae. The objective is toexplore the role of the aquatic reservoir on the persistence of endemic cholera as well as to defineminimum conditions for the development of epidemic and endemic cholera.
Results: The reproduction rate of cholera in a community is defined by the product of social andenvironmental factors. The importance of the aquatic reservoir depends on the sanitary conditionsof the community. Seasonal variations of contact rates force a cyclical pattern of cholera outbreaks,as observed in some cholera-endemic communities.
Conclusions: Further development on cholera modeling requires a better understanding of V.cholerae ecology and epidemiology. We need estimates of the prevalence of V. cholerae infection inendemic populations as well as a better description of the relationship between dose and virulence.
BackgroundSince Snow's seminal work (1855), when cholera epi-demics were first associated with a contaminated water
supply, this disease has been the focus of intense study.
Cholera is a waterborne disease characterized by severe
diarrhea. The etiological agent is V. cholerae O1 (more
recently also V. cholerae O139), which colonizes the
small intestine and produces an enterotoxin responsible
for a watery diarrhea. Without prompt treatment, a per-
son with cholera may die of dehydration in a matter of
hours after infection. Cholera outbreaks are generally as-
sociated to contaminated food and water supplies. Ap-
propriate sanitation and safe water are the main
weapons against this disease.
Until the 19th century, cholera was confined to the Indian
sub-continent [1]. There, cholera outbreaks are seasonalwith one or two peaks per year [2]. From this region,
cholera has spread throughout the world seven times
since 1817 [3]. The last pandemics began in 1961 in Indo-
nesia, spread through the Asian continent during the
60's, reached Africa in 1970 [4] and Latin America in
1991. The occurrence of successive cholera outbreaks
throughout Africa and Latin America during the 90's
raised the concern that cholera had established itself in
these regions as an endemic disease.
Once cholera arrives into a new region, either carried by
an infected person or by contaminated water and food,
Published: 2 February 2001
BMC Infectious Diseases 2001, 1:1
This article is available from: http://www.biomedcentral.com/1471-2334/1/1
(c) 2001 Codeço, licensee BioMed Central Ltd.
Received: 13 July 2000Accepted: 2 February 2001

BMC Infectious Diseases (2001) 1:1 http://www.biomedcentral.com/1471-2334/1/1
we may expect one of three possible outcomes: no out-
break, an outbreak possibly followed by few waves; or a
cholera outbreak followed by subsequent outbreaks that
may assume a persistent seasonal pattern. I call these,respectively, cholera-free; epidemic and endemic pat-
terns. What demographic, environmental and sociologi-
cal factors drive these outcomes? Studies suggest that the
number of susceptibles; exposure to untreated water and
sewage; and the presence of an aquatic reservoir of V.
cholerae are important factors [1] [3] [5]. How important
they are and how they interact with each other and with
other variables to drive cholera epidemiology, are open
questions.
Recently, it was found that toxigenic V. cholerae can sur-
vive in some aquatic environments for months to years,
in association with zooplankton and other aquatic organ-
isms [6]. Under stress, this pathogen assumes a viable
but not culturable state, becoming undetectable to tradi-
tional bacteriological techniques. These findings suggest
that the aquatic environment may be a reservoir of toxi-
genic V. cholerae in endemic regions. What is the role of
the aquatic reservoir in promoting epidemic and endem-
ic cholera? What regions are more likely to maintain en-
demic cholera? What are the best approaches to prevent
and control cholera outbreaks? What are the best predic-
tors of the fate of a community after the introduction of
cholera?
Here, I start to address these questions by proposing a
mathematical model that incorporates what are consid-
ered important determinants of cholera dynamics. De-
spite the great effort towards understanding choleradynamics, the mechanisms driving V. cholerae dynamics
in water is still poorly known. Thus, it is appropriate to
start a modeling exercise with a simple model (with few
variables) and then add complexity as needed. Following
this methodology, I started with a basic Susceptible-In-
fective-Recovered model coupled to an aquatic popula-
tion of V. cholerae. The objective is to explore the role of
the aquatic reservoir on the persistence of endemic chol-
era as well as to define minimum conditions for the de-
velopment of epidemic and endemic cholera.
Mathematical models are powerful tools for the develop-
ment of epidemiological theories [7]. They can synthe-
size the current empirical knowledge about the disease
into a coherent mechanistic framework. These models
may help us to infer causal relationships and to suggest
experimental designs to test alternative hypotheses.
This work is structured in three parts. First, the mathe-
matical model for epidemic and endemic cholera is pre-
sented. Secondly, the proposed model is applied to three
hypothetical communities to simulate cholera-free, epi-
demic and endemic situations. Thirdly, I consider possi-
ble causes of endemic oscillations. I finish this work
discussing insights brought from model analyses into
cholera dynamics.
Mathematical ModelThe model proposed here is an extension of Capasso's
model [8], used to describe the 1973's cholera epidemics
in Italy. In Capasso's version, two equations describe the
dynamics of infected people in the community and the
dynamics of the aquatic population of pathogenic bacte-
ria. In our formulation, the dynamics of the susceptible
population is included since I wish to study long term dy-
namics [7]. The mathematical model is:
Symbols are listed in Table 1 and a diagrammatic repre-
sentation of the model is shown in Figure 1. Equation 1a
describes the dynamics of susceptibles in a community of
Table 1: Symbols used in the model
Symbol Description
State VariablesS number of susceptiblesI number of infectedB concentration of toxigenic V. cholerae in water
(cells/ml)Parameters
H total human populationn Human birth and death rates (day-1)a rate of exposure to contaminated water (day-1)K concentration of V. cholerae in water that yields 50%
chance of catching cholera (cells/ml)r rate at which people recover from cholera (day-1)
nb growth rate of V. cholerae in the aquatic environ-ment (day-1)
mb loss rate of V. cholerae in the aquatic environment (day-1)
e contribution of each infected person to the popula-tion of V. choleraein the aquatic environment (cell/ml day-1 person-1)

BMC Infectious Diseases (2001) 1:1 http://www.biomedcentral.com/1471-2334/1/1
constant size H. Susceptible individuals are renewed at a
rate n. Renewal may occur as result of birth, immigration
and/or loss of acquired immunity (cholera apparently
does not confer life-long immunity). Susceptible people
becomes infected at a rate a λ (B), where a is the rate of
contact with untreated water and λ (B) is the probability
of such person to catch cholera. Probability of catching
cholera depends on the concentration of V. cholerae in
the consumed water. Experimental studies suggest thatit is necessary a heavy inoculum of V. cholerae in order
to develop cholera [9]. Here, this dependence is repre-
sented by a logistic dose response curve (Figure 2)
where K is the concentration of V. cholerae in water that
yields 50% chance of catching cholera. I assume that the
only route for infection is the ingestion of contaminated
water from non-treated sources.
Equation 1b describes the dynamics of infected people in
the community. This category includes not only cholera
cases but also those with asymptomatic and mild infec-
tions. In reality, only 1 to 30% of V. cholerae infections
actually develops into severe cholera cases [10]. By com-
bining all infection types into a single model compart-ment, I am assuming that they follow the same
dynamics, i.e., that the case-to-infection ratio remains
constant through the epidemics. This is reasonable if in-
fection virulence is strongly determined by host factors
(sensitivity to cholera toxin, blood type, etc) and bacteri-
al factors (biotype, etc), that are not expected to change
during the period of interest [11] [12] [13]. A potential
problem with this assumption is that inoculum size may
affect the case-to-infection ratio [14]. It is not clear, how-
ever, if inoculum size is directly related to virulence or if
it just increases the chance of intestine colonization.
Figure 1Model diagram (symbols are listed in table 1). All individuals in population H are born susceptible. Susceptible people (S)become infected as they are exposed to contaminated water (i.e., to B). Infected people recover at a rate r. Recovered popula-tion is not explicitly included but its size can be estimated by H-I-S (since total population is constant). While infected, individu-als contribute to the enhancement of bacterial population through excretion. Bacterial population in the aquatic reservoir (B)may also grow in the water at a rate determined by environmental factors (temperature, for example).

BMC Infectious Diseases (2001) 1:1 http://www.biomedcentral.com/1471-2334/1/1
Here, I assumed that inoculum size affects the per capita
infection rate (i.e., the probability of colonization), but
not the severity of symptoms. Equation 1b states that the
infected population increases as susceptibles become in-
fected (first term in the equation) and decreases as they
recover from the disease or die.
The third equation describes the dynamics of pathogenic
V. cholerae in the aquatic reservoir, in this case, the set
of untreated waters consumed by the population. Envi-
ronmental V. cholerae is found in ponds, wells, rivers,
estuaries and coast waters. These environments have
quite distinct physical, chemical and biological charac-
teristics and V. cholerae dynamics is probably controlled
by different factors in each of them. Classical studies on
the survival of culturable V. cholerae in aquatic environ-
ments suggest that V. cholerae cannot maintain a stable
population in the environment. Observed rates of popu-lation extinction in microcosms are variable, ranging
from 0.02 day-1 to >3 day-1 [15]. Islam [16], however,
showed that population decay does not necessarily imply
death, but also the transition towards a non-culturable
state. Using fluorescent antibody techniques, he found V.
cholerae surviving for more than 15 months within the
mucilagenous sheaths of a filamentous alga (extinction
rate <0.002). Here, equation 1c states that bacterial den-
sity in the water results from the balance between local
birth and death processes and the inflow of contaminat-
ed sewage. The parameter e defines the average contri-
bution of each infected person to the aquatic population
of V. cholerae.
At last, equations (2) specify the initial conditions (all in-
dividuals are initially susceptible).
Model predictionsThe model predicts three qualitative outcomes after the
introduction of few cholera infectives into a susceptible
population: cholera does not spread; epidemic choleraand endemic cholera. Here I describe each dynamics
separately and illustrate them using three hypothetical
communities, whose parameters are shown in Table 2.
Figure 2Dose-dependent infection rate.

BMC Infectious Diseases (2001) 1:1 http://www.biomedcentral.com/1471-2334/1/1
First case: cholera-free populationConsider a community that does not experience cholera
for generations. All individuals are susceptibles. There
are neither infective or immune individuals nor toxigenic
bacteria in the water.
Superscript * indicates equilibrium quantities. The first
question of interest is: What will happen to this commu-
nity if a small number of infectives comes in? Stability
analysis of equation system 1 (see 1additional material:
Appendix) indicates that if the number of susceptibles in
this population is greater than a critical number S C, an
outbreak will occur. Otherwise, the number of cases will
decrease and return to zero (Figure 3). This threshold is
given by:
The S c threshold increases proportionally to the barriers
to cholera infection (K), and recovery (r) as well as the
net mortality rate of V. cholerae in the water. It decreas-
es, on the other hand, as contamination of water supplies
as well as contact with these waters increase. In other
words, the better water quality and sewage treatment
are, the greater must be the pool of susceptibles in order
to trigger a cholera outbreak.
Rearranging equation 5, we find the maximum degree of
contamination each infected person may cause to the wa-
ter reservoir without causing public health hazards:
Asymptomatic cases of V. cholerae infection yield 102-
105 V. cholerae per gram of feces [15]. In severe cases,
yield increases to 106-109 cells/ml of rice-water stool
[15]. If we know the proportion of infections that are
asymptomatic, mild and severe, we could obtain a rough
estimation of e as
Consider a hypothetical community with 10,000 mem-bers sharing the same water source. Suppose that the wa-
ter reservoir is directly contaminated with sewage. If a =
1, cholera outbreak in this community will develop only
if individual contribution to water contamination ex-
ceeds ca. 7 cells/ml day-1. Now, consider that each infect-
ed person yields 1 × 10⁴ cells person-1 day-1. This water
will remain infective unless it is diluted to a value less
than 7 cells/ml. Such dilution requires 4 × 10⁴/7 = ca.
5700 liters of water per infected person per day.
A real pond, however, is not perfectly mixed as this mod-
el assumes. If water used for consumption is taken from
a point close to the excretion site, the risk of acquiring
the infection will be higher even if the pond is large.
Moreover, V. cholerae is found associated to phytoplank-
ton, macrophyte, zooplankton, crustacea and other
aquatic organisms. On the surface of these organisms,
density of bacteria may be 100 to 1000 times greater
than in the aquatic medium. These organisms are not
evenly distributed within the water body. Phytoplankton
tends to concentrate on the water surface, zooplankton
migrates along the water column on a daily basis. If wa-
ter is taken from phyto- or zooplankton-rich patches,
risk of catching cholera will increase, enhancing the
probability of triggering an outbreak in the community.
This model is too simple to provide quantitative predic-
tions on cholera dynamics. Nevertheless, its qualitative
results verifies known alternative approaches to the pre-
vention of cholera outbreaks:
1. Minimize water contamination as well as consumption
of untreated waters: This is the classical approach to
cholera control. Good sanitation reduces the parameter e
and water treatment reduces parameter a. The smaller
these parameters are, the larger must be the susceptible
pool in order to a cholera outbreak to develop (equation
5).
Table 2: Parameters for three hypothetical communities.
Parameters Community 1 Community 2 Community 3
Expected cholera dynamics
cholera-free epidemic endemic
H 10,000 10,000 10,000n 0.0001 0.0001 0.001a 0.5 1 1K 1 × 10⁶ 1 × 10⁶ 1 × 10⁶r 0.2 0.2 0.2
nb-mb -0.33 -0.33 -0.33e 10 10 10
SC 13200 6600 6600
BMC Infectious Diseases (2001) 1:1 http://www.biomedcentral.com/1471-2334/1/1
2. Dilute cholera diarrhea with large amounts of water tomake water uninfective.
Second case: Epidemic choleraNow, consider a community whose susceptible pool ex-
ceeds the threshold S C. The introduction of infectives
into this community will trigger a cholera outbreak. Fig-
ure 4 shows the dynamics of infectives, susceptibles and
bacteria in community 2 (Table 2) after the introduction
of a few infectives. Cholera outbreak follows a traditional
epidemiological curve. The initial reproduction rate of
the disease is positively affected by the degree of contam-
ination of the water supply (e) as well as the frequency of
contact with these waters (a):
Together with the outbreak curve, we observe a bacterial
bloom in the water. Since growth rate is negative, bacte-
rial population will eventually decline when the suscepti-
ble pool decreases below the critical size S C (Figure 4b).
From this point on, bacterial extinction rate exceeds hu-
man excretion and the environmental V. cholerae popu-
lation eventually goes extinct. Community 2, then,
returns to the cholera-free steady state.
Figure 3Effect of e (mean contribution of each individual to water contamination) on the threshold population size S C (equation 5).Curve a = 0.5 uses parameters from community 1; curve a = 1 uses parameters from communities 2 and 3 (table 2). Eachcurve defines values of e and S C at which R0 = 1 (see 1additional material: Appendix). A community located above its curvewill suffer an outbreak following the introduction of infectives. A community located below its curve, will not. The three hypo-thetical communities occupy the same position in this graph as they share the same initial susceptible pool size and degree ofwater contamination. However, community 1 does not suffer a cholera outbreak because the lower contact with contaminatedwater (a = 0.5) shifts its threshold curve outwards. Communities 2 and 3 are located above their threshold curve (a = 1); theintroduction of infectives will trigger an outbreak.

BMC Infectious Diseases (2001) 1:1 http://www.biomedcentral.com/1471-2334/1/1
Third case: Endemic choleraConsider our hypothetical community 3 (Table 2). Its pa-
rameters are identical to those set for community 2, ex-
cept that n is greater. Since S 0 > S C, the introduction of
infectives in community 3 starts a cholera outbreak. In
this case, however, cholera does not vanish after the first
peak. It actually returns in successive waves and eventu-
ally converges to a positive endemic equilibrium (Figure
5). Setting the derivatives of equation system 1 to zero
and solving it algebraically, we obtain the endemic equi-
librium:
The equilibrium number of infected individuals in the
population is a fraction φ of the surplus population (H-S
C), where φ is
Fraction φ increases as the susceptible turnover rate n in-
creases and tends to a at large values of n. This fraction
is a function of human parameters, only.
Although in theory any community with S 0 > S C and n
> 0 is expected to become endemic, this is not likely to
occur in practice. To maintain an endemic state, I* must
be much greater than 1, otherwise infection will fade-out
due to stochastic processes [7].
Figure 4Simulation of a cholera outbreak in Community 2 (numerical solution of equation system 1 with parameters from table 2). Thesimulation starts with 10,000 susceptibles. The arrival of an infected individual triggers an outbreak. Bacterial density in thewater (dashed black line) increases as result of human excretion. The epidemic curve (red solid line) starts to decline when thenumber of susceptibles crosses down the threshold line Sc.

BMC Infectious Diseases (2001) 1:1 http://www.biomedcentral.com/1471-2334/1/1
Stability analysis (see 1additional material: Appendix)
indicate that the endemic equilibrium is stable to smallperturbations if S C > S 0 and mb > nb. The route to the
endemic equilibrium involves dumped oscillations (Fig-
ure 5). Cholera waves arise when the susceptible popula-
tion grows above the threshold S C, triggering a new
outbreak. Eventually, the number of infectives stabilizes
into a fixed fraction of the population. Bacterial dynam-
ics in the water is also oscillatory and follows the human
excretion pattern.
In summary, our model predicts that cholera outbreaks
should occur in communities whose susceptible pool is
greater than the susceptible threshold (S C). The magni-
tude of the threshold depends on a combination of envi-
ronmental, sociological and strain-specific factors. The
environmental reservoir reduces the susceptible thresh-
old. In the presence of a permanent reservoir of V. chol-
erae (nb tending to mb), the threshold tend to zero, and
community of any size in contact with the reservoir
should be subject to an outbreak.
Environmental triggers of cholera outbreaksIn endemic regions, cholera outbreaks are often associat-ed to climatic events [17]. In some parts of Africa, out-
breaks occur during the dry season or right after heavy
rainfalls [4][18]. In the Americas, disasters caused by the
El Niño preceded large cholera outbreaks [19]. In Bang-
ladesh, cholera season coincides with the post-monsoon
period [3]. Flooding and drought are likely to affect chol-
era dynamics in a complex way. Flooding of streets and
cities washes contaminated feces and sewage into the
rivers. It may also disrupt water distribution service and
aggravate hygiene conditions [18]. Drought, on the other
hand, reduces the availability of potable water; aggra-
vates hygiene conditions; increases the number of people
sharing the same water supply; and may increase per
capita water contamination. All these factors contribute
to a greater rate of contact with unsafe waters (parameter
a) and increased (floods) or reduced (floods or droughts)
dilution of the per capita bacterial yield (parameter e).
Figure 5Simulation of cholera dynamics in the hypothetical community 3, using parameters from table 2. The fast turnover of suscepti-bles allows cholera to persist. After the initial outbreak (not shown, but similar to figure 4), cholera prevalence oscillates untilit reaches a steady-state. Oscillations are triggered when the number of susceptibles exceed the Sc threshold (dashed line).

BMC Infectious Diseases (2001) 1:1 http://www.biomedcentral.com/1471-2334/1/1
Besides weather changes, seasonal variations of water
temperature has been also associated to cholera out-
breaks. Cholera outbreaks in Peru [20] and Bangladesh
[21] are preceded by periods of warm waters, duringwhich toxigenic V. cholerae is detected in the environ-
ment. Colwell [21] explains this pattern by an association
between zooplankton seasonal growth (that generally
peaks during the warm season) and V. cholerae dynam-
ics.
Floods, droughts, temperature and biotic interactions
have potentially quite different impacts on cholera sea-
sonality. To untangle the potential roles of these factors,
I conducted a series of simulations of equation system 1
where the following parameters are assumed to vary sea-
sonally: 1) the contact rate with contaminated water
(simulating seasonal variations in water quality); 2) the
per capita excretion rate (simulating seasonal variations
in per capita water contamination); 3) the growth rate of
V. cholerae (simulating seasonal variations in autoch-
tonous V. cholerae abundance in the water). In all simu-
lations, a sine function with period equal to 365 days was
used to simulate the seasonal oscillations.
Scenario 1. Seasonal oscillation of the contact rate (a)Here, I substituted the parameter a in equation 1 by the
sin function:
The forced equation system was numerically solved (us-
ing the software ModelMaker) using parameters for the
hypothetical community 3 (Table 2). To test the sensitiv-
ity of the obtained results to parameter change, I alsocarried out a sensitivity analysis where the model was
simulated 42 times, keeping all parameters at their de-
fault values (Table 2) and changing only one (Table 3).
All 42 simulations resulted in periodic dynamics with an
annual peak of cholera (Figure 6). In general, peaks
tended to occur earlier in larger populations with high
water contamination. Low values of K and long bacterialresidence time also contributed to the early onset of chol-
era outbreak. In most simulations (except those with the
minimal values of e, H, and n), cholera outbreak was fol-
lowed by a period of variable length during which infec-
tion incidence remained ca. constant. This "plateau"
eventually vanished and a period with no human infec-
tion was noted until the next annual outbreak. Figure 6
shows the effect of population size on the infection dy-
namics. The greater the population size (H) or the sus-
ceptible turnover rate (n), the shorter is the period
without any infection.
Scenario 2. Seasonal oscillation of the per capita contam-ination rate (e)In this scenario, the parameter e in equation system 1
was replaced by the periodic function:
Simulations were performed using the same parameter
values listed for the first scenario (now a is constant).
Seasonal variation of e forces an annual outbreak whose
peak occurs from 3 months earlier up to one month later
the e(t) peak. The greater the population size and the sus-
ceptible turnover rate are, the earlier the outbreak starts.
Low a and low e are the main factors delaying the cholera
onset. A period with no infections precedes each annual
big outbreak (Figure 7).
A prevalence "plateau" often follows the annual choleraoutbreak. The dynamics is very similar to that observed
for the scenario 1. For some parameter combinations,
however, this plateau rises to form a second outbreak of
minor intensity. Conditions favoring the occurrence of
this second peak include high K, high extinction rate and
fast recover rate.
Scenario 3. Seasonal oscillation of V. cholerae extinction rate (nb-mb)In this last scenario, the term netnb = (nb-mb) in equa-
tion system 1 was replaced by the periodic function:
The goal is to simulate, in a phenomenological way, theseasonal variation of V. cholerae abundance in the envi-
ronment due to autochtonous growth. Seasonal growth
of V. cholerae in the environment has been linked to fac-
tors as temperature, copepod abundance and chloro-
Table 3: Parameter values used in the sensitivity analysis.
Parameters Values
H 1,000; 20,000; 40,000; 60,000; 80,000; 100,000n 0.0001; 0.002; 0.004; 0.006; 0.008; 0.01a 0.1; 0.2; 0.4;.0.6; 0.8; 1K 1,000; 20,000; 40,000; 60,000; 80,000; 100,000r 0.02; 0.05; 0.09; 0.13; 0.16; 0.2
nb-mb -0.02; -0.13; -0.25; -0.37; -0.48; -0.6e 1; 20; 40; 60; 80; 100

BMC Infectious Diseases (2001) 1:1 http://www.biomedcentral.com/1471-2334/1/1
phyll. However, the mechanistic relationships between
these variables are still not clearly defined and I opted for
not including them explicitly in the model.
Forty-two simulations were again performed. All simula-
tions showed annual outbreaks of V. cholerae infection 2
to 4 months after the onset of V. cholerae growth in the
water. Small populations, and low rate of contact with
contaminated water helped to delay cholera outbreak.
Differently from the previous two scenarios, the number
of infected people never dropped to zero in large popula-
tions (Figure 8).
DiscussionIn the last decades, attention to cholera epidemiology in-
creased, as cholera epidemics became a worldwide
health problem. Detailed investigation of V. cholerae in-
teractions with its host and with other organisms in the
environment suggests that cholera dynamics is much
more complex than it was previously thought. We know
now that cholera toxin is codified by a lisogenic phage
that can be transferred horizontally between bacteria
[22][23]. We also know that V. cholerae can survive in
the water for a long time, assuming a non-culturable
form, living in association with aquatic organisms. These
findings increase the complexity of the cholera system,
that passes from a two-factor system (human - patho-
gen) to a three or four factor system (virus-bacteria-
aquatic organisms-humans?). Despite the great effort to-
wards understanding cholera dynamics, we are still
scratching the surface of this problem. Most studies as-
sociating cholera dynamics to environmental events are
based on correlations. The causal mechanisms behind
these correlations are still poorly understood. Unfortu-
nately, many experimental studies performed in the
past, on the tolerance and survival of V. cholerae in the
Figure 6Simulation of a community that experiences seasonal contact with contaminated waters (due to periodic flooding, for exam-ple). Periodic fluctuation of the contact rate causes oscillations in the number of infections. During the low contact period, noinfections occur. As contact increases (due to rising waters in a flooding area, for example), the probability of catching choleraincreases. Outbreaks tend to occur sooner in larger populations. Dot-dashed line shows the number of infections in a popula-tion with 1,000 individuals, dashed line in a 5,500 population and dotted line in a 100,000 population. In large populations, theseasonal outbreak may be followed by a period with relatively constant incidence as contact rate continues high.

BMC Infectious Diseases (2001) 1:1 http://www.biomedcentral.com/1471-2334/1/1
environment (important for the establishment of causal
relationships), may be misleading because they used
bacteriological techniques for detecting V. cholerae.These findings may require further considerations on the
light of the existence of unculturable forms of V. choler-
ae.
Experimental effort towards understanding cholera epi-
demiology has been accompanied by a theoretical effort.
Authors have proposed new conceptual models of chol-
era epidemiology where the aquatic environment has an
important role on the emergence of new strains of toxi-
genic V. cholerae [3] and on the seasonality of cholera
outbreaks [5] [6].
The model introduced here is based on a previous chol-
era model [8], modified to incorporate an environmental
reservoir. We still know very little about the dynamics of
V. cholerae in the environment. Consequently, I opted
for modeling the population dynamics of V. cholerae in
the water in the simplest way possible, i.e., with density
independent growth and death rates. This model is quiteabstract but provides some insights about the role of an
environmental reservoir on cholera epidemiology.
According to the model, a permanent environmental res-
ervoir of toxigenic V. cholerae (mb = nb) should increase
R0 towards infinity (equation 8). It means that any sus-
ceptible human population exposed to this water would
be prone to cholera outbreaks. The magnitude of the
problem, in terms of public health, would vary according
to the probability of secondary transmission. In a com-
munity with good sanitation, cholera would show up as
occasional primary cases without secondary transmis-
sion. In poor communities, on the other hand, endemism
would result from the close contact between susceptibles
and the source of contamination. An infinite R0 is an
overestimation of this simplistic deterministic model.
Figure 7Dynamics of infection in a hypothetical population with 1,000; 5,500 and 100,000 individuals under seasonal variation of thewater contamination rate (due to water shortage, for example). Symbols are the same as figure 6. Seasonal decay of waterquality triggers periodic outbreaks that are followed by a period of approximately constant prevalence.

BMC Infectious Diseases (2001) 1:1 http://www.biomedcentral.com/1471-2334/1/1
The probability of caching a V. cholerae infection is dose-
dependent. It is likely a minimal reservoir should be re-quired for the occurrence of cholera cases in the popula-
tion.
Endemic cholera, however, can be maintained even in
the absence of a permanent reservoir (mb > nb). This is
a less obvious result. Endemism is maintained if bacteria
net loss rate (mb-nb) is sufficiently low to maintain an
aquatic population of V. cholerae until the susceptible
pool crosses the threshold S C again. However, the best
the sanitation condition (low a and e), the longer-lived
the reservoir must be. On the other hand, the worse the
sanitation (high a and e), the shorter can be the bacterial
residence time in the water. In the limit, we may say that
endemism in sanitized communities requires a perma-
nent reservoir while endemism in poor communities re-
quires just transient reservoirs (and a sufficiently high
turnover of susceptibles).
This result suggests that cholera endemism in the US
Golf Coast, for example, may be due to a permanent res-ervoir of V. cholerae. In some African regions, on the
other hand, poor conditions may maintain endemism
even in the absence of an environmental reservoir [4]
[24].
In some cholera endemic regions, outbreaks are periodic
with one or two peaks per year. Seasonal floods and
droughts cause periodic variations in contact and con-
tamination rates. If such variations are strong enough to
cause large variations of R0, we will note the occurrence
of periodic outbreaks. Cholera outbreaks will be trig-
gered when contact and/or contamination rates bring
the R0 above the unity threshold. This effect of contact
rate variations on cholera dynamics was clearly observed
in the Brazilian Amazon Region, during the 1990's. This
region is characterized by seasonal flooding of the Ama-
zon and Negro Rivers. Annual variations of water level
Figure 8Dynamics of infection in a population with 1,000; 5,500 and 100,000 individuals in contact with a environmental reservoir oftoxigenic V. cholerae. In this reservoir, growth rate of V. cholerae oscillates due to variations in water temperature, for example.Line symbols are the same of figure 6. As in figures 6 and 7, seasonal growth of V. cholerae in the environment also triggers sea-sonal outbreaks of cholera.
BMC Infectious Diseases (2001) 1:1 http://www.biomedcentral.com/1471-2334/1/1
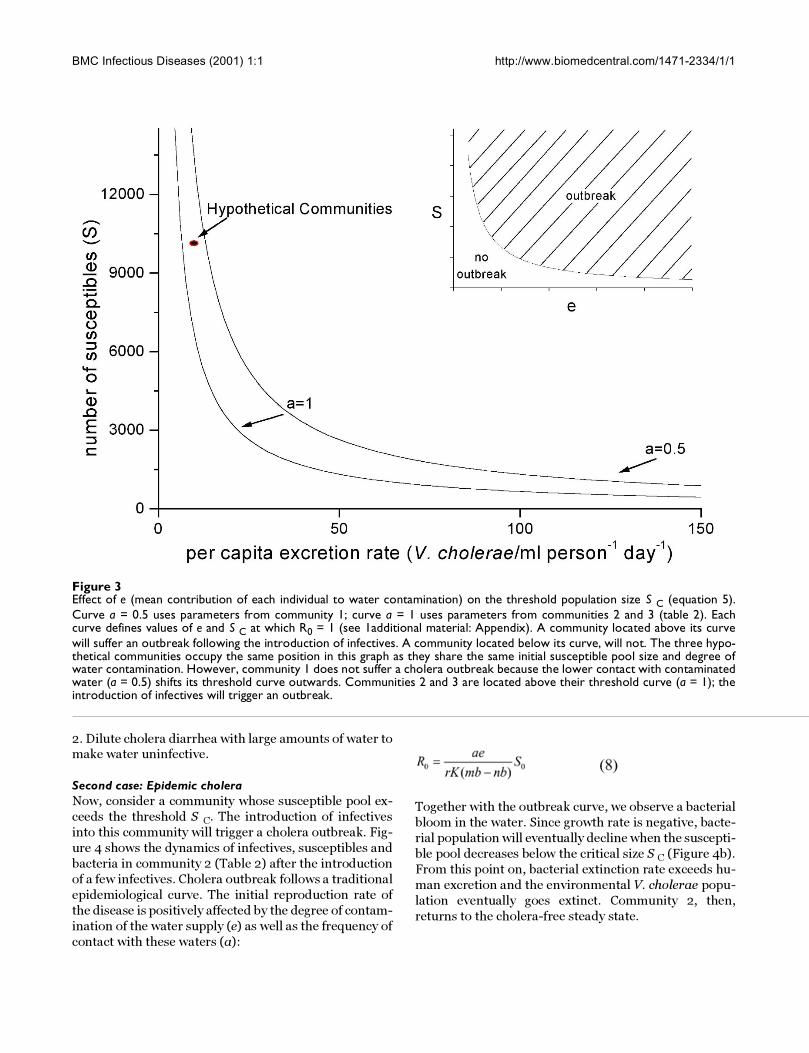
are quite high (ca. 8- 11 meters in Manaus) with slow ris-
ing and falling waters mainly driven by the slow snow
melt in the Amazon River Andean headwaters [25]. The
current cholera pandemics arrived in this region in 1991,
caused outbreaks of marked periodicity (Figure 9). Chol-
era outbreaks started during the dry season where water
is at the lowest level. During this period, potable water is
often scarce and risk of contamination is high (high e;
high a). Cholera peak coincides with the beginning of the
rising waters. From this point on, cholera cases decrease
until reaching its lowest levels during the high water pe-
riod. This pattern is consistent with periodic variation of
either e or a (Figures 6 and 7).
ConclusionThis work is an effort towards the formulation of a chol-era theory that incorporates a V. cholerae environmental
reservoir. The model proposed is very simple and does
not include many features of this complex system. None-
theless, this study brings some new insights into cholera
epidemiology. Most studies on cholera epidemiology
concentrate on either social or environmental factors.
This work, however, shows that the reproduction rate of
cholera is a function of social and environmental factors.
It is necessary to determine the relative weights of each
one of these components in order to develop appropriate
control strategies.
Further developments on cholera modeling require a
better understanding of V. cholerae ecology and epide-
miology. We need estimates of the prevalence of V. chol-
erae infection in endemic populations. We also need
better estimates of the required infection dose as well as
a better description of the relationship between dose and
virulence.
Figure 9Periodicity of reported cases of cholera in the Brazilian Central Amazon region. This region is characterized by seasonal flood-ing of the Negro and Amazon Rivers, driven mainly by snow melt in the Andean headwaters of the Amazon River.

BMC Infectious Diseases (2001) 1:1 http://www.biomedcentral.com/1471-2334/1/1
AcknowledgmentsI would like to thank Dr. Bradley Sack and Dr. Russek-Cohen for providing critiques of this manuscript. Support was provided by FAPERJ, FINEP and PRONEX.
References1. Epstein PR: Algal blooms in the spread and persistence of chol-
era. Biosystems 1993, 31:209-2212. Islam MS, Miah MA, Hasan MK, Sack RB, Albert MJ: Detection of
non-culturable Vibrio cholerae O1 associated with a cyano-bacterium from an aquatic environment in Bangladesh.Transactions of the Royal Society of Tropical Medicine and Hygiene 1994,88:298-299
3. Faruque SM, Albert MJ, Mekalanos JJ: Epidemiology, genetics andecology of toxigenic Vibrio cholerae. Microbiology and MolecularBiology Reviews 1998, 62:1301-1314
4. Morillon M, De Pina JJ, Husser JA, Baundet JM, Bertherat E, Martet G:Djibouti, histoire de deux épidémies de choléra: 1993-1994.Bull Soc Path Ex 1998, 91:407-411
5. Islam MS, Drasar B, Bradley SR: Probable role of blue-green algaein maintaining endemicity and seasonality of cholera inBangladesh: a hypothesis. J Diarrhoeal Dis Res 1994, 12:245-256
6. Colwell RR, Huq A: Environmental reservoir of Vibrio choler-ae, the causative agent of cholera. Annals of the New York Acade-my Society 1994, 740:44-54
7. Anderson RM, May RM: Infectious diseases of humans. Oxford:Oxford University Press; 1991,
8. Capasso V, Paveri-Fontana SL: A mathematical model for the1973 cholera epidemic in the european mediterranean re-gion. Rev Epidém et Santé Pub 1979, 27:121-132
9. Sengupta TK, Nandy RK, Mukhopadyay S, Hall RH, Sathyamoorthy V,Ghose AC: Characterization of a 20-k Da pilus protein ex-pressed by a diarrheogenic strain of non-O1/non-O139 Vi-brio cholerae. FEMS Microbiol. Letters 1998, 160:183-189
10. Sack DA, Cadoz M: Cholera vaccines In Plotkin AS, Orenstein WA.Vaccines. Philadelphia: WB Saunders Co; 1999,
11. Sack FH, Pierce NF, Hennessey KN: Gastric acid in cholera andnon-cholera diarrhea. Bulletin of the World Heath Organization 1972,47:31-36
12. Clemens JD, Sack DA, Harris JR: ABO blood groups and cholera:new observations on specificity of risk and modification ofvaccine efficacy. The Journal of Infectious Diseases 1989, 159:770-773
13. Glass RI, Holmgren J, Haley CE: Predisposition for cholera of in-dividuals with O blood group. Possible evolutionary signifi-cance. Am J Epidemiol 1985, 121:791-796
14. Hornick RB, Music SI, Wenzel RP, Cash RA, Libonati JP, Snyder MJ, etal: The Broad Street pump revisited: response of volunteersto ingested cholera vibrios. Bulletin of the New York Academy ofMedicine 1971, 47:1181-1191
15. Feachem R, Bradley DJ, Garelick H, Mara DD: Vibrio cholerae andcholera. In Sanitation and disease. Health aspects of excreta and waste-water menagement. John Wiley & Sons; 1983, 297-325
16. Islam MS, Drasar B, Bradley DJ: Survival of toxigenic Vibrio chol-erae 01 on a duckweed, Lemna minor. Transactions of the RoyalSociety of Tropical Medicine and Hygiene 1990, 84:422-424
17. Lobitz B, Beck L, Huq B, Wood B, Fuchs G, Faruque SM, et al: Cli-mate and infectious diseases: use of remote sensing for de-tection of Vibrio cholerae by indirect measurement.Proceedings of the National Academic Society USA 2000, 97:1438-1443
18. Lawoyin TO, Ogunbodede NA, Olumide EAA, Onadeko MO: Out-break of cholera in Ibadan, Nigeria. European Journal of Epidemi-ology 1999, 15:367-370
19. WHO: Cholera in 1998. Weekly Epidemiological Recort 1999,74:257-263
20. Franco AA, Fix AD, Prada A, Paredes E, Palomino JC, Wright AC,Johnson JÁ, McCarter R, Guerra H, Morris JG Jr: Cholera in Lima,Peru, correlates with prior isolation of Vibrio cholerae fromthe environment. Am J Epidemiol 1997, 148:1067-1075
21. Colwell R: Global climate and infectious disease: the choleraparadigm. Science 1996, 274:2025-
22. Levin BR, Tauxe R: Cholera: nice bacteria and bad viruses. Cur-rent Biology 1996, 6:1389-1391
23. Taylor RK: Virus on virus infects bacterium. Nature 1999,399:312-313
24. Utsalo SJ, Eko FO, Umoh F, Asindi AA: Faecal excretion of Vibriocholerae during convalescence of cholera patients in Cala-bar, Nigeria. European Journal of Epidemiology 1999, 15:379-381
25. Walker I: Amazonian streams and small rivers. In Limnology inBrazil. Edited by Tundisi JG, Bicudo CEM, Tundisi TM. Rio de Janeiro: ABC/SBL; 1995, 167-194
26. Nisbet RM, Gurney WSC: Modelling fluctuating populations.New York: John Wiley & Sons; 1982,
Pre-publication historyThe pre-publication history for this paper can be ac-
cessed here:
http://www.biomedcentral.com/content/backmatter/
1471-2334-1-1-b1.pdf
Appendix
Stability analysis.
[http://www.biomedcentral.com/content/supplementary/1471-2334-1-1-s1.doc]
Publish with BioMedcentral and every scientist can read your work free of charge
"BioMedcentral will be the most significant development for disseminating the results of biomedical research in our lifetime."
Paul Nurse, Director-General, Imperial Cancer Research Fund
Publish with BMc and your research papers will be:
available free of charge to the entire biomedical community
peer reviewed and published immediately upon acceptance
cited in PubMed and archived on PubMed Central
yours - you keep the copyright
[email protected] your manuscript here:http://www.biomedcentral.com/manuscript/
BioMedcentral.comBioMedcentral.com
http://www.ncbi.nlm.nih.gov/entrez/query.fcgi?cmd=Retrieve&db=PubMed&dopt=Abstract&list_uids=8155853
http://www.ncbi.nlm.nih.gov/entrez/query.fcgi?cmd=Retrieve&db=PubMed&dopt=Abstract&list_uids=7974666
http://www.ncbi.nlm.nih.gov/entrez/query.fcgi?cmd=Retrieve&db=PubMed&dopt=Abstract&list_uids=9841673
http://www.ncbi.nlm.nih.gov/entrez/query.fcgi?cmd=Retrieve&db=PubMed&dopt=Abstract&list_uids=7751564
http://www.ncbi.nlm.nih.gov/entrez/query.fcgi?cmd=Retrieve&db=PubMed&dopt=Abstract&list_uids=2647864
http://www.ncbi.nlm.nih.gov/entrez/query.fcgi?cmd=Retrieve&db=PubMed&dopt=Abstract&list_uids=4014172
http://www.ncbi.nlm.nih.gov/entrez/query.fcgi?cmd=Retrieve&db=PubMed&dopt=Abstract&list_uids=5286453
http://www.ncbi.nlm.nih.gov/entrez/query.fcgi?cmd=Retrieve&db=PubMed&dopt=Abstract&list_uids=2260179
http://www.ncbi.nlm.nih.gov/entrez/query.fcgi?cmd=Retrieve&db=PubMed&dopt=Abstract&list_uids=8953025