Modeling Cholera Dynamics with a Control Strategy in Ghana
12
British Journal of Research www.britishjr.org British Journal of Research www.britishjr.org Original Article Modeling Cholera Dynamics with a Control Strategy in Ghana Emmanuel Appoh Andam 1 , Lawrence Obiri – Apraku 2 , Wallace Agyei1 3 and William Obeng – Denteh* 4 1 Department of Mathematics Education, University of Education, Winneba, Ghana 2 Boakye-Tromo Senior High School, Duayaw- Nkwanta, B/A, Ghana 3 Tweneboa Kodua Senior High School, Kumawu Ashanti, Ghana 4 Department of Mathematics, Kwame Nkrumah University of Science and Technology, Kumasi, Ghana *Corresponding author e-mail: [email protected] A B S T R A C T In this work, we present and analyze amathematical epidemiological model for Vibrio cholerae (Cholera) with an incorporated control strategy. Cholera is regarded generally as a disease of the poor and it affects areas that lack access to safe drinking water and sense of hygiene. An epidemiological mathematical model for the transmission dynamics of cholera, with control strategies is formulated in this paper. The epidemiological model formulated is designed into compartments which lead to a system of differential equations for the transmission dynamics of cholera with a control strategy of water treatment being proposed. It was assumed in the model that cholera in contracted when an individual comes into contact and ingest contaminated water. The equilibrium points of the model are found and their stability is investigated. The results showed that the disease free equilibrium is locally asymptotically stable under suggested conditions on the parameters given in the model (i.e. cholera can be eradicated under such conditions in time bound). It was then concluded from the results that treatment of water is an effective method of controlling and eradicating cholera as well as public education on the disease. The numerical simulations and graphical solutions of the differential equations were carried out with Matlab application software. Keywords: Mathematical model, Cholera, Control strategy, Epidemic, Differential equations, Numerical simulation. INTRODUCTION Dynamics of a disease are a result of the interactions of complex systems in complicated ways. The epidemiological experiments can be difficult and expensive
Transcript of Modeling Cholera Dynamics with a Control Strategy in Ghana
British Journal of Research
www.britishjr.org
British Journal of Research www.britishjr.org
Original Article
Modeling Cholera Dynamics with a Control Strategy in Ghana
Emmanuel Appoh Andam1, Lawrence Obiri – Apraku2, Wallace Agyei13 and William Obeng – Denteh*4
1Department of Mathematics Education, University of Education, Winneba, Ghana
2Boakye-Tromo Senior High School, Duayaw- Nkwanta, B/A, Ghana 3Tweneboa Kodua Senior High School, Kumawu Ashanti, Ghana
4Department of Mathematics, Kwame Nkrumah University of Science and Technology, Kumasi, Ghana
*Corresponding author e-mail: [email protected]
A B S T R A C T
In this work, we present and analyze amathematical epidemiological model for Vibrio cholerae (Cholera) with an incorporated control strategy. Cholera is regarded generally as a disease of the poor and it affects areas that lack access to safe drinking water and sense of hygiene. An epidemiological mathematical model for the transmission dynamics of cholera, with control strategies is formulated in this paper. The epidemiological model formulated is designed into compartments which lead to a system of differential equations for the transmission dynamics of cholera with a control strategy of water treatment being proposed. It was assumed in the model that cholera in contracted when an individual comes into contact and ingest contaminated water. The equilibrium points of the model are found and their stability is investigated. The results showed that the disease free equilibrium is locally asymptotically stable under suggested conditions on the parameters given in the model (i.e. cholera can be eradicated under such conditions in time bound). It was then concluded from the results that treatment of water is an effective method of controlling and eradicating cholera as well as public education on the disease. The numerical simulations and graphical solutions of the differential equations were carried out with Matlab application software.
Keywords: Mathematical model, Cholera, Control strategy, Epidemic, Differential equations, Numerical simulation.
INTRODUCTION
Dynamics of a disease are a result of the interactions of complex systems in
complicated ways. The epidemiological experiments can be difficult and expensive
Denteh et al__________________________________________________ ISSN: 2394-3718
BJR[2][1][2015] 030-041
though, mathematical modeling is an important tool for the understanding of their complex dynamics1,2. Mathematical modeling enables us to characterize the general and specific behavior of these systems analytically and to understand which aspects contribute the most to the observed dynamics as well as making policy decisions for preventive measures and control strategies.
The application of differential equations in the transmission dynamics of infectious diseases have been extensively used in several papers3-8. The analysis of these models predicted and suggested several control strategies for the control and eradication of the infections (diseases). Some the control strategies being suggested were early detection and reporting, vaccination and mass immunization, therapeutic treatment and good sanitation practices. It is therefore important that adequate attention is paid to stopping the spread of such diseases by using effective control strategies and measures.
Many infectious diseases are as a direct result of poor hygienic conditions and contact between an infectious person and a susceptible person. Cholera, according to reference9, has been a persistent epidemic and continues to be a global world health issue. Despite the studies of this disease for over one hundred years, it is estimated that approximately 120,000 people die from cholera annually9.
Studies have attributed utmost environmental issues for the ability of the disease to desolate communities and households. Cholera is an infectious disease of which it outbreak leads to the death of millions of individuals. The outbreak of Cholera present a serious public health burden in the affected regions as enormous amount of money is needed to control and eradicate it, and this have sparked computational modeling efforts to forecast
the dynamics of ongoing outbreaks, assess and predict intervention strategies10-14.
According to15, Cholera is an acute intestinal infectious disease caused by the bacterium Vibrio cholerae characterized by extreme diarrhea and vomiting. It is deadly water – borne disease which usually results from poor hygienic conditions and sanitation and untreated water. The human body is dehydrated and prevented from absorbing liquids and this is caused by toxins produced by the Cholera bacteria, Vibrio cholerae. Contaminated drinking water and food are the channels through which the bacteria are transmitted. Individuals who are not treated may die from severe dehydration two or three hours of the infection and this is due to the relatively short incubation period of the disease (usually two to five hours), which will eventually result into an outbreak if it is not controlled and eradicated.
Reference9 ascertained that, increasing the protection against the disease can be gained by improving sanitation and hygiene. Though it is life threatening, controlling and prevention is achieved if proper sanitation practices are followed. Most cases of cholera currently occur in developing countries such as Peru, Bangladesh, India and some of the coastal regions of South America recent cholera outbreaks. Recent cholera outbreaks in Haiti (2010–2011), Nigeria (2010), Kenya (2010), Vietnam (2009), Zimbabwe (2008–2009), etc., continue leading to a large number of infections and receiving worldwide attention16,17.
Currently, Ghana is faced with prevalent cases of cholera infections, especially in the capital Accra and it surroundings, thereby it being declared a health emergency and an outbreak. Records available at the Ghana Health Service18 have hit a record high in the regions, with most health centres in the various regions recording about 300 cases daily and a
Denteh et al__________________________________________________ ISSN: 2394-3718
BJR[2][1][2015] 030-041
weekly tally of about 1000 cases. Earlier commemoration has it that, there were 823 cases in 2008 with no deaths; 431 recorded in 2009 with 12 deaths; 2010 had no death from a record of seven cases; there were over 9000 cases with 72 deaths in 2011; in 2012, there was close to 7,000 cases with 48 deaths recorded; no deaths were recorded in 2013 out of 22 cases.2014 has at least 6,179 reported cholera cases and these figures are rising by the day, with a total of over 67 deaths and this has called for it being declared an outbreak.
According to reference19, transmission dynamics of cholera involve multiple interactions between human host, the pathogen, and the environment. In an attempt to gain deeper understanding of the dynamics of cholera, several mathematics models have been established20-26. Reference27 is of the view that, mathematical modeling provides a unique approach to gain basic knowledge in cholera dynamics13. Effective prevention, prevention and control strategies have been designed based on this knowledge and the assumptions, variables and parameters are clarified in the formulation of the mathematical model. These results can help health workers understand and predict the spread of an epidemic and evaluate potential effectiveness of the different control measures to be used.
There have been a number of studies on mathematical models of cholera transmission, but actual modeling of cholera transmission was started by28, they studied the cholera epidemic which occurred in the Mediterranean in 1973, with the proposal of a simple deterministic model. Following this, there were several studies, which primarily focused on different control strategies. Reference29 formulated a SIR compartmental transmission model which divided the population as susceptible, infected and infectious, to the other
individuals. Recovered or otherwise were removed from risk to further infection. Their assumption was that cholera could be transmitted through either contaminated water or close contact with the infective but that water borne transmission was a far more important method of transmission. They added a water compartment to the model.
Other models such as that of21, is of a more general form which took into consideration, the infectious stages for the transmission of Vibrio Cholerae. The model comprised five equations which described the dynamics of a susceptible, infectious and removed human population and the dynamics of a hyper infective state and lower infective states of Vibrio cholerae population and also assumed that the total population N, is constant with a constant birth and death rate.
Ref12 formulated a model which had human – to – human factor incorporated into the model. The basic reproductive number (R0) for 2008 – 2009 cholera outbreaks in Zimbabwe was estimated in their model. Their model conformed to the situation in the nature of the Zimbabwe situation that resulted in the epidemic.
On a broader perspective, most mathematical models of cholera transmission on the global level have proposed control strategy for the control and eradication of the disease. Reference20 formulated a model which had an environmental component (Vibrio cholera concentration in water supply). The interaction between the human host and the environmental pathogen were studied and analyzed in their model for the utmost understanding of the transmission dynamics of cholera (SIR – B, with B denoting the concentration of Vibrio cholerae in the water supply). Based on this idea on the understanding of this transmission
Denteh et al__________________________________________________ ISSN: 2394-3718
BJR[2][1][2015] 030-041
mechanic, there has been the development of other models such as12,21,27.
In this paper, we aim to give a better understanding of the effects of control measures coupled with the transmission dynamics of cholera and this will in diverse ways help gain practicable and efficient preventive strategies for the control of the cholera pandemic. Water treatment is the most basic and fundamental strategy for controlling cholera and it is for this reason that we incorporate water treatment as the control strategy in our model. Sensitivity analysis of the parameters of the model in the control of the cholera epidemic will be established. Equilibrium analysis of the disease - free and endemic states will also be investigated for its existence and stability and a conclusion will be drawn for the paper. MATERIALS AND METHODS
The authors proposed a
mathematical model which will be formulated using differential equations based on the epidemiological compartment modeling. We used the SIR model for this paper, with water treatment as a control strategy, which will be incorporated into the model. The computer software package that will be used to solve the differential equation model numerically is Matrix Laboratory (Matlab R2010a). Sensitivity analysis and numerical simulations of the model will be conducted.
The mathematical model
In this paper, we consider the SIR epidemiological model with the assumption that water treatment incorporated, is the only control strategy, as developed in the model ofreference20, in addition to human birth and death rates being unequal. For our model, we assume that water treatment is the control strategy because it is the basic and
most primal control strategy for cholera. With this, we introduce another compartment into the model, i.e. concentration of vibrio cholerae in water, at
a given time (t), denoted by ( )C t . The cholera model is a combination
of the human populations and the environmental component (SIR – C), with
the total population, N S I R assumed to be constant. The model to be formulated will take into consideration the effectiveness of the water treatment as the control strategy and will be sought for in the model. We make the following assumptions for the model: Water sanitation leads to death of the
Vibrio cholerae in the aquatic environment.
Water treatment is the only control strategy considered.
Other control strategies such as vaccination and curative treatment were not considered in the model.
Human Birth and Death rate occur at different rates.
Cholera occurs in a relatively short period of time and it has low mortality.
The variables and parameters used in the model are defined below:
( )S t The number of Susceptible individuals at time, t
( )I t The number of Infected individuals at time, t
( )R t The number of Recovered individuals at time, t N Total Population
( )C t Vibrio Cholerae concentration in the water supply at time, t
µ = natural death rate, β = birth rate, ε = rate of exposure to contaminated water, γ = rate at which people recover from Cholera, m = Vibrio Cholerae growth rate, n = Vibrio Cholerae loss rate, Ƙ= concentration of Vibrio Cholerae in water
Denteh et al__________________________________________________ ISSN: 2394-3718
BJR[2][1][2015] 030-041
(pathogen concentration that yields 50% chance of getting Cholera), δ =rate of death of Vibrio Cholerae as result of water treatment, α= contribution of each infected person to the population of Vibrio Cholerae in the aquatic environment (water sanitation), φ= net death rate of Vibrio Cholerae, i.e. φ = m – n.
As a result of the analysis and the assumptions, we obtained the following dynamical systems: dS c
N S Sdt c
(1) dI c
S I Idt c
(2) dC
I C Cdt
(3)
With initial conditions: (0) , (0) 0, (0) 0S N I C .
In addition, we have the equation for the R compartment (recovered individuals), even though this equation is not needed in the model analysis. This is
because R N S I . dR
I Rdt
…….……………………..(4)
Analysis of the equilibrium points of the model
In this section, we present the results of the stability of the equilibrium points on the model. Analytic studies on the results of the stability of the equilibrium points were done. In order to determine the stability of the model, the systems of ordinary differential equations (Equations 1 – 3) were evaluated. The two non – negative equilibrium points to be found are the
disease – free equilibrium, where 0i and
endemic equilibrium, where 0i .
Existence and stability of the disease – free equilibrium
At the equilibrium point,
0dS dI dC
dt dt dt
, we therefore equate equations (1) - (3) to zero (0).
0c
N S Sc
(5)
0c
S I Ic
(6) 0I C C (7)
There are no infections at the
Disease – Free equilibrium, hence 0I . We then substitute this into equation (7) to get 0 ( ) 0
0
C C C
C
, given
that 0 .
Putting 0C into equation (5), we
obtained
NS
. Hence there exists a Disease – Free equilibrium point given as:
0 0 0( , , ) ,0,0N
S I C
. (8)
For the stability of the Disease – Free equilibrium, we will consider linearizing the system of equations (1) – (3) about the equilibrium points to prove that it is locally asymptotically stable, by taking the Jacobian of them. The Jacobian matrix is given by
2
0 0 0 2
0( )
( , , )( )
0
c S cS
c c c
c S cSJ S I C
c c c
(9) We evaluate the Jacobian matrix at
the equilibrium points,
0 0 0( , , ) ,0,0N
S I C
Denteh et al__________________________________________________ ISSN: 2394-3718
BJR[2][1][2015] 030-041
And hence we get
0 0 0
0
( , , ) 0
0
N
NJ S I C
..(10)
The characteristic equation of the Jacobian matrix is given as follows:
0 0 0
0
( , , ) 0 0
0
N
NJ S I C I
(11)
( ) ( )( ) 0N
We observe that the characteristic equation of the Jacobian matrix has three roots.
From equation (10), 1 . Thus the two other roots will be
solved for using the general formula for the roots of an equation. That is
2
2,3
( ( )) ( ( )) 4 ( )( )
2
N
2
0
2,3
( ( )) ( ( )) 4 ( )( )(1 )
2
R
Where, 0
( )( )
NR
(12)
Note: According to [30], R0is the Basic Reproductive Number and in epidemiology, it’s the number of cases one case generates on the average over the course of its infectious period.
Now, suppose 0 if 0 1R , we have
04( )( )(1 ) 0R Therefore,
2 20( ( )) 4( )( )(1 ) ( ( ))R
2
0( ( )) 4( )( )(1 ) ( ( ))R
Hence, we can deduce from the equation () that
2,3
( ( )) ( ( ))
2 2
2
( ( )) ( ( ))
2 2
, 3
( ( )) ( ( ))
2 2
From the analysis, the roots are all
negative when R0< 1, thus the Disease – Free equilibrium is asymptotically stable when R0< 1. Existence and stability of the endemic equilibrium
The endemic state of the system of equations (1) – (3) will be determined
at 0I . We now analyze the existence of the stability of the Endemic state of the model.
At equilibrium,0
dS dI dC
dt dt dt
, we therefore equate equations (1) – (3) to zero (0).
0c
N S Sc
…………… (13)
0c
S I Ic
…………………. (14) 0I C C ……………………... (15)
From equation (15),
0
( )
( )
I C C
I C
IC
…………………….. (16)
Also from equation (14),
0
( )
( )
cS I I
c
cS I
c
cS I
c
……………….. (17)

Denteh et al__________________________________________________ ISSN: 2394-3718
BJR[2][1][2015] 030-041
Again, from equation (13),
0
0
cN S S
c
cN S
c
We then substitute S from equation …(17)
( ) 0
( )
( ) 1 0
c cN I
c c
c c cN I
c c c
cN I
c
We also substitute C from equation (16)
( )( ) 1 0
( )
( ) 1( ) 1 0
( ) ( ) ( )( ) 0
( ) ( )( ) 1 0
( ) ( ) ( ) 1 0
(
I
N II
N II
I IN I
I
N I
N I
N
) ( ) ( ) ( ) 0
( ) ( )
( ) ( )
I
NI
(18) Supposedly, for I to be > 0,
( ) ( )N
1( ) ( )
N
. 0 1R Where, the Basic Reproductive
number, R0 is given as
0( ) ( )
NR
(19) From the analysis, it can be observed
that a positive endemic equilibrium exist if R0> 1. This conditions (necessary and sufficient) are true for all values of the
parameters (all non – negative), hence the endemic equilibrium is locally asymptotically stable when R0> 1. NUMERICAL ANALYSIS AND RESULTS
In this paper, we present a cholera epidemiological model by incorporating water treatment as a control strategy. We used the standard ordinary differential equation obtained from our proposed SIR - C model to predict the dynamics and the control of the disease. Matrix Laboratory (Matlab R2010a) application software was use to solve the system of equations in the model. Numerical simulations of the model were done, as well as the plots of the graphs. This was done to look into the effects and changes that will occurin the model when the values of each of the compartments of the model were altered. The sensitivity analysis of the model was performed and this led to the discussion of the existence and stability of the disease- free equilibrium and endemic equilibrium states of the model equations. We assign values for the model parameters for the components of the compartments of the model based on specified values as being used in the models by references8,20,21. Below are the results obtained after the numerical investigations on the model; (See Figure 1)
At the initial stages, the level of infections is reduced since there are no Vibrio Cholerae bacteria in the water bodies consumed by the population. The source of drinking water at this state is treated and safe for human consumption. As expected, the number of infected individuals increases with the introduction of the bacteria in the sources of drinking water, as it can be seen from Figure 2.
In trying to access the effectiveness of the control strategy on the susceptible and infected individuals in the population, we can see from Figure 1 as compared to Figure
Denteh et al__________________________________________________ ISSN: 2394-3718
BJR[2][1][2015] 030-041
2, that strong control strategy for the disease generated good results for disease control and eradication. This is due to the fact that when the rate of exposure of humans to contaminated water is reduced, the rate of contribution of each infected person to the population of Vibrio Cholerae in the aquatic environment (water sanitation) will also reduce and hence prevent the disease from spreading into an outbreak.
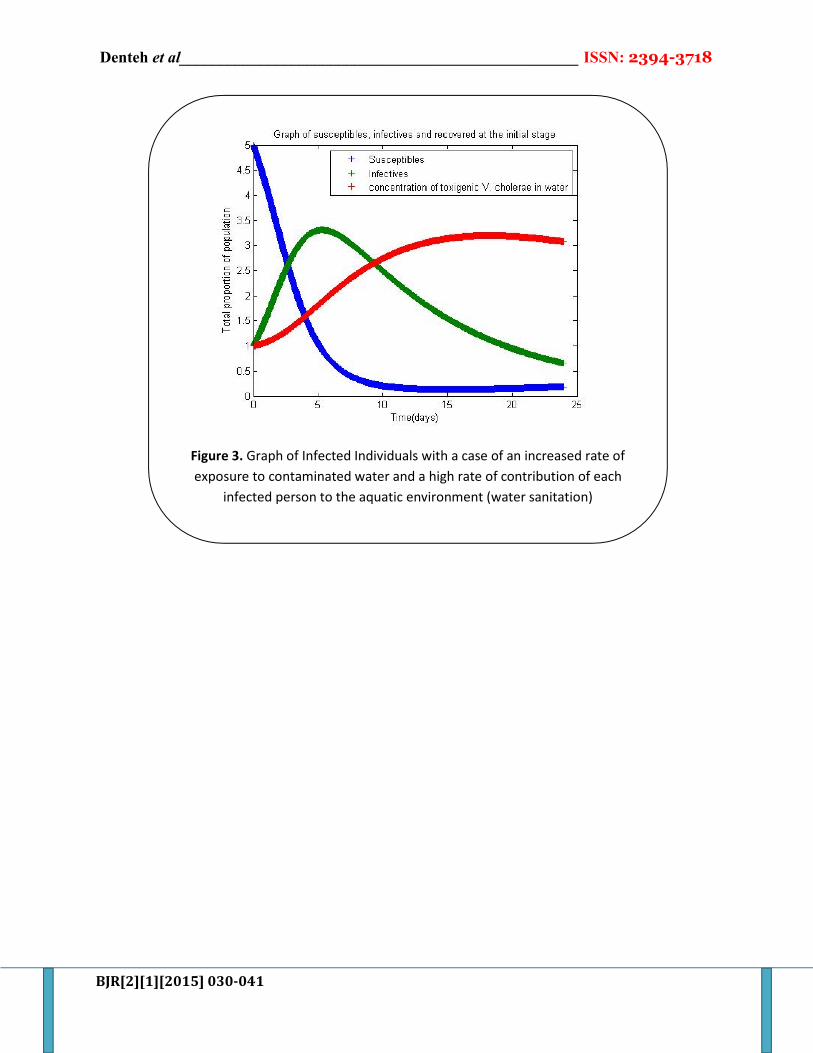
It can be seen from Figure 3 that, cholera cases persist in the population. This is because the number of infected individuals will increase and this is as a result of the increased rate of exposure to contaminated water and a high rate of contribution of each infected person to the aquatic environment (water sanitation).Even with the presence of a water treatment as a control strategy, cholera will still persist in the population until both rates are reduced drastically. This can be achieved through sensitization and education by authorities for the populace, on the dangers of open urinating and defecating into sources of drinking water. CONCLUSION AND RECOMMENDATIONS
The analysis and formulation of the modified SIR epidemiological model with a control strategy of water treatment (water sanitation) incorporated (SIR – C) by the authors enabled a better understanding of the transmission dynamics of the spread of cholera and how it can be controlled.
The model has two non – negative equilibria, namely the disease – free equilibrium and the endemic equilibrium and their existence and stability analysis were also performed. The analysis of the model also produced a threshold parameter, R0, which is the basic reproductive number. It was noted that when R0< 1, the disease – free equilibrium is asymptotically stable and this indicates the disease will not persist in
the population and hence can be controlled. Also, whenR0> 1, the endemic equilibrium state exist and become stable and this will let the disease persist in the population and hence an outbreak will occur. In the case with constant controls, the equilibrium analysis shows that the basic reproductive number for the model plays an essential role in determining the epidemic and endemic dynamics of the cholera disease.
The numerical simulations analysis was widely useful in the determination of the effect of the control intervention on the transmission of the disease. The control strategy has more effect on the contribution of the each individual to the water ecosystem (aquatic environment) and that there is a reduction of the rate of exposure to contaminated and untreated water.
Cholera is a pandemic disease that affects hundreds of thousands of people every year. Because the bacterium that causes cholera, Vibrio cholerae, is always present in aquatic ecosystems, eradication of the bacteria is not feasible. There is the need to find better ways of treating drinking water, predicting future outbreaks, and treating infected individuals in the populace. We recommend that the Government should educate the population in order to create awareness of the disease transmission for the individuals to be aware of its endemism. Health authorities and Non – Governmental Organization (NGO’s) should sensitize the public on the dangers of open urinating and defecation in various source of drinking water. Portable drinking water should be provided for the populace so that they can avoid the using and coming into contact with untreated water. ACKNOWLEDGEMENT
The authors express their gratitude to the unknown reviewers for their useful comments.
Denteh et al__________________________________________________ ISSN: 2394-3718
BJR[2][1][2015] 030-041
Competing interests Authors have declared that no
competing interests exist. REFERENCES
1. Anderson, R. M. (1991). The Kermack McKendrick Epidemic Threshold Theorem. Bulletin of Mathematical Biology, 53(1/2).
2. Anderson, R. M. &May, R. M. (1991).Infectious Diseases of Humans: dynamics and control. Oxford University Press, New York, (1991).
3. Dontwi, I. K., Obeng - Denteh, W., Andam, E. A. &Obiri-Apraku, L. A. (2014). Mathematical Model to Predict the Prevalence and Transmission Dynamics of Tuberculosis in Amansie West District, Ghana. British Journal of Mathematics and Computer Science. 4(3):402-425.
4. Dontwi, I. K., Obeng - Denteh, W., Andam, E. A. &Obiri-Apraku, L. (2014). Modeling Hepatitis B in A High Prevalence District in Ghana. British Journal of Mathematics and Computer Science. 4(7):969-988.
5. Ahmed, B. E., Obeng – Denteh, W., Barnes, B. & Ntherful, G. E. (2014). Vaccination Dynamics of Chickenpox in Agona West Municipality of Ghana. British Journal of Mathematics and Computer Science. 4(14): 2036-2045.
6. Gyasi – Agyei, K. A., Obeng – Denteh, W. & Gyasi – Agyei, A. (2013). Analysis and Modeling of Prevalence of Measles in the Ashanti Region of Ghana. British Journal of Mathematics and Computer Science. 3(2):209-225.
7. Ochoche, J. M. (2013). A Mathematical Model for the Transmission Dynamics of Cholera with Control Strategy. International Journal of Science and Technology. Volume 2 No. 11.
8. Wang, J. & Modnak, C. (2011). Modeling Cholera Dynamics with Controls.
Canadian Applied Mathematics Quarterly. Volume 19 (3).
9. Faruque, S. M., Albert, M. J. & Mekalanos, J. J. (1998). Epidemiology, Genetics, and Ecology of Toxigenic Vibrio cholerae. Microbiol. Mol. Biol. Rev., 62(4):1301–1314.
10. Andrews, J. R. & S. Basu, S. (2011). Transmission dynamics and control of cholera in Haiti: An epidemic model. Lancet, 377:1248–1255.
11. Bertuzzo, E., Mari, L., Righetto, L., Gatto, M., Casagrandi, R., Blokesch, M., Rodriguez-Iturbe, I. &Rinaldo, A. (2011). Prediction of the spatial evolution and effects of control measures for the unfolding Haiti cholera outbreak. Geophysical Research Letters, 38:L06403.
12. Mukandavire, Z., Liao, S., Wang, J., Gaff, H., Smith, D. L. &Morris, J. G. (2011). Estimating the reproductive numbers for the 2008–2009 cholera outbreaks in Zimbabwe, Proceedings of the National Academy of Sciences, 108: 8767 - 8772.
13. Tuite, A. R., Tien, J., Eisenberg, M., Earn, D. J., Ma, J. & Fisman, D. N. (2011). Cholera epidemic in Haiti, 2010: Using a transmission model to explain spatial spread of disease and identify optimal control interventions. Annals of Internal Medicine, 154(9):593–601.
14. Chao, D. L., Halloran, M. E.& Longini Jr., I. M. (2011). Vaccination strategies for epidemic cholera in Haiti with implications for the developing world. Proceedings of the National Academy of Sciences USA, 108(17):7081–7085.
15. McElroy, A. & Townsend, P. T. (2009). Medical Anthropology in Ecological Perspective. Boulder, CO: Westview, 375.
16. Center for Disease Control and Prevention (CDC). Web page: www.cdc.gov. (2014).
Denteh et al__________________________________________________ ISSN: 2394-3718
BJR[2][1][2015] 030-041
17. World Health Organization (WHO). Web page: www.who.org. (2014).
18. Ghana Health Service (GHS) (2014). Cholera Outbreak Report in Ghana.
19. Nelson, E. J., Harris, J. B., Morris, J. G., Calderwood, S. B. & Camilli, A. (2009). Cholera transmission: the host, pathogen and bacteriophage dynamics, Nature Rev.: Microbiology 7, 693–702.
20. Codeço, C. T. (2001). Endemic and Epidemic Dynamics of Cholera: The Role of the Aquatic Reservoir, BMC Infectious Diseases 1(1) (2001). Retrieved from http://www.biomedcentral.com/1471-2334/1/1.
21. Hartley, D. M.,Morris, J. G. Jr. &Smith, D. L. (2006).Hyperinfectivity: A critical element in the ability of V. cholerae to cause epidemics? PLoS Medicine 3, 0063–0069.
22. Alam, A., Larocque, R. C., Harris, J. Bet al. (2005). Hyperinfectivity of humanpassaged Vibrio cholerae can be modeled by growth in the infant mouse, Infection Immunity 73, 6674–6679.
23. Merrell, D. S., Butler, S. M., Qadri Fet al. (2002). Host-induced epidemic spread of the cholera bacterium, Nature 417, 642–645.
24. Joh, R. I., Wang, H., Weiss, H. &Weitz, J. S. (2009).Dynamics of indirectly transmitted infectious diseases with
immunological threshold, Bull. Math. Biol. 71, 845–862.
25. Neilan, R. L. M., Schaefer, E., Gaff, H., Fister, K. R. &Lenhart, S. (2010).Modeling optimal intervention strategies for cholera, Bull. Math. Biol. 72, 2004-2018.
26. Tien, J. H. &Earn, D. J. D. (2010).Multiple transmission pathways and disease dynamics in a waterborne pathogen model, Bull. Math. Biol. 72, 1502–1533.
27. Tian, P. T., Liao, S. &Wang, S. J. (2010). Dynamical analysis and control strategies in modeling cholera. A monograph.
28. Capaso, V. &Pavari-Fontana, S. L. (1979). A Mathematical Model for the 1973 Cholera Epidemic in the European Mediterranean region. Rev Epidém Santé Pub, 27:121 – 132.
29. Ashliegh, R. T., Tien, J., Eisenberg, J. M., David, J. D., Junling, M. &David, N. F. (2011). Cholera Epidemic in Haiti, 2010: Using a Transmission Model to Explain Spatial Spread of Disease and Identify Optimal Control Interventions, Annals of internal medicine. 154:593-601.
30. Hethcote, H.W. (2000). The Mathematics of Infectious Diseases, SIAM REVIEW, Vol.42, No.4 Pg.599-653, Society for Industrial and Applied Mathematics.

Denteh et al__________________________________________________ ISSN: 2394-3718
BJR[2][1][2015] 030-041
Figure 1. Graphs of Infective in the population for the cholera model with
control
Figure 2. Graph of Susceptible and Infected Individuals in the population
without control (presence of the bacteria Vibrio Cholerae)
Denteh et al__________________________________________________ ISSN: 2394-3718
BJR[2][1][2015] 030-041
Figure 3. Graph of Infected Individuals with a case of an increased rate of
exposure to contaminated water and a high rate of contribution of each
infected person to the aquatic environment (water sanitation)