Cholera Outbreaks in India, 2011–2020: A Systematic Review
27
Citation: Muzembo, B.A.; Kitahara, K.; Debnath, A.; Ohno, A.; Okamoto, K.; Miyoshi, S.-I. Cholera Outbreaks in India, 2011–2020: A Systematic Review. Int. J. Environ. Res. Public Health 2022, 19, 5738. https:// doi.org/10.3390/ijerph19095738 Academic Editor: Paul B. Tchounwou Received: 1 April 2022 Accepted: 6 May 2022 Published: 8 May 2022 Publisher’s Note: MDPI stays neutral with regard to jurisdictional claims in published maps and institutional affil- iations. Copyright: © 2022 by the authors. Licensee MDPI, Basel, Switzerland. This article is an open access article distributed under the terms and conditions of the Creative Commons Attribution (CC BY) license (https:// creativecommons.org/licenses/by/ 4.0/). International Journal of Environmental Research and Public Health Review Cholera Outbreaks in India, 2011–2020: A Systematic Review Basilua Andre Muzembo 1, *, Kei Kitahara 1,2 , Anusuya Debnath 1,3 , Ayumu Ohno 1,2 , Keinosuke Okamoto 1 and Shin-Ichi Miyoshi 1 1 Graduate School of Medicine, Dentistry and Pharmaceutical Sciences, Okayama University, Okayama 700-8530, Japan; [email protected] (K.K.); [email protected] (A.D.); [email protected] (A.O.); [email protected] (K.O.); [email protected] (S.-I.M.) 2 Collaborative Research Center of Okayama University for Infectious Diseases in India, Kolkata 700010, India 3 Department of Biotechnology, Brainware University, Kolkata 700125, India * Correspondence: [email protected] or [email protected] Abstract: Fecal contamination of water sources and open defecation have been linked to cholera outbreaks in India. However, a systematic review on the drivers responsible for these outbreaks has yet to be published. Here, we systematically review the published literature on cholera outbreaks in India between 2011 and 2020. We searched studies in English in three databases (MEDLINE, EMBASE, and Web of Science) and the Integrated Disease Surveillance Program that tracks cholera outbreaks throughout India. Two authors independently extracted data and assessed the quality of the included studies. Quantitative data on the modes of transmission reviewed in this study were assessed for any change over time between 2011–2015 and 2016–2020. Our search retrieved 10823 records initially, out of which 81 full-text studies were assessed for eligibility. Among these 81 studies, 20 were eligible for inclusion in this review. There were 565 reported outbreaks between 2011 and 2020 that led to 45,759 cases and 263 deaths. Outbreaks occurred throughout the year; however, they exploded with monsoons (June through September). In Tamil Nadu, a typical peak of cholera outbreaks was observed from December to January. Seventy-two percent (33,089/45,759) of outbreak-related cases were reported in five states, namely Maharashtra, West Bengal, Punjab, Karnataka, and Madhya Pradesh. Analysis of these outbreaks highlighted the main drivers of cholera including contaminated drinking water and food, inadequate sanitation and hygiene (including open defecation), and direct contact between households. The comparison between 2011–2015 and 2016–2020 showed a decreasing trend in the outbreaks that arose due to damaged water pipelines. Many Indians still struggle with open defecation, sanitation, and clean water access. These issues should be addressed critically. In addition, it is essential to interrupt cholera short-cycle transmission (mediated by households, stored drinking water and foodstuffs) during an outbreak. As cholera is associated with deprivation, socio-economic development is the only long-term solution. Keywords: cholera; outbreak; water supply; open defecation; sewage; household; food; close contact; behavioral changes; India 1. Introduction Cholera is a disease associated with destitution [1]. The heavy reliance on untreated environmental water sources for daily water needs such as drinking, bathing, cooking, and washing utensils by poverty-stricken communities increases the risk of ingesting cope- pods, the biotic carriers for cholera-causing bacteria Vibrio cholerae O1 or O139 (V. cholerae). Copepods soar in environmental water due to fluctuations in several climatic factors such as increased water temperature. Under such conditions, this increases the likelihood of ingesting an infective dose of V. cholerae through copepod-infested water [2]. Transmission of cholera spreads further upon contamination of drinking water sources or food with feces from infected people. Studies have demonstrated that host factors (such as age, nutrition, and blood group) also play a role in the development of cholera [3–6]. Int. J. Environ. Res. Public Health 2022, 19, 5738. https://doi.org/10.3390/ijerph19095738 https://www.mdpi.com/journal/ijerph
-
Upload
khangminh22 -
Category
Documents
-
view
3 -
download
0
Transcript of Cholera Outbreaks in India, 2011–2020: A Systematic Review

Citation: Muzembo, B.A.; Kitahara,
K.; Debnath, A.; Ohno, A.; Okamoto,
K.; Miyoshi, S.-I. Cholera Outbreaks
in India, 2011–2020: A Systematic
Review. Int. J. Environ. Res. Public
Health 2022, 19, 5738. https://
doi.org/10.3390/ijerph19095738
Academic Editor: Paul B.
Tchounwou
Received: 1 April 2022
Accepted: 6 May 2022
Published: 8 May 2022
Publisher’s Note: MDPI stays neutral
with regard to jurisdictional claims in
published maps and institutional affil-
iations.
Copyright: © 2022 by the authors.
Licensee MDPI, Basel, Switzerland.
This article is an open access article
distributed under the terms and
conditions of the Creative Commons
Attribution (CC BY) license (https://
creativecommons.org/licenses/by/
4.0/).
International Journal of
Environmental Research
and Public Health
Review
Cholera Outbreaks in India, 2011–2020: A Systematic ReviewBasilua Andre Muzembo 1,*, Kei Kitahara 1,2, Anusuya Debnath 1,3, Ayumu Ohno 1,2, Keinosuke Okamoto 1
and Shin-Ichi Miyoshi 1
1 Graduate School of Medicine, Dentistry and Pharmaceutical Sciences, Okayama University,Okayama 700-8530, Japan; [email protected] (K.K.); [email protected] (A.D.);[email protected] (A.O.); [email protected] (K.O.); [email protected] (S.-I.M.)
2 Collaborative Research Center of Okayama University for Infectious Diseases in India, Kolkata 700010, India3 Department of Biotechnology, Brainware University, Kolkata 700125, India* Correspondence: [email protected] or [email protected]
Abstract: Fecal contamination of water sources and open defecation have been linked to choleraoutbreaks in India. However, a systematic review on the drivers responsible for these outbreaks hasyet to be published. Here, we systematically review the published literature on cholera outbreaksin India between 2011 and 2020. We searched studies in English in three databases (MEDLINE,EMBASE, and Web of Science) and the Integrated Disease Surveillance Program that tracks choleraoutbreaks throughout India. Two authors independently extracted data and assessed the qualityof the included studies. Quantitative data on the modes of transmission reviewed in this studywere assessed for any change over time between 2011–2015 and 2016–2020. Our search retrieved10823 records initially, out of which 81 full-text studies were assessed for eligibility. Among these81 studies, 20 were eligible for inclusion in this review. There were 565 reported outbreaks between2011 and 2020 that led to 45,759 cases and 263 deaths. Outbreaks occurred throughout the year;however, they exploded with monsoons (June through September). In Tamil Nadu, a typical peakof cholera outbreaks was observed from December to January. Seventy-two percent (33,089/45,759)of outbreak-related cases were reported in five states, namely Maharashtra, West Bengal, Punjab,Karnataka, and Madhya Pradesh. Analysis of these outbreaks highlighted the main drivers of choleraincluding contaminated drinking water and food, inadequate sanitation and hygiene (includingopen defecation), and direct contact between households. The comparison between 2011–2015 and2016–2020 showed a decreasing trend in the outbreaks that arose due to damaged water pipelines.Many Indians still struggle with open defecation, sanitation, and clean water access. These issuesshould be addressed critically. In addition, it is essential to interrupt cholera short-cycle transmission(mediated by households, stored drinking water and foodstuffs) during an outbreak. As cholera isassociated with deprivation, socio-economic development is the only long-term solution.
Keywords: cholera; outbreak; water supply; open defecation; sewage; household; food; close contact;behavioral changes; India
1. Introduction
Cholera is a disease associated with destitution [1]. The heavy reliance on untreatedenvironmental water sources for daily water needs such as drinking, bathing, cooking,and washing utensils by poverty-stricken communities increases the risk of ingesting cope-pods, the biotic carriers for cholera-causing bacteria Vibrio cholerae O1 or O139 (V. cholerae).Copepods soar in environmental water due to fluctuations in several climatic factors suchas increased water temperature. Under such conditions, this increases the likelihood ofingesting an infective dose of V. cholerae through copepod-infested water [2]. Transmissionof cholera spreads further upon contamination of drinking water sources or food with fecesfrom infected people. Studies have demonstrated that host factors (such as age, nutrition,and blood group) also play a role in the development of cholera [3–6].
Int. J. Environ. Res. Public Health 2022, 19, 5738. https://doi.org/10.3390/ijerph19095738 https://www.mdpi.com/journal/ijerph
Int. J. Environ. Res. Public Health 2022, 19, 5738 2 of 27
In October 2017, the WHO Global Task Force on Cholera Control (GTFCC) launcheda vigorous fight against cholera. The GTFCC aims for the elimination of the disease as apublic threat by 2030 in at least 20 countries with an emphasis on multiple targets includingpreventing the recurrence of cholera in hotspots [7].
Cholera outbreaks are relatively frequent in India. Surveillance data reveal a steady in-crease in reported cholera outbreaks throughout the country. From 1997 to 2006, 68 outbreakswere reported [8], while the reported outbreaks rose to 559 between 2009 and 2017 [9].However, this is only the tip of the iceberg. The disease is grossly underreported in In-dia [10], and despite these figures, cholera remains an under-recognized health issue inIndia [1,8]. Many state authorities are unaware of the disease burden and its impact onthe citizens [11]. In India, cholera is endemic and occurs with marked seasonal dynamics;cholera is prevalent in the hot, humid and rainy season. In general, the seasonality ofcholera outbreaks is mediated by various contributing and overlapping factors such asenvironmental parameters and climatic factors [2,12], waning host-immunity [13], andprobably human behaviors (e.g., social gatherings) and activities also. For instance, thetribal communities (poorest and marginalized Indian communities) usually work in thepaddy fields during the rainy season and became ill after drinking untreated environmentalwater [14]. Although access to safe drinking water and improved sanitation has beenenhanced in most of the states and union territories (SUTs) by the Swachh Bharat (CleanIndia) Mission, substantial progress is still needed because of high inequities in distribution.For instance, only 16% of the population in rural India had access to piped water up until2015 [15,16]. In addition, sanitation is another major hurdle to be handled. Approximatelysixty percent of the world’s population who defecate in the open are in India. The over-whelming majority of individuals in rural India engage in open defecation that leads to thecontamination of water bodies and heavy rainfall further worsens the situation [14,17]. Asa remote driver of cholera, high rainfall raises the water level causing sewage and stagnantwater to leak into damaged pipelines [14].
Several analyses of cholera outbreaks occurring in India have been documented [8,9,18,19].However, the drivers of these outbreaks have yet to be systematically synthesized. The mostrecent report [9] summarized outbreaks from 2009 to 2017 and focused on antimicrobialresistance. Although this is only four years ago, data on fresh outbreaks have also becomeavailable. While it is useful and important in understanding antimicrobial resistance, thelatter [9] did not address the importance of shifts in human behaviors in addition to accessto clean drinking water to interrupt transmission during cholera outbreaks. Hence, both atimely update of data and a detailed synthesis of the evidence base for public health arewarranted for policy recommendations.
The objective of this study is to provide the trend of cholera outbreaks in India overthe last ten years. In addition, we also analyzed data for potential changes in the pattern ofdrivers of cholera. We specifically sought to understand whether there is any decreasingtrend among the key drivers of cholera outbreaks by comparing two periods: 2011–2015and 2016–2020. As cholera outbreaks are strongly seasonal in India, this makes us questionwhat human-behavioral practices are associated with these seasonal fluctuations. Weargue that broad shifts in behaviors are central to effective outbreak control. The datareviewed here would prove useful for informing policy-makers by pinpointing the areaswhere efforts should be focused for better prevention measures (such as motivating peoplein rural areas to use toilets, providing tap water to every household in the rural areasand urban slums, along with education on health and hygiene, education on householdwater storage, and mass availability of oral cholera vaccine for target-oriented vaccination),enhancing advocacy for launching a National Cholera Control Program in India or atleast strengthening the sentinel surveillance system for diarrheal diseases and cholerain particular.
Int. J. Environ. Res. Public Health 2022, 19, 5738 3 of 27
2. Methods2.1. Data Sources
We undertook a systematic review according to the preferred reporting items forsystematic reviews and meta-analysis (PRISMA) [20] to explore cholera outbreaks in In-dia from the period 2011 to 2020. This systematic review is registered with PROSPERO(CRD42021233348). We defined a cholera outbreak as the occurrence of “at least one labora-tory confirmed cholera case either by culture or polymerase chain reaction and there wasevidence of local transmission in a specified geographical area or could be linked by placeand time” [21]. For practical purposes, we considered a cholera outbreak as it had beendefined in the studies included in this review.
We searched three electronic databases (MEDLINE through PubMed, EMBASE, andWeb of science) for studies that were published on cholera outbreaks from January 2011to December 2020 in India. This period of 10 years was chosen based on a similar reviewconducted by Kanungo and colleagues in which they also analyzed data over a ten-yearperiod (1997–2006) [8]. The following groups of keywords were employed for cholera:“Cholera” OR “Vibrio cholerae” OR “Vibrio cholerae O1” OR “Vibrio cholerae O139”. Thesekeywords were combined with: “outbreak” OR “epidemiology” OR “epidemics” OR“pandemic” OR “prevalence” OR “incidence” OR “risk factors”, OR “community” OR“immunity” AND “India.” We further narrowed down our searches by including eachof the 36 names of SUTs. The search was further refined by scanning the reference listsof the obtained studies and related reviews. We did not apply any language restrictionsduring the search. Retrieved studies were exported to the Endnote software X9 (Clarivate,PA, USA) and duplicated studies were manually removed. Anticipating a scarcity of peer-reviewed publications on cholera outbreaks in India, the searches were supplemented bythe grey literature data, i.e., the epidemiology reports of the Integrated Disease SurveillanceProgram (IDSP) that track cholera outbreaks [22]. The last search was performed on 6 April2021. We used population, exposure, comparison, outcomes, and study design (PECOS) asa framework for study selection.
To be included, a study had to meet the following inclusion criteria:
(1) Population: any group of individuals affected by a cholera outbreak in India;(2) Exposure: a study had to assess sources of exposure or potential risk factors for
an outbreak;(3) Comparison: it was not considered obligatory to include a comparison group for the
present analysis;(4) Outcomes: we focused on transmission routes as well as human practices that lead to
cholera, the sources of the cholera outbreak and other human factors that may explainthe seasonality of cholera;
(5) Study design: prevalence and incidence studies were eligible.
Articles were excluded for any of the following reasons: they were non-outbreakstudies, reports were available in abstract form only, they investigated sporadic choleracases, or the study failed to meet the above inclusion criteria.
2.2. Data Extraction and Analysis
Two authors independently screened articles for inclusion and abstracted data fromthe included studies. Disagreements were discussed and resolved by consensus. Wedevised a standardized chart to extract data. For each study, the extracted data includedthe first author’s last name, year of publication, setting and geographic region, durationof the outbreak, number of cholera cases, number of deaths, attack rates, investigatedrisk factors, behavioral characteristics of the index case, occurrence season, V. choleraeserogroup/serotype/biotype and required data for quality assessment. We also gathereddata on two particular aspects related to the setting of each study: (1) urban versus rural,and (2) SUTs. Data on antibiotic resistance were also abstracted wherever applicable becauseantibiotic resistance is a serious public health issue that needs novel intervention strategies.
Int. J. Environ. Res. Public Health 2022, 19, 5738 4 of 27
Data extracted from IDSP outbreak reports included information on setting, numberof cases, number of deaths, date of onsets, and transmission vehicle.
Two authors independently assessed the quality of the included studies. The risk ofbias in the included studies was assessed employing a modified Downes et al. appraisalchecklist for cross-sectional studies [23].
Results were presented in both textual narrative and tabular formats. In addition,the geographical distribution of outbreaks was presented in area maps. The countryarea maps were generated using MapChart [24]. We generated graphs using the Statasoftware package (version 16, StataCorp LP, College Station, TX, USA). The prevalenceof laboratory-confirmed cholera was synthetized using a random-effects model in theComprehensive meta-analysis software, version 3. Annual reports of the Central Bureau ofHealth Intelligence (CBHI) on the national health profile of India were used to ascertainthe Indian population by SUTs [25]. Cumulative cases were expressed as cholera cases per100,000 persons. Quantitative data on the modes of transmission reviewed in this studywere assessed for any change over time between the two time periods, i.e., period 1 (from2011 to 2015) and period 2 (from 2016 to 2020).
3. Results3.1. Study Characteristics
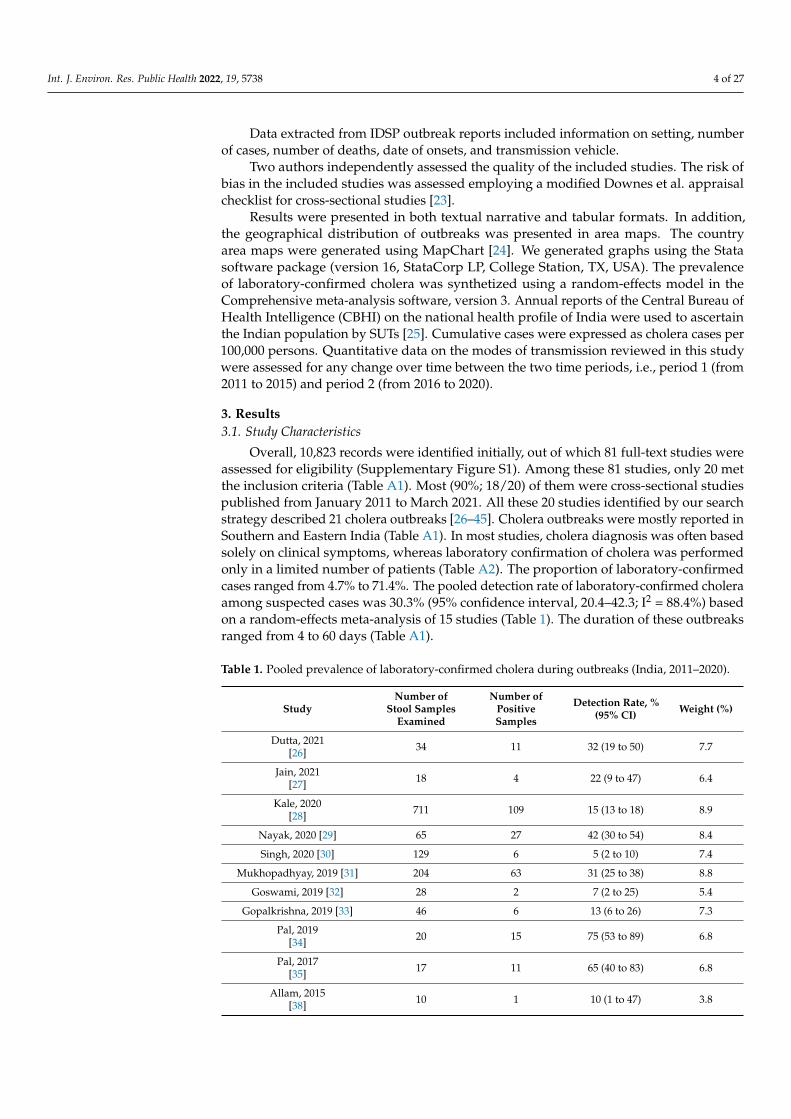
Overall, 10,823 records were identified initially, out of which 81 full-text studies wereassessed for eligibility (Supplementary Figure S1). Among these 81 studies, only 20 metthe inclusion criteria (Table A1). Most (90%; 18/20) of them were cross-sectional studiespublished from January 2011 to March 2021. All these 20 studies identified by our searchstrategy described 21 cholera outbreaks [26–45]. Cholera outbreaks were mostly reported inSouthern and Eastern India (Table A1). In most studies, cholera diagnosis was often basedsolely on clinical symptoms, whereas laboratory confirmation of cholera was performedonly in a limited number of patients (Table A2). The proportion of laboratory-confirmedcases ranged from 4.7% to 71.4%. The pooled detection rate of laboratory-confirmed choleraamong suspected cases was 30.3% (95% confidence interval, 20.4–42.3; I2 = 88.4%) basedon a random-effects meta-analysis of 15 studies (Table 1). The duration of these outbreaksranged from 4 to 60 days (Table A1).
Table 1. Pooled prevalence of laboratory-confirmed cholera during outbreaks (India, 2011–2020).
StudyNumber of
Stool SamplesExamined
Number ofPositiveSamples
Detection Rate, %(95% CI) Weight (%)
Dutta, 2021[26] 34 11 32 (19 to 50) 7.7
Jain, 2021[27] 18 4 22 (9 to 47) 6.4
Kale, 2020[28] 711 109 15 (13 to 18) 8.9
Nayak, 2020 [29] 65 27 42 (30 to 54) 8.4
Singh, 2020 [30] 129 6 5 (2 to 10) 7.4
Mukhopadhyay, 2019 [31] 204 63 31 (25 to 38) 8.8
Goswami, 2019 [32] 28 2 7 (2 to 25) 5.4
Gopalkrishna, 2019 [33] 46 6 13 (6 to 26) 7.3
Pal, 2019[34] 20 15 75 (53 to 89) 6.8
Pal, 2017[35] 17 11 65 (40 to 83) 6.8
Allam, 2015[38] 10 1 10 (1 to 47) 3.8

Int. J. Environ. Res. Public Health 2022, 19, 5738 5 of 27
Table 1. Cont.
StudyNumber of
Stool SamplesExamined
Number ofPositiveSamples
Detection Rate, %(95% CI) Weight (%)
Bhattacharya, 2015[37] 6 4 67 (3 to 92) 4.7
Fredrick, 2015[39] 16 9 56 (32 to 78) 6.9
Dey, 2014[41] 7 5 71 (33 to 93) 4.8
Mahanta, 2013[45] 13 3 23 (8 to 52) 5.9
Total (random effects) 1324 276 32 (23 to 44) 100.0Definition of abbreviation: CI = confidence interval.
The majority (75%; 15/20) of included studies was scored as a moderate risk ofbias, 25% (5/20) as a low risk of bias, and no study was deemed to have a high risk ofbias (Table A3).
3.2. Geographical Distribution of Cholera Outbreaks
There were 565 outbreaks reported between 2011 and 2020 resulting in approximately45,759 cholera cases and 263 (0.6%) deaths [22]. The median annual number of outbreaksreported during period 1 (2011 to 2015) was higher than period 2 (2016 to 2020). However,the difference was not statistically significant (66 versus 31; p = 0.058) (Table 2). In addition,the crude number of cases during 2011 to 2015 (n = 22,438; 49%) was lower compared with2016 to 2020 (n = 23,321; 51%).
Table 2. Number of cholera outbreaks during the period 2011–2015 compared with 2016–2020.
Transmission Routes Number of Outbreaksduring 2011–2015, n (%)
Number of Outbreaksduring 2016–2020, n (%)
Median (Min-Max)Annual Outbreaks
Number during2011–2015 versus
2016–2020
p Value *
Unimproved water sources/Non-potablewater/Contaminated drinking water 127 (36.6) 114 (52.3) 21 (14–43) vs. 12 (3–75) 0.058
Water pipeline leaks 67 (19.3) 11 (5.0) 8 (6–26) vs. 4 (2–5) 0.028 **Open defecation 14 (4.0) 1 (0.5) 4 (1–6) vs. 1 (1–1) 0.361Poor sanitation 6 (1.7) 1 (0.5) 1 (1–4) vs. 1 (1–1) 0.505
Waterborne combined with inadequatesanitation and poor hygiene 2 (0.6) 2 (0.9) 1 (1–1) vs. 1 (1–1) -
Foodborne/gathering/close contact 5 (1.4) 1 (0.5) 2 (1–2) vs. 1 (1–1) 0.248Not reported or unknown 126 (36.3) 88 (40.4) 16 (11–45) vs. 16 (2–37) 1.000
Total 347 (100.0) 218 (100) 66 (40–98) vs. 31 (5–114) 0.058
* p values were calculated using Fisher’s exact test. They are comparing the median annual outbreaks numberduring 2011–2015 versus 2016–2020. ** p value < 0.05.
These outbreaks occurred in 24 of the 36 SUTs at least once between 2011 to 2020(Figure 1). The occurrence of outbreaks varied greatly across the years. The highest numberof reported outbreaks was recorded in 2016 (114/565; 20%), whereas the year 2020 hadstrikingly fewer (0.9%; 5/565) reported outbreaks than the previous years (Figures 2–4).Five states, namely Gujarat, Karnataka, Maharashtra, Punjab, and West Bengal, reporteda recurrence of cholera outbreaks every year from 2011 to 2019 (Figure 2). On the otherhand, Karnataka and Maharashtra reported cholera outbreaks every year throughout thelast 10 years that we have reviewed. When comparing period 1 (2011 to 2015) with period 2(2016 to 2020), Delhi and Rajasthan reported cholera outbreaks during period 2 (2016 to 2020)but there was not a single report during period 1 (2011 to 2015) (Supplementary Figure S2).
Int. J. Environ. Res. Public Health 2022, 19, 5738 6 of 27
Int. J. Environ. Res. Public Health 2022, 19, 5738 6 of 26
tact
Not reported or unknown 126 (36.3) 88 (40.4) 16 (11–45) vs. 16 (2–37) 1.000
Total 347 (100.0) 218 (100) 66 (40–98) vs. 31 (5–114) 0.058
* p values were calculated using Fisher’s exact test. They are comparing the median annual out-
breaks number during 2011–2015 versus 2016–2020. ** p value < 0.05.
These outbreaks occurred in 24 of the 36 SUTs at least once between 2011 to 2020
(Figure 1). The occurrence of outbreaks varied greatly across the years. The highest
number of reported outbreaks was recorded in 2016 (114/565; 20%), whereas the year
2020 had strikingly fewer (0.9%; 5/565) reported outbreaks than the previous years (Fig-
ures 2–4). Five states, namely Gujarat, Karnataka, Maharashtra, Punjab, and West Bengal,
reported a recurrence of cholera outbreaks every year from 2011 to 2019 (Figure 2). On
the other hand, Karnataka and Maharashtra reported cholera outbreaks every year
throughout the last 10 years that we have reviewed. When comparing period 1 (2011 to
2015) with period 2 (2016 to 2020), Delhi and Rajasthan reported cholera outbreaks dur-
ing period 2 (2016 to 2020) but there was not a single report during period 1 (2011 to 2015)
(Supplementary Figure S2).
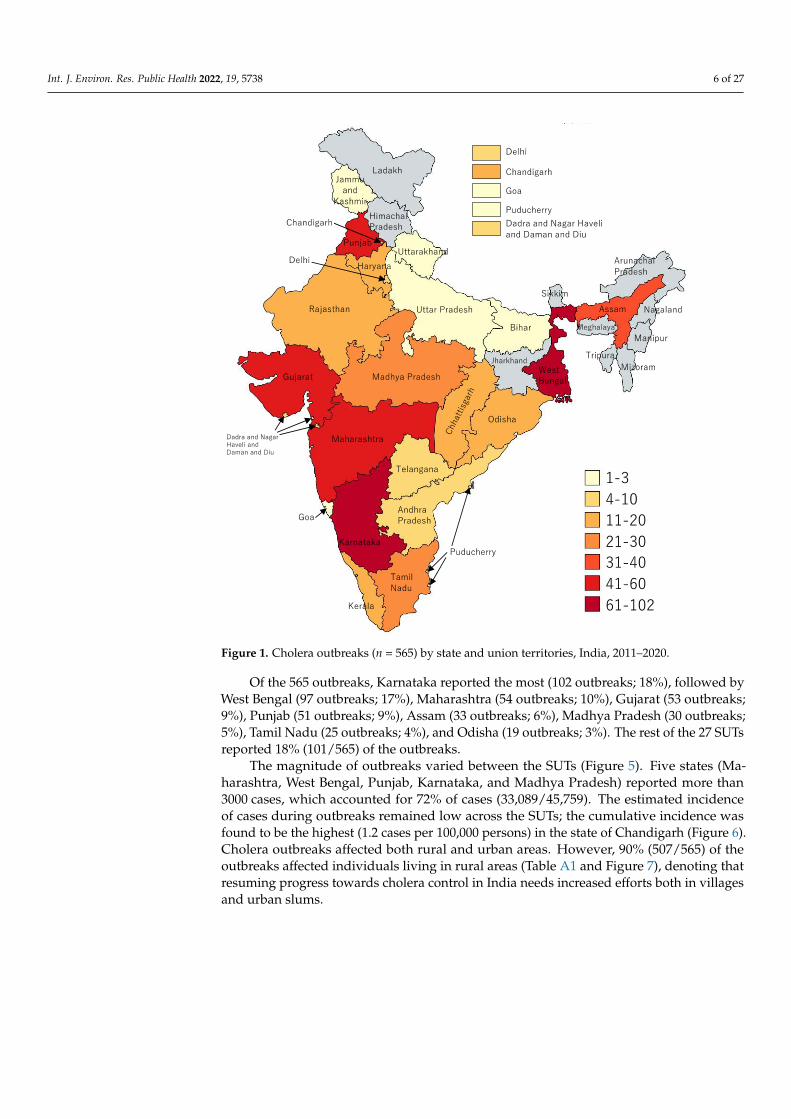
Figure 1. Cholera outbreaks (n = 565) by state and union territories, India, 2011–2020. Figure 1. Cholera outbreaks (n = 565) by state and union territories, India, 2011–2020.
Of the 565 outbreaks, Karnataka reported the most (102 outbreaks; 18%), followed byWest Bengal (97 outbreaks; 17%), Maharashtra (54 outbreaks; 10%), Gujarat (53 outbreaks;9%), Punjab (51 outbreaks; 9%), Assam (33 outbreaks; 6%), Madhya Pradesh (30 outbreaks;5%), Tamil Nadu (25 outbreaks; 4%), and Odisha (19 outbreaks; 3%). The rest of the 27 SUTsreported 18% (101/565) of the outbreaks.
The magnitude of outbreaks varied between the SUTs (Figure 5). Five states (Ma-harashtra, West Bengal, Punjab, Karnataka, and Madhya Pradesh) reported more than3000 cases, which accounted for 72% of cases (33,089/45,759). The estimated incidenceof cases during outbreaks remained low across the SUTs; the cumulative incidence wasfound to be the highest (1.2 cases per 100,000 persons) in the state of Chandigarh (Figure 6).Cholera outbreaks affected both rural and urban areas. However, 90% (507/565) of theoutbreaks affected individuals living in rural areas (Table A1 and Figure 7), denoting thatresuming progress towards cholera control in India needs increased efforts both in villagesand urban slums.

Int. J. Environ. Res. Public Health 2022, 19, 5738 7 of 27
Int. J. Environ. Res. Public Health 2022, 19, 5738 7 of 26
Figure 2. Cholera outbreaks (n = 565) by year and state, India, 2011–2020.
Figure 3. Cholera outbreaks (n = 565) by year, India, 2011–2020.
2011 2012 2013 2014 2015
2016 2017 2018 2019 2020
DL
CH
GA
PY
DD
DL
CH
GA
PY
DD
DL
CH
GA
PY
DD
DL
CH
GA
PY
DD
DL
CH
GA
PY
DD
DL
CH
GA
PY
DD
DL
CH
GA
PY
DD
DL
CH
GA
PY
DD
DL
CH
GA
PY
DD
DL
CH
GA
PY
DD
Figure 2. Cholera outbreaks (n = 565) by year and state, India, 2011–2020.
Int. J. Environ. Res. Public Health 2022, 19, 5738 7 of 26
Figure 2. Cholera outbreaks (n = 565) by year and state, India, 2011–2020.
Figure 3. Cholera outbreaks (n = 565) by year, India, 2011–2020.
2011 2012 2013 2014 2015
2016 2017 2018 2019 2020
DL
CH
GA
PY
DD
DL
CH
GA
PY
DD
DL
CH
GA
PY
DD
DL
CH
GA
PY
DD
DL
CH
GA
PY
DD
DL
CH
GA
PY
DD
DL
CH
GA
PY
DD
DL
CH
GA
PY
DD
DL
CH
GA
PY
DD
DL
CH
GA
PY
DD
Figure 3. Cholera outbreaks (n = 565) by year, India, 2011–2020.

Int. J. Environ. Res. Public Health 2022, 19, 5738 8 of 27Int. J. Environ. Res. Public Health 2022, 19, 5738 8 of 26
Figure 4. Cholera outbreaks (n = 565) by year and season, India, 2011–2020. Winter = December to
January; Pre‐monsoon = March to May; Monsoon = June to September; and Post‐monsoon = Octo‐
ber to November.
Of the 565 outbreaks, Karnataka reported the most (102 outbreaks; 18%), followed
by West Bengal (97 outbreaks; 17%), Maharashtra (54 outbreaks; 10%), Gujarat (53 out‐
breaks; 9%), Punjab (51 outbreaks; 9%), Assam (33 outbreaks; 6%), Madhya Pradesh (30
outbreaks; 5%), Tamil Nadu (25 outbreaks; 4%), and Odisha (19 outbreaks; 3%). The rest
of the 27 SUTs reported 18% (101/565) of the outbreaks.
The magnitude of outbreaks varied between the SUTs (Figure 5). Five states (Ma‐
harashtra, West Bengal, Punjab, Karnataka, and Madhya Pradesh) reported more than
3000 cases, which accounted for 72% of cases (33,089/45,759). The estimated incidence of
cases during outbreaks remained low across the SUTs; the cumulative incidence was
found to be the highest (1.2 cases per 100,000 persons) in the state of Chandigarh (Figure
6). Cholera outbreaks affected both rural and urban areas. However, 90% (507/565) of the
outbreaks affected individuals living in rural areas (Table A1 and Figure 7), denoting that
resuming progress towards cholera control in India needs increased efforts both in vil‐
lages and urban slums.
Figure 5. Reported cholera cases during outbreaks by state, India, 2011–2020.
Figure 4. Cholera outbreaks (n = 565) by year and season, India, 2011–2020. Winter = December toJanuary; Pre-monsoon = March to May; Monsoon = June to September; and Post-monsoon = Octoberto November.
Int. J. Environ. Res. Public Health 2022, 19, 5738 8 of 26
Figure 4. Cholera outbreaks (n = 565) by year and season, India, 2011–2020. Winter = December to
January; Pre‐monsoon = March to May; Monsoon = June to September; and Post‐monsoon = Octo‐
ber to November.
Of the 565 outbreaks, Karnataka reported the most (102 outbreaks; 18%), followed
by West Bengal (97 outbreaks; 17%), Maharashtra (54 outbreaks; 10%), Gujarat (53 out‐
breaks; 9%), Punjab (51 outbreaks; 9%), Assam (33 outbreaks; 6%), Madhya Pradesh (30
outbreaks; 5%), Tamil Nadu (25 outbreaks; 4%), and Odisha (19 outbreaks; 3%). The rest
of the 27 SUTs reported 18% (101/565) of the outbreaks.
The magnitude of outbreaks varied between the SUTs (Figure 5). Five states (Ma‐
harashtra, West Bengal, Punjab, Karnataka, and Madhya Pradesh) reported more than
3000 cases, which accounted for 72% of cases (33,089/45,759). The estimated incidence of
cases during outbreaks remained low across the SUTs; the cumulative incidence was
found to be the highest (1.2 cases per 100,000 persons) in the state of Chandigarh (Figure
6). Cholera outbreaks affected both rural and urban areas. However, 90% (507/565) of the
outbreaks affected individuals living in rural areas (Table A1 and Figure 7), denoting that
resuming progress towards cholera control in India needs increased efforts both in vil‐
lages and urban slums.
Figure 5. Reported cholera cases during outbreaks by state, India, 2011–2020. Figure 5. Reported cholera cases during outbreaks by state, India, 2011–2020.
3.3. Seasonality
Cholera outbreaks occurred throughout the year (Figures 4 and 8); however, theexplosion of outbreaks (61%, 345/565; Figure 9) occurred during monsoon season (Juneto September) in most of the SUTs and the peak was observed in July. The state of TamilNadu is the only exception, where the peak was observed during the winter season, fromDecember to January.

Int. J. Environ. Res. Public Health 2022, 19, 5738 9 of 27Int. J. Environ. Res. Public Health 2022, 19, 5738 9 of 26
Figure 6. Rate of reported cholera outbreaks per 100,000 persons, India, 2011–2020.
Figure 7. Cholera outbreaks (n = 565) by type of setting (rural vs. urban), India, 2011–2020. DNHDD
= Dadra and Nagar Haveli and Daman and Diu.
3.3. Seasonality
Cholera outbreaks occurred throughout the year (Figures 4 and 8); however, the
explosion of outbreaks (61%, 345/565; Figure 9) occurred during monsoon season (June to
September) in most of the SUTs and the peak was observed in July. The state of Tamil
Nadu is the only exception, where the peak was observed during the winter season, from
December to January.
Figure 6. Rate of reported cholera outbreaks per 100,000 persons, India, 2011–2020.
Int. J. Environ. Res. Public Health 2022, 19, 5738 9 of 26
Figure 6. Rate of reported cholera outbreaks per 100,000 persons, India, 2011–2020.
Figure 7. Cholera outbreaks (n = 565) by type of setting (rural vs. urban), India, 2011–2020. DNHDD
= Dadra and Nagar Haveli and Daman and Diu.
3.3. Seasonality
Cholera outbreaks occurred throughout the year (Figures 4 and 8); however, the
explosion of outbreaks (61%, 345/565; Figure 9) occurred during monsoon season (June to
September) in most of the SUTs and the peak was observed in July. The state of Tamil
Nadu is the only exception, where the peak was observed during the winter season, from
December to January.
Figure 7. Cholera outbreaks (n = 565) by type of setting (rural vs. urban), India, 2011–2020.DNHDD = Dadra and Nagar Haveli and Daman and Diu.

Int. J. Environ. Res. Public Health 2022, 19, 5738 10 of 27Int. J. Environ. Res. Public Health 2022, 19, 5738 10 of 26
Figure 8. Number of cholera outbreaks (n = 565) by month and transmission routes, India, 2011–
2020.
Figure 9. Cholera outbreaks (n = 565) in different seasons, India, 2011 to 2020. Winter = December to
January; Pre‐monsoon = March to May; Monsoon = June to September; and Post‐monsoon = Octo‐
ber to November.
3.4. Transmission Routes and Source of Water Contamination
From the IDSP surveillance data, the proportion of outbreaks in which the routes of
transmission were identified was 62% (351/565), whereas 38% (214/565) had either un‐
known routes of transmission or were not reported. Among the 351 outbreaks, 319 (91%)
transmission routes were the consumption of contaminated drinking water or exposure
Figure 8. Number of cholera outbreaks (n = 565) by month and transmission routes, India, 2011–2020.
Int. J. Environ. Res. Public Health 2022, 19, 5738 10 of 26
Figure 8. Number of cholera outbreaks (n = 565) by month and transmission routes, India, 2011–
2020.
Figure 9. Cholera outbreaks (n = 565) in different seasons, India, 2011 to 2020. Winter = December to
January; Pre‐monsoon = March to May; Monsoon = June to September; and Post‐monsoon = Octo‐
ber to November.
3.4. Transmission Routes and Source of Water Contamination
From the IDSP surveillance data, the proportion of outbreaks in which the routes of
transmission were identified was 62% (351/565), whereas 38% (214/565) had either un‐
known routes of transmission or were not reported. Among the 351 outbreaks, 319 (91%)
transmission routes were the consumption of contaminated drinking water or exposure
Figure 9. Cholera outbreaks (n = 565) in different seasons, India, 2011 to 2020. Winter = December toJanuary; Pre-monsoon = March to May; Monsoon = June to September; and Post-monsoon = Octoberto November.
3.4. Transmission Routes and Source of Water Contamination
From the IDSP surveillance data, the proportion of outbreaks in which the routesof transmission were identified was 62% (351/565), whereas 38% (214/565) had eitherunknown routes of transmission or were not reported. Among the 351 outbreaks, 319 (91%)transmission routes were the consumption of contaminated drinking water or exposure tounimproved water sources, and 32 (9%) were a lack of hygiene or inadequate sanitation.

Int. J. Environ. Res. Public Health 2022, 19, 5738 11 of 27
In more detail, transmission routes were (i) waterborne, including leaking waterpipelines; (ii) inadequate sanitation or hygiene, including open defecation; (iii) waterbornewith inadequate sanitation/hygiene; and (iv) foodborne/household spread or during socialgatherings (Table 2; Figures 8, 10 and 11). As for changes over time in these transmissionroutes, a decreasing trend was observed in the number of outbreaks linked to leakingwater pipelines (Figure 11). The median annual number of outbreaks due to leaking waterpipelines from 2011 to 2015 was higher than from 2016 to 2020 (Table 2). However, there wasno change in the median annual number of cholera outbreaks linked to other transmissionroutes, although the absolute number was generally higher from 2011 to 2015 (n = 347)compared with 2016 to 2020 (n = 218).
Int. J. Environ. Res. Public Health 2022, 19, 5738 11 of 26
to unimproved water sources, and 32 (9%) were a lack of hygiene or inadequate sanita-
tion.
In more detail, transmission routes were (i) waterborne, including leaking water
pipelines; (ii) inadequate sanitation or hygiene, including open defecation; (iii) water-
borne with inadequate sanitation/hygiene; and (iv) foodborne/household spread or
during social gatherings (Table 2; Figures 8, 10 and 11). As for changes over time in these
transmission routes, a decreasing trend was observed in the number of outbreaks linked
to leaking water pipelines (Figure 11). The median annual number of outbreaks due to
leaking water pipelines from 2011 to 2015 was higher than from 2016 to 2020 (Table 2).
However, there was no change in the median annual number of cholera outbreaks linked
to other transmission routes, although the absolute number was generally higher from
2011 to 2015 (n = 347) compared with 2016 to 2020 (n = 218).
Figure 10. Number of cholera outbreaks (n = 565) by state and transmission routes, India, 2011–
2020. Multiple modes of transmission were involved in some outbreaks.
Figure 11. Number of cholera outbreaks (n = 565) by transmission routes and year, India, 2011–
2020.
Waterborne
DL
CH
GA
PY
DD
Waterborne: Water pipeline leaks
DL
CH
GA
PY
DD
Open defecation
DL
CH
GA
PY
DD
Poor sanitation
DL
CH
GA
PY
DD
Waterborne with inadequate
sanitation and poor hygiene
DL
CH
GA
PY
DD
Foodborne/close contact/gathering
DL
CH
GA
PY
DD
Figure 10. Number of cholera outbreaks (n = 565) by state and transmission routes, India, 2011–2020.Multiple modes of transmission were involved in some outbreaks.
Int. J. Environ. Res. Public Health 2022, 19, 5738 11 of 26
to unimproved water sources, and 32 (9%) were a lack of hygiene or inadequate sanita‐
tion.
In more detail, transmission routes were (i) waterborne, including leaking water
pipelines; (ii) inadequate sanitation or hygiene, including open defecation; (iii) water‐
borne with inadequate sanitation/hygiene; and (iv) foodborne/household spread or
during social gatherings (Table 2; Figures 8, 10 and 11). As for changes over time in these
transmission routes, a decreasing trend was observed in the number of outbreaks linked
to leaking water pipelines (Figure 11). The median annual number of outbreaks due to
leaking water pipelines from 2011 to 2015 was higher than from 2016 to 2020 (Table 2).
However, there was no change in the median annual number of cholera outbreaks linked
to other transmission routes, although the absolute number was generally higher from
2011 to 2015 (n = 347) compared with 2016 to 2020 (n = 218).
Figure 10. Number of cholera outbreaks (n = 565) by state and transmission routes, India, 2011–
2020. Multiple modes of transmission were involved in some outbreaks.
Figure 11. Number of cholera outbreaks (n = 565) by transmission routes and year, India, 2011–
2020.
Waterborne
DL
CH
GA
PY
DD
Waterborne: Water pipeline leaks
DL
CH
GA
PY
DD
Open defecation
DL
CH
GA
PY
DD
Poor sanitation
DL
CH
GA
PY
DD
Waterborne with inadequate sanitation and poor hygiene
DL
CH
GA
PY
DD
Foodborne/close contact/gathering
DL
CH
GA
PY
DD
Figure 11. Number of cholera outbreaks (n = 565) by transmission routes and year, India, 2011–2020.
In some settings (Table A2), cholera outbreaks were specifically linked to the useof contaminated sources such as pond water [29,40], wells [26,28,41], pipe water [45],handpumps [32], leaky water pipelines [30,33,36,39,43–45], consumption of untreatedmunicipal water [30], and unboiled water [39]. The one seasonal activity that could belinked to the cholera outbreaks was the period of paddy cultivation during which the

Int. J. Environ. Res. Public Health 2022, 19, 5738 12 of 27
farmers practice open defecation and consume drinking water from open wells withinpaddy fields [26] and from nearby rivers [35]. The spread of V. cholerae in India also benefitsfrom the back-and-forth flow of the population for labor or trade between rural areas andperi-urban slums. For instance, when there is no work on the farms, seasonal waged labordrives rural people towards urban areas as part-time workers and thereafter these ruralpeople return to the villages for farming during rainy seasons [35].
Several outbreaks were attributed to fecal contamination of drinking water, i.e., watersamples with coliforms above the maximum permissible number [26,30,32,37,38,40,41,43].
Some outbreaks particularly arose in zones prone to natural disasters (i.e., flooding orcyclone) or during humanitarian emergencies as a result of water contamination due to over-flowing toilets, canals, and drains [31], interrupted water distribution, or shortages of drink-ing water supply leading to the usage of unimproved water sources [34,38,39]. Shortage ofdrinking water during the summer also compelled people to use contaminated water [28].
However, it is sometimes challenging to isolate V. cholerae O1 or O139 from watersamples. For instance, we noted that in a subset of studies, water samples were negativefor V. cholerae even though patients showed typical cholera-like symptoms [32,33,35,41].
4. Discussion
In this study, we sought to understand whether there is any decreasing trend amongthe key drivers of cholera outbreaks in India by comparing two periods: 2011–2015 and2016–2020. Of the reviewed modes of transmission (Table 2), only outbreaks due to dam-aged water pipelines showed a decreasing trend. As compared to a previous reportsummarizing cholera outbreaks from 1997 to 2006 [8], our review provides good evidenceto substantiate the fact that access to safe water and sanitation continues to be an issue in In-dia. A similar situation was also observed in Bangladesh, where leakages in water pipelineswere the most frequent route of cholera transmission [46]. Damaged water pipelines andsanitation had also been hypothesized to spread cholera in Ghana, Guinea, and SierraLeone [47]. Francois Jeannot recently pointed out that access to safe water and sanitationdeclined in Haiti from 1990 to 2015, and this issue creates a fertile ground for the spreadof cholera [48].
From 2011 to 2020, we identified 565 reported cholera outbreaks that occurred ev-ery year. This is different from the African continent where outbreaks are sporadic inmost African countries, except in some countries such as the Democratic Republic of theCongo (DRC) and Mozambique [49]. In 2016, cholera outbreaks were at their highest(Figures 3 and 11). The reasons for this finding are unknown. While other explanationsare possible, one hypothesis is that this increasing trend could have been the result ofmore thorough reporting of outbreaks from the affected SUTs. Another hypothesis is thatIndia experienced its warmest year since 1901 in 2016 (ideal conditions for copepods tothrive). As a result, the amount of rain that fell during the 2016 monsoon varied, withbelow-normal rainfall in June and August (87%), and above-normal rainfall in July (107%;accompanied by flooding and cyclones), thus affecting water demands, especially forrural communities [50].
In this study, the overall number of cholera cases was lower (n = 45,759) comparedwith reported cases from 1997 to 2006 (n = 222,038) [8], but the case fatality rate was slightlyhigher during the period 2011–2020. The case fatality rate was 0.6% during the period2011–2020 in contrast to 0.4% in the period from 1997 to 2006. However, the case fatalityrate found in this study is within the range (0.07–0.6) reported in the previous ten-yearperiod (1997 to 2006) [8]. Differences in the case fatality rate could be due to the currentrelatively improved surveillance and reporting in recent times.
The picture of cholera outbreaks has also changed in terms of geographical distribution.States with high morbidity were quite different in the recent decade (2011–2020) comparedto the previous decade (1997 to 2006), except the state of West Bengal which consistentlyfalls within the cholera-prone region. In this study, 72% of outbreak-related cases werereported from five states (Maharashtra, West Bengal, Punjab, Karnataka, and Madhya

Int. J. Environ. Res. Public Health 2022, 19, 5738 13 of 27
Pradesh). However, during the period 1997–2006, 91% of the cases were reported in fourstates (West Bengal, Odisha, Chhattisgarh, and Andaman and Nicobar Islands). This meansthat outbreaks are not limited only to the endemic states (such as West Bengal); thus,vigilance is needed even in states that do not report outbreaks.
Outbreaks were reported from 24 of the 36 SUTs. Despite having similar socio-economic difficulties in 12 no-cholera outbreak reporting states, this is a very unlikelyscenario. This seems to be due to a general stigma against cholera in Indian society. Thisprecludes the authorities from disclosing cholera outbreaks as it portrays a tarnished imageof the water distribution networks and sanitation systems of their states [11]. Alternativeexplanations for underreporting could be attributed to the limited laboratory diagnosticresources, especially in the peripheral healthcare centers, along with constraints in cholerasurveillance resources [1,8].
Only 21 cholera outbreaks were found in the peer-reviewed literature; an obviousexplanation for this relatively low number of publications pertaining to the perceivednotion of the investigators that this kind of outbreak reporting lacks novelty. Therefore, itis less likely to get published in a peer-reviewed journal [8]. Another explanation is that wemight have missed some articles as Google scholar and Indian medical journals were notsearched; we consider this to be one of the limitations of this study.
Despite the efforts of the Indian government to invest in efficient programmaticwater sanitation and hygiene (e.g., Swachh Bharat Mission), there are numerous challengesto cope with, such as in-house contamination of drinking water [51], inadequate waterinfrastructures resulting in contamination of drinking water, and a shortage of water supplycompelling people to use unimproved water sources. The fact that water was found to bethe major vehicle for cholera outbreaks is not surprising because 90% (507/565) of reportedoutbreaks occurred in rural India, where inequity in clean water distribution is a significantproblem. For example, in rural India, only 16% of people used improved piped water fordrinking in 2015 [15,16]. In addition, the widespread fecal contamination of drinking wateris still common in the country [26,30,32,37,38,40,41,43], in part due to higher rates of opendefecation across the country and decaying sewage infrastructure.
Fecal contamination of the surrounding environment by persons infected with V. choleraeis frequently observed in India. This can be seen in the state of Odisha, where tribal peoplepractice open defecation [29]. Another set of people who might be responsible for thefecal contamination is daily workers—people who move day-by-day to earn their livingsuch as street vendors, farmers, fishermen, and traders. These people may be compelledeither to practice open defecation or defecate in unimproved toilets in heavily pollutedenvironments [52]. Therefore, a hygienic sanitation campaign for these people might servea bigger purpose. It is also increasingly evident that exposure to V. cholerae in the countryhas centered overwhelmingly around some workplaces such as tea gardens, urban slums,and colonies where marginalized people of society reside due to a lack of access to basicwater and sanitation services [19]. This observation is quite similar in countries whereV. cholerae thrives. For instance, a fishing community in Uganda practices open defecationleading to cholera outbreaks [53] or discharges pit latrines into open drainage channelsduring heavy rains, contaminating well water, which also results in cholera outbreaks [54].
The studies reviewed suggest that V. cholerae can be transmitted through close person-to-person contact and also via environmental water during outbreaks In India. In contrast,V. cholerae is rarely detected in environmental water bodies of African countries (exceptsome countries such as Mozambique). The principal mode of cholera spread was person-to-person contact in most African countries such as Uganda and Cameroon [49].
We found that contact with a patient suffering from cholera or an asymptomatic humancarrier increased the risk of illness [37,40,55–58]. This may occur via fomites, food, or water(e.g., stored in-house water) contaminated with V. cholerae. Someone who touched infectedfomites with V. cholerae unknowingly became a carrier, and in the absence of handwashingwith soap, this carrier might, in turn, contaminate edibles or infect the person through afecal–oral pathway. For instance, in-house fecal contamination of stored water represents

Int. J. Environ. Res. Public Health 2022, 19, 5738 14 of 27
a major hygiene problem in India. This issue was highlighted in one study where theyfound that 7% of stored water samples contained V. cholerae in the urban slums of Kolkataand 58% of samples had fecal coliforms higher than permissible limits [51]. This remindsus that we should not underestimate the basic health-promoting behavior of frequenthandwashing with soap, especially in the context of India, due to two cultural habits. Oneof them is the habit of anal cleansing with water after defecation using hands and anotherone is eating with bare hands as socio-cultural norms. The lack of handwashing afteranal cleansing followed by food consumption using those hands establishes an easy routefor coliform intake. Households with limited access to handwashing resources (soap andrunning water) would not be able to often wash their hands and handwashing will lesslikely to be a priority and thus, the awareness about handwashing would be meaningless.Therefore, we need to develop and maintain hand-washing facilities alongside providinglogistics to support hand-washing. Even the ample availability of handwashing facilitieswill neither automatically translate into their higher usage (high uptake) nor into effectivehealth benefits because it requires substantial behavioral changes that might be difficultto maintain over time. Thus, we stress targeting educational efforts that would probablygive desirable outcomes along with social mobilization, support for behavioral changeand counselling as an alternative intervention strategy to enhance compliance in order toreduce exposure to V. cholerae.
During cholera outbreaks, cooking stations, areas in close proximity to the patient’sbed, and toilet floors were found to be the most contaminated surfaces in a household [59].The sanitization of household surfaces and drinking water with chlorine-based disinfectantnot only reduces cholera transmission but can also provide room for hygiene promotion.Therefore, it would be an ideal tool for curbing the burden of cholera. However, previousattempts to use household sprays to control cholera outbreaks did not warrant whether theprocedure was effective because often this is not conducted in a timely manner, i.e., whenV. cholerae had already been transmitted to other healthy household members by the sickperson. It should be borne in mind that there are drawbacks associated with householdspraying such as stigma, and household disinfection by a response team might increasehesitation among people to report cholera cases. Hence, new research is needed to yieldsufficient evidence to support the use of household spraying during cholera outbreaks.
Countries such as Thailand [60] and Singapore [61] have also experienced contami-nation of food as the mode of cholera transmission, as with India. The consumption ofcontaminated food supplies remains a prominent driver of cholera outbreaks across SUTs,demonstrating that food-related transmission plays a non-negligible role in the spread ofV. cholerae and we have to increasingly recognize the need to tackle this issue in order toensure successful control of outbreaks. However, food-related cholera outbreaks have beenunder-explored in India with only very few published studies, which denotes a criticalresearch gap. Any food contaminated with V. cholerae can spread the disease. In India,different foods had been incriminated in cholera outbreaks such as fermented rice, knownas Pantha Bhat [40], milk products [56], and ice cream [62]. Some of these contaminatedfoods were from street vendors [40,62], indicating that food-related cholera outbreakscould still be a great public issue. Thus, the intervention methods targeting street foodmight be an effective method to prevent secondary transmission. Another critical factoris the presence of asymptomatic cholera carriers among the general population. Thesepeople, in spite of infection with V. cholerae, might remain asymptomatic but shed thebacteria in their feces and, therefore, are likely to sustain the transmission chain. Thisobservation emphasizes the importance of targeting asymptomatic food handlers such asstreet food vendors by the investigators of outbreaks whenever food is suspected to bethe cause of the outbreak. Especially, food handlers with diarrhea should be given adviceon hygiene, and should not handle food that other people would eat. The observationof this review is consistent with the findings from a recent meta-analysis which reportedthat the consumption of street food was associated with a 5-fold increase in the odds ofcholera [4]. These observations advocate for prevention efforts focused on tailored hygiene

Int. J. Environ. Res. Public Health 2022, 19, 5738 15 of 27
and cooking practices in people responsible for preparing food. In addition, advice mustbe given about the proper storage of cooked food and, if bound to keep food at ambienttemperature because of poor resources, food must be heated before consumption. In someinstances, it had been observed that uncontaminated food was unknowingly mixed withcontaminated water due to a particular kind of food habit. This was illustrated in an out-break triggered among villagers due to the consumption of fermented rice that was madeusing pond water that had neither been boiled nor chlorine treated. Even after villagersbecame ill, they said that the fermented rice tasted good only when pond water was usedfor its preparation [40], which further justifies the need to encourage behavioral changes aspart of the prevention efforts.
There are two relevant limitations in the interpretation of our findings. Firstly, thedepiction of our conclusion is based on the cholera outbreak data provided by the IDSPsurveillance system and peer-reviewed articles which most likely underestimate the num-ber of cholera outbreaks that have occurred in India since 2011. One possible explanationfor this probable underestimation is that many outbreaks were classified as of unknown eti-ology and recorded in IDSP as outbreaks of acute watery diarrhea [22] and some outbreakscould have been missed during the literature search. Secondly, there were differences inoutbreak notifications over time periods or SUTs. This means that for any comparisons oftrends, one needs to apply caution in interpreting the data of interferences that could influ-ence the detection of outbreaks along with their reporting systems. Notably, the decreasednumber of cholera outbreaks reported in 2020 was likely due to constraints in surveillancebecause of the COVID-19 pandemic, and SUTs with viable IDSP infrastructure and diag-nostic facilities were more likely to report more about cholera outbreaks as compared toother SUTs with rudimentary surveillance structures [9].
5. Conclusions
In conclusion, an analysis of reported cholera outbreaks in India reconfirms thatcholera is indeed a disease associated with destitution which mostly affects the neglectedpopulation. Most of the outbreaks occurred in rural India, where only 16% of people usedimproved piped water for drinking and open defecation is a common practice. Surprisingly,outbreaks due to damaged water pipelines showed a decreasing trend when a comparisonwas made between the two time periods 2011–2015 and 2016–2020.
Cholera outbreaks in India are likely to recur unless social and economic development(including higher education and better housing) improves dramatically along with thetermination of apparently insurmountable behaviors such as doing the laundry in ponds,hygienic bathing in an environmental water source after defecation, open defecation, infre-quent handwashing, and eating unhygienic street foods. The spread of V. cholerae duringoutbreaks should not be interrupted only through the intrusion of long-cycle transmission(mediated through the environment and water supply) but also by the interruption ofshort-cycle transmission of cholera mediated by unhygienic practices of households andfood contamination.
Previous studies investigating outbreaks in India have recommended equally impor-tant measures that can be applied to counter future outbreaks. These include targeted useof cholera vaccines, access to safe drinking water, chlorination of water sources, regulardisinfection of tube wells and wells, filtering the water with a piece of silk cloth, supply-ing oral rehydration salts (ORS), antibiotics and bleaching powder, use of telemedicine,action research, adequate sanitation, promotion of good personal hygiene, education andawareness campaigns (e.g., regarding latrine sanitation), safe food handling, proper sewagedisposal, construction of drainage water away from the water pipelines, and long-termdisease surveillance.
Supplementary Materials: The following supporting information can be downloaded at: https://www.mdpi.com/article/10.3390/ijerph19095738/s1, Supplementary Figure S1: Flow chart showingevidence search and selection of studies (Cholera outbreaks in India, 2011–2020); Supplementary

Int. J. Environ. Res. Public Health 2022, 19, 5738 16 of 27
Figure S2: Cholera outbreaks in selected state and union territories comparing 2011–2015 with2016–2020. The states of Tamil Nadu and Haryana did not cholera outbreaks during 2016–2020.
Author Contributions: B.A.M. and S.-I.M.: study conception and its design; B.A.M. and K.K.:data collection, analysis and interpretation; B.A.M.: wrote the first draft of the manuscript; K.K.:Commented on an early version of the manuscript; K.K., A.D., A.O., K.O. and S.-I.M.: revised themanuscript for important academic content. S.-I.M.: supervised this work. All authors have read andagreed to the published version of the manuscript.
Funding: We declare that we have no conflicts of interest. This study was supported by the JapanInitiative for Global Research Network on Infectious Diseases (J-GRID) from the Ministry of Education,Culture, Sports, Science & Technology in Japan (MEXT), and the Japan Agency for Medical Researchand Development (AMED; Grant Number 21wm0125004h0002). The funders had no role in its studydesign, data collection and analysis, decision to publish, or preparation of the manuscript. All authorshad full access to all the data in the review process, and the corresponding author had the finalresponsibility in deciding to submit this article for publication.
Institutional Review Board Statement: No applicable.
Informed Consent Statement: No applicable.
Data Availability Statement: All relevant data are within the manuscript and its supporting infor-mation files.
Acknowledgments: We would like to thank Matthew James McLaughlin for his editing skills andMansongi Biyela Carine for her assistance in searching for articles in the reference lists of relatedreview articles.
Conflicts of Interest: The authors declare no conflict of interest.
Appendix A

Int. J. Environ. Res. Public Health 2022, 19, 5738 17 of 27
Table A1. Characteristics of included studies.
OutbreakNumber References Location Urban/Rural
AreaStudy
Design/TypeStudyPeriod
Age (Year)/Descriptor
OutbreakDuration
(Days)
Populationat Risk
Number ofCholera
Cases
Attack Rate(Case/100Person)
Case FatalityRatio
(Number ofDeath)
OccurrenceMonth
1 Dutta, 2021[26]
Ghughri,MadhyaPradesh,Central
Rural Cross-sectional 2016 27 (1–76) 30 101,115 628 0.6 2 (14/628) August
2 Jain, 2021[27]
Shahpur,Haryana,Northern
Rural Cross-sectional 2019 18 (1–65) 29 2602 196 8 1 (2/196) September
3 Kale, 2020[28]
Yavatmal,Maharashtra,
WesternRural Cross-
sectional 2018 All - - - - - March–July
4 and 5Nayak, 2020
[29]Odisha,Eastern Rural Cross-
sectional
2018 >5 4 1387 55 4.0 0 August
2019 >5 5 500 73 14.6 1.4 April
6 Singh, 2020[30]
Bhadola,Delhi,
NorthernUrban Case-control 2018 Median = 14.5 56–59 7280 129 1.8 0 April-May
7 Mukhopadhyay,2019 [31]
Kolkata andvicinity, West
Bengal,Eastern
Urban Cross-sectional 2015 Median = 26 15 - - - 1 death August
8 Goswami,2019 [32]
Wardha,Maharashta,
WesternUrban Cross-
sectional 2018 3–65 9 104 28 27 0 July
9 Gopalkrishna,2019 [33]
Aurangabad,Maharashta,
WesternUrban Cross-
sectional 2017 >14 (90%) 12 16,000 7447 47 - November
10 Pal, 2019[34]
Odisha,Eastern Rural Cross-
sectional 2018 All - - - - 0 May
11 Pal, 2017[35]
Narla,Kalahandi,
Odisha,Eastern
Urban Cross-sectional 2014 >20 60 46,236 321 0.7 0.9 July–
September

Int. J. Environ. Res. Public Health 2022, 19, 5738 18 of 27
Table A1. Cont.
OutbreakNumber References Location Urban/Rural
AreaStudy
Design/TypeStudyPeriod
Age (Year)/Descriptor
OutbreakDuration
(Days)
Populationat Risk
Number ofCholera
Cases
Attack Rate(Case/100Person)
Case FatalityRatio
(Number ofDeath)
OccurrenceMonth
12Uthappa,
2015[36]
Medipally,Telangana,Southern
Rural Case-control 2013 All 9 – 138 11.5 0.7(1 death) November
13Bhattacharya,
2015[37]
Somanakoppa,Bagalkot,
Karnataka,Southern
Rural Cross-sectional 2013 - 12 – 49 3.5 – August
14 Allam, 2015[38]
Medak,AndhraPradesh,Southern
Rural Cross-sectional 2013 All (0–74) 30 281 3.3 1.4 (3 deaths) August
15Fredrick,
2015[39]
Pondicherry,Puducherry,
SouthernUrban Case-control 2012 All 13 8367 921 11 0.1 (1 death) January
16 Biswas, 2014[40]
Haibatpur,West Bengal,
EasternRural Cross-
sectional 2012 33 (5 to 80) 14 780 41 5 0 June
17 and 18Dey, 2014
[41]
Talikoti,Bijapur,Karnata,Southern
Semi-rural Cross-sectional 2012 All 20 26,205 101 0.4 0 July–August
Harnal,Bijapur,Karnata,Southern
Rural Cross-sectional 2012 All 7 960 200 21 0 July–August
19Kumar,2014 *[42]
Kalamb andYavatmal,
Maharashtra,Western
Urban Cross-sectional 2012 - - - - - 4.5 May

Int. J. Environ. Res. Public Health 2022, 19, 5738 19 of 27
Table A1. Cont.
OutbreakNumber References Location Urban/Rural
AreaStudy
Design/TypeStudyPeriod
Age (Year)/Descriptor
OutbreakDuration
(Days)
Populationat Risk
Number ofCholera
Cases
Attack Rate(Case/100Person)
Case FatalityRatio
(Number ofDeath)
OccurrenceMonth
19Kumar,2014 *[43]
Kalamb andYavatmal,
Maharashtra,Western
Urban Cross-sectional 2012 - - - - - - May
20 Puri, 2014[44]
Vikas Nagar,Chandigarh,
NorthernUrban Cross-
sectional 2012 All 14 15,000 1875 15 (4 deaths) July
21Mahanta,
2013[45]
Bagjan,Sivasagar,
Assam,North-eastern
Rural Cross-sectional 2012 41 (3–70) - 2503 120 4.8 0.83 (1 death) May
*: These two studies described the same outbreak.
Table A2. Sources of outbreaks.
Study Risk FactorsAssessed Men (%) Women (%) Population Cholera
Definition Serogroup Serotype/Biotype
TransmissionRoute/Suspected
Exposure
NumberExamined
Number ofInfected
Individuals
Prevalence(95% CI) Comment
Dutta, 2021[26] Water 39 61 Community
Clinical;Culture-
confirmedVC O1
Ogawabiotype El
Tor
Contaminateddrinking water 34 11 32
More womenwere
affected.
Jain, 2021[27]
Water,Environment 46 54 Community
Clinical;Culture-
confirmed- - Contaminated
drinking water 18 4 22
Attack rateswere highestin the 11–20years group
Kale, 2020[28] None - - -
Clinical;Culture-
confirmedVC O1
Ogawabiotype El
Tor
Contaminateddrinking water 711 109 15
Males andwomen were
equallyaffected

Int. J. Environ. Res. Public Health 2022, 19, 5738 20 of 27
Table A2. Cont.
Study Risk FactorsAssessed Men (%) Women (%) Population Cholera
Definition Serogroup Serotype/Biotype
TransmissionRoute/Suspected
Exposure
NumberExamined
Number ofInfected
Individuals
Prevalence(95% CI) Comment
Nayak, 2021[29]
Water,Hygiene - - -
Clinical;Culture-
confirmed
Haitianvariant of VC
O1
Ogawabiotype El
Tor
Pond water usedto cook foods andclean utensils at alocal festival and
marriageceremony
65 27 42 (30 to 54)
Children < 5were notaffected.
More womenwere affected
Singh, 2020 [30]
Water,Hygiene,
Knowledgeon diarrhea
transmission
48 52 -Clinical;Culture-
confirmedVC O1
Ogawabiotype El
Tor
Drinkinguntreated
municipal water129 6 5 (2 to 10) -
Mukhopadhyay,2019 [31] Habitation 56 44
Hospital-based
surveillance
Clinical;Culture-
confirmedVC O1
Ogawabiotype El
Tor andInaba
Living near waterchannel andcentral lake
channel.Contamination of
drinking watersources due tooverflowing of
canals and drainsduring
heavy rains
204 63 31 (25 to 38)
Age range: 5months to 99
years. Nodifference
between menand women
Goswami, 2019[32]
Habitationlocation,Water
- - -Clinical;Culture-
confirmedVC O1
Ogawabiotype El
Tor
Hand pump;drinking water 28 2 7 (2 to 23)
Most caseswere children(0–10); Moremales were
affected
Gopalkrishna,2019 [33] Water - - -
Clinical;Culture-
confirmedVC O1
Ogawabiotype El
Tor
Fecalcontamination of
the river waterand leakage in
the pipeline
46 6 13 (6 to 26) -

Int. J. Environ. Res. Public Health 2022, 19, 5738 21 of 27
Table A2. Cont.
Study Risk FactorsAssessed Men (%) Women (%) Population Cholera
Definition Serogroup Serotype/Biotype
TransmissionRoute/Suspected
Exposure
NumberExamined
Number ofInfected
Individuals
Prevalence(95% CI) Comment
Pal, 2019[34] Water - - -
Clinical;Culture-
confirmedVC O139 -
Heavy raincontaminated
muddywater supply
20 15 75 (53 to 89) -
Pal, 2017[35] Water - - - - -
Ogawabiotype,
ctxB7 variantof
Haitian VC
Contaminateddrinking water
source,unhygienic
conditions in thehouse, unsafe
disposal of fecalmaterials,
cleaning ofexcrement-
contaminatedclothes in nearbywater reservoirs,visiting choleric
patients
17 11 65 (41 to 83)
Prevalencehigh in
children< 1 year
Allam, 2015[38]
Water,Hygiene - - -
Clinical;Culture-
confirmedVC O1
OgawabiotypeEl Tor
Contaminateddrinking water 10 1 - -
Bhattacharya,2015[37]
Water,hygiene - - -
Clinical;Culture-
confirmedVC O1
OgawabiotypeEl Tor
Contaminateddrinking water 6 4 - -
Uthappa, 2015[36]
Water,household
size, hygiene,socio-
demographics
53 47 -Clinical;Culture-
confirmedVC O1
OgawabiotypeEl Tor
Contaminateddrinking
water source- 138 -
Prevalencehigh in
children≤ 5 year
Fredrick, 2015[39]
Water,Hygiene 47 53 -
Clinical;Culture-
confirmedVC O1
OgawabiotypeEl Tor
Contaminateddrinking water 16 9 - -
Biswas, 2014[40]
Water,hygiene 69 31 -
Clinical;Culture-
confirmedVC O1
OgawabiotypeEl Tor
Contaminateddrinking
water source- 41 - -
Int. J. Environ. Res. Public Health 2022, 19, 5738 22 of 27
Table A2. Cont.
Study Risk FactorsAssessed Men (%) Women (%) Population Cholera
Definition Serogroup Serotype/Biotype
TransmissionRoute/Suspected
Exposure
NumberExamined
Number ofInfected
Individuals
Prevalence(95% CI) Comment
Dey, 2014[41]
Water,Hygiene - - -
Clinical;Culture-
confirmedVC O1
OgawabiotypeEl Tor
Contaminateddrinking water 7 5 -
Allage-groups
were affected
Kumar, 2014[43]
Water,Environment - - Hospital - VC O1
OgawabiotypeEl Tor
Contaminateddrinking
water source- 20 -
Leakage inwater pipes
mixing waterwith
drainage
Puri, 2014[44]
Water,Environment,
Food,Mass
gathering
53 47 Hospital andcommunity
Clinical;Culture-
confirmedVC O1
OgawabiotypeEl Tor
Contaminateddrinking
water source- 8 - -
Mahanta, 2013[45]
Demographics,Socioeconomic,Environmental
- - -Clinical;Culture-
confirmedVC O1
OgawabiotypeEl Tor
Contaminateddrinking
water source13 3 23 -
VC = vibrio cholerae; NR = not reported.
Table A3. Study quality.
Study Aim ClearlyStated
SettingProvided
Study Designor Sampling
MethodExplained
CaseDefinition ofDiarrhea or
CholeraClearly
Mentioned
Statistical orAnalysisMethodsReported
Risk Factorsfor Outbreak(or Causes ofOutbreaks)
Investigated
Case FatalityRatio
Reported
Performanceof
ConfirmatoryTest (Culture
or PCR)
Limitations orPotential
ConfoundersDiscussed
Score Risk of Bias
Dutta, 2021[26] Yes Yes No Yes Unclear Yes Yes Yes Yes 7 Moderate
Jain, 2021[27] Yes Yes No Yes Unclear Yes Yes Yes Yes 7 Moderate
Kale, 2020[28] Yes Yes No No No Yes Yes Yes No 5 Moderate
Int. J. Environ. Res. Public Health 2022, 19, 5738 23 of 27
Table A3. Cont.
Study Aim ClearlyStated
SettingProvided
Study Designor Sampling
MethodExplained
CaseDefinition ofDiarrhea or
CholeraClearly
Mentioned
Statistical orAnalysisMethodsReported
Risk Factorsfor Outbreak(or Causes ofOutbreaks)
Investigated
Case FatalityRatio
Reported
Performanceof
ConfirmatoryTest (Culture
or PCR)
Limitations orPotential
ConfoundersDiscussed
Score Risk of Bias
Nayak, 2020[29] Yes Yes Yes Yes No Yes Yes Yes No 7 Moderate
Singh, 2020 [30] Yes Yes Yes Yes No Yes Yes Yes Yes 9 Low
Mukhopadhyay,2019 [31] Yes Yes Yes Yes No Yes Yes Unclear No 6 Moderate
Goswami, 2019[32] Yes Yes Yes Yes No Yes Yes Yes No 7 Moderate
Gopalkrishna,2019 [33] Yes Yes No No No Yes Yes Yes No 5 Moderate
Pal, 2019[34] Yes Yes No No No Yes Yes Yes No 5 Moderate
Pal, 2017[35] Yes Yes Yes Yes No Yes Yes Unclear No 6 Moderate
Uthappa, 2015[36] Yes Yes Yes Yes Unclear Yes Yes Yes Yes 9 Low
Bhattacharya,2015[37]
Yes Yes Yes No No Yes No Yes Unclear 5 Moderate
Allam, 2015[38] Yes Yes No Yes No Yes Yes Yes Yes 6 Moderate
Fredrick, 2015[39] Yes Yes Yes Yes No Yes Yes Yes Yes 9 Low
Biswas, 2014[40] Yes Yes Yes Yes Unclear Yes Yes Yes No 8 Low

Int. J. Environ. Res. Public Health 2022, 19, 5738 24 of 27
Table A3. Cont.
Study Aim ClearlyStated
SettingProvided
Study Designor Sampling
MethodExplained
CaseDefinition ofDiarrhea or
CholeraClearly
Mentioned
Statistical orAnalysisMethodsReported
Risk Factorsfor Outbreak(or Causes ofOutbreaks)
Investigated
Case FatalityRatio
Reported
Performanceof
ConfirmatoryTest (Culture
or PCR)
Limitations orPotential
ConfoundersDiscussed
Score Risk of Bias
Dey, 2014[41] Yes Yes Yes Yes No Yes Yes Yes No 7 Moderate
Kumar, 2014[42] Yes Yes Yes Unclear No Yes No Yes Unclear 5 Moderate
Kumar, 2014[43] Yes Yes Yes No No No Yes Yes Unclear 5 Moderate
Puri, 2014[44] Yes Yes Yes Yes No Yes Yes Yes Yes 8 Low
Mahanta, 2013[45] Yes Yes Yes Yes No Yes Yes Yes No 7 Moderate
A score “1” was given for each reported item. Scores were rated as having a low risk of bias (score of 8–9), moderate risk of bias (score of 5–7) or high risk of bias (score 4 or below). PCR:polymerase chain reaction.

Int. J. Environ. Res. Public Health 2022, 19, 5738 25 of 27
References1. Ali, M.; Gupta, S.S.; Arora, N.; Khasnobis, P.; Venkatesh, S.; Sur, D.; Nair, G.B.; Sack, D.A.; Ganguly, N.K. Identification of burden
hotspots and risk factors for cholera in India: An observational study. PLoS ONE 2017, 12, e0183100. [CrossRef]2. Lipp, E.K.; Huq, A.; Colwell, R.R. Effects of Global Climate on Infectious Disease: The Cholera Model. Clin. Microbiol. Rev. 2002,
15, 757–770. [CrossRef]3. Glass, R.I.; Svennerholm, A.-M.; Stoll, B.J.; Khan, M.R.; Hossain, K.M.B.; Hug, M.I.; Holmgren, J. Protection against Cholera in
Breast-Fed Children by Antibodies in Breast Milk. N. Engl. J. Med. 1983, 308, 1389–1392. [CrossRef]4. Richterman, A.; Sainvilien, D.R.; Eberly, L.; Ivers, L.C. Individual and Household Risk Factors for Symptomatic Cholera Infection:
A Systematic Review and Meta-analysis. J. Infect. Dis. 2018, 218, S154–S164. [CrossRef]5. Harris, J.B.; Khan, A.I.; LaRocque, R.C.; Dorer, D.J.; Chowdhury, F.; Faruque, A.S.G.; Sack, D.A.; Ryan, E.T.; Qadri, F.;
Calderwood, S.B. Blood Group, Immunity, and Risk of Infection with Vibrio cholerae in an Area of Endemicity. Infect. Immun. 2005,73, 7422–7427. [CrossRef]
6. Glass, R.I.; Holmgren, J.; Haley, C.E.; Khan, M.R.; Svennerholm, A.; Stoll, B.J.; Hossain, K.M.B.; Black, R.E.; Yunus, M.; Barua, D.Predisposition for cholera of individuals with o blood group possible evolutionary significance. Am. J. Epidemiol. 1985, 121,791–796. [CrossRef]
7. Legros, D. Partners of the Global Task Force on Cholera Control Global Cholera Epidemiology: Opportunities to Reduce theBurden of Cholera by 2030. J. Infect. Dis. 2018, 218, S137–S140. [CrossRef]
8. Kanungo, S.; Sah, B.K.; Lopez, A.L.; Sung, J.S.; Paisley, A.M.; Sur, D.; Clemens, J.D.; Nair, G.B. Cholera in India: An analysis ofreports, 1997–2006. Bull. World Health Organ. 2010, 88, 185–191. [CrossRef]
9. Chatterjee, P.; Kanungo, S.; Bhattacharya, S.K.; Dutta, S. Mapping cholera outbreaks and antibiotic resistant Vibrio cholerae inIndia: An assessment of existing data and a scoping review of the literature. Vaccine 2020, 38 (Suppl. S1), A93–A104. [CrossRef]
10. Gupta, S.S.; Gupta, S.K. Social mobilization for cholera prevention & control in India: Building on the existing framework. Vaccine2020, 38 (Suppl. S1), A181–A183. [CrossRef]
11. Nayyar, A.; Privor-Dumm, L. Cholera control and prevention: Role of evidence-based advocacy and communications. Vaccine2020, 38, A178–A180. [CrossRef]
12. Taneja, N.; Mishra, A.; Batra, N.; Gupta, P.; Mahindroo, J.; Mohan, B. Inland cholera in freshwater environs of north India. Vaccine2020, 38 (Suppl. S1), A63–A72. [CrossRef]
13. Koelle, K.; Rodo, X.; Pascual, M.; Yunus, M.; Mostafa, G. Refractory periods and climate forcing in cholera dynamics. Nature 2005,436, 696–700. [CrossRef]
14. Pal, B.B.; Nayak, S.R.; Khuntia, H.K. Epidemiology and Antibiogram Profile of Vibrio cholerae Isolates between 2004–2013 fromOdisha, India. Jpn. J. Infect. Dis. 2018, 71, 99–103. [CrossRef]
15. Sekhar, A.; Kang, G. Pathways to a policy for cholera control in India. Vaccine 2020, 38 (Suppl. S1), A157–A159. [CrossRef]16. World Health Organization (WHO) and Unicef. Progress on Sanitation and Drinking Water: 2015 Update and MDG Assessment;
World Health Organization: Geneva, Switzerland, 2015. Available online: https://apps.who.int/iris/bitstream/handle/10665/177752/9789241509145_eng.pdf?sequence=1&isAllowed=y (accessed on 23 June 2021).
17. Coffey, D.; Spears, D.; Vyas, S. Switching to sanitation: Understanding latrine adoption in a representative panel of rural Indianhouseholds. Soc. Sci. Med. 2017, 188, 41–50. [CrossRef]
18. Ramamurthy, T.; Sharma, N.C. Cholera Outbreaks in India. Tuberculosis 2014, 379, 49–85. [CrossRef]19. Panda, S.; Chatterjee, P.; Deb, A.; Kanungo, S.; Dutta, S. Preventing cholera in India: Synthesizing evidences through a systematic
review for policy discussion on the use of oral cholera vaccine. Vaccine 2020, 38 (Suppl. S1), A148–A156. [CrossRef]20. Moher, D.; Liberati, A.; Tetzlaff, J.; Altman, D.G.; PRISMA Group. Preferred reporting items for systematic reviews and
meta-analyses: The PRISMA statement. Ann. Intern. Med. 2009, 151, 264–269. [CrossRef]21. World Health Organization (WHO). Global Task Force on Cholera Control (GTFCC) Working Group on Surveillance. Surveillance
& Global Monitoring Sub-Group and Outbreak Sub-Group. Available online: https://www.gtfcc.org/wp-content/uploads/2021/04/5th-meeting-of-the-gtfcc-working-group-on-surveillance-webinars-2021-report.pdf (accessed on 3 June 2021).
22. National Centre for Disease Control. Integrated Disease Surveillance Programme. Dir Gen Heal Serv Minist Heal Fam Welfare,Gov India. Available online: https://www.idsp.nic.in (accessed on 20 March 2021).
23. Downes, M.J.; Brennan, M.L.; Williams, H.C.; Dean, R.S. Development of a critical appraisal tool to assess the quality ofcross-sectional studies (AXIS). BMJ Open 2016, 6, e011458. [CrossRef]
24. MapChart. Available online: https://mapchart.net (accessed on 31 May 2021).25. Central Bureau of Health Intelligence (CBHI). Government of India, National Health Profile. 2019. Available online: http:
//www.cbhidghs.nic.in/showfile.php?lid=1147 (accessed on 25 March 2021).26. Dutta, B.P.; Kumar, N.; Meshram, K.; Yadav, R.; Sodha, S.V.; Gupta, S. Cholera outbreak associated with contaminated water
sources in paddy fields, Mandla District, Madhya Pradesh, India. Indian J. Public Health 2021, 65, 46–50. [CrossRef]27. Jain, A.; Choudhary, S.; Saroha, E.; Bhatnagar, P.; Harvey, P. Cholera outbreak in an informal settlement at Shahpur huts,
Panchkula District, Haryana State, India, 2019. Indian J. Public Health 2021, 65, S51–S54. [CrossRef]28. Kale, S.S.; Bulle, P.A.; Deshmukh, D.G.; Tankhiwale, S.S.; Gujar, V.M. An outbreak of diarrhoeal disease of El Tor Vibrio cholerae
O1 Ogawa in and around Yavatmal district, Maharashtra, India in 2018. Int. J. Community Med. Public Health 2020, 7, 1297.[CrossRef]
https://apps.who.int/iris/bitstream/handle/10665/177752/9789241509145_eng.pdf?sequence=1&isAllowed=y

Int. J. Environ. Res. Public Health 2022, 19, 5738 26 of 27
29. Nayak, S.R.; Nayak, A.K.; Biswal, B.L.; Pati, S.; Pal, B.B. Spread of Haitian Variant Vibrio cholerae O1 Causing Cholera Outbreaksin Odisha, India. Jpn. J. Infect. Dis. 2021, 74, 137–143. [CrossRef]
30. Singh, A.; Gupta, R.; Dikid, T.; Saroha, E.; Sharma, N.C.; Sagar, S.; Gupta, S.; Bindra, S.; Khasnobis, P.; Jain, S.K.; et al. Choleraoutbreak investigation, Bhadola, Delhi, India, April–May 2018. Trans. R. Soc. Trop. Med. Hyg. 2020, 114, 762–769. [CrossRef]
31. Mukhopadhyay, A.K.; Deb, A.K.; Chowdhury, G.; Debnath, F.; Samanta, P.; Saha, R.N.; Manna, B.; Bhattacharya, M.K.; Datta, D.;Okamoto, K.; et al. Post-monsoon waterlogging-associated upsurge of cholera cases in and around Kolkata metropolis, 2015.Epidemiol. Infect. 2019, 147, e167. [CrossRef]
32. Goswami, S.; Jha, A.; Sivan, S.P.; Dambhare, D.; Gupta, S.S. Outbreak investigation of cholera outbreak in a slum area of urbanWardha, India: An interventional epidemiological study. J. Fam. Med. Prim. Care 2019, 8, 1112–1116. [CrossRef]
33. Gopalkrishna, V.; Joshi, M.; Viswanathan, R.; Malu, G.; Ganorkar, N.; Chavan, N.; Shinde, M.; Kumar, A.; Dhurandhare, S. Choleraoutbreak in Aurangabad, Maharashtra, western India. Indian J. Med. Res. 2019, 150, 640–643. [CrossRef]
34. Pal, B.B.; Mohanty, A.; Biswal, B.; Nayak, S.R. New Variant of Vibrio cholerae O139 in Odisha, India. J. Clin. Microbiol. 2019,57, e01877-18. [CrossRef]
35. Pal, B.B.; Khuntia, H.K.; Nayak, S.R.; Mohanty, A.; Biswal, B. Vibrio cholerae O1 Ogawa Strains Carrying the ctxB7 Allele Causeda Large Cholera Outbreak during 2014 in the Tribal Areas of Odisha, India. Jpn. J. Infect. Dis. 2017, 70, 549–553. [CrossRef]
36. Uthappa, C.K.; Allam, R.R.; Nalini, C.; Gunti, D.; Udaragudi, P.R.; Tadi, G.P.; Murhekar, M.V. An outbreak of cholera in Medipallyvillage, Andhra Pradesh, India, 2013. J. Health Popul. Nutr. 2015, 33, 7. [CrossRef] [PubMed]
37. Bhattacharya, D.; Dey, S.; Roy, S.; Parande, M.V.; Telsang, M.; Seema, M.H.; Parande, A.V.; Mantur, B.G. Multidrug-ResistantVibrio cholerae O1 was Responsible for a Cholera Outbreak in 2013 in Bagalkot, North Karnataka. Jpn. J. Infect. Dis 2015, 68,347–350. [CrossRef] [PubMed]
38. Allam, R.R.; Uthappa, C.K.; Nalini, C.; Udaragudi, P.R.; Tadi, G.P.; Murhekar, M.V. An Outbreak of Cholera due to ContaminatedWater, Medak District, Andhra Pradesh, India, 2013. Indian J. Community Med. 2015, 40, 283–285. [CrossRef]
39. Fredrick, T.; Ponnaiah, M.; Murhekar, M.V.; Jayaraman, Y.; David, J.K.; Vadivoo, S.; Joshua, V. Cholera outbreak linked with lackof safe water supply following a tropical cyclone in Pondicherry, India, 2012. J. Health Popul. Nutr. 2015, 33, 31–38. [PubMed]
40. Biswas, D.K.; Bhunia, R.; Maji, D.; Das, P. Contaminated pond water favors cholera outbreak at haibatpur village, purba medinipurdistrict, west bengal, India. J. Trop. Med. 2014, 2014, 764530. [CrossRef]
41. Dey, S.; Parande, M.V.; Parande, A.M.; Lakkannavar, S.L.; Rathore, P.K.; Mantur, B.G.; Kholkute, S.D.; Roy, S. Twin outbreak ofcholera in rural North Karnataka, India. Indian J. Med. Res. 2014, 140, 420–426. [PubMed]
42. Kumar, P.; Mishra, D.K.; Deshmukh, D.G.; Jain, M.; Zade, A.M.; Ingole, K.V.; Yadava, P.K. Haitian variant ctxB producing Vibriocholerae O1 with reduced susceptibility to ciprofloxacin is persistent in Yavatmal, Maharashtra, India, after causing a choleraoutbreak. Clin. Microbiol. Infect. 2014, 20, O292–O293. [CrossRef]
43. Kumar, P.; Mishra, D.K.; Deshmukh, D.G.; Jain, M.; Zade, A.M.; Ingole, K.V.; Goel, A.K.; Yadava, P.K. Vibrio cholerae O1 OgawaEl Tor strains with the ctxB7 allele driving cholera outbreaks in south-western India in 2012. Infect. Genet. Evol. 2014, 25, 93–96.[CrossRef]
44. Puri, S.; Sarpal, S.; Kumar, A.; Goel, N. An outbreak of Vibrio cholerae in Vikas Nagar, Chandigarh, India. Med. J. DY Patil. Univ.2014, 7, 147–151.
45. Mahanta, B.N.; Mahanta, T.G.; Sinha, R.; Dutta, A.; Payeng, D.; Jawed, Q. Investigation of a cholera outbreak in a tea garden ofsivasagar district of assam. Indian J. Community Med. 2013, 38, 240–243. [CrossRef]
46. Haque, F.; Hossain, M.J.; Kundu, S.K.; Naser, A.M.; Rahman, M.; Luby, S.P. Cholera Outbreaks in Urban Bangladesh in 2011.Epidemiology 2013, 3, 1–7. [CrossRef] [PubMed]
47. Moore, S.; Dongdem, A.Z.; Opare, D.; Cottavoz, P.; Fookes, M.; Sadji, A.Y.; Dzotsi, E.; Dogbe, M.; Jeddi, F.; Bidjada, B.; et al.Dynamics of cholera epidemics from Benin to Mauritania. PLoS Negl. Trop. Dis. 2018, 12, e0006379. [CrossRef] [PubMed]
48. Francois, J. Cholera remains a public health threat in Haiti. Lancet Glob. Health 2020, 8, e984. [CrossRef]49. Sack, D.A.; Debes, A.K.; Ateudjieu, J.; Bwire, G.; Ali, M.; Ngwa, M.C.; Mwaba, J.; Chilengi, R.; Orach, C.C.; Boru, W.; et al.
Contrasting Epidemiology of Cholera in Bangladesh and Africa. J. Infect. Dis 2021, 224, S701–S709. [CrossRef] [PubMed]50. Chowdary, J.S.; Srinivas, G.; Du, Y.; Gopinath, K.; Gnanaseelan, C.; Parekh, A.; Singh, P. Month-to-month variability of Indian
summer monsoon rainfall in 2016: Role of the Indo-Pacific climatic conditions. Clim. Dyn. 2019, 52, 1157–1171. [CrossRef]51. Palit, A.; Batabyal, P.; Kanungo, S.; Sur, D. In-house contamination of potable water in urban slum of Kolkata, India: A possible
transmission route of diarrhea. Water Sci. Technol. 2012, 66, 299–303. [CrossRef]52. Ziegelbauer, K.; Speich, B.; Mausezahl, D.; Bos, R.; Keiser, J.; Utzinger, J. Effect of sanitation on soil-transmitted helminth infection:
Systematic review and meta-analysis. PLoS Med. 2012, 9, e1001162. [CrossRef]53. Oguttu, D.W.; Okullo, A.; Bwire, G.; Nsubuga, P.; Ario, A.R. Cholera outbreak caused by drinking lake water contaminated with
human faeces in Kaiso Village, Hoima District, Western Uganda, October 2015. Infect. Dis. Poverty 2017, 6, 146. [CrossRef]54. Eurien, D.; Mirembe, B.B.; Musewa, A.; Kisaakye, E.; Kwesiga, B.; Ogole, F.; Ayen, D.O.; Kadobera, D.; Bulage, L.; Ario, A.R.; et al.
Cholera outbreak caused by drinking unprotected well water contaminated with faeces from an open storm water drainage:Kampala City, Uganda, January 2019. BMC Infect. Dis. 2021, 21, 1–9. [CrossRef]
55. Sur, D.; Deen, J.L.; Manna, B.; Niyogi, S.K.; Deb, A.K.; Kanungo, S.; Sarkar, B.L.; Kim, D.R.; Danovaro-Holliday, M.C.;Holliday, K.; et al. The burden of cholera in the slums of Kolkata, India: Data from a prospective, community based study.Arch. Dis. Child 2005, 90, 1175–1181. [CrossRef]

Int. J. Environ. Res. Public Health 2022, 19, 5738 27 of 27
56. Das, A.; Manickam, P.; Hutin, Y.; Pattanaik, B.; Pal, B.B.; Chhotray, G.P.; Kar, S.K.; Gupte, M.D. Two sequential outbreaks in twovillages illustrate the various modes of transmission of cholera. Epidemiol. Infect. 2009, 137, 906–912. [CrossRef] [PubMed]
57. Khuntia, H.K.; Pal, B.B.; Meher, P.K.; Chhotray, G.P. Environmental Vibrio cholerae O139 may be the progenitor of outbreak ofcholera in coastal area of Orissa, eastern India, 2000: Molecular evidence. Am. J. Trop Med. Hyg. 2008, 78, 819–822. [CrossRef][PubMed]
58. Panda, S.; Pati, K.K.; Bhattacharya, M.K.; Koley, H.; Pahari, S.; Nair, G.B. Rapid situation & response assessment of diarrhoeaoutbreak in a coastal district following tropical cyclone AILA in India. Indian J. Med. Res. 2011, 133, 395–400. [PubMed]
59. Gallandat, K.; Huang, A.; Rayner, J.; String, G.; Lantagne, D.S. Household spraying in cholera outbreaks: Insights from threeexploratory, mixed-methods field effectiveness evaluations. PLoS Negl. Trop. Dis. 2020, 14, e0008661. [CrossRef] [PubMed]
60. Swaddiwudhipong, W.; Hannarong, S.; Peanumlom, P.; Pittayawonganon, C.; Sitthi, W. Two consecutive outbreaks of food-bornecholera associated with consumption of chicken rice in northwestern Thailand. Southeast Asian J. Trop. Med. Public Health 2012, 43,927–932. [PubMed]
61. Wong, C.S.; Ang, L.W.; James, L.; Goh, K.T. Epidemiological Characteristics of Cholera in Singapore, 1992–2007. Ann. Acad. Med.Singap. 2010, 39, 507–512.
62. Shroff, B.D.; Mazumdar, V. Investigation of a cholera outbreak in Kanpur village of Panchmahal, Gujarat. Natl. J. Commun. Med.2011, 2, 371–373.