Order picking plan to maximize the order fill rate
10
Order picking plan to maximize the order fill rate Suk-Chul Rim * , In-Sun Park Department of Industrial Engineering, Ajou University, 443-749 Suwon, Republic of Korea Received 2 September 2007; accepted 18 January 2008 Available online 26 January 2008 Abstract In distribution centers, some orders may not be fulfilled due to the shortage of inventory. We consider the case where an order is picked and shipped only when all items in the order is available in the inventory; and the unfulfilled orders are transferred to the next day with higher priority. Given daily inventory and a set of orders arrived during a day, the problem is to assign the inventory to the orders so as to maximize the order fill rate (OFR). We formulate this problem as a linear programming problem. We also consider the weighted OFR to reflect the importance of each order. Simulation results indicate that the proposed LP approach outperforms the existing simple rules; and, more importantly, the improvement ratio increases as the number of items and/or orders increases. Ó 2008 Elsevier Ltd. All rights reserved. Keywords: (Weighted) Order fill rate; Order picking plan; Order fulfillment 1. Introduction 1.1. Problem description Distribution centers (DCs) have played an important role in today’s supply chain. Delivering the right items to the right customers at the right time at the right cost is a critical mission of the DCs. For many man- ufacturers, DCs are regarded as a front-end for customer service. Regardless of whether the DCs are owned by the manufacturer or operated by third party logistics providers, the DCs are important to the manufacturers in its supply chain in terms of cost, speed, quality, and service. Among the performance indicators of the DCs, order fill rate (OFR) is defined as the ratio of the number of fulfilled orders over the number of orders received during a certain period of time. An order is said to be fulfilled when the required quantity of all items in that order are available from the inventory (Simchi-levi, Kaminsky, & Simchi-levi, 2003). An order from a customer usually contains many items with non-zero order quantity. As the number of items grows in a DC, it is not unusual that some items are out of stock. In such a case, the shortage is usually handled as a back order. However, in this paper we consider the case where an order is picked and shipped to 0360-8352/$ - see front matter Ó 2008 Elsevier Ltd. All rights reserved. doi:10.1016/j.cie.2008.01.012 * Corresponding author. Tel.: +82 31 219 2424. E-mail address: [email protected] (S.-C. Rim). Available online at www.sciencedirect.com Computers & Industrial Engineering 55 (2008) 557–566 www.elsevier.com/locate/caie
-
Upload
independent -
Category
Documents
-
view
4 -
download
0
Transcript of Order picking plan to maximize the order fill rate
Available online at www.sciencedirect.com
Computers & Industrial Engineering 55 (2008) 557–566
www.elsevier.com/locate/caie
Order picking plan to maximize the order fill rate
Suk-Chul Rim *, In-Sun Park
Department of Industrial Engineering, Ajou University, 443-749 Suwon, Republic of Korea
Received 2 September 2007; accepted 18 January 2008Available online 26 January 2008
Abstract
In distribution centers, some orders may not be fulfilled due to the shortage of inventory. We consider the case where anorder is picked and shipped only when all items in the order is available in the inventory; and the unfulfilled orders aretransferred to the next day with higher priority. Given daily inventory and a set of orders arrived during a day, the problemis to assign the inventory to the orders so as to maximize the order fill rate (OFR). We formulate this problem as a linearprogramming problem. We also consider the weighted OFR to reflect the importance of each order. Simulation resultsindicate that the proposed LP approach outperforms the existing simple rules; and, more importantly, the improvementratio increases as the number of items and/or orders increases.� 2008 Elsevier Ltd. All rights reserved.
Keywords: (Weighted) Order fill rate; Order picking plan; Order fulfillment
1. Introduction
1.1. Problem description
Distribution centers (DCs) have played an important role in today’s supply chain. Delivering the rightitems to the right customers at the right time at the right cost is a critical mission of the DCs. For many man-ufacturers, DCs are regarded as a front-end for customer service. Regardless of whether the DCs are owned bythe manufacturer or operated by third party logistics providers, the DCs are important to the manufacturersin its supply chain in terms of cost, speed, quality, and service. Among the performance indicators of the DCs,order fill rate (OFR) is defined as the ratio of the number of fulfilled orders over the number of orders receivedduring a certain period of time. An order is said to be fulfilled when the required quantity of all items in thatorder are available from the inventory (Simchi-levi, Kaminsky, & Simchi-levi, 2003).
An order from a customer usually contains many items with non-zero order quantity. As the number ofitems grows in a DC, it is not unusual that some items are out of stock. In such a case, the shortage is usuallyhandled as a back order. However, in this paper we consider the case where an order is picked and shipped to
0360-8352/$ - see front matter � 2008 Elsevier Ltd. All rights reserved.doi:10.1016/j.cie.2008.01.012
* Corresponding author. Tel.: +82 31 219 2424.E-mail address: [email protected] (S.-C. Rim).
558 S.-C. Rim, I.-S. Park / Computers & Industrial Engineering 55 (2008) 557–566
the customer only if the order is fulfilled, that is, the required quantity of all items are available in the inven-tory. Typical examples of such business practice can be found in internet shopping mall where customers dis-like receiving the delivery of a part of what they have ordered, and shipping an order in two or more partialshipment will increase the shipping cost. Hence, instead of shipping a partial order to the customer, the DCswould postpone the unfulfilled orders to the next day; and ship only the fulfilled orders to the customers today.
Maintaining excessively high level of inventory for all items will result in high OFR and service level for thecustomers. But DCs usually have a limited storage space; and higher inventory will increase inventory cost,including potential obsolescence of expensive high-tech products. Consequently, shortage is experienced inmany DCs as orders are processed everyday.
In today’s e-commerce environment, the traditional Pareto’s 20:80 rules may no longer apply. The phenom-enon that 80% items of small sales volume or low profit rate are becoming more important is called the longtail phenomenon (Anderson, 2004). Unlike in the past when inventory management is concentrated on 20%major items, in today’s long tail environment, more sophisticated inventory management for 80% items arealso required. Otherwise shortage is more likely to occur in DCs as the number of items increases. Sincethe items are replenished by the suppliers to maintain a certain level of inventory, shortage is frequently expe-rienced in DCs.
In this study, we define order picking planning as the decision process as to which set of orders to pick andship today in a DC. Although this step is very important for higher customer satisfaction in DC operation,order picking planning has not received attention from the academia and practitioners so far. Order pickingplanning must be carefully conducted before sophisticated execution of order picking, such as route optimi-zation, storage optimization, and order-batching, etc. for efficient picking. We will define the problem in thenext section; and review the related research results in Chapter 2. A LP model is presented in Chapter 3; andthe average performances are evaluated in Chapter 4 using simulation. The problem is extended to theweighted OFR in Chapter 5; and the implication of the study and further research issues are discussed inChapter 6.
1.2. Problem definition
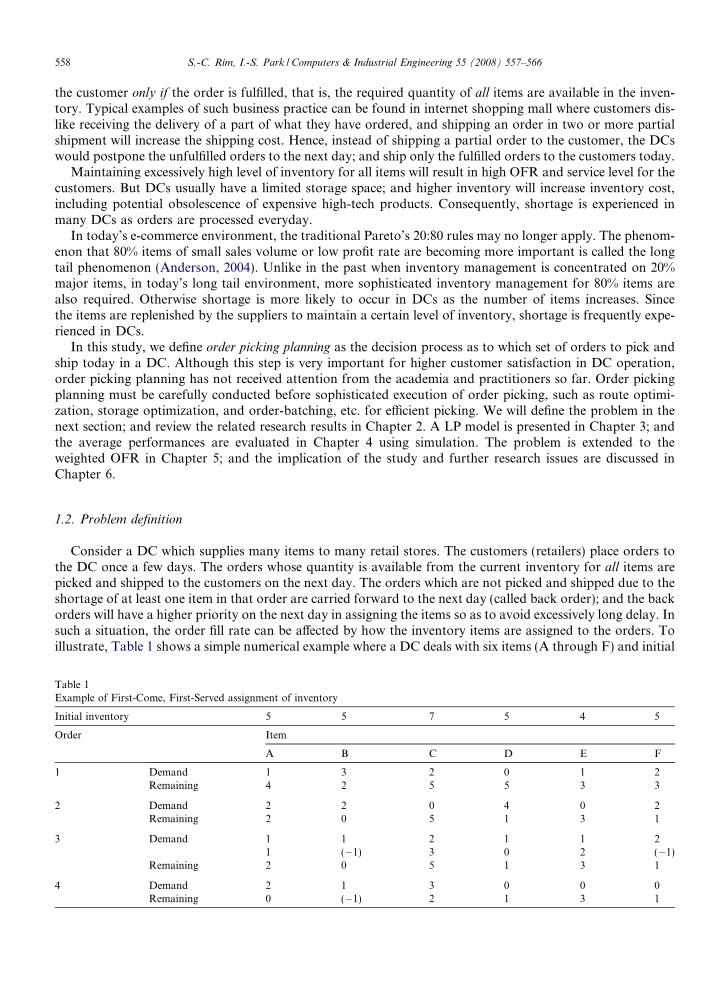
Consider a DC which supplies many items to many retail stores. The customers (retailers) place orders tothe DC once a few days. The orders whose quantity is available from the current inventory for all items arepicked and shipped to the customers on the next day. The orders which are not picked and shipped due to theshortage of at least one item in that order are carried forward to the next day (called back order); and the backorders will have a higher priority on the next day in assigning the items so as to avoid excessively long delay. Insuch a situation, the order fill rate can be affected by how the inventory items are assigned to the orders. Toillustrate, Table 1 shows a simple numerical example where a DC deals with six items (A through F) and initial
Table 1Example of First-Come, First-Served assignment of inventory
Initial inventory 5 5 7 5 4 5
Order Item
A B C D E F
1 Demand 1 3 2 0 1 2Remaining 4 2 5 5 3 3
2 Demand 2 2 0 4 0 2Remaining 2 0 5 1 3 1
3 Demand 1 1 2 1 1 21 (�1) 3 0 2 (�1)
Remaining 2 0 5 1 3 1
4 Demand 2 1 3 0 0 0Remaining 0 (�1) 2 1 3 1
S.-C. Rim, I.-S. Park / Computers & Industrial Engineering 55 (2008) 557–566 559
inventory level is (5, 5, 7, 5, 4, and 5), respectively. Suppose that four orders have been received during the dayin that sequence.
If the inventory is assigned to the orders in the First-Come, First-Served (FCFS) base, then the stepwisereduction of the inventory will be as shown in Table 1; and orders 3 and 4 will not be fulfilled(OFR = 50%). Note that, for order 3, since the shortage is found for item B and F, the entire order is carriedforward to the next day; and no item (from A to F) is assigned to that order today, so the remaining inventoryremains unchanged. It is clear that all four orders cannot be fulfilled today because the total demand is greaterthan today’s initial inventory for items A, B, and F. However, if we cleverly assign the initial inventory to theorders 1, 3, and 4, then the three orders can be fulfilled (OFR = 75%) because the total demand of the threeorders are no greater than the initial inventory for all six items. This simple example shows us the possibleimprovement of OFR, given the same initial inventory level, that is, without increasing the inventory holdingcost. The question is how we can assign the inventory to the orders in order to maximize the OFR for largesized problems such as 500 items and 20 orders.
As mentioned in Section 1.1, order picking planning is important before considering the efficient order pick-ing. In most DCs which deal with thousands of items, order picking planning will affect the OFR, and con-sequently, the service level and customer satisfaction. The problem we deal with in this study is to maximizethe OFR by optimally assigning the current inventory to the orders from the customers.
2. Literature review
Many research results have been reported in the literature on the order picking. If we divide the order pick-ing into two stages, the first stage is planning, in which we determine the set of orders to pick today among thereceived orders. The second stage is the execution of the order picking, in which we try to complete the pickingin most efficient way, such as minimum total travel distance. To the best of our knowledge, there is no study inplanning the order picking that we address in this paper.
For efficient order picking, researchers have elaborated on warehouse layout, storage policy, and pickingpolicy (Petersen & Aase, 2004). Warehouse layout problem addresses the shape of warehouse, shelf location,number of aisles, location and number of starting/ending points of picking operation (Ratliff & Rosenthal,1983; Vaughan & Petersen, 1999). Storage policy includes random storage, dedicated storage, class-based stor-age, and volume-based storage (Petersen & Aase, 2004).
Picking policy includes zone picking, order combination, and picker routing. Zone picking policy dividesthe picking area into a few subzones; and the dedicated picker will pick items in that subzone only. The mainresearch topic is the number of subzones and pickers. Order combination (batching) is that a picker picksitems of multiple orders during a single trip. Ho and Tseng (2006) study the order-batching methods for aDC with two cross-aisles; and conduct an extensive experiments over the combinations of nine seed-orderselection rules and ten accompanying-order selection rules, along with two route-planning methods andtwo picking frequency distributions.
Picker routing problem is to determine how many pickers to travel along what sequence in order to min-imize the total travel distance. Many researchers have studied this problem. Among those, Hsieh and Tsai(2006) conduct a simulation over a set of variables such as the number of cross-aisles, storage policy, ordercombination, and picking policy in order to find out an efficient design of the warehouse. The authors recom-mend two or three cross-aisles, order combination is better than single order picking; and determine the stor-age location based on the shipping frequency. Petersen and Aase (2004) conduct a simulation study tocompare the impact of picking policy, storage policy, and routing policy on the picking efficiency; and con-cluded that the total picking time can be reduced the most by order combination, followed by storage policyand routing policy.
A recent review paper by Gu, Goetschalckx, and McGinnis (2007) identifies order picking as one area ofwarehouse operations. They classify order picking into batching, sequencing and routing, and sorting, all ofwhich belong to operational level, not planning level. Brynzer and Johansson (1996) address the stock locationassignment problem (SLAP) and describe a strategy for pre-structuring components and information for thepicking work in storehouses. Their results imply a more efficient material handling through reorganizing thecomponents in the storage system, in order to support the work from the picker’s point of view. Chen and Wu
560 S.-C. Rim, I.-S. Park / Computers & Industrial Engineering 55 (2008) 557–566
(2005) describe the development of an order-batching approach based on data mining and integer program-ming; and present an order-clustering model based on 0–1 integer programming to maximize the associationsbetween orders within each batch. Daniels, Rummel, and Schantz (1998) address the problem in which itemsmay be stored in multiple locations so that order picking requires choosing a subset of the locations that storethe required item to collect the required quantity. They formulate a model for simultaneously determining theassignment and sequencing decisions, and compare it to previous models for order picking. De Koster, van derPoort, and Wolters (1999) propose two groups of heuristic algorithms for efficient order-batching, the Seedalgorithms and the Time Savings algorithms, and evaluate the performance of the algorithms using two dif-ferent routing strategies: The so-called S-shape and largest gap strategies. Won and Olafsson (2005) deal withthe problem of batching and picking orders with respect not only to improving efficiency, as measured by lowpicking time and effective use of vehicles, but also to doing so in a way that optimizes customer response time.They formulate the batching and order picking problem jointly as a combinatorial optimization problem; andevaluate the benefits of addressing the joint problem and propose simple but effective heuristics for its solu-tion. Gademann and van de Velde (2005) address problem of batching orders in a parallel-aisle warehouseso as to minimize the total traveling time needed to pick all items. They model the problem as a generalizedset partitioning problem and present a column generation algorithm to solve its linear programming relaxa-tion. For further research results on order picking, the interested readers may refer to Gu et al. (2007).
In summary, various factors and policies affect the performance of the order picking system, but none of themconsider the shortage in the DC. According to the warehouse practitioners, shortage is frequently experienced indaily order picking operation, especially as the number of items grows, and inventory is tightly controlled to aminimum level. Therefore, a planning stage as to which set of received orders to pick today becomes an importantissue, in addition to many existing tools to improve the efficiency of order picking in its execution stage. This is themotivation of this paper. In the following section, we will describe a few heuristic approaches to assign the inven-tory to the orders; and introduce the linear programming (LP) model to maximize the OFR.
3. LP model
Consider a daily planning of orders, that is, orders that have arrived during a day are collected; and thedaily initial inventory is optimally assigned to the orders. In this chapter, we present an LP model to solvethe problem of maximizing the order fill rate (OFR). In describing the LP model for the OFR, we will usethe following notations:
i order number (i = 1, . . .., m)j item number (j = 1, . . .., n)Sj daily initial inventory of item j
dij demand of item j in order i
Fi 1 if order i is fulfilled; or 0 otherwiseM a large positive numberQij assigned quantity of inventory item j to order i (decision variable)
Then, given the current inventory and a set of received orders, the problem of maximizing the OFR can beformulated as a binary integer linear programming problem as follows:
MaximizeX
i
F i ð1Þ
Subject to
dij P Qij for all i; j ð2ÞSj P
X
i
Qij for all j ð3Þ
F i 6 1�dij � Qij
Mfor all i; j ð4Þ
F i ¼ 0 or 1 for all i ð5Þ
S.-C. Rim, I.-S. Park / Computers & Industrial Engineering 55 (2008) 557–566 561
Eq. (1) maximizes the number of fulfilled orders; Eq. (2) limits the assignment of inventory to be nogreater than the demand; Eq. (3) means that the total assignment for item j cannot exceed the currentinventory of the item; and Eq. (4) forces Fi to be 0 if any one item of the order i is not fulfilled by thecurrent inventory. Due to Eq. (5) the above formulation becomes a binary integer linear programmingproblem. The distribution center in question is operated dynamically in a sense that the unfilled ordersare carried forward to the next day. However, the LP model repeats myopic daily optimization for thestatic problem of daily data.
4. Simulation
In this chapter, we evaluate the average OFR obtained by solving the LP model presented in the previouschapter against the traditional method of First-Come, First-Served (FCFS) assignment rule, using simulation.The FCFS rule assigns the inventory to the orders in the order of arrival. The FCFS rule is coded using Micro-soft Visual C++ 6.0; and LP is solved using CPLEX 9.0 by ILOG.
In simulation, we assume the followings. Inventory of each item at the DC is replenished everyday from theoutside suppliers. To be precise, the simulation model has to include the replenishment policy such as reorderpoint or order-up-to level. However, since there are so many items, initial inventory level of an item on a par-ticular day is assumed to follow a normal distribution. In this study we use the normal distribution with meanof 50, and standard deviation of 3 as the approximation of the daily initial inventory level for each item. Itemscan be grouped as group A, B, and C, based on the order frequency. Items of group A, B, and C are orderedwith the probability of 80%, 40%, and 10%, respectively, in each order. The number of items of group A, B,and C are 50%, 30%, and 20% of the total number of items, respectively. Once an item is ordered, the non-zeroquantity of order for the item follows Poisson distribution with mean equal to 1, regardless of the order group.The unfilled orders are carried forward to the next day; and inventory is first assigned to these transferredorders before they are assigned to the orders arrived in the next day.
We will examine the number of orders per day between 15 and 21 in which the shortage occurs under thegiven situation; and the number of items for 100, 500, and 1000. The First-Come, First-Served (FCFS) is con-sidered as the base, against which the proposed LP method is compared. For 7 levels of # orders times 3 levelsof # items times two methods, with 10 replications for each case gives 420 simulation runs as a total. A priorityis given to the unfulfilled order today when they are transferred and reconsidered in the next day. Simulation isconducted for 100 days to obtain the average order fill rates. Table 2 shows the simulation results, indicatingthat the proposed LP model outperforms the FCFS rule for all cases. As the number of orders increases, theOFR decreases, but the difference increases between the LP and FCFS.
Fig. 1 shows that the improvement of OFR by LP over FCFS increases as the number of items increases.This is a desirable result because implementing the proposed LP approach will require additional resource andeffort, but for larger scale DC handling more items and orders, the additional resource will be justified byobtaining larger improvement in OFR. Fig. 2 shows the increasing improvement ratio of LP model overthe FCFS rule as the number of orders increases.
Table 2Comparison of order fill rate (%)
No. of items Method No. of orders
15 16 17 18 19 20 21
100 FCFS 100 100 100 99.789 99.453 98.469 96.826LP 100 100 100 99.789 99.67 98.964 98.071
500 FCFS 100 99.75 99.529 99.444 96.562 92.116 86.049LP 100 99.813 99.706 99.667 97.698 95.596 91.604
1000 FCFS 99.833 99.768 99.706 98.288 95.281 88.074 78.166LP 99.833 99.829 99.824 98.975 96.881 93.149 86.496
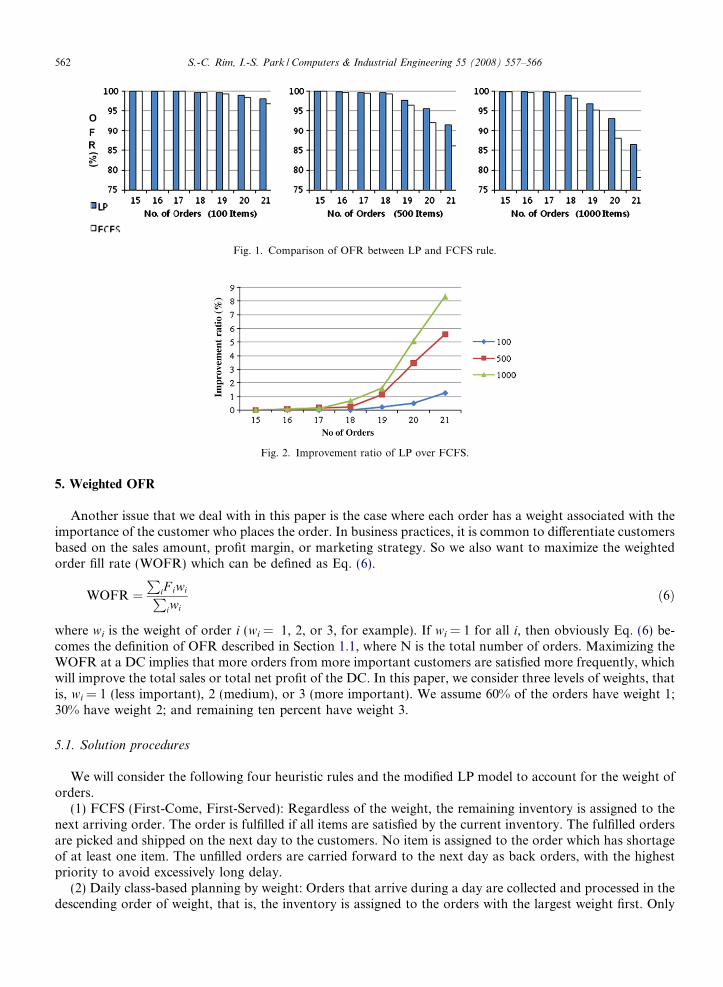
Fig. 1. Comparison of OFR between LP and FCFS rule.
Fig. 2. Improvement ratio of LP over FCFS.
562 S.-C. Rim, I.-S. Park / Computers & Industrial Engineering 55 (2008) 557–566
5. Weighted OFR
Another issue that we deal with in this paper is the case where each order has a weight associated with theimportance of the customer who places the order. In business practices, it is common to differentiate customersbased on the sales amount, profit margin, or marketing strategy. So we also want to maximize the weightedorder fill rate (WOFR) which can be defined as Eq. (6).
WOFR ¼P
iF iwiPiwi
ð6Þ
where wi is the weight of order i (wi = 1, 2, or 3, for example). If wi = 1 for all i, then obviously Eq. (6) be-comes the definition of OFR described in Section 1.1, where N is the total number of orders. Maximizing theWOFR at a DC implies that more orders from more important customers are satisfied more frequently, whichwill improve the total sales or total net profit of the DC. In this paper, we consider three levels of weights, thatis, wi = 1 (less important), 2 (medium), or 3 (more important). We assume 60% of the orders have weight 1;30% have weight 2; and remaining ten percent have weight 3.
5.1. Solution procedures
We will consider the following four heuristic rules and the modified LP model to account for the weight oforders.
(1) FCFS (First-Come, First-Served): Regardless of the weight, the remaining inventory is assigned to thenext arriving order. The order is fulfilled if all items are satisfied by the current inventory. The fulfilled ordersare picked and shipped on the next day to the customers. No item is assigned to the order which has shortageof at least one item. The unfilled orders are carried forward to the next day as back orders, with the highestpriority to avoid excessively long delay.
(2) Daily class-based planning by weight: Orders that arrive during a day are collected and processed in thedescending order of weight, that is, the inventory is assigned to the orders with the largest weight first. Only
S.-C. Rim, I.-S. Park / Computers & Industrial Engineering 55 (2008) 557–566 563
the fulfilled orders are picked and shipped. There will be multiple orders that have the same weight. As a tie-breaker, we consider the following three class-based planning rules: Among the orders with the same weight,the sequence of orders to assign the inventory is
(CP-R): Randomly determined(CP-D): The descending order of the number of items ordered(CP-A): The ascending order of the number of items ordered
(3) Modified LP model: We simply modify the objective function in Eq. (1) toP
iF iwi. All other constraintsremain unchanged.
5.2. Performance evaluation
For 500 items in the DC, and daily initial inventory level of normal distribution with mean of 50 and stan-dard deviation of 3, the objective function (weighted OFR) shows considerable difference among the proposedmethods when the number of orders exceeds 20. As a representing value we conduct simulation for the casewhen 21 orders arrive per day. The reason why we choose 21 orders per day is as follows. From the prelimin-ary simulation results, given the daily initial inventory of mean 50, for daily orders of less than 21 orders, theOFRs are very high for all five methods so that significant difference is hardly found among the five methods.On the other hand, for daily orders of more than 21 orders, the OFRs are so low that the situation is far frompractical one. In other words, if the OFR is too high (low), then the DC operators will immediately decrease(increase) the daily initial inventory level so that the average OFR will be an acceptable level such as 95%.
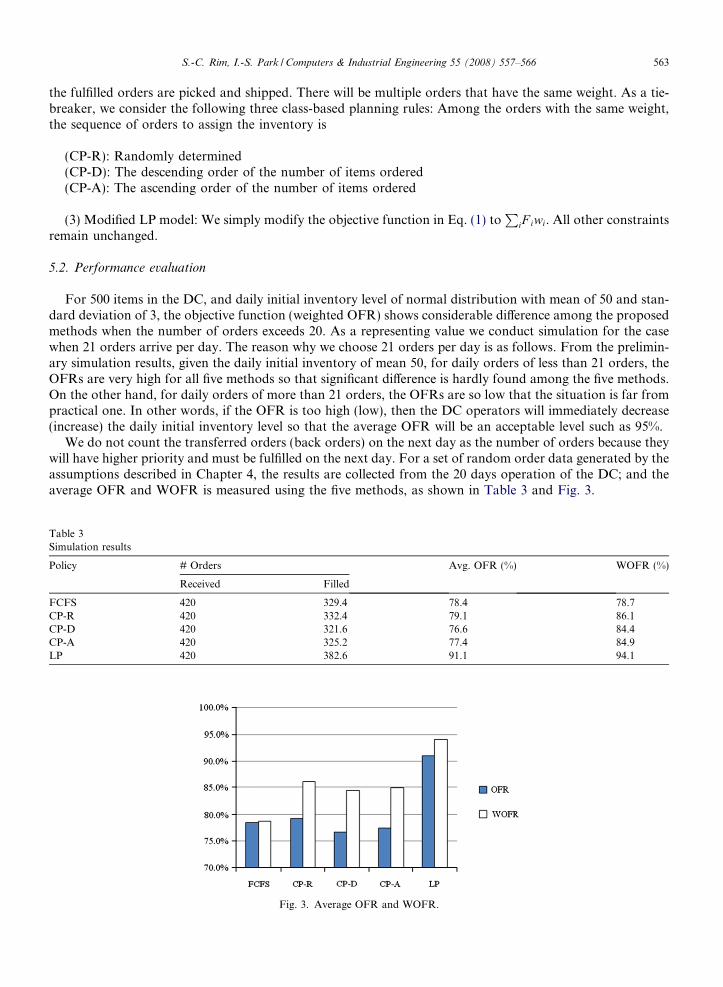
We do not count the transferred orders (back orders) on the next day as the number of orders because theywill have higher priority and must be fulfilled on the next day. For a set of random order data generated by theassumptions described in Chapter 4, the results are collected from the 20 days operation of the DC; and theaverage OFR and WOFR is measured using the five methods, as shown in Table 3 and Fig. 3.
Table 3Simulation results
Policy # Orders Avg. OFR (%) WOFR (%)
Received Filled
FCFS 420 329.4 78.4 78.7CP-R 420 332.4 79.1 86.1CP-D 420 321.6 76.6 84.4CP-A 420 325.2 77.4 84.9LP 420 382.6 91.1 94.1
Fig. 3. Average OFR and WOFR.
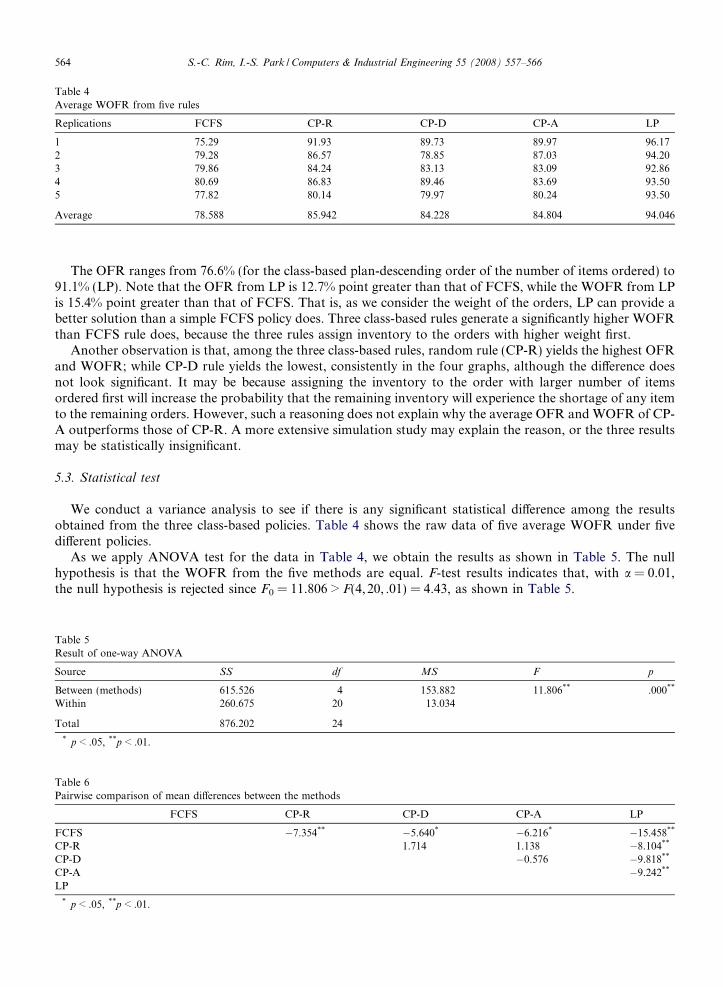
Table 4Average WOFR from five rules
Replications FCFS CP-R CP-D CP-A LP
1 75.29 91.93 89.73 89.97 96.172 79.28 86.57 78.85 87.03 94.203 79.86 84.24 83.13 83.09 92.864 80.69 86.83 89.46 83.69 93.505 77.82 80.14 79.97 80.24 93.50
Average 78.588 85.942 84.228 84.804 94.046
564 S.-C. Rim, I.-S. Park / Computers & Industrial Engineering 55 (2008) 557–566
The OFR ranges from 76.6% (for the class-based plan-descending order of the number of items ordered) to91.1% (LP). Note that the OFR from LP is 12.7% point greater than that of FCFS, while the WOFR from LPis 15.4% point greater than that of FCFS. That is, as we consider the weight of the orders, LP can provide abetter solution than a simple FCFS policy does. Three class-based rules generate a significantly higher WOFRthan FCFS rule does, because the three rules assign inventory to the orders with higher weight first.
Another observation is that, among the three class-based rules, random rule (CP-R) yields the highest OFRand WOFR; while CP-D rule yields the lowest, consistently in the four graphs, although the difference doesnot look significant. It may be because assigning the inventory to the order with larger number of itemsordered first will increase the probability that the remaining inventory will experience the shortage of any itemto the remaining orders. However, such a reasoning does not explain why the average OFR and WOFR of CP-A outperforms those of CP-R. A more extensive simulation study may explain the reason, or the three resultsmay be statistically insignificant.
5.3. Statistical test
We conduct a variance analysis to see if there is any significant statistical difference among the resultsobtained from the three class-based policies. Table 4 shows the raw data of five average WOFR under fivedifferent policies.
As we apply ANOVA test for the data in Table 4, we obtain the results as shown in Table 5. The nullhypothesis is that the WOFR from the five methods are equal. F-test results indicates that, with a = 0.01,the null hypothesis is rejected since F0 = 11.806 > F(4,20, .01) = 4.43, as shown in Table 5.
Table 5Result of one-way ANOVA
Source SS df MS F p
Between (methods) 615.526 4 153.882 11.806** .000**
Within 260.675 20 13.034
Total 876.202 24
* p < .05, **p < .01.
Table 6Pairwise comparison of mean differences between the methods
FCFS CP-R CP-D CP-A LP
FCFS �7.354** �5.640* �6.216* �15.458**
CP-R 1.714 1.138 �8.104**
CP-D �0.576 �9.818**
CP-A �9.242**
LP
* p < .05, **p < .01.
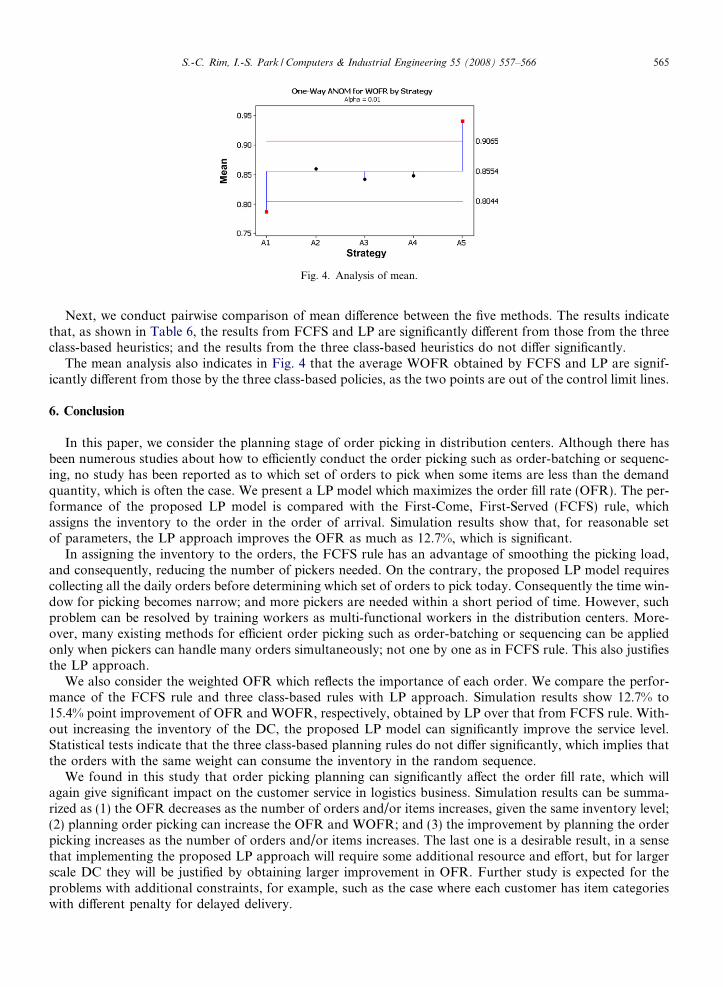
Fig. 4. Analysis of mean.
S.-C. Rim, I.-S. Park / Computers & Industrial Engineering 55 (2008) 557–566 565
Next, we conduct pairwise comparison of mean difference between the five methods. The results indicatethat, as shown in Table 6, the results from FCFS and LP are significantly different from those from the threeclass-based heuristics; and the results from the three class-based heuristics do not differ significantly.
The mean analysis also indicates in Fig. 4 that the average WOFR obtained by FCFS and LP are signif-icantly different from those by the three class-based policies, as the two points are out of the control limit lines.
6. Conclusion
In this paper, we consider the planning stage of order picking in distribution centers. Although there hasbeen numerous studies about how to efficiently conduct the order picking such as order-batching or sequenc-ing, no study has been reported as to which set of orders to pick when some items are less than the demandquantity, which is often the case. We present a LP model which maximizes the order fill rate (OFR). The per-formance of the proposed LP model is compared with the First-Come, First-Served (FCFS) rule, whichassigns the inventory to the order in the order of arrival. Simulation results show that, for reasonable setof parameters, the LP approach improves the OFR as much as 12.7%, which is significant.
In assigning the inventory to the orders, the FCFS rule has an advantage of smoothing the picking load,and consequently, reducing the number of pickers needed. On the contrary, the proposed LP model requirescollecting all the daily orders before determining which set of orders to pick today. Consequently the time win-dow for picking becomes narrow; and more pickers are needed within a short period of time. However, suchproblem can be resolved by training workers as multi-functional workers in the distribution centers. More-over, many existing methods for efficient order picking such as order-batching or sequencing can be appliedonly when pickers can handle many orders simultaneously; not one by one as in FCFS rule. This also justifiesthe LP approach.
We also consider the weighted OFR which reflects the importance of each order. We compare the perfor-mance of the FCFS rule and three class-based rules with LP approach. Simulation results show 12.7% to15.4% point improvement of OFR and WOFR, respectively, obtained by LP over that from FCFS rule. With-out increasing the inventory of the DC, the proposed LP model can significantly improve the service level.Statistical tests indicate that the three class-based planning rules do not differ significantly, which implies thatthe orders with the same weight can consume the inventory in the random sequence.
We found in this study that order picking planning can significantly affect the order fill rate, which willagain give significant impact on the customer service in logistics business. Simulation results can be summa-rized as (1) the OFR decreases as the number of orders and/or items increases, given the same inventory level;(2) planning order picking can increase the OFR and WOFR; and (3) the improvement by planning the orderpicking increases as the number of orders and/or items increases. The last one is a desirable result, in a sensethat implementing the proposed LP approach will require some additional resource and effort, but for largerscale DC they will be justified by obtaining larger improvement in OFR. Further study is expected for theproblems with additional constraints, for example, such as the case where each customer has item categorieswith different penalty for delayed delivery.
566 S.-C. Rim, I.-S. Park / Computers & Industrial Engineering 55 (2008) 557–566
References
Anderson, C. (2004). The long tail. Wired Magazine, Issue 12.10. CondeNet Inc.Brynzer, H., & Johansson, M. I. (1996). Storage location assignment: Using the product structure to reduce order picking times.
International Journal of Production Economics, 46–47, 595–603.Chen, M. C., & Wu, H. P. (2005). An association-based clustering approach to order batching considering customer demand patterns.
Omega, 33(4), 333–343.Daniels, R. L., Rummel, J. L., & Schantz, R. (1998). A model for warehouse order picking. European Journal of Operational Research, 105,
1–17.De Koster, M. B. M., van der Poort, E. S., & Wolters, M. (1999). Efficient order batching methods in warehouses. International Journal of
Production Research, 37(7), 1479–1504.Gademann, N., & van de Velde, S. (2005). Order batching to minimize total travel time in a parallel-aisle warehouse. IIE Transactions,
37(1), 63–75.Gu, J., Goetschalckx, M., & McGinnis, L. F. (2007). Research on warehouse operation: A comprehensive review. European Journal of
Operational Research, 177, 1–21.Ho, Y. C., & Tseng, Y. Y. (2006). A study on order-batching methods of order-picking in a distribution centre with two cross-aisle.
International Journal of Production Research, 44(17), 3391–3417.Hsieh, L., & Tsai, L. (2006). The optimum design of a warehouse system on order picking efficiency. International Journal of Advanced
Manufacturing Technology, 28(5/6), 626–637.Petersen, C. G., & Aase, G. (2004). A comparison of picking, storage, and routing policies in manual order picking. International Journal
of Production Economics, 92(1), 11–19.Ratliff, H. D., & Rosenthal, S. (1983). Order-picking in a rectangular warehouse: A solvable case of the traveling salesman problem.
Operation Research, 31(3), 507–521.Simchi-levi, D., Kaminsky, P., & Simchi-levi, E. (2003). Designing and managing the supply chain. In Product and supply chain design
(2nd. ed.). McGraw-Hill.Vaughan, T. S., & Petersen, C. G. (1999). The effect of cross aisles on order picking efficiency. International Journal of Production Research,
37(4), 887–897.Won, J., & Olafsson, S. (2005). Joint order batching and order picking in warehouse operations. International Journal of Production
Research, 43(7), 1427–1442.