Picking up speed through collaboration - Tietoevry
182
-
Upload
khangminh22 -
Category
Documents
-
view
3 -
download
0
Transcript of Picking up speed through collaboration - Tietoevry

ANNUAL REPORT 2018
Picking up speed through collaboration

ANNUAL REPORT 2018
Picking up speed through collaboration

This annual report is published in English.
The EVRY Annual Report 2018 is available at investor.evry.com
EVRY seeks to have a customer-centric and partner-driven approach as well as a corporate culture that supports innovation and collaboration. In order for EVRY to pick up speed and succeed in a market characterised by a fast pace of innovation, close collaboration is crucial. This applies in relation to internal collaboration at the company as well as to our collaboration with our partners and, not least, with our customers. In 2018 EVRY therefore put extra emphasis on collaboration, as indicated by the title of this year’s annual report.
This annual report sets out not only our strategy, organisational structure and financial results, but also other matters that are important to EVRY, from our effect on wider society to our business plan and internal matters. It consequently provides integrated reporting on sustainability and corporate social responsibility, and is intended to provide an overview of our business as it is today and to show where we are heading over the coming years.
ABOUT EVRY
EVRY is a leading Nordic IT services and software company aiming to create Digital Advantage for people, businesses and society as a whole. Rooted in our Nordic values and combining business understanding, technology expertise and local proximity we strive to enable our customers to make use of technology in the best possible way. We leverage our Nordicness to do business in more than 18 countries and our 8 800 employees are passionate about shaping the future – today.
Picking up speed through collaboration

Contents
EVRY IN BRIEFCEO letter 06Vision, values and business goals 10Main features in 2018 12Case study: Financial Services 14Case study: EPIM 18Case study: Volvo 22
BUSINESS PLANOur framework 28 Get the basics right 30Operational excellence 36Customer centricity 42Employee engagement & culture 48Innovation 56
INVESTOR INFORMATIONCFO letter 66The EVRY share 68Key figures 74Alternative performance measures 76
BUSINESS REPORTAbout EVRY 82EVRY’s executive management team 88Key figures by business area 90
FROM THE BOARDROOMEVRY s Board of Directors 94Corporate governance 96 Report from the Board of Directors 2018 102
FINANCIAL STATEMENTS & NOTESGroup financial statements & notes 113EVRY ASA financial statements & notes 162Independent auditor's report 172
01
02
03
04
05
06
EVRY IN BRIEF
BUSINESS PLAN
INVESTOR INFORMATION
BUSINESS REPORT
FROM THE BOARDROOM
FINANCIAL STATEMENTS & NOTESEVRY IN BRIEF
BUSINESS PLAN
INVESTOR INFORMATION
BUSINESS REPORT
FROM THE BOARDROOM
FINANCIAL STATEMENTS & NOTESEVRY IN BRIEF
BUSINESS PLAN
INVESTOR INFORMATION
BUSINESS REPORT
FROM THE BOARDROOM
ANNUAL ACCOUNTS AND NOTES
EVRY IN BRIEF
BUSINESS PLAN
INVESTOR INFORMATION
BUSINESS REPORT
FROM THE BOARDROOM
FINANCIAL STATEMENTS & NOTES

Key figures
2018 2017 2016 2015 2014 2013 2012
Operating revenue (NOK million) 12 912 12 596 12 246 12 860 12 773 12 600 12 731EBITA1) (NOK million) 1 582 1 569 1 322 811 813 764 691 EBITA-margin1) 12.3 % 12.5 % 10.8 % 6.3 % 6.4 % 6.1 % 5.4 %Free cash flow (NOK million) 997 913 964 592 652 473 297Order backlog (NOK bn) 19.4 18.0 20.8 17.1 18.0 16.6 15.3No. of employees 8 807 8 545 8 864 9 422 10 350 10 323 9 873Employee satisfaction (total score 100) 81.7 81.6 80 .1 75.4 n/a n/a n/aEnvironmental performance (CDP) A A- A 97 91 89 78
OPERATING REVENUE NOK MILLION FREE CASH FLOW NOK MILLIONEBITA 1) NOK MILLION
13 000
12 500
12 000
11 500
11 000
10 500
10 000
201
6
201
6
201
6
201
7
201
7
201
7
201
8
201
8
12 9
12
1 58
2
997
201
8
201
5
201
5
201
5
201
4
201
4
201
4
201
3
201
3
201
3
201
2
201
2
201
2
1 200
1000
800
600
400
200
0
1 600
1 400
1 200
1 000
800
600
400
1) Before other income and expensed
2 | ANNUAL REPORT 2018

Carbon Disclosure Project (CDP) scores, which indicate companies´ environmental performance.
A 2018
A- 2017
A 2016
97 2015
91 2014
89 2013
78 2012
OUR INDUSTRIES
OPERATING REVENUE 2018
EVRY Norway 46%
EVRY Sweden 27%
EVRY Financial Services 27%
NOK 12.9BN
8 800+NUMBER OF EMPLOYEES
81.7pointsEMPLOYEE SATISFACTION
12.3%EBITA MARGIN 1)
nok 19.4bn
ORDER BACKLOG
> Financial Services Innovating IT today, defining banking for tomorrow
> Insurance Digital insurance operations that support innovation and growth
> Public Services Digitalization partner for the benefit of citizens and public sector organisations
> Healthcare Solutions for simplifying and increasing the safety of patient care
> Retail Smart solutions for a seamless customer experience
> Logistics Creating sustainable and intelligent logistics for more demanding customer requirements
> Energy A complete spectrum of services adapted to the sector’s needs
> Industry & Manufacturing Increasing productivity through digital business processes
> Communications, Media & Tech Creating digital advantage by focusing on the customer’s customer
> Professional Services Transformative solutions for leveraging digitalisation
OUR ENVIRONMENTAL PERFORMANCE
EVRY IN BRIEF
BUSINESS PLAN
INVESTOR INFORMATION
BUSINESS REPORT
FROM THE BOARDROOM
FINANCIAL STATEMENTS & NOTES
ANNUAL REPORT 2018 | 3
EVRY IN BRIEF
BUSINESS PLAN
INVESTOR INFORMATION
BUSINESS REPORT
FROM THE BOARDROOM
FINANCIAL STATEMENTS & NOTES


EVRY in Brief01
06 CEO letter
10 Vision, values and business goals
12 Main features in 2018
14Case study: Financial Services
18 Case study: EPIM
22 Case study: Volvo
EVRY IN BRIEF
BUSINESS PLAN
INVESTOR INFORMATION
BUSINESS REPORT
FROM THE BOARDROOM
FINANCIAL STATEMENTS & NOTES

Collaboration is the key to successEVRY has come a long way in terms of repositioning itself from an IT service provider into a business partner that creates digital advantage for, and together with, its customers. In 2018, EVRY took new and important steps to address the changes taking place in the market, and we see significant potential for the company in the years ahead.
“EVRY is committed to being the Nordic alternative: close by, easy to work with, transparent with its customers and capable.”
CEO LETTER
6 | ANNUAL REPORT 2018

Two big waves are closing in on the global IT landscape. The first wave, which has already reached us, is about efficiency improvements, standardisation and automation. Large global providers and scala-ble cloud services are creating stiff competition in infrastructure services. This means that the transaction- oriented aspect of the IT industry is becoming a mature market that is growing slowly and offering decreasing margins. The next wave, which is racing toward the shore, is based on disruptive technology and how this can create greater business value by radically changing the value propositions, processes and business models of our customers.
A BUSINESS PARTNER FOR DIGITAL TRANSFORMATION
In the face of these waves, we have chartered a new course. Instead of continuing as an IT services company primarily focused on scale and cost efficiency, we are working toward becoming a busi-ness partner for our customers. EVRY’s knowledge of business, technology, customers and markets is enabling new value creation. In 2018 we worked on shifting our focus from transaction-based IT services to value-based services that offer greater profitability. We have increased our use of disruptive technology, and are combining robotics, artificial intelligence and analytics, among other technologies, to support our customers’ businesses.
Understanding business as well as technology will be an important requirement for our journey over the coming years. EVRY is committed to being a partner for value creation and to contributing to the digitalisation of the Nordic region. We will also seek, in conjunction with our partners, to deliver the infrastructure services needed to make this possible.
EVRY EMBRACES DIVERSITY
Our most important priority for the coming years is to ensure that our employees have the right exper-tise for us to be relevant to our customers. We need to attract the right people and to ensure that EVRY becomes one of the best places to work in the Nordic region. A number of studies have emphasised the fact that companies with significant diversity are more successful. I think that the reason for this is that diversity means you can mirror your customers to a greater extent. Understanding each other better enhances the conditions for value creation. We are therefore recruiting skilled people in a range of professions with backgrounds that are relevant to our customers. This is enabling us to offer customer teams that are varied in terms of their educational background, expertise, experiences, age, gender and cultural heritages.
A KNOWLEDGE INTENSIVE ORGANISATION
EVRY is a knowledge business, so access to leading technology and industry expertise is business- critical for us. We are building the weight of expertise needed to digitalise the Nordic region. By recruiting the right people and developing our employees’ expertise, we can deliver comprehensive, future- oriented solutions that benefit key sections of business and industry as well as society as a whole. One of the major challenges for success going forward will be winning the battle for talent. EVRY has therefore established strong collaborations with educational institutions. We invested heavily in our workforce in 2018, and this included us taking our own medicine and launching cognitive HR for both recruitment and competence development. Using robotics to carry out personality and game-based ability assessments means we can screen candidates objectively, and this is making the recruitment process more efficient and helping us to select the right people. Our solution, which we are now delivering to a number of customers, is helping us to employ more women. 40 percent of the new graduates we recruited in 2018 were women.
A LEADING NORDIC CONSULTING COMPANY
Investment in technology is increasingly being managed directly by companies’ business units, and we now talk directly to the managers of business units to an increasing degree. This means that we need to be experts in how new technology can create advan-tages in the industries on which we have chosen to focus. In 2018, we hired around 800 new employees in Norway and Sweden, which has helped give us the injection of expertise we need to meet our custom-ers’ digital needs.
We are now setting up seven Nordic-wide areas of expertise to provide bigger and better specialist environments for our consultants: Digital Experience, Business Consulting, Business Applications, Cloud & Infrastructure, Application Innovation, Security & Risk, and Artificial Intelligence, Analytics & Insight. This will strengthen our collaboration across national borders and enable us to better respond to customer needs.
CLOSER TO THE CUSTOMER’S BUSINESS
In order to become a business partner to our customers, we need to be familiar with the reality in which they operate. Greater industry focus is therefore essential. Over a period of many years, we have built up significant expertise in the finan-cial sector, and this benefits both our customers and us. Our ambition going forward is to use this success as a source of inspiration for building more strong industry segments where we can be the leading player in the Nordic region in >
ANNUAL REPORT 2018 | 7
EVRY IN BRIEF
BUSINESS PLAN
INVESTOR INFORMATION
BUSINESS REPORT
FROM THE BOARDROOM
FINANCIAL STATEMENTS & NOTES
terms of our expertise and solutions. In the public and healthcare sectors, we already have a strong position that we are building on further. We also have a significant focus on retail and logistics, industrial and service companies, and small and medium-sized businesses.
We are working actively to internationalise our Nordic solutions. One of the strate-gic agreements we entered into in 2018 was with Handelsbanken in Finland, which has selected our new platform for core banking and payment solutions. We also won an agreement to deliver our ATM services to Geldmaat in the Netherlands. Geldmaat is a joint venture between ABN AMRO Bank, ING Bank and Rabobank. We also entered into an agreement to deliver systems and services for all of Bankomat’s 1 800 ATMs in Sweden.
A PARTNER-CENTRIC APPROACH
Digitalisation is continuing at full strength. EVRY’s potential as a business partner for Nordic companies and their digital journeys is significant. How well we work together internally and with our external collaboration partners will be crucial to our future success. Our ecosystem of global partners such as Microsoft, Google, IBM and Amazon, as well as our various local specialist partners, represent important building blocks for the future. Our primary value proposition consists of combining the technology and expertise of our collaboration partners with our local presence, business understanding and know-how – for the benefit of our customers.
We do not intend to develop the kind of platforms that we offer for the banking sector for other sectors, but we will be working closely with the best suppliers in their fields and will be expanding our ecosystem of collaboration partners. This will enable us to provide good advice about what is best in each individual case.
THE NORDIC ALTERNATIVE
Going forward, we will make the most of our Nordic strength and will work across national borders to a greater extent to do things on a larger scale. We will also work in a more integrated way and will capitalise on the uniqueness of being Nordic. EVRY has a local presence and is close to its customers, and it can process their data safely and securely in the Nordic region. These factors are important to creating genuine value for customers and differentiate us from global companies.
EVRY is committed to being the Nordic alternative: close by, easy to work with, trans-parent with its customers and capable.
Per HoveChief Executive Officer (CEO)
8 | ANNUAL REPORT 2018

THE OSLO MENTORS:
Jostein Prytz, a Junior Consultant at EVRY Norway, and Benedicte Aase Vabø, a Development Manager at EVRY Financial Services, are mentors to Per Hove.
"Having internal mentors means I always have someone to discuss ideas with and test messages on. This helps me to see things from a different perspective. I also benefit from the continual feedback they give me when I give presentations or speeches."
PER HOVECEO
ANNUAL REPORT 2018 | 9
EVRY IN BRIEF
BUSINESS PLAN
INVESTOR INFORMATION
BUSINESS REPORT
FROM THE BOARDROOM
FINANCIAL STATEMENTS & NOTES

Vision, values and business goals
VALUES
> Anticipate needs
> Go beyond expectations
> Perform together
> Empower and inspire
Creating digital advantage for tomorrow´s leaders
VISION
BUSINESS CONCEPT
Together, we identify opportunities and deliver superior solutions, creating tangible value for our customers and society as a whole
10 | ANNUAL REPORT 2018

BUSINESS GOALS
Leverage our extensive customer base and strong portfolio of products and services across all business areas to further accelerate organic growth
Continuously enhance and increase customer satisfaction across all
business areas
Continue to increase profitability across all business areas by deploying best practices and exploiting innovations
and new technologies
Attract, develop and retain the most highly motivated, committed and skilled
employees in the industry
ANNUAL REPORT 2018 | 11
EVRY IN BRIEF
BUSINESS PLAN
INVESTOR INFORMATION
BUSINESS REPORT
FROM THE BOARDROOM
FINANCIAL STATEMENTS & NOTES

IT AGREEMENT WITH GASSCO
EVRY will deliver a broad range of IT services.
LONG-TERM AGREEMENT WITH SWEDBANK NORWAY
EVRY will deliver solutions for banking operations, including next-generation core banking and payment solutions.
EXPANDED COLLABORATION WITH LANDKREDITT BANK
EVRY will deliver a complete portfolio of solutions, including next-generation core banking and payment solutions.
EXTENDED AND EXPANDED AGREEMENT WITH STOREBRAND
EVRY will deliver IT outsourcing services, including cloud services.
IMPROVING PATIENT SAFETY
New agreement with the South-Eastern Norway Regional Health Authority for an electronic patient record solution.
STRENGTHENING FOCUS ON ARTIFICIAL INTELLIGENCE
Technology partnership with ADDO AI from Singapore.
AGREEMENT WITH BANKOMAT
Bankomat and EVRY extend their ATM agreement.
ACCELERATING GJENSIDIGE’S DIGITALISATION
EVRY will be a core supplier of techno- logical solutions and digital services for the coming years.
Main features in 2018
Q1 Q2
EVRY GRANTED AUTHORISATION TO OPERATE A DEBT REGISTER
This is an important step positioning EVRY in the data economy.
UNIVERSUM SURVEY FOR 2018
EVRY is the 10th most attractive technology company to work for in
our region, and one of the most attractive employers for IT-students in
the Nordics.
12 | ANNUAL REPORT 2018

EVRY AND MONOBANK LAUNCHGOOGLE PAY
EVRY launches the mobile payment solution for Monobank’s customers.
COLLABORATION WITH SPAREBANK 1 ALLIANCE
A new collaboration on digital workplace services will enable innovation and better services for the Sparebank 1 Alliance’s employees.
NEW PARTNERSHIP WITH BANKGIROT
EVRY will work with Bankgirot to modernise its technical infrastructure.
DNB AND EVRY
DNB and EVRY adopt artificial intelligence and machine learning to stop card fraud.
HANDELSBANKEN IN FINLANDAND EVRY ENTER AGREEMENT
New strategic agreement for the delivery of a complete portfolio of banking solutions including next-generation core banking and payment solutions.
EVRY AND GELDMAAT
EVRY will deliver ATM transactionprocessing services based on its ATM platform and modern technology. Geldmaat (former GSN) is a joint venture between ABN AMRO Bank, ING Bank and Rabobank in the Netherlands.
PAYMENT FROM WRISTBANDS LAUNCHED
Handelsbanken, Bankaxept and EVRY launch contactless payment from micro bank cards in wristbands.
DNB EXTENDS ITS AGREEMENT
DNB extends its agreement for main-frame operations services for the bank's core banking system and other important systems by one year.
Q3 Q4
3838 banks have entered into agreements to use EVRY’s Open banking platform which has PSD2 functionality.
THE ONLY NORDIC IT COMPANY WITH A-RATING FROM CDP THREE YEARS IN A ROW
CDP : Carbon Disclosure Project
ANNUAL REPORT 2018 | 13
EVRY IN BRIEF
BUSINESS PLAN
INVESTOR INFORMATION
BUSINESS REPORT
FROM THE BOARDROOM
FINANCIAL STATEMENTS & NOTES

EVRY Financial Services
New regulations, new competition and evolving customer expectations as well as rapid technological development are driving digital transformation and the move toward open banking models. It is essential for banks to embrace and adapt to these changes, which are creating new opportunities. EVRY has the experience, resources and skills that banks and financial institutions need to transform their operations and continuously generate digital advantages.
CASE STUDY
14 | ANNUAL REPORT 2018

PEOPLE – We understand the finance industry and its customers, their needs and how to create value. Whether customers choose to meet their bank in person, or via digital channels, customers expect a good experience with intuitive, relevant and prompt services. EVRY makes this happen.
BUSINESS – The financial industry is undergoing a significant transformation and is increasingly competitive. Through deep industry knowledge, EVRY finds ways to help banks do things differently and generates new ideas that change how they operate and compete.
TECHNOLOGY – EVRY supports the customer experience provided by banks, modernises and simplifies their core IT systems and helps them to achieve greater cost efficiency through automated processes. As a business partner for digitalisation, EVRY transforms banks’ operations and helps them generate digital advantages.
Creating digital advantage for tomorrow’s leaders.
EVRY IN BRIEF
ANNUAL REPORT 2018 | 15
BUSINESS PLAN
INVESTOR INFORMATION
BUSINESS REPORT
FROM THE BOARDROOM
FINANCIAL STATEMENTS & NOTES

Innovating IT today, defining banking for tomorrow
CASE STUDY – EVRY FINANCIAL SERVICES
EVRY Financial Services offers a broad and comprehensive portfolio of solutions to support banks in their management of continuous change and to facilitate the next generation of banking services. Through its in-depth industry knowledge, EVRY helps its banking customers to innovate and to generate new ideas that change how they operate and compete, with its services ranging from developing the customer experience to modernizing and simplifying key IT systems and improving an organisation’s cost efficiency by automating its processes.
OPEN BANKING
Many banks have already deployed different open banking initi-atives that have enabled them to gain access to an expanded ecosystem of services and to reach new customers. EVRY´s solutions for open banking help customers to securely share and consume financial data with financial institutions, fintechs and third parties. Several banks have entered into agreements with EVRY, and have thus started investing in frameworks and solutions that enable their business and operational models to harness the value of open banking.
NEXT-GENERATION CORE BANKING AND PAYMENT SOLUTIONS
The banking industry continues to change quickly. The bank of the future will open up and share its capacity through new business models. In order to be able to do this, banks need flex-ible core banking and payment solutions that provide real-time access to data and are dynamic, scalable, customer-centric and efficient. EVRY's solutions are built on industry standards and modern architecture that is fit for the digital economy, includ-ing a high degree of automation, and support straight-through processes and are easy to integrate with third parties.
CARD SERVICES AND MOBILE PAYMENTS
The world of payments is evolving, and consumer and business behaviour is changing rapidly, moving towards even faster and easier methods of payment. EVRY provides a comprehensive portfolio of card and mobile payment services, and offers physi-cal and virtual cards, including full lifecycle management, as well as other related services. Our scalable, compliant and inter-nationally adapted card platform enables our customers to manage all types of payment instruments using a single admin-istration tool. This ensures flexible and cost-efficient services, and enables customers to launch new products and services to the market more quickly.
LENDING SERVICES
Lending is one of the most complex processes that banks carry out since it involves multiple steps and specialist roles. In order to support the efficient and automated processing of loans and credit, EVRY offers services covering the entire loan life cycle that meet the particular needs of both the private and corporate markets. EVRY delivers its lending services to customers across the Nordics and Europe.
ATM SERVICES
Recent years have seen a significant decline in the use of cash in the Nordics, but cash will still remain crucial for the foreseeable future. EVRY is seeing banks throughout Europe become increasingly interested in reducing the costs of handling cash. With our expertise and experience, we can play a vital role in delivering optimized, secure ATM networks to the European market. EVRY is one of the few suppliers in the world that offers a true ATM-pooling solution, and currently delivers ATM services to customers in the Nordic and European markets.
CASH MANAGEMENT
Enterprises that manage their working capital effectively benefit from better cash flow, achieve higher returns on invested capital and can reduce the cost of funding. However, optimising working capital in complex organisa-tional structures can be a demanding task. EVRY provides banks with sophisticated cash management solutions, which include multi-currency cash pool, cross-border cash pool and global liquidity management services. These solutions enable banks to offer their corporate customers advanced products that enable them to enjoy superior liquidity optimisation, shorter times to market and lower operating expenses.
CARD FRAUD PREVENTION SERVICES
Although the Nordic countries have one of the lowest rates of card fraud in the world, fraudsters are becoming increasingly sophisticated and organized. With EVRY’s card fraud services, potential fraud can be detected before it happens, reducing fraud losses. Our team of experts and analysts ensure that banks receive maximum protection against fraudulent transactions. Integrating artificial intelligence into our solutions is increasing the accuracy of real-time authorisation for genuine transactions and is helping to stop more attempts to commit fraud. EVRY’s solutions currently stop eight out of ten fraudulent transactions.
16 | ANNUAL REPORT 2018

Complete portfolio of banking services
Next generation core banking and payment solutions
Card services & mobile payments
Lending services
Cash mangement
ATM services
Card fraud prevention services
Open banking
SpareBank 1
Handelsbanken
Handelsbanken
Aktia
Bankdata
BECChange Group
Hampden & Co Geldmaat (former GSN)
Bankomat
Länsforsäkringar Bank
DNB
MonobankSwedbank
S-banken
EVRY Financial Services serves more than 165 customers in 18 countries– Examples of customers and deliveries
Alpha Bank
(Greece)
ANNUAL REPORT 2018 | 17
EVRY IN BRIEF
BUSINESS PLAN
INVESTOR INFORMATION
BUSINESS REPORT
FROM THE BOARDROOM
FINANCIAL STATEMENTS & NOTES

EPIM - By the industry, for the industry
EPIM (Exploration & Production Information Management) and EVRY have built a forward-looking and intuitive system for matching suppliers and operators on the Norwegian continental shelf. The new system has the potential to generate huge savings in operating costs and makes it easier for all parties to stay up to date.
CASE STUDY
18 | ANNUAL REPORT 2018

PEOPLE – The new system will have a much better “matching system” with intuitive user interfaces that will guide users through the search for companies able to deliver according to their specifications, and companies will be rated based on their previous performance. EVRY has developed a helpdesk chatbot, which will help users of the new platform.
BUSINESS – The new and intelligent system from EPIM has the potential to generate huge savings in operating costs, and makes sure that the right products and services from a bewil-dering pool of suppliers are matched with the requirements of operators. Suppliers no longer need to update their key business information as this is continually updated with changes from public sources such as the Brønnøysund Register Centre, which saves time.
TECHNOLOGY – The project delivery from EVRY included architecture, consulting, application development and application management. Chatbot, service desk, artificial intelligence, robotics and automated process services were also included in the project.
Creating digital advantage for tomorrow’s leaders.
ANNUAL REPORT 2018 | 19
EVRY IN BRIEF
BUSINESS PLAN
INVESTOR INFORMATION
BUSINESS REPORT
FROM THE BOARDROOM
FINANCIAL STATEMENTS & NOTES

BACKGROUND
EPIM is a non-profit membership association governed by the operators on the Norwegian Continental Shelf. Its purpose is to facilitate the best possible flow of information between operators, partners, authorities and other stakeholders on the Norwegian Continental Shelf, through innovative and cost efficient industry solutions.
The 27 oil and gas operators on the Norwegian continental shelf spend approximately NOK 50 billion each year on products and services from more than 4 000 suppliers from around the globe in order to run safe and efficient production operations. The current process for finding suppliers for each of the thou-sands of requests is time consuming and does not always result in the best match in terms of service, product quality, suitability, availability and price. For more than 20 years, a joint qualification system (Achilles JQS) has been used to qualify suppliers and match operator requirements with the best suited suppliers.
EPIM, which is the owner of the JQS-concept, decided to build its own and more forward-looking solution that would be adapted to EPIM’s users. Together with EPIM, EVRY created a roadmap for this and developed a substitute for the old system, with the new system launched in autumn 2018.
THE PROJECT
EVRY has been instrumental in the development of EPIM’s new JQS solution, which is a supplier register and pre-qualification service used by purchasers in the Norwegian and Danish oil and gas sector. It manages supplier information and risk in the supply chain and enables efficient purchasing in accordance with EU regulations, covering most procurement needs. The collabo-ration between operators and suppliers coordinated by EPIM will deliver a standardised industry solution for the Norwegian continental shelf, with operators and suppliers having jointly agreed standards for product and service categories, capability assessment guidelines, and core inputs for all key functionalities in the solution.
EPIM JQS dynamically retrieves web information from the 4 000 companies via 'web crawlers' that make the system
much more user-friendly. It automatically updates companies’ information from the Brønnøysund Register Centre and Dun & Bradstreet, with the information found on the web checked continuously against what is in the database. Previously the infor-mation was only updated once a year when the companies sent their updates.
The project delivery from EVRY included architecture, consulting, application development and application manage-ment. On the basis of the process and implementation project, EVRY has been awarded additional business by EPIM, including chatbot, service desk, artificial intelligence, robotics and auto-mated process services.
BUSINESS OUTCOMES
The solution has been designed, developed and is supported by EVRY entirely on the basis of EPIM's requirements specifica-tion. As a result, EPIM has a modern, intuitive solution that makes the job of staying up to date much easier for all suppliers to the Norwegian oil sector. It also makes it easier for operators to find the right vendors based on a modern search engine. The solu-tion is built on a platform that means that adding more cognitive functions and expanding the solution to meet future needs would be simple.
“The new and intelligent EPIM JQS has the potential to generate huge savings in operating costs, and equally importantly, to ensure that the right product and service are matched to each requirement for a bewildering pool of suppliers”.
GYRO AANESTAD VIDVEIProject Manager, EVRY Norway
A collaborative arena for the oil and gas industry
CASE STUDY – EPIM
20 | ANNUAL REPORT 2018

ULIANA BASHCHUK
Age: 24
Position: UX-UI designer
Workplace: EVRY Ukraine
Nationality: Ukrainian
YNGVE NILSEN
Age: 41 Position: Senior Advisor - JQS Service Manager
Workplace: EPIM
Nationality: Norwegian
TONE O. SANDVIK
Age: 42 Position: Head of Sales, Global Delivery SME
Workplace: EVRY Norway
Nationality: Norwegian
TOM ERLING HENRIKSEN
Age: 63
Position: Head of Oil & Gas
Workplace: EVRY Norway
Nationality: Norwegian
DENYS SHEVCHENKO
Age: 26
Position: Team lead
Workplace: EVRY Ukraine
Nationality: Ukrainian
ANDRE OALAND
Age: 33
Position: Advisor and Project Manager
Workplace: Efab
Nationality: Norwegian
OLEKSANDR GOLUBCHYKOV
Age: 25
Position: Business Analyst
Workplace: EVRY Ukraine
Nationality: Ukrainian
GYRO AANESTAD VIDVEI
Age: 40
Position: Project Manager
Workplace: EVRY Norway
Nationality: Norwegian
THE TEAM
ANNUAL REPORT 2018 | 21
EVRY IN BRIEF
BUSINESS PLAN
INVESTOR INFORMATION
BUSINESS REPORT
FROM THE BOARDROOM
FINANCIAL STATEMENTS & NOTES
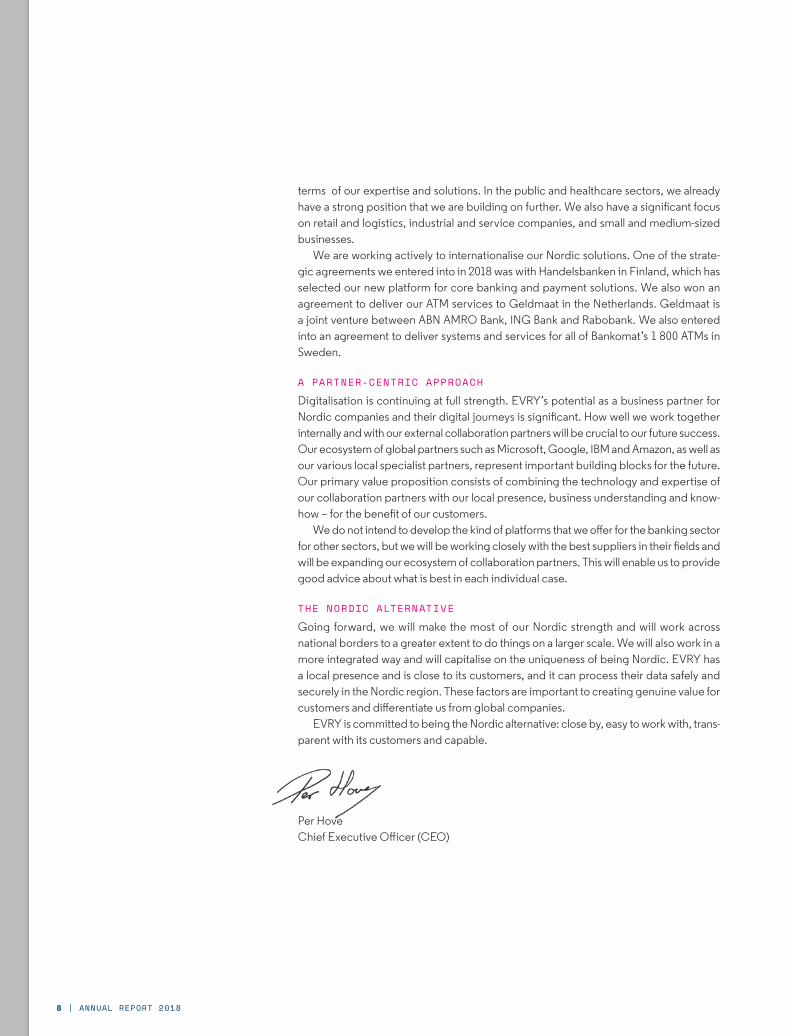
PEOPLE – The new digital workflow is user-friendly and efficient, which has increased the satisfaction and motivation of Volvo´s technicians. As it also helps them to be more productive and to develop their skills, it has increased employee engage-ment, with improvements also seen in the agility, efficiency and quality of core processes.
BUSINESS – Volvo and EVRY have worked together to increase Volvo's workshop capacity by introducing augmented reality and a mobile-first application that assist Volvo's technicians. These measures have helped strengthen Volvo´s customer relationships by improving its servicing work and the customer experience. Due to the new digital solutions, less experienced technicians can now perform more complex services and repairs more quickly and efficiently.
TECHNOLOGY – The project team designed both a mobile application and an AR application for the Microsoft HoloLens. This has resulted in Volvo's workshop technicians moving from a paper-based process to a 100-percent digital workflow with two digital options.
Creating digital advantage for tomorrow’s leaders.
22 | ANNUAL REPORT 2018

Volvo
Volvo and EVRY joined forces to explore whether they could increase customer satisfaction by using digital tools in order to provide technicians with better support when conducting servicing and repair work. After a preliminary study and concept creation phase, a concept called “How2” emerged. Following a design and development phase and testing, technicians now use Augumented Reality glasses and tablets in their day-to-day work, securing an efficient and high-quality service for the customer.
CASE STUDY
EVRY IN BRIEF
ANNUAL REPORT 2018 | 23
BUSINESS PLAN
INVESTOR INFORMATION
BUSINESS REPORT
FROM THE BOARDROOM
FINANCIAL STATEMENTS & NOTES

PRELIMINARY STUDY
The preliminary study involved gathering user insights through interviews and observation. Technicians with different levels of experience from seven different markets were interviewed. Technicians were also observed at 13 different workshops in four markets, with the workshops varying in size and in terms of the routines they performed. One of the preliminary study’s findings was that the support tools that the technicians use when conduct-ing servicing and repair work needed updating in order to be able to provide the customer with an efficient and high-quality service.
CONCEPT CREATION
Several concept ideas were developed on the basis of the prelim-inary study. During a workshop with technicians and represent-atives from several departments from Volvo’s Global Customer Service unit, it was decided that a concept called “How2” was one of the concepts that should be further explored. The How2 concept used Augumented Reality (AR) glasses and tablets to find new digital tools that could support the technicians in their daily work.
DESIGN AND DEVELOPMENT
Two prototypes were developed, one based on AR glasses (HoloLens) and one based on tablets. A UX-designer was added to the team to refine the UX and design of the prototypes. The content of the prototypes was developed by a content team from Ukraine. During the design and development phase, technicians and other experts were involved to give the team information and feedback.
PILOT TEST
The final prototypes were tested in a pilot study in Belgium that involved 26 technicians with varying levels of experience from seven different dealerships. The aim was to get a spread in terms of the amount of experience the technicians had. During the pilot, the team measured service times, quality and experience in order to evaluate the prototypes against current tools.
BUSINESS OUTCOMES
With the new digital tools, less experienced technicians can now perform more complex services and repairs more quickly and efficiently. The new digital workflow has increased the satisfac-tion and motivation of technicians, as it also helps them to be more productive and to develop their skills.
“Working together with EVRY on the How2 concept has taught me that the success of collaborations depends on the mind-set of the team involved. When everyone is working to succeed together and sees opportunities rather than obstacles, that’s when the magic starts to happen. And last but definitely not least, it is important to remember to have fun. Fun really makes all the difference.”
Increased customer satisfaction with digital tools
LOTTA STRÖMBECKDigital Innovation manager, Volvo
CASE STUDY – VOLVO
24 | ANNUAL REPORT 2018

LOTTA STRÖMBECK
Age: 31
Position: Digital Innovation Manager
Workplace: Volvo, Innovation & Digital Services
Nationality: Swedish
TOM CLIGNEZ
Age: 38
Position: Content Creator Team Lead
Workplace: EVRY Malmö
Nationality: Belgian
SALIM FARRAN
Age: 42
Position: Senior UX-designer
Workplace: EVRY Gothenburg
Nationality: SwedishTHE TEAM
JAN KEIL
Age: 41
Position: VP Marketing
Workplace: EVRY Ukraine
Nationality: German
EMMA SIKANDER
Age: 29
Position: Project Manager
Workplace: EVRY Gothenburg
Nationality: Swedish
ANNUAL REPORT 2018 | 25
EVRY IN BRIEF
BUSINESS PLAN
INVESTOR INFORMATION
BUSINESS REPORT
FROM THE BOARDROOM
FINANCIAL STATEMENTS & NOTES


Business plan02
28 Our framework
30 Get the basics right
36 Operational excellence
42 Customer centricity
48 Employee engagement & culture
56 Innovation
BUSINESS PLAN
INVESTOR INFORMATION
BUSINESS REPORT
FROM THE BOARDROOM
FINANCIAL STATEMENTS & NOTES

A repositioned EVRY
EVRY adopted a new business plan in 2015 to adapt the company to the market and to position itself for growth and development. It continues to operate this business plan today, which has four action areas: Get the basics right, Operational excellence, Customer centricity, and Employee engagement & culture. A fifth area is Innovation, which is an integral part of the other areas.
We have built our reporting on these areas. EVRY seeks to have a customer-centric and partner-driven approach, and a corporate culture that supports innovation and collaboration. In order to direct this approach, the company’s employees follow “the three Cs”:
Customer-centricity: We understand and anticipate custom-ers’ current and future needs, helping them successfully navigate digital transformation and excel in business.
Culture: We share our energy, curiosity and ideas to foster innovation, attracting talented people and enabling the most diversified and competent teams.
Collaboration: We leverage cross-functional industry and tech-nology insights in collaboration with customers and strategic partners to increase our expertise and create value.
Get the basicsright
Customercentricity
Operationalexcellence
Employee engagement
& culture
Innovation
OUR FRAMEWORK
28 | ANNUAL REPORT 2018
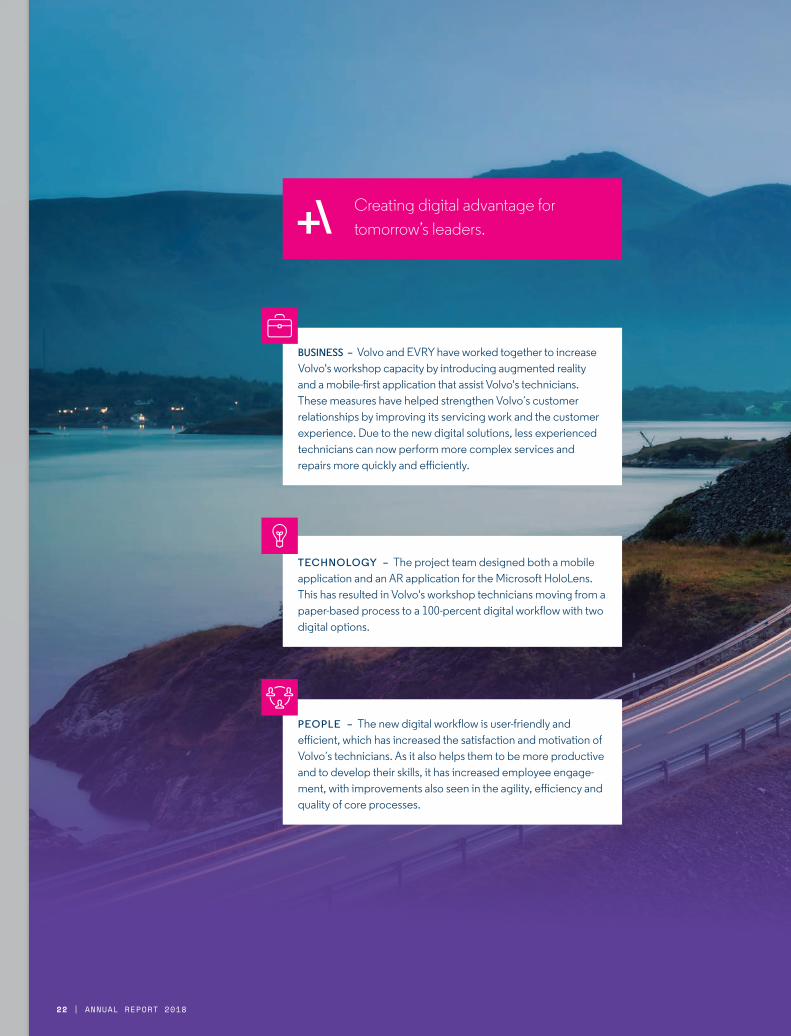
KEY ACTIVITIES IN 2018:
> EVRY succeeded in internationalising its ATM and core banking and payment solutions.
> Inspired by the success of EVRY Financial Services, a greater focus on specific Nordic industries was implemented under the following groupings: Public & Health, Retail & Logistics, Industry & Services, and SMEs.
> EVRY streamlined its consultancy business from 64 areas of expertise to 7 areas, and is building a consulting powerhouse.
> EVRY created business outcomes by delivering “innovation as a service” in close collaboration with customers and partners.
> EVRY strengthened and expanded its capabilities in cognitive analytics, enterprise search and health technology by acquiring Findwise and Exonor.
> EVRY introduced a more standardised and automated product offering with scalable and repeatable solutions.
> The billable utilisation rate for EVRY’s consultants increased for external projects, while internal spending on consultants decreased.
> EVRY reduced critical errors.
> EVRY won or renewed major contracts with customers such as Handelsbanken Finland, Geldmaat in the Nederlands, SpareBank1, DNB, Bankgirot, Bankomat, Swedbank Norway, Landkreditt Bank, Storebrand, Gassco and the Southern and Eastern Norway Regional Health Authority.
> EVRY’s order backlog stabilised at a strong, sustainable level of NOK 19.4 billion at year end.
> EVRY systemised and targeted its recruitment of talented graduates and personnel with new expertise and capabilities.
BUSINESS GOALS
2018 RESULTS
2017 RESULTS
2016 RESULTS
2015 RESULTS
Measuring, verifying and managing carbon emissions in both direct operations and supply chains.
Carbon Disclosure Project Score
A
Carbon Disclosure Project Score
A-
Carbon Disclosure Project Score
A
Carbon Disclosure Project Score
97
Leverage our extensive customer base and strong portfolio of products and services across all business areas to further accelerate organic growth.
Order backlog
NOK 19.4 BN
Order backlog
NOK 18.0 BN
Order backlog
NOK 20.8 BN
Order backlog
NOK 17.1 BN
Continue to increase profitability across all business areas by deploying best practices and exploiting innovations and new technologies.
Adjusted EBITA margin
12.3 percent
Adjusted EBITA margin
12.5 percent
Adjusted EBITA margin
10.8 percent
Adjusted EBITA margin
6.3 percent
Attract, develop and retain the most highly motivated, committed and skilled employees in the industry.
Employee satisfaction
81.7 points
Employee satisfaction
81.6 points
Employee satisfaction
80.1 points
Employee satisfaction
75.4 points
ANNUAL REPORT 2018 | 29
BUSINESS PLAN
INVESTOR INFORMATION
BUSINESS REPORT
FROM THE BOARDROOM
FINANCIAL STATEMENTS & NOTES

From transaction-based to value-based services
EVRY worked in a targeted way on further strengthening the company’s commercial foundation in 2018. Organisational measures were implemented to ensure EVRY delivers as effectively
as possible on customers’ future digital needs, and work was undertaken to further boost the company’s organic growth.
In 2018 EVRY worked on getting the basics right and achieving operational excellence.
GET THE BASICS RIGHT
30 | ANNUAL REPORT 2018

Application services were the main driver of growth in 2018, but EVRY also experienced very positive momentum within its consultancy business. The demand for digital consultancy services is high, and EVRY demonstrated its position in the Nordic market in 2018, as in this period it initiated and completed a number of consulting projects in emerging technologies and digital growth areas.
EVRY worked on a range of growth initiatives in 2018, focused on expertise development and resource use, and further developed and strengthened its culture of performance. EVRY has defined three key strategic focus areas for delivering on the company’s ambitious targets and equipping it for further organic growth:
> Setting up a management team focusing on commercial and operational capabilities
> Building a profitable, competitive and future-oriented infrastructure
> Developing the company’s core banking platform to create future growth potential
Since 2015 EVRY has worked on getting the basics right and achieving operational excellence. Over this period, EVRY has cut one layer of management, created an asset-light and Capex-light organisation through partnerships, and decreased its internal complexity. EVRY has also worked on customer centricity and on developing its employees to create a more flexible and agile organisation. In recent years EVRY has become a more customer-centric organisation with higher levels of customer satisfaction.
CORPORATE SOCIAL RESPONSIBILITY (CSR)
At EVRY, corporate social responsibility is a question of how we recruit and look after our employees, how our expertise and solutions have a positive impact on society, and of ensuring that our activities are responsible and environmentally friendly. EVRY’s corporate social responsibility is based on competence, diversity and the environment. EVRY is committed to being a leading generator of competence in technology where technologists receive further training – and to making a positive contribution to society. We focus on diversity, which is positive for individuals, our company and society, and we develop and deliver digital solutions that benefit the environment. >
At EVRY, corporate social responsibility is a question of how we recruit and look after our employees, how our competence and solutions have a positive impact on society, and of ensuring that our activities are responsible and environmentally friendly.
ANNUAL REPORT 2018 | 31
BUSINESS PLAN
INVESTOR INFORMATION
BUSINESS REPORT
FROM THE BOARDROOM
FINANCIAL STATEMENTS & NOTES

Competence:
> We are building the weight of expertise needed to digitalise the Nordic region. By developing our employees’ expertise, we can deliver comprehensive, future-oriented solutions that benefit key sections of business and industry as well as society as a whole.
> We are a knowledge business, so access to leading technology expertise is business-critical for us. We therefore recruit a large number of new graduates who develop their expertise through work on internal and external projects.
> This builds competence both at the individual level and in public and private companies.
Diversity:
> EVRY’s diversity needs to reflect the diversity of society if everyone is to benefit from digitalisation. At EVRY, new grads and long-serving employees work together. We believe that diversity and complementary expertise create a better working environment, facilitate learning, lead to better solutions and increase value creation.
> We focus on attracting employees from different backgrounds who have a wide range of different expertise, and this is reflected in the fact we have employees from numerous different countries spread across eleven countries including the USA.
> EVRY is one of the largest employers of women in IT in the Nordic region. The company has approximately 2 600 female employees (~30 percent), which is above the industry average. The proportion of female managers is the same as the proportion of female employees. In 2018, 40 percent of the new graduates we recruited were women.
Environmentally sustainable:
> EVRY is an important driving force for digitalisation and uses technology to contribute to solutions that reduce the climate footprint of public and private companies.
> We are a major provider to business and industry, the financial sector, and public-sector organisations active at the national and local government level and in healthcare. Our digital solutions help our customers to reduce their emissions.
> We have used environmentally-friendly technology to set up one of the world’s most sustainable data centres, which ensures that the solutions EVRY provides are operated in as energy-efficient a manner as possible.
Competence DiversityEnvironmentally
sustainable
EVRY is a leading generator of expertise in technology where
technologists receive further training – and it makes a positive contribution to society.
We focus on diversity, which is positive for individuals, our company,
and society.
We develop and deliver digital solutions that benefit the environment.
CSR FRAMEWORK
32 | ANNUAL REPORT 2018
DIVERSITY
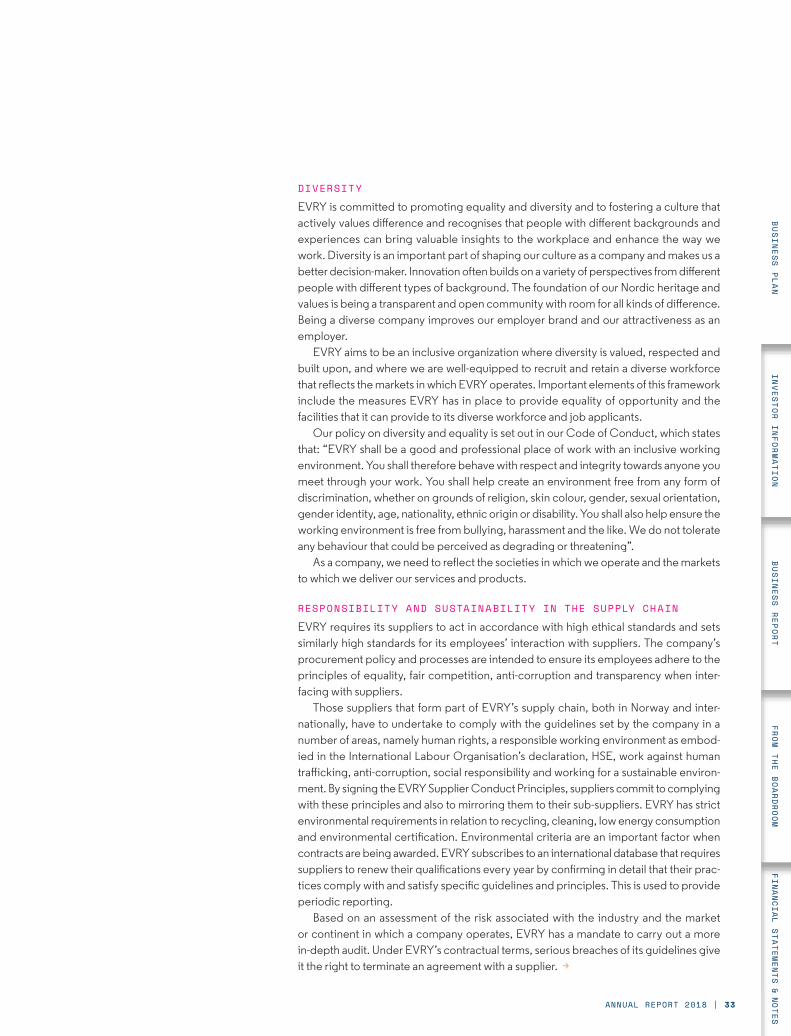
EVRY is committed to promoting equality and diversity and to fostering a culture that actively values difference and recognises that people with different backgrounds and experiences can bring valuable insights to the workplace and enhance the way we work. Diversity is an important part of shaping our culture as a company and makes us a better decision-maker. Innovation often builds on a variety of perspectives from different people with different types of background. The foundation of our Nordic heritage and values is being a transparent and open community with room for all kinds of difference. Being a diverse company improves our employer brand and our attractiveness as an employer.
EVRY aims to be an inclusive organization where diversity is valued, respected and built upon, and where we are well-equipped to recruit and retain a diverse workforce that reflects the markets in which EVRY operates. Important elements of this framework include the measures EVRY has in place to provide equality of opportunity and the facilities that it can provide to its diverse workforce and job applicants.
Our policy on diversity and equality is set out in our Code of Conduct, which states that: “EVRY shall be a good and professional place of work with an inclusive working environment. You shall therefore behave with respect and integrity towards anyone you meet through your work. You shall help create an environment free from any form of discrimination, whether on grounds of religion, skin colour, gender, sexual orientation, gender identity, age, nationality, ethnic origin or disability. You shall also help ensure the working environment is free from bullying, harassment and the like. We do not tolerate any behaviour that could be perceived as degrading or threatening”.
As a company, we need to reflect the societies in which we operate and the markets to which we deliver our services and products.
RESPONSIBILITY AND SUSTAINABILITY IN THE SUPPLY CHAIN
EVRY requires its suppliers to act in accordance with high ethical standards and sets similarly high standards for its employees’ interaction with suppliers. The company’s procurement policy and processes are intended to ensure its employees adhere to the principles of equality, fair competition, anti-corruption and transparency when inter-facing with suppliers.
Those suppliers that form part of EVRY’s supply chain, both in Norway and inter-nationally, have to undertake to comply with the guidelines set by the company in a number of areas, namely human rights, a responsible working environment as embod-ied in the International Labour Organisation’s declaration, HSE, work against human trafficking, anti-corruption, social responsibility and working for a sustainable environ-ment. By signing the EVRY Supplier Conduct Principles, suppliers commit to complying with these principles and also to mirroring them to their sub-suppliers. EVRY has strict environmental requirements in relation to recycling, cleaning, low energy consumption and environmental certification. Environmental criteria are an important factor when contracts are being awarded. EVRY subscribes to an international database that requires suppliers to renew their qualifications every year by confirming in detail that their prac-tices comply with and satisfy specific guidelines and principles. This is used to provide periodic reporting.
Based on an assessment of the risk associated with the industry and the market or continent in which a company operates, EVRY has a mandate to carry out a more in-depth audit. Under EVRY’s contractual terms, serious breaches of its guidelines give it the right to terminate an agreement with a supplier. >
ANNUAL REPORT 2018 | 33
BUSINESS PLAN
INVESTOR INFORMATION
BUSINESS REPORT
FROM THE BOARDROOM
FINANCIAL STATEMENTS & NOTES
RISK-REDUCTION MEASURES
It is important for EVRY to have a good overview of risk threats and new opportunities from risk assessments. The overall objective of risk management at EVRY is to identify and quantify risks and to use this information as the basis for correct decision making. Risk management is an integral part of the company’s management model and of its financial reporting. The key areas of risk are monitored as part of the executive management’s routine monitoring of EVRY’s business areas and key financial metrics. In operational terms, the company’s objective is to integrate systematic risk management into the Group’s business processes, as well as to support its customers with their risk management.
EVRY has established a risk management system in order to support the risk management process and ensure traceability and aggregation of risk threats and new opportunities. In addition to producing aggregated risk reporting, this system provides detailed information and measures to reduce unacceptable risk and to identify new opportunities. This helps line management to follow up on the status of measures that have been implemented and to propose activities to manage risks.
ETHICS
EVRY’s Code of Conduct sets the framework for how each employee should relate to customers and business partners, work to create a good and inclusive working environment, ensure diversity and promote sustainability by minimising their carbon footprint. The Code of Conduct is available on the Group’s website and intranet. Managers and employees of all levels in the company must sign and confirm their adherence with the Code of Conduct annually in connection with their appraisals.
ANTI-CORRUPTION
EVRY works actively to combat all forms of corruption. Courses are organised to ensure employees are trained to act in accordance with the Group’s guidelines.
The Code of Conduct also includes guidelines on accepting gifts, reimbursement payments and other benefits or activities. How to distance oneself from all forms of bribery and corruption is also part of the training.
The compliance function works proactively to increase awareness and to develop the right attitudes among employees in order to ensure compliance. Employees in doubt whether a particular situation or gift is permissible are also able to seek guidance from the company’s compliance function. EVRY has a well-established ‘whistle-blower’channel as well as procedures for dealing with any suspicion of corruption.
34 | ANNUAL REPORT 2018
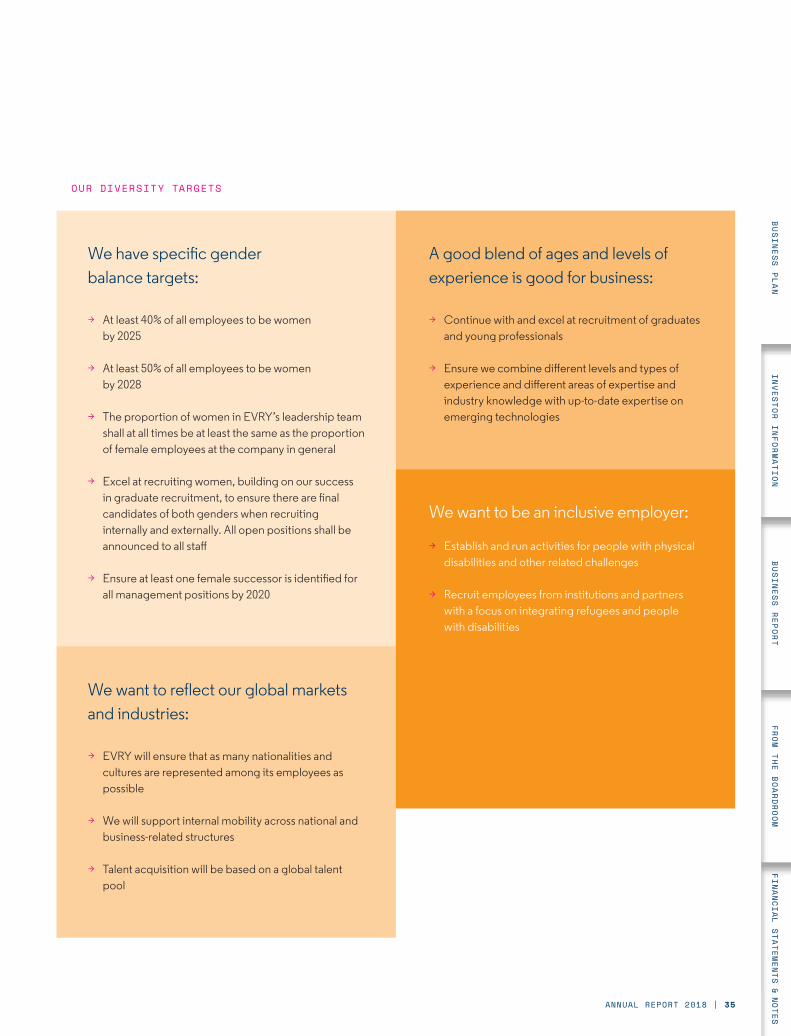
We have specific gender balance targets:
> At least 40% of all employees to be women by 2025
> At least 50% of all employees to be women by 2028
> The proportion of women in EVRY’s leadership team shall at all times be at least the same as the proportion of female employees at the company in general
> Excel at recruiting women, building on our success in graduate recruitment, to ensure there are final candidates of both genders when recruiting internally and externally. All open positions shall be announced to all staff
> Ensure at least one female successor is identified for all management positions by 2020
OUR DIVERSITY TARGETS
We want to be an inclusive employer:
> Establish and run activities for people with physical disabilities and other related challenges
> Recruit employees from institutions and partners with a focus on integrating refugees and people with disabilities
A good blend of ages and levels of experience is good for business:
> Continue with and excel at recruitment of graduates and young professionals
> Ensure we combine different levels and types of experience and different areas of expertise and industry knowledge with up-to-date expertise on emerging technologies
We want to reflect our global markets and industries:
> EVRY will ensure that as many nationalities and cultures are represented among its employees as possible
> We will support internal mobility across national and business-related structures
> Talent acquisition will be based on a global talent pool
ANNUAL REPORT 2018 | 35
BUSINESS PLAN
INVESTOR INFORMATION
BUSINESS REPORT
FROM THE BOARDROOM
FINANCIAL STATEMENTS & NOTES

A partner for value creationEVRY looks back on 2018 as another year in which it made significant operational progress. EVRY implemented organisational changes and adjustments in order to provide customers
with the best possible offer, and it positioned the company for new service areas and profitable organic growth.
We streamlined our Consulting Services unit in 2018 by consolidating its 64 areas of expertise into seven areas. This has created a much better and more customer-oriented organisation and represents an important step towards becoming a consulting powerhouse that combines business strategy, design thinking and technology expertise.
OPERATIONAL EXCELLENCE
36 | ANNUAL REPORT 2018

There are four strategic cornerstones to our ability to deliver the business outcomes desired by our customers: a focus on specific industries, a local presence combined with global capabilities, an ecosystem of partners, and integrated services from EVRY's Consulting Services, Application Services, Digital Platform Services and Fufillment Services units. Combining these elements going forward is the secret recipe for creating real business value for our customers.
EVRY’s order intake during 2018 was significant, with our order backlog totalling NOK 19.4 billion at the end of December 2018, an increase of NOK 1.4 billion from the end of 2017. This was due to some major contracts being signed, but also to a high intake of a balanced mix of smaller and medium-sized contracts and projects.
IMPORTANT INVESTMENTS
In addition to organisational progress, EVRY invested in a number of exciting initiatives in 2018. EVRY invested heavily in new talent and recruited a range of new employees whose exper-tise lies in new areas of technology. The internships EVRY offers at its Innovation Hub gave talented young people the chance to try their hand at working on exciting digital questions related to real-life customer challenges. In addition to the completion of specific real-life projects, EVRY’s internship program helped EVRY to recruit new skilled employees. Its Innovation Hub focuses on attracting a diverse and broad range of expertise.
PREFERRED PROVIDER OF CORE BANKING AND PAYMENT SOLUTIONS
EVRY Financial Services continues to deliver and strengthen its position as the preferred provider of core banking and payment solutions in the Nordics, which it combines with its undisputed position as the market leader for card services. EVRY’s new contract for core banking and payment solutions with Handelsbanken was a breakthrough in Finland, but it is also pleasing to see that we are succeeding in renewing and extend-ing agreements with our existing customers.
The renewed and extended contracts EVRY signed in the mainframe and fraud services areas with DNB, which is Norway’s largest bank, the contracts we secured with Vipps for digital invoices, and with Handelsbanken in Norway for contactless micro bank cards, and the contract renewals that EVRY secured with the SpareBank 1 Alliance and Swedbank in Norway that are more extensive in scope than previous agreements demonstrate our position as the preferred IT services partner for banks in the Nordics. Furthermore, the ATM contracts we signed with Bankomat in Sweden and Geldmaat (former GSN) in the Netherlands show that EVRY is positioned as a full-service provider of banking services and has untapped international
potential. In addition to traditional banking services, we are also seeing increased interest in our services from fintechs and new start-ups as well as more demand for services related to open banking, which we expect to leverage further in the years to come.
MARKET LEADER IN NORWAY BY A GOOD MARGIN
Despite our business in Norway having been repositioned through the implementation of a number of strategic changes over the last few years, it continued to grow and to deliver good margins in 2018, and we retained our position as the market leader in Norway by a good margin. A more vertical industry approach has been implemented to help EVRY adapt to and meet its customers’ needs and requirements, and this has been accom-panied by a more streamlined consultancy set-up that provides customers with key capabilities that combine legacy technology with expertise in new digital growth areas like cognitive solutions, artificial intelligence, robotics/automation and advanced analyt-ics. We are continuously moving our services higher up in the value stack, meaning we are focusing more on higher margin business, such as consultancy and application services.
Our infrastructure services are nonetheless still a significant part of our business. EVRY’s position in the insurance industry has been strengthened through new long-term agreements with two leading insurance companies, Gjensidige and Storebrand, and we have leveraged our position in the public and health sectors, with this resulting in strategic achievements with the Southern and Eastern Norway Regional Health Authority and with the Norwegian Tax Administration.
HIGH LEVEL OF DEMAND FOR DIGITAL EXPERTISE AND IT CONSULTANTS
As in Norway, EVRY’s business in Sweden has undergone a huge transformation, and as part of this some challenges have unfortunately presented themselves that have resulted in slower than anticipated progress, which has had an adverse effect on our results in Sweden. EVRY’s position in the public and health sectors in Sweden is very strong, as it is in the industrials segment as well. As this implies, the major challenges we have encountered relate to recruiting and retaining people with the right expertise in order to adapt the organisation to the market changes and trends that we are currently experiencing. The demand for digital expertise and IT consultants is at an all-time high, and the competition from start-ups, fintechs and other companies in the industry has made both retaining our employ-ees and attracting the right mix of people in Sweden challeng-ing. However, EVRY is working in a targeted way to ensure the business is on track to deliver in line with expectations, and we expect our business in Sweden to deliver an improved >
ANNUAL REPORT 2018 | 37
BUSINESS PLAN
INVESTOR INFORMATION
BUSINESS REPORT
FROM THE BOARDROOM
FINANCIAL STATEMENTS & NOTES
performance in 2019. The contract awarded by Bankgirot at the end of 2018 shows that EVRY has a strong standing in the Swedish market.
STRATEGIC ACQUISITIONS
In order to complement its existing capabilities and expand its service offerings, EVRY proactively seeks to identify niche players that will be a fit with its business model and strategy, and the company is continuously on the lookout for strategic acquisitions and partnerships. In April, EVRY announced that it had entered into a definitive agreement to acquire Findwise AB, a leading Nordic provider of advanced search, advanced analytics and big data services that improves business outcomes for customers by creating solutions for search-driven and data-driven decisions. In the third quarter, it was announced that EVRY had acquired Exonor, a leading provider of strategic consultancy and support services in relation to implementing clinical IT systems. EVRY has, over the course of several years, built up a strong position in the healthcare sector, and it is contin-uously strengthening its focus on health technology across the Nordic region. EVRY’s acquisition of Exonor will strengthen its expertise in what is an operationally critical area for Nordic healthcare trusts and will position EVRY to meet the future need for health solutions in the healthcare sector.
GLOBAL PARTNERSHIPS
Technology is developing at a fast pace, and this makes in-house development a demanding and risky task. EVRY has therefore adopted a partnership model as its principal strategy in the infra-structure area. The company today has strategic collaboration agreements in cloud services with Microsoft, Google, IBM and Amazon. This means EVRY can offer its customers world-leading technology as well as processes that enable customers to tran-sition to cloud-based solutions on the basis of their own require-ments and wishes.
INFORMATION SECURITY
EVRY works to be at the forefront of developments and to implement preventive measures. In their threat assessments, the Norwegian National Security Authority and the Norwegian Police Security Service have highlighted computer network operations and cyber security threats as areas that could be used to cause significant harm. EVRY plays a significant role in terms of operating systems that are critical for society across all sectors. There is thus a clear expectation that we will deliver secure and stable operations, and EVRY works closely with suppliers and customers. Through systematic information security work EVRY has implemented the measures needed to protect the confiden-tiality, integrity and accessibility of data. Information security
breaches can have significant consequences for both customers and EVRY. We are well-equipped to meet the constantly increas-ing threat level thanks to the systematic information security work we undertake in relation to customers as well as internally. EVRY recognises the importance of continuing to improve expertise in the information security area.
We have a target of helping to improve expertise both internally and in society in general. To this end, we collaborate with educa-tional institutions and specialist networks. EVRY collaborates extensively on security matters with national and international organisations and authorities in the information security area.
DATA PRIVACY
The EU’s new General Data Protection Regulation (GDPR) came into force in the EU on 25 May 2018 and in Norway on 20 July 2018. For the first time, data processors are subject to specific legal requirements such as record keeping, security measures and reporting.
In order to ensure compliance with the new requirements, EVRY set up a Steering Committee that included members of its management team. All levels of the organization were involved in reviewing the company’s procedures and systems for records of processing activities and accountability. EVRY’s products, soft-ware development activities, life cycle management processes and customer systems were reviewed in order to assess and meet the “Privacy by Design” requirements. Close collaboration between customers and EVRY was a key factor in this process. The executive group management team was provided with overall progress reports regarding the project on a regular basis. In the fourth quarter, an internal audit was performed to review the situation with regard to compliance objectives and activities.
EVRY has appointed several Data Protection Coordinators to support its Data Protection Officer. Mandatory GDPR training was provided to all employees and consultants in order to increase data privacy awareness and ensure the proper management of personal data. In its capacity as a as data controller, EVRY established a point of contact and procedures to support data subject requests related to the right of access, rectification and erasure, the right to restrict processing and the right to data portability.
The implementation of GDPR has not fundamentally impacted the overall risk assessment of the security of EVRY’s operations and services. EVRY is ISO27001 certified and a third-party ISAE3402 audit with attestation is performed annually to verify compliance. However, EVRY’s incident process was reviewed to ensure consistent reporting and that its handling of potential breaches is in accordance with the new legal require-ments. We established a separate point of contact in addition to the existing incident response team.
38 | ANNUAL REPORT 2018

EVRY requires all its sub-processors to adhere to EVRY’s Code of Conduct and Supplier Conduct Principles. A supplier qualification process that covers topics such as legal compliance, security and privacy is mandatory for all new suppliers that handle personal data as sub-processors for EVRY.
KEY FOCUS AREAS WITH RESPECT TO GDPR
GDPR has also created new business opportunities for EVRY. We assisted customers with the preparatory work needed in order to comply with the new regulation and we continue to provide value-added services. We believe that new opportunities will arise as new digital solutions make it possible for organisations’ data management capabilities to be improved. Better data management capabilities will in turn enhance data governance and data quality while creating value for businesses.
EVRY has seven key focus areas with respect to GDPR: Management and Organisation, Records of processing and Accountability, Individual Rights, Security, Supplier Management, Privacy by Design and Incident and Breach Reporting.
CLIMATE AND ENVIRONMENT
In 2018 EVRY Financial Services and EVRY Norway followed EVRY Sweden in obtaining ISO 14001 accreditation for envi-ronmental management. This standard provides a high-quality management system with clear targets, prioritised activities and target achievement monitoring, helping EVRY to manage its environmental work in an holistic way and to integrate this as a natural part of the company’s strategic objectives.
EVRY is contributing to the creation of a low-carbon society both by cutting its own emissions and by developing solutions that reduce the impact its customers have on the environment. The climate and environment play a central role in EVRY’s Code of Conduct. The company is committed to continuously reduc-ing its impact on the environment, and is at the forefront of devel-oping and promoting environmentally friendly technology.
MATERIALLY LOWER GREENHOUSE GAS EMISSIONS
In the 2011-2016 period, EVRY reduced its greenhouse gas emissions by 50 percent. We are working in a systematic and long-term way on reducing our impact on the environment to an absolute minimum. The most important measures we take internally are energy efficiency measures, digital collaboration solutions, reducing business travel and rigorous procurement policies, as well as waste management with a high level of reuse and recycling. By developing and implementing smart IT solu-tions at its customers, EVRY helps to reduce the impact on the environment in a range of sectors. Good examples of this are e-prescriptions and the agreement EVRY has with Vipps that enables EVRY’s customers to distribute their invoices digitally using Vipps, which will cut the number of paper invoices by nearly 60 million in future. EVRY was also tasked by Yara (the world’s leading fertilizer company) with building a system for loading and unloading an autonomous ship. Yara chose EVRY as one of their partners for its project to create the world's first fully electric and autonomous container ship (“Yara Birkeland”), which will help cut NOx and CO2 emissions by reducing >
Management and Organisation
Records of processing and Accountability
Supplier Management
Individual Rights
Privacy by Design
Security
Incident and Breach Reporting
EVRY’S SEVEN KEY FOCUS AREAS WITH RESPECT TO GDPR:
ANNUAL REPORT 2018 | 39
BUSINESS PLAN
INVESTOR INFORMATION
BUSINESS REPORT
FROM THE BOARDROOM
FINANCIAL STATEMENTS & NOTES
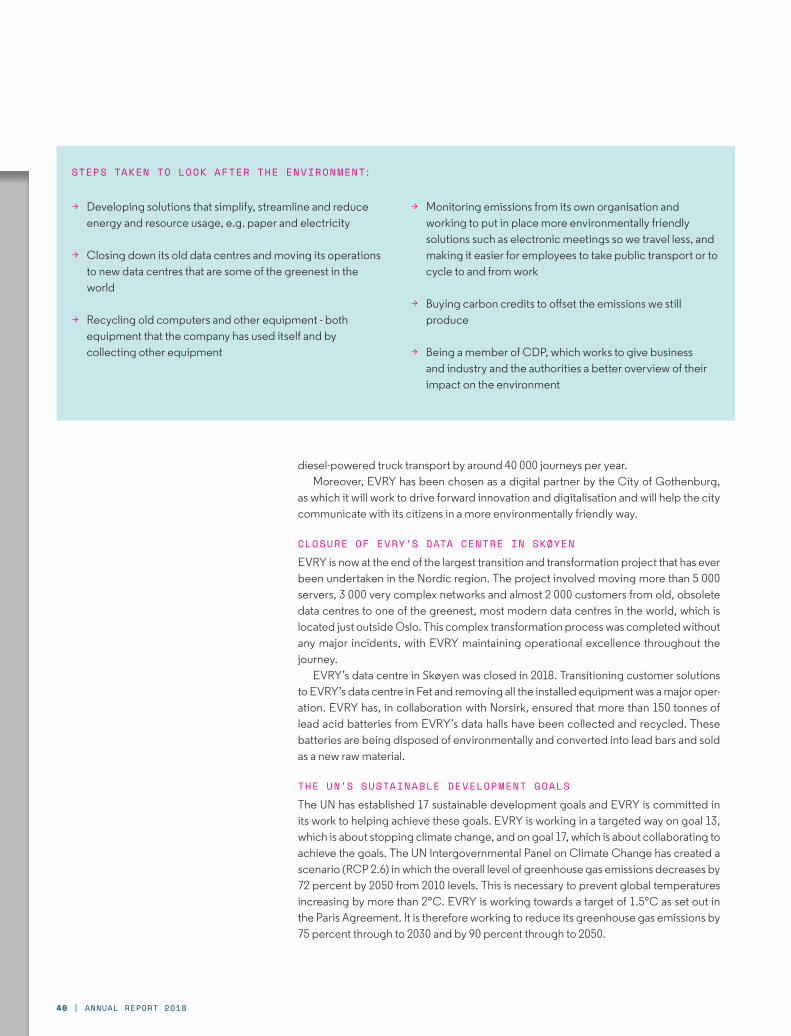
> Developing solutions that simplify, streamline and reduce energy and resource usage, e.g. paper and electricity
> Closing down its old data centres and moving its operations to new data centres that are some of the greenest in the world
> Recycling old computers and other equipment - both equipment that the company has used itself and by collecting other equipment
> Monitoring emissions from its own organisation and working to put in place more environmentally friendly solutions such as electronic meetings so we travel less, and making it easier for employees to take public transport or to cycle to and from work
> Buying carbon credits to offset the emissions we still produce
> Being a member of CDP, which works to give business and industry and the authorities a better overview of their impact on the environment
STEPS TAKEN TO LOOK AFTER THE ENVIRONMENT:
diesel-powered truck transport by around 40 000 journeys per year. Moreover, EVRY has been chosen as a digital partner by the City of Gothenburg,
as which it will work to drive forward innovation and digitalisation and will help the city communicate with its citizens in a more environmentally friendly way.
CLOSURE OF EVRY’S DATA CENTRE IN SKØYEN
EVRY is now at the end of the largest transition and transformation project that has ever been undertaken in the Nordic region. The project involved moving more than 5 000 servers, 3 000 very complex networks and almost 2 000 customers from old, obsolete data centres to one of the greenest, most modern data centres in the world, which is located just outside Oslo. This complex transformation process was completed without any major incidents, with EVRY maintaining operational excellence throughout the journey.
EVRY’s data centre in Skøyen was closed in 2018. Transitioning customer solutions to EVRY’s data centre in Fet and removing all the installed equipment was a major oper-ation. EVRY has, in collaboration with Norsirk, ensured that more than 150 tonnes of lead acid batteries from EVRY’s data halls have been collected and recycled. These batteries are being disposed of environmentally and converted into lead bars and sold as a new raw material.
THE UN’S SUSTAINABLE DEVELOPMENT GOALS
The UN has established 17 sustainable development goals and EVRY is committed in its work to helping achieve these goals. EVRY is working in a targeted way on goal 13, which is about stopping climate change, and on goal 17, which is about collaborating to achieve the goals. The UN Intergovernmental Panel on Climate Change has created a scenario (RCP 2.6) in which the overall level of greenhouse gas emissions decreases by 72 percent by 2050 from 2010 levels. This is necessary to prevent global temperatures increasing by more than 2°C. EVRY is working towards a target of 1.5°C as set out in the Paris Agreement. It is therefore working to reduce its greenhouse gas emissions by 75 percent through to 2030 and by 90 percent through to 2050.
40 | ANNUAL REPORT 2018

OUR ENVIRONMENTAL PERFORMANCE
Carbon Disclosure Project (CDP) scores, which indicate companies' environmental performance.
A 2018
A- 2017
A 2016
97 2015
91 2014
89 2013
78 2012
RATED “A” BY THE CARBON DISCLOSURE PROJECT
EVRY has produced and submitted climate reports to the Carbon Disclosure Project (CDP) since 2011. The CDP is an independent, non-commercial organisation that has the world’s largest database of how businesses manage, measure and report their greenhouse gas emissions. Achieving a high score from the CDP means that a company is measuring, verifying and manag-ing its carbon emissions, for example by achieving emissions reductions by implementing programs to reduce emissions in both its direct operations and its supply chain.
In 2018 EVRY received an “A” rating for its work on reducing its own greenhouse gas emissions from the CDP. EVRY is the only IT company in the Nordic region to have been awarded this top rating in 2016, 2017 and 2018. However, the CDP rating does not take into account the additional impact that EVRY’s digital
solutions and services have on society’s overall emissions. This is where EVRY can really make a difference: solutions such as e-prescriptions, digital invoices and communication, and other eco-initiatives are examples of solutions that help reduce transport and paper usage – and therefore reduce energy consumption.
“Over the last couple of years we have consolidated our data centre operations and today have the market’s most environmentally friendly IT infrastructure. This has helped us to materially reduce our carbon footprint, but we want to take further steps and to become a climate-neutral company in 2019”
PER HOVECEO
ANNUAL REPORT 2018 | 41
BUSINESS PLAN
INVESTOR INFORMATION
BUSINESS REPORT
FROM THE BOARDROOM
FINANCIAL STATEMENTS & NOTES

In 2018 EVRY increased its focus on widening the range and depth of its industry expertise and has made progress in terms of becoming a business partner for its customers.
CUSTOMER CENTRICITY
Closer to customers and industries
EVRY works continuously on being a customer-centric company and a business partner for its customers’ digital needs. In 2018 it worked intensively on developing new digital services in
close dialogue with its customers and is delivering services higher up in the value stack.
42 | ANNUAL REPORT 2018

Today’s market is becoming much more complex. To really deliver business value, customers must pick and choose from the options offered by the technological landscape, such as virtual reality, chatbots, robotics and artificial intelligence. This has had some impact on customer behaviour, with customers moving away from large projects to instead leverage new technology on top of existing processes and technologies. This is leading to smaller projects of higher value that deliver a quicker return on investment. Customers also want more agility, more flexibility and faster rewards.
In 2018 EVRY made progress at leveraging the company’s Nordic strength and worked to a great extent across national borders in order to operate on a larger scale. EVRY has worked in a more integrated way, and going forward will capitalise on the uniqueness of being a Nordic company with a local presence that can handle customer data safely and securely in the Nordic region.
BUSINESS PARTNER FOR CUSTOMERS
In 2018 EVRY worked on shifting its focus from transaction-based IT services to value-based services that offer greater profitability, and it also made progress in terms of becoming a business partner for its customers. EVRY’s knowledge of business, tech-nology, customers and markets is enabling new value creation.
Today the EVRY executive team reflects the company’s targets and ambitions well. In order to be an attractive partner to customers and to deliver growth, EVRY also worked on attracting new talent, and a range of skilled people joined in 2018 in both new technology areas and management roles.
NEW PARTNERSHIPS
EVRY is seeing more customers seeking different kinds of partnership, such as partnerships involving multiple custom-ers working together with vendors like EVRY and partnerships involving multiple vendor constellations delivering value to the market. Many customers also want to bring work back from offshore, initially to a local Nordic market due to the fact that you can now automate things and make them more efficient locally.
EVRY has created a new partnership model which involves the company sourcing a lot of partner components for its value propositions from both big global partners and a large number of niche partners. This transformation has led to EVRY winning projects in areas for which it was not even invited to submit a proposal two years ago.
EXPANDING OUR PRODUCT OFFERINGS
EVRY continuously works to expand its product offerings and to enter new market segments. An example of the way in which we are working to expand and bundle our services with existing products is EVRY’s debt register, which is to say that EVRY has
been granted authorisation to operate an information register for the purposes of collecting and distributing debt informa-tion from credit cards and other forms of unsecured consumer debt. The purpose of the debt register is to help prevent private households from running into debt problems by giving banks and other providers of credit the opportunity to check how much credit and consumer debt a borrower already has. The number of consumer banks is growing and it is increasingly easy to take out short-term consumer loans, and the register may help financial companies to take better decisions in relation to issuing loans to private consumers.
EVRY has wide-ranging expertise and experience in managing public registers that contain sensitive data. The debt register is a natural development in this regard, and it will allow EVRY to deliver information in real-time based on efficient infrastructure and existing market channels. EVRY will deliver high-quality services with an emphasis on both security and privacy.
VALUE-ADDED SERVICES
It is crucial for EVRY to be close to its customers. This is important to our ability to develop value-adding services that enable our customers to offer their customers more attractive products and services as well as a better user experience. EVRY is committed to focusing the company’s resources on what creates customer value. The digital shift currently taking place is creating a whole range of opportunities. This is leaving many customers unsure about what they should and can do. Against this backdrop, EVRY wants to be a high-quality advisor. To succeed in the new “digital world” where technology is the key to innovation, EVRY needs to continuously focus on skills and diversity. Skills are the backbone of the company and in 2018 EVRY hired more than 800 new employees in Norway and Sweden. The key to EVRY’s future success is a workforce that is well balanced in terms of its members' backgrounds, expertise, experience, age and gender. The company therefore needs to be at the forefront of developments in technology and close to its customers. EVRY is committed to dialogue with its customers on their terms, with the starting point of identifying what digital opportunities are available to them.
INDUSTRY EXPERTISE
EVRY has in-depth insight into its customers’ industry segments. In 2018 it increased its focus on widening the range and depth of its industry expertise, with a target of offering leading compre-hensive solutions that are adapted to each industry. EVRY has taken those industry areas in which it is particularly skilled and has worked on further strengthening them. Over a period of many years EVRY has built up significant expertise in the banking sector and has had a lot of success in this market. >
ANNUAL REPORT 2018 | 43
BUSINESS PLAN
INVESTOR INFORMATION
BUSINESS REPORT
FROM THE BOARDROOM
FINANCIAL STATEMENTS & NOTES
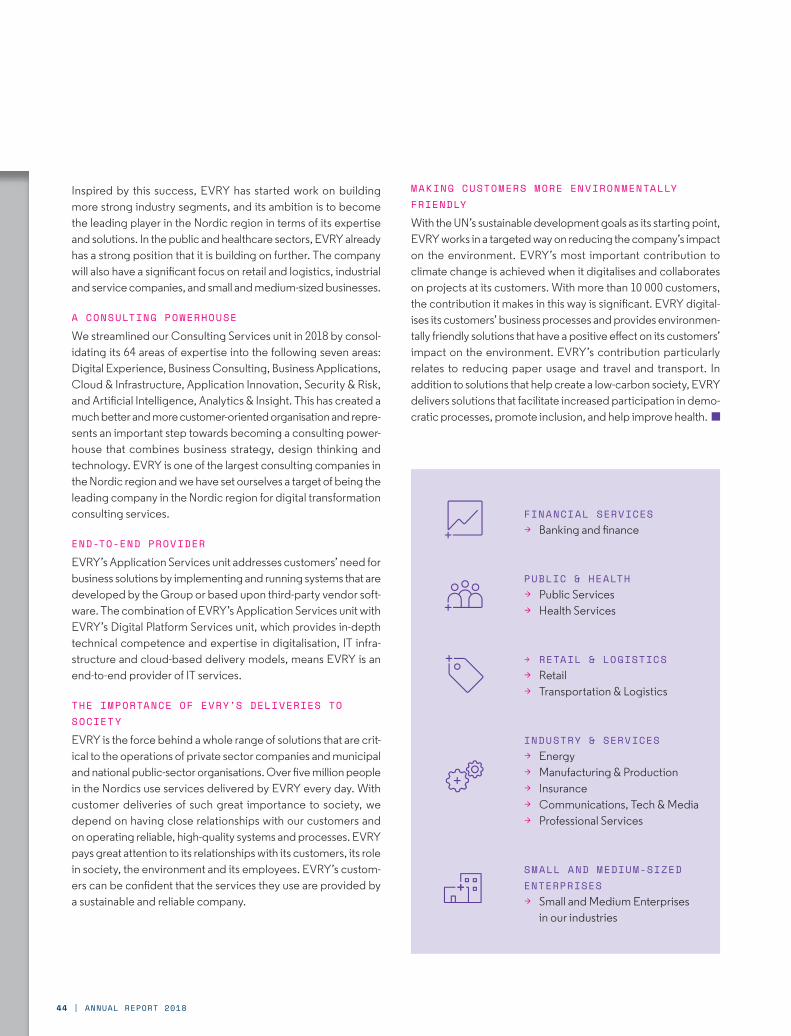
Inspired by this success, EVRY has started work on building more strong industry segments, and its ambition is to become the leading player in the Nordic region in terms of its expertise and solutions. In the public and healthcare sectors, EVRY already has a strong position that it is building on further. The company will also have a significant focus on retail and logistics, industrial and service companies, and small and medium-sized businesses.
A CONSULTING POWERHOUSE
We streamlined our Consulting Services unit in 2018 by consol-idating its 64 areas of expertise into the following seven areas: Digital Experience, Business Consulting, Business Applications, Cloud & Infrastructure, Application Innovation, Security & Risk, and Artificial Intelligence, Analytics & Insight. This has created a much better and more customer-oriented organisation and repre-sents an important step towards becoming a consulting power-house that combines business strategy, design thinking and technology. EVRY is one of the largest consulting companies in the Nordic region and we have set ourselves a target of being the leading company in the Nordic region for digital transformation consulting services.
END-TO-END PROVIDER
EVRY’s Application Services unit addresses customers’ need for business solutions by implementing and running systems that are developed by the Group or based upon third-party vendor soft-ware. The combination of EVRY’s Application Services unit with EVRY’s Digital Platform Services unit, which provides in-depth technical competence and expertise in digitalisation, IT infra-structure and cloud-based delivery models, means EVRY is an end-to-end provider of IT services.
THE IMPORTANCE OF EVRY’S DELIVERIES TO SOCIETY
EVRY is the force behind a whole range of solutions that are crit-ical to the operations of private sector companies and municipal and national public-sector organisations. Over five million people in the Nordics use services delivered by EVRY every day. With customer deliveries of such great importance to society, we depend on having close relationships with our customers and on operating reliable, high-quality systems and processes. EVRY pays great attention to its relationships with its customers, its role in society, the environment and its employees. EVRY’s custom-ers can be confident that the services they use are provided by a sustainable and reliable company.
MAKING CUSTOMERS MORE ENVIRONMENTALLY FRIENDLY
With the UN’s sustainable development goals as its starting point, EVRY works in a targeted way on reducing the company’s impact on the environment. EVRY’s most important contribution to climate change is achieved when it digitalises and collaborates on projects at its customers. With more than 10 000 customers, the contribution it makes in this way is significant. EVRY digital-ises its customers’ business processes and provides environmen-tally friendly solutions that have a positive effect on its customers’ impact on the environment. EVRY’s contribution particularly relates to reducing paper usage and travel and transport. In addition to solutions that help create a low-carbon society, EVRY delivers solutions that facilitate increased participation in demo-cratic processes, promote inclusion, and help improve health.
FINANCIAL SERVICES > Banking and finance
PUBLIC & HEALTH > Public Services > Health Services
> RETAIL & LOGISTICS > Retail > Transportation & Logistics
INDUSTRY & SERVICES > Energy > Manufacturing & Production > Insurance > Communications, Tech & Media > Professional Services
SMALL AND MEDIUM-SIZED ENTERPRISES
> Small and Medium Enterprises in our industries
44 | ANNUAL REPORT 2018

ANNUAL REPORT 2018 | 45
BUSINESS PLAN
INVESTOR INFORMATION
BUSINESS REPORT
FROM THE BOARDROOM
FINANCIAL STATEMENTS & NOTES

THE CHALLENGE
For us, there is beauty in human concern, business and tech- nology, coming together to form a perfect and creative end result, which can be well thought-out code.
Lfant, an innovation company owned by three of Länsförsäkringar's companies, is tasked with constantly research- ing new ideas that can create change for its business or customers as well as society in general. EVRY has worked on a number of innovation projects with Lfant, which have ranged from preventing water damage using IoT and machine learning through to virtual reality solutions. Lfant came to EVRY with a question: Can we do something together to help prevent the 300 road traffic accidents involving children that take place every year?
When we take this type of project on, we usually work using our SPARK innovation process, which is a method that combines design thinking, lean startup and agile development. Its aim is to quickly identify needs and prerequisites, to form hypotheses that can be investigated and validated and, if any of them fly, to proceed to implement them quickly.
RESEARCH
Research work revealed that over half of children are afraid of and worried about traffic. Children gave examples of drivers running red lights, of cyclists and moped drivers driving on the pave-ment, and cars driving into playgrounds. The children were also anxious when visibility was poor, e.g. when snow has not been properly cleared away or when hedges have not been properly trimmed. One of the children’s biggest difficulties with regard to road safety is that they were trapped by self-oriented thinking; they work on the basis of their perspective and cannot under-stand that others might have a different perspective. What this means in the context of traffic is that they cannot understand and thus take into account drivers’ thought processes. A lot of work has been done on how to educate children about road safety without great success, and this is because while children act
correctly under controlled conditions, this is not the case in more complex traffic environments. Why does changing children’s behaviour not help make them safer? The reason is that, before the age of about 12, children do not have the skills needed to always exhibit behaviour that keeps them safe in terms of road safety.
THE SOLUTION
One working hypothesis was that offering lessons involving augmented reality and gamification so that children would experience and practice road safety situations in an enjoyable and safe way would increase their knowledge and thus reduce the number of accidents. The solution was therefore an interactive AR game in which children learn about road safety in a safe environ- ment. A number of initial “lessons” were created that were intended to teach children road safety rules and specific skills, in addition to a Pokémon Go-inspired game in which children collect road signs and then put them out in the right place in the game environment.
THE RESULT
The solution has now been tested at a number of pre-schools and primary schools in Skåne with good results. One variant has been completed at various city events by thousands of children. The element of the game that the children enjoyed the most was looking for the signs, with the children telling their parents about them. Interviews and assessments show that 90 percent of the children learnt to cross the road. We are now starting work in earnest, and are working together with Länsförsäkringar, Lfant and the Swedish National Society for Road Safety on develop-ing new lessons and learning materials for teachers in order to introduce the solution as a tool for road safety education at schools across Sweden.
Beautiful codeLfant gave EVRY the following challenge in 2018: What can we do together to help prevent the
300 road traffic accidents involving children that take place every year? The result was a road safety training solution for children that uses augmented reality and gamification as tools.
CASE STUDY - LFANT
46 | ANNUAL REPORT 2018

“The greater purpose is of course to save lives. That’s why we are doing this. I interviewed the children afterwards and pretty much all of them said they had learnt about traffic safety. Now they know how to cross the road, which is so rewarding. It is only when you test a product in real life that you can tell if it’s a success.”
LISA OLSSON COO, Lfant AB
TOM CLIGNEZAge: 38Position: Content Creator Team LeadNationality: Belgian
SELECTED TEAM MEMBERS
ULF SANDFROSTAge: 51 Position: Innovation and design directorNationality: Swedish
EMMY HALLAge: 31Position: Consultant Service DesignNationality: Swedish
ANNUAL REPORT 2018 | 47
BUSINESS PLAN
INVESTOR INFORMATION
BUSINESS REPORT
FROM THE BOARDROOM
FINANCIAL STATEMENTS & NOTES
EVRY embraces diversityEVRY invested heavily in 2018 in recruiting talented employees with expertise in new areas of technology, with a range of new people joining over the course of the year. These new
employees will actively contribute to EVRY’s further development as well as to the development of future-oriented solutions that will generate profitable growth.
EMPLOYEE ENGAGEMENT & CULTURE
EVRY is one of the largest employers of women in IT in the Nordic region. Women represent 28 percent of EVRY’s workforce in Norway and 30 percent in Sweden.
48 | ANNUAL REPORT 2018
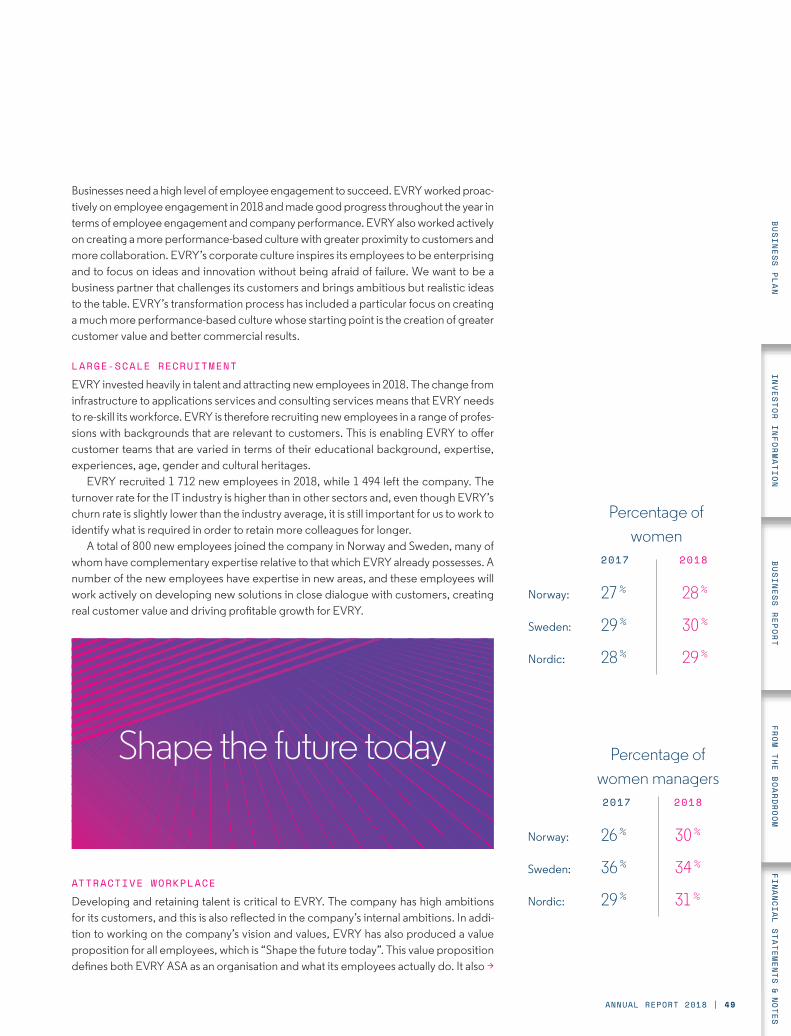
Norway:
Sweden:
Nordic:
Percentage of women
28 %
30 %
29 %
27 %
29 %
28 %
Norway:
Sweden:
Nordic:
2017 2018
2017 2018
Percentage of women managers
30 %
34 %
31 %
26 %
36 %
29 %
Businesses need a high level of employee engagement to succeed. EVRY worked proac-tively on employee engagement in 2018 and made good progress throughout the year in terms of employee engagement and company performance. EVRY also worked actively on creating a more performance-based culture with greater proximity to customers and more collaboration. EVRY’s corporate culture inspires its employees to be enterprising and to focus on ideas and innovation without being afraid of failure. We want to be a business partner that challenges its customers and brings ambitious but realistic ideas to the table. EVRY’s transformation process has included a particular focus on creating a much more performance-based culture whose starting point is the creation of greater customer value and better commercial results.
LARGE-SCALE RECRUITMENT
EVRY invested heavily in talent and attracting new employees in 2018. The change from infrastructure to applications services and consulting services means that EVRY needs to re-skill its workforce. EVRY is therefore recruiting new employees in a range of profes-sions with backgrounds that are relevant to customers. This is enabling EVRY to offer customer teams that are varied in terms of their educational background, expertise, experiences, age, gender and cultural heritages.
EVRY recruited 1 712 new employees in 2018, while 1 494 left the company. The turnover rate for the IT industry is higher than in other sectors and, even though EVRY’s churn rate is slightly lower than the industry average, it is still important for us to work to identify what is required in order to retain more colleagues for longer.
A total of 800 new employees joined the company in Norway and Sweden, many of whom have complementary expertise relative to that which EVRY already possesses. A number of the new employees have expertise in new areas, and these employees will work actively on developing new solutions in close dialogue with customers, creating real customer value and driving profitable growth for EVRY.
ATTRACTIVE WORKPLACE
Developing and retaining talent is critical to EVRY. The company has high ambitions for its customers, and this is also reflected in the company’s internal ambitions. In addi-tion to working on the company’s vision and values, EVRY has also produced a value proposition for all employees, which is “Shape the future today”. This value proposition defines both EVRY ASA as an organisation and what its employees actually do. It also >
Shape the future today
ANNUAL REPORT 2018 | 49
BUSINESS PLAN
INVESTOR INFORMATION
BUSINESS REPORT
FROM THE BOARDROOM
FINANCIAL STATEMENTS & NOTES

defines important aspects of EVRY’s corporate culture. Companies have no choice but to become digital if they are to maintain and strengthen their ability to compete; their future survival depends on their ability to shape the future today. This is where EVRY wants to be a key partner to its customers. EVRY needs to attract new expertise and talent, and its new value proposition is also intended to be relevant to this target audi-ence, specifically to communicate how the company offers potential employees the opportunity to shape their career and future today.
WORKING ENVIRONMENT AND EMPLOYEE SATISFACTION
EVRY aims to be an attractive employer, and the Group’s working environment is good. Employee satisfaction is surveyed quarterly. The results of each survey are discussed by all of EVRY’s governing bodies as well as by its employee and management groups at all levels. The main topics assessed by the employee surveys are the Group’s working envi-ronment, employee motivation, commitment, management, reputation and compliance with the company’s values. The survey leads to the introduction of concrete improve-ment measures in EVRY’s operating plans.
EVRY worked in a targeted way on these areas in 2018. The employee engagement survey for the final quarter of 2017 yielded a score of 81.6, which improved to a score of 81.7 in the third term of 2018.
EMPLOYEE DEVELOPMENT
EVRY has well-established processes and systems for employee development. These form an annual cycle with employee appraisal meetings held in the first and third quarters. These meetings are held to address where employees are in relation to the company’s career model, to set personal targets and to agree training requirements. In addition to the intensive training gained by completing demanding assignments and projects, more formal training and certification opportunities are provided by the EVRY Academy’s extensive offering. The EVRY Academy organises classroom and e-learn-ing courses for all employees, with some courses delivered by EVRY employees and others by external experts. Our goal is to retain and develop our employees so they grow together with the business. We have set up processes to ensure this is a well-established part of the company’s operating model. There is also an emphasis on ensuring EVRY has a culture in which all employees are trusted knowledge workers whose development and skills are material to EVRY’s success, both internally and externally. We see our organisational culture as our primary competitive advantage, and this requires continual and systematic attention to ensure we are in front.
DIVERSITY, GENDER EQUALITY AND DEMOGRAPHICS
The EVRY group employs 2 587 women, which in total represents 29.4 percent of the workforce. EVRY is one of the largest employers of women in IT in the Nordic region. Women represent 27.6 percent of EVRY’s workforce in Norway and 30.0 percent in Sweden. EVRY’s male and female employees have equal access to all types of position. The distribution of genders is also reflected in management, where the proportions of women are 29.8 percent in Norway and 33.6 percent in Sweden. EVRY has well-estab-lished personnel guidelines that ensure there is no discrimination based on gender in matters such as salaries, promotion and recruitment.
In the recruitment process, emphasis is placed on attracting highly qualified employ-ees of both genders. The Group’s employees have extensive experience, and their average age is 39. At the end of 2018, EVRY’s executive management team totalled eleven people, three of whom are women. The proportion of women on the Board of Directors of EVRY ASA was 42 percent.
Average age
38 years 39 years
Norway:
Sweden:
Latvia:
India:
Ukraine:
Sick leave
3.2 %
3.3 %
3.8 %
1.5 %
1.2 %
3.0 %
3.3 %
3.6 %
2.1 %
1.2 %
2017 2018
2017 2018
50 | ANNUAL REPORT 2018

EVRY EMPLOYEE ENGAGEMENT SURVEY 2018
Leadership
Execution Capabilities
ABSENCE DUE TO SICKNESS AND ACCIDENTS
EVRY works in a systematic and long-term way on health, safety and the working environment. The primary focus of the compa-ny’s work in this area is on preventative measures to keep sick leave at the lowest possible level, to avoid risks to life and health, to minimise adverse effects on the environment and to prevent accidents and injuries. The risk of serious injuries and fires is considered to be extremely low. The preventative health meas-ures include early intervention for health problems, encouraging a healthy diet in EVRY’s canteens and organised sports activities.
INCLUSIVE WORKING ENVIRONMENT
EVRY focuses on encouraging a working environment that is free of discrimination, whether on grounds of religion, skin colour, gender, sexual orientation, age, functional disability, or national or ethnic origin. The Norwegian part of the Group has entered into an agreement for “Inclusive Working Environment” (the IA Agreement) to strengthen the focus on working environment programs, measures to reduce absence due to sickness, and diversity. The Group collaborates with Telenor Open Mind and routinely offers work experience placements for individuals with disabilities.
HUMAN RIGHTS
The most important human right for EVRY’s employees relates to data protection. EVRY focuses on this as the data controller for its own personal data. EVRY supports the United Nations Universal Declaration of Human Rights and related conventions.
The company places particular emphasis on protecting the fundamental rights of employees as embodied in the ILO core conventions. EVRY’s Code of Conduct is aligned with the UN’s Global Compact. This commits the company to following the 10 basic principles, which address labour rights and environmental and social responsibility issues. EVRY’s suppliers have to satisfy the standards EVRY itself observes in all areas related to corpo-rate social responsibility.
EVRY Group Index
Pride
Commitment
80.2
80.1
80.1
79.3
78.3
75.4 81
.0
81.6
81.9
81.4
81.7
Q317
Q217
Q117
Q416
Q316
Q216
Q116
Q417
T118
T218
T318
77.8
Q317
Q217
Q117
Q416
Q316
Q216
Q116
Q417
T118
T218
T318
81.5
78.8
79.8
79.8
81.2
80.1
82.2
82.5
81.9
82.3
Q317
Q217
Q117
Q416
Q316
Q216
Q116
Q417
T118
T218
T318
85.8
83.9
83.9
85.2
85.3
85.8
85.0
86.2
86.4
86.1
86.6
Q217
Q117
Q416
Q316
Q216
Q116
Q317
Q417
T118
T218
T318
80.9
78.1
78.8
79.9
80.2
80.9
79.9
81.5
81.7
81.1
81.6
Q317
Q217
Q117
Q416
Q316
Q216
Q116
Q417
T118
T218
T318
76.6
70.0
71,6
72,9
75.0
76.2
75.4
76.4
76.8
76.4
76.4
ANNUAL REPORT 2018 | 51
BUSINESS PLAN
INVESTOR INFORMATION
BUSINESS REPORT
FROM THE BOARDROOM
FINANCIAL STATEMENTS & NOTES
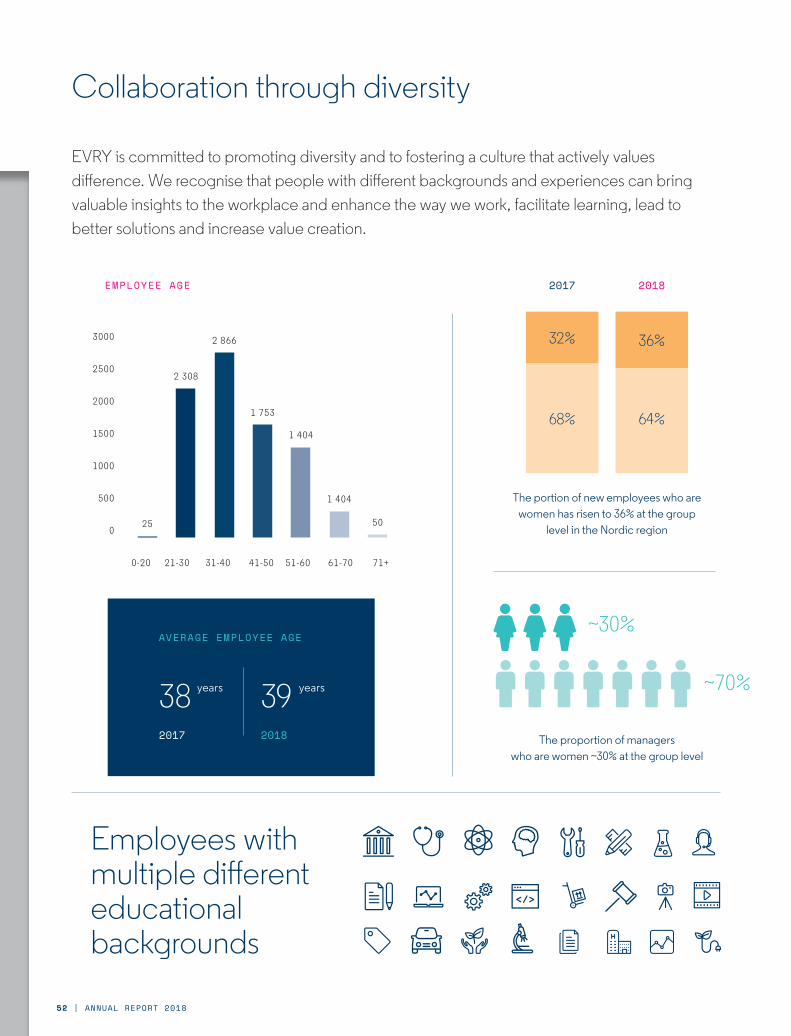
3000
2500
2000
1500
1000
500
0
21-300-20
2 308
25
2 866
1 753
1 404
1 404
50
31-40 41-50 51-60 61-70 71+
EMPLOYEE AGE
Employees with multiple differenteducational backgrounds
~30%
~70%
The portion of new employees who are women has risen to 36% at the group
level in the Nordic region
Collaboration through diversity
EVRY is committed to promoting diversity and to fostering a culture that actively values difference. We recognise that people with different backgrounds and experiences can bring valuable insights to the workplace and enhance the way we work, facilitate learning, lead to better solutions and increase value creation.
The proportion of managers who are women ~30% at the group level
2017 2018
20182017
AVERAGE EMPLOYEE AGE
38 39years years
32%
68% 64%
36%
52 | ANNUAL REPORT 2018

EVRY's employees come from over 30 different countries.
no. of women in the EVRY Group
countries
Offices in
EVERYONE IS EQUAL
In June EVRY took part for the first time in Oslo Pride, which is Norway’s largest celebration of LGBT+ (lesbian, gay, bi-sexual, and transgender ) love and diversity. EVRY employees participated in the Pride parade, which attracted 40 000 participants and 200 000 spectators to what is a big public party. The purpose of the festival is to highlight LGBT+ culture and to help increase acceptance and respect for this section of Oslo’s diverse population.
50%11~2 600of all employees
to be women by 2028
Our goal
ANNUAL REPORT 2018 | 53
BUSINESS PLAN
INVESTOR INFORMATION
BUSINESS REPORT
FROM THE BOARDROOM
FINANCIAL STATEMENTS & NOTES
EVRY’s game-based recruitment solution is attracting significant interest in the market and companies such as Storebrand, Norsk Gjenvinning and a Swedish recruitment company have started using it.
In order to develop and deliver good IT services, EVRY needs to have the right expertise, but in a world in which digitalisation is progressing at record speed, skilled IT people are very much in demand. In order to stay ahead in the battle for talent, EVRY has become the first organisation in the Nordic region to adopt robotics and game-based assessment for job applicants.
GAME-BASED ASSESSMENT
Candidates who apply for a job at EVRY are asked to download an app containing a game. When the candidate plays the game, a robot gathers and analyses information on the player. Over the course of the 45 minutes that the game takes, the robot collects 5 000 data points. It then analyses how the player reasons when solving complex problems, how quickly he or she learns new things, and how he or she scores on mathematical understanding. The game is both an aptitude and a personality test. This means that EVRY can test hundreds of applicants before reading their applications and CVs. This approach to recruitment means that
EVRY can test all the applicants and does not risk missing skilled candidates because their CVs do not reflect their true abilities.
The test results can, for example, show that a candidate is a 92 percent match to the profile for one type of position at the company, a 79 percent match for another, and a 22 percent match for a third. If a candidate applies for a role for which he or she is not a sufficiently good match, this does not mean that he or she is of no interest. EVRY can explain to the candidate that his or her profile is a good match for a different position.
MORE DIVERSITY
The game-based assessment solution compares each candi-date with the other candidates regardless of gender, ethnicity, personal beliefs or other factors. The solution has thus contrib-uted to the proportion of women at EVRY increasing in recent years. The industry average is only 24 percent, but at EVRY around 40 percent of new graduates who have been recruited using the new solution are women. Using gaming technology in recruitment is positively received by job applicants and an impressive 70 percent of candidates say that it made them more interested in working at EVRY.
More effective talent acquisition with gamification
EVRY has adopted game-based assessment as a way of screening candidates when recruiting, making the process more time-efficient and increasing diversity
CASE STUDY - RECRUITMENT AT EVRY
“Diversity is important for innovation and we need to be innovative. But we tend to recruit people who are like ourselves. Game-based assessment reduces the subjective dimension of recruitment.”
TROND VINJEEVP HR
54 | ANNUAL REPORT 2018

PROJECT RESULTS:
50% better quality of new hires
26% reduction in costs
92% positive experience rate
40% proportion of women
“Gamification has helped us test more than 2500 candidates over the last 18 months. Using robotics in recruitment ensures we do not miss talented candidates because their CVs do not reflect their true abilities.”
JEANETTE LOUISE RØNNEHead of Emerging Tech
ANNUAL REPORT 2018 | 55
BUSINESS PLAN
INVESTOR INFORMATION
BUSINESS REPORT
FROM THE BOARDROOM
FINANCIAL STATEMENTS & NOTES

56 | ANNUAL REPORT 2018

ANNUAL REPORT 2018 | 57
EVRY IN BRIEF
BUSINESS PLAN
INVESTOR INFORMATION
BUSINESS REPORT
FROM THE BOARDROOM
FINANCIAL STATEMENTS & NOTES

EVRY provides a broad and extensive portfolio of deliveries to its customers. Its guiding principle is to always create genuine commercial value and to provide a digital advantage. To succeed in this, EVRY needs to partner with its customers as closely as possible and to really understand what drives their business as it stands and also what factors are set to influence this in future.
Collaboration to create value for customers
EVRY’s knowledge of business, technology, customers and markets is enabling new value creation for customers. Customers are increasingly seeking advice on how digital solutions can create better services and increase their competitiveness, and EVRY is working toward
becoming a business partner for customers’ digital needs.
INNOVATION
58 | ANNUAL REPORT 2018

EVRY’s customers want to simplify and streamline their work processes, to be more competitive, to be better at what they do, to offer a high-quality customer experience, and to achieve better compliance in their day-to-day work. EVRY is always on the lookout for technologies and solutions that can give its customers a commercial advantage. New technology creates new opportunities, and EVRY is investing in innovation, exper-tise and its corporate culture - in order to develop new digital services that will help shape the future.
INVESTING HEAVILY IN NEW TECHNOLOGIES
EVRY is actively investing in talent, and has recruited a range of new employees with expertise in important new areas of tech-nology such as blockchain, artificial intelligence, augmented reality, robotics, machine learning and the internet of things. EVRY’s investment in its Innovation Hub is giving talented young people the chance to try their hand at working on digital ques-tions related to real customer challenges. EVRY’s investment in cognitive solutions means more EVRY employees are now dedicated to working on cognitive solutions.
EVRY provides a broad and extensive portfolio of deliveries to its customers. Its guiding principle is to always create genuine commercial value and to provide a digital advantage. To succeed in this, EVRY needs to partner with its customers as closely as possible and to really understand what drives their business as it stands and also what factors are set to influence this in future.
PARTNER-CENTRIC INNOVATION
In order to be an attractive collaboration partner, EVRY needs to be relevant by ensuring it offers leading products and services in the areas of digitalisation, applications and infrastructure. EVRY has the right products and services, and offers standardised solu-tions that function across industry segments as well as dedicated industry-specific solutions that satisfy industry requirements. The main components of EVRY’s offer are based on its partnerships, and EVRY has entered into strategic collaboration agreements with leading companies such as Microsoft, Google, IBM and Amazon. Through these partnerships EVRY offers world-lead-ing technology as well as processes and tools for transitioning to cloud-based solutions. These are combined with EVRY’s local presence, market understanding and infrastructure solutions across the entire Nordic region.
DIGITAL EXPERIENCE AND STRATEGIC DESIGN
What solutions should a customer choose and in what order, and how should new technology and the organisation interact to create optimal value? EVRY has a key role to play in relation to such questions by functioning as a reliable partner that helps its customers to make the right choices. Our goal is to be a collab-oration partner that helps its customers to predict their needs, to manage change and to create business value. We seek to help our customers to develop new business models and to imple-ment innovative solutions for their end-users.
EVRY is creating a Nordic powerhouse within digital expe-rience and strategic design by leveraging capabilities in
Stockholm, Gothenburg, Oslo and Bergen. Thanks to our close to 200 digital and strategic designers in the Nordics, we have a unique ability to identify opportunities and to create solutions from ideas in order to create business value for our customers. With our ability to understand the customer and industry-specific jobs-to-be-done in combination with our extensive technology expertise within fields such as AI, data analytics and security, we can truly be a partner for digital advantage.
CLOSE COLLABORATION WITH CUSTOMERS
The EVRY Strategic Design Lab represents an entirely new way of working with customers. The primary objective is to engage customers’ senior management teams in dialogue in order to look at new business opportunities and to support customers with the changes they face by using strategic design. Design Thinking involves creating a good understanding of end-customers and their needs before looking at solutions.
This approach is helping EVRY to differentiate itself. Working closely with customers, rather than using the more traditional customer-supplier relationship, creates better dialogue and leads to the co-creation of optimal solutions. This way of working is well suited to customers who need help with improving the customer experience and developing new products and services or with challenging their organisation. EVRY works to anticipate needs and on this basis develops a “proof of concept” that is tested on end-users before finally being developed into a finished service. The point of departure for the EVRY Strategic Design Lab is not new technology per se; it is instead focused on achieving value creation through technology. Collaborating with customers’ commercial teams in this way is important and will become increasingly so in future.
Six state lotteries partnered with EVRY and Method* to launch and run CoLab – a lab for co-creation driven innovation – facilitating the ideation, prototyping and testing of game concepts and experiences. In the first year, 154 concepts were created, with nine taken into further testing and one real market test carried out in Norway with Norsk Tipping.
*Method is a partner and a global experience design firm that transforms companies through the intersection of branding, products, and services.
ANNUAL REPORT 2018 | 59
BUSINESS PLAN
INVESTOR INFORMATION
BUSINESS REPORT
FROM THE BOARDROOM
FINANCIAL STATEMENTS & NOTES

The Innovation Hub develops talented employees who drive ideas for business forward and focus on radical innovations in the form of new products and services for customers. The Innovation Hub is divided into two areas. One area consists of interns who are talented new graduates who work on experimental projects for 2-4 months and the other of full-time employees who work on turning projects undertaken by the interns into reality as well as on initiatives from customers.
The Innovation Hub has worked with multiple customers in the banking industry.
DIVERSE TO ITS CORE
The Innovation Hub hires talented people from all over the world and has 21 nationalities represented among its staff, 49 percent of whom are women. The educational backgrounds of its employ-ees range from history, design and development through to global studies, psychology, technology and business. Every year 80 talented people join the internship program, and in 2018 three in every four took up a permanent position at EVRY.
“AVATAR” FOR SPAREBANK 1
One of the projects that the Innovation Hub worked on in 2018 was developing a concept known as “Avatar” for SpareBank 1. The purpose of the project was to identify potential value prop-ositions for the family segment in order to strengthen customer relationships and subsequent revenue streams. The process included identifying common pain points faced by families and developing solutions to address key needs.
The Innovation Hub was set the following challenge: “How can SpareBank1 maintain and grow traffic to its digital channels?” Several methods of gathering insight were used for the project, including surveys, workshops and interviews. As the key target audience for the project was young people, a lot of the research was done using social media channels such as Snapchat. The findings from the data gathering process culminated in several ideas, with the final concept selected consisting of a prototype based on an avatar. The idea consists of an avatar, which could be used on various digital channels, that represents the customer in relation to his or her private financial situation and behaviour. The avatar would reflect each customer’s income and expenditure, and thus his or her financial situation or “health”. If, for instance, a customer met his or her saving goal for a given month, the avatar would dress up in a nice suit with a cigar.
The value that the customer gained from the project was a better understanding of how to attract the younger customer segment. This understanding derives from the qualitative insights into the needs and wants of young consumers and the proposals for how to satisfy their expectations of financial service providers that were generated by the project.
Developing ideas and driving innovation
EVRY´s Innovation Hub is giving talented young people the chance to try their hand at working on digital questions related to real customer challenges.
CASE STUDY - INNOVATION HUB
60 | ANNUAL REPORT 2018

THE TEAM
“To create the solutions of the future, it is essential to have different viewpoints and multidisciplinary teams whose members challenge one another, the customer and EVRY. The Innovation Hub is a diverse team of interns and full-time employees who collaborate to solve digital questions related to real customer challenges.”
TONE MARIE WAHLSTRØMHead of the EVRY Innovation Hub
From left: Masoom Maham, Jun Christian Villanueva, Renaud Permezel, Kaja Drews, Torkel Wølner, Åshild Walseth
ANNUAL REPORT 2018 | 61
BUSINESS PLAN
INVESTOR INFORMATION
BUSINESS REPORT
FROM THE BOARDROOM
FINANCIAL STATEMENTS & NOTES

In practice, an Application Programming Interface (API) is an interface in a piece of software that enables specific aspects of it to be used by another piece of software. EVRY has developed a large number of APIs across the company’s industry segments and services. There is a desire to use the company’s expertise in quality control and data accessibility to simplify and increase the value of EVRY’s integrations in collaboration with customers and partners. APIs have a central role to play in this regard.
CONCEPT AND PROTOTYPE
In the summer of 2018 a group of eight interns in EVRY’s Innovation Hub was given the challenge of investigating the options for how the company could make better use of its APIs. The students developed a concept and a prototype for how EVRY, its customers and others could make their own and other providers’ APIs more easily accessible and usable.
AN “APP STORE” FOR APIS
In October 2018, EVRY set up a broad-based team consisting of recently employed ex-interns and experienced employees in the form of a technical architect, a senior developer and a business developer working together. Three students from the Norwegian University of Science and Technology, who work at EVRY on a part-time basis, were also part of the team. On the basis of the prototype, the team are working on a cloud-based marketplace for APIs that they named “API Exchange”. The project team collaborates with a range of units internally at EVRY as well as with numerous external organisations. The ambition is that EVRY, its customers and others can make their APIs available via the marketplace. The more APIs that are added to the solution by EVRY and others, the better it will become. The portal will make it much easier to make use of APIs and connect different solutions together, which in turn helps create better end-user services.
SPEEDS UP DIGITALISATION
Work is now underway on how EVRY’s services could be made available to users. An example is how APIs for SMS messages and the Norwegian National Register, which is accessed via EVRY’s Infotorg solution, could be made available. This could, for instance, give Norway’s municipalities the opportunity to find the segment of the population they wish to communicate with and send them personalised SMS messages. Information that today takes a week to communicate by post will in the future be distributed in a matter of minutes.
EVRY to introduce a public marketplace for APIs
In the summer of 2018 EVRY’s Innovation Hub was tasked with looking at whether better use could be made of the company’s APIs. In October, EVRY launched “API Exchange”, a project
to develop a public marketplace for APIs.
CASE STUDY - API EXCHANGE
“The different APIs function as building blocks that you can use to put together the solution you want. Gathering together and offering all EVRY’s APIs through standardised interfaces, with proper documentation, login and access control will be very useful for all parties. ”
MARCUS BERGQUISTEVRY NORWAY
62 | ANNUAL REPORT 2018

THE TEAM
The Innovation Hub team at work creating the “API Exchange” concept.
ANNUAL REPORT 2018 | 63
BUSINESS PLAN
INVESTOR INFORMATION
BUSINESS REPORT
FROM THE BOARDROOM
FINANCIAL STATEMENTS & NOTES

Investor information03
66 CFO letter
68 The EVRY share
74 Key figures
76 Alternative performance measures
INVESTOR INFORMATION
BUSINESS REPORT
FROM THE BOARDROOM
FINANCIAL STATEMENTS & NOTES

Compelling growth in sales and EBITAEVRY has been focusing on achieving a solid platform for growth since 2015, and 2018 was the first year in which organic growth stabilised through positive momentum in each of the four quarters of the year. 2018 was also proof of EVRY's stabilised profitability and strong focus on achieving solid cash flow.
CFO LETTER
66 | ANNUAL REPORT 2018

EVRY delivered organic top-line growth in accordance with our plan. The utilisation rate for the company’s consultants was good, and a range of significant agree-ments were entered into with customers throughout the year. At the same time, we implemented a number of structural changes in order to reposition the company.
We are pleased that revenue has increased and that we have reported organic revenue growth for the last six quarters. There is continuous down-ward pressure on prices for infrastructure services and we are focusing to a greater extent on consulting and application services, areas in which we will see the strongest growth in the years ahead. The feedback we received following the capital markets day in November was positive. Investors can see that our transformation of the company has come a long way and that we are now well-equipped for profitable growth. Our restructuring costs were significantly lower in 2018 than in 2017, and we expect them to decrease further in 2019.
All in all, EVRY delivered a solid year. The EVRY Financial Services business area generated strong numbers and in 2018 we succeeded in internationalising our new core banking and payment solutions, including through a comprehensive agreement with Handelsbanken in Finland. We also entered into strategic agreements to manage ATMs for major banks in the Netherlands and Sweden.
The EVRY Norway business area also performed well. We maintained our posi-tion as market leader and entered into a number of exciting contracts in focus areas such as robotics, artificial intelli-gence and analytics. EVRY Sweden is encountering strong competition, with big international IT companies and local competitors strongly present in the market. At the same time, the battle for talented tech employees is becoming
more competitive. Digital expertise is in strong demand from both our competi-tors and our customers, and this is affect-ing our results in Sweden in 2018. We are therefore working in a targeted way on retaining our employees and on recruit-ing the expertise we need to meet our customers’ future needs.
EVRY was listed on the Oslo stock exchange for the entirety of 2018 and throughout this period the company demonstrated to investors that it is achieving growth. We are reporting total operating revenue for 2018 of NOK 12 912 million, compared with NOK 12 596 million in 2017. This represents organic growth of 3.0 percent relative to 2017. We have a target of achieving a Compound Annual Growth Rate (CAGR) of more than 3 percent in the period through to 2022.
EVRY improved its profitability in 2018 and has a stable double-digit margin. Adjusted EBITA increased from NOK 1 569 million in 2017 to NOK 1 582 million in 2018. This gives an adjusted EBITA margin of 12.3 percent, compared to 12.5 percent in 2017.
Cash is an important priority for EVRY, and the company is making good progress on cash flow. Free cash flow for 2018 was close to NOK 1 billion as compared to NOK 913 million in 2017.
EVRY is committed to being a business partner for digital transformation and we are working on shifting our focus from transaction-based IT services to value based services that offer greater profitability. We have made excitingly good progress on this journey, which will continue in 2019.
Henrik SchiblerChief Financial Officer (CFO)
INVESTOR INFORMATION
“EVRY has reported organic revenue growth for the last six quarters, and in 2018 it continued its shift to more profitable services.”
ANNUAL REPORT 2018 | 67
INVESTOR INFORMATION
BUSINESS REPORT
FROM THE BOARDROOM
FINANCIAL STATEMENTS & NOTES

THE EVRY SHARE
Returning cash to shareholdersAfter being delisted in 2015, EVRY was relisted on the Oslo stock exchange (“OSE”) on 21 June 2017 with an issue price of NOK 31.00 per share. In 2018 EVRY’s share price traded between NOK 26.95 and NOK 32.95 per share and at year-end 2018 was NOK 31.45 per share. EVRY distributed a dividend of NOK 1.25 per share in May 2018, which implies a dividend-adjusted closing share price at the end of 2018 of NOK 32.70 per share. The company’s market capitalisation at the end of 2018 was NOK 11.7 billion.
EVRY trades with the ticker code “EVRY” on the OSE, and the share has been included in the Oslo Stock Exchange Benchmark Index since 1 December 2017. As EVRY operates in the Nordic IT software and services segment, it has from the same date been included in the OSE Software and Services Index and in the OSE Information Technology Index. As one of the largest listed IT companies in Norway, EVRY is also included in other indices on the Oslo stock exchange, such as the OSE All Share Index, the OSE Mutual Fund Index and the OSE Mid Cap Index.
In 2018 EVRY’s share price rose by 1.5 percent, while its share price rose by 5.5 percent when adjusted for the dividend of NOK 1.25 per share. In contrast, the Oslo Stock Exchange Benchmark Index (OSEBX) fell by 1.9 percent in 2018, while the OSE Information Technology Index (OSE45GI) and the OSE Software and Services Index (OSE4510GI) fell by 20.0
percent and 4.1 percent respectively over the same period.
SHARE CAPITAL, MARKET CAPITALISATION AND SHAREHOLDER STRUCTURE
At the end of December 2018, the share capital of the company was NOK 649 million made up of 370 806 077 ordi-nary shares, each with a nominal value of NOK 1.75. All ordinary shares have equal voting rights and the same right to receive dividends. In 2018 the company initiated a share buy-back program and at 31 December 2018 the company owned 1 501 744 of its own shares.
EVRY’s total market capitalisation at the end of December 2018 was NOK 11.7 billion based on 370 806 077 ordinary shares and a share price of NOK 31.45 per share.
Lyngen Holdco S.A.R.L., a company indirectly controlled by private equity
4 119Shareholders
+1 . 5 %2018 share price
performance
N O K 1 .75Proposed dividend
per share
68 | ANNUAL REPORT 2018

EVRY´S RELATIVE SHARE PRICE PERFORMANCE BETWEEN IPO ON 21 JUNE 2017 AND YEAR-END 2018
funds advised by Apax Partners LLP, was the largest share-holder in EVRY at the end of 2018 with a holding of 201 410 067 shares, which is equivalent to 54.3 percent of the total issued share capital in the company. Funds controlled and managed by Polygon Global Partners LLP represent the second largest shareholder, albeit with a much smaller percentage holding, while Folketrygdfondet (the Government Pension Fund Norway) is the third largest shareholder. As of 31 December 2018, EVRY’s executive management team controlled 0.71 percent of the shares in EVRY.
Investors based in Luxembourg represent the largest share-holder group with holdings totalling approximately 56 percent of the issued share capital. Shareholders based in the United Kingdom and Norway represent the joint-second largest groups and each account for approximately 13 percent of the share capital. Shareholders based in the United States of America control 10 percent of the total share capital. EVRY had 4 119 registered private and institutional shareholders at the end of 2018, with non-Norwegian investors holding approximately 87 percent of the share capital. >
Source: Oslo Børs
80
90
100
110
120
130
140
21.0
6.17
21.0
7.17
21.0
8.17
21.0
9.17
21.1
0.17
21.1
1.17
21.1
2.17
21.0
1.18
21.0
2.18
21.0
3.18
21.0
4.18
21.0
5.18
21.0
6.18
21.0
7.18
21.0
8.18
21.0
9.18
21.1
0.18
21.1
1.18
21.1
2.18
EVRY OSEBX OSE45GI OSE4510GI
Shareholder Shares % of shares
LYNGEN HOLDCO S.A.R.L. 201 410 067 54.32POLYGON (PE) HOLDINGS LTD 19 444 554 5.24FOLKETRYGDFONDET* 18 870 507 5.09STATE STREET BANK AND TRUST COMP 9 483 012 2.56UBS AG 7 726 265 2.08CREDIT SUISSE SECURITIES (EUROPE) 5 150 368 1.39STATE STREET BANK AND TRUST COMP 4 738 480 1.28NORTHERN TRUST GLOBAL SERVICES PLC 4 715 352 1.27STATE STREET BANK AND TRUST COMP 4 353 464 1.17DANSKE BANK A/S 4 194 404 1.13CREDIT SUISSE SECURITIES (USA) LLC 4 034 600 1.09ARCTIC FUNDS PLC 3 823 138 1.03KLP AKSJENORGE 3 192 936 0.86STATE STREET BANK AND TRUST COMP 2 914 107 0.79VERDIPAPIRFONDET PARETO INVESTMENT 2 869 461 0.77STATE STREET BANK AND TRUST COMP 2 559 203 0.69SEB PRIME SOLUTIONS SISSENER CANOP 2 520 000 0.68JPMORGAN CHASE BANK, N.A., LONDON 2 487 616 0.67MORGAN STANLEY & CO. INT. PLC. 2 366 441 0.64J.P. MORGAN SECURITIES LLC 2 350 000 0.6320 largest shareholders total 309 203 975 83.39
* The government pension fund NorwaySource: Euroland
20 LARGEST SHAREHOLDERS AT 31 DECEMBER 2018
ANNUAL REPORT 2018 | 69
INVESTOR INFORMATION
BUSINESS REPORT
FROM THE BOARDROOM
FINANCIAL STATEMENTS & NOTES

TRADING VOLUME IN 2018
Due to the significant shareholdings held by EVRY’s two major shareholders, Lyngen Holdco S.A.R.L. and funds controlled and managed by Polygon Global Partners LLP (both shareholders prior to the IPO), only a relatively small proportion of EVRY shares are available for trading on a day-to-day basis, and trading volumes were relatively low in 2018. The number of shares traded in the period between 2 January 2018 and 28 December 2018 was 51.0 million, which is equivalent to 13.7 percent of the total outstanding shares in the company. 205 000 shares were traded on average each day, equivalent to 0.1 percent of the issued shares.
ANALYST COVERAGE
At the end of 2018, the EVRY share was covered by nine financial analysts, five of whom are based in Norway/the Nordics. EVRY is committed to providing relevant and complete information and to ensuring that all analysts are always treated on an equal basis. Day-to-day contact with investors and analysts is handled by EVRY’s Investor Relations department.
DIVIDEND POLICY
EVRY intends to pay dividends based on a pay-out ratio of around 60 percent of EVRY’s Adjusted Net Income (as defined on page 74 of this Annual Report). The proposal to pay a dividend in any year is further subject to any restrictions under the Company's borrowing arrangements and/ or other contractual arrange-ments in place at the time. Share buy-backs and/or extraordi-nary dividends are evaluated on a case by case basis and need to be approved by the company’s Board of Directors and the General Meeting/ Extraordinary General Meeting. There can be no assurance that a dividend will be proposed or declared in any
Luxemburg 56%
United Kingdom 13%
Norway 13%
United States 10%
Sweden 3%
Ireland 2%
Other 3%
Source: Euroland
Shareholding distribution by geography
31 December 2018
Company Analyst
ABG Sundal Collier ASA Aksel Øverland Engebakken
Credit Suisse International Charles A. Brennan
DNB Bank ASA Christoffer Wang Bjørnsen
Goldman Sachs International Gautam Pillai
Morgan Stanley & Co. International plc Adam Wood
Nordea Bank Abp Oliver Schüler Pisani
Pareto Securities AS Fredrik Steinslien
SpareBank1 Markets Petter Kongslie
UBS Investment Bank Michael Briest
LIST OF ANALYSTS COVERING THE EVRY SHARE AT 31 DECEMBER 2018
70 | ANNUAL REPORT 2018

Country Number of sharesPercentage of total
share capital Number of shareholdersPercentage of total
shareholders
Luxembourg 207 100 101 55.9 10 0.24United Kingdom 49 860 674 13.5 43 1.04Norway 46 882 135 12.6 3 833 93.06United States 38 090 889 10.3 54 1.31Sweden 10 150 555 2.7 59 1.43Ireland 6 237 631 1.7 18 0.44France 4 234 392 1.1 14 0.34Australia 2 785 303 0.8 5 0.12Switzerland 1 954 198 0.5 10 0.24Others 3 510 199 1.0 73 1.77Total 370 806 077 100 4 119 100
SHAREHOLDING DISTRIBUTION BY GEOGRAPHY AT 31 DECEMBER 2018
Source: Euroland
given year. If a dividend is proposed or declared, there can be no assurance that the dividend amount will be as indicated above.
EVRY’s Board will propose to the Annual General Meeting the payment of a dividend for 2018 of NOK 1.75 per share, which represents 61 percent of 2018 Adjusted Net Income. The divided proposed for 2018 represents a total payment of NOK 648.9 million on the basis of the number of shares outstanding at 31 December 2018.
SHARE BUY-BACK PROGRAM
The Board of Directors of EVRY ASA resolved to initiate a share buy-back program based on the authorisation to acquire treasury shares granted by the company's Annual General Meeting on 3 May 2018.
The Board resolved to initiate an acquisition by the Company of up to 2 500 000 shares under the share buy-back program, for the purposes of acquiring treasury shares which may be used to fulfill the Company's obligations under its incentive programs. The shares shall be purchased as ordinary market trades over the stock exchange.
Over the course of the year, EVRY completed the share buy-back programme representing a total of 1 501 744 shares corresponding to 0.4 percent of shares issued at year-end.
For additional information regarding the scope of the authori-sation granted to the Board by the Company's General Meeting, please refer to the minutes of the Company's Annual General Meeting held on 3 May 2018 (available on www.evry.com).
INVESTOR RELATIONS
EVRY is committed to providing the financial markets with precise, relevant, timely and consistent information. EVRY has introduced an investor relations policy in accordance with the >
FINANCIAL CALENDAR
EVRY intends to publish and present its results in 2019 on the following dates:
> Annual General Meeting – 11 April 2019
> Interim Report Q1 2019 - 08 May 2019
> Interim Report Q2 2019 - 12 July 2019
> Interim Report Q3 2019 - 31 October 2019
EVRY’s presentations will take place at EVRY's head-quarters in Fornebu and over webcast and will start at 08:00 CET. The quarterly reports and presentation materials will be made available via the Oslo stock exchange (www.oslobors.no /www.newsweb.no) and on the company’s website (www.evry.com) at or around 07:00 CET on the day of release. Please see our website for further details and for any updates.
ANNUAL REPORT 2018 | 71
INVESTOR INFORMATION
BUSINESS REPORT
FROM THE BOARDROOM
FINANCIAL STATEMENTS & NOTES

Oslo Børs Code of Practice for IR of 1 March 2017. The purpose of EVRY’s IR policy is to ensure that the company complies with all official rules and regu-lations that apply to financial reporting and communication in the Norwegian financial market, and that it meets market participants’ expectation to be provided with information on a timely and equal basis. EVRY live-streams its quarterly and annual results presentations, which are held at its headquarters in Fornebu, Oslo, Norway.
EVRY is committed to open dialogue with market participants, including shareholders, investors and analysts. All information that may be important and relevant for capital markets partici-pants is provided in the form of releases published through Oslo Børs’ NewsWeb publication service, the media and/or press releases.
Key figures 2018 2017
Number of shares issued at year-end 370 806 077 370 806 077
Average number of shares at year-end 370 806 077 319 072 529
Number of official shares traded (million shares) 25.9 76.4*
Average official daily trading volume (thousand shares) 104.0 561.4
Number of all shares traded** (million shares) 51.0 133.9
Average daily trading volume all shares traded** (thousand shares)
204.6 984.5
Number of trading days 249 136*
Share price on first trading day of the year (NOK/share) 31.00
Share price at year-end (NOK/share) 31.45 32.5
Highest closing share price (NOK/share) 32.95 33.9
Lowest closing share price (NOK/share) 26.95 28.0
Volume-weighted average share price (NOK/share) 30.2 30.9*
% change in share price since first trading day of the year 1.5% 4.8%*
% change in adjusted share price since first trading day of the year
5.5% -
% change in OSE Benchmark Index since first trading day of the year
-1.9% 16.4%*
% change in OSE Information Technology Index since first trading day of the year
-20.0% 2.9%*
% change in OSE Software and Service index since first trading day of the year
-4.1% 7.7%*
Adjusted earnings per share for the year (NOK) 2.89 2.82
Proposed dividend per share (NOK) 1.75 1.25
Market capitalization at year-end (NOK billion) 11.7 12.1
Key shareholder figures 2018 2017
Number of shareholders at 31 Dec. 4 119 1 592
Proportion held by Norwegian shareholders 13% 10%
Proportion held by foreign shareholders 87% 90%
Largest shareholder, Lyngen Holdco S.A.R.L. holds 54.3% 54.3%
Source: Oslo Børs, Euroland
Source: Oslo Børs, Euroland, EVRY ASA*between IPO on 21 June 2017 and year-end 2017** Volume data from all trades including official trades and others
FOR FURTHER INFORMATION, PLEASE CONTACT EVRY INVESTOR RELATIONS:
e-mail: [email protected]: investor.evry.com
72 | ANNUAL REPORT 2018

Capital Markets Day 2018
EVRY hosted a capital markets day at its headquarters in Fornebu on 27 November 2018 primarily for analysts and investors. EVRY has come a long way since the last capital markets it held day four years ago by following its business plan, and the company is now positioned to create business value through a customer-centric approach.
ANNUAL REPORT 2018 | 73
INVESTOR INFORMATION
BUSINESS REPORT
FROM THE BOARDROOM
FINANCIAL STATEMENTS & NOTES

EB ITDA
Earnings before interest, tax, depreciation and write-downs of tangible assets and in-house developed software, and amortisation of customer contracts. AD J US TED EB ITDA
EBITDA before other income and expenses. EB ITA
Earnings before interest, tax and amortisation of customer contracts.
AD J US TED EB ITA
EBITA before other income and expenses.
EQUIT Y R ATIO
Total equity as a percentage of total equity and liabilities. NE T INTERE S T- BE ARING DEBT (NIBD)
Total of current and non-current interest-bearing liabilities less bank deposits.
NE T LE VER AG E
NIBD divided by adjusted EBITDA
OPER ATIONAL CA SH FLOW
Cash flow from operational activities. AD J US TED OPER ATIONAL CA SH FLOW
Operational cash flow before other income and expenses.
DEFINITIONS OF KEY FIGURES
Key figuresKEY FIGURES FOR THE GROUP
NOK million 2018 2017 2016 2015 2014 2013 * 2012 **
Operating revenue 12 912 12 596 12 246 12 860 12 773 12 600 12 731 EBITDA 1 252 629 1 217 -938 1 020 1 128 1 010 EBITDA-margin 9.7 % 5.0 % 9.9 % -7.3 % 8.0 % 8.9 % 7.9 %Adjusted EBITDA 1 812 1 821 1 583 1 278 1 290 1 219 1 141 Adjusted EBITDA-margin 14.0 % 14.5 % 12.9 % 9.9 % 10.1 % 9.7 % 9.0 %EBITA 1 022 353 947 -1 405 543 673 484 EBITA-margin 7.9 % 2.8 % 7.7 % -10.9 % 4.2 % 5.3 % 3.8 %Adjusted EBITA 1 582 1 569 1 322 811 813 764 691 Adjusted EBITA-margin 12.3 % 12.5 % 10.8 % 6.3 % 6.4 % 6.1 % 5.4 %Number of employees 8 807 8 545 8 864 9 422 10 350 10 323 9 873 Backlog (NOK billion) 19.4 18.0 20.8 17.1 18.0 16.6 15.3
KEY FIGURES PER SHARE (NOK)
Earnings per share 1.73 -0.82 1.12 -5.28 -3.26 -0.29 0.60 Adjusted earnings per share 2.89 2.82 2.18 1.15 1.85 1.49 1.16 Free cash flow per share 2.69 2.86 3.61 2.22 2.44 1.77 1.11Book equity per share 8.05 10.15 0.73 8.03 16.02 20.04 20.46 Average number of shares outstanding 370 806 077 319 072 529 267 187 441 267 187 441 266 994 898 266 798 981 266 421 202
SOLIDITY
Equity ratio 25.7 % 28.4 % 1.9 % 19.4 % 40.0 % 44.6 % 45.0 %Net interest-bearing liabilities (NOK million) 4 104 3 807 6 041 4 008 2 568 2 966 3 007 Net leverage 2.26 2.09 3.82 3.14 1.99 2.43 2.64
LIQUIDITY (NOK MILLION)
Cash and bank deposits 646 880 990 900 616 683 561 Liquidity reserve 2 246 2 580 2 799 2 209 2 414 2 145 2 013 Cash flow from operations 713 -495 306 217 973 1 027 723 Adjusted cash flow from operations 1 374 1 272 1 280 1 002 1 068 1 099 807 Investments in fixed assets 138 176 161 297 398 484 425 Investments in in-house developed software 260 206 189 147 93 143 86 Sale of tangible operating assets (sales proceeds) 21 24 35 34 75 - 1 Free cash flow 997 913 964 592 652 473 297 Cash conversion 86.2 % 91.6 % 108.0 % 97.8 % 93.9 % 104.5 % 88.9 %Cash conversion ex CAPEX 65,4 % 72.0 % 88.0 % 65.8 % 61.7 % 53.2 % 44.2 %
* The financial figures for 2013 are restated due to implementation of IFRS 11 Joint Arrangements with effect from 1 January 2014 and the classification of EVRY Danmark A/S as discontinued operations.**The financial figures for 2012 are restated due to implementation of IAS 19 Employee Benefits with effect from 1 January 2013.
74 | ANNUAL REPORT 2018

FREE CA SH FLOW
Adjusted operational cash flow less investments in tangible assets and in-house developed software and the sale of tangible assets. CA SH CONVERS ION
Adjusted operational cash flow (excl interest payments) divided by adjusted EBITDA.
CA SH CONVERS ION E X CAPE X
Adjusted operational cash flow (excl interest payments) less CAPEX divided by adjusted EBITDA.
CA SH FLOW PER SHARE
Net cash flow from operations divided by average number of shares outstanding. E ARNINGS PER SHARE Profit/-loss for the year attributable to shareholders (owners of the parent company) divided by the average number of shares outstanding.
AD J US TED E ARNINGS PER SHARE
Profit/-loss for the year attributable to shareholders (owners of the parent company) adjusted for other income and expenses after tax divided by the average number of shares outstanding.
KEY FIGURES BY SEGMENT
NOK million 2018 2017 2016 2015 2014 2013 2012
EVRY FINANCIAL SERVICES
Operating revenue 3 392 3 222 3 133 3 613 3 682 3 554 3 339 EBITA 456 432 415 392 371 326 314 EBITA-margin 13.4 % 13.4 % 13.2 % 10.9 % 10.1 % 9.2 % 9.4 %Operational investments (CAPEX) incl. in-house developed software 226 206 182 205 115 188 199 Number of employees 1 504 1 409 1 238 1 299 1 457 1 490 1 490
EVRY NORWAY*
Operating revenue 5 765 5 769 5 669 5 761 6 093 6 180 6 607
EBITA 604 603 430 111 322 359 356 EBITA-margin 10.5 % 10.5 % 7.6 % 1.9 % 5.3 % 5.8 % 5.4 %Operational investments (CAPEX) incl. in-house developed software 101 87 64 130 255 334 209 Number of employees Norway 2 187 2 193 2 361 2 660 3 344 3 378 3 457 Number of employees Global Delivery 3 103 2 861 2 440 * incl Global Delivery for the years 2012-2014
EVRY SWEDEN
Operating revenue 3 301 3 312 3 245 3 430 3 472 3 293 3 307 EBITA 248 325 305 232 255 213 234 EBITA-margin 7.5 % 9.8 % 9.4 % 6.8 % 7.3 % 6.5 % 7.1 %Operational investments (CAPEX) incl. in-house developed software 39 51 53 65 80 66 61 Number of employees 1 739 1 685 1 778 1 939 2 218 2 308 2 305
EVRY OTHER
Operating revenue Global Delivery 1048 930 888 831Group eliminations -594 -636 -689 -776Total Operating revenue other 454 294 199 55
EBITA Global Delivery 172 140 127 135Corporate functions 102 69 45 -59Total EBITA other 274 209 172 76
EBITA-margin Global Delivery 16.4 % 15.0 % 14.3 % 16.2 %Operational investments (CAPEX) incl own developed software 33 38 51 43Number of employees 3 378 3 258 3 487 3 524
ANNUAL REPORT 2018 | 75
INVESTOR INFORMATION
BUSINESS REPORT
FROM THE BOARDROOM
FINANCIAL STATEMENTS & NOTES

EVRY Group’s financial information is prepared in accordance with International Financial Reporting Standards (IFRS). In addition to the ordinary financial performance measures prepared in accordance with IFRS, it is management's intent to provide alternative performance measures (APM) to enhance the understanding of the Group’s underlying performance. Financial APMs are intented to enhance comparability of the results and cash flows from period to period, and it is EVRY's experience that these are frequently used by analysts, investors and other parties. These measures are adjusted IFRS measures, defined, calculated and used in a consistent and transparent manner over the years and across the company where relevant. The alternative performance measures take into consideration other income and expenses defined as items regarded as special due to their nature and include among others provision for restructuring, write-downs, strategic processes and refinancing.
Financial APMs should not be considered as a substitute for measures of performance in accordance with the IFRS.
Alternative performance measures
76 | ANNUAL REPORT 2018

ADJUSTED EBITA AND EBITDA
Earnings before interest, tax and amortisation of customer contracts and write-downs of other intangible assets (EBITA) is an important performance measure for EVRY. EBITDA excludes depreciation and write-downs of tangible assets and in-house developed soft-ware. Adjusted EBITA/EBITDA is defined as EBITA/EBITDA less items defined as other income and expenses, which include inter alia, write-downs and restructuring. These performance measures are considered useful to the users of the financial statements when evaluating operational profitability on a more variable cost basis as they exclude amortisa-tion and depreciation expense related to capital expenditure, and items not considered to be part of ordinary operations.
NOK million 2018 2017Growth in
percent
Reported revenues 12 912.0 12 596.4 2.5 %Currency effects - -141.0 1.1 %Effects from acquistions - 84.0 -0.7 %Basis for organic growth 12 912.0 12 539.4 3.0 %
NOK million 2017 2016 Growth in
percent
Reported revenues 12 596.4 12 246.4 2.9 %Currency effects - -61.2 0.5 %Effects from acquistions - 122.5 -1.0 %Basis for organic growth 12 596.4 12 307.6 2.4 %
ORGANIC REVENUE GROWTH
Organic revenue growth is a measurement of the company’s ability to grow organically by additional net sales to existing and new customers as opposed to through acquired growth. Organic growth is defined as revenue adjusted for the effects from material acqu-isitions, divestments and foreign currency effects. Organic growth is an important key figure to EVRY and to the users of the financial statements as it illustrates the underlying operational growth by excluding effects not related to operations.
NOK million 2018 2017
Adjusted EBITA 1 582.2 1 568.6 Provisons for restructuring - -32.9 Provisons former CEO 14.7 -IBM partner agreement -545.4 -940.9 Transaction costs, IPO and refinancing - -241.3 Reported EBITA 1 022.1 353.4
NOK million 2018 2017
Reported EBITA 1 022.1 353.4 Depreciation and write-down of tangible assets and in-house developed software
230.2
275.6
Reported EBITDA 1 252.4 629.0 Provisons for restructuring - 32.9 Provisons former CEO 14.7 -IBM partner agreement 545.4 917.9 Transaction costs, IPO and refinancing - 241.3 Adjusted EBITDA 1 812.4 1 821.2
ANNUAL REPORT 2018 | 77
INVESTOR INFORMATION
BUSINESS REPORT
FROM THE BOARDROOM
FINANCIAL STATEMENTS & NOTES

CASH CONVERSION
Cash conversion measures how EBITDA is converted into cash and is defined as adjusted operational cash flow before interest payments divided by adjusted EBITDA. In addition, cash conversion is also calculated after investments in tangible assets and in-house devel-oped software and the sale of tangible operating assets.
NOK million 2018 2017
Adjusted operational cash flow 1 374.3 1 272.2 Interest payments 188.5 395.0 Adjusted EBITDA 1 812.4 1 821.2 Cash conversion (in percent) 86.2 % 91.6 %Investment in tangible assets -137.8 -176.3 Investment in in-house developed software -260.5 -206.3 Sale of tangible operating assets 21.5 23.6 Cash conversion after capex (in percent) 65.4 % 71.8 %
ADJUSTED OPERATIONAL CASH FLOW
Adjusted operational cash flow is defined as cash flow from operating activities less the cash effect from other income and expenses. EVRY is of the opinion that this performance measure provides a better expression of the underlying cash flow from operations as it takes into consideration cash effects of items not directly related to its underlying operations, which will be useful to the users of the financial statements in analysing the company's operational profitability.
FREE CASH FLOW
Free cash flow represents the cash flow that EVRY is able to generate after the necessary investments have been made. Free cash flow is defined as operational cash flow adjusted for the cash effect of other income and expenses less investments in tangible operating assets and in-house developed software and the sale of tangible assets.
NOK million 2018 2017
Adjusted operational cash flow 1 374.3 1 272.2Investment in tangible assets -137.8 -176.3Investment in in-house developed software -260.5 -206.3Sale of tangible operating assets 21.5 23.6Free cash flow 997.5 913.2
NOK million 2018 2017
Adjusted operational cash flow 1 374.3 1 272.2 Payments related to restructuring processes -82.4 -195.2Transaction, IPO and refinancing payments -21.9 -342.9Payments related to IBM partner agreement -556.8 -1 228.8 Reported operational cash flow1) 713.2 -494.7
1) Equals net cash flow from operations in the cash flow statement.
78 | ANNUAL REPORT 2018

NOK million 2018 2017
Total profit/-loss for the year attributable to shareholders (owners of the parent company) 639.7 -262.2Other income and expenses (note 3) 560.1 1 215.1Finance costs related to new financing - 313.0Tax effect other income and expenses -128.8 -366.8Adjusted total profit/-loss for the year attributable to shareholders (owners of the parent company) 1 070.9 899.2
Average number of shares outstanding 370 806 077 319 072 529 Adjusted earnings per share 2.89 2.82
NOK million 2018 2017
Non-current interest-bearing liabilities (excluding the capitalised arrangement fee) 4 746.6 4 683.1Current interest-bearing liabilities 3.1 3.1Bank deposits -645.7 -880.0Net interest-bearing liabilities (NIBD) 4 104.0 3 806.6
Capitalised arrangement fee 46.8 60.7Non-current interest-bearing liabilities (including the capitalised arrangement fee) 4 699.8 4 622.4
NOK million
As of 31 December
2018
As of 31 December
2017
Net interest-bearing liabilities (NIBD) 4 104.0 3 806.6Adjusted EBITDA 1 812.4 1 821.2Net leverage 2.26 2.09
ADJUSTED EARNINGS PER SHARE
Earnings per share is calculated as profit/-loss for the year attributable to shareholders (owners of the parent company) adjusted for other income and expenses after tax, divided by the average number of shares outstanding over the year.
NET INTEREST-BEARING LIABILITIES (NIBD)
Net interest-bearing liabilities represents current interest-bearing liabilities plus non- current interest bearing liabilities (before adjustments for accrued arrangement fees) less bank deposits.
NET LEVERAGE
Net leverage represents NIBD divided by adjusted EBITDA.
ANNUAL REPORT 2018 | 79
INVESTOR INFORMATION
BUSINESS REPORT
FROM THE BOARDROOM
FINANCIAL STATEMENTS & NOTES


Business report04
82 About EVRY
88 EVRY’s executive management team
90 Key figures by business area
BUSINESS REPORT
FROM THE BOARDROOM
FINANCIAL STATEMENTS & NOTES

Digital Advantage
Digital Platform Services
Application Services
Consulting Services
����������������
Financial services Public & Health Retail & logistics
Small and medium-sized
enterprises
Industry & Services

More than 10 000 customers
Offices in 11 countries
EVRY is a leading Nordic IT services and software company that aims to create Digital Advantage for people, businesses and society as a whole. We combine Nordic values, business understanding, technological expertise and local presence to enable our customers to make the best possible use of technology. Every second, day and night, people are logging into their internet banking, retrieving important work documents, or just checking the time of the next train home.
EVRY is the force behind services such as these that are of great value to society. Our employees are highly qualified and have in-depth expertise and extensive experience. Making use of our strong local knowledge and drawing on our international resources has allowed us to develop a unique position in the Nordic market. We provide both industrialised IT services to organisations that need standard solutions as well as solutions that are adapted to meet industry-specific and regulatory requirements.
ABOUT EVRY
Building the digital societyMore than five million people in the Nordics use services delivered by EVRY every day. The company is the force behind a whole range of innovations that have transformed the way people access services. Through our insight, solutions and technology, we contribute to the development of the digital society of the future, for the benefit of our customers, their customers and society as a whole.
ANNUAL REPORT 2018 | 83
BUSINESS REPORT
FROM THE BOARDROOM
FINANCIAL STATEMENTS & NOTES
EVRY has 8 807 full-time employees located across Norway, Sweden, Denmark, Finland, India, the United Kingdom, Poland, Ukraine, Latvia, Bulgaria and the USA. EVRY’s head office is located in Fornebu, outside Oslo.
EVRY FINANCIAL SERVICES
EVRY Financial Services is a complete industry vertical and is responsible for the Group’s deliveries to bank and finance customers. The business area offers a broad and comprehensive port-folio of solutions to support banks in their management of continuous change and to facilitate the next generation of banking and payment services.
EVRY has the experience, resources and expertise that banks and financial institutions need to adapt to the changes taking place in the sector. Through its in-depth industry knowledge, EVRY helps its customers to think innovatively and to generate new ideas that change how they operate and compete, with its services ranging from developing the customer experience and helping banks to deploy different open banking initiatives to modernising and simplifying key IT systems and processes.
It is crucial for banks to provide both their customers and employees with user-friendly banking services with state-of-the art functionality.
EVRY’s signif icant investment in next-generation core banking and payment solutions is therefore strategically important for the company. The use of modern architecture and standards ensures that EVRY’s solutions are flexible, cost-effective and adapted to international require-ments. EVRY’s development strategy and implementation methodology are firmly based on the company’s close collaboration with the Banking Industry Architecture Network (BIAN). The solutions can be delivered as SaaS services from EVRY, or as components installed at banks.
EVRY Financial Services has 1 504 employees with in-depth insight into the opportunities and challenges that characterise the bank and finance market. EVRY Financial Services has significant experience from executing major and important projects, giving it the expertise and delivery capabilities needed to deliver on customer requirements.
Our businessEVRY is divided into the following business areas: EVRY Financial Services, EVRY Norway and EVRY Sweden, which are responsible for customer relationships and customer service. EVRY Financial Services delivers services to the banking and finance sector internationally, while EVRY Norway and EVRY Sweden serve all other sectors in their respective markets, with a particular focus on the public and healthcare sectors, retail and logistics, industrial and service companies, and small and medium-sized businesses.
84 | ANNUAL REPORT 2018

EVRY NORWAY
EVRY Norway delivers business-critical solutions to several focused industries within the private and public sectors. Amongst its customers are the largest organisations in Norway. EVRY is the market leader in the small and medium- sized business market. The business area is responsible for approximately 25 percent of all IT service deliveries in Norway.
EVRY is represented in over 20 Norwegian towns and cities. With a customer-centric approach in combi-nation with extensive industry expe-rience and a high level of expertise, EVRY achieves significant digital gains for its customers. EVRY helps custom-ers modernise business processes and make IT operations more efficient and is the force behind a whole range of inno-vations that are shaping and developing Norwegian society every day. In each industry EVRY is a full-service provider of IT services throughout the whole value chain, from infrastructure and operations services to business process systems, applications, consulting services, collaboration solutions and innovation concepts. In the small and medium-sized business segment, EVRY delivers complete and cost-efficient solutions through its extensive local presence. The
company has dedicated teams that know the opportunities and challenges facing local businesses. In addition, EVRY has a unique partner network that ensures its customers have access to leading tech-nology and specialist expertise and the flexibility to choose the best solution for their organisation.
EVRY Norway has 2 187 employees with in-depth insight into the opportu-nities and challenges that characterise the Norwegian market. Thanks to its strong delivery capabilities and dedi-cated teams with extensive experience from large and complex projects, EVRY Norway is an attractive collaboration partner to customers in all the company’s focus industries.
EVRY SWEDEN
Swedish customers want consultants who are technological and commer-cial experts in their sectors and indus-tries. EVRY Sweden's ability to meet the market’s needs with industry specific solutions and a broad spec-trum of innovative services means EVRY Sweden is the no 1 supplier of IT Services to the small and medium-sized business segment in Sweden, while it also occupies a strong position in rela-tion to large public and private sector
organisations. EVRY Sweden has a unique regional presence and its 23 local offices take full responsibility for its customers’ investment in IT, right from identifying their needs through to realising the benefits of their invest-ment and following up on the results. EVRY Sweden offers everything from strategic advice and consulting services through to complete solutions and IT operating services, and has the delivery capabilities to serve small, medium- sized and large customers.
Thanks to its in-depth expertise in busi-ness-critical services, including in data storage, cloud services architecture, IoT, analytics, automation, information logis-tics and application operations, EVRY is able to offer both efficient and reliable infrastructure services and value-adding services, supporting customers in their digital change journeys.
EVRY Sweden has 1 739 employees with in-depth insight into the opportu-nities and challenges that characterise the Swedish market. Thanks to its expe-rience from a range of large and impor-tant projects, EVRY Sweden has strong expertise, innovative solutions and unique local delivery capabilities, all of which are required to meet the needs of the market it serves. >
EVRY has more than 8 800 full-time employees located across Norway, Sweden, Denmark, Finland, India, the United Kingdom, Poland, Ukraine, Latvia, Bulgaria and the USA. EVRY’s head office is located in Fornebu, outside Oslo.
ANNUAL REPORT 2018 | 85
BUSINESS REPORT
FROM THE BOARDROOM
FINANCIAL STATEMENTS & NOTES
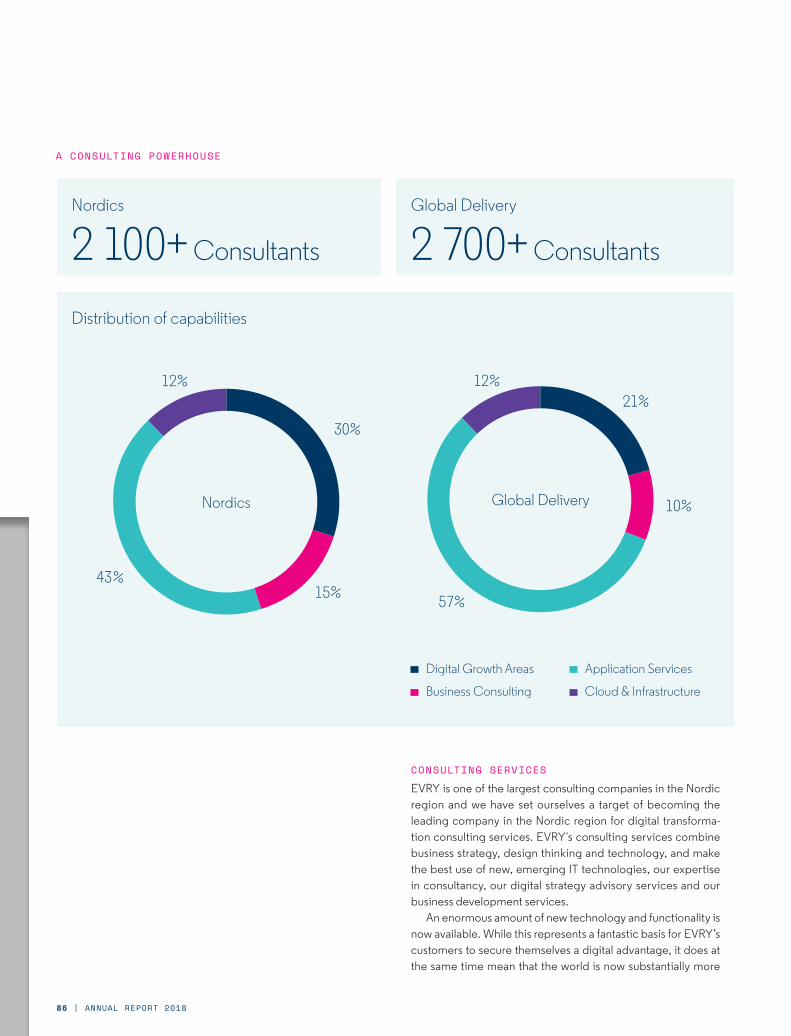
CONSULTING SERVICES
EVRY is one of the largest consulting companies in the Nordic region and we have set ourselves a target of becoming the leading company in the Nordic region for digital transforma-tion consulting services. EVRY´s consulting services combine business strategy, design thinking and technology, and make the best use of new, emerging IT technologies, our expertise in consultancy, our digital strategy advisory services and our business development services.
An enormous amount of new technology and functionality is now available. While this represents a fantastic basis for EVRY’s customers to secure themselves a digital advantage, it does at the same time mean that the world is now substantially more
Digital Growth Areas
Business Consulting
Application Services
Cloud & Infrastructure
12%
30%
15%43%
Nordics
12%21%
10%
57%
Global Delivery
A CONSULTING POWERHOUSE
Nordics
2 100+ Consultants
Global Delivery
2 700+ Consultants
Distribution of capabilities
86 | ANNUAL REPORT 2018

BUSINESS REPORT
complex. Even though advanced technologies are available, all the various options that there are to choose from and the uncertainty that this creates means that adopting new technology is more difficult. This in turn increases the need for good, independent advisors.
In 2018 EVRY reorganised its consulting activities around various areas of expertise. As a result, it has now consolidated its 64 areas of expertise into the following seven areas: Digital Experience, Business Consulting, Business Applications, Cloud & Infrastructure, Application Innovation, Security & Risk, and Artificial Intelligence, Analytics & Insight. This has created a much stronger and more customer-oriented organisation and represents an important step towards becoming a consulting powerhouse that combines business strategy, design thinking and technology.
In Norway, three regional organisational units were consoli-dated into one in 2018. The same step will be taken in Sweden, India and Ukraine in the time ahead. By organising its consult-ing unit virtually on the basis of areas of expertise, EVRY will have bigger and stronger specialist units that function across the company. This will make consultants’ roles more interesting from a professional perspective, and it will also represent a big advantage for EVRY’s customers and collaboration partners.
APPLICATION SERVICES
EVRY’s application services address the need of EVRY’s custom-ers for business solutions by implementing and running systems that are developed by EVRY, by the customer or based on third-party vendor software. The combination of EVRY’s application services together with EVRY Digital Platform Services, which provides in-depth technical competence and expertise in digi-talisation, IT infrastructure and cloud-based delivery models, allows EVRY to take end-to-end responsibility of its customers’ IT services.EVRY’s application services enhance the efficiency of our customers' businesses and make their information more acces-sible. EVRY’s solutions are typically tied to the implementation, development, maintenance and deployment of business systems and processes that are critical in customer value chains. As many customers are focusing on DevOps, EVRY has DevOps platforms that can be implemented for customers as well as expertise that can be utilized. This enables EVRY to take a key role in its custom-ers’ DevOps practice and so help to shorten the system develop-ment lifecycle and provide frequent updates and deployments of new services.
With constant pressure on IT budgets, companies are increasingly seeking to reduce their capital expenditure and to outsource such commitments so they can focus their efforts on their core business and the value their core business generates.
With its in-depth industry knowledge, EVRY can provide addi-tional expertise, bringing experience from other customers to support the entire range of a customer's application portfolio. Whether through a full-service solution that covers application development, application maintenance, application operations and license management for an application or by operating a collection of smaller applications, EVRY’s application services are designed to allow its customers to benefit from the cost effectiveness of large-scale IT operations with both nearshore and offshore resources.
DIGITAL PLATFORM SERVICES
Digital Platform services is a new business area that was set up in 2017 by bringing together Nordic Operations, Cloud Services and Global Delivery. This step has given EVRY a more future- oriented organisation for operations and digital service develop-ment. The new delivery unit is responsible for shared methods, processes and tools and delivers repeatable, scalable services to EVRY Financial Services, EVRY Norway and EVRY Sweden. Digital Platform Services establishes partnerships with leading global companies and develops the partnerships EVRY already has in order to secure new and future-oriented services across all industries.
Digital Platform Services seeks to contribute to accelerated organic growth by investing in expertise and solutions that create significant value for our customers. The unit will be a powerful Nordic unit at the cutting edge of EVRY's service development in strategic areas such as cloud and cognitive technology. Through this strategy, EVRY will quickly enter the market in other attractive growth areas as these develop. As an integral part of its service offering EVRY has entered into strategic partnerships with leading global companies such as Microsoft, Google, IBM, Amazon Web Services, Apple, Facebook and Method.
Digital Platform Services has over 1 000 employees with in-depth technical competence and expertise in digitalisation, IT infrastructure and cloud-based delivery models. Global Delivery, which now is included in Digital Platform Services, has more than 3 000 employees. This division provides offshoring from India and Ukraine, nearshoring from Poland and first-line customer service from Latvia.
ANNUAL REPORT 2018 | 87
BUSINESS REPORT
FROM THE BOARDROOM
FINANCIAL STATEMENTS & NOTES

Group Management
Per HoveC H I E F E X EC U T I V E O F F I C E R – C EO
Experience: Per Hove has been SVP Sales at EVRY, Country Manager Norway and Public Services Director Nordic at HCL Technologies, Managing Director at Oracle, Sales & Marketing Director at TietoEnator, District Manager at Siebel Systems and Account Manager at SAP. He has also held chairman and board member positions at companies such as NamePhonect, SYNQ.fm, Right Consulting and Computas.
Education: A Master’s degree in Management from the BI Norwegian School of Management.
Number of shares*: 356 869
Henrik SchiblerC H I E F F I N A N C I A L O F F I C E R – C FO
Experience: Henrik Schibler has been CFO at ISS Norway, regional CFO at ISS Central Europe, and Finance Manager at ISS Group Operations. He has also worked at the FisherThermo Scientific/Nunc Group and at Egmont.
Education: A Master’s degree in Economics and Business Administration from Copenhagen Business School, with specialisation in Management, Accounting and Control.
Number of shares*: 803 358
Asta Ellingsen StenhagenE X EC U T I V E V I C E P R E S I D E N T,
L EG A L A N D R I S K
Experience: Since joining EVRY in 2014 Asta Ellingsen Stenhagen has held positions as Chief Legal, Head of a finance department and Group Compliance Officer. Before joining EVRY she worked as an attorney, Legal Counsel, and Company (Board) Secretary.
Education: Cand. Jur. from the University of Oslo.
Number of shares*: 38 123
Wiljar NesseE X EC U T I V E V I C E P R E S I D E N T,
E V RY F I N A N C I A L S E R V I C E S
Experience: Wiljar Nesse has been Head of the Bank and Finance business area at EDB Business Partner. He has also worked at Elkem and AP Dow Jones, and as chief executive and part owner of Manamind AS.
Education: A Master’s degree in Business Economics from the Norwegian School of Economics.
Number of shares*: 1 231 157
Daniel Nordstad GrönquistE X EC U T I V E V I C E P R E S I D E N T, S T R AT EGY
Experience: Daniel Nordstad Grönquist joined EVRY in 2016 as SVP Strategic Design Lab. He has been SVP Strategy & CIO at Observer Group, Partner and Director of Strategy & Technology at NormannPartners and Principal at Bekk Management Consulting. Daniel is also on the Board of Center for Service Innovation, NHH.
Education: Master of Science, Computer Science and Human Computer Interaction from the Royal Institute of Technology (KTH, Sweden) and the University of Florida.
Number of shares*: 18 584
Malin Fors-SkjævelandE X EC U T I V E V I C E P R E S I D E N T FO R S A L E S
E XC E L L E N C E
Experience: Malin Fors-Skjaeveland has been Senior Executive at Accenture where she held various position within the management consulting and BPO practice, and Commercial Director at ISS Norway.
Education: Master of Science from NTNU.
Number of shares*: 0
*Shareholdings in EVRY ASA as at 31 December 2018. Shares held by the immediate family and companies over which the shareholder has decisive influence are also included.
88 | ANNUAL REPORT 2018

BUSINESS REPORT
Christian PedersenE X EC U T I V E V I C E P R E S I D E N T, E V RY N O R WAY
( AC T I N G )
Experience: Christian Pedersen has been at EVRY since 2014 and has held several leading positions in the EVRY Norway business area. He has also been Country Manager at Teradata and held positions at Oracle and Sterling.
Education: A Master of Science from the Norwegian University of Science and Technology (NTNU).
Number of shares*: 0
Bengt-Göran KangasE X EC U T I V E V I C E P R E S I D E N T, E V RY S W E D E N
( AC T I N G ) * *
Experience: Bengt-Göran Kangas has been Head of Public Sector in Sweden at CSC and Managing Director and Director Sales to the Public sector at CGI.
Education: A Bachelor of Science in Business Economics and IT from Umeå University.
Number of shares*: 47 600
** Karin Schreil has been appointed Excecutive Vice President EVRY Sweden starting May 2019.
Unni StrømstadE X EC U T I V E V I C E P R E S I D E N T,
G R O U P C O M M U N I C AT I O N S A N D M A R K E T I N G
Experience: Unni Strømstad has been Communication Director and Chief Press Officer at Nordea and held several positions at Eniro, including Nordic Marketing Director and Head of Marketing and Communications in Eniro Norway.
Education: A Master’s degree in Management from the BI Norwegian Business School and a Bachelor’s degree from the University of Oslo.
Number of shares*: 0
Trond VinjeE X EC U T I V E V I C E P R E S I D E N T,
H U M A N R E S O U R C E S
Experience: Trond Vinje has been HR Director at CGI Norway, HR Director at Scandic Hotels, and HR Manager and Quality Manager at ISS Facility Services. He has also held senior management positions at Accenture and the Norwegian Tax Administration, and been a consultant at the PA Consulting Group.
Education: A Master’s degree in Political Science, specialising in Management and Organisation, from the University of Oslo and Manchester Metropolitan University.
Number of shares*: 215 000
Robert Darre-NilsenE X EC U T I V E V I C E P R E S I D E N T, D I G I TA L
P L AT FO R M S E R V I C E S ( AC T I N G ) * * *
Experience: Robert Darre-Nilsen has held several leadership positions at EVRY such as SVP Cognitive Services, SVP Managed Services and VP Operational Excellence. He has also held leadership positions at Adviso AS and at the Telenor Group.
Education: University of Oxford.
Number of shares*: 18 584
***Johan Torstensson has been appointed Executive Vice President Digital Platform Services starting June 2019.
ANNUAL REPORT 2018 | 89
BUSINESS REPORT
FROM THE BOARDROOM
FINANCIAL STATEMENTS & NOTES

EBITA* NOK MILLION
1 58
2
5 76
8
604
13 000
12 500
12 000
11 500
11 000
1 600
1 400
1 200
1 000
800
600
400
ADJUSTED EBITA NOK MILLION
OPERATING REVENUE* NOK MILLION
OPERATING REVENUE NOK MILLION
* incl Global Delivery for the years 2012-2014
7 000
6 000
5 000
4 000
3 000
2 000
201
2
201
4
201
3
201
5
201
6
201
7
201
8
201
2
201
4
201
3
201
5
201
6
201
7
201
8600
500
400
300
200
100
0
of total revenue
46%
EVRY Group
EVRY Norway
201
2
201
2
201
4
201
4
201
3
201
3
201
5
201
5
201
6
201
6
201
7
201
7
201
8
201
8
12 9
12
90 | ANNUAL REPORT 2018

BUSINESS REPORT
of total revenue
27%
of total revenue
27%
EBITA NOK MILLION
EBITA NOK MILLION
4 000
3 500
3 000
2 500
2 000
1 500
201
2
201
4
201
3
201
5
201
7
201
8
201
6
500
400
300
200
100
0
201
2
201
4
201
3
201
5
201
6
201
7
201
845
6
3 39
23
301
248
4 000
3 500
3 000
2 500
2 000
1 500
1 000
400
300
200
100
0
OPERATING REVENUE NOK MILLION
OPERATING REVENUE NOK MILLION
201
2
201
2
201
4
201
4
201
3
201
3
201
5
201
5
201
6
201
6
201
7
201
7
201
8
201
8
EVRY Financial Services
EVRY Sweden
ANNUAL REPORT 2018 | 91
BUSINESS REPORT
FROM THE BOARDROOM
FINANCIAL STATEMENTS & NOTES


From the boardroom05
94EVRY S Board of Directors
96Corporate governance
102Report from the Board of Directors 2018
FROM THE BOARDROOM
FROM THE BOARDROOM
FINANCIAL STATEMENTS & NOTES

The Board of Directors
Göran LindahlC H A I R O F T H E B OA R D
Experience: Göran Lindahl is Chair of the Board of Directors of IKEA Greentech AB and of LivSafe Group. He was the CEO and president of the global technology and engineering group ABB Ltd from 1997 to 2000, and spent more than 30 years in various positions in the ABB Group. Göran has also previously served on the Boards of INGKA Holding BV, Atlas Copco AB, EI du Pont de Nemours and Company, the Sony Corporation, Ericsson and Saab. He has also worked as a special advisor to former UN Secretary General Kofi Annan.
Education: Master’s degree in Electrical Engineering from Chalmers University of Technology in Gothenburg, Sweden.
Rohan HaldeaB OA R D M E M B E R E L EC T E D BY
S H A R E H O L D E R S
Experience: Rohan Haldea is a Partner in the Tech & Telco team at Apax. He joined Apax Partners in 2007 and is based in London. Prior to joining Apax, he was an Associate at Bain Capital in their North American private equity division in New York, where he specialised in evaluating and executing transactions in the industrial, distribution and retail sectors. Haldea has also worked as a consultant at McKinsey in India.
Education: MBA from Harvard Business School and a Bachelor of Technolog in Manufacturing Sciences and Engineering from the Indian Institute of Technology, New Delhi.
Kristin Krohn DevoldB OA R D M E M B E R E L EC T E D BY
S H A R E H O L D E R S
Experience: CEO of the Norwegian Hospitality Association (NHO Reiseliv), Norwegian Minister of Defense 2001 – 2005, Member of the Norwegian Parliament for the Conservative Party 1993-2005, General Secretary of The Norwegian Trekking Association 2006-2013.
Education: Master’s degree from the Norwegian School of Economics (NHH) and Business Administration, and a Bachelor in Sociology from the University in Bergen.
Louise SondergaardB OA R D M E M B E R E L EC T E D BY
S H A R E H O L D E R S
Experience: Louise Sondergaard is a member of the Tech and Telco team at Apax Partners. She joined Apax in 2014 and is based in London. Prior to joining Apax Partners, Louise Sondergaard was an Associate at McKinsey & Company in London, where she primarily worked on restructuring, transformation and strategy topics.
Education: An M.Sc. from London Business School (with distinction) and a BSc in International Business from Copenhagen Business School.
Leif TeksumB OA R D M E M B E R E L EC T E D BY
S H A R E H O L D E R S
Experience: Partner, Vest Corporate Advisors.Extensive banking experience in specialist functions as well as Group Management at DNB over 23 years. International experience through responsibility for all of DNB’s business outside Norway. Industry knowledge within the shipping, oil & gas, seafood, manufacturing, real estate and service sectors. Board member and Chairperson at a large number of corporations such as Yara International ASA (Chair).
Education: Master’s degree in Economics, Norwegian School of Economics (NHH).
Salim NathooB OA R D M E M B E R E L EC T E D BY
S H A R E H O L D E R S
Experience: Salim Nathoo is a Partner in the Tech & Telco team at Apax Partners and is based in London. He joined Apax Partners in 1999 and specialises in the Tech and Telecom space. Prior to joining Apax, Salim Nathoo was a consultant at McKinsey where he specialised in advising clients in the telecom sector.
Education: MBA from INSEAD and an MA in Mathematics from the University of Cambridge.
94 | ANNUAL REPORT 2018

Al-Noor RamjiB OA R D M E M B E R E L EC T E D BY
S H A R E H O L D E R S
Experience: Al-Noor Ramji is Group Chief Digital Officer at Prudential, responsible for developing and executing an integrated, long-term digital strategy for the Group. Before joining Prudential, he worked at Northgate Capital, where he ran the technology-focused funds. He has also worked for Misys, the financial services software group, and held leading technology and innovation roles at BT Group, Qwest Communications, Dresdner Kleinwort Benson and Swiss Bank Corporation.
Education: CFA, B.Sc. Electronics from the University of London.
Malin PerssonB OA R D M E M B E R E L EC T E D BY
S H A R E H O L D E R S
Experience: Malin Persson is a professional non- executive board director and serves on, among others, the boards of Getinge, Peab and Ricardo. Previously Malin has held senior positions mainly in global industrial companies with a particular focus on research & innovation and strategy. Malin has been the President & CEO of Chalmers University Foundation, CEO of Volvo Technology AB and Vice President Corporate Strategy & Business Development in the Volvo Group.
Education: M.Sc. (Tech.), Industrial Engineering and Management, from Chalmers University of Technology, Sweden.
Sigve Sandvik LærdalB OA R D M E M B E R E L EC T E D BY E M P LOY E E S
Experience: Sigve Sandvik Lærdal is currently employed as a Change Manager in EVRY Digital Platform Services. He has several years of experience as a Solutions Advisor from the ITSM Tools Department at EVRY, with responsibility for support function and application management related to the Service Desk tools at EVRY.
Education: Business Administration, Economics from BI Norwegian Business School. Bachelor’s Degree, IT Candidate from Norwegian School of Information Technology. Additionally college courses in HRM – Human Resource Management and Basic Labour Law from Buskerud and Vestfold University College.
Jenny LindhB OA R D M E M B E R E L EC T E D BY E M P LOY E E S
Experience: Jenny Lindh is currently employed as Process Owner of Temp Resource and Time reporting process, Operational excellence, EVRY Sweden. Jenny has broad experience from a lot of companies. She has been acting business manager, team manager, process owner and lecturer.
Education: Master of Education, University of Umeå and Bachelor in Science, University of Stockholm/Umeå.
Tommy Sander AldrinB OA R D M E M B E R E L EC T E D BY E M P LOY E E S
Experience: More than 30 years of experience in Operations and Application Operations (AO/AM) on mainframe systems, mainly in Financial Services. Specialist in automation, integration and production planning. Leader of the Negotia union at EVRY.
Education: Educated in cybernetics, electronics and computer technology at OIH (OsloMet).
Bente Riis LennertzenB OA R D M E M B E R E L EC T E D BY E M P LOY E E S
Experience: Bente Riis Lennertzen has broad experience from positions such as Acting Business Unit Manager, Core Banking in EVRY Financial Services, Acting head of department, Sales & Business Development, and Product Manager, EVRY.
Education: Bachelor of Education (BoE), Secondary Education and Teaching, Information Technology. Bachelor’s degree, Management Information Systems, General, Information Technology.
ANNUAL REPORT 2018 | 95
FROM THE BOARDROOM
FINANCIAL STATEMENTS & NOTES

Corporate governance
EVRY is committed to sound corporate governance to enable optimal value creation over time. The main objective of
corporate governance is to regulate the division of roles and cooperation between shareholders, the Board of Directors and
executive management.
96 | ANNUAL REPORT 2018
1. IMPLEMENTATION AND REPORTING ON CORPORATE GOVERNANCE
EVRY ASA’s Board of Directors (the “Board”) has the ultimate responsibility for ensuring that the company practices good corporate governance.
EVRY ASA is a Norwegian public limited liability company listed on the Oslo stock exchange. Confidence in EVRY ASA and its business activities as a whole is essential for the Group’s contin-uing competitiveness.
EVRY is committed to openness about its systems and procedures for the management of the Group. This strengthens value creation and builds internal and external confidence, while at the same time promoting an ethical and sustainable approach to business.
EVRY’s website, evry.com, provides relevant information about the compa-ny’s corporate vision and business concept, as well as information on the company’s policy for corporate social responsibility and its Code of Conduct.
As a listed company, EVRY adheres to the Norwegian Code of Practice for Corporate Governance (the Code) issued by the Norwegian Corporate Governance Board (NCGB) and will therefore explain any deviation from the Code.
2. BUSINESS
The business objective of EVRY ASA is defined in Article 3 of the company’s Articles of Association, which states that:“The company’s business is to develop,
manage and operate its own and other parties’ IT solutions, to sell services and consultancy and any activities related to the foregoing. These activities may be carried out by the company itself, by its subsidiaries or through participation in other companies and collaboration with other parties.”
EVRY’s Articles of Association are available on EVRY’s website, evry.com. The Articles of Association were last updated on 20 June 2017.
The Board considers EVRY’s strategy and operational goals annually and ensures that risks related to the company’s business are assessed on a continual basis.
3. EQUITY AND DIVIDEND POLICY
The book value of the Group’s equity at 31 December 2018 was NOK 2 984 million, representing an equity ratio of 25.7 percent. The Group’s capital adequacy is kept under constant review in relation to its objectives, strategy and risk profile.
The company’s objective is to generate a return for its shareholders through dividends and increases in the share price that is at least in line with the return available on similar investment oppor-tunities of comparable risk. The Board proposes a dividend if it is satisfied that this will not have an adverse effect on the company’s future growth ambitions and capital structure. The company intends to pay dividends based on a pay-out ratio of around 60 percent of >
OUR PRINCIPLES ARE:
> EVRY will provide open, reliable and relevant communication to the outside world about the company’s activities and its corporate governance.
> EVRY’s Board of Directors will be independent of the Group’s executive management and ensure a clear division of responsibility between the Board of Directors and the executive management.
> EVRY will ensure that there are no conflicts of interest between the interests of its shareholders, the members of its Board of Directors and its executive management.
> EVRY will treat all shareholders equally.
ANNUAL REPORT 2018 | 97
FROM THE BOARDROOM
FINANCIAL STATEMENTS & NOTES

EVRY’s Adjusted Net Income. The proposal to pay a dividend in any year is further subject to any restrictions under the Company's borrowing arrangements and/ or other contractual arrangements in place at the time. Share buy-backs and/or extraordinary dividends are eval-uated on a case by case basis and need to be approved by the company’s Board of Directors and the General Meeting/ Extraordinary General Meeting.
For the 2018 financial year, the Board will propose a dividend of NOK 1.75 per share, equivalent to approximately NOK 469 million.
Pursuant to a resolution passed at the annual general meeting held on 3 May 2018, the Board is authorised to increase the company's share capital in connection with investments, general corporate purposes and transactions by up to NOK 64 891 063. The Board is also authorised to increase the share capital in connection with incentive programs by up to NOK 1 730 428. These authori-sations are valid until the annual general meeting in 2019, but not beyond 30 June 2019. The company did not issue any new shares during 2018. The company held 1 501 744 own shares at the end of 2018.
4. EQUAL TREATMENT OF SHAREHOLDERS AND TRANSACTIONS WITH CLOSE ASSOCIATES
EVRY ASA has only one class of shares. The Articles of Association do not impose any restrictions on voting rights and all shares have equal voting rights.
EVRY’s Board and executive manage-ment are committed to treating all the company’s shareholders equally. At the end of 2018, Lyngen Holdco S.A.R.L. held 54.3 percent of the share capital of EVRY ASA. The remaining share capital was spread among 4 119 private and institutional shareholders. The Board will obtain independent valuations for any material transactions between the company and its shareholders, parent companies of its shareholders, members of the Board, executive personnel or any
close associates of such parties. In 2018 EVRY ASA purchased a total
of 1 501 744 of its own shares. All such purchases were completed at the stock exchange at prevailing market prices. A total of 80 756 of these shares were used for the purpose of the EVRY ASA share matching program for board members.
The company has guidelines in place to ensure that members of the Board and executive personnel notify the Board if they have any material interest, directly or indirectly, in a pending transaction or decision.
5. SHARES AND NEGOTIABILITY
EVRY ASA does not impose any restric-tions on any party's ability to own, trade or vote for shares in the company.
6. GENERAL MEETINGS
The General Meeting is the company’s ultimate corporate body. The Board strives to ensure that the Annual General Meeting (“AGM”) is an effective forum for communication between sharehold-ers and the Board. The AGM is usually held before 1 June each year, and in any case no later than 30 June, which is the latest date permitted by company law.
The notice calling the AGM and any Extraordinary General Meeting is made available on newsweb.no and on the company’s website (evry.com), and is sent to all shareholders no later than three weeks before the meeting. Article 8 of EVRY’s Articles of Association stip-ulates that the supporting documents dealing with matters to be considered at a meeting can be made available on the company’s website rather than being sent to shareholders by post. However, shareholders are still entitled to receive the documents by post upon request if they so wish.
The supporting documentation shall contain relevant information for share-holders to form a view on the matters to be considered. In accordance with the company’s Articles of Association, shareholders wishing to attend a general meeting must notify the company by the
deadline given in the notice calling the meeting, which can be no earlier than two days before the meeting.
Shareholders must give written notice of their intention to attend a general meeting, either by post, electronic regis-tration or e-mail. Shareholders who are unable to attend a meeting are encour-aged to appoint a proxy. The arrange-ments for appointing a proxy allow shareholders to specify how their proxy should vote on each matter to be consid-ered. Representatives from the Board attend general meetings. The executive management is represented at general meetings with, at a minimum, the CEO and normally also the CFO attending. The external auditor attends the AGM.
The Board decides the agenda for general meetings. The main agenda items for the AGM are determined by the requirements of the Public Limited Liability Companies Act. Each general meeting appoints a chairperson for the meeting who will chair the meeting with due attention to shareholders’ rights in accordance with legislation and the company’s Articles of Association. The CEO gives a presentation of the Group at each AGM. The minutes from general meetings are published on newsweb.no and on the EVRY website at evry.com.
7. NOMINATION COMMITTEE
The Nomination Committee’s duties are to nominate candidates for consideration by the AGM for appointment as share-holder-elected members of the Board, including the Chair, and to nominate candidates for appointment as members of the Nomination Committee. The mandate for the Nomination Committee includes guidance on selecting suitable candidates to ensure an appropriate composition of expertise on the Board. The Nomination Committee is also responsible for carrying out an annual review of the remuneration paid to the members and deputy members of the Board and submitting specific proposals in this respect to the AGM.
98 | ANNUAL REPORT 2018

The members of the Nomination Committee are:
> Francisco Menjibar, Chair > Arthur Brothag > Tore Mengshoel
Katharine Ostrow was appointed as a member of the Nomination Committee at the annual general meeting in 2018, but resigned from the Nomination Committee in October 2018.
No members of the Nomination Committee are members of the Board and Tore Mengshoel is independent of the Board and the executive manage-ment of EVRY ASA.
8. BOARD OF DIRECTORS - COMPOSITION AND INDEPENDENCE
With the exception of its employee- elected members, the Board of Directors of EVRY is elected by the Annual General Meeting. The Board of EVRY comprises 12 members. Eight members of the Board are elected by shareholders. The shareholder-elected members have varied and extensive experience of relevant industries and specialist areas, and the members bring experience from both Nordic and international busi-nesses. Five of the shareholder-elected board members are considered by the company to be independent of the company (Göran Lindahl, Kristin Krohn Devold, Leif Teksum, Al-Noor Ramji and Malin Persson), its main shareholders and its material business contacts. The Board does not include any members from the company’s executive personnel. Four members of the Board are elected by employees. The employee-elected members have significant experience of the Group and contribute important perspectives for the Board’s work.
EVRY believes that the Board as a whole represents the best interests of all the company’s shareholders.
The Board has rules on conflicts of interest to ensure that any potential conflicts are identified and handled in a professional manner. The Board’s
guidelines require that members must notify the Chair if the Board is to consider any matter in which they may have a financial interest or are otherwise involved. EVRY does not have a corpo-rate assembly by agreement between the company’s trade unions, Board and executive management.
An up-to-date overview of the members of the Board of EVRY ASA is provided on the company’s website at evry.com.
9. THE WORK OF THE BOARD
The Board has the ultimate responsibility for the management of the Group and for supervising its executive management and its activities in general. This includes developing the company’s strategy and monitoring its implementation. In addition, the Board exercises control functions to ensure that the company manages its finances and risk exposure in a prudent and satisfactory manner.
The CEO is appointed by the Board of Directors. The Board issues a mandate for the work of the CEO. There is an appropriate division of responsibilities between the Board and the CEO. The CEO is responsible for the operational management of the Group. Per Kristian Hove was appointed as the new CEO of EVRY ASA with effect from 19 November 2018.
The Board holds regular meetings, which are held as physical meetings, although members are also able to attend using a digital conference solu-tion. Extraordinary Board meetings are held between the ordinary meet-ings as and when required, and these are generally conducted as telephone conferences. In exceptional circum-stances, Board decisions may be made on the basis of circulating documents. In addition, the Board has appointed an Audit Committee and a Compensation Committee to work on matters in these areas, as well as a Strategy Committee. These sub-committees prepare issues for and provide advice to the full Board in their respective areas.
Audit CommitteeThe Audit Committee is appointed by the Board, and its main responsibilities are to supervise the Group’s systems for internal control, to ensure that the auditor is independent and to ensure that the financial statements give a fair picture of the Group’s financial results and financial condition in accordance with generally accepted accounting practice. The Audit Committee has reviewed the proce-dures for risk management and financial controls in the key areas of the Group’s business activities. The Audit Committee receives reports on the work of the exter-nal auditor and the results of the audit. The Audit Committee also supervises the activities of Group Internal Audit. (see the “Internal Audit” section).
As a part of their review of the Group’s audit services, the Audit Committee initi-ated a tender process in the second half of 2018. Four suppliers of audit services were invited into the process. Based on the tender process, the Board reached its decision at a meeting in February 2019. The Board decided to continue with the current provider, Ernst & Young, as the company’s external auditor. The commit-tee had in total five meetings in 2018.
The members of the Audit Committee are:
> Leif Teksum, Chair > Louise Sondergaard > Sigve Sandvik Lærdal
Compensation Committee The Compensation Committee makes proposals to the Board on the employment terms and conditions and total remuner-ation of the CEO and other executive personnel, in addition to ensuring there are succession plans for the top manage-ment levels at the company. An important part of the work in 2018 was administering the hiring of a new CEO. The committee interviewed external and internal candi-dates and made a proposal of a final candidate to the Board. The committee had in total five meetings in 2018. >
ANNUAL REPORT 2018 | 99
FROM THE BOARDROOM
FINANCIAL STATEMENTS & NOTES

The members of the Compensation Committee are:
> Kristin Krohn Devold, Chair > Göran Lindahl > Salim Nathoo > Bente Lennertzen
Strategy Committee The Strategy Committee assists the Board and executive management with strategic reviews, market and trend anal-ysis, and the early-stage assessment of M&A opportunities. In 2018, the strategy work was discussed by the Board collec-tively, and as such there has not been any separate meetings in the strategy committee.
The members of the StrategyCommittee are:
> Göran Lindahl, Chair > Rohan Haldea > Al-Noor Ramji > Malin Persson
10. RISK MANAGEMENT AND INTERNAL CONTROL
EVRY has a well-established internal control function, which is the founda-tion for the Group’s internal control and risk management systems. EVRY’s internal control and risk management systems consist of a set of policies, procedures and organisational structures and are certified in accordance with the ISO 9001 standard. The internal control and risk management systems consist of processes for EVRY’s strategy, oper-ations, business ethics, legislative and regulatory compliance, and internal and external reporting.
Internal control over financial reporting at EVRY is documented in EVRY’s Governance Risk Compliance (GRC) system. The controls are tested regularly, and continual improvement work is carried out to maintain quality. The ISAE 3402 controls are audited by an external audit partner and provide a Type 2 report annually.
EVRY operates a structured risk management process that includes relevant categories of risk, including
strategic risk, financial risk, reputational risk, operational risk, technical risk, and legislative and regulatory compliance risk. EVRY’s risk management process is based on ISO 31000.
EVRY is not subject to direct super-vision by Finanstilsynet (the Financial Supervisory Authority of Norway), but Finanstilsynet can exercise control over the Group through the banks that are customers of the company (the ICT Regulations).
EVRY complies with GDPR, which entered into force in the EU/EEA in 2018. EVRY ensures its own personal data as well as that of its customers is protected and the company has its own designated Data Protection Officer.
Businesses and individuals across the world are facing security threats more than ever before. Cyber security has in recent years become a pressing issue. On the basis of these general negative developments, the safeguarding of infor-mation security is a high priority at EVRY, and the company is certified in accord-ance with ISO 27001 (incl. ISO 27002).
CertificationsOur customers often require us to be certified in accordance with specific standards. EVRY typically meets such requirements by undergoing third-party audits and obtaining certifications. For the purposes of independence, we have undergone third-party audits and obtained certification´s as indicated in the table below.
Business ethics EVRY has a Compliance function, which is responsible for work on business ethics issues. The Compliance function consists of the Group Compliance Officer together with Compliance Managers who are assigned to the Group’s different business areas and geographies. The key responsibility of the Compliance function is to identify risks, design and implement controls, monitor and report on the effectiveness of those controls to management, to resolve compliance difficulties as they occur, and to advise the Group on rules and controls.
The Group carries out annual processes to ensure all business areas are familiar with and comply with the Code of Conduct. All employees, including employees of wholly owned subsidiary companies, are required to re-confirm yearly that they have read and understood the Code of Conduct. All new employees are provided with an introduction to the Code of Conduct as part of their training program and must sign a declaration confirming they have read and understood it. In addition, all EVRY’s suppliers and sub-contractors must accept EVRY’s Supplier Conduct Principles when entering into an agree-ment with the company.
EVRY operates whistle-blowing chan-nels for employees to use in the event that they wish to report serious concerns or possible breaches of EVRY’s Code of Conduct, or if they require advice in relation to ethical matters. The whis-tle-blowing channels can be easily
Business Area Standard Valid until
BA Norway ISO 9001 Quality Assurance 06.11.2021ISO 14001 Environment 06.11.2021ISO 27001 Information security 06.11.2021
BA Sweden ISO 9001 Quality Assurance 06.11.2021ISO 14001 Environment 06.11.2021ISO 27001 Information security 06.11.2021
Digital Platform Services ISO 9001 Quality Assurance 06.11.2021ISO 14001 Environment 06.11.2021ISO 27001 Information security 06.11.2021
Financial Service Operations ISO 9001 Quality Assurance 06.11.2021ISO 27001 Information security 06.11.2021PCI Yearly
EVRY Group ISAE 3402 Type 2 report Yearly
100 | ANNUAL REPORT 2018

accessed by all employees via EVRY’s intranet and email ([email protected]). The Compliance function also has entered into an agreement with an external partner under which the partner manages a whistle-blowing channel for EVRY that offers full anonymity and allows users to enter into written dialogue and to exchange information without losing their anonymity. Employees, customers, suppliers and other third parties are all able to use the whistle-blowing channel anonymously. A total of 32 cases were reported and investigated in 2018, and the requisite action was taken. The major-ity of the cases that were reported related to the working environment, employee relations, and compliance with internal procedures. In 2018, the company devel-oped a new e-learning program that will seek to train all employees in EVRY’s Code of Conduct and general business ethics, which will be launched in 2019.
Internal audit The Board has established an independ-ent and objective internal audit function, Group Internal Audit (GIA). GIA exam-ines corporate governance, risk manage-ment and the management and control of EVRY’s business processes. GIA’s mandate covers all operations at EVRY and its majority-owned subsidiaries.
A risk-based audit plan is drawn up annually and approved by the Board based on recommendations from the Audit Committee. In 2018 GIA scrutinized inter alia the operations and governance processes of selected subsidiaries, the management of the transition and trans-formation program, CRM governance, and the management of customer contracts. A total of 13 internal audits were carried out in 2018, seven of which were carried out by EVRY’s internal audit partner at EVRY India.
GIA’s observations and recommen-dations are intended to reduce risk, increase efficiency and improve EVRY’s processes. It is the responsibility of the management team concerned to put in place appropriate action plans based on the recommendations made by GIA.
An important aspect of GIA’s internal audit process is reviewing these action plans until such point as all GIA’s recom-mended remediation measures have been implemented.
GIA also coordinates its activities and relays on the work of other assurance providers to ensure proper coverage and minimize the duplication of efforts. The main responsibility for security and data privacy audits lies with Group Security, Quality & Risk. Furthermore, GIA supports Group Compliance with the investigation of whistle-blower cases to ensure the control weaknesses are identified and the processes concerned are improved.
GIA reports the results of its audit activities and the status of its action plans to the Audit Committee at least twice a year, with the Audit Committee in turn reporting to the Board. Whenever the Audit Committee deems it necessary, GIA will also attend Board meetings.
Annual review by the Board The Board receives regular reports on risk management at its meetings, through routine financial reporting and the executive management’s reports on each business area.
This reporting has not been performed as a pure annual review contemplating all major group risks and areas of exposures included in one report. In 2019 a group risk reporting routine will be implemented.
11. REMUNERATION OF THE BOARD OF DIRECTORS AND THE NOMINATION COMMITTEE
The remuneration paid to the members of the Board is decided by the AGM based on recommendations from the Nomination Committee.
The notes to the financial statements for 2018 provide information on the remuneration paid to the Board in 2018.
12. REMUNERATION OF EXECUTIVE PERSONNEL
The Board has prepared a statement on the remuneration of executive personnel
in accordance with the applicable legisla-tion. Please refer to this statement, which is included in this annual report, for infor-mation on the remuneration of executive personnel.
13. INFORMATION AND COMMUNICATIONS
EVRY ASA has produced guidelines for its communication activities, its market reporting activities, and its communica-tion activities in relation to shareholders outside general meetings. These guide-lines emphasise the need for transpar-ency and to provide shareholders and the market with equal access to information.
14. TAKE-OVERS
EVRY ASA has put in place guiding prin-ciples for how it will act in the event of a take-over bid. Pursuant to these princi-ples (i), the Board shall not seek to hinder or obstruct any takeover bid for the Company’s operations or shares unless there are particular reasons for it to do so; (ii) the Board shall not undertake any actions intended to give shareholders or others an unreasonable advantage at the expense of other shareholders or the Company; (iii) the Board shall not institute measures with the intention of protecting the personal interests of its members at the expense of the interests of sharehold-ers; and (iv) the Board must be aware of the particular duty it has for ensuring that the value of the company and the inter-ests of its shareholders are protected. The Board shall also ensure that the share- holders have sufficient information and time to assess any take-over offer.
15. EXTERNAL AUDITOR
Ernst & Young is the external auditor for the EVRY group. The auditor attends at least one meeting each year with the Board at which the company’s manage-ment is not represented. The auditor participates at meetings of the Board that consider the financial statements and participates at all meetings of the Audit Committee.
The Board requests at least yearly that the auditor confirm its independence.
ANNUAL REPORT 2018 | 101
FROM THE BOARDROOM
FINANCIAL STATEMENTS & NOTES

2018
Report from the Board of Directors
In 2018 EVRY delivered a year in which it generated a solid cash flow and grew its EBITA in nominal terms for the third year in a row. A combination of major new wins and numerous small and medium-sized contracts resulted in solid growth in its order backlog. EVRY also launched
several projects within emerging technologies and digital growth areas, giving it a robust platform for the future.
102 | ANNUAL REPORT 2018

The application services area was the main driver of growth in 2018, but EVRY also experienced very positive momentum in its consultancy activities. The demand for digital consultancy services is high, and 2018 demonstrated EVRY's position in the Nordic market, as over the course of the year it initiated and completed several consulting projects within emerging technologies and digital growth areas. EVRY has over the last few years managed to change its business mix to include relatively more higher margin services, with less basic infra-structure services and a higher volume of value-added Application Services.
At EVRY, there are more than 2 100 consultants across the Nordics and close to 5 000 consultants in total (includ-ing Global Delivery). The ambition for EVRY’s consulting business is to expand and focus on defined key practice areas, which fall under digital consulting services and application services. These services are delivered on top of the digital platform services that create repeatable and scalable solutions together with EVRY’s partners.
EVRY’s consolidated operating revenue for 2018 was NOK 12 912 million, an increase of NOK 316 million from NOK 12 596 million in 2017. After adjusting for exchange rate effects and company acquisitions and sales, organic revenue growth was 3.0 percent.
The Group’s operating result before amortisation of customer contracts, write-downs of intangible assets and other income and expenses (normalised EBITA) was NOK 1 582 million in 2018 as compared to NOK 1 569 million in 2017. The normalised EBITA margin was 12.3 percent in 2018, compared to 12.5 percent in 2017.
The Group’s cash conversion ratio was 86.2 percent in 2018, a decrease of 5.4 percentage points from 2017. The Group’s free cash flow (adjusted for other income and expenses) was NOK 997 million in 2018, compared to NOK
913 million in 2017.The Group’s order backlog at the end
of December 2018 was NOK 19.4 billion, of which NOK 7.8 billion (38 percent) is due for delivery in 2019. The Group’s order backlog at the end of December 2017 totalled NOK 18.0 billion. The backlog at year-end 2018 is not solely the result of a year in which EVRY won some big contracts. The backlog under-lines the trend and fact that customers in general are changing their purchasing behaviour, with customers choosing to undertake small and medium-sized projects rather than entering into large and complex agreements.
Earnings per share for 2018 was NOK 1.73 as compared to NOK -0.82 in 2017. Adjusted earnings per share for 2018 was NOK 2.89 as compared to NOK 2.82 in 2017.
For more detailed information see page 74-75 “Key Figures, Definitions, Alternative Performance Measures”.
FINANCIAL STATEMENTS
Operating revenueEVRY’s consolidated operating revenue for 2018 was NOK 12 912 as compared to 12 596 million in 2017, representing organic revenue growth of 3.0 percent. This growth was driven by higher revenue in the Application Services area, while revenue was lower in the infrastruc-ture services area. The growth achieved in applications services was largely in EVRY Financial Services.
Operating result before amortisation of customer contracts and write-downs of intangible assets (EBITA)The Group’s operating result before amortisation of customer contracts (EBITA) for 2018 was a profit of NOK 1 022 million as compared to a profit of NOK 353 million in 2017. In 2018 EBITA was impacted by other income and expenses totalling NOK 560 million, of which NOK 545 million was related to the partner agreement with IBM and >
ANNUAL REPORT 2018 | 103
FROM THE BOARDROOM
FINANCIAL STATEMENTS & NOTES

NOK 15 million to provisions related to EVRY´s former CEO. EBITA was nega-tively impacted in 2017 by other income and expenses totalling NOK 1 215 million, NOK 941 million of which amount relates to the IBM contract and NOK 241 million to transaction costs associated with EVRY’s IPO and refinancing in 2017. See Note 2 to the consolidated financial state-ments for a more detailed breakdown of other income and expenses. After adjust-ing for other income and expenses, the Group reported an EBITA of NOK 1 582 million in 2018 as compared to NOK 1 569 million in 2017.
Depreciation and write-downs of tangible assets and in-house developed software amounted to NOK 230 million in 2018, with depreciation of in-house devel-oped software accounting for NOK 57 million of this amount. On a comparable basis, depreciation amounted to NOK 276 million in 2017, with depreciation of in-house developed software accounting for NOK 56 million of this amount.
The Group’s operating result (EBIT) in 2018 was NOK 1 021 million, compared to NOK 339 million in 2017.
Net financial items and result for the year before and after tax The Group had net financial expenses of NOK 231 million in 2018, a decrease of NOK 442 million from NOK 673 million in 2017. The net financial expenses in 2017 were driven by the refinancing of the Group’s debt facilities completed in connection with the IPO in June 2017, where refinancing costs added up to NOK 313 million. Additionally, the reduc-tion in net financial expenses in 2018 was due to significantly lower leverage during the year compared to 2017. The net financial expenses were positively impacted by an agio effect of NOK 13 million in 2017, compared to a negative effect of NOK 27 million in 2018.
The Group’s result before tax was a profit of NOK 791 million in 2018. The Group’s tax expense for the year totalled NOK 151 million in 2018, representing an effective tax rate of 19.1 percent. The
result for the year for 2018 was a profit of NOK 640 million.
On a comparable basis the Group's result before tax in 2017 was a loss of NOK 333 million. The Group’s tax expense for the year totalled NOK 72 million in 2017, representing an effective tax rate of 21.6 percent. The result for the year for 2017 was a loss of NOK 2 61 million.
Cash flow and financial position Net cash flow from operations in 2018 was NOK 713 million as compared to nega-tive NOK 495 million in 2017. Adjusted operational cash flow in 2018 was NOK 1 374 million, compared to NOK 1 272 million in 2017. The operational cash flow in both 2017 and 2018 was negatively impacted by payments to IBM in relation to the transformation and transitions projects, as well as the IPO and refinancing process in 2017.
Net operational investments for 2018 amounted to NOK 377 million, compared to NOK 359 million in 2017. Investment in tangible assets amounted to NOK 138 million in 2018, while investment in in-house developed software amounted to NOK 260 million. The corresponding figures in 2017 were NOK 176 million and NOK 206 million respectively. The investments in in-house developed soft-ware mainly relate to EVRY Financial Services and the development of new core banking and payment solutions built on industry standards such as ISO 20022, SOA and BIAN that are suitable for the international market. Investment in group companies amounted to NOK 157 million in 2018, the majority of which amount relates to the acquisition of Findwise AB and Exonor Group in Sweden, and to the acquisition of the remaining 10 percent of the shares in EVRY Financing AS.
Net cash flow from financing activities in 2018 was negative NOK 414 million. Net cash flow from financing in 2017 was NOK 770 million, because of the IPO process and refinancing completed in June 2017.
The Group reports liquidity reserves of NOK 2 246 million at the end of 2018, of
104 | ANNUAL REPORT 2018
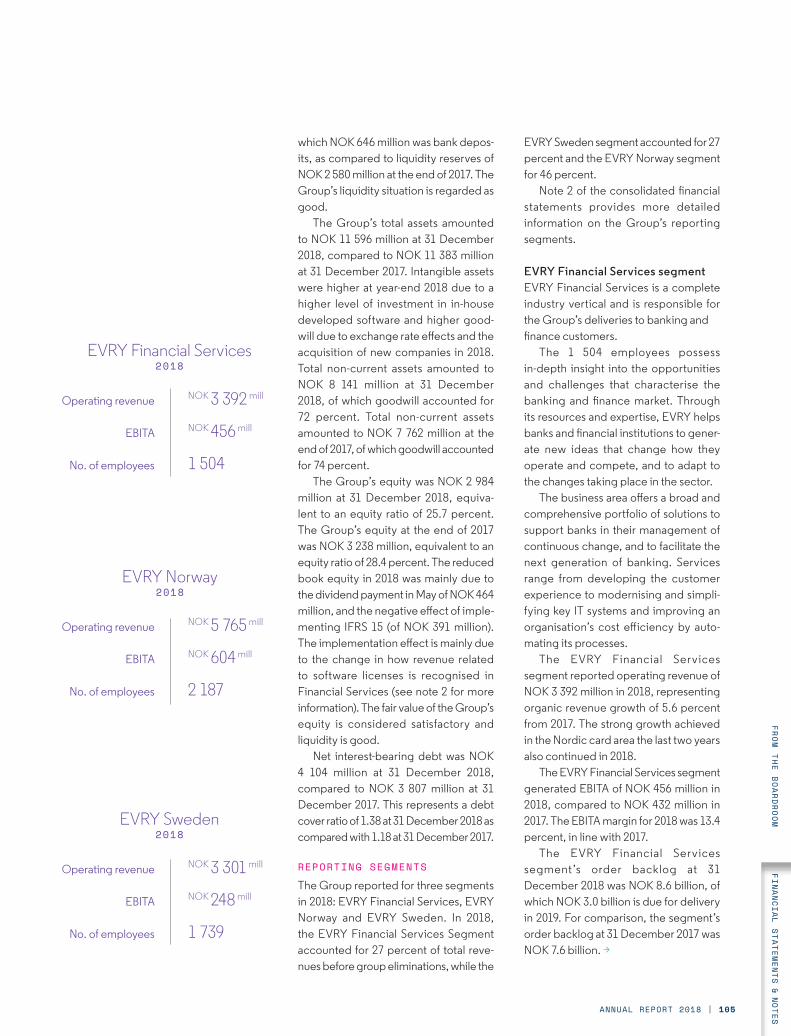
which NOK 646 million was bank depos-its, as compared to liquidity reserves of NOK 2 580 million at the end of 2017. The Group’s liquidity situation is regarded as good.
The Group’s total assets amounted to NOK 11 596 million at 31 December 2018, compared to NOK 11 383 million at 31 December 2017. Intangible assets were higher at year-end 2018 due to a higher level of investment in in-house developed software and higher good-will due to exchange rate effects and the acquisition of new companies in 2018. Total non-current assets amounted to NOK 8 141 million at 31 December 2018, of which goodwill accounted for 72 percent. Total non-current assets amounted to NOK 7 762 million at the end of 2017, of which goodwill accounted for 74 percent.
The Group’s equity was NOK 2 984 million at 31 December 2018, equiva-lent to an equity ratio of 25.7 percent. The Group’s equity at the end of 2017 was NOK 3 238 million, equivalent to an equity ratio of 28.4 percent. The reduced book equity in 2018 was mainly due to the dividend payment in May of NOK 464 million, and the negative effect of imple-menting IFRS 15 (of NOK 391 million). The implementation effect is mainly due to the change in how revenue related to software licenses is recognised in Financial Services (see note 2 for more information). The fair value of the Group’s equity is considered satisfactory and liquidity is good.
Net interest-bearing debt was NOK 4 104 million at 31 December 2018, compared to NOK 3 807 million at 31 December 2017. This represents a debt cover ratio of 1.38 at 31 December 2018 as compared with 1.18 at 31 December 2017.
REPORTING SEGMENTS
The Group reported for three segments in 2018: EVRY Financial Services, EVRY Norway and EVRY Sweden. In 2018, the EVRY Financial Services Segment accounted for 27 percent of total reve-nues before group eliminations, while the
EVRY Sweden segment accounted for 27 percent and the EVRY Norway segment for 46 percent.
Note 2 of the consolidated financial statements provides more detailed information on the Group’s reporting segments.
EVRY Financial Services segmentEVRY Financial Services is a complete industry vertical and is responsible for the Group’s deliveries to banking andfinance customers.
The 1 504 employees possess in-depth insight into the opportunities and challenges that characterise the banking and finance market. Through its resources and expertise, EVRY helps banks and financial institutions to gener-ate new ideas that change how they operate and compete, and to adapt to the changes taking place in the sector.
The business area offers a broad and comprehensive portfolio of solutions to support banks in their management of continuous change, and to facilitate the next generation of banking. Services range from developing the customer experience to modernising and simpli-fying key IT systems and improving an organisation’s cost efficiency by auto-mating its processes.
The EVRY Financial Services segment reported operating revenue of NOK 3 392 million in 2018, representing organic revenue growth of 5.6 percent from 2017. The strong growth achieved in the Nordic card area the last two years also continued in 2018.
The EVRY Financial Services segment generated EBITA of NOK 456 million in 2018, compared to NOK 432 million in 2017. The EBITA margin for 2018 was 13.4 percent, in line with 2017.
The EVRY Financial Services segment’s order backlog at 31 December 2018 was NOK 8.6 billion, of which NOK 3.0 billion is due for delivery in 2019. For comparison, the segment’s order backlog at 31 December 2017 was NOK 7.6 billion. >
Operating revenue
EBITA
No. of employees
Operating revenue
EBITA
No. of employees
Operating revenue
EBITA
No. of employees
EVRY Financial Services2018
EVRY Norway2018
EVRY Sweden2018
NOK 3 392 mill
NOK 456 mill
1 504
NOK 5 765 mill
NOK 604 mill
2 187
NOK 3 301 mill
NOK 248 mill
1 739
ANNUAL REPORT 2018 | 105
FROM THE BOARDROOM
FINANCIAL STATEMENTS & NOTES

EVRY Norway segmentThe EVRY Norway segment offers consulting, infrastructure and operating services. EVRY Norway has a significant position in the local government and healthcare sectors, and is currently strengthening its position in other indus-tries including retail, oil and gas, and insurance. Through its extensive activi-ties, EVRY Norway has in-depth techni-cal expertise in specialist services that are independent of geographic location and sector. This includes growth areas such as mobility, cloud-based solutions and Business Intelligence.
The EVRY Norway segment reported operating revenue of NOK 5 765 million in 2018, in line with operating revenue in 2017.
The EVRY Norway segment gener-ated EBITA of NOK 604 million in 2018, representing an EBITA margin of 10.5 percent. For comparison, EBITA was NOK 603 million in 2017, representing an EBITA margin of 10.5 percent.
The EVRY Norway segment’s order backlog at 31 December 2018 was NOK 7.4 billion, of which NOK 3.0 billion is due for delivery in 2019. For compari-son, the segment’s order backlog at 31 December 2017 was NOK 6.9 billion.
EVRY Sweden segmentThe EVRY Sweden segment offers everything from strategic advice and consulting services through to solutions and IT operating services. EVRY Sweden offers a significant portfolio of industry vertical solutions that combine indus-try-specific insight and business under-standing with technological expertise. EVRY Sweden also delivers specialist services independent of geographic location and sector based on strong specialist expertise, for example ERP solutions, mobility, cloud-based solutions and Business Intelligence. EVRY Sweden also has its own operating services organ-isation, which focuses on medium-sized businesses and entities in the private and public sectors.
The EVRY Sweden segment reported
operating revenue of NOK 3 301 million in 2018 as compared to NOK 3 312 million in 2017. After adjusting for exchange rate effects, this represents organic revenue growth of 0.2 percent.
The EVRY Sweden segment generated EBITA of NOK 248 million in 2018, repre-senting an EBITA margin of 7.5 percent. EBITA in 2017 was NOK 325 million, with an EBITA margin of 9.8 percent.
The EVRY Sweden segment’s order backlog at 31 December 2018 was NOK 3.3 billion, of which NOK 1.4 billion is due for delivery in 2019. The segment’s order backlog was NOK 3.5 billion at the end of 2017.
Other EVRY’s Global Sourcing activities accounted for approximately 8 percent of the Group’s revenue in 2018. Deliveries from EVRY’s companies in India, Ukraine and Latvia to the Group’s Nordic organisation account for some 40 percent of total revenues for EVRY’s Global Sourcing businesses. The other revenue relates to other customers, and this ensures that the Global Sourcing businesses have a profitable and scalable business model.
THE STRUCTURE OF EVRY IN 2018
EVRY ASA is a public limited liabil-ity company listed on the Oslo stock exchange. The company was converted from a private limited company in connection with its IPO in June 2017. The company’s head office is located in Fornebu in Bærum and it is led by CEO Per Kristian Hove.
The Group mainly carries out its activ-ities through wholly-owned companies in Norway, Sweden, Denmark, Finland, India, the United Kingdom, Poland, Ukraine, Latvia, Bulgaria and USA.
EVRY sees the Nordic region as its natural home market. The company operates from locations in 50 Nordic towns and cities, principally in Norway and Sweden, providing the expertise to serve customers locally. The company is
106 | ANNUAL REPORT 2018

committed to operating with a decentral-ised organisational structure that is able to respond rapidly to customers, and has therefore ensured that decision-making authority is delegated appropriately. The company considers it very important to ensure that the local offices can draw upon the expertise and strengths that the Group as a whole represents. This is achieved through appropriate organ-isational and reporting arrangements and a group-wide program, as well as through arrangements for marketing and customer relationship management. In addition to its activities in the Nordic region, EVRY has wholly-owned compa-nies in India, Ukraine and Latvia that represent a major part of the company’s overall delivery capacity. In order to make the best possible use of this competence base, thus EVRY´s compa-nies in India and Ukraine also have signif-icant customer portfolios in addition to their deliveries to EVRY for its Nordic customers.
CORPORATE GOVERNANCE
The Board of Directors at EVRY is commit-ted to sound corporate governance, as this increases confidence in the company and contributes to the highest possible value creation over time. The main objective of corporate govern-ance is to regulate the division of roles and cooperation between shareholders, the Board of Directors and executive management.
EVRY’s general corporate govern-ance principles are based on maintaining open and reliable lines of communica-tion and having a Board that is autono-mous and independent of the Group management. There is a clear division of responsibility between the Board and the executive management , and emphasis is placed on the equal treatment of all shareholders. Further information on the company’s corporate bodies and their function and work can be found in the Corporate Governance report on page 96 of this annual report.
WORKING ENVIRONMENT, THE EXTERNAL ENVIRONMENT AND DIVERSITY
Implicit in EVRY’s new value proposition, “Shape the future today”, is the belief that EVRY can help bring about positive change for the future. This applies to EVRY as a company, to its decision- making bodies and to managers and employees across the organisation. Social responsibility is achieved by group-wide targets, the commitment of individual employees, and close cooperation with customers. The task is to minimize EVRY’s impact on the environment and to maximise the positive impact the company has on the environment, working conditions, society, and customer satisfaction. EVRY makes its contribution to creating a low-carbon society by implementing measures involving its own operations, but also >
EVRY was converted from a private limited company in connection with its IPO in June 2017.
ANNUAL REPORT 2018 | 107
FROM THE BOARDROOM
FINANCIAL STATEMENTS & NOTES

most importantly by working in collab-oration with customers on creating a sustainable future. Annual targets are set for these areas, with reports submitted to the executive management team.
EVRY focuses on encouraging a working environment that is free of discrimination, whether on grounds of religion, skin colour, gender, sexual orientation, age, functional disability, or national or ethnic origin. The Norwegian part of the Group has entered into an agreement for “Inclusive Working Environment” (the IA Agreement) to strengthen the focus on working envi-ronment programs, measures to reduce absence due to sickness, and diversity. The Group collaborates with Telenor Open Mind and routinely offers work experience placements for individuals with disabilities.
See the “Business plan” section of this report (pages 28-63) for further infor-mation on the working environment, absence due to sickness, diversity and the external environment.
RISK EXPOSURE AND RISK MANAGEMENT
The overall objective of risk management at EVRY is to identify and quantify risks to provide a basis for decision making. Risk management is an important aspect for value creation by ensuring that risk expo-sure is taken into account.
Risk management is an integral part of the company’s management model and of its financial reporting. Risks that the business units consider to be mate-rial are monitored as part of the executive management’s routine supervision of the business areas and key financial metrics. Systematic risk management is a part of the Group’s business processes.
EVRY has structured and organised its approach to risk management through Enterprise Risk Management (ERM), which embeds risk management into businesses as a part of activities at every level. ERM ensures a shared under-standing of the concept of risk, defines a group-wide methodology for identify-ing, assessing, managing and monitoring risks, and also stipulates risk acceptance
criteria and frames for risk ownership.Risk management includes all catego-
ries of risks such as strategic risk, financial risk, reputational risk, operational risk, technical risk and compliance risk.
EVRY bases its ERM process on ISO 31000:2009. Risk assessment is the overall process of identifying, analysing and evaluating unwanted risks as well as opportunities.
EVRY has established risk reporting procedures in its business areas. This includes reporting the important and crit-ical risk exposure and ensuring that the ownership of the exposure is identified. In addition to producing aggregated risk reporting, this system provides detailed information on vulnerabilities, which risks the vulnerabilities affect, and what meas-ures the organisation has implemented to reduce unacceptable risk exposure. This helps line management to follow up on the status of measures that have been implemented and possible opportunities for both EVRY and our customers.
MARKET RISK
Market risk describes risk from chang-ing market prices and fundamental economic circumstances, such as inter-est rates and exchange rates. EVRY has established a strategy to manage its exposure to exchange rate risk and inter-est rate risk. The strategy is designed to ensure a high degree of predictability and low volatility in annual currency gains/losses and interest costs.
EVRY is mainly exposed to two types of currency risk: contractual obligations denominated in foreign currency as well as foreign investments and future cash flows from these investments. EVRY has both revenue and costs denominated in foreign currencies. This creates some degree of natural hedging between financial transactions denominated in foreign currency. The Group has also established an arrangement for multi-currency bank accounts for the Group. These accounts are used to reduce expo-sure to currency risk at the Group level. The Group hedges future cash flows denominated in foreign currency where the amount is greater than the equivalent
of NOK 50 million. At the end of 2018, the Group had borrowed SEK 1 135 million to hedge its investment in Sweden.
EVRY has established subsidiaries in India and Ukraine, and the revenue of these two companies is mainly denom-inated in euros and US dollars. The Group’s exchange rate risk mainly relates to the Swedish krone, the euro, the US dollar and the Indian rupee.
Interest rate risk is the risk that future cash flows will fluctuate as a result of changes in the general level of interest rates. The Group’s exposure to inter-est rate risk stems mainly from floating interest rates used as a reference for its interest-bearing liabilities. Interest rate risk is managed with financial hedging instruments such as interest rate swaps.
Note 3 of the consolidated financial statements provides more detailed infor-mation on interest rate hedging instru-ments, together with a sensitivity analysis of exposure to currency and interest rate movements.
CREDIT RISK
The Group’s total exposure to credit risk at 31 December 2018 was NOK 2 070 million. This includes accounts receivable and contract assets. The Group’s exposure to counterparty risk is moderated by the fact that it has a wide customer base with its largest custom-ers being companies with good credit ratings. No significant provisions were made for losses on accounts receivable in 2018.
LIQUIDITY RISK
Liquidity risk arises if the cash flows generated by the Group are not sufficient to match its financial liabilities as they fall due. It is group policy to operate with sufficient liquidity reserves. The Group restricts its use of short-term interest-bearing debt, other than its credit facility, in order to reduce its exposure to refinancing risk. Financing for significant corporate acquisitions is evaluated on a case-by-case basis.
The Group monitors its liquidity daily and produces rolling liquidity forecasts to identify liquidity requirements.
108 | ANNUAL REPORT 2018

MARKET OUTLOOK
EVRY’s integrated service offerings and broad experience within the banking domain and in areas such as open banking, core banking, payment solu-tions, ATM, card and mobile payments have placed the company in a unique position. EVRY is now not only the leading provider to financial service companies in the Nordics, but it has also expanded internationally. The fourth quarter of 2018 marked a breakthrough for EVRY’s Financial Services busi-ness in Finland as a result of the new contract it signed with Handelsbanken. For Handelsbanken, EVRY will deliver a complete portfolio of banking solutions, including next-generation core banking and payment solutions. The agreement also covers internet banking for personal and corporate customers, loan manage-ment and back office solutions for Handelsbanken’s employees, as well as a full value chain of card services. This is a major step for EVRY´s and EVRY Financial Services’ Nordic strategy, and will enable the company to take a strong position in Finland and to further grow its
presence in international markets.The substantial changes in market
dynamics related to the digitalisation trend experienced across all market segments require EVRY and its custom-ers to adapt to a new business landscape. EVRY holds an attractive position in this market environment, as it has the consultancy expertise, local knowledge of its customer's markets and the right mix of technological competence. This, in combination with high-value added business solutions and a broad partner ecosystem, allows EVRY to be well positioned to compete with the global players that are entering the Nordic market.
SHAREHOLDER INFORMATION
Lyngen Holdco S.A.R.L., a company indi-rectly controlled by private equity funds managed by Apax Partners LLP, was the largest shareholder in the company with 54.3 percent of the total share capital. There were 4 119 shareholders at 31 December 2018, with 87 percent of the total share capital held by share-holders from outside Norway. Further
information is provided in Note 18 to the consolidated financial statements.
ALLOCATION OF THE 2018 RESULT
EVRY ASA reported a profit for the year of NOK 77 million in 2018, which is allo-cated to other equity.
The company’s dividend policy is to distribute a dividend above 60 percent of the Group’s adjusted Net Profit. Extraordinary dividends may be distributed in particular circumstances, and will be evaluated on a case-by-case basis. A dividend of NOK 1.75 per share is proposed for 2018, equivalent to NOK 649 million.
The Group has prepared its finan-cial statements on the going concern assumption, and the Board confirms in accordance with Section 3-3 of the Norwegian Accounting Act that the going concern assumption is applica-ble. The Group’s reported results, its business strategy and its current budgets and financing, provide the basis for the going concern assumption.
Göran Lindahl CHAIR OF THE BOARD
BÆRUM, 21 MARCH 2019, BOARD OF DIRECTORS OF EVRY ASA
Per Hove CEO
Salim Nathoo
Leif Teksum Al-Noor Ramji Kristin Krohn Devold Tommy Sander Aldrin Sigve Sandvik Lærdal
Bente Riis Lennertzen Jenny Lindh
Rohan Haldea Malin Persson Louise Sondergaard
ANNUAL REPORT 2018 | 109
FROM THE BOARDROOM
FINANCIAL STATEMENTS & NOTES


113Group financial statements & notes
162EVRY ASA financial statements & notes
172Independent auditor's report
Financial statements and notes
06
FINANCIAL STATEMENTS & NOTES

112 | ANNUAL REPORT 2018
Financial statements Group 113
Consolidated statement of comprehensive income 113
Consolidated statement of financial position 114
Consolidated statement of cash flow 116
Consolidated statement of changes in equity 117
Notes Group 118
1 Accounting principles 118
2 Segment information 129
3 Management of capital structure and financial risk 132
4 Financial instruments 134
5 Salaries and personnel costs 138
6 Employee share options 142
7 Pensions 143
8 Cost of goods sold and other operating costs 147
9 Financial items 148
10 Taxes 149
11 Earnings and proposed dividend per share 150
12 Intangible assets 151
13 Property, plant and equipment 153
14 Interests in subsidiaries, associated companies and joint ventures 154
15 Accounts receivable 155
16 Other financial assets 155
17 Bank deposits/guarantee liabilities 156
18 Share capital, shareholders etc. 156
19 Other current liabilities 158
20 Provisions 158
21 Leasing contracts/contractual commitments 159
22 Related parties 161
23 Disputes and other legal matters 161
24 Events after balance sheet date 161
Financial statements EVRY ASA 162
Statement of comprehensive income 162
Statement of financial position 163
Statement of cash flow 164
Statement of changes in equity 165
Notes EVRY ASA 166
1 Accounting principles 166
2 Salaries and personnel costs 166
3 Income from investment in subsidiaries 166
4 Other operating costs 167
5 Financial items 167
6 Taxes 168
7 Guarantee liabilities/group cash management account arrangement 168
8 Shares in subsidiaries 169
9 Intra-group accounts receivables and liabilities 169
10 Share capital, shareholders etc. 169
11 Financial instruments 170
12 Related parties 170
Responsibility statement 171
Independent Auditor’s report 172
Financial statements and notes disclosures

ANNUAL REPORT 2018 | 113
FINANCIAL STATEMENTS & NOTES
(NOK million) Note 2018 2017
Operating revenue 2 12 912.0 12 596.4
Cost of goods sold 8 4 667.1 4 692.7Salaries and personnel costs 5, 6, 7 5 709.8 5 858.8Depreciation and write-down of tangible assets and in-house developed software 12, 13 230.2 275.6Other operating costs 8, 21 1 282.8 1 415.9Operating profit/-loss before amortisation of customer contracts (EBITA) 1) 1 022.1 353.4
Amortisation of customer contracts 12 0.8 14.4Operating profit/-loss (EBIT) 1 021.3 339.1
Financial income 9, 14 12.7 20.5Financial expense 9, 14 217.0 706.2Net foreign exchange gain/-loss 9 -26.5 13.2Net financial items -230.8 -672.5
Profit/-loss before tax 790.5 -333.4
Taxes 10 150.8 -72.1Profit/-loss for the year 639.7 -261.3
Other comprehensive incomeItems which will not be reclassified over profit and loss (after tax)Actuarial gains/-losses on defined benefit pension plans -6.1 -40.5
Items which may be reclassified over profit and loss in subsequent periods (after tax)Cash flow hedges 12.8 99.4Currency translation differences -22.4 49.8Total other comprehensive income 11 -15.7 108.6
Total comprehensive income for the year 624.0 -152.7
Profit/-loss for the year is allocated as follows Owners of the parent 639.7 -262.2 Non-controlling interests - 0.9
639.7 -261.3
Total comprehensive income for the year is allocated as followsOwners of the parent 624.0 -153.6 Non-controlling interests - 0.9
624.0 -152.7
Earnings per share (basic and diluted)Earnings per share, basic (NOK) 11 1.73 -0.82 Earnings per share, diluted (NOK) 11 1.72 -0.82
1) Including amortisation other intangible assets with the exception of customer contracts.
GROUPCONSOLIDATED STATEMENT OF COMPREHENSIVE INCOME
1 January - 31 December

114 | ANNUAL REPORT 2018
(NOK million) Note 2018 2017
Non-current assets Goodwill 12 5 849.5 5 736.1 Deferred tax assets 10 637.9 588.2 Other intangible assets 12 938.9 722.2 Total intangible assets 7 426.3 7 046.4
Leased premises 13 39.4 47.0 Machinery, equipment and fixtures 13, 21 275.0 329.0 Total tangible assets 314.3 376.0
Investment in associated companies and joint ventures 14 78.9 62.7 Other non-current receivables 16 321.0 276.4 Total non-current financial assets 399.9 339.2
Total non-current assets 8 140.5 7 761.6
Current assets Inventories 53.1 50.0 Accounts receivable 15 1 701.2 1 663.3 Other current receivables 16 1 055.9 1 028.1 Bank deposits 4, 17 645.7 880.0 Total current assets 3 455.9 3 621.4
Total assets 11 596.4 11 383.1
GROUPCONSOLIDATED STATEMENT OF FINANCIAL POSITION
As of 31 December

ANNUAL REPORT 2018 | 115
FINANCIAL STATEMENTS & NOTES
(NOK million) Note 2018 2017
Equity Share capital 18 648.9 648.9 Own shares 18 -2.6 - Other paid-in equity 2 192.7 2 588.7 Other equity 144.9 - Non-controlling interests - 1.5 Total equity and non-controlling interests 2 983.9 3 239.2
Liabilities Non-current interest bearing liabilities 3, 4 4 699.8 4 622.4 Non-current non-interest bearing liabilities 4 393.6 12.8 Pension liabilities 7 273.0 265.5 Deferred tax 10 12.3 4.5 Other provisions for liabilities 20 1.9 4.3 Total non-current liabilities 5 380.6 4 909.6
Accounts payable 842.3 933.8 Tax payable 10 15.2 91.3 Deductions and duties payable 1 026.4 986.2 Other current liabilities 19 1 347.9 1 222.9 Total current liabilities 3 231.8 3 234.2
Total liabilities 8 612.5 8 143.8
Total equity and liabilities 11 596.4 11 383.1
GROUPCONSOLIDATED STATEMENT OF FINANCIAL POSITION
As of 31 December
BÆRUM, 21 MARCH 2019, BOARD OF DIRECTORS OF EVRY ASA
Göran Lindahl CHAIR OF THE BOARD
Per Hove CEO
Salim Nathoo
Leif Teksum Al-Noor Ramji Kristin Krohn Devold Tommy Sander Aldrin Sigve Sandvik Lærdal
Bente Riis Lennertzen Jenny Lindh
Rohan Haldea Malin Persson Louise Sondergaard

116 | ANNUAL REPORT 2018
(NOK million) Note 2018 2017
Cash from/to operations: Profit/-loss before tax 790.5 -333.4 Gain/-loss on sale of tangible and intangible assets 7.1 6.2 Tax paid in the period -68.5 -52.4 Depreciation/write-downs 12, 13 231.1 289.9 Net financial Items 9 230.8 672.5 Paid interests -188.5 -395.0 Change in working capital -264.9 -177.1 Other changes 1) -24.4 -505.4 Net cash flow from operations 713.2 -494.7
Cash from/to investmentsInvestment in tangible assets 12, 13 -137.8 -176.3 Investment in in-house developed software 12 -260.5 -206.3 Sale of tangible assets (sales proceeds) 21.5 23.6 Investment in group companies -157.2 -9.0 Net cash flow from investments -534.0 -368.0
Cash from/to financingDraw down of new debt 1 025.0 5 240.0 Repayment of debt -928.1 -7 636.9 Dividends paid -463.8 - Proceeds from equity issued 18 - 3 166.7 Purchase/sale of own shares 18 -47.1 - Net cash flow from financing -414.0 769.7
Changes in foreign exchange rates 0.5 -17.2 Net change in cash flow -234.3 -110.2 Bank deposits at 1 January 880.0 990.2 Bank deposits at 31 December 645.7 880.0
Whereof restricted cash at 31 December - -
1) Other changes relate to changes in non-current receivables, non-current liabilities and non-current provisions.
GROUPCONSOLIDATED STATEMENT OF CASH FLOW
1 January - 31 December

ANNUAL REPORT 2018 | 117
FINANCIAL STATEMENTS & NOTES
Owners of the parent
(NOK million)Share
capitalOwn
shares
Other paid-in captial
Actuarial gains/-
losses on defined benefit
pension plans
Cumulative cash flow
hedges
Cumulative translation
differencesRetained earnings Total
Non-controlling
interestsTotal
equity
Equity at 1 January 2017 467.8 - - -87.8 -78.1 115.1 -224.0 193.2 0.6 193.8Issue of share capital 181.1 2 999.0 3 180.1 - 3 180.1Other comprehensive income -40.5 99.4 49.8 - 108.6 - 108.6Profit/-loss for the year 2017 -262.2 -262.2 0.9 -261.3Sharebased options schemes employees 18.1 18.1 - 18.1Allocation of equity -410.3 410.3 - - -Equity at 31 December 2017 648.9 - 2 588.7 -128.3 21.3 164.9 -57.9 3 237.7 1.5 3 239.2Implementation effect of IFRS 15 -391.2 -391.2 - -391.2Tax rate impact on implementation effect of IFRS 15 -4.8 -4.8 - -4.8Equity at 1 January 2018 648.9 2 192.7 -128.3 21.3 164.9 -57.9 2 841.7 1.5 2 843.3
Transactions with non-controlling interests - -1.5 -1.5Other comprehensive income -6.1 12.8 -22.4 - -15.7 - -15.7Profit/-loss for the year 2018 639.7 639.7 - 639.7Dividend -463.8 -463.8 - -463.8Purchase of own shares -2.6 -42.2 -44.8 - -44.8Sharebased options schemes employees 26.8 26.8 - 26.8Equity at 31 December 2018 648.9 -2.6 2 192.7 -134.4 34.0 142.5 102.7 2 983.9 - 2 983.9
GROUPCONSOLIDATED STATEMENT OF CHANGES IN EQUITY
1 January - 31 December

118 | ANNUAL REPORT 2018
ACCOUNTING PRINCIPLES
1. General informationEVRY ASA is a Norwegian public limited liability company and is subject to the Public Limited Liability Companies Act. The company’s registered office is at Snarøyveien 30A, NO- 1360 Fornebu.
The main activities of the parent company EVRY ASA and its subsidiaries (the ‘Group’) are the sale of software, IT solutions and consulting services, as well as centralised and decentralised operation of IT systems. In addition, the Group offers outsourcing services and services related to data communication, data security and electronic publishing.
The consolidated financial statements have been approved for issuance by the Board of Directors on 21 March 2019 and is subject to approval by the Annual General Meeting on 11 April 2019.
2. Significant accounting policies2.1 Basis of presentationThe consolidated financial statement of EVRY ASA have been prepared in accordance with the International Financial Reporting Standards (IFRS) as published by the IASB and endorsed by the EU.
As permitted by International Accounting Standard (IAS) 1, the statement of comprehensive income is presented on a mixed basis as a blend of expenses by nature and function as this is considered to give the most relevant and reliable presentation for the Group.
The Group’s business is, for internal reporting requirements, divided into three segments, each of which is separately organised and managed. Financial information about the segments and geographic areas of activity is presented in note 3: Segment information.
In preparing the financial statements for the 2018 financial year, the Group has implemented all the new and revised standards and interpretations issued by the IASB and endorsed by the EU that are relevant to its activities and that were in force for the accounting year commencing on 1 January 2018. Several other amendments and interpretations apply for the first time in 2018, but do not have an impact on the consolidated financial statements of the Group. The Group has not early adopted any standards, interpretations or amendments that have been issued but are not yet effective. A review of the standards and interpretations that had not come into force for the 2018 financial year, but that may be relevant for the Group is provided at the end of note 1.
IFRS 15 - Revenue from Contracts with CustomersThe new standard on revenue recognition, IFRS 15 Revenue from Contracts with Customers, was effective from 1 January 2018. The standard replaces existing IFRS revenue requirements. The core principle of IFRS 15 is that revenue is recognised to depict the transfer of promised goods or services to customers in an amount that reflects the consideration to which the entity expects to be entitled in exchange for those goods or services. The standard applies to all revenue contracts and provides a model for the recognition and measurement of sales of some non-financial assets (e.g., disposals of property, plant and equipment). The Group has applied IFRS 15 with effect from 1 January 2018 and has used the modified retrospective transition method. Accordingly, the comparative information for 2017 has not been restated and is presented, as previously reported, under IAS 18, IAS 11 and other interpretations. Additionally, the disclosure requirements in IFRS 15 have not generally been applied to comparative information. Only contracts not completed at 31 December 2017 were subject to transition to IFRS 15.
IFRS 15 has had the following effects on the Groups revenue streams:
• Sale of licenses/right to use in the Financial Services business area - IFRS 15 has resulted in revenue to be recognised over time instead of at a point in time. The implementation effect on equity 1 January 2018 was NOK 391 million.
• Implementation/transition projects – Certain performance obligations are recognised over the contract period instead of over the transition period using the percentage of completion method. There was no material implementation effect on equity 1 January 2018.
Below is the implementation effect specified on the relevant line items:
(NOK million)Deferred tax asset 117Retained earnings 391Deferred income -508
NOTE 1
GROUPNOTES TO FINANCIAL ACCOUNTS

ANNUAL REPORT 2018 | 119
FINANCIAL STATEMENTS & NOTES
Impact on the consolidated statement of financial position (increase/(decrease)
(NOK million)31 December
2017Adjustments
IFRS 151 January
2018
Goodwill 5 736 - 5 736Other intangible assets 1 310 117 1 427Total intangible assets 7 046 117 7 163
Total tangible assets 376 - 376Total non-current financial assets 339 - 339Total current assets 3 621 - 3 621Total assets 11 383 117 11 500
Equity 3 238 -391 2 847Non-controlling interests - 1Total equity 3 239 -391 2 848
Provison for liabilities 274 406 682Non-current non-interest-bearing liabilities 12 - 12Non-current interest-bearing liabilities 4 623 - 4 623Total non-current liabilities 4 910 406 5 317Total current liabilities 3 234 102 3 335Total equity and liabilities 11 383 117 11 500
IFRS 15 requires entities to exercise judgement, taking into consideration all of the facts and circumstances when applying each step of the model to contracts with customers. For EVRY, the main significant judgements made when implementing IFRS 15 related to identifying the performance obligations in bundled deliveries, determining the timing of revenue recognition and assessment of contract costs.
For more information about the Group’s revenue recognition principles, see paragraph 2.3 below.
IFRS 9 - Financial InstrumentsIFRS 9 addresses the recognition, classification, measurement and derecognition of financial assets and financial liabilities, introduces new rules for hedge accounting and a new impairment model for financial assets. This standard replaces IAS 39 Financial Instruments: Recognition and Measurement. IFRS 9 is effective from 1 January 2018.
The Group has implemented IFRS 9 from 1 January 2018 retrospectively. The Group has not had any significant impact on its balance sheet or equity implementing the new standard. All hedging relationships designated under IAS 39 at 31 December 2017 met the criteria for hedge accounting under IFRS 9 at 1 January 2018 and are therefore regarded as continuing hedging relationships.
2.2. Basis for consolidationThe consolidated financial statements include the parent company EVRY ASA and its subsidiaries as of 31 December 2018. Control is achieved when the Group is exposed or has rights, to variable returns from its involvement with the company and has the ability to affect those returns through its power over the company. If the Group ceases to have a controlling influence over a subsidiary, the subsidiary’s assets, liabilities, non-controlling ownership interests and any accrued translation differences are derecognized. The remaining investment at the time that the Group ceased to have a controlling influence is measured at fair value, and any gain or loss is recognised in the consolidated statement of comprehensive income.
Consolidation of a subsidiary begins when the Group obtains control over the subsidiary and ceases when the Group loses control of the subsidiary.
The Group’s comprehensive income is attributed to the parent company’s owners and to the non-controlling interests, even where this causes non-controlling interests to be negative. At the time of acquisition non-controlling ownership interests are calculated either as their portion of identified assets or to fair value. The choice of method is made at the date of acquisition for each business combination. The share of profits is calculated on the basis of the subsidiary’s post-tax profit, as included in the consolidated financial statements.
All intra-group transactions and balances, purchases and sales between companies in the Group and unrealised internal gains are eliminated in the financial statements.

120 | ANNUAL REPORT 2018
2.3 Summary of significant accounting policiesThe significant accounting principles used to prepare the annual financial statements of EVRY ASA are as follows:
Presentation and functional currencyThe Group presents its financial statements in Norwegian kroner (NOK). This is also EVRY ASA’s functional currency. The figures presented in the annual financial statements are in millions of Norwegian kroner unless otherwise stated. Rounding differences may result in amounts and percentages reported do not necessarily adding up to the total shown.
Business combination and goodwillSubsidiaries are accounted for in accordance with the acquisition method, whereby the acquisition cost of the shares is offset against the subsidiary’s equity at acquisition date. Any excess value is allocated to identifiable assets and is depreciated over their useful life. Excess value that cannot be attributed to identifiable assets and liabilities in subsidiaries at the date of acquisition is recognised as goodwill in the statement of financial position. Goodwill acquired in a business combination represents a payment made by the acquirer in anticipation of future economic benefits from assets that are not capable of being individually identified and separately recognised.
Goodwill that arises as a result of a business combination is not amortised. Goodwill does not generate cash flows independently of other assets or groups of assets and is assigned to the cash generating units that are expected to benefit from the synergy effects of the business combination that gave rise to the goodwill. Upon disposal of a business, the business’ proportion of goodwill based on relative fair value is taken into account in calculating the gain or loss on disposal.
The Group carries out goodwill impairment tests if there are any indications that suggest this is necessary, and in any case at least at the end of each year. If there are such indications, the recoverable amount of the asset is estimated in order to determine the extent of the impairment loss. Recoverable amount is defined as the higher of value in use and fair value less costs to sell. Value in use is calculated as net present value of future cash flow from continuing use, including cash flow arising from eventual disposal. A calculated Weighted Cost of Capital (WACC) is applied as the discount rate used to calculate net present value. Net sales value is calculated as the amount that the company would expect to obtain from the disposal of an asset in an arm’s length transaction between knowledgeable, willing parties, after deducting the estimated costs of disposal.
The smallest unit of a particular asset which can be separately assessed as a valuation unit for the purpose of determining whether there has been a fall in value, is determined by the lowest level at which it is possible to identify incoming cash flow independent of cash flow from other groupings of the same class of asset, the cash generating unit (CGU). In most cases, the Group’s business areas represent the smallest valuation unit, CGU, for this purpose.
An asset is written down to the recoverable amount if the recoverable amount is less than the carrying value before write-down. The write-down is applied first to any goodwill and thereafter to the book value of the unit’s other assets on a proportional basis relative to the book value of the unit’s specific assets. Impairment losses are charged to profit and loss in the period the impairment loss is identified and reduce the carrying value of the asset by an equivalent amount. Impairment of goodwill may not subsequently be reversed, even though the reason for the impairment loss no longer applies.
Investments in associated companies and joint ventureAn associate company is a company over whose financial and operating policy decisions the Group has significant influence. Significant influence is normally deemed to exist where one entity has an ownership interest in another of between 20 % and 50 %.
A joint venture is a joint arrangement in which the parties who have joint control over the arrangement have rights to the net assets of the arrangement. ‘Joint control’ is the contractually agreed sharing of control over a joint arrangement, which exists only when decisions about the relevant activities require the unanimous consent of the parties sharing control.
The Group’s investments in associate companies and joint ventures are recognised in the Group’s accounts using the equity method. When the equity method is used, the investment in the associate company or joint venture is recorded at cost, and the carrying amount is adjusted to recognise the Group’s share of the profit or loss after the date of acquisition. The Group’s share of the profit or loss of the company in which it has invested is recognised in the consolidated income statement. Distributions received by the Group reduce the carrying amount of the investment. Goodwill is included in the cost price of investments in associate companies or joint ventures.
Transactions in foreign currencyTransactions in foreign currencies are translated at the exchange rate at the date of the transaction. Currency gains/losses that arise as result of changes in the exchange rate between the date of the transaction and the payment date are recognised to profit and loss.
Assets and liabilities of foreign subsidiaries that use a functional currency other than Norwegian kroner (NOK) are translated on the balance sheet date at the exchange rate on the accounting period date, while profit and loss items are translated at the daily average exchange rate during the accounting period.

ANNUAL REPORT 2018 | 121
FINANCIAL STATEMENTS & NOTES
Upon disposal of a foreign subsidiary, the cumulative translation difference in respect of the subsidiary is recognised to profit and loss.
Revenue recognitionThe Group recognises its revenues according to IFRS 15 Revenue from Contract with Customers. The revenue is recognised to depict the transfer of promised goods or services to customers in an amount that reflects the consideration to which EVRY expects to be entitled in exchange for those goods or services. EVRY exercises judgement and take all relevant facts and circumstances into consideration when recognising revenue from its contracts with customers.
At contract inception, EVRY identifies the promised goods and services within the contract and determines which of those goods and services are separate performance obligations. EVRY’s performance obligations within the different service lines are described below. EVRY recognises revenue when we satisfy the identified performance obligations by transferring the promised good or service to the customer. The timing of the transfer is determined based on when the customer obtains control over the delivered good or service.
Consulting servicesThe performance obligations within the consulting services are typically consulting hours which are performed over time and thereby will be recognised over time, as the customer simultaneously receives and consumes the benefits of the services. Total hours incurred will be used to measure the progress in the over-time revenue recognition.
For consulting services with fixed prices, the revenue recognition will be made linearly over the contract period. Application servicesIn this service line, sale of licenses and development projects are common performance obligations. Sale of licenses (right to use) that are distinct are recognised at a point in time when the customer is able to use and benefit from the license. Sale of licenses that are part of a bundled contract (right to access) are not distinct and are recognised over the contract period.
Revenue from software developed specifically for customers is recognised over the development period in line with the degree of completion. The degree of completion is calculated on cost as a progress measure.
Infrastructure servicesPerformance obligations in this area are operating services including maintenance services and implementation and transition projects. Where operating services are provided through volume-based contracts, revenue is recognised on the basis of the actual use of services by the customer, or on a linear basis over the period of the contract for term-based contracts. Sales of dialogue services are recognised as revenue on the basis of actual customer usage. Revenue from service and maintenance contracts is recognised in the accounts over the period of the contract, as the customer simultaneously consumes the service and maintenance as it is performed.
Revenue from a transition/implementation project that is an integrated part of a subsequent operating services contract is recognised on a linear basis over the period of the operating services contract as this is when the customer receives and consumes the benefits from the project. Revenue from a transition project that is not related to an operating services contract is recognised when the customer receives and benefits from the project.
Fulfilment servicesSale of software and hardware will be recognised at a point in time when the customer obtains control of the goods, which is assumed to be at delivery.
Variable considerationsSome contracts can have transaction prices which vary based on contract terms. Variable consideration includes discounts, rebates, refunds, credits, price concessions, incentives, performance bonuses, penalties or other similar items. The variable consideration is estimated at contract inception and constrained until the related uncertainty is resolved. For the Group, the most common variable consideration relates to Service Level Agreement (SLA) penalties, volume discounts and price regulations. Variable consideration will be estimated using either an ‘expected value’ or ‘most likely amount’ method, whichever better predicts the consideration to which EVRY will be entitled and will be treated as an adjustment to the transaction price (reduction of revenue). SLA and price regulations are allocated to the service, which is a series of distinct services and will be accounted for as it occurs (SLA) or based on calculations of volume fluctuations (at year-end). Price regulations will not be allocated to services already performed, only prospectively.
122 | ANNUAL REPORT 2018
Warranty obligationsThe revenue standard defines two types of warranties;(i) Assurance-type warranties, and (ii) Service-type warranties
Assurance-type warranties are accounted for in accordance with IAS 37 Provisions, Contingent Liabilities and Contingent Assets, while service-type warranties represent a distinct service and is a separate performance obligation. The Group's contracts do not contain any warranties that could have been sold separately. The Group does not provide any warranties beyond promising that the deliverables meet the agreed specifications, i.e. SLA, and these warranties therefore do not represent separate performance obligations.
Principal versus agent considerationsThe Group often use subcontractors or partners to fulfil its contracts with customers. When using partners or subcontractors, the issue is whether the Group should report revenue based on the gross amount billed (EVRY is the principal) or the net amount retained (that is, the amount billed to the customer less the amount paid to the subcontractor), because the Group has only earned a commission fee (EVRY is the agent). In most cases, the Group is fully responsible for the goods and services delivered towards the customer and has the discretion in setting the prices to the customer and is regarded as principal in the contract.
Contract costsUnder the new standard, there are two types of contract costs where an asset must be recognised;
(iii) incremental costs of obtaining a contract, and (iv) costs incurred in fulfilling a contract
Incremental costs of obtaining a contract (e.g. sales commission) will be recognised as an asset if the Group expects to recover them, either directly through reimbursement, or indirectly through the inherent margin in the contract. Costs such as bid costs, negotiations, meetings and contract writing are not considered incremental and are expensed as incurred, unless they are explicitly chargeable to the customer.
Under IFRS 15, the Group will capitalise the costs to fulfil a contract if they relate directly to the contract, generate or enhance the resources used to satisfy performance obligations and are expected to be recovered. These costs include direct labour, direct materials, allocation of costs directly related to the contract, costs explicitly chargeable to the customer and other costs that are only incurred because the entity entered into the contract. However, costs that relate to past performance or performance obligations that have already been transferred to the customer and have already been expensed, cannot be capitalised. In order for costs to meet the ‘expected to be recovered’ criterion, costs need to be either explicitly reimbursable under the contract or reflected in the pricing on the contract and recoverable through margin.
IFRS 15 requires these costs to be recognised as an asset and amortised on a systematic basis that is consistent with the transfer to the customer of the goods or services to which the asset relates.
Cost of goods soldCost of goods sold comprises directly allocated costs related to the delivery of goods, including maintenance and operational leasing of hardware and software, as well as the cost of consulting services that are directly related to the turnover of the goods. The costs of employing external consultants that are used for the Group’s normal operations and that are re-charged to customers, are classified as cost of goods sold. However, the salary cost related to own employees used in the Group’s normal operations is not part of cost of goods sold.
TaxationTax payable in the financial statement is measured at the amount that the company expects to receive or pay to the tax authorities. The value of deferred tax liabilities/deferred tax assets in the statement of financial position is calculated on the basis of all differences between accounting and taxation values of assets and liabilities (liability method). The amount provided includes all types of difference and is calculated without being discounted to present value. Deferred tax liabilities and deferred tax assets are calculated based on approved tax rates at the time of reporting and netted to the extent that temporary timing differences can be reversed under the same tax system. The tax charge is made up of tax payable and changes in deferred tax liabilities/deferred tax assets.
Deferred tax asset is recognised in the statement of financial position to the extent that it is considered likely that the company in question will have sufficient taxable profit in subsequent periods to make use of the deferred tax asset. At each year end, the Group carries out a review of deferred tax asset not recognised in the statement of financial position and their accounting value. Deferred tax asset not previously recognised in the statement of financial position is recognised to the extent that it appears likely from the review that the company in question will be able to make use of the deferred tax asset. Similarly, companies will reduce the recognised value of deferred tax asset to the extent that they are no longer able to use the tax asset in question.
ANNUAL REPORT 2018 | 123
FINANCIAL STATEMENTS & NOTES
Tax payable and deferred tax liabilities/deferred tax assets are recognised directly to equity to the extent that they relate to items that are recognised directly to equity. Items that are reported as “other comprehensive income” are presented on a post-tax basis in the statement of comprehensive income.
Earnings per share Earnings per share is calculated by dividing the parent company shareholders’ share of the profit/-loss for the year by the weighted average number of ordinary shares outstanding over the course of the period. When calculating diluted earnings per share, the average number of shares outstanding is adjusted for all share options that have a potential dilutive effect.
Classification of current and non-current itemsThe Group presents assets and liabilities in the statement of financial position based on current/non-current classification. An asset is classified as current when it is:
a) Expected to be realised or intended to be sold or consumed in the normal operating cycleb) Held primarily for the purpose of tradingc) Expected to be realised within twelve months after the reporting period, ord) Cash or cash equivalent unless restricted from being exchanged or used to settle a liability for at least twelve months after the
reporting period
The Group classifies all other assets as non-current.
A liability is current when:
a) It is expected to be settled in normal operating cycleb) It is held primarily for the purpose of tradingc) It is due to be settled within twelve months after the reporting period, ord) There is no unconditional right to defer the settlement of the liability for at least twelve months after the reporting period
The Group classifies all other liabilities as non-current.
Contract balances Contract assets: A contract asset is the right to consideration in exchange for goods or services transferred to the customer. If the Group performs by transferring goods or services to a customer before the customer pays consideration or before payment is due, a contract asset is recognised for the earned consideration that is conditional.
Accounts receivable: A receivable represents the Group’s right to an amount of consideration that is unconditional.
Contract liabilities: A contract liability is the obligation to transfer goods or services to a customer for which the Group has received consideration (or an amount of consideration is due) from the customer. If a customer pays consideration before the Group transfers goods or services to the customer, a contract liability is recognised when the payment is made. Contract liabilities are recognised as revenue when the Group fulfils the performance obligation (s) under the contract.
Intangible assets with limited lifeThe Group’s intangible assets with limited life largely consist of capitalised costs related to software developed in-house.
Expenses relating to development are capitalised if the following criteria are met in full:
- the product or process is clearly defined, and its cost elements can be identified and measured reliably- the technical solution for the product has been demonstrated- the product or process will be sold or used in the company’s operations- the asset will generate future economic benefit; and- sufficient technical, financial and other resources for completing the project are present.
When all the above criteria are met, the costs relating to development are capitalised. Costs that have been charged as expenses in previous accounting periods are not capitalised. The evaluation of future commercial benefit is based on the expected license revenue and/or reduction in operating costs that will be achieved by carrying out the project. When calculating the profitability of a project, the estimated future cash flows associated with the project are discounted to present value using a rate of return adjusted for the risk associated with the project in question.
Intangible assets with limited life are amortised over their expected useful life. The amortisation period used is between 1-4 years for intangible assets other than capitalised developments costs. For capitalised development costs the amortisation period is 5-15 years depending on the product type developed.

124 | ANNUAL REPORT 2018
The length of useful life remaining, and the method of amortisation are subject to annual review that takes into account the commercial reality of the intangible asset in question. The Group does not have any intangible assets with unlimited life other than goodwill.
At each reporting date, the Group evaluates if there are indications that intangible assets may be impaired. If there are such indications, the recoverable amount of the asset is estimated to determine the extent of the impairment loss. Impairment losses may subsequently be reversed to the extent that the reason for the impairment no longer applies.
Tangible assetsTangible operating assets are carried in the statement of financial position at historic purchase price less accumulated ordinary depreciation and write-down. When tangible operational assets cease to be used, the historic purchase price and accumulated depreciation are derecognized from the statement of financial position, and any gain or loss this causes are recognised to profit and loss. Depreciation is applied on a straight-line basis, after allowance for disposal value, over the following time periods:
• Leasehold improvements 5-10 years• Machinery/equipment/fixtures 3–7 years• Vehicles 5 years• IT equipment 3–5 years
The economic life and depreciation method used are reviewed regularly to ensure that the method and depreciation period reflect the expected useful life of the assets in question. This also applies to disposal value. The depreciation period for leasehold improvements will at a maximum be the remaining lease period.
Tangible assets are reviewed for impairment annually and whenever events or changes in circumstances indicate that the carrying amount of an asset may not be recoverable. For the purposes of assessing impairment, assets are grouped at the lowest levels for which there are separately identifiable cash inflows. An impairment loss is the amount by which the carrying amount of the assets exceeds the recoverable amount.
The recoverable amount is the higher of the asset’s net selling price and its value in use. The value in use is determined by reference to discounted future net cash flows expected to be generated by the asset. Cash flows are discounted using a pre-tax discount rate that reflects current market assessments of the time-value of money and the risks specific to the asset.
LeasingLeasing of assets where the lessor retains the major part of risk and control are classified as operational leases. Other leasing contracts are treated as financial leasing. The accounting principle describes situations where the Group is the lessee.
Operational leasingThe leasing costs of operational leases are allocated on a linear basis over the period of the lease and are classified as cost of goods sold or other operating costs in the statement of comprehensive income.
Financial leasingFinancial leasing contracts are capitalised as assets and liabilities in the statement of financial position in an amount equivalent to the operating asset’s fair value at the time the leasing contract was entered into or, if lower, the net discounted value of the future minimum payments under the terms of the lease contract. The liability to the lessor is included in the statement of financial position as a financial lease liability. Lease payments are recognised in the financial statements as interest expense and a reduction in the lease liability. Leased assets are depreciated over the expected useful life in accordance with the depreciation plan for owned assets. If it is not likely that the Group will take over the asset upon the expiry of the leasing contract, the asset is depreciated over the shorter of the life of the leasing contract and the depreciation period applied for equivalent assets owned by the Group.
Financial instrumentsA financial instrument is any contract that gives rise to a financial asset of one entity and a financial liability or equity instrument of another entity.
Financial assetsThe Group´s financial assets are: derivatives, accounts receivable and bank deposits.
The classification of financial assets at initial recognition depends on the financial asset’s contractual cash flow characteristics and the Group’s business model for managing them. With the exception of accounts receivable that do not contain a significant financing component, the Group initially measures a financial asset at its fair value plus, in the case of a financial asset not at fair value through profit or loss, transaction costs.

ANNUAL REPORT 2018 | 125
FINANCIAL STATEMENTS & NOTES
The Group classified its financial assets in three categories:
• Financial assets at amortised cost• Financial assets at fair value through OCI with recycling of cumulative gains and losses• Derivatives at fair value designated as hedging instruments
Financial assets at amortised cost The Group measures financial assets at amortised cost if both of the following conditions are met:
• The financial asset is held within a business model with the objective to hold financial assets in order to collect contractual cash flows and,
• The contractual terms of the financial asset give rise on specified dates to cash flows that are solely payments of principal and interest on the principal amount outstanding
Financial assets at amortised cost are subsequently measured using the effective interest (EIR) method and are subject to impairment. Gains and losses are recognised in profit or loss when the asset is derecognised, modified or impaired.
The Groups financial assets at amortised cost includes accounts receivable and other short-term deposit. Accounts receivable that do not contain a significant financing component are measured at the transaction price determined under IFRS 15 Revenue from contracts with customers.
Financial assets at fair value through OCIThe Group measures debt instruments at fair value through OCI if both of the following conditions are met:
• The financial asset is held within a business model with the objective of both holding to collect contractual cash flows and selling, and,
• The contractual terms of the financial asset give rise on specified dates to cash flows that are solely payments of principal and interest on the principal amount outstanding
For debt instruments at fair value through OCI, interest income, foreign exchange revaluation and impairment losses or reversals are recognised in the statement of profit or loss and computed in the same manner as for financial assets measured at amortised cost. The remaining fair value changes are recognised in OCI. Upon derecognition, the cumulative fair value change recognised in OCI is recycled to profit or loss.
Derivatives at fair value designated as hedging instruments Derivatives at fair value are carried in the statement of financial position at fair value with net changes in fair value in OCI.
The Groups derivatives at fair value designated as hedging instruments includes interest rate swaps.
Derecognition of financial assetsA financial asset (or, where applicable, a part of a financial asset or part of a group of similar financial assets) is primarily derecognised (i.e., removed from the Group’s consolidated statement of financial position) when:
• The rights to receive cash flows from the asset have expired, or• The Group has transferred its rights to receive cash flows from the asset or has assumed an obligation to pay the received cash
flows in full without material delay to a third party under a ‘pass-through’ arrangement; and eithera. the Group has transferred substantially all the risks and rewards of the asset, orb. the Group has neither transferred nor retained substantially all the risks and rewards of the asset, but has transferred control
of the asset
Financial liabilitiesFinancial liabilities are classified, at initial recognition, as loans and borrowings, payables, or as derivatives designated as hedging instruments in an effective hedge, as appropriate. Derivatives are recognised initially at fair value and net of directly attributable transaction costs.
Derivatives are financial liabilities when the fair value is negative, accounted for similarly as derivatives as assets.
Loans, borrowings and payables After initial recognition, interest-bearing loans and borrowings are subsequently measured at amortised cost using the EIR method. Gains and losses are recognised in profit or loss when the liabilities are derecognised as well as through the EIR amortisation process.
126 | ANNUAL REPORT 2018
Amortised cost is calculated by taking into account any discount or premium on acquisition and fees or costs that are an integral part of the EIR. The EIR amortisation is included as finance costs in the statement of profit or loss.
Payables are measured at their nominal amount when the effect of discounting is not material.
Derecognition of financial liabilities A financial liability is derecognised when the obligation under the liability is discharged or cancelled or expires. When an existing financial liability is replaced by another from the same lender on substantially different terms, or the terms of an existing liability are substantially modified, such an exchange or modification is treated as the derecognition of the original liability and the recognition of a new liability. The difference in the respective carrying amounts is recognised in the statement of profit or loss.
Accounting of financial derivatives under IAS 39 (2017 comparables):The Group’s financial derivatives consist almost entirely of hedging derivatives. All purchases and sales of financial instruments are recognised on the transaction date. Changes in fair value for derivatives that meet the requirements for cash flow hedging are reported in the statement of comprehensive income as “other comprehensive income”. The fair value changes are reclassified to profit or loss in the period where the hedged transactions affects profit or loss. Derivatives that are not classified as hedging instruments are classified as available for sale and valued at fair value. Changes in the fair value of such derivatives are presented as financial income/financial expense.
Cash flow hedgesThe Group has decided to adopt the new general hedge accounting model in IFRS 9, which requires the Group to ensure that hedge accounting relationships are aligned with its risk management objectives and strategy and to apply a more qualitative and forward-looking approach to assessing hedge effectiveness. The Group has established a strategy to hedge the currency and interest rate risks related to the exposure to foreign currency and investments. The strategy is designed to ensure a high degree of predictability in currency gains/losses and interest costs. The Group has hedged (cash flow hedging) part of its net investment in Swedish subsidiaries.
The Group uses only derivative financial instruments, such as interest rate swaps to hedge its interest rate risks. Such instruments are initially recognised at fair value on the date on which a derivative contract is entered into and are subsequently remeasured at fair value. Derivatives are carried as financial assets when the fair value is positive and as financial liabilities when the fair value is negative.
The effective portion of the gain or loss on the hedging instrument is recognised in OCI in the cash flow hedge reserve, while any ineffective portion is recognised immediately in the statement of profit or loss. The cash flow hedge reserve is adjusted to the lower of the cumulative gain or loss on the hedging instrument and the cumulative change in fair value of the hedged item. The forward premium of currency contracts is excluded from the hedging relationship and is accounted for as cost of hedging and is also recognised in OCI.
Impairment of financial assetsThe Group recognises an allowance for expected credit losses (ECLs) for all debt instruments not held at fair value through profit or loss. ECLs are based on the difference between the contractual cash flows due in accordance with the contract and all the cash flows that the Group expects to receive, discounted at an approximation of the original effective interest rate. The expected cash flows will include cash flows from the sale of collateral held or other credit enhancements that are integral to the contractual terms.
ECLs are recognised in two stages. For credit exposures for which there has not been a significant increase in credit risk since initial recognition, ECLs are provided for credit losses that result from default events that are possible within the next 12-months (a 12-month ECL). For those credit exposures for which there has been a significant increase in credit risk since initial recognition, a loss allowance is required for credit losses expected over the remaining life of the exposure, irrespective of the timing of the default (a lifetime ECL).
For accounts receivable and contract assets, the Group applies a simplified approach in calculating ECLs. Therefore, the Group does not track changes in credit risk, but instead recognises a loss allowance based on lifetime ECLs at each reporting date. The Group has established a provision matrix that is based on its historical credit loss experience, adjusted for forward-looking factors specific to the debtors and the economic environment.
At every reporting date, the Group evaluates whether the debt instrument is considered to have low credit risk using all reasonable and supportable information that is available without undue cost or effort. In making that evaluation, the Group reassesses the inter-nal credit rating of the debt instrument. In addition, the Group considers that there has been a significant increase in credit risk when contractual payments are more than 30 days past due.
The Group considers a financial asset in default when contractual payments are 90 days past due. However, in certain cases, the

ANNUAL REPORT 2018 | 127
FINANCIAL STATEMENTS & NOTES
Group may also consider a financial asset to be in default when internal or external information indicates that the Group is unlikely to receive the outstanding contractual amounts in full before taking into account any credit enhancements held by the Group. A financial asset is written off when there is no reasonable expectation of recovering the contractual cash flows.
A financial instrument is any contract that gives rise to a financial asset of one entity and a financial liability or equity instrument of another entity.
Inventories Inventories are valued at the lower of purchase price and net realisable value. Net realisable value is defined as the expected sale price under normal commercial conditions with a deduction for sales costs. Purchase price is determined based on average cost price.
EquityThe nominal value of holdings of own shares is reported in the statement of financial position as a deduction to share capital. The purchase price in excess of nominal value is recognised in other equity. Gains or losses on transactions in own shares are recognised directly in equity. If own shares are sold at a price in excess of cost price, the surplus is recognised as other paid-in equity. Realised losses related to sales of own shares are recognised against other equity.
Transaction costs in relation to equity transactions are recognised in equity after deducting tax.
Other equity includes cumulative net changes in fair value of financial instruments until the investment is derecognised.
Pension liabilities Liability in respect of contractual pension arrangements in the Group is valued as the present value of the future pension benefits for which entitlement has been earned at the date of the statement of financial position and is calculated based on assumptions about discount rates and expected growth in earnings and pensions. Pension calculations use the K2013 table for mortality risk. The risk table for disability, IR02, corresponds with the estimated risk of disability in the Group. Pension assets are valued at fair value on the balance sheet date. Costs incurred in relation to the Group's pension arrangements are reported as salary costs in the accounts.
The starting point for calculating pension costs in respect of the Group pension schemes is linear application of pension entitlement earned against the likely accumulated pension liability at the time the pension is first drawn.
The cost of pensions is calculated based on the discounted pension entitlement earned at the beginning and end of the year and the pension rights accrued during the year, less the return on the assets provided to fund pensions. Significant changes to the pension schemes, including scheme closures and changes that cause the issuance of paid-up policies, are recognised in the accounts in the accounting period when such change takes place. The effect of any changes in the pension scheme that leads to the issuance of fully paid-up policies is recognised in the period the change is made. The effect of other changes in the pension scheme is amortised over the expected average remaining service period. The effect of any changes in estimates, changes in assumptions and calculation are accounted for in “other comprehensive income” in the period that they occur.
The Group has established a unfunded compensation scheme for employees in connection with the closure of a defined benefit pension scheme. The size of the compensation and the profile for its accrual are calculated based on a standard set of calculation parameters at the time of the change to the pension arrangements and are accounted for as a defined benefit pension scheme in the financial statements. The accrual formula and profile for the compensation scheme are used as the basis to make provisions in the accounts so that the total compensation earned to date by employees at any time is provided for as a liability in the consolidated statement of financial position.
The majority of the employees in the Group’s Norwegian companies are members of an early retirement scheme (AFP), which is a multi-company defined benefit scheme, and is financed by premium payments determined as a percentage of salary. There is no reliable measurement and allocation of liabilities and asset between the companies that participate in the scheme. The scheme is therefore treated for accounting purposes as a defined contribution pension scheme and the premiums paid are recognised as costs through profit and loss.
Provisions A provision is recognised in the statement of financial position only when the company is subject to a liability that is a consequence of an event that has already happened and where it is likely (more likely than not) that to reduce or discharge the liability the company will have to provide financially measurable resources, and the liability can be reasonably estimated. Provisions are evaluated at the end of each accounting period and adjusted to reflect the available information about the provision. Where the information available is insufficient, a best estimate is used. If the time period to the date at which the liability may lead to payment has a material effect on the calculation, the provision will represent the discounted present value of the future liability. Increases in liability caused solely by the lapse of time are reported as an interest expense.

128 | ANNUAL REPORT 2018
Provisions for restructuring costs only include direct expenses linked to the restructuring which are both necessary for the implementation of the restructuring and which do not relate to the continuing ordinary activities of the company. Such provisions are recognised in the accounts when the company has a detailed plan for the restructuring in question that identifies which business areas will be affected, the locations affected, the functions and estimated number of employees due to receive termination payments, the costs that will be incurred and a time plan for implementation. There must be a real expectation by the parties affected that the company will implement the restructuring. This means either that implementation of the restructuring program has commenced or that the main elements have been communicated to the affected parties.
Contingent assets and liabilitiesA contingent asset is defined as a possible asset, that arises from past events, and whose existence will be confirmed only by the occurrence or non-occurrence of one or more uncertain future events, not wholly within the control of the entity. Contingent assets are not recognized in the financial statements, but information is provided if there is a reasonable certainty that the benefit in question will accrue to the Group.
Contingent liabilities comprise:
- a possible obligation arising as a result of past events where the obligation depends on some uncertain future event- a present obligation that is not recognised in the accounts since it is not probable that the obligation will result in a payment
being made- liabilities that cannot be measured reliably
Contingent liabilities are not recognised in the financial statements except for contingent liabilities acquired as part of the purchase of a business. Continent liabilities acquired as part of the purchase of a business are recognised in the accounts at fair value even if the liability is not likely to crystallise.
Cash flow statementThe cash flow statement is presented using the indirect method. The Group’s activities are divided into operational, financing and investment activities. Investment in new business or sale of business is classified as cash from/to investments, in the cash flow statement, and amounts to the purchase price/sales price less transferred cash and cash deposits at the transaction date.
The cash flow statement includes businesses disposed of up to the date of disposal.
3. Standards issued but not yet effective The following paragraphs provide an overview of changes to IFRS/IAS standards that are relevant to the Group’s activities but have not yet come into effect. The Group intends to adopt these standards when they become effective.
IFRS 16 LeasesIFRS 16 was issued in January 2017 and replaces IAS 17 Leases, IFRIC 4 and SIC 15 and 27. IFRS 16 sets out the principles for the recognition, measurement, presentation and disclosure of leases and requires lessees to account for all leases under a single on-balance sheet model similar to the accounting for financial leases under IAS 17. IFRS 16 is effective for annual periods beginning on or after 1 January 2019. The standard introduces two exemptions for lessees – leases of “low-value assets” and short-term leases (i.e. leases with a lease term of 12 months or less). At the commencement date the lessee will recognise a liability to make lease payments and an asset representing the right to use the underlying asset during the lease term. Lessees will be required to separately recognise the interest expense on the lease liability and the depreciation expense on the right-of-use asset.
Lessees will be also required to remeasure the lease liability upon the occurrence of certain events (e.g., a change in the lease term, a change in future lease payments resulting from a change in an index or rate used to determine those payments). The lessee will generally recognise the amount of the remeasurement of the lease liability as an adjustment to the right-of-use asset.
Lessor accounting under IFRS 16 is substantially unchanged from today’s accounting under IAS 17. Lessors will continue to classify all leases using the same classification principle as in IAS 17 and distinguish between two types of leases: operating and finance leases.
The Group has in 2018 reviewed its lease agreements and assessed the potential effects of IFRS 16 on its consolidated financial statements. The Group will implement IFRS 16 using the modified retrospective method for all lease agreements existing on the implementation date. Comparative figures will not be restated when using the modified retrospective method. The Group will apply transition reliefs where the lease asset will be equal to the lease liability at the transition date. IFRS 16 requires lessees and lessors to make more extensive disclosures than under IAS 17.

ANNUAL REPORT 2018 | 129
FINANCIAL STATEMENTS & NOTES
The Group has assessed lease of software to be outside the scope of IFRS 16. In addition, the partner agreement with IBM is assessed to be a service agreement and thereby not in the scope of the standard. The Group will apply the two recognition exemptions in the standard, for low value items and short-term leases.
The Group's assessment has identified a potential increase on the Group's balance sheet (assets and liabilities) in the range of NOK 1.6 billion to NOK 1.9 billion, with no effect on the book value of total equity (Right of Use Asset equal to Lease Liability). This implies an reduction of the equity ratio as of 31 December 2018 of approximately 3.1 –3.6pp (i.e. equity ratio of 22.1 –22.6 %).
The total cost over the lease term will remain unchanged after the implementation of IFRS 16 compared. However, IFRS 16 will result in a front-loading of expenses and reclassification of costs from operating profit before amortisation of customer contracts (EBITA) to net financial items. In the Consolidated Statement of Comprehensive Income, operating lease costs (in other operating costs) will be replaced by depreciation and interest expenses. As a result, the group expects the EBITDA to increase in the range of NOK 250 - 350 million. The group expects no significant impact on profit for the year as a result of the implementation of IFRS 16. In the cash flow statement, the part of lease payments that relates to repayment of the lease liability will be reclassified from cash flows from operations to cash flows from financing.
SEGMENT INFORMATION
The Group’s activities are divided into three segments. The allocation of activities to segments is based on the main markets served by the Group, and corresponds with the structures used for internal operational reporting to the executive management, which is the decision making body in the Group. The segment structure is unchanged from the 2017 reporting.
The EVRY Financial Services segment offers a broad portfolio of solutions and services, and is a complete industry vertical with responsibility for all the company’s deliveries to bank and finance customers. The solutions portfolio includes solutions for all core banking services, whether this relates to interfaces with end-customers or solutions to support a bank’s internal processes and employees. The portfolio is module-based, and includes banking services, transactions systems, payment solutions and card services. The portfolio also includes a unique value chain of card services that are delivered to banks in the Nordic countries and in the United Kingdom. The EVRY Financial Services segment has its operations within Application Services and Digital Platform Services, see table below on service lines.
The EVRY Sweden segment offers everything from strategic advice and consulting services through to solutions and IT operat-ing services. EVRY Sweden has a significant portfolio of industry vertical solutions that combine industry-specific insight and business understanding with technological expertise. EVRY Sweden also delivers services based on strong specialist expertise that are independent of geographic location and sector, for example ERP solutions, mobility, cloud-based solutions and Business Intelligence. EVRY Sweden also has its own operating services organisation, which focuses on medium-sized businesses and entities in the private and public sectors. The EVRY Sweden segment has its operations within Digital Services, Application Services, Digital Platform Services and Fulfilment Services, see table below on service lines.
The EVRY Norway segment offers consulting, infrastructure and operating services. EVRY Norway has a long history with leadingcustomers in the Norwegian public and private sectors, and holds strong positions in a number of industry verticals where it combines industry insight and business understanding with technological expertise. Customer deliveries cover a broad range of consulting and solutions services, as well as IT operating services. EVRY Norway has a significant position in the local government and healthcare sectors, and is currently strengthening its position in other verticals including retail, oil & gas and insurance. Through its extensive activities, EVRY Norway has in-depth technical expertise in specialist services that are independent of geographic location and sector. This includes growth areas such as mobility, cloud-based solutions and Business Intelligence. The EVRY Norway segment has its operations within Digital Services, Application Services, Digital Platform Services and Fulfilment Services, see table below on service lines.
The Group’s other activities are shown in the presentation below as other. These activities include for reporting purposes the Group's Global delivery activities. In addition, financing and central group functions that are not allocated to the segments, included in the line other. Transactions between the business areas are based on market terms and conditions. The rental of software and other IT equipment is based on the cost from an external supplier plus a margin. The purchase and sale of consulting services between the segments is charged at an agreed price equivalent to the price achieved by the best customer. The operating profit/-loss before amortisation of customer contracts and write-down of intangible assets (EBITA) reported for each segment includes revenue and costs related to transactions with other segments of the Group. Eliminations between segments are included in the line other.
NOTE 2
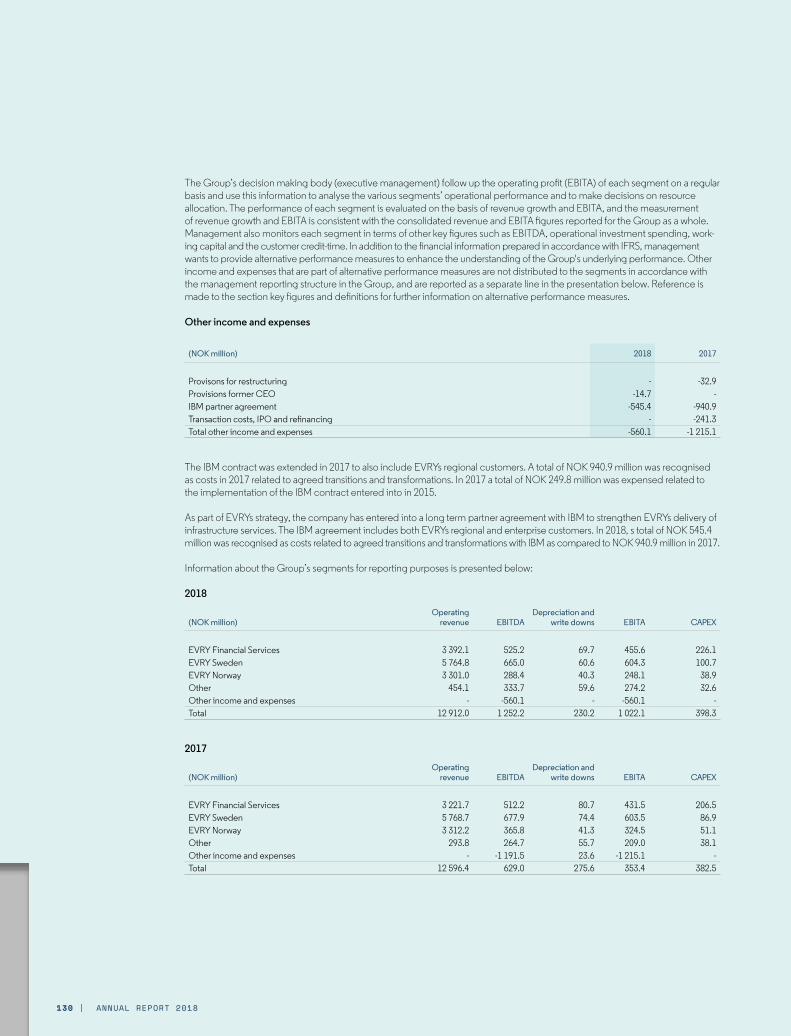
130 | ANNUAL REPORT 2018
The Group’s decision making body (executive management) follow up the operating profit (EBITA) of each segment on a regular basis and use this information to analyse the various segments’ operational performance and to make decisions on resource allocation. The performance of each segment is evaluated on the basis of revenue growth and EBITA, and the measurement of revenue growth and EBITA is consistent with the consolidated revenue and EBITA figures reported for the Group as a whole. Management also monitors each segment in terms of other key figures such as EBITDA, operational investment spending, work-ing capital and the customer credit-time. In addition to the financial information prepared in accordance with IFRS, management wants to provide alternative performance measures to enhance the understanding of the Group's underlying performance. Other income and expenses that are part of alternative performance measures are not distributed to the segments in accordance with the management reporting structure in the Group, and are reported as a separate line in the presentation below. Reference is made to the section key figures and definitions for further information on alternative performance measures.
Other income and expenses
(NOK million) 2018 2017
Provisons for restructuring - -32.9Provisions former CEO -14.7 -IBM partner agreement -545.4 -940.9Transaction costs, IPO and refinancing - -241.3Total other income and expenses -560.1 -1 215.1
The IBM contract was extended in 2017 to also include EVRYs regional customers. A total of NOK 940.9 million was recognised as costs in 2017 related to agreed transitions and transformations. In 2017 a total of NOK 249.8 million was expensed related to the implementation of the IBM contract entered into in 2015.
As part of EVRYs strategy, the company has entered into a long term partner agreement with IBM to strengthen EVRYs delivery of infrastructure services. The IBM agreement includes both EVRYs regional and enterprise customers. In 2018, s total of NOK 545.4 million was recognised as costs related to agreed transitions and transformations with IBM as compared to NOK 940.9 million in 2017.
Information about the Group’s segments for reporting purposes is presented below:
2018
(NOK million)Operating
revenue EBITDADepreciation and
write downs EBITA CAPEX
EVRY Financial Services 3 392.1 525.2 69.7 455.6 226.1EVRY Sweden 5 764.8 665.0 60.6 604.3 100.7EVRY Norway 3 301.0 288.4 40.3 248.1 38.9Other 454.1 333.7 59.6 274.2 32.6Other income and expenses - -560.1 - -560.1 - Total 12 912.0 1 252.2 230.2 1 022.1 398.3
2017
(NOK million)Operating
revenue EBITDADepreciation and
write downs EBITA CAPEX
EVRY Financial Services 3 221.7 512.2 80.7 431.5 206.5EVRY Sweden 5 768.7 677.9 74.4 603.5 86.9EVRY Norway 3 312.2 365.8 41.3 324.5 51.1Other 293.8 264.7 55.7 209.0 38.1Other income and expenses - -1 191.5 23.6 -1 215.1 - Total 12 596.4 629.0 275.6 353.4 382.5
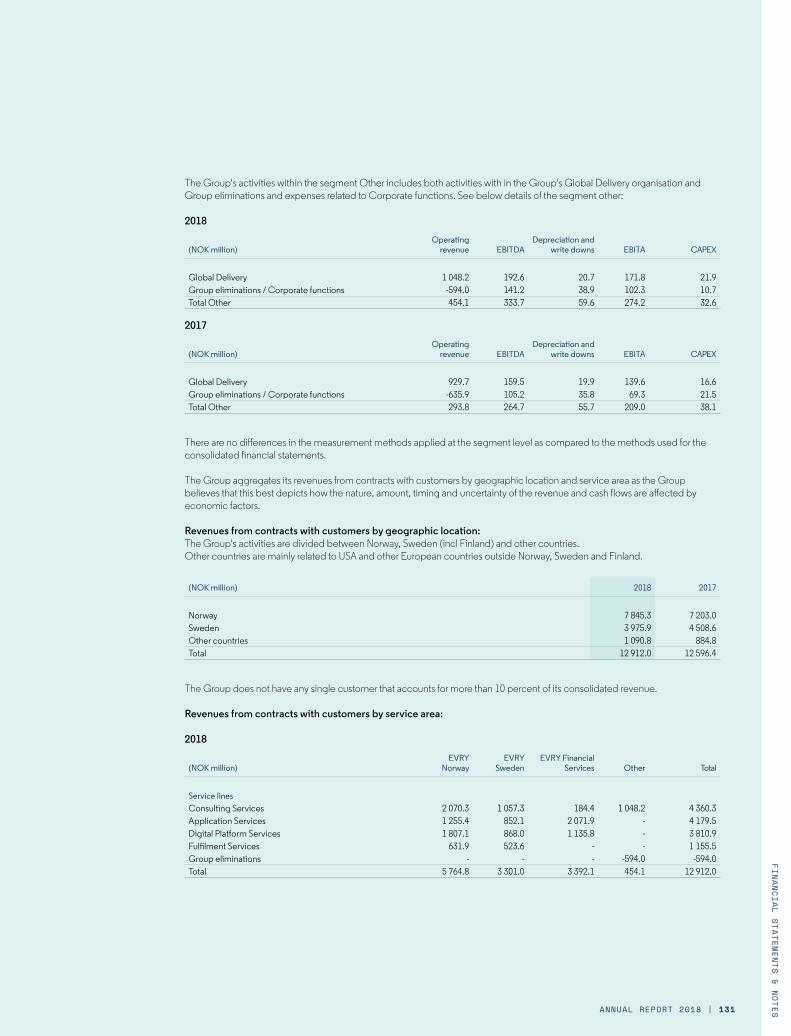
ANNUAL REPORT 2018 | 131
FINANCIAL STATEMENTS & NOTES
The Group's activities within the segment Other includes both activities with in the Group's Global Delivery organisation and Group eliminations and expenses related to Corporate functions. See below details of the segment other:
2018
(NOK million)Operating
revenue EBITDADepreciation and
write downs EBITA CAPEX
Global Delivery 1 048.2 192.6 20.7 171.8 21.9Group eliminations / Corporate functions -594.0 141.2 38.9 102.3 10.7Total Other 454.1 333.7 59.6 274.2 32.6
2017
(NOK million)Operating
revenue EBITDADepreciation and
write downs EBITA CAPEX
Global Delivery 929.7 159.5 19.9 139.6 16.6Group eliminations / Corporate functions -635.9 105.2 35.8 69.3 21.5Total Other 293.8 264.7 55.7 209.0 38.1
There are no differences in the measurement methods applied at the segment level as compared to the methods used for the consolidated financial statements.
The Group aggregates its revenues from contracts with customers by geographic location and service area as the Group believes that this best depicts how the nature, amount, timing and uncertainty of the revenue and cash flows are affected by economic factors.
Revenues from contracts with customers by geographic location:The Group's activities are divided between Norway, Sweden (incl Finland) and other countries.Other countries are mainly related to USA and other European countries outside Norway, Sweden and Finland.
(NOK million) 2018 2017
Norway 7 845.3 7 203.0 Sweden 3 975.9 4 508.6 Other countries 1 090.8 884.8 Total 12 912.0 12 596.4
The Group does not have any single customer that accounts for more than 10 percent of its consolidated revenue.
Revenues from contracts with customers by service area:
2018
(NOK million) EVRY
Norway EVRY
SwedenEVRY Financial
Services Other Total
Service linesConsulting Services 2 070.3 1 057.3 184.4 1 048.2 4 360.3Application Services 1 255.4 852.1 2 071.9 - 4 179.5Digital Platform Services 1 807.1 868.0 1 135.8 - 3 810.9Fulfilment Services 631.9 523.6 - - 1 155.5Group eliminations - - - -594.0 -594.0Total 5 764.8 3 301.0 3 392.1 454.1 12 912.0

132 | ANNUAL REPORT 2018
2017
(NOK million) EVRY
Norway EVRY
SwedenEVRY Financial
Services Other Total
Service linesConsulting Services 2 170.8 1 110.8 173.8 929.7 4 385.1Application Services 1 170.0 853.0 1 933.2 - 3 956.1Digital Platform Services 1 838.9 902.5 1 114.8 - 3 856.2Fulfilment Services 589.0 445.9 - - 1 034.9Group eliminations - - - -635.9 -635.9Total 5 768.7 3 312.2 3 221.7 293.8 12 596.4
Contract assets and contract liabilitiesThe timing of revenue recognition, billings and cash collections results in billed accounts receivable, unbilled receivables (contract assets) and customer advances and deposits (contract liabilities) on the Consolidated Statement of Financial Position.EVRY receives payment from customers based on billing schedules as established in the contracts. Contract assets relate to EVRY's right to receive consideration for the completed performance under the contracts. Accounts receivable are recognised when the right to conditional consideration becomes unconditional. Contract liabilities relate to payments received in advance of performance under the contracts. Contract liabilities are recognised as revenue as (or when) EVRY performs under the contracts.
Contract assets mainly relate to implementation projects where the customers have not yet been invoiced. Contract liabilities consist of prepaid amounts from customers.
Net contract assets/-liabilities consist of the following:
(NOK million) 31.12.2018 01.01.2018
Contract assets 362.6 335.8 Contract liabilities - current -401.9 -313.7 Contract liabilities - non-current -393.6 -415.8 Net contract assets/-liabilities -433.0 -393.7
Included in contract liabilities is the implementation effect 1 January 2018 of NOK 508 million (deferred income), whereof NOK 101 million is classified as current. See note 1 for further information on implementation effects.
MANAGEMENT OF CAPITAL STRUCTURE AND FINANCIAL RISK
1. Management of capital structureEVRY aims for a capital structure, which supports its long-term strategic ambitions. EVRY intends to pay dividends based on a pay-out ratio of around 60 percent of Adjusted Net Income 1).
The Group manages its capital structure by monitoring equity as a proportion of total assets, net interest-bearing liabilities as a proportion of total equity (gearing), and debt cover ratio measured by net interest-bearing liabilities relative to normalized EBITDA as defined in the Group's senior financing agreement. The Group’s senior financing agreement contains covenants related to the debt cover ratio, which need to be reported to the bank syndicate. The Group has through 2018 been in compliance with its covenants.
1) Adjusted Net Income: Represents profit/-loss for the period before other income and expenses.
NOTE 3

ANNUAL REPORT 2018 | 133
FINANCIAL STATEMENTS & NOTES
(NOK million) 31.12.2018 31.12.2017
Non-current interest-bearing liabilities 2) 4 746.6 4 683.1 Current interest-bearing liabilities 3.1 3.1 Bank deposits -645.7 -880.0 Net interest-bearing liabilities 4 104.0 3 806.3
Equity 2 983.9 3 239.2 Total assets 11 596.4 11 383.1
Gearing 1.38 1.18 Equity ratio 25.7 % 28.4 %Debt cover ratio 2.26 2.09
2) Excluding arrangement fees
Subsidiaries have limited ability to establish independent financing and are required to distribute their surplus capital to EVRY ASA by means of dividend, repayment of internal financing or group contributions.
2. Financial risk managementThe Group's policies for the management of financial risk are approved by the Board of Directors and Group Management of EVRY ASA. The main objective of financial risk management is to identify, quantify and manage financial risk. Operational responsibility for monitoring and managing financial risk lies with EVRY's centralised treasury function.
Financial risk is normally divided into three groups:1. Market risk
a. Interest rate riskb. Currency risk
2. Credit risk3. Liquidity risk
1. Market riskMarket risk is the risk of changes in market prices and changes in fundamental conditions in the economy, such as changes in interest rates, exchange rates, prices of inputs and the cost of capital.
1a. Interest rate risk Interest rate risk is the risk that future cash flows will fluctuate because of changes in the general level of interest rates. The Group’s exposure to interest rate risk relates primarily to interest-bearing liabilities with floating interest rates. The Group uses interest rate swaps to hedge against large fluctuations in cash flow. The Group financial policy states that 30 to 70 percent of the debt should be swapped to fixed interest rates.
See also Note 4 for more information on the Group’s exposure to interest rate risk.
1b. Currency risk The main objective of currency risk management in EVRY is to reduce the effect of changes in exchange rates on future cash flows and on the Group’s financial situation. Currency risk can be divided into i) transaction risk, ii) translation risk and iii) strategic risk:
i) Transaction risk represents the risk that future cash flows may fluctuate because of changes in exchange rates. It arises from future financial transactions in a currency other than the Group’s reporting currency.
EVRY has both revenue and costs denominated in foreign currency, which to some degree act as a natural hedge. The Group has established an arrangement for multicurrency bank accounts, which are used to reduce exposure to currency risk on group level. The Group hedges future cash flows denominated in foreign currency where the aggregated amount is greater than the equivalent of NOK 50 million.
ii) Translation risk represents the risk of assets or liabilities being exposed to changes in value measured in the Group’s functional currency because of changes in exchange rates. Due to the Group’s activities outside Norway (mainly Sweden, India, Ukraine, Latvia and the US), currency exposure is mainly towards SEK, EUR, USD and INR.
As the Group has significant operations in Sweden, a share of its debt with the current bank syndicate is denominated in Swedish kroner.

134 | ANNUAL REPORT 2018
iii) Strategic risk is a concept used to describe the long-term effects of changes in exchange rates. This risk arises when establish-ing business operations in low-cost countries, importing from countries with low commodity prices and other exposure to currency risk in relation to strategic decisions.
EVRY has established subsidiary companies in India, Ukraine, Latvia and USA. These companies have income mainly in EUR and USD, while costs are mainly in local currency.
See also note 4 for more information on the Group’s exposure to currency risk.
2. Credit riskCredit risk relates to the risk that the Group’s counterparties fail to pay their financial commitments, which might lead to a financial loss. Follow--up and collection of receivables happens across units, based on guidelines set centrally.
No significant provisions were made in 2018 for losses on receivables. The Group’s maximum exposure to credit risk from accounts receivables and contract assets amounted to NOK 2 070 million as of 31 December 2018.
3. Liquidity riskLiquidity risk arises if the cash flows generated by the Group are not sufficient to match its financial obligations. The Group has established long-term financing agreements to cover potential investments and other liquidity needs. The Group aims for limited current interest-bearing debt in addition to its bank facility to reduce refinancing risk. Financing for corporate acquisitions is evaluated independently.
The Group monitors its liquidity daily and produces liquidity forecasts on a regular basis to identify future liquidity requirements.
See also note 4 for more information on the Group’s exposure to liquidity risk.
FINANCIAL INSTRUMENTS
A) Non-current interest-bearing liabilities and interest rate risk
Non-current interest-bearing liabilities
(NOK million) 31.12.2018 31.12.2017
Financial lease 12.6 15.7Liabilities to credit institution 4 733.9 4 667.4Capitalised arrangement fees -46.8 -60.7Non-current interest-bearing liabilities 4 699.8 4 622.4
See below a reconciliation of the changes in interest-bearing liabilites during 2018.
(NOK million) 31.12.2017 Draw down of new debt
Repayment of debt
Currency effects 31.12.2018
Financial lease 15.7 - -3.1 - 12.6Liabilities to credit institutions 4 667.4 100.0 - -33.5 4 733.9Total 4 683.1 100.0 -3.1 -33.5 4 746.5
See below an allocation of the Group's non-current interest-bearing liabilites in fixed and variable interest rates (without excluding capitalised arrangement fees)
(NOK million) 31.12.2018 31.12.2017
Interest-bearing liabilities - swapped to fixed interest rates 2 115.7 2 118.9Interest-bearing liabilities - variable interest rates 2 630.8 2 564.2Total non-current interest-bearing liabilities 4 746.5 4 683.1
NOTE 4

ANNUAL REPORT 2018 | 135
FINANCIAL STATEMENTS & NOTES
Non-current interest-bearing debt and interest rate riskIn 2018, there have been no changes to EVRY's financing agreement (“Senior Facility Agreement”/“SFA”) with a syndicate of 8 banks. The largest lenders are DNB, Nordea Bank, SEB, and Swedbank. The financing agreement has a total commitment of NOK 6 039 million divided in a bullet loan at draw-down of NOK 4 539 million and a revolving credit facility (RCF) of NOK 1 500 million to cover working capital and other financing needs. The bullet loan consists of two tranches, NOK 3 433 million and SEK 1 135 million. As of 31 December 2018, NOK 200 million of the RCF was drawn. The bullet loan falls due in its entirety in June 2022.
The financing secures EVRY a flexible capital and financing structure at competitive terms. Margins are subject to adjustments based on the Group’s financial development. Adjustments to margins are based on the debt cover ratio defined as net interest-bearing debt relative to normalized EBITDA.
The Group has throughout 2018 been in compliance with its financial covenants. The covenant calculation and reporting is based on "original accounting principles" valid at the date of the facility agreement.
Arrangement fees related to the refinancing in June 2017 as well as commitment fees are part of the amortized cost calculation.
Interest rate swapsAs of 31 December 2018, EVRY had entered into interest rate swaps totaling NOK 2 100 million to hedge interest rates. 46 percent of the Group’s long-term debt has thereby been swapped to fixed interest rates. The interest rate swaps match the interest periods in the SFA (quarterly). Hedge accounting is applied and changes to the market value of the interest rate swaps are recognized as part of the comprehensive income.
Interest rate swaps 31 December 2018:
Currency Amount Maturity date Fixed interest rate Mtm value
Interest rate swap Nordea NOK 500 26.11.2021 1.28 % 3.5 Interest rate swap DNB NOK 500 27.06.2022 1.46 % 2.1 Interest rate swap SEB NOK 500 27.06.2022 1.37 % 3.6 Interest rate swap SEB NOK 300 27.06.2022 1.37 % 2.2 Interest rate swap Swedbank NOK 300 27.06.2022 1.38 % 2.0
Average duration for the interest rate swaps as of 31 December 2018 was 3.35 years.
The Group is exposed to the general level of interest rates in Norway and Sweden (Nibor/Stibor). A significant change in interest rates would represent a significant increase/decrease in the company’s overall earnings.
The Group uses interest rate swaps to hedge against large fluctuations of cash flow. An increase in the general level of interest rates will cause an increase in interest expense. This effect will be partially offset by interest rate swaps as the Group pays fixed in-terest on part of its debt (46 percent as of 31 December 2018). The Group monitors interest rate risk and calculates result effects from potential changes in interest rates by simulating a change in the yield curve.
An increase of interest rates will increase the value of the Group’s interest rate swaps (positive effect). At the same time, the Group’s interest costs will rise because of higher interest rates payable on the part of its total borrowings which is subject to floating interest rates.
The table below shows the effect of an increase of 100 basis points in interest rates on the consolidated profit and loss account:
(NOK million) 2018 2017
Increase / decrease in basis points 100 100Effect on profit after tax -17.6 -13.5

136 | ANNUAL REPORT 2018
B) Exchange rate risk and currency hedgeFinancial items per currency 31 December 2018:
(NOK million) SEK USD EUR Other
Accounts receivable 527.2 73.2 113.5 27.8 Accounts payable 241.5 11.3 40.6 64.2 Bank deposits 74.0 133.1 33.7 41.5 Non-current liabilities 1 101.1 - - - Net exposure financial position -741.4 195.0 106.6 5.2
As of 31 December 2018, the Group had borrowed SEK 1 135 million to hedge its investments in Sweden. Translation effects from liabilities and receivables arising from foreign investments are recognized as other comprehensive income. In 2018, the translation amounted to NOK 17 million after tax for investments in Sweden.
The company has no material balance sheet risk in other currencies.
Exchange rates of relevance:
2018Average
2018Spot
2017Average
2017Spot
SEK 0.9359 0.9701 0.9680 0.9996EUR 9.5962 9.9483 9.3271 9.8403USD 8.1338 8.6885 8.2630 8.2050GBP 10.8463 11.1213 10.6386 11.0910
C) Liquidity risk
(NOK million) 2018 2017
Liquidity reserve 31 December 1) 2 245.7 2 580.0 Liquidity reserve/operating revenues last 12 months 17.4 % 20.5 %
1) The liquidity reserve includes bank deposits and available credit facilities on the RCF and the overdraft.
Maturity profile for financial liabilities:
(NOK million) Total 0 - 1 year 1- 5 year More than 5 years
Accounts payable 842.3 842.3 - - Deductions and duties payable 1 026.4 1 026.4 - - Other current liabilities 942.8 942.8 - - Financial lease 15.7 3.1 12.6 - Maturity credit facility 4 733.9 - 4 733.9 Non-current non-interest bearing liabilities 1) 94.2 - 94.2 - Interests 2) 711.7 203.3 508.3 - Total 8 367.1 3 018.0 5 349.1 -
1) Non-current non-interest bearing liabilities of NOK 393.6 million in the balance sheet consists of NOK 94.2 in other liabilities and NOK 299.4 million in contract liabilities.2) Estimate based on current debt portfolio, current forward curve and current margins.
D) Fair value hierarchyFinancial instruments that are valued at fair value in the statement of financial position are grouped on the basis of the following fair value hierarchy, which applies three levels/groups for financial instruments. The levels/groups reflect the information used for the determination of fair value.

ANNUAL REPORT 2018 | 137
FINANCIAL STATEMENTS & NOTES
Level 1: Quoted (unadjusted) prices in active markets for identical assets or liabilities. Level 2: Instruments for which observable information is available, but for which there is no active market. Level 3: Instruments for which there is no observable market data and the determination of fair value accordingly uses company specific/subjective information.
For accounts receivable, accounts payable and other short-term items, fair values are considered to be equal to carrying values due to their short-term nature. Non-current interest bearing liabilities are measured at amortised cost.
Financial assets and liabilities categories
As of 31 December 2018:
(NOK million)Fair value
level
Fair value through
OCI
Fair value through
profit and loss
Loans and Receivables
at amortized cost
Other financial
liabilities at amortized
cost Total book
value Fair value
AssetsOther non-current receivables 2, 3 1) 10.4 - 310.6 - 321.0 321.0 Accounts receivable 3 - - 1 701.2 - 1 701.2 1 701.2 Other current receivables 3 - - 1 055.9 - 1 055.9 1 055.9 Bank deposits 3 - - 645.7 - 645.7 645.7 Total financial assets 10.4 - 3 713.4 - 3 723.8 3 723.8
LiabilitiesNon-current interest-bearing liabilities 3 - - - 4 699.8 4 699.8 4 699.8 Non-current non-interest-bearing liabilities 3 - - - 94.2 94.2 94.2 Accounts payable 3 - - - 842.3 842.3 842.3 Deductions and duties payable 3 - - - 1 026.3 1 026.3 1 026.3 Other current liabilities 3 - - - 1 181.0 1 181.0 1 181.0 Total financial liabilities - - - 7 843.6 7 843.6 7 843.6
1) Fair value level 2 relates to interest rate swaps
During the reporting period 1 January 2018 to 31 December 2018, there were no transfers between the levels in the fair value hierarchy.
As of 31 December 2017:
(NOK million)Fair value
level
Fair value through
OCI
Fair value through
profit and loss
Loans and Receivables
Other financial liabilities
Total book value Fair value
AssetsOther non-current receivables 3 - - 276.4 - 276.4 276.4 Accounts receivable 3 - - 1 663.3 - 1 663.3 1 663.3 Other current receivables 3 - - 1 028.1 - 1 028.1 1 028.1 Bank deposits 3 - - 880.0 - 880.0 880.0 Total assets - - 3 847.9 - 3 847.9 3 847.9
LiabilitiesNon-current interest bearing liabilities 3 - - - 4 622.4 4 622.4 4 622.4 Non-current non-interest bearing liabilities 2,3 1) 3.0 - - 9.8 12.8 12.8 Accounts payable 3 - - - 933.8 933.8 933.8 Deductions and duties payable 3 - - - 986.2 986.2 986.2 Other current liabilities 3 - - - 1 222.9 1 222.9 1 222.9 Total liabilities 3.0 - - 7 775.1 7 778.1 7 778.1
1) Fair value level 2 relates to interest rate swaps
During the reporting period 1 January 2017 to 31 December 2017, there were no transfers between the levels in the fair value hierarchy.
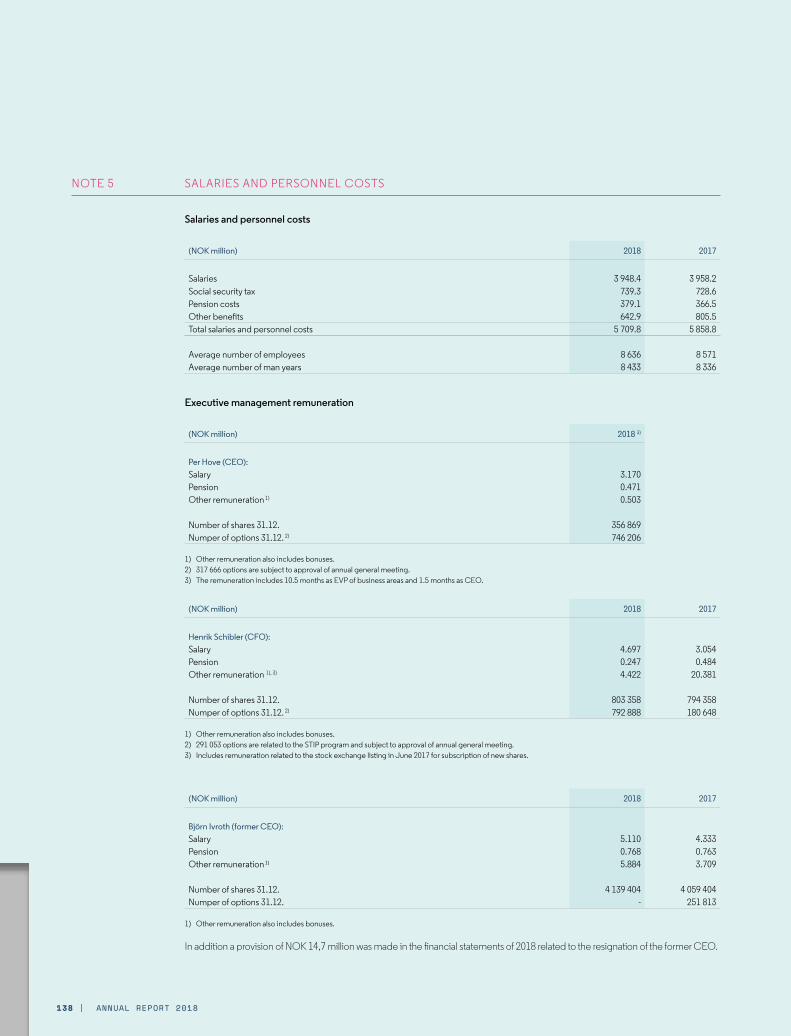
138 | ANNUAL REPORT 2018
SALARIES AND PERSONNEL COSTS
Salaries and personnel costs
(NOK million) 2018 2017
Salaries 3 948.4 3 958.2Social security tax 739.3 728.6Pension costs 379.1 366.5Other benefits 642.9 805.5Total salaries and personnel costs 5 709.8 5 858.8
Average number of employees 8 636 8 571Average number of man years 8 433 8 336
Executive management remuneration
(NOK million) 2018 3)
Per Hove (CEO):Salary 3.170 Pension 0.471 Other remuneration 1) 0.503
Number of shares 31.12. 356 869 Numper of options 31.12. 2) 746 206
1) Other remuneration also includes bonuses. 2) 317 666 options are subject to approval of annual general meeting.3) The remuneration includes 10.5 months as EVP of business areas and 1.5 months as CEO.
(NOK million) 2018 2017
Henrik Schibler (CFO):Salary 4.697 3.054 Pension 0.247 0.484 Other remuneration 1), 3) 4.422 20.381
Number of shares 31.12. 803 358 794 358 Numper of options 31.12. 2) 792 888 180 648
1) Other remuneration also includes bonuses.2) 291 053 options are related to the STIP program and subject to approval of annual general meeting.3) Includes remuneration related to the stock exchange listing in June 2017 for subscription of new shares.
(NOK million) 2018 2017
Björn Ivroth (former CEO):Salary 5.110 4.333Pension 0.768 0.763Other remuneration 1) 5.884 3.709
Number of shares 31.12. 4 139 404 4 059 404Numper of options 31.12. - 251 813
1) Other remuneration also includes bonuses.
In addition a provision of NOK 14,7 million was made in the financial statements of 2018 related to the resignation of the former CEO.
NOTE 5

ANNUAL REPORT 2018 | 139
FINANCIAL STATEMENTS & NOTES
Other members of executive management 2018
(NOK million) Period Salary Pension
Other remune-
ration 1)
Number of shares 31.12.18
Number of options 31.12.18 2)
Wiljar Nesse 2.746 0.527 1.074 1 231 157 407 766Trond Vinje 1.823 0.211 1.064 215 000 213 106Asta Ellingsen Stenhagen 1.270 0.098 0.259 38 123 134 771Malin Fors-Skjæveland 1.8-31.12 0.768 0.109 0.111 0 70 423Unni Strømstad 1.383 0.127 0.547 0 92 866Daniel Nordstad Grönquist 1.783 0.164 0.356 18 584 115 759Total 9.772 1.237 3.412 1 502 864 1 034 691
Previous member of executive management (3 members) 5.975 1.377 2.342
1) Other remuneartion also includes bonuses2) Of which 375596 options are related to the STIP program and subject to approval of annual general meeting
Other members of executive management 2017
(NOK million) Salary Pension
Other remune-
ration 1)
Number of shares 31.12.18
Number of options
31.12.18
Other members of executive management 14.678 1.968 9.276 3 057 260 473 655
1) Other remuneration also includes bonuses.
The total remuneration of the CEO, CFO and other members of executive managment consists of basic salary and benefits sup-plemented by performance-based bonuses, share-based long-term incentive schemes and pension and insurance arrangements. The Board of EVRY ASA has approved a bonus scheme for the CEO, CFO and members of executive manage-ment, whereby bonus will be paid based on the achievement of pre-determined targets. The maximum bonus entitlement for the CEO and CFO is 18 months’ fixed salary, while the maximum bonus entitlement for the other members of executive management is up to 12 months’ fixed salary. The Board of Directors has established detailed guidelines to implement the above principles.
The Company has in November 2018 decided to implement a short-term one-off incentive program, in the form of a restricted stock unit program (RSU's), for selected members of the executive management in the EVRY (the "STIP"), the purpose of the STIP being to incentivise and secure retention of the selected key management. The STIP covers a total of 666 649 restricted stock units (the "RSU's"), where each vested RSU gives the beneficiary the right to receive one share in the Company free of charge (the "RSU Shares"). The RSU's will vest two years after the Grant Date (the "Vesting Period"), subject to the Beneficiary still being employed within the EVRY Group at the Vesting Date. The Company may choose to settle the vested RSUs in cash rather than in shares, through payment of the Grant Amount to the beneficiary. The STIP and any grant thereunder is subject to approval by EVRY's general meeting in 2019.
The CEO will be granted RSU's with the value of two annual base salaries. These will vest after 24 months senority in the position as CEO. The arrangement is subject to approval by the general meeting in 2019 and is conditioned upon that the executive is hired as CEO at the time of the vesting.
The CEO has waived the redundancy rights provided by Chapter 15 of the Working Environment Act, ref. Section 15-16. He isentitled to receive salary for 6 months following the normal notice period of 6 months. The CFO and other members of extended group management are entitled to receive salary for periods of between 0 and 12 months following notice periods of between 6 and 12 months. Both the Chief Executive Officer, CFO and other members of executive management are subject to non-compete agreements.
The CEO, CFO and other members of executive management have not received any remuneration or other benefits from any other company in the Group other than as set out above. No additional payments were made for special services over and above an individual’s normal management responsibilities. The remuneration of the CEO, CFO and other members of executive management is discussed in the company's Remuneration Committee and approved by the Board. Development of basic salary follows a similar development as the rest of the employees.

140 | ANNUAL REPORT 2018
Board of DirectorsThe table below shows remuneration paid out to the Board of Directors in 2018 and the number of shares held by board members.
(NOK million) Remuneration Number of shares
31.12.18
Göran Lindahl (Chairman) 1.142 1 061 777Salim Nathoo - - Rohan Haldea - - Louise Søndergaard - - Leif Teksum 0.792 59 987Kristin Krohn Devold 0.792 59 987Malin Persson 0.817 24 180Al-Noor Ramji 0.817 11 600Bente Riis Lennertzen 1) 0.362 6 680Sigve Sandvik Lærdal 1) 0.361 2 436Tommy Sander Aldrin 1) 0.216 - Jenny Lindh 1) 0.312 6 680
Previous board membersIngrid Lund 0.091Ola Hugo Jordhøy 0.072Jan Anders Dahlström 0.072Total remuneration 5.844 1 233 327
1) Employee elected board members
The remuneration to the Board of Directors is determined in advance and paid out every six month with one half each time. The employee elected board members receive the remuneration from the board in addition to ordinary salary from the company.
Each member of the Board of Directors was in 2018 invited to participate in a new share matching program, under which each member will have the right to receive one additional share free of charge from the Company for each share the member acquires at market terms, up to such maximum number of shares that equal 1/3 of the base remuneration received. Both investment shares and matching shares will be subject to a lock-up agreement and cannot be sold until the member retires from the Board of Directors.
No loan or provision of security have been provided to the CEO or members of the Board.
STATEMENT TO THE GENERAL MEETING OF EVRY ASA REGARDING STIPULATION OF SALARY AND OTHER REMUNERATION TO THE EXECUTIVE MANAGEMENT 1. GENERAL Pursuant to the Norwegian Public Limited Liability Companies Act (the "Companies Act") § 6-16a, the Board of Directors shall prepare a statement regarding stipulation of salary and other compensation to the CEO and the other executive management. The statement contains guidelines for stipulation of salary and other remuneration, and should also include the main principles for the company's policy for remuneration of the executive management. The Companies Act § 6-16a also requires the Board of Directors to give an account of the policy for remuneration of the executive management applied in the preceding financial year.
This statement is presented by the Board of Directors of EVRY ASA (the "Company") to the Company's general meeting for the first time following conversion of the company to a public limited liability company on 1 June 2017.
2. MAIN PRINCIPLES FOR THE COMPANY'S POLICY FOR REMUNERATION OF THE EXECUTIVE MANAGEMENT As a larger international participant within its industry, the Company is required to compete in an international market for top executive candidates when determining the remuneration for its executive management.
The Company is consequently also dependent on being able to offer remuneration which can attract and retain high-quality persons for the executive management.
It is the Board of Directors' policy to ensure that in order to secure the best possible management of the Company, the Company needs to offer remuneration which is satisfactory to the relevant candidates and which is competitive in an international market.
The level of remuneration shall as a starting point be competitive both in a Norwegian and an international context.

ANNUAL REPORT 2018 | 141
FINANCIAL STATEMENTS & NOTES
3. REMUNERATION AND OTHER SALARY It is the Company's policy that the remuneration to the executive management mainly shall be paid in the form of a monthly salary which reflects the employees' position, experience and expertise.
Bonus schemes for the executive management shall partly be linked to the Company's results and partly determined at the discretion of the Board of Directors.
The Board of Directors' discretion shall, inter alia, consider achievements on financial, operational and organizational targets.
The bonus arrangement for the executive management is capped at different levels, up to a maximum of 150 % of the regular annual salary for the relevant persons.
The executive management may be offered free use of a company car in addition to other normal employee benefits such as free phone, internet access, etc.
Special pension plans may be established for the executive management. The members of executive management are currently members of a pension plan financed from operations. The operations pension plan is not subject to the legislation on defined contribution pensions or the legislation on enterprise pensions, and is not funded. The annual pension entitlement is calculated as 25 percent of salaries exceeding 12 G for the CEO and the other members of executive management.
Arrangements for remuneration post termination of employment will normally be viewed in connection with competition clauses in the relevant person's employment agreement, so that they shall only compensate for any restrictions in the relevant person's ability to seek new employment, and otherwise in accordance with applicable law. Arrangements for remuneration post termination of employment shall at the outset provide for deduction of salary from other employers.
When considered appropriate, the Board of Directors may also agree that certain members of the executive management shall have a contractual severance payment included in their employment contracts. The CEO, the CFO and the EVP EVRY Norway have, on certain customary terms, a right to up to a twelve-month severance payment package. No other members of the executive management currently have severance packages.
4. LONG TERM INCENTIVE PROGRAM The Company has established a long-term incentive programme ("LTIP"), pursuant to which members of management and key employees, may be granted options to subscribe for shares in the Company.
Participation in the LTIP each year will be decided by the Company's Board of Directors, based on recommendations from the remuneration committee in connection with annual allocations. The total maximum award each year, in terms of options that can be granted under the LTIP, (the "Annual Award") shall be based on inter alia the EVRY Group's overall performance in the preceding financial year. The Annual Award shall, however, not exceed 0.8 percent of the total outstanding share capital in the Company on a fully diluted basis.
The strike price for the options shall be equal to par value of the shares at the time of exercise. The options allocated in any given year will vest linearly with one-third after 12 months, one-third after 24 months and one-third after 36 months, subject to certain hurdles based on fair value of the Shares. The maximum profit through exercise of share options under the LTIP in one year is capped at 200 percent of the annual base salary for the CEO and CFO, and 100 percent of the annual base salary for other employee participants.
5. THE REMUNERATION POLICY IN THE PRECEDING FINANCIAL YEAR The policy for remuneration in the preceding financial year has been conducted based on the same principles as set out in this statement. In addition, a number of previously existing incentive arrangements were triggered by the listing of the Company on Oslo Børs, as further described in the Company's prospectus dated 6 June 2017 and published in connection with the listing.
6. TREATMENT OF THIS STATEMENT This statement is provided to the Company's shareholders in connection with the notice of the Annual General Meeting for 2018.
This statement shall be considered by the General Meeting and the General Meeting shall hold an advisory vote in which the General Meeting may approve or reject the guidelines set out in this statement.
With respect to the guidelines relating to remuneration in the form of shares, subscription rights, options and other forms of remuneration linked to shares or the development of the price of the shares in the Company or other companies in the group (ref. Section 4 above), the General Meeting's vote will be binding on the Board of Directors.

142 | ANNUAL REPORT 2018
EMPLOYEE SHARE OPTIONS
Share option programThe company operates a share option program for members of executive management and key employees in leading positions. 71 employees were included in the program at 31 December 2018.
The total maximum allocation each year, in terms of options that can be granted under the LTIP, (the "Annual Award") shall be based on inter alia the EVRY Group's overall performance in the preceding financial year. The Annual Award shall, however, not exceed 0.8 percent of the total outstanding share capital in the Company on a fully diluted basis.
The options allocated in any given year will vest linearly with one-third after 12 months, one-third after 24 months and one-third after 36 months. The overall value of the program is linked to EVRY's share price at the Oslo Stock Exchange. Participants in the program are granted an option to subscribe for a certain number of shares in EVRY at a strike price of NOK 1.75 provided the fair value of EVRY's shares meets certain thresholds. In order for the options to become exercisable, the EVRY share price must be at or above the so called "Fair Market Value" of EVRY's shares at the grant date. The Fair Market Value of EVRY's shares shall be determined by using the volume weighted average trading price of the EVRY shares in the 15 days before and 15 days after the grant date. The participant must be employed at the time of vesting and exercise.
Shares received following exercise of vested options will be subject to a 12-month lock-in period. In this period the participants cannot sell the shares other than to be able to pay taxes resulting from exercise of the options. In addition to the lock-in period, there is also a cap on the maximum profits the participants can receive when exercising the options. The cap is individually set for each participant.
Options outstanding at 31.12:
2018 2017
Options outstanding at 1.1 2 305 847 - Options granted 2 557 045 2 305 847 Options exercised - - Options terminated -516 195 - Options expired - - Options outstanding at 31.12 4 346 697 2 305 847 Of which fully vested 616 849 -
Accrued Social Security tax at 31.12 (NOK million) 6.2 0.4Option cost recognised to profit and loss (NOK million) 27.1 1.8
Provision is made for employer's social security contributions on the difference between the exercise price of options vested and the market value at 31 December each year.
The fair value of options is calculated when they are granted, and charged to profit and loss over the vesting period and off set against equity. The fair value of options is calculated by using a Monte Carlo simulation.
The following assumptions are used for the calculation:
2018 2017
Fair Market Value (at grant date) 30.15 32.30Option exercise price (NOK) 1.75 1.75Average volatility 0.27 % 0.27 %Expected dividend yield 4 % 4 %Vesting period 12-36 months 12-36 monthsExpire (from grant date) 7 years 7 years
NOTE 6

ANNUAL REPORT 2018 | 143
FINANCIAL STATEMENTS & NOTES
VolatilityHistoric volatility is assumed to be a reasonable indicator of future volatility. Future volatility is therefore defined as historic volatility for the same period as the vesting period. As EVRY does not have sufficient history to use its own volatility, the average volatility of a set of peers has been used to determine the expected volatility for the lifetime of the options.
Risk-free interest rateThe risk-free interest rate used for option calculations is collected as of grant date from Norges Bank and Oslo Stock Exchange. Where there is no exact match between the term of the interest rates and the term of the options, interpolation is used to estimate a comparable term. The risk-free rate on the grant date ranges from 0.34 percent (1 year) to 1.24 percent (interpolated year).
PENSIONS
The Group provides pensions principally through insured collective schemes with life insurance companies. Pension arrangements related at 31 December 2018 to 5 570 active employee members of defined contribution pension schemes and 542 pensioners in insured defined benefit schemes. In addition the Group have various compensation- and uninsured pension plans that includes 1 313 employees. The presentation of pension costs and pension liabilities set out below aggregates the various pension arrangements provided by the Group. The figures therefore include a number of different defined benefit, defined contribution and multi-company pension schemes.
The Group’s Norwegian companies operate a defined contribution pension scheme for employees. The annual contributions to this scheme are at the rates of 4.25 percent for salaries up to 7.1 times the social security base amount (G) and 8 percent for salaries between 7.1G and 12G. From 1.1 2017 the break point was moved from 6G to 7.1G as a consequence of a change in the Defined-Contribution Pensions Act. The scheeme meets the Norwegian legal requirements for mandatory occupational pension ("obligatorisk tjenestepensjon").
The majority of the employees of the Group’s Norwegian companies is members of the common scheme of AFP early retirement pension arrangement.The scheme gives a lifelong supplement to the ordinary pension. Employees can choose whether to draw the new AFP pension from 62 years of age, even if they continue to work, and additional rights can be earned by working until 67 years of age. The scheme is a multi-company defined benefit scheme, and is financed by premium payments determined as a percentage of salary. There is as yet no reliable measurement and allocation of liabilities and assets between the companies that participate in the scheme. The new scheme is therefore treated for accounting purposes as a defined contribution pension scheme and the premiums paid are recognised as costs through profit and loss with no provision made in the accounts. The premiums paid in 2018 were set at 2.5 percent of total salary payments for salary payments to the employer’s employees between the social security base amount (G) and 7.1G. The equivalent premium rate for 2019 will be unchanged at 2.5 percent. The scheme is underfunded, and the administrator (Fellesordningen for AFP) assumes that premiums will have to increase over time in order to ensure sufficient buffer capital to cope with increased payments. Companies that participate in the AFP scheme are jointly and severally liable for two-thirds of the pension payments due to employees who satisfy the terms and conditions at any time. The liability applies both to shortfalls in premium payments and if the premium rate applied proves insufficient to meet the liabilities. In the event that the scheme is terminated, the participating companies have a duty to continue to make premium payments to provide for pension payments to employees who are members of the scheme or who satisfy the requirements of collective agreements for such pension arrangements at the date of termination.
Employees in the Group’s Swedish companies are principally members of the ITP pension scheme. The ITP scheme is based on collective agreement between the Confederation of Swedish Enterprise and the Council for Negotiation and Co-operation representing salaried employees within the private sector. ITP came into operation on 1 July 2007, and applies to employees born in 1979 or later. All new employees become members of the scheme at 25 years of age. The ITP scheme is a defined contribution scheme, to which the employer contributes 4.5 percent of salary up to 7.5 times the "basic income amount" and 30 percent of salary over this amount. Employees born before 1979 are members of the old scheme, which is a combination of a defined contribution scheme and a defined benefit scheme (ITPK and ITP2 respectively). ITP2 is a multi-company schemethat provides a retirement pension calculated as 10 % of final salary for salary up to 7.5 times the "basic income amount", 65 percent of final salary for salary between 7.5 times and 20 times the "basic income amount" and 32.5 percent of final salary for salary between 20 times and 30 times the "basic income amount". Full pension entitlement is earned after 30 years of pension-able employment. There is no reliable measurement and allocation of the company’s share of the overall assets and liabilities of the scheme. The scheme is therefore treated in the accounts as a defined contribution scheme. ITPK is a defined contribution scheme with a contribution rate of 2 % with the possibility of additional contributions by agreement.
NOTE 7

144 | ANNUAL REPORT 2018
The members of executive management are members of a pension plan financed from operations. The operations pension plan is not subject to the legislation on defined contribution pensions or the legislation on enterprise pensions, and is not funded. The annual pension entitlement is calculated as 25 percent of salaries exceeding 12 G for the Chief Executive Officer and the other members of executive management. The annual return shall at a minimum equal 12 months NIBOR as at 31 December of the previous year. The accumulated accrued entitlement, including investment return and employer’s social security contributions, totalled NOK 23.2 million at 31 December 2018.
Pension costs
(NOK million) 2018 2017
Current value of pension entitlement accrued over the year 17.1 18.5Net interest on pension liabilities 5.0 3.3Curtailments and settlements 0.1 -2.0Pension costs charged to profit and loss from defined benefit plans 22.3 19.8Defined contribution schemes and early retirement plans 356.9 346.6Pension costs charged to profit and loss 379.1 366.5
Change in calculated pension liabilities
(NOK million) 1.1 - 31.12.2018 1.1 - 31.12.2017
Defined benefit obligations 1 January 767.0 818.6Current value of pension entitlement accrued over the year 17.1 18.5Interest on pension liabilities 16.5 18.1Actuariel gains and losses 5.4 32.5Acquisition/sale of business, curtailment and settlement 0.7 -82.0Pension payments -40.2 -38.8Defined benefit obligations 31 December 766.6 767.0
Change in fair value of plan assets
(NOK million) 1.1 - 31.12.2018 1.1 - 31.12.2017
Fair value of plan assets 1 January 567.6 651.6Actual return on plan assets -5.1 10.2Curtailment and settlement - -76.3Pension premium paid 7.7 10.8Pension payments -25.7 -28.7Fair value of plan assets 31 December 544.5 567.6
Pension liabilities
(NOK million) 1.1 - 31.12.2018 1.1 - 31.12.2017
Gross liability to provide pensions (PBO) 766.6 767.0Fair value of plan assets 544.5 567.6Effect of asset ceiling -50.9 -66.1Net pension liability 273.0 265.5
Plan assets in the statement of financial position - - Pension liabilities in the statement of financial position 273.0 265.5

ANNUAL REPORT 2018 | 145
FINANCIAL STATEMENTS & NOTES
Change in pension liabilities
(NOK million) 1.1 - 31.12.2018 1.1 - 31.12.2017
Pension liabilities 1 January 265.5 217.6Pension costs 22.3 19.8Effect of actuarial gains and losses recognised as comprehensive income 7.8 52.7Premium payments -7.7 -10.8Acquisition/sale of business - -3.7Benefits paid and Paid-up policies -14.9 -10.0Pension liabilities 31 December 273.0 265.5
The effect of asset ceiling of NOK 50.9 million relate to pension plans which have an overfunding exceeding the asset ceiling.
The effect for the year of actuarial gains and losses recognised as other comprehensive income represented an increase in pension liability of NOK 7.8 million, principally as the result of lower return than expected on plan assets.
The summarised information presented is based on annual calculations carried out by an independent actuary.
The following assumptions are used in the actuarial calculations:
2018 2017
Discount rate 2.60 % 2.40 %Future salary inflation 2.75 % 2.50 %Growth in the basic state pension (G) 2.50 % 2.25 %Annual increase in pensions 0.80 % 0.50 %Staff turnover Own table Own tableMortality assumptions K2013 K2013
The assumptions used for pension calculations follow the guidelines issued by the Norwegian Accounting Standards Board (NRS) as at 31 December 2018. Over recent years, the Norwegian market for covered bonds has grown strongly. NRS has therefore accepted the use of covered bond interest rates as the basis for the discount rate for pension calculations instead of using the interest rate on Norwegian government bonds. Based on it's assessment of the depth in the Norwegian market for covered bonds, EVRY has applied the parameters recommended by the NRS guidelines, which includes using the covered bond interest rate as the basis for the discount rate.
Pension calculations use the K2013 table for mortality risk, which is based on the best estimate of the population in Norway. The risk table for disability, IR02, corresponds with the estimated risk of disability in the Group. Extracts of information from the risk tables are provided below. The table shows the likelihood of an employee in a specified age group for men and women becoming disabled or dying within 12 months, and also shows life expectancy.
Life expectancy (age) Mortality expectancy (%) Disability expectancy (%)
Age Men Women Men Women Men Women
20 89.9 94.0 0.02 % 0.01 % 0.10 % 0.10 %40 88.4 92.1 0.05 % 0.03 % 0.20 % 0.30 %60 87.2 90.7 0.39 % 0.27 % 1.90 % 2.90 %80 90.0 92.4 4.03 % 2.78 % - -

146 | ANNUAL REPORT 2018
Uncertainty of estimatesCalculations of pension cost for the year and the book value of pension liability are based on the assumptions above. Considerable uncertainty attaches to the amounts calculated, which principally vary in pace with the level of interest rates in Norway.The plan assets as of 31 December were invested as follows:
Investment category
2018 2017
Bonds 67 % 63 %Equity securities 27 % 29 %Properties 5 % 7 %Other 1 % 1 %Total 100 % 100 %
Pension assets are invested in bonds issued by the Norwegian government, Norwegian municipalities, financial institutions and corporations. Bonds held in foreign currencies are to a large extent currency hedged. Pension assets are invested both in Norwegian and foreign equity securities. The currency hedging policy for foreign equity securities is evaluated on an individual investment basis. Pension assets are invested in accordance with the guidelines applying to life insurance companies.
The Group expects to pay approximately NOK 8 million in pension premiums to the Group’s defined benefit plans in 2019.
The weighted average duration of the Group's pension liabilities as at 31 December 2018 was 12 years, and the maturity structure over the next 10 years is as follows:
(NOK million)
Year 1 34.9Year 2 34.9Year 3 36.1Year 4 37.1Year 5 38.0Year 6-10 212.4

ANNUAL REPORT 2018 | 147
FINANCIAL STATEMENTS & NOTES
Sensitivity analysisThe table below shows the estimated percentage change in pension liability and pension cost for the defined benefit pension schemes in Norway in the event of a one percentage point change in the most important parameters. This analysis has been carried out using a method that extrapolates the effect on pension liabilities of a change in the calculation parameters at the expiry of the reporting period.
PBO Pension costs
Discount rate -1 % 11.4 % 1.8 %Discount rate +1 % -9.3 % -1.5 %Future salary inflation -1 % -0.4 % -1.6 %Future salary inflation +1 % 0.7 % 2.1 %Growth in the basic state pension (G) -1 % 0.4 % 1.3 %Growth in the basic state pension (G) +1 % -0.3 % -1.1 %Annual growth in pensions -0.5 % -5.4 % -0.6 %Annual growth in pensions +1 % 10.8 % 1.1 %
Risk assessmentThe Group is exposed to various risks in relation to its defined benefit pension arrangements as a result of uncertainty in relation to the assumptions applied and future outcomes. The most important areas of risk relate to increasing life expectancy, the risk of a reduction in the actual return earned on pension assets, interest rate level in Norway and risks associated with higher inflation and salary increases. Changes of this nature would cause an increase in liability for the Group. However, risk exposure in this respect has been significantly reduced following the closure by the Group of a number of defined benefit pension schemes over recent years.
COST OF GOODS SOLD AND OTHER OPERATING COSTS
Cost of goods sold comprise:
(NOK million) 2018 2017
Purchase and lease of software 482.2 441.0Purchase and lease of hardware 98.9 101.0Consulting services 596.7 550.4Network capacity 187.6 207.8Use of goods embedded in service deliveries 1 530.9 1 491.6Other cost of goods sold 1 770.8 1 901.0Total cost of goods sold 4 667.1 4 692.7
Other cost of goods sold are mainly related to the long-term partner agreement with IBM, where IBM operates EVRY’s basis infrastructure platform.
Other operating costs comprise:
(NOK million) 2018 2017
Premises rental and other premises costs 568.0 626.2Consulting costs 292.9 346.3Travel costs 164.6 148.0Other operating costs 257.4 295.5Total other operating costs 1 282.8 1 415.9
Consulting costs which are reinvoiced as a part of a customer contract are classified as cost of goods sold in the statement of comprehensive income. Other consulting costs are classified as other operating costs.
NOTE 8

148 | ANNUAL REPORT 2018
Auditor’s remunerationThe following table shows remuneration to the Group's auditor, EY, in respect of audit services delivered, including the amounts invoiced in respect of audit-related and tax-related services. The amounts shown include both Norwegian and foreign subsidiaries, and are exclusive of value added tax.
(NOK million) 2018 2017
Audit fee 8.155 8.201 Other attestation services 5.777 14.402 Tax services 2.607 1.855 Other services 2.363 9.068 Total remuneration 18.902 33.527
Other attestation services includes services related to ISAE 3402 and SAS 70. These expenses are mainly reinvoiced by the company.
FINANCIAL ITEMS
(NOK million) 2018 2017
Interest income 10.5 16.8Other financial income 2.2 3.7Total financial income 12.7 20.5
Interest expenses 175.4 331.3Other financial expenses 41.5 374.9Total financial expense 217.0 706.2
Currency gains 145.3 309.7Currency losses 171.8 296.5Net foreign exchange gain/-loss -26.5 13.2
Net financial expenses in 2018 was NOK 230.8 million, a decrease of NOK 441.7 million from NOK 672.5 million in 2017. The net financial expenses in 2017 were driven by the refinancing of the Group’s debt facilities completed in connection with the IPO in June 2017, where refinancing costs added up to NOK 313 million, where of NOK 195 are realted to arragement fees on the old financing agreement.
The reduction in net financial expenses in 2018 were also due to significantly lower leverage during the year compared to 2017.
See note 4 for further information on the Group's financing agreements.
NOTE 9
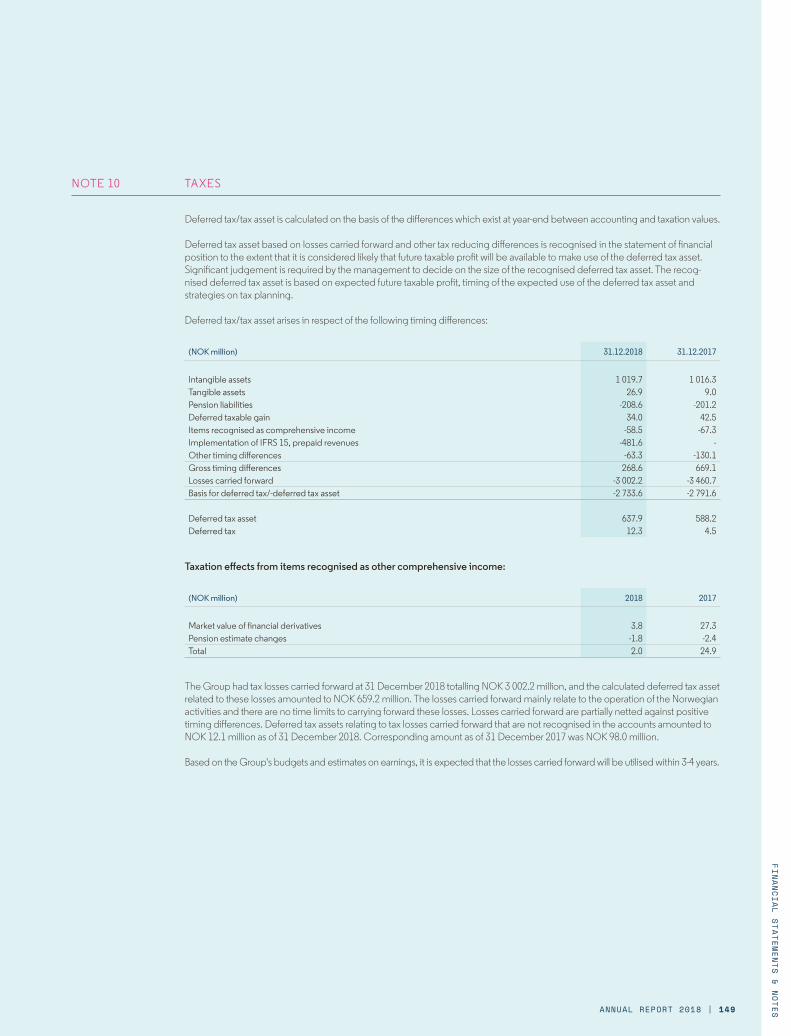
ANNUAL REPORT 2018 | 149
FINANCIAL STATEMENTS & NOTES
TAXES
Deferred tax/tax asset is calculated on the basis of the differences which exist at year-end between accounting and taxation values.
Deferred tax asset based on losses carried forward and other tax reducing differences is recognised in the statement of financial position to the extent that it is considered likely that future taxable profit will be available to make use of the deferred tax asset. Significant judgement is required by the management to decide on the size of the recognised deferred tax asset. The recog-nised deferred tax asset is based on expected future taxable profit, timing of the expected use of the deferred tax asset and strategies on tax planning.
Deferred tax/tax asset arises in respect of the following timing differences:
(NOK million) 31.12.2018 31.12.2017
Intangible assets 1 019.7 1 016.3 Tangible assets 26.9 9.0 Pension liabilities -208.6 -201.2 Deferred taxable gain 34.0 42.5 Items recognised as comprehensive income -58.5 -67.3 Implementation of IFRS 15, prepaid revenues -481.6 - Other timing differences -63.3 -130.1 Gross timing differences 268.6 669.1 Losses carried forward -3 002.2 -3 460.7 Basis for deferred tax/-deferred tax asset -2 733.6 -2 791.6
Deferred tax asset 637.9 588.2 Deferred tax 12.3 4.5
Taxation effects from items recognised as other comprehensive income:
(NOK million) 2018 2017
Market value of financial derivatives 3.8 27.3Pension estimate changes -1.8 -2.4Total 2.0 24.9
The Group had tax losses carried forward at 31 December 2018 totalling NOK 3 002.2 million, and the calculated deferred tax asset related to these losses amounted to NOK 659.2 million. The losses carried forward mainly relate to the operation of the Norwegian activities and there are no time limits to carrying forward these losses. Losses carried forward are partially netted against positive timing differences. Deferred tax assets relating to tax losses carried forward that are not recognised in the accounts amounted to NOK 12.1 million as of 31 December 2018. Corresponding amount as of 31 December 2017 was NOK 98.0 million.
Based on the Group's budgets and estimates on earnings, it is expected that the losses carried forward will be utilised within 3-4 years.
NOTE 10

150 | ANNUAL REPORT 2018
(NOK million) 2018 2017
Changes in deferred tax Change in deferred tax to profit and loss 77.8 -121.2 Deferred tax from implementation of IFRS 15 (booked against equity) -121.7 - Other changes in deferred tax not taken to profit and loss 2.0 24.9 Change in deferred tax in the statement of financial position -41.8 -96.2
Tax cost for the year comprisesTax payable 49.1 49.0 Change in deferred tax to profit and loss 77.8 -121.2 Witholding tax 20.5 Under/over accrual of tax prior year 3.4 0.1 Total tax of the year 150.8 -72.1
Tax expense related to transaction costs recorded directly against equity - 13.4
Reconciliation of tax of the year23 % of profit/-loss before tax (24 % in 2017) 181.8 -80.0 Expenses not deductible 5.5 1.8 Non-taxable income -5.9 - Change in valuation allowance -81.9 -10.3 Withholding tax 20.5 - Tax rate differences abroad 2.8 1.9 Tax rate change in Norway and Sweden 22.1 26.6 Under/over accrual of tax prior year 3.4 0.1 Other permanent differences 2.4 -12.2 Tax of the year 150.8 -72.1
Effective tax rate 19.1 % 21.6 %
EARNINGS AND PROPOSED DIVIDEND PER SHARE
Basic earnings per share is calculated as profit/-loss for the year attributable to shareholders (owners of the parent company) divided by the average weighted number of shares outstanding over the year.
Diluted earnings per share is calculated as profit/-loss for the year attributable to shareholders (owners of the parent company) adjusted for all dilutive effects in respect of options.
(NOK) 2018 2017
Profit/-loss for the year attributable to shareholders (owners of the parent) 639 700 000 -262 200 000
Weighted average number of shares in the period 370 806 077 319 072 529Effect of share options (employees) 1 485 391 40 566 Diluted weighted average number of shares 372 291 468 319 113 095
Earnings per share, basic (NOK) 1.73 -0.82Earnings per share, diluted (NOK) 1.72 -0.82
Dividend proposed for approval by the Annual General Meeting (not recognised as a liability at 31 December)Proposed total dividend payment (NOK) 648 910 635 463 507 596 Proposed dividend per share (NOK) 1.75 1.25
NOTE 11

ANNUAL REPORT 2018 | 151
FINANCIAL STATEMENTS & NOTES
INTANGIBLE ASSETS
(NOK million) Goodwill
In-houseDeveloped
Software
Other intangible
assets
Customer contracts and other intangible
assets allocated from acquisitions Total
Book value at 1 January 2017 5 577.7 433.0 123.6 16.0 6 150.2 -
Additions in the year 37.2 206.3 44.0 0.9 288.4 Disposal/reclassification in the year - - -6.3 - -6.3 Depreciations - -55.7 -30.7 -14.4 -100.8 Translation differences 121.2 12.2 -6.5 - 126.8 Book value at 31 December 2017 5 736.1 595.8 124.0 2.5 6 458.3
Additions in the year 180.8 260.5 64.5 - 505.7 Disposal/reclassification in the year -2.8 -1.9 - - -4.6 Depreciations - -57.0 -26.7 -0.8 -84.4 Write-downs - - -15.5 - -15.5 Translation differences -64.6 6.6 -13.1 - -71.1 Book value at 31 December 2018 5 849.5 804.0 133.1 1.7 6 788.3
Useful life Yearly assessment 5-15 years 2 - 10 years 4 - 10 yearsMethod of depreciation Linear Linear Linear
The additions of goodwill in 2018 are mainly related to the acquisition of Exonor Group AS (NOK 33.1 million), Findwise AB (NOK 139.5 million). All excess values related to the acquisitions have been allocated to goodwill.
Costs of NOK 260.5 million in respect of in-house developed software were capitalised in 2018, of which NOK 201.0 million related to investments carried out in the Financial Services segment. These investments are mainly related to the development of a new core banking and payment solutions. Investments in customer contracts and other intangible assets totalled NOK 64.5 million in 2018. Investments in in-house developed software and other intangible assetes are depreciated when the software or the different modules are delivered and ready to be used by the customer.
When capitalising development costs that relate to the use of internal resources, costs are estimated using an hourly rate based on the direct costs per employee. In the event of any indication of the need for a write-down in respect of an individual development project, the recoverable amount is tested against the book value. The recoverable amount assigned to the development project is determined on the basis of calculations of value in use. These calculations are based on discounting future cash flows that involve uncertainty and require the use of estimates. A change in the forecast revenue or margin used when estimating future cash flows will affect the estimated value of the development project in question. Annual impairment tests are performed for capitalised development projects where amortisation has not yet started. Projects under development have been tested for impairment as of year-end 2018. Based on these tests, no need for impairment has been identified for 2018.
Allocation of goodwill to cash-generating units:
(NOK million) 31.12.2018 31.12.2017
Financial Services 1 612.7 1 612.7 Norway 1 816.1 1 807.9 Sweden 1 867.9 1 759.5 BEKK Consulting 381.8 381.8 Global Delivery 171.0 174.1 Total 5 849.5 5 736.1
NOTE 12

152 | ANNUAL REPORT 2018
The Group evaluates whether there are any indications of a possible impairment of goodwill on a quarterly basis. The price on the Group's listed shares is an important indicator. The Group also tests goodwill for impairment at other times if this becomes necessary as a result of indications of possible impairment, and such tests are always carried out at year-end. Goodwill is tested for impairment for each identified cash generating unit in the Group. A ‘cash generating unit’ represents the lowest identifiable group of assets that generates cash inflow while being for all practical purposes independent of cash inflow generated by other assets or groups of assets. The number of cash generating units in 2018 was five, in line with the Group’s business structure.
For the 2018 financial year the Group has determined the value in use of its cash generating units using the discounted cash flow method. For the Bekk Consulting and Global Delivery cash generating units, fair value has been calculated using valuation multiples. For Bekk Consulting a multiple of 10 x EBITDA in 2018 has been assumed, while for Global Delivery a multiple of 6 x EBITDA has been assumed. Cash flows for after 2018 (terminal values ) have been extrapolated from the cash flows for 2018, adjusted for the expected level of long-term revenue growth. Future cash flows have been determined on the basis of the Board-approved budget for 2019.
The impairment tests carried out at the end of 2018 do not show any need to write down the Group’s goodwill. The Group has delivered financial results for 2018, in line with expectations and it has, together with the cost reduction measures that have been implemented and the outsourcing agreement entered into with IBM, created a sound foundation for strengthening its market position and growth rate going forward.
A change in the yield requirement used for discounting future cash flows will affect the book value of goodwill. An increase in the yield requirement will, in isolation, cause a lower value in use which in turn will cause a fall in the value of goodwill. A change in the WACC used with 2 percentage points will not lead to any write down of goodwill.
The estimates used to determine future cash flows and the discount rate used when calculating value in use are subject to uncertainty. The assumptions applied are as follows:
Growth rateAverage rates of growth in operating revenue are based on management’s expectations of future conditions in the markets in which the business operates. The assumed long-term growth rate beyond the budgets and strategic plans approved by the Board cannot be higher than the long-term rate of growth in the economy where the business operates.
EBITA marginEBITA margins are based on the volume/margins achieved historically, adjusted for expected future developments in market conditions. Programs to improve efficiency that are approved and committed are taken into account in determining the ex-pected future EBITA margins.
Investment (CAPEX)Calculations of value in use assume a normalised relationship between investment and operating revenue. It is assumed that the operational investments and investments in software developed in-house that are necessary to achieve the expected growth in revenue will be carried out. The cash generating unit Financial Services is more capital intensive than the other cash generating units, and accordingly CAPEX for this unit is forecast at a higher percentage of revenue.
Discount rateFuture cash flows are discounted to present value using a discount rate based on a calculation of a weighted average cost of capital (WACC). For 2018, after-tax WACC was assumed to be 7 percent. This is based on a risk-free interest rate of 1.88 percent, a gearing ratio, of 26 percent an equity market premium of 5 percent and equity beta of 1.3. The same WACC is applied for all cash generating units since differences in future uncertainty are reflected in the expected cash flows that form the basis for the calculation of future value in use. The observed level of risk expressed in terms of equity beta is also considered to be close to 1 for all segments in which the Group operates, indicating that the same WACC should apply to all cash generating units.

ANNUAL REPORT 2018 | 153
FINANCIAL STATEMENTS & NOTES
NOTE 13 PROPERTY, PLANT AND EQUIPMENT
(NOK million)
Improvements to leased
premises 1)Machinery/
fixtures 1) VehiclesIT
equipment Total
Acquisition cost at 1 January 2017 143.9 562.1 1.7 954.3 1 661.9
Reclassifications 24.9 -21.3 0.1 -3.7 - Additions 14.2 75.6 0.2 44.3 134.3 Disposals -0.4 -97.8 -0.1 -295.4 -393.7 Translation differences 1.5 6.3 - 7.5 15.3 Acquisition cost at 31 December 2017 184.1 524.9 1.9 707.0 1 417.9
Reclassifications -22.5 -41.6 - -294.6 -358.7 Additions 1.8 42.9 0.8 31.9 77.3 Additions through acquisitions - 0.9 - 0.2 1.1 Disposals - - - - - Translation differences -1.9 -3.1 - -5.6 -10.6 Acquisition cost at 31 December 2018 161.4 524.0 2.7 438.9 1 127.0
Accumulated depreciation/write-down at 1 January 2017 105.2 370.7 0.7 759.6 1 236.2
Reclassifications 22.7 -24.5 0.2 1.6 - Depreciations 8.6 63.1 0.2 91.2 163.1 Write-downs - - - 26.1 26.1 Disposals -0.4 -96.0 -0.1 -295.7 -392.1 Translation differences 1.0 4.6 - 3.0 8.6 Accumulated depreciation/write-down at 31 December 2017 137.1 317.9 1.1 585.8 1 041.9
Reclassifications -21.9 -37.9 - -291.6 -351.4Depreciations 8.4 57.0 0.2 65.3 130.9 Additions through acquisitions - 0.2 - 0.6 0.9 Disposals - - - - - Translation differences -1.5 -2.4 - -5.7 -9.6Accumulated depreciation/write-down at 31 December 2018 122.1 334.8 1.3 354.5 812.7
Depreciation rates 2) 10-20 % 15-30 % 20 % 20-33 %Depreciation method Linear Linear Linear Linear
Book valueAt 31 December 2018 39.4 189.2 1.4 84.3 314.3 At 31 December 2017 47.0 207.0 0.9 121.1 376.0
1) Fixtures and fittings in leased premises are depreciated over the residual period of the lease if this is shorter than the normal depreciation period.2) Depreciation rates stated are valid for both 2018 and 2017.

154 | ANNUAL REPORT 2018
INTERESTS IN SUBSIDIARIES, ASSOCIATED COMPANIES AND JOINT VENTURES
Shares in subsidiaries owned by parent company
Company Registered office Ownership share Voting share
EVRY Norge AS Bærum, Norway 100 % 100 %EVRY Sweden Holding AB Stockholm, Sweden 100 % 100 %EVRY Card Services AS Mo i Rana, Norway 100 % 100 %EVRY Danmark A/S Viborg, Denmark 100 % 100 %EVRY Økonomitjenester AS Trondheim, Norway 100 % 100 %Fellesdata AS Bærum, Norway 100 % 100 %
In addition to subsidiaries owned by the parent company, the following material companies are consolidated in the Group accounts:
Company Registered office Ownership share Voting share
EVRY AB Stockholm, Sweden 100 % 100 %EVRY Card Services AB Stockholm, Sweden 100 % 100 %Infopulse Ukraine LLC Kiev, Ukraine 100 % 100 %EVRY India Private Limited Bangalore, India 100 % 100 %EVRY USA Corporation Inc California, USA 100 % 100 %Eye-share AS Stavanger, Norway 100 % 100 %Bekk Consulting AS Oslo, Norway 100 % 100 %EVRY Sweden AB Jönköping, Sweden 100 % 100 %EVRY Financing AS Bærum, Norway 100 % 100 %
The subsidiary EVRY Financial Service UK Limited (register number 05042894) has for 2018 used an exemption in the Companies Act (section 479A) relating to audit of the accounts. The company's financial statements for 2018 have thereby not been audited.
Interests in joint ventures:The Group has a 50 percent share in the joint venture Buypass AS. The other 50 percent share is held by Norsk Tipping AS. The investment is recognised in the consolidated accounts in accordance with the equity method.
(NOK million) Buypass AS
Book value at 1 January 2018 62.7The Group's share of this years profit/-loss 16.1Book value at 31 December 2018 78.9
Summarised financial information - Buypass AS (NOK million):
Company Assets Liabilities EquityOperating
revenueProfit for the year
Buypass AS 379.4 221.9 157.5 225.1 24.8
NOTE 14

ANNUAL REPORT 2018 | 155
FINANCIAL STATEMENTS & NOTES
ACCOUNTS RECEIVABLE
Accounts receivable are recognised at their nominal value less a provision for losses.
(NOK million) 31.12.2018 31.12.2017
Gross outstanding 1 707.4 1 671.0 Provision for losses on receivables -6.2 -7.6 Net accounts receivable 1 701.2 1 663.3
Loss on receivables to profit and loss 1.4 4.1
Age distribution accounts receivable
Not overdue
Less than 30 days
overdue30 - 60 days
overdue61 - 90 days
overdue 91 - 180 daysMore than
180 days overdue
31 December 2018 74 % 14 % 3 % 3 % 2 % 4 %31 December 2017 74 % 18 % 2 % 1 % 2 % 4 %
OTHER FINANCIAL ASSETS
Other non-current financial assets
(NOK million) 31.12.2018 31.12.2017
Contract assets 44.9 39.5Other non-current financial assets 276.1 236.9Total other non-current assets 321.0 276.4
Other non-current financial assets is mainly related to prepayments in relations with the partner agreement with IBM.
Other current receivables
(NOK million) 31.12.2018 31.12.2017
Contract assets 349.0 296.2Prepaid expenses 524.0 471.3Advance income tax 73.9 145.4Other current financial assets 109.0 115.2Total other current assets 1 055.9 1 028.1
Implementation projects (included in contract assets) related to customer contracts which constitute an integral part of subse-quent operations deliveries are capitalised on the balance sheet and allocated over the lifetime of the operations contract in question. Implementation projects are reported net in the statement of financial position. The proportion expected to be allo-cated over the following 12 months is classified as current, while the remaining amount is classified as long-term in the statement of financial position.
NOTE 15
NOTE 16

156 | ANNUAL REPORT 2018
BANK DEPOSITS/GUARANTEE LIABILITIES
EVRY has established a group bank account system whereby EVRY ASA operates the group account, while other group companies are sub-account holders. The bank nets all balances and withdrawals to create a net position that represents the credit or debit balance between DNB Bank ASA and EVRY ASA.
The Group has issued a guarantee in respect of tax deductions from salaries due to the tax authorities. The guarantee amount was NOK 208 million at 31 December 2018. Other bank guarantees amounted to NOK 175 million at 31 December 2018, including a guarantee of NOK 132 mill in favour of Norsk Tillitsmann Pensjon AS as collateral for employees’ accrued compensation rights arising from the transition from defined benefit to defined contribution pension arrangements.
EVRY ASA had issued parent company guarantees on behalf of its subsidiary companies amounting to NOK 685 million as of 31 December 2018. The guarantees have no impact on the Groups deposits.
The Group had no restricted deposits at 31 December 2018.
SHARE CAPITAL, SHAREHOLDERS ETC.
The share capital of EVRY ASA consists of:
NumberPar value
(NOK)Book value
(NOK)
Ordinary shares 1 January 2018 370 806 077 1.75 648 910 635
Ordinary shares 31 December 2018 370 806 077 1.75 648 910 635
The company has only one class of shares. All shares in the company have equal voting rights and equal rights to dividends.
In accordance with the company's Articles of Association, the number of shares is the same as the number of ordinary shares issued and fully paid-up.
The company had 1 501 744 own shares as of 31 December 2018.
The company had 4 119 shareholders at the end of 2018 and 87 percent of the shares were held by foreign shareholders.
NOTE 17
NOTE 18

ANNUAL REPORT 2018 | 157
FINANCIAL STATEMENTS & NOTES
The largest shareholders at 31 December 2018 were as follows:
Shareholder Interest
Lyngen Holdco S.A.R.L. 1) 54.3 %Polygon (PE) Holdings LTD 5.2 %Folketrygdefondet 2) 5.1 %State Street Bank and Trust Comp 2.6 %UBS AG 2.0 %Credit Suisse Securities (Europe) 1.3 %State Street Bank and Trust Comp 1.3 %Northern Trust Global Services Plc 1.3 %State Street Bank and Trust Comp 1.2 %Danske Bank A/S 1.1 %Credit Suisse Securities (USA) LLC 1.1 %Artic Funds PLC 1.1 %KLP Aksje Norge 0.9 %State Street Bank and Trust Comp 0.8 %Verdipapirfondet Pareto Investment 0.8 %SEB Prime Solutions Sissener Canop 0.7 %State Street Bank and Trust Comp 0.7 %JPMorgan Chase Bank, N.A., London 0.7 %J.P. Morgan Securities LLC 0.6 %Morgan Stanley & Co. Int. Plc. 0.6 %Total 20 largest shareholders 83.2 %Other shareholders 16.8 %Total 100.0 %
1) Lyngen Holdco S.A.R.L controlled 54.3 percent of the shares in EVRY ASA as of 31 December 2018, held through a custody account with Morgan Stanley & Co. Int. PLC. Lyngen Holdco S.A.R.L is indirectly controlled by private equity funds advised by Apax Partners LLP.
2) The Government Pension Fund Norway.
AUTHORISATION FOR THE BOARD OF DIRECTORS TO INCREASE THE SHARE CAPITAL IN CONNECTION WITHINVESTMENTS, GENERAL CORPORATE PURPOSES AND TRANSACTIONSThe Board of Directors is authorised to increase the share capital by up to NOK 64,891,063. The shareholders' preferential rights pursuant to section 10-4 of the Norwegian Public Limited Liability Companies Act may be set aside. The authorisation also covers share capital increases against non-cash contributions and the right to assume special obligations on behalf of the Company, as well as resolutions on mergers and demergers, cf. sections 13-5 and 14-6 (2) of the Norwegian Public Limited Liability Companies Act. The authorisation can be used in situations as described in the Norwegian Securities Trading Act section 6-17. The authorisation may only be used to raise additional capital for future investments or for general corporate purposes, or to issue shares in connection with acquisitions, mergers, demergers or other transactions.
The authorisation is valid until the Annual General Meeting in 2019, however no longer than until 30 June 2019.
AUTHORISATION FOR THE BOARD OF DIRECTORS TO INCREASE THE SHARE CAPITAL IN CONNECTION WITH INCENTIVE PROGRAMSThe Board of Directors is authorised to increase the share capital by up to NOK 1,730,428. The shareholders' preferential rights pursuant to section 10-4 of the Norwegian Public Limited Liability Companies Act may be set aside. The authorisation can be used in situations as described in the Norwegian Securities Trading Act section 6-17. The authorisation may only be used to issueshares to the Company's employees and/or board members in connection with incentive programs.
The authorisation is valid until the Annual General Meeting in 2019, however no longer than until 30 June 2019.
AUTHORISATION FOR THE BOARD OF DIRECTORS TO ACQUIRE TREASURY SHARESThe Board of Directors is authorised to on behalf of the Company acquire and be granted security in treasury shares up to an aggregate nominal value of NOK 64,891,063. The purchase price for each share shall be minimum NOK 1 and maximum NOK 100. The authorisation may only be used for the purpose of using treasury shares for investment purposes, realise the shares, use the shares as consideration in connection with acquisitions, mergers, demergers or other transactions, or use the shares to fulfil the Company's obligations in connection with incentive programs for the Company's employees and/or board members. The Board of Directors may otherwise freely determine the method of acquisition and disposal of shares.
The authorisation is valid until the Annual General Meeting in 2019, however no longer than until 30 June 2019.

158 | ANNUAL REPORT 2018
OTHER CURRENT LIABILITIES
(NOK million) 31.12.2018 31.12.2017
Accrued expenses 786.8 842.7 Contract liabilities 401.9 212.1 Provisions (note 20) 42.1 146.1 Current liabilities financial lease 3.1 3.1 Other current financial liabilities 113.9 18.9 Total other current liabilities 1 347.9 1 222.9
PROVISIONS
(NOK million)Onerous
contractsRestruc-
turing PremisesOther
provisions Total
Book value at 1 January 2017 13.8 126.7 56.8 9.3 206.6
Provisions made in the year - 112.1 30.3 0.2 142.6 Provisions applied in the year -13.3 -153.5 -28.7 -5.2 -200.7 Translation differences - 1.9 - - 2.0 Book value at 31 December 2017 0.5 87.2 58.4 4.3 150.4
Provisions made in the year - 27.2 - 0.3 27.5 Additions through acquisitions - 7.4 - - 7.4 Provisions applied in the year -0.5 -95.3 -44.9 -2.8 -143.6 Unused provisions - - - - - Translation differences - 2.1 - - 2.1 Book value at 31 December 2018 - 28.6 13.5 1.9 43.9
Current at 31 December 2018 - 28.6 13.5 - 42.1Current at 31 December 2017 0.5 87.2 58.4 4.3 150.4
Non-current at 31 December 2018 - - - 1.9 1.9 Non-current at 31 December 2017 - - - - -
RestructuringProvisions for restructuring are mainly related to severance pay to employees in connection with implementation of the IBM partner agreement.
PremisesProvision is made for premises leases where the premises are not used or are sub-let at a loss.
NOTE 19
NOTE 20

ANNUAL REPORT 2018 | 159
FINANCIAL STATEMENTS & NOTES
LEASING CONTRACTS/CONTRACTUAL COMMITMENTS
Group as lessee – financial leasingThe Group has entered into a financial agreement regarding lease of data center at Gjøvik. The lease expires at 23 September 2023. The Group has an option to acquire the building of NOK 1 after the expire of the lease period.
Assets leased under financial leasing contracts are as follows as of 31 December:
(NOK million) 2018 2017
Premises (data center) 18.7 21.2Net book value 18.7 21.2
Future minimum financial lease payments:
(NOK million) 2018 2017
Up to 1 year 3.5 3.61 to 5 years 13.2 13.5After 5 years - 3.2Total future minimum lease payments 16.7 20.3
Interest -1.0 -1.4Present value of future minimum lease payments 15.7 18.9
Of which:- current liabilities 3.1 3.1- non-current liabilities 12.6 15.7
These leasing contracts do not impose any restrictions on the company’s dividend policy or financing arrangements.
Group as lessee – operational leasingThe Group has entered into a number of operational leasing contracts for, IT equipment, premises (inclusive data center) and dark fiber facilities. The majority of these leasing contracts include options to extend. There are no restrictions to the Group's dividend or financing opportunities related to these leasing contracts.
Leasing costs are made up as follows:
(NOK million) 2018 2017
Premises (inclusive data center) 439.9 457.0IT equipment, vehicles, dark fiber and other 167.3 166.1Total leasing costs 607.1 623.1
NOTE 21

160 | ANNUAL REPORT 2018
The Group has entered into agreements with fixed payments due in respect of the following as of 31 December:
(NOK million) 2019 2020-2023 After 2023
The minimum future operational lease payments in respect of contracts with no cancellation option:
Premises (incl. data centres) 322.6 835.5 989.7IT equipment, vehicles, dark fiber and other 212.3 241.1 -Total 534.9 1 076.6 989.7
Contractual payment commitments:EVRY has also entered into non-cancelable contractual payment commitments of NOK 341 million, related to software licenses and network capacity. These commitments are due within 1-5 years.
The costs for 2018 are made up as follows:
(NOK million) 2018 2017
Software licenses 482.2 441.0Network capacity (ex dark fiber) 182.1 203.1Total contractual Commitments 664.3 644.1
Network capacity does not include dark fiber, which is accounted for as operating leases. A significant part of network capacity costs relates to the provision of customer services and are cancellable in the event of customer cancellations. The Group has also recognized significant operational costs relating to the IBM partner agreement, see note 8 . Such costs are volume dependent and have not been included in the table above.
Significant lease agreementsPremises lease - Fornebu, BærumThe lease expires in 2025 and the rent is adjusted annually in line with CPI. Rental payments are based on total m2. The tenant is responsible for maintaining the interior of the premises at the original standard. Total area of premises is 26 000 m2.
Premises lease - Solna, StockholmThe lease expires in 2027 and the rent is adjusted annually in line with CPI. Rental payments are based on total m2. The tenant is responsible for maintaining the interior of the premises at the original standard. Total area of premises is 9 500 m2.
Premises lease - Skøyen, OsloThe lease expires in February 2019 and the rent is adjusted annually in line with CPI. Rental payments are based on total m2. The tenant is responsible for maintaining the interior of the premises at the original standard. Total area of premises is 41 000 m2, whereas 21 000 m2 is subleased.
Premises lease - Sluppen, TrondheimThe lease expires in 2023 and the rent is adjusted annually in line with CPI. Rental payments are based on total m2. The tenant is responsible for maintaining the interior of the premises at the original standard. Total area of premises is 6 000 m2.
Premises lease - Maskinveien, StavangerThe lease expires in 2020 and the rent is adjusted annually in line with CPI. Rental payments are based on total m2. The tenant is responsible for maintaining the interior of the premises at the original standard. Total area of premises is 6 800 m2.
Premises lease - Fyllingsdalen, BergenThe lease expires in 2026 and the rent is adjusted annually in line with CPI. Rental payments are based on total m2. The tenant is responsible for maintaining the interior of the premises at the original standard. Total area of premises is 5 300 m2.
Premises Data center - FetThe lease expires in 2035 and the rent is adjusted annually in line with CPI. Rental payments are based on total m2. The tenant is responsible for maintaining the interior of the premises at the original standard. Total area of premises is 4 200 m2.

ANNUAL REPORT 2018 | 161
FINANCIAL STATEMENTS & NOTES
RELATED PARTIES
Lyngen Holdco S.A.R.L controlled 54.3 percent of the shares in EVRY ASA as of 31 December 2018, held through a custody account with Morgan Stanley & Co. Int. PLC. Lyngen Holdco S.A.R.L is indirectly controlled by private equity funds advised by Apax Partners LLP. The Group has not had any significant transactions with Lyngen Holdco in the ownership period.
EVRY owns 50 percent of the shares in Buypass AS. The transactions between the parties include operating services related to payment transmission.
For information about remuneration to executive management and the board of directors, see note 5.
DISPUTES AND OTHER LEGAL MATTERS
EVRY is from time to time involved in a number of disputes/legal proceedings in connection with deliveries of products and the interpretation of contracts. While the outcome of these matters is uncertain, management is of the opinion that, on the basis of the information currently available, these matters will be resolved without causing any material impairment to the Group’s financial position, and no material provisions have been made related to these cases as of 31 December 2018.
In September 2016, EVRY signed a new agreement with Telenor to deliver IT infrastructure and cloud services, including a transition and transformation project (ITSSN project). On 11 March 2019 Telenor submitted a statement of claim in an arbitration regarding a dispute in connection with the ITSSN project. Based on the information currently available, the management expects the dispute to be solved without any material adverse effect on the Group’s financial position and no provisions have been made.
EVENTS AFTER BALANCE SHEET DATE
There have been no events after 31 December that have a material effect on the financial statement for 2018.
NOTE 22
NOTE 23
NOTE 24

162 | ANNUAL REPORT 2018
(NOK million) Note 2018 2017
Operating revenue - -
Salaries and personnel costs 2 5.4 13.2 Other operating costs 4 1.3 100.5 Operating profit/-loss -6.7 -113.7
Income from investment in subsidiaries 3 226.1 201.9 Other financial income 5 115.2 248.6 Financial expense 5 229.7 722.7 Net financial items 111.9 -272.3
Profit/-loss before tax 105.2 -385.9
Taxes 6 28.1 -86.3 Profit/-loss for the year 77.1 -299.6
Other comprehensive incomeItems which may be reclassified over profit and loss in subsequent periods (after tax)
Cash flow hedges 12.8 99.4 Total other comprehensive income 12.8 99.4
Total comprehensive income for the year 89.8 -200.3
EVRY ASASTATEMENT OF COMPREHENSIVE INCOME
1 January - 31 December

ANNUAL REPORT 2018 | 163
FINANCIAL STATEMENTS & NOTES
(NOK million) Note 31.12.2018 31.12.2017
Non-current assets Deferred tax asset 6 113.9 145.8 Total intangible assets 113.9 145.8
Shares in subsidiaries 8 6 033.3 5 965.7 Other financial assets 14.0 0.4 Non-current interest bearing receivables 9 2 034.5 2 073.6 Total financial non-current assets 8 081.8 8 039.7
Total non-current assets 8 195.7 8 185.4
Current assets Current receivables 9 235.3 258.4 Bank deposits 7 - - Total current assets 235.3 258.4
Total assets 8 431.1 8 443.9
Equity Share capital 10 648.9 648.9 Own shares 10 -2.6 - Other paid-in equity 2 933.3 3 348.9 Total equity 3 579.5 3 997.7
Liabilities Non-current interest bearing liabilities 11 3 597.4 3 487.2 Non-current non-interest bearing liailities - 3.0 Total non-current liabilities 3 597.4 3 490.3
Accounts payable 1.0 3.1 Deductions and duties payable 1.4 1.2 Bank overdraft 1 226.3 902.3 Other current liabilities 9 25.5 49.3 Total current liabilities 1 254.2 955.8 Total liabilities 4 851.7 4 446.1
Total liabilities and equity 8 431.1 8 443.9
EVRY ASASTATEMENT OF FINANCIAL POSITION
As of 31 December
BÆRUM, 21 MARCH 2019, BOARD OF DIRECTORS OF EVRY ASA
Leif Teksum Al-Noor Ramji Kristin Krohn Devold Tommy Sander Aldrin Sigve Sandvik Lærdal
Bente Lennertzen Jenny Lindh Per Hove CEO
Göran Lindahl CHAIR OF THE BOARD
Salim Nathoo Rohan Haldea Malin Persson Louise Sondergaard

164 | ANNUAL REPORT 2018
(NOK million) 2018 2017
Cash from/to operations: Profit/-loss before tax 105.2 -385.9Share of profit/-loss in subsidiaries -226.5 -201.9Interest income/-expenses 114.5 474.2Paid interests -84.2 -450.2Change in accounts payable -2.1 -2.7Change in other accruals -34.8 34.1Net cash flow from operations -127.8 -532.5
Cash from/to investments: Investment in group companies - - Net cash flow from investments - -
Cash from/to financing: New borrowing (short and long-term) 1 025.0 2 011.9Borrowings repaid -925.0 -4 446.6Dividends paid -463.5 - Proceeds from equity issued - 3 166.7Purchase/sale of own shares -47.1 -Group contribution received 201.4 172.9Net cash flow from financing -209.2 904.9
Changes in foreign exchange rates 13.0 -56.9Net change in cash flow -324.0 315.5Bank overdraft at 1.1. -902.3 -1 217.7Bank overdraft at 31.12 -1 226.3 -902.3
EVRY ASASTATEMENT OF CASH FLOW
1 January - 31 December

ANNUAL REPORT 2018 | 165
FINANCIAL STATEMENTS & NOTES
(NOK million) Share capital Own shares
Other paid-in equity
Actuarial gains/-losses on defined benefit
pension plans
Cumulative cash flow
hedges Retained earnings Total equity
Equity at 1 January 2017 467.8 - 550.1 -2.4 -75.5 77.9 1 017.9
Other comprehensive income 99.4 - 99.4Profit/-loss for the year 2017 -299.6 -299.6Issue of share capital 181.1 2 999.0 3 180.1Allocation of equity -200.3 200.3 0.0Equity at 31 December 2017 648.9 - 3 348.9 -2.4 23.9 -21.5 3 997.7
Other comprehensive income 12.8 - 12.8Profit/-loss for the year 2018 76.2 76.2Dividend -463.3 -463.3Purchase of own shares -2.6 -42.2 -44.8Allocation of equity -415.6 415.6 -Equity at 31 December 2018 648.9 -2.6 2 933.3 -2.4 36.7 -34.3 3 579.5
EVRY ASASTATEMENT OF CHANGES IN EQUITY
1 January - 31 December
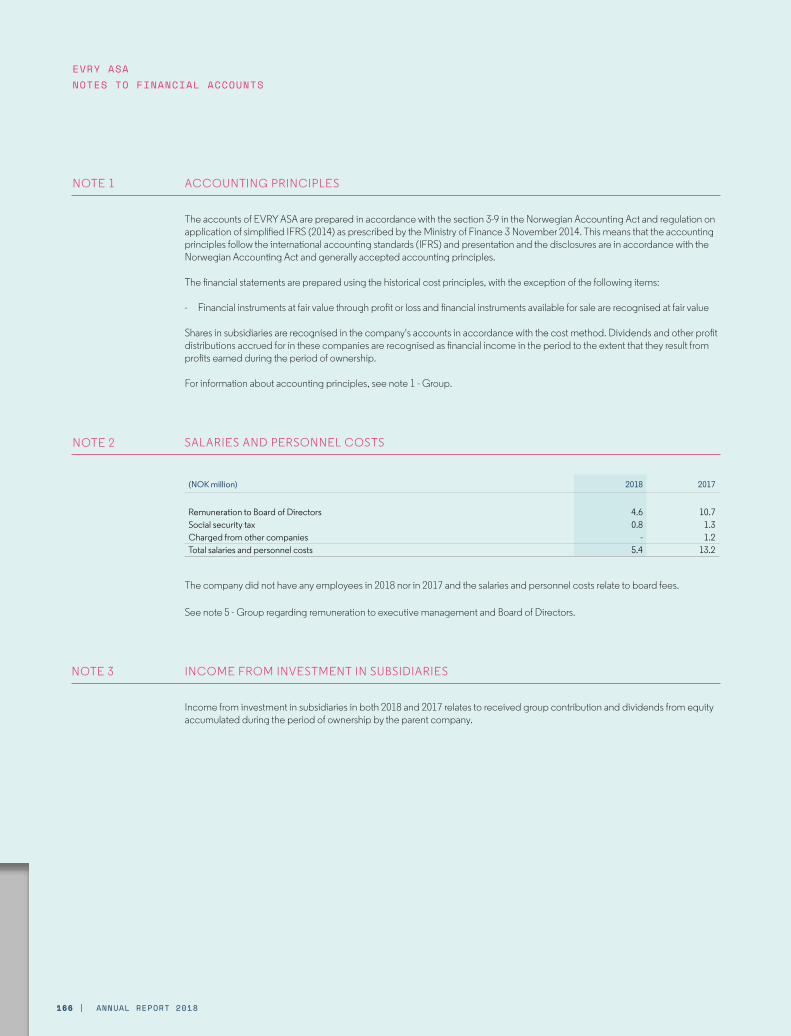
166 | ANNUAL REPORT 2018
ACCOUNTING PRINCIPLES
The accounts of EVRY ASA are prepared in accordance with the section 3-9 in the Norwegian Accounting Act and regulation on application of simplified IFRS (2014) as prescribed by the Ministry of Finance 3 November 2014. This means that the accounting principles follow the international accounting standards (IFRS) and presentation and the disclosures are in accordance with the Norwegian Accounting Act and generally accepted accounting principles.
The financial statements are prepared using the historical cost principles, with the exception of the following items:
- Financial instruments at fair value through profit or loss and financial instruments available for sale are recognised at fair value
Shares in subsidiaries are recognised in the company's accounts in accordance with the cost method. Dividends and other profit distributions accrued for in these companies are recognised as financial income in the period to the extent that they result from profits earned during the period of ownership.
For information about accounting principles, see note 1 - Group.
SALARIES AND PERSONNEL COSTS
(NOK million) 2018 2017
Remuneration to Board of Directors 4.6 10.7 Social security tax 0.8 1.3 Charged from other companies - 1.2 Total salaries and personnel costs 5.4 13.2
The company did not have any employees in 2018 nor in 2017 and the salaries and personnel costs relate to board fees.
See note 5 - Group regarding remuneration to executive management and Board of Directors.
INCOME FROM INVESTMENT IN SUBSIDIARIES
Income from investment in subsidiaries in both 2018 and 2017 relates to received group contribution and dividends from equity accumulated during the period of ownership by the parent company.
NOTE 1
NOTE 2
NOTE 3
EVRY ASANOTES TO FINANCIAL ACCOUNTS

ANNUAL REPORT 2018 | 167
FINANCIAL STATEMENTS & NOTES
OTHER OPERATING COSTS
Other operating costs comprise:
(NOK million) 2018 2017
Consultant costs - 98.5Other operating costs 1.3 2.0Total other operating costs 1.3 100.5
Auditor’s remunerationThe following table shows remuneration to the Group's auditor, Ernst & Young AS, in respect of audit services delivered, including the amounts invoiced in respect of audit related and tax related services. The amounts shown are exclusive of value added tax.
(NOK million) 2018 2017
Audit fee 1.780 1.767 Other attestation services 3.991 13.405 Tax services 1.158 1.721 Other services 2.363 9.002 Total auditor's remuneration 9.292 25.895
Other attestation services include services related to ISAE3402 and SAS70. These expenses are mainly reinvoiced by the company.
FINANCIAL ITEMS
(NOK million) 2018 2017
Intra-group interest income 70.7 80.2External interest income 9.1 14.3Currency gains 35.4 154.0Total other financial income 115.2 248.6
Intra-group interest expense 3.6 4.5External interest expenses 146.1 253.3Currency losses 59.0 154.8Other 21.0 310.2Total other financial expenses 229.7 722.7
NOTE 5
NOTE 4

168 | ANNUAL REPORT 2018
TAXES
Deferred tax/tax asset is calculated on the basis of the differences which exists at year-end between accounting and taxation values.
Deferred tax/tax asset arises in respect of the following differences as of 31 December:
(NOK million) 31.12.2018 31.12.2017
Financial instruments 13.6 -3.0Non-current receivables / loans 14.9 52.8Losses carried forward -546.1 -683.7Gross timing differences -517.6 -633.9
Deferred tax/-deferred tax asset -113.9 -145.8
Calculation of tax base for the yearProfit/-loss before tax 105.2 -385.9Share issue related costs - -56.0Change in timing differences to profit and loss 37.9 -31.5Losses carried forward -143.1 473.4Basis for tax payable - -
Changes in deferred taxChange in deferred tax to profit and loss -28.1 -86.3Tax on equity transactions - 17.0Change in deferred tax -28.1 -69.3
Tax cost for the year comprisesTax payable - - Change in deferred tax 28.1 -86.3Total tax cost 28.1 -86.3
Effect of permanent differences23 % of profit/-loss before tax (24 % in 2017) 24.2 -92.6Tax rate change 5.2 6.3 Other permanent differences -1.3 -Tax for the year 28.1 -86.3
GUARANTEE LIABILITIES/GROUP CASH MANAGEMENT ACCOUNT ARRANGEMENT
EVRY ASA has issued a guarantee of NOK 300 million for borrowings by subsidiaries as part of the group cash management account arrangement. In addition, the company has issued parent company guarantees on behalf of its subsidiaries amounting to NOK 685 million.
EVRY ASA has issued a guarantee in respect of tax deductions from salaries due to the tax authorities. The guarantee amount was NOK 2 million at 31 December 2018.
As of 31 December 2018 the company has no overdraft on the group cash management account arrangement.
See note 17 - Group for information about the group cash management setup.
NOTE 6
NOTE 7

ANNUAL REPORT 2018 | 169
FINANCIAL STATEMENTS & NOTES
SHARES IN SUBSIDIARIES
Shares in subsidiaries are recognised in accordance with the cost method.
Company Registered office Ownership share Voting shareBook value
(NOK million)
EVRY Norge AS Bærum, Norway 100 % 100 % 5 648.4EVRY Sweden Holding AB Stockholm, Sweden 100 % 100 % 111.5EVRY Card Services AS Mo i Rana, Norway 100 % 100 % 272.3EVRY Danmark A/S Viborg, Denmark 100 % 100 % - EVRY Økonomitjenester AS Trondheim, Norway 100 % 100 % 1.1Fellesdata AS Bærum, Norway 100 % 100 % - Total 6 033.3
INTRA-GROUP ACCOUNTS RECEIVABLES AND LIABILITIES
(NOK million) 2018 2017
ReceivablesNon-current interest bearing receivables 2034.5 2073.6Group contribution 171.0 201.9Accrued interest income 64.4 53.9 Total receivables 2 269.8 2 329.4
LiabilitiesGroup contribution 10.0 - Other current non-interest bearing liabilities - 8.9 Total liabilities 10.0 8.9
Non-current interest bearing receivables are due in 2020 or later.
SHARE CAPITAL, SHAREHOLDERS ETC.
See note 18 - Group for information about share capital, shareholders etc.
NOTE 8
NOTE 9
NOTE 10

170 | ANNUAL REPORT 2018
FINANCIAL INSTRUMENTS
(NOK million) 31.12.2018 31.12.2017
Liabilities to credit institutions 3 632.9 3 532.9 Capitalised arrangement fees -35.4 -45.6Total non-current interest bearing liabilities 3 597.4 3 487.2
See note 4 - Group for information about financial instruments.
RELATED PARTIES
There have been no significant transactions with the shareholders in 2017 or 2018.
For information about remuneration to executive management and board of directors, see note 5 - Group.
See note 22 - Group on related parties for further information.
NOTE 12
NOTE 11
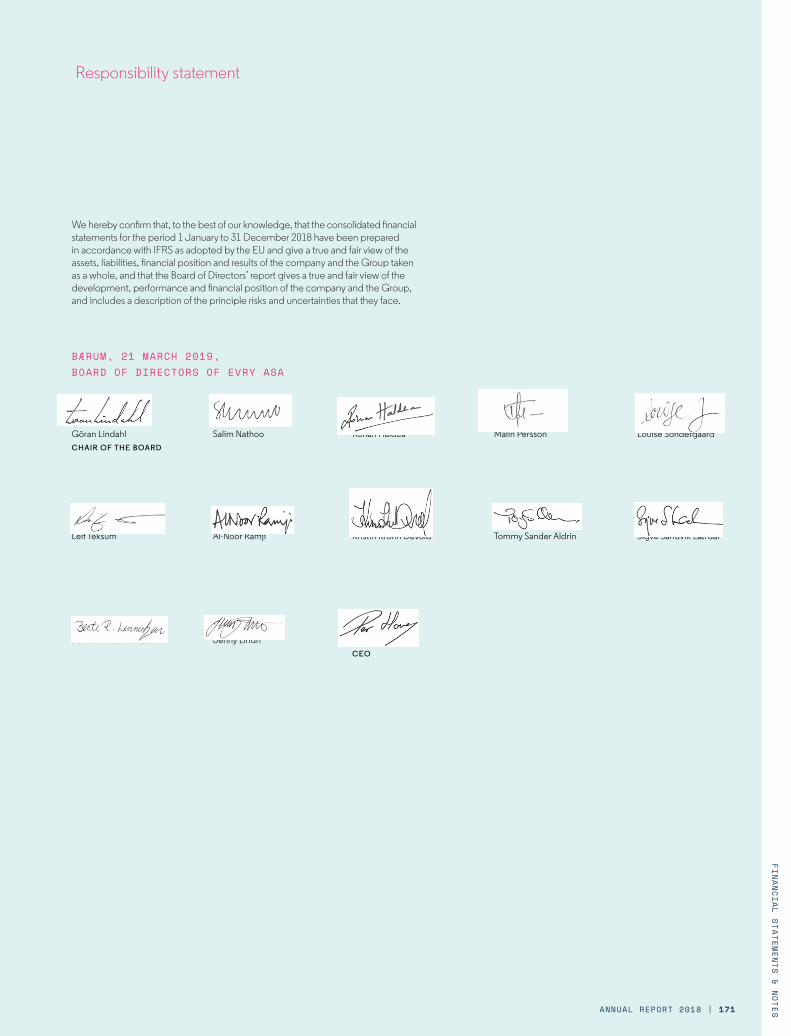
ANNUAL REPORT 2018 | 171
FINANCIAL STATEMENTS & NOTES
Responsibility statement
We hereby confirm that, to the best of our knowledge, that the consolidated financial statements for the period 1 January to 31 December 2018 have been prepared in accordance with IFRS as adopted by the EU and give a true and fair view of the assets, liabilities, financial position and results of the company and the Group taken as a whole, and that the Board of Directors’ report gives a true and fair view of the development, performance and financial position of the company and the Group, and includes a description of the principle risks and uncertainties that they face.
BÆRUM, 21 MARCH 2019, BOARD OF DIRECTORS OF EVRY ASA
Göran Lindahl CHAIR OF THE BOARD
Per Hove CEO
Salim Nathoo
Leif Teksum Al-Noor Ramji Kristin Krohn Devold Tommy Sander Aldrin Sigve Sandvik Lærdal
Bente Riis Lennertzen Jenny Lindh
Rohan Haldea Malin Persson Louise Sondergaard

172 | ANNUAL REPORT 2018
Auditor’s report
A member firm of Ernst & Young Global Limited
Statsautoriserte revisorer Ernst & Young AS Dronning Eufemias gate 6, NO-0191 Oslo Postboks 1156 Sentrum, NO-0107 Oslo
Foretaksregisteret: NO 976 389 387 MVA Tlf: +47 24 00 24 00 Fax: www.ey.no Medlemmer av Den norske revisorforening
INDEPENDENT AUDITOR’S REPORT
To the Annual Shareholders' Meeting of EVRY ASA
Report on the audit of the financial statements
Opinion We have audited the financial statements of EVRY ASA, which comprise the financial statements for the parent company and the Group. The financial statements for the parent company and the Group comprise the statement of financial position as at 31 December 2018, the statement of comprehensive income, the statements of cash flows and changes in equity for the year then ended and notes to the financial statements, including a summary of significant accounting policies.
In our opinion,
► the financial statements are prepared in accordance with the law and regulations; ► the financial statements present fairly, in all material respects, the financial position of the parent
company as at 31 December 2018, and of its financial performance and its cash flows for the year then ended in accordance with the Norwegian Accounting Act and accounting standards and practices generally accepted in Norway;
► the consolidated financial statements present fairly, in all material respects the financial position of the Group as at 31 December 2018 and of its financial performance and its cash flows for the year then ended in accordance with International Financial Reporting Standards as adopted by the EU.
Basis for opinion We conducted our audit in accordance with laws, regulations, and auditing standards and practices generally accepted in Norway, including International Standards on Auditing (ISAs). Our responsibilities under those standards are further described in the Auditor’s responsibilities for the audit of the financial statements section of our report. We are independent of the Company and the Group in accordance with the ethical requirements that are relevant to our audit of the financial statements in Norway, and we have fulfilled our ethical responsibilities as required by law and regulations. We have also complied with our other ethical obligations in accordance with these requirements. We believe that the audit evidence we have obtained is sufficient and appropriate to provide a basis for our opinion.
Key audit matters Key audit matters are those matters that, in our professional judgment, were of most significance in our audit of the financial statements for 2018. These matters were addressed in the context of our audit of the financial statements as a whole, and in forming our opinion thereon, and we do not provide a separate opinion on these matters. For each matter below, our description of how our audit addressed the matter is provided in that context.
We have fulfilled the responsibilities described in the Auditor’s responsibilities for the audit of the financial statements section of our report, including in relation to these matters. Accordingly, our audit included the performance of procedures designed to respond to our assessment of the risks of material misstatement of the financial statements. The results of our audit procedures, including the procedures performed to address the matters below, provide the basis for our audit opinion on the financial statements.

ANNUAL REPORT 2018 | 173
FINANCIAL STATEMENTS & NOTES
2
Independent auditor's report - EVRY ASA A member firm of Ernst & Young Global Limited
Recognition of revenue
The Group’s revenue for the year ended 31 December 2018 amounted to NOK 12 912 million of which a significant portion relates to revenues from licenses and operation and maintenance of IT-platforms that includes both separable and bundled products and services. As of 1 January 2018 the Group implemented the new revenue recognition standard, revenues from contract with customers (IFRS 15) using the modified retrospective method. The standard requires identification of performance obligations and determination of fair values. The principles for recognizing revenues of licenses and right to use in the Financial Services Business Area have therefore changed from being recognised at a point in time to being recognized over time. The identification of performance obligations requires judgement, and management estimates the fair value of each performance obligation. Due to the significance of revenue from licenses and operation and maintenance of IT-platforms, the inherent complexities and judgements involved, recognition of revenue is a key audit matter.
We identified, assessed and tested the design and operating effectiveness of management’s controls over revenue recognition. We assessed the Group’s new revenue recognition accounting policies and tested the application of the accounting principles for a sample of contracts. We performed analysis of the revenues per service line and per customer contract. Furthermore, we tested a sample of sales transactions recognized close to year-end and credit notes issued after year-end. We assessed the allocation of fair value for bundled goods and services and measurement of revenue through test of sales transactions and related contracts and assessment of accruals of revenue.
Reference is made to the Group’s disclosure about revenue recognition and implementation of IFRS 15 in note 1 section 2.1 and 2.3 Accounting principles and note 2 Segment information.
Other information Other information consists of the information included in the Company’s annual report other than the financial statements and our auditor’s report thereon. The Board of Directors and Chief Executive Officer (management) are responsible for the other information. Our opinion on the financial statements does not cover the other information, and we do not express any form of assurance conclusion thereon.
In connection with our audit of the financial statements, our responsibility is to read the other information, and, in doing so, consider whether the other information is materially inconsistent with the financial statements or our knowledge obtained in the audit, or otherwise appears to be materially misstated. If, based on the work we have performed, we conclude that there is a material misstatement of this other information, we are required to report that fact. We have nothing to report in this regard.
Responsibilities of management for the financial statements Management is responsible for the preparation and fair presentation of these financial statements in accordance with the Norwegian Accounting Act and accounting standards and practices generally accepted in Norway for the financial statements of the parent company and International Financial Reporting Standards as adopted by the EU for the financial statements of the Group, and for such internal control as management determines is necessary to enable the preparation of financial statements that are free from material misstatement, whether due to fraud or error.
In preparing the financial statements, management is responsible for assessing the Company’s ability to continue as a going concern, disclosing, as applicable, matters related to going concern and using the going concern basis of accounting, unless management either intends to liquidate the Company or to cease operations, or has no realistic alternative but to do so.
Auditor’s responsibilities for the audit of the financial statements Our objectives are to obtain reasonable assurance about whether the financial statements as a whole are free from material misstatement, whether due to fraud or error, and to issue an auditor’s report that includes our opinion. Reasonable assurance is a high level of assurance, but is not a guarantee that an audit conducted in accordance with ISAs will always detect a material misstatement when it exists. Misstatements can arise from fraud or error and are considered material if, individually or in the

174 | ANNUAL REPORT 2018
3
Independent auditor's report - EVRY ASA A member firm of Ernst & Young Global Limited
aggregate, they could reasonably be expected to influence the economic decisions of users taken on the basis of these financial statements.
As part of an audit in accordance with law, regulations and generally accepted auditing principles in Norway, including ISAs, we exercise professional judgment and maintain professional scepticism throughout the audit. We also:
► identify and assess the risks of material misstatement of the financial statements, whether due to fraud or error, design and perform audit procedures responsive to those risks, and obtain audit evidence that is sufficient and appropriate to provide a basis for our opinion. The risk of not detecting a material misstatement resulting from fraud is higher than for one resulting from error, as fraud may involve collusion, forgery, intentional omissions, misrepresentations, or the override of internal control;
► obtain an understanding of internal control relevant to the audit in order to design audit procedures that are appropriate in the circumstances, but not for the purpose of expressing an opinion on the effectiveness of the Company’s internal control;
► evaluate the appropriateness of accounting policies used and the reasonableness of accounting estimates and related disclosures made by management;
► conclude on the appropriateness of management’s use of the going concern basis of accounting and, based on the audit evidence obtained, whether a material uncertainty exists related to events or conditions that may cast significant doubt on the Company’s ability to continue as a going concern. If we conclude that a material uncertainty exists, we are required to draw attention in our auditor’s report to the related disclosures in the financial statements or, if such disclosures are inadequate, to modify our opinion. Our conclusions are based on the audit evidence obtained up to the date of our auditor’s report. However, future events or conditions may cause the Company to cease to continue as a going concern;
► evaluate the overall presentation, structure and content of the financial statements, including the disclosures, and whether the financial statements represent the underlying transactions and events in a manner that achieves fair presentation.
► obtain sufficient appropriate audit evidence regarding the financial information of the entities or business activities within the Group to express an opinion on the consolidated financial statements. We are responsible for the direction, supervision and performance of the group audit. We remain solely responsible for our audit opinion
We communicate with those charged with governance regarding, among other matters, the planned scope and timing of the audit and significant audit findings, including any significant deficiencies in internal control that we identify during our audit.
We also provide those charged with governance with a statement that we have complied with relevant ethical requirements regarding independence, and communicate with them all relationships and other matters that may reasonably be thought to bear on our independence, and where applicable, related safeguards.
From the matters communicated with those charged with governance, we determine those matters that were of most significance in the audit of the financial statements of the current period and are therefore the key audit matters. We describe these matters in our auditor’s report unless law or regulation precludes public disclosure about the matter or when, in extremely rare circumstances, we determine that a matter should not be communicated in our report because the adverse consequences of doing so would reasonably be expected to outweigh the public interest benefits of such communication.
Report on other legal and regulatory requirements
Opinion on the Board of Directors’ report and on the statements on corporate governance and corporate social responsibility Based on our audit of the financial statements as described above, it is our opinion that the information presented in the Board of Directors’ report and in the statements on corporate governance and corporate social responsibility concerning the financial statements, the going concern assumption and proposal for the allocation of the result is consistent with the financial statements and complies with the law and regulations.

ANNUAL REPORT 2018 | 175
FINANCIAL STATEMENTS & NOTES
4
Independent auditor's report - EVRY ASA A member firm of Ernst & Young Global Limited
Opinion on registration and documentation Based on our audit of the financial statements as described above, and control procedures we have considered necessary in accordance with the International Standard on Assurance Engagements (ISAE) 3000, Assurance Engagements Other than Audits or Reviews of Historical Financial Information, it is our opinion that management has fulfilled its duty to ensure that the Company's accounting information is properly recorded and documented as required by law and bookkeeping standards and practices accepted in Norway.
Oslo, 21 March 2019 ERNST & YOUNG AS
Asbjørn Ler
State Authorised Public Accountant (Norway)


EVRY IN BRIEF
BUSINESS PLAN
INVESTOR INFORMATION
BUSINESS REPORT
FROM THE BOARDROOM
FINANCIAL STATEMENTS & NOTES
A BOUT PRODUCTION
EVRY’s annual report 2018 has been produced by Group Finance and Group Communications & Marketing.
Project, concept and text: EVRY and WergelandApenesDesign and layout: MissionPhotography: CF-Wesenberg, Christian Lärk and GettyImages Print: Runestein

1961
EDB established as Elektronisk Databehandling
2000
EDB acquires Fellesdata
2001
EDB established in Sweden
2007
EDB establishes Global Sourcing units through acquisi-tions in Ukraine and India
2008
EDB acquires IS Partner from StatoilHydro ASA
2010
EDB and ErgoGroup merge to form EDB ErgoGroup
1972
ErgoGroup established as Statens Datasentral
1995
Norway Post acquires Statens Datasentral
2006
ErgoGroup acquires SYSteam and Allianse
2007
ErgoGroup acquires BEKK Consulting
2012
EDB ErgoGroup changes its name to EVRY

2013
EVRY acquires TAG Systems Finland
2015
Lyngen Bidco, a company indirectly controlled by private equity funds advised by Apax Partners LLP, becomes majority shareholder
2015
EVRY enters into strategic IT
infrastructure partnership with IBM 2018
EVRY acquires Findwise
2018
EVRY acquires Exonor
2015
EVRY is delisted from Oslo Stock Exchange
2017
EVRY is listed on Oslo Stock Exchange
2018
Per Hove appointed as new CEO of EVRY
2016
EVRY acquires NetRelations