Cell-specific nitrogen responses mediate developmental plasticity
6
Cell-specific nitrogen responses mediate developmental plasticity Miriam L. Gifford* † , Alexis Dean*, Rodrigo A. Gutierrez* ‡ , Gloria M. Coruzzi*, and Kenneth D. Birnbaum †§ † Center for Genomics and Systems Biology and *Department of Biology, New York University, 100 Washington Square East, New York, NY 10003; and ‡ Departamento de Gene ´tica Molecular y Microbiologı´a, Pontificia Universidad Cato ´ lica de Chile, Alameda 340, Santiago 8331010, Chile Edited by Joseph R. Ecker, Salk Institute for Biological Studies, La Jolla, CA, and approved November 21, 2007 (received for review October 8, 2007) The organs of multicellular species consist of cell types that must function together to perform specific tasks. One critical organ function is responding to internal or external change. Some cell- specific responses to changes in environmental conditions are known, but the scale of cell-specific responses within an entire organ as it perceives an environmental flux has not been well characterized in plants or any other multicellular organism. Here, we use cellular profiling of five Arabidopsis root cell types in response to an influx of a critical resource, nitrogen, to uncover a vast and predominantly cell-specific response. We show that cell- specific profiling increases sensitivity several-fold, revealing highly localized regulation of transcripts that were largely hidden from previous global analyses. The cell-specific data revealed responses that suggested a coordinated developmental response in distinct cell types or tissues. One example is the cell-specific regulation of a transcriptional circuit that we showed mediates lateral root outgrowth in response to nitrogen via microRNA167, linking small RNAs to nitrogen responses. Together, these results reveal a previously cryptic component of cell-specific responses to nitrogen. Thus, the results make an important advance in our understanding of how multicellular organisms cope with environmental change at the cell level. cell sorting microRNA lateral roots auxin response transcriptional analysis I ndividual cell types differ dramatically in their transcriptional programs on a global level (1–3). Thus, to deconvolute the genetic programs that mediate development, it is necessary to separate signals from different cells to discriminate the genes that determine cell fate and specificity. Similarly, cells are known to respond individually to environmental inputs, and identifying cell-specific responses on a global scale is critical to understand- ing how organs partition functions among cell types. We provide a high-resolution readout of an organ-level response by exposing whole roots to an environmental stimulus and identifying re- sponses in individual cell types by analysis of expression profiles before and after treatments. For plants, reactions to environmental stimuli are particularly important, because they are sessile yet must still cope with changes in the environment. The root’s response to nitrogen is an ideal model to study how an organ reacts to environmental change, because nitrogen is a limiting resource for plants (4), and among the root’s critical functions are the efficient uptake and utilization of nitrogen. Although a few genes are known to respond specifically to nitrogen in a subset of cells (5, 6), obtaining a comprehensive view of cell-specific reactions to an input in an entire organ has not been accomplished. Results Cell Sorting Yields an Accurate Readout of Environmental Responses at the Cell Level. We asked how the plant regulates transcription at the cellular level in response to nitrogen by adapting tech- niques used to generate static profiles of cells (1, 2). In brief, we treated cell-specific GFP-expressing plants with nitrate or con- trol treatments, isolated individual cell types by a combination of protoplast generating treatment and FACS, and analyzed gene expression using microarrays (Materials and Methods). To model a fluctuating soil environment, we grew plants for 12 days in 0.5 mM ammonium succinate, during which time nitrogen assays revealed a gradual depletion but not a complete exhaustion of nitrogen from the media (Materials and Methods), which avoids pure stress responses. Roots were then treated with 5 mM nitrate to mimic a nitrogen influx (7). The growing conditions and nitrogen treatments were selected based on known nitrogen responses and tested treatment regimes that best preserved nitrogen responses during protoplast-generating treatment (supporting information (SI) Text). Because one goal was to associate metabolic and cellular responses to develop- mental functions, we also chose treatment conditions that led to dramatic changes in plant architecture via root branching, which is mediated by the outgrowth of lateral roots from a subset of pericycle cells called founder cells. For cell sorting, roots were exposed to nitrate or mock (KCl) treatments for a total of 3.5 h and then isolated by FACS after a rapid enzymatic dissociation of cells (1, 2). The goal of the analysis was to gain a comprehensive view of how tissues respond individually and coordinate their responses to nitrogen signals. Thus, five markers were selected to cover a range of cell types from inner to outer layers: lateral root cap and epidermis/cortex lines for cells that contact the soil, endodermis/ pericycle and stele lines for cells that have a role in controlling vascular loading to the shoot, and pericycle founder cells, including initiating and preemergent lateral roots for cells that give rise to lateral appendages (SI Text and SI Fig. 5). In each case, we confirmed that we were able to generate protoplasts from the cell types marked by our fluorescent lines. We used a two-way ANOVA to classify genes as responsive either to nitrogen across all cells (treatment level, P 0.05) or only in specific cell types (cell treatment interaction, P 0.05). Responses in individual cells were identified by using a non- parametric test that accounted for multiple testing [significance analysis of microarrays (SAM) with a false discovery rate (FDR) of q 5%] (8) (SI Table 1). To validate that cell-sorting techniques captured in vivo gene expression, we first confirmed that the cell-specific expression pattern of known root markers was recapitulated in our sorted cell treatment controls (1) (SI Table 3). We also confirmed the Author contributions: M.L.G., G.M.C., and K.D.B. designed research; M.L.G. and A.D. performed research; R.A.G. contributed new reagents/analytic tools; M.L.G., G.M.C., and K.D.B. analyzed data; and M.L.G., G.M.C., and K.D.B. wrote the paper. Conflict of interest statement: The authors have filed a patent related to this research but declare no financial interest in the publication of this work. This article is a PNAS Direct Submission. Data deposition: The microarray data reported in this paper have been deposited in the Gene Expression Omnibus (GEO) database, www.ncbi.nlm.nih.gov/geo (accession no. GSE7631). § To whom correspondence should be addressed. E-mail: [email protected]. This article contains supporting information online at www.pnas.org/cgi/content/full/ 0709559105/DC1. © 2008 by The National Academy of Sciences of the USA www.pnas.orgcgidoi10.1073pnas.0709559105 PNAS January 15, 2008 vol. 105 no. 2 803– 808 PLANT BIOLOGY
-
Upload
independent -
Category
Documents
-
view
1 -
download
0
Transcript of Cell-specific nitrogen responses mediate developmental plasticity
Cell-specific nitrogen responses mediatedevelopmental plasticityMiriam L. Gifford*†, Alexis Dean*, Rodrigo A. Gutierrez*‡, Gloria M. Coruzzi*, and Kenneth D. Birnbaum†§
†Center for Genomics and Systems Biology and *Department of Biology, New York University, 100 Washington Square East, New York, NY 10003;and ‡Departamento de Genetica Molecular y Microbiologıa, Pontificia Universidad Catolica de Chile, Alameda 340, Santiago 8331010, Chile
Edited by Joseph R. Ecker, Salk Institute for Biological Studies, La Jolla, CA, and approved November 21, 2007 (received for review October 8, 2007)
The organs of multicellular species consist of cell types that mustfunction together to perform specific tasks. One critical organfunction is responding to internal or external change. Some cell-specific responses to changes in environmental conditions areknown, but the scale of cell-specific responses within an entireorgan as it perceives an environmental flux has not been wellcharacterized in plants or any other multicellular organism. Here,we use cellular profiling of five Arabidopsis root cell types inresponse to an influx of a critical resource, nitrogen, to uncover avast and predominantly cell-specific response. We show that cell-specific profiling increases sensitivity several-fold, revealing highlylocalized regulation of transcripts that were largely hidden fromprevious global analyses. The cell-specific data revealed responsesthat suggested a coordinated developmental response in distinctcell types or tissues. One example is the cell-specific regulation ofa transcriptional circuit that we showed mediates lateral rootoutgrowth in response to nitrogen via microRNA167, linking smallRNAs to nitrogen responses. Together, these results reveal apreviously cryptic component of cell-specific responses to nitrogen.Thus, the results make an important advance in our understandingof how multicellular organisms cope with environmental changeat the cell level.
cell sorting � microRNA � lateral roots � auxin response �transcriptional analysis
Individual cell types differ dramatically in their transcriptionalprograms on a global level (1–3). Thus, to deconvolute the
genetic programs that mediate development, it is necessary toseparate signals from different cells to discriminate the genesthat determine cell fate and specificity. Similarly, cells are knownto respond individually to environmental inputs, and identifyingcell-specific responses on a global scale is critical to understand-ing how organs partition functions among cell types. We providea high-resolution readout of an organ-level response by exposingwhole roots to an environmental stimulus and identifying re-sponses in individual cell types by analysis of expression profilesbefore and after treatments.
For plants, reactions to environmental stimuli are particularlyimportant, because they are sessile yet must still cope withchanges in the environment. The root’s response to nitrogen isan ideal model to study how an organ reacts to environmentalchange, because nitrogen is a limiting resource for plants (4), andamong the root’s critical functions are the efficient uptake andutilization of nitrogen. Although a few genes are known torespond specifically to nitrogen in a subset of cells (5, 6),obtaining a comprehensive view of cell-specific reactions to aninput in an entire organ has not been accomplished.
ResultsCell Sorting Yields an Accurate Readout of Environmental Responsesat the Cell Level. We asked how the plant regulates transcriptionat the cellular level in response to nitrogen by adapting tech-niques used to generate static profiles of cells (1, 2). In brief, wetreated cell-specific GFP-expressing plants with nitrate or con-trol treatments, isolated individual cell types by a combination of
protoplast generating treatment and FACS, and analyzed geneexpression using microarrays (Materials and Methods).
To model a fluctuating soil environment, we grew plants for12 days in 0.5 mM ammonium succinate, during which timenitrogen assays revealed a gradual depletion but not a completeexhaustion of nitrogen from the media (Materials and Methods),which avoids pure stress responses. Roots were then treated with5 mM nitrate to mimic a nitrogen influx (7). The growingconditions and nitrogen treatments were selected based onknown nitrogen responses and tested treatment regimes that bestpreserved nitrogen responses during protoplast-generatingtreatment (supporting information (SI) Text). Because one goalwas to associate metabolic and cellular responses to develop-mental functions, we also chose treatment conditions that led todramatic changes in plant architecture via root branching, whichis mediated by the outgrowth of lateral roots from a subset ofpericycle cells called founder cells. For cell sorting, roots wereexposed to nitrate or mock (KCl) treatments for a total of 3.5 hand then isolated by FACS after a rapid enzymatic dissociationof cells (1, 2).
The goal of the analysis was to gain a comprehensive view ofhow tissues respond individually and coordinate their responsesto nitrogen signals. Thus, five markers were selected to cover arange of cell types from inner to outer layers: lateral root cap andepidermis/cortex lines for cells that contact the soil, endodermis/pericycle and stele lines for cells that have a role in controllingvascular loading to the shoot, and pericycle founder cells,including initiating and preemergent lateral roots for cells thatgive rise to lateral appendages (SI Text and SI Fig. 5). In eachcase, we confirmed that we were able to generate protoplastsfrom the cell types marked by our fluorescent lines.
We used a two-way ANOVA to classify genes as responsiveeither to nitrogen across all cells (treatment level, P � 0.05) oronly in specific cell types (cell � treatment interaction, P � 0.05).Responses in individual cells were identified by using a non-parametric test that accounted for multiple testing [significanceanalysis of microarrays (SAM) with a false discovery rate (FDR)of q �5%] (8) (SI Table 1).
To validate that cell-sorting techniques captured in vivo geneexpression, we first confirmed that the cell-specific expressionpattern of known root markers was recapitulated in our sortedcell treatment controls (1) (SI Table 3). We also confirmed the
Author contributions: M.L.G., G.M.C., and K.D.B. designed research; M.L.G. and A.D.performed research; R.A.G. contributed new reagents/analytic tools; M.L.G., G.M.C., andK.D.B. analyzed data; and M.L.G., G.M.C., and K.D.B. wrote the paper.
Conflict of interest statement: The authors have filed a patent related to this research butdeclare no financial interest in the publication of this work.
This article is a PNAS Direct Submission.
Data deposition: The microarray data reported in this paper have been deposited in theGene Expression Omnibus (GEO) database, www.ncbi.nlm.nih.gov/geo (accession no.GSE7631).
§To whom correspondence should be addressed. E-mail: [email protected].
This article contains supporting information online at www.pnas.org/cgi/content/full/0709559105/DC1.
© 2008 by The National Academy of Sciences of the USA
www.pnas.org�cgi�doi�10.1073�pnas.0709559105 PNAS � January 15, 2008 � vol. 105 � no. 2 � 803–808
PLA
NT
BIO
LOG
Y
nitrogen response of two genes, ATGSR (9), which is broadlyinduced, and ARF8, which is induced in the pericycle and lateralroot cap and marginally repressed in the stele (see below), usingcell-specific GFP and GUS reporters, respectively (SI Fig. 8). Inaddition, we retested 10 genes that showed cell-specific but notwhole-root responses in microarray analyses with more sensitivequantitative PCR (qPCR) assays on whole-root samples (SI Fig.9, SI Table 4). All 10 transcripts showed the response predictedby cell sorting using qPCR on whole roots. Overall, these resultsconfirm the accuracy of the cell sampling techniques in capturingthe in vivo dynamics of cell types in response to nitrogen on aglobal scale.
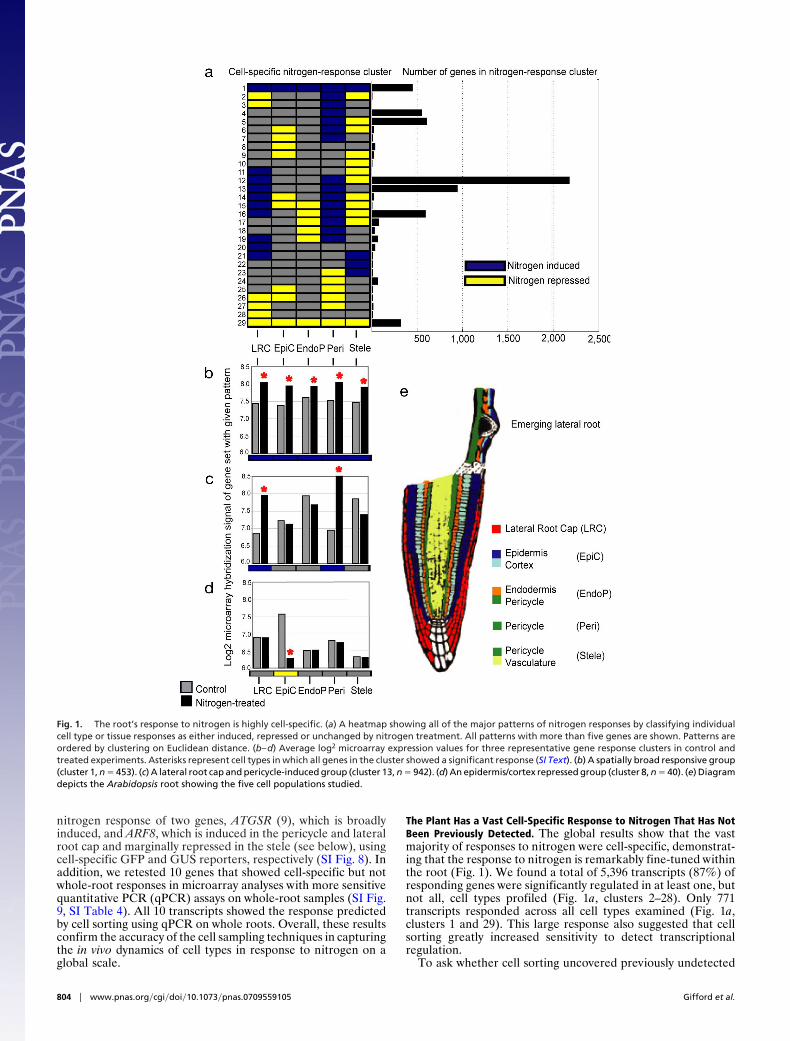
The Plant Has a Vast Cell-Specific Response to Nitrogen That Has NotBeen Previously Detected. The global results show that the vastmajority of responses to nitrogen were cell-specific, demonstrat-ing that the response to nitrogen is remarkably fine-tuned withinthe root (Fig. 1). We found a total of 5,396 transcripts (87%) ofresponding genes were significantly regulated in at least one, butnot all, cell types profiled (Fig. 1a, clusters 2–28). Only 771transcripts responded across all cell types examined (Fig. 1a,clusters 1 and 29). This large response also suggested that cellsorting greatly increased sensitivity to detect transcriptionalregulation.
To ask whether cell sorting uncovered previously undetected
Fig. 1. The root’s response to nitrogen is highly cell-specific. (a) A heatmap showing all of the major patterns of nitrogen responses by classifying individualcell type or tissue responses as either induced, repressed or unchanged by nitrogen treatment. All patterns with more than five genes are shown. Patterns areordered by clustering on Euclidean distance. (b–d) Average log2 microarray expression values for three representative gene response clusters in control andtreated experiments. Asterisks represent cell types in which all genes in the cluster showed a significant response (SI Text). (b) A spatially broad responsive group(cluster 1, n � 453). (c) A lateral root cap and pericycle-induced group (cluster 13, n � 942). (d) An epidermis/cortex repressed group (cluster 8, n � 40). (e) Diagramdepicts the Arabidopsis root showing the five cell populations studied.
804 � www.pnas.org�cgi�doi�10.1073�pnas.0709559105 Gifford et al.
responses, we compared our cell-sorting results with the re-sponses found in all comparable previously published transcrip-tome analyses on nitrogen responses (7, 10, 11) and a series ofprofiles we generated on whole roots using the same treatmentsas sorted cells. After standardizing the analysis of all experimentsand setting liberal criteria to detect as many genes as possible[dChip normalization, t test filter (P � 0.05), FDR analysis (q �5%)], we found that cell sorting uncovers a much larger responsethan the 1,000–2,000 nitrogen-responsive genes reported inprevious studies or found in our own whole-root experiments.This corroborates the increased sensitivity of the technique. Atotal of 4,139 genes were detected in all four studies, only 1,271of which overlapped with the response detected by cell sorting.Thus, cell sorting uncovered an aspect of whole-genome re-sponses to nitrogen treatments that are missed in whole-rootstudies.
The increased sensitivity of cell sorting was due to the abilityto detect highly localized responses within the root that wouldhave been diluted in whole-organ samples. In addition, cellsorting was able to detect transcripts with mixed induction andrepression responses that, when combined, dampen strong sig-nals from specific cells. For example, among genes induced bynitrogen treatment, transcriptional responses detected by bothwhole-root and cell-specific analyses were relatively broadlyexpressed (3.5 of 5 tissues on average), whereas those uniquelyidentified by cell sorting had a significantly narrower expressionpattern on average (2.4 of 5 tissues, Student’s t test, P � 1E–12E).In addition, more than half the genes detected in cell sorting(3,656) were induced in one cell type and repressed in another.The vast majority of these genes (85%) were not detected in anyof the whole-root experiments. Thus, cell sorting provides agreatly expanded resource to study nitrogen responses (i.e., 4,931of 6,202 gene responses were detected only by cell sorting) anduncovers a previously undocumented level of cell-specific re-sponses in a multicellular organism on a global scale.
Nitrogen Elicits Coordinated but Distinct Cellular Responses in Dif-ferent Tissues. One test of the utility of cell sorting is whether itcan identify new types of functional responses. Gene Ontology(GO) provides one objective benchmark for the ability to classifygenes into functional groups. Of 105 GO categories overrepre-sented in the various cell-specific response clusters, �50% (n �51) were not detected in our global whole-root response profiles.As expected, these unique functional categories were largelyrestricted to highly tissue-specific clusters. Although categoriesidentified in whole-root responses were largely physiological andmetabolic cellular processes, cell sorting tended to identify morespecific processes [e.g., hormone-mediated signaling, cluster 25,P � 0.05; enzyme linked receptor protein signaling pathway,cluster 7, P � 0.02; response to light stimulus, cluster 8, P � 0.002(Fig. 1d)].
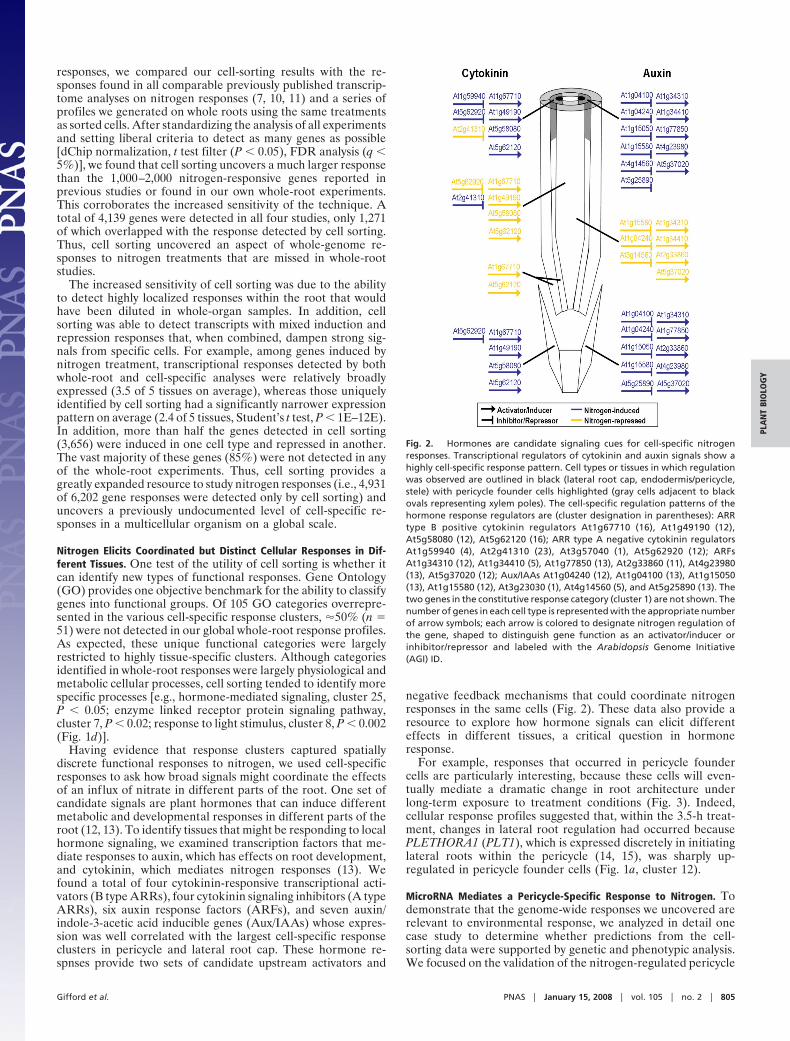
Having evidence that response clusters captured spatiallydiscrete functional responses to nitrogen, we used cell-specificresponses to ask how broad signals might coordinate the effectsof an influx of nitrate in different parts of the root. One set ofcandidate signals are plant hormones that can induce differentmetabolic and developmental responses in different parts of theroot (12, 13). To identify tissues that might be responding to localhormone signaling, we examined transcription factors that me-diate responses to auxin, which has effects on root development,and cytokinin, which mediates nitrogen responses (13). Wefound a total of four cytokinin-responsive transcriptional acti-vators (B type ARRs), four cytokinin signaling inhibitors (A typeARRs), six auxin response factors (ARFs), and seven auxin/indole-3-acetic acid inducible genes (Aux/IAAs) whose expres-sion was well correlated with the largest cell-specific responseclusters in pericycle and lateral root cap. These hormone re-spnses provide two sets of candidate upstream activators and
negative feedback mechanisms that could coordinate nitrogenresponses in the same cells (Fig. 2). These data also provide aresource to explore how hormone signals can elicit differenteffects in different tissues, a critical question in hormoneresponse.
For example, responses that occurred in pericycle foundercells are particularly interesting, because these cells will even-tually mediate a dramatic change in root architecture underlong-term exposure to treatment conditions (Fig. 3). Indeed,cellular response profiles suggested that, within the 3.5-h treat-ment, changes in lateral root regulation had occurred becausePLETHORA1 (PLT1), which is expressed discretely in initiatinglateral roots within the pericycle (14, 15), was sharply up-regulated in pericycle founder cells (Fig. 1a, cluster 12).
MicroRNA Mediates a Pericycle-Specific Response to Nitrogen. Todemonstrate that the genome-wide responses we uncovered arerelevant to environmental response, we analyzed in detail onecase study to determine whether predictions from the cell-sorting data were supported by genetic and phenotypic analysis.We focused on the validation of the nitrogen-regulated pericycle
Fig. 2. Hormones are candidate signaling cues for cell-specific nitrogenresponses. Transcriptional regulators of cytokinin and auxin signals show ahighly cell-specific response pattern. Cell types or tissues in which regulationwas observed are outlined in black (lateral root cap, endodermis/pericycle,stele) with pericycle founder cells highlighted (gray cells adjacent to blackovals representing xylem poles). The cell-specific regulation patterns of thehormone response regulators are (cluster designation in parentheses): ARRtype B positive cytokinin regulators At1g67710 (16), At1g49190 (12),At5g58080 (12), At5g62120 (16); ARR type A negative cytokinin regulatorsAt1g59940 (4), At2g41310 (23), At3g57040 (1), At5g62920 (12); ARFsAt1g34310 (12), At1g34410 (5), At1g77850 (13), At2g33860 (11), At4g23980(13), At5g37020 (12); Aux/IAAs At1g04240 (12), At1g04100 (13), At1g15050(13), At1g15580 (12), At3g23030 (1), At4g14560 (5), and At5g25890 (13). Thetwo genes in the constitutive response category (cluster 1) are not shown. Thenumber of genes in each cell type is represented with the appropriate numberof arrow symbols; each arrow is colored to designate nitrogen regulation ofthe gene, shaped to distinguish gene function as an activator/inducer orinhibitor/repressor and labeled with the Arabidopsis Genome Initiative(AGI) ID.
Gifford et al. PNAS � January 15, 2008 � vol. 105 � no. 2 � 805
PLA
NT
BIO
LOG
Y
response as potentially mediated by ARF8, which was one of thepericycle-induced ARFs and is itself a documented target ofmicroRNA 167 (miR167) (16). Thus, ARF8 offers a link betweenenvironmental inputs and auxin-mediated plasticity of lateralroot architecture.
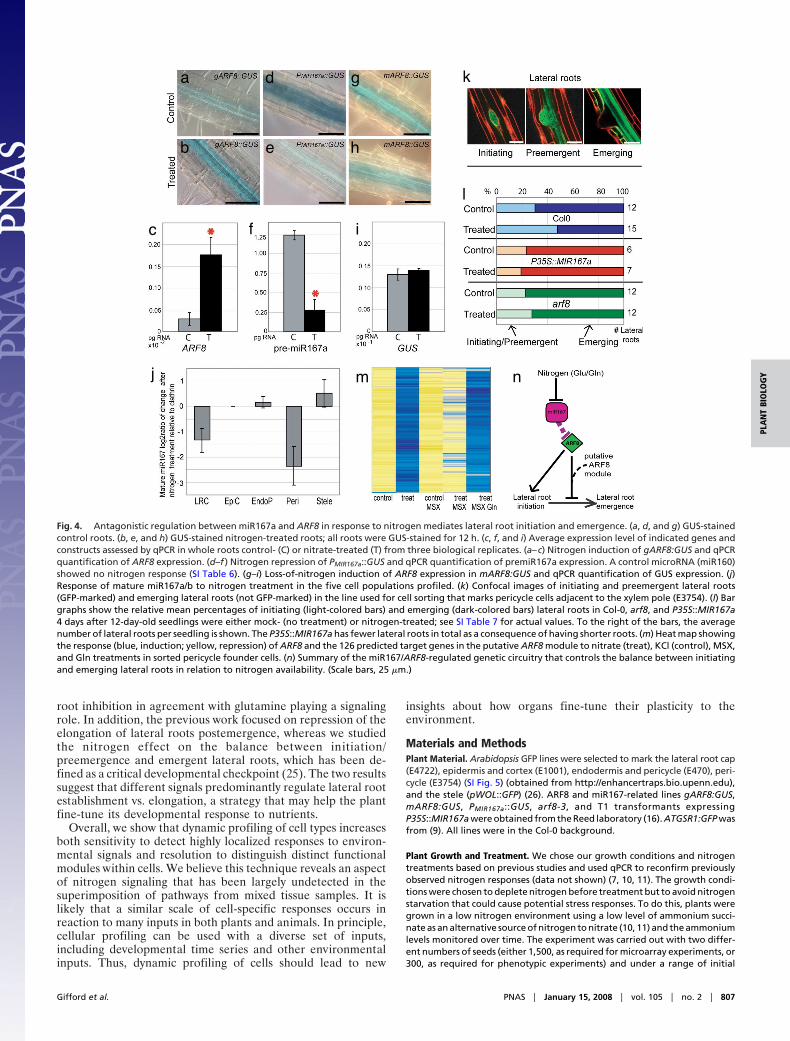
ARF8 has been shown to have developmental roles in theshoot (16) and subtle phenotypes in root (17) but was notpreviously known to be a regulator of developmental plasticity.To test the hypothesis that ARF8 regulates lateral roots inresponse to nitrogen, we first confirmed that ARF8 is nitrogen-induced in the pericycle (Fig. 4 a–c) and lateral root cap (datanot shown) using qPCR and reporter constructs expressingARF8 gDNA fused to GUS cDNA under the ARF8 promoter(16) in whole roots. Statistical analyses show that ARF8 is alsorepressed in the stele, suggesting that, whereas it is induced in thepericycle, it is repressed in the xylem and phloem. We found thatmiR167a,b was expressed specifically in the pericycle and lateralroot cap along with ARF8, but, consistent with an antagonisteffect on ARF8, was repressed in the pericycle and lateral rootcap in response to nitrogen, as determined by qPCR of both themature miR167a/b and the miR167a precursor and stainingintensity of a PMIR167a::GUS reporter (16) (Fig. 4 d–f and j). Weused qPCR of premiR160a and mature miR160a/b as a non-nitrogen-regulated miR control, showing no response (SI Table6). An ARF8:GUS fusion with a mutated miR167-binding site(mARF8:GUS) (16) showed loss of nitrogen regulation (Fig. 4g–i). In conjunction with previous results showing that miR167atargets ARF8 (16), these results show that nitrogen represseslevels of miR167a to permit the ARF8 transcript to accumulatein the pericycle upon nitrogen treatment.
The ARF8 Circuit Controls Lateral Root Architecture. We next askedwhether the ARF8/miR167 circuit was involved in mediating theobserved long-term effects of our nitrogen treatment on lateralroot outgrowth, using genetic backgrounds with perturbed levelsof miR167a and ARF8 (16). Because the pericycle GFP line thatwe used marks both initiating and preemergent lateral roots (Fig.4k), it seemed feasible that the ARF8/miR167 circuit controlleda potential checkpoint between lateral root initiation and sub-sequent emergence (18, 19). In wild-type (Col-0) plants, nitrogentreatment led to an increased ratio of initiating vs. emerginglateral roots (Fig. 4l; �2 P � 8–13E), a strategy that apparentlyenables plants to initiate lateral roots in high nitrogen conditionsbut stimulates lateral root outgrowth to ‘‘forage’’ the soil for
nutrients only in nitrogen-depleted conditions. This strategy alsoexplains why PLT1 induction suggested increased lateral rootinitiation whereas the long-term treatments led to fewer emer-gent lateral roots. The apparently subtle effect observed over 4days of nitrogen treatment accumulated over longer treatments,to lead to dramatic changes in root architecture, such as observedafter 12 days (e.g., Fig. 3).
In contrast to wild-type plants, P35S::MIR167a seedlings thatoverexpress miR167a exhibited a complete loss of nitrogencontrol over lateral root emergence (Fig. 4l; �2 P � 0.5354). arf8roots also show a lack of nitrogen control over emergence (�2
P � 0.1369), although some nitrogen response may persistperhaps due to redundancy with ARF6, which is also a target ofmiR167a (16). Together, these results show how a cell-specificresponse circuit controls a major aspect of the plant’s strategicresponse to nitrogen influx via changes in root architecture. Theresult also demonstrates how quantitative adjustments in tran-scriptional circuits (ARF8 and miR167) can ultimately lead tochanges in root architecture over time.
The Putative ARF8 Module Is Regulated by Glutamine. To explorefactors downstream of the miR167-ARF8 circuit in the pericycle,we tested whether potential ARF8 targets exhibit coordinatedresponses within the pericycle. To build such a list of potentialtargets, we searched for genes that were induced in the pericycle(where ARF8 induction is most dramatic), that had an ARF-binding site, and that also showed moderate correlation (R �0.5) with ARF8 over �1,900 microarray experiments depositedin the NASC database (20) (SI Text). The procedure identified126 potential targets (SI Table 8).
To test whether the putative ARF8 module formed a cohesiveresponse group, we asked whether ARF8 and the 126 potentialtargets responded similarly to either nitrate or downstreammetabolites. Thus, we treated roots with nitrate and methioninesulfoximine (MSX), which blocks the assimilation of nitrate intoglutamine (Gln) and consequently glutamate (21), and collectedpericycle cells for RNA analysis. Induction of ARF8 and all 126of the putative ARF8 targets was blocked by MSX treatment (q �5% FDR), suggesting they were responsive to downstreamnitrogen metabolites rather than nitrate itself (Fig. 4m). Toconfirm that the effect was specific to metabolite signaling, werepeated the MSX block of nitrate metabolism into glutamate/glutamine, but added glutamine, which should restore metabo-lite signaling if the signal is glutamine or a derived nitrogenmetabolite. The induction of ARF8 and all 126 of the putativeARF8 targets was indeed restored by the glutamine ‘‘add back’’(q � 5% FDR) (Fig. 4m). No other ARFs that were induced inthe pericycle showed the same coordinated regulation with thiscluster. Overall, the data are consistent with ARF8 and itsputative pericycle targets forming a cohesive response moduleunder coordinated regulation by glutamine or a downstreammetabolite (Fig. 4n).
DiscussionTaken together, these results demonstrate a link between mi-croRNA regulation and nitrogen responses, as has been shownwith phosphate and sulfate (22, 23). Importantly, this proof ofprinciple demonstrates that profiling cellular responses providesa trail of evidence that leads directly to discrete, highly com-partmentalized circuits that, in turn, mediate cell-specificfunctions.
Interestingly, our finding that glutamine/glutamate is thepredominant signal regulating repression of lateral root emer-gence is in contrast to an earlier report showing lateral rootdevelopment is enhanced in a nitrate reductase mutant (24),suggesting that nitrate accumulation rather than glutamine/glutamate in fact plays an important role in this process. In oneprevious study, glutamine treatment also resulted in some lateral
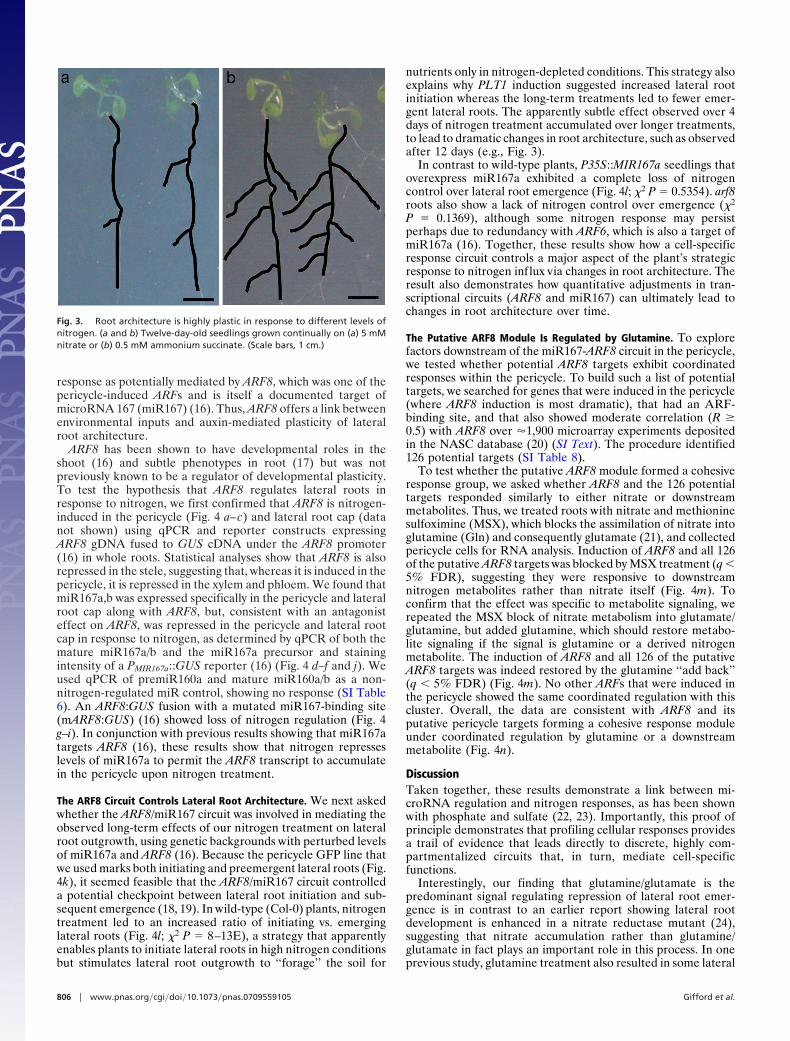
Fig. 3. Root architecture is highly plastic in response to different levels ofnitrogen. (a and b) Twelve-day-old seedlings grown continually on (a) 5 mMnitrate or (b) 0.5 mM ammonium succinate. (Scale bars, 1 cm.)
806 � www.pnas.org�cgi�doi�10.1073�pnas.0709559105 Gifford et al.
root inhibition in agreement with glutamine playing a signalingrole. In addition, the previous work focused on repression of theelongation of lateral roots postemergence, whereas we studiedthe nitrogen effect on the balance between initiation/preemergence and emergent lateral roots, which has been de-fined as a critical developmental checkpoint (25). The two resultssuggest that different signals predominantly regulate lateral rootestablishment vs. elongation, a strategy that may help the plantfine-tune its developmental response to nutrients.
Overall, we show that dynamic profiling of cell types increasesboth sensitivity to detect highly localized responses to environ-mental signals and resolution to distinguish distinct functionalmodules within cells. We believe this technique reveals an aspectof nitrogen signaling that has been largely undetected in thesuperimposition of pathways from mixed tissue samples. It islikely that a similar scale of cell-specific responses occurs inreaction to many inputs in both plants and animals. In principle,cellular profiling can be used with a diverse set of inputs,including developmental time series and other environmentalinputs. Thus, dynamic profiling of cells should lead to new
insights about how organs fine-tune their plasticity to theenvironment.
Materials and MethodsPlant Material. Arabidopsis GFP lines were selected to mark the lateral root cap(E4722), epidermis and cortex (E1001), endodermis and pericycle (E470), peri-cycle (E3754) (SI Fig. 5) (obtained from http://enhancertraps.bio.upenn.edu),and the stele (pWOL::GFP) (26). ARF8 and miR167-related lines gARF8:GUS,mARF8:GUS, PMIR167a::GUS, arf8-3, and T1 transformants expressingP35S::MIR167a were obtained from the Reed laboratory (16). ATGSR1:GFP wasfrom (9). All lines were in the Col-0 background.
Plant Growth and Treatment. We chose our growth conditions and nitrogentreatments based on previous studies and used qPCR to reconfirm previouslyobserved nitrogen responses (data not shown) (7, 10, 11). The growth condi-tions were chosen to deplete nitrogen before treatment but to avoid nitrogenstarvation that could cause potential stress responses. To do this, plants weregrown in a low nitrogen environment using a low level of ammonium succi-nate as an alternative source of nitrogen to nitrate (10, 11) and the ammoniumlevels monitored over time. The experiment was carried out with two differ-ent numbers of seeds (either 1,500, as required for microarray experiments, or300, as required for phenotypic experiments) and under a range of initial
a d g
b e h
c f i
j m n
k
l
Fig. 4. Antagonistic regulation between miR167a and ARF8 in response to nitrogen mediates lateral root initiation and emergence. (a, d, and g) GUS-stainedcontrol roots. (b, e, and h) GUS-stained nitrogen-treated roots; all roots were GUS-stained for 12 h. (c, f, and i) Average expression level of indicated genes andconstructs assessed by qPCR in whole roots control- (C) or nitrate-treated (T) from three biological replicates. (a–c) Nitrogen induction of gARF8:GUS and qPCRquantification of ARF8 expression. (d–f ) Nitrogen repression of PMIR167a::GUS and qPCR quantification of premiR167a expression. A control microRNA (miR160)showed no nitrogen response (SI Table 6). (g–i) Loss-of-nitrogen induction of ARF8 expression in mARF8:GUS and qPCR quantification of GUS expression. (j)Response of mature miR167a/b to nitrogen treatment in the five cell populations profiled. (k) Confocal images of initiating and preemergent lateral roots(GFP-marked) and emerging lateral roots (not GFP-marked) in the line used for cell sorting that marks pericycle cells adjacent to the xylem pole (E3754). (l) Bargraphs show the relative mean percentages of initiating (light-colored bars) and emerging (dark-colored bars) lateral roots in Col-0, arf8, and P35S::MIR167a4 days after 12-day-old seedlings were either mock- (no treatment) or nitrogen-treated; see SI Table 7 for actual values. To the right of the bars, the averagenumber of lateral roots per seedling is shown. The P35S::MIR167a has fewer lateral roots in total as a consequence of having shorter roots. (m) Heat map showingthe response (blue, induction; yellow, repression) of ARF8 and the 126 predicted target genes in the putative ARF8 module to nitrate (treat), KCl (control), MSX,and Gln treatments in sorted pericycle founder cells. (n) Summary of the miR167/ARF8-regulated genetic circuitry that controls the balance between initiatingand emerging lateral roots in relation to nitrogen availability. (Scale bars, 25 �m.)
Gifford et al. PNAS � January 15, 2008 � vol. 105 � no. 2 � 807
PLA
NT
BIO
LOG
Y
ammonium succinate concentrations. We determined appropriate ammo-nium succinate concentrations for different growth setups by testing a seriesof different concentrations for signs of stress in plants at different time points,noting the point when plants showed signs of stress, and by monitoringdepletion using an ammonium assay. For a standard 12-day growth period, wedetermined that concentrations of 0.5 mM ammonium succinate for 1,500seeds and 0.2 mM ammonium succinate for 300 seeds led to reduced but notentirely depleted ammonium in the media. No signs of nitrogen starvation/stress were evident in these seedlings.
All experiments were carried out in triplicate. Approximately 6,000 seeds(per replicate) of each GFP line for sorted cell experiments or of Col-0 forwhole-root and protoplast treatment controls were sterilized and sown onNitex 03–250/47 mesh (Sefar America). The mesh was supported on a plasticplatform to allow roots to grow in hydroponics inside a sterile Phytatray(Sigma–Aldrich); 1,500 seeds were sown in each Phytatray. Growing mediaconsisted of 1� Murashige and Skoog basal medium containing no nitrogenor sucrose (custom-ordered, GibcoBRL, Gaithersburg, MD) supplemented with3 mM sucrose and 0.5 mM ammonium succinate. All components were keptsterile throughout the growth period of a 16-h light (50 mmol photons m�2s�1
light intensity)/8-h dark cycles at 22°C, which was maintained inside a growthincubator (Percival Scientific). For treatments, KNO3 was added to the mediato a final concentration of 5 mM for 2 hours at the start of the light period on
day 12 (7, 11). Control plants were mock-treated by adding the same concen-tration of KCl. For MSX treatments, we used 5 mM KNO3 or 5 mM KCl and 1 mMMSX or 1 mM MSX plus 5 mM glutamine (Gln), as described (21). For qPCR andphenotypic tests in different genetic backgrounds, 300 seeds of each ARF8-and miR167-related line and Col-0 in ARF8/miR167 experiments were treatedin a similar fashion but were grown on 0.2 mM ammonium succinate.
ANOVA. The two-way ANOVA was modeled as follows: Y � � � �cell pop ��treatment � �cell pop* treatment � �, where Y is the normalized dChip expressionsignal of a gene; � is the global mean; the � coefficients correspond to theeffects of cell population, treatment; and the interaction between cell pop-ulation and treatment, and � represents unexplained variance.
ACKNOWLEDGMENTS. We thank Miin-Feng Wu and Jason Reed (University ofNorth Carolina, Chapel Hill) for the ARF8- and miR167-related transgenic linesand mutants; John Hirst for assistance with cell sorting; Manpreet Katari forassistance with VirtualPlant; and Bastiaan Bargmann, Kris Gunsalus, KarenThum, and Anita Fernandez for helpful comments. This work was supportedby National Science Foundation (NSF) Grants NSF N2010 (IBN-0115586, toG.M.C. and K.D.B.) and NSF 2010 (DBI-0519984, to K.D.B.), by National Insti-tutes of Health (NIH) (Grants GM32877, to G.M.C., and R01 GM078279-01, toK.D.B.), and by a European Molecular Biology Organization (EMBO) long-termpostdoctoral fellowship (Grant ALTF107-2005, to M.L.G.).
1. Birnbaum K, Shasha DE, Wang JY, Jung JW, Lambert GM, Galbraith DW, Benfey PN(2003) Science 302:1956–1960.
2. Birnbaum K, Jung JW, Wang JY, Lambert GM, Hirst JA, Galbraith DW, Benfey PN (2005)Nat Methods 2:615–619.
3. Roy PJ, Stuart JM, Lund J, Kim SK (2002) Nature 418:975–979.4. Vitousek PM, Howarth RW (1991) Biogeochemistry 13:87–115.5. Little DY, Rao H, Oliva S, Daniel-Vedele F, Krapp A, Malamy JE (2005) Proc Natl Acad
Sci USA 102:13693–13698.6. Remans T, Nacry P, Pervent M, Filleur S, Diatloff E, Mounier E, Tillard P, Forde BG, Gojon
A (2006) Proc Natl Acad Sci USA 103:19206–19211.7. Gutierrez RA, Lejay LV, Dean A, Chiaromonte F, Shasha DE, Coruzzi GM (2007) Genome
Biol 8:R7.8. Tusher VG, Tibshirani R, Chu G (2001) Proc Natl Acad Sci USA 98:5116–5121.9. Tian GW, Mohanty A, Chary SN, Li S, Paap B, Drakakaki G, Kopec CD, Li J, Ehrhardt D,
Jackson D, et al. (2004) Plant Physiol 135:25–38.10. Wang R, Okamoto M, Xing X, Crawford NM (2003) Plant Physiol 132:556–567.11. Wang R, Tischner R, Gutierrez RA, Hoffman M, Xing X, Chen M, Coruzzi G, Crawford
NM (2004) Plant Physiol 136:2512–2522.12. Vieten A, Sauer M, Brewer PB, Friml J (2007) Trends Plants Sci 12:160–168.13. Sakakibara H, Takei K, Hirose N (2006) Trends Plants Sci 11:440–448.
14. Aida M, Beis D, Heidstra R, Willemsen V, Blilou I, Galinha C, Nussaume L, Noh YS,Amasino R, Scheres B (2004) Cell 119:109–120.
15. Blilou I, Xu J, Wildwater M, Willemsen V, Paponov I, Friml J, Heidstra R, Aida M, PalmeK, Scheres B (2005) Nature 433:39–44.
16. Wu MF, Tian Q, Reed JW (2006) Development 133:4211–4218.17. Tian CE, Muto H, Higuchi K, Matamura T, Tatematsu K, Koshiba T, Yamamoto KT (2004)
Plant J 40:333–343.18. Malamy JE (2005) Plant Cell Environ 28:67–77.19. Walch-Liu P, Ivanov I, Filleur S, Gan Y, Remans T, Forde BG (2006) Ann Bot (Lond)
97:875–881.20. Craigon DJ, James N, Okyere J, Higgins J, Jotham J, May S (2004) Nucleic Acids Res
32:D575–577.21. Rawat SR, Silim SN, Kronzucker HJ, Siddiqi MY, Glass AD (1999) Plant J 19:143–152.22. Chiou TJ (2007) Plant Cell Environ 30:323–332.23. Bari R, Datt Pant B, Stitt M, Scheible WR (2006) Plant Physiol 141:988–999.24. Zhang H, Jennings A, Barlow PW, Forde BG (1999) Proc Natl Acad Sci USA 96:6529–
6534.25. Malamy JE, Benfey PN (1997) Development 124:33–44.26. Bonke M, Thitamadee S, Mahonen AP, Hauser MT, Helariutta Y (2003) Nature 426:181–
186.
808 � www.pnas.org�cgi�doi�10.1073�pnas.0709559105 Gifford et al.