Functional site plasticity in domain superfamilies
44
Functional Site Plasticity in Domain Superfamilies Benoit H Dessailly a , Natalie L Dawson b , Kenji Mizuguchi a , Christine A Orengo b,* a National Institute of Biomedical Innovation, ZIP:567-0085, 7-6-8 Asagi Saito Ibaraki-City Osaka, Japan b Institute of Structural and Molecular Biology, Division of Biosciences, University College London, Gower Street, London, WC1E 6BT, UK Abstract We present, to our knowledge, the first quantitative analysis of functional site diversity in homologous domain superfamilies. Different types of functional sites are considered separately. Our results show that most diverse superfamilies are very plastic in terms of the spatial location of their functional sites. This is especially true for protein-protein interfaces. In contrast, we confirm that catalytic sites typically occupy only a very small number of topological locations. Small-ligand binding sites are more diverse than expected, although in a more limited manner than protein-protein interfaces. In spite of the observed diversity, our results also confirm the previously reported preferential location of functional sites. We identify a subset of homologous domain superfamilies where diversity is particularly extreme, and discuss possible reasons for such plasticity, i.e. structural diversity. Our results do not contradict previous reports of preferential co-location of sites among homologues, but rather point at the importance of not ignoring other sites, especially in large and diverse superfamilies. Data on sites exploited by different relatives, within each well annotated domain superfamily, has been made accessible from the CATH website in order to highlight versatile superfamilies or superfamilies with highly preferential sites. This information is valuable for systems biology and knowledge of any constraints on protein interactions could help in understanding the dynamic control of networks in which these proteins participate. The novelty of our work lies in the comprehensive nature of the analysis we have used a significantly larger dataset than previous studies - and the fact that in many superfamilies we show that different parts of the domain surface are exploited by different relatives for ligand/protein interactions, particularly in superfamilies which are diverse in sequence and structure, an observation not previously reported on such a large scale. Keywords: protein domain structure, functional diversity, structural diversity, functional residues, functional site diversity 1. Introduction Functional sites are sets of residues that are directly involved in the function of proteins. Those generally include binding sites to other molecules, and catalytic sites, a subset thereof, which are involved in the actual * Corresponding author Email address: [email protected] (Christine A Orengo) Preprint submitted to Elsevier February 15, 2013
Transcript of Functional site plasticity in domain superfamilies
Functional Site Plasticity in Domain Superfamilies
Benoit H Dessaillya, Natalie L Dawsonb, Kenji Mizuguchia, Christine A Orengob,∗
aNational Institute of Biomedical Innovation, ZIP:567-0085, 7-6-8 Asagi Saito Ibaraki-City Osaka, JapanbInstitute of Structural and Molecular Biology, Division of Biosciences, University College London, Gower Street, London,
WC1E 6BT, UK
Abstract
We present, to our knowledge, the first quantitative analysis of functional site diversity in homologous domain
superfamilies. Different types of functional sites are considered separately. Our results show that most diverse
superfamilies are very plastic in terms of the spatial location of their functional sites. This is especially true
for protein-protein interfaces. In contrast, we confirm that catalytic sites typically occupy only a very small
number of topological locations. Small-ligand binding sites are more diverse than expected, although in
a more limited manner than protein-protein interfaces. In spite of the observed diversity, our results also
confirm the previously reported preferential location of functional sites. We identify a subset of homologous
domain superfamilies where diversity is particularly extreme, and discuss possible reasons for such plasticity,
i.e. structural diversity. Our results do not contradict previous reports of preferential co-location of sites
among homologues, but rather point at the importance of not ignoring other sites, especially in large and
diverse superfamilies. Data on sites exploited by different relatives, within each well annotated domain
superfamily, has been made accessible from the CATH website in order to highlight versatile superfamilies
or superfamilies with highly preferential sites. This information is valuable for systems biology and knowledge
of any constraints on protein interactions could help in understanding the dynamic control of networks in
which these proteins participate. The novelty of our work lies in the comprehensive nature of the analysis
we have used a significantly larger dataset than previous studies - and the fact that in many superfamilies
we show that different parts of the domain surface are exploited by different relatives for ligand/protein
interactions, particularly in superfamilies which are diverse in sequence and structure, an observation not
previously reported on such a large scale.
Keywords: protein domain structure, functional diversity, structural diversity, functional residues,
functional site diversity
1. Introduction
Functional sites are sets of residues that are directly involved in the function of proteins. Those generally
include binding sites to other molecules, and catalytic sites, a subset thereof, which are involved in the actual
∗Corresponding authorEmail address: [email protected] (Christine A Orengo)
Preprint submitted to Elsevier February 15, 2013
catalytic mechanism of enzymes.
Knowing which residues in a protein are important for its function is important for a number of reasons.
For example, it makes it easier to modify the function of that protein by site-directed mutagenesis. It can
also help identify potential interacting partners for the protein.
Because of their importance, much effort has been put into the development of computational methods
to predict the location of functional sites (see for example [1]). One prevalent approach to predicting the
location of a functional site in a query protein, is to transfer known functional site data from homologous
proteins. The assumption with this type of approach is that homologous proteins should have functional
sites at equivalent locations.
Generally, such homology-based approaches tend to become more reliable as the sequence similarity
between proteins increases [2]. However, a number of studies have explored the possibility of transferring
functional site information between remotely related homologues [3, 4, 5]. Some studies have even suggested
that functional sites could be transferred with some success between proteins that share structural similarities
but no evidence of homology [6, 7].
Proteins are made up of domains, i.e. units of protein evolution that have well-defined structures [8].
Several resources have been established to group such domains by homology into so-called “domain super-
families” [9, 10]. It is generally well accepted that such homologous domains share some level of functional
similarity, and that intermolecular interactions and the functional sites mediating them can often be inherited
between them [6, 11].
In-depth analysis of protein domain superfamilies has shown that related domains may often adopt diverse
structures, and perform a variety of functions [12]. This is particularly true for a subset of superfamilies
that are very diverse, and that are populated by large numbers of domains [13, 14, 8].
The observation that structural diversity is often more pronounced in regions directly involved in func-
tion [15, 16] points at the possibility that functional sites may vary significantly between related protein
domains in those large and diverse superfamilies. Over the years, a number of studies have shown that the
underlying assumption that homologous proteins have their sites in similar locations, may not always hold
true.
For example, it was shown that similar domain pairs tend to interact in the same way when sequence
identity is 30-40% or higher, but that more remote similarities (at the fold level for example) are rarely
associated with a similarity in interaction [2].
Previous studies have attempted to look at how diverse the functional sites of different types are between
sets of homologous proteins, genes or domains. For example, it was reported that domains within SCOP
families (the family level in SCOP groups together domains that are clearly evolutionarily related, generally
with pairwise sequence identities of 30% or greater), generally have their binding sites in similar locations [17].
As part of a review on challenges to predict macromolecular interactions, Wass et al succinctly reported a
count of ligand-binding sites in SCOP superfamilies and described that most superfamilies have a small
2

number of such sites, and that these sites tend to be found in most superfamily members [11].
However, an exhaustive and quantitative analysis of site location diversity for all types of functional sites
among related protein domains at the superfamily level remains to be performed. That is the purpose of
this manuscript. We have compared the spatial location of different types of functional sites between related
domains, in an exhaustive manner for all superfamilies. For that, we first select a representative in each
superfamily of our dataset, and then map functional sites from each domain in the superfamily onto the
representative. We consider different types of functional sites separately, and present results for each type.
In an attempt to compensate for the lack of functional site data in the PDB, we then go on to perform the
same analysis but this time exploiting a simple and intuitive protein functional site predictor, i.e. sequence
conserved residues. We report that domains in large and diverse superfamilies, can have sites in very diverse
locations, especially for protein-protein binding sites, and small ligand binding sites. We observe that large
superfamilies with many domains are the most likely to have sites in different locations, especially if their
domains are also structurally diverse. This a novel observation not previously reported in the literature
and has been obtained by performing a more comprehensive analysis than earlier studies. It is valuable in
drawing attention to superfamilies where more caution may need to be employed when inheriting functional
site data between relatives.
Our results simply reflect what is currently observed in the PDB when all known site data for a given
superfamily is sampled. They are purely empirical and not intended to provide probabilities for particular
binding sites.
Our functional site mappings are made publicly available for all superfamilies via the CATH website.
2. Methods
2.1. Definition of homologous protein domains
In our study, protein domains are considered homologous if they are part of the same CATH superfamily
[9]. Within CATH superfamilies, domains are further clustered at 60% sequence identity.
Some superfamilies have been shown to be very large and very diverse [14]. These 60% sequence identity
clusters (also called s60 clusters) are useful to quantify diversity in superfamilies. Indeed, 60% sequence
identity has been shown in several studies to be a reasonable threshold for grouping domains with similar
functions [18]. Therefore, the number of clusters at 60% sequence identity provides an approximation of the
number of diverse functions in the superfamily.
We use version 3.5 of the CATH database, which consists of 2626 superfamilies. Since we are focusing on
functional site diversity, we exclude all superfamilies consisting of a single 60% cluster, or with no functional
site data. Our final dataset consists of 1456 superfamilies.
2.2. Definition of functional families
Functional families have recently been introduced to the CATH-Gene3D database [19]. CATH super-
family sequence data are clustered into functional families, using two related approaches (GeMMA [20] and
3
Domain Family eXploration program [21]), which consist of relatives likely to have the same function. The
GeMMA algorithm identifies functional families using a hierarchical agglomerative clustering algorithm to
produce a tree of clusters built from the leaf nodes to the root node. This iterative approach first clusters
close homologues, i.e. sequences with at least 90% sequence identity, using the program CD-HIT [22]. For
each of these clusters, multiple sequence alignments (MSAs) are constructed using MAFFT [23]. In the
second iteration, pairs of MSAs are compared using the COmparison of Multiple Protein Alignments with
Assessment of Statistical Significance (COMPASS) set of tools [24]. COMPASS takes two MSAs as input
and from these builds two PSSM profiles for comparison purposes. It then calculates the similarity of all
profile pairs, and the alignments with the highest similarity are merged. This continues until one cluster
remains. The final tree of clusters is partitioned by cutting the tree at a generic threshold. This approach
is referred to as the ‘unsupervised’ method and produces ‘fine’ functional families (FineFams) [20]. The
FineFams have been benchmarked against the Structure Function Linkage Database (SFLD) [25].
A modified version of the functional families has since been developed using a ‘supervised’ protocol [21].
This approach (DFX) detects and accounts for functional ‘chaining’ within the tree of clusters. ‘Chaining’
refers to instances of protein domain sequences in a superfamily that cluster in an unexpected way. In DFX,
GO annotation data is used to ensure functional coherence in each functional family, and clusters are only
merged if they contain coherent GO terms. However, in some superfamilies the sequence similarity reflected
in the COMPASS scores appears to contradict GO term similarity so that domain relatives apparently having
different functions are preferentially merged in the hierarchy. This phenomenon usually arises because in
these superfamilies domains have a generic functional role, that remains unchanged despite the different
functional contexts (reflected in different GO terms for their parent proteins) in which the relatives appear.
The DFX method is described in more detail in Rentzsch et al [21] and tends to produce ‘coarser’ functional
families (FunFams), in which domain relatives in a cluster are likely to have similar functional roles but the
proteins in which they are found may have different overall functions.
This is illustrated by the fact that relatives in FunFams tend to superpose with higher RMSD than
relatives within FineFams (see Supplementary Material Figure A.10), suggesting that since there is known
to be a correlation between structural and functional diversity [14], FineFam relatives are closer in function.
As functional families carry out the same general function, each sequence member is expected to contain
the same residues required for that function. Such sites will therefore be highly conserved throughout a
functional family.
Using these functional families allows us to study these highly conserved functional residues and observe
how such residues compare between functional families within a superfamily, thereby giving an impression
of how functional sites evolve within a superfamily.
2.3. Definition of functional sites
Catalytic residues are defined as manually curated residues from the Catalytic Site Atlas (CSA) [26].
4

Binding sites are defined using the NCBI Inferred Biomolecular Interaction Server (IBIS) [27]. IBIS
provides information about binding sites for all types of ligands, including other proteins, nucleic acids,
small organic compounds, peptides and ions. Binding sites for these different types of ligands were considered
separately throughout this work. We also used quality filters provided by IBIS when selecting binding site
data. In particular, we ignore any ligands that are not considered biologically relevant by IBIS. And we also
exclude interfaces that are not confirmed by PISA [28]. IBIS functional residues inferred by homology are
not considered here. Finally, in our work, we group together small organic compounds, peptides and ions in
a common category that we refer to as “Small Ligands”.
Some proteins have several structures in the PDB [29]. Some structures may contain ligands and others
will not. To ensure maximal coverage, we always consider all structures of a given protein when collecting
its functional site residues.
2.4. Mapping functional sites between members of the superfamily
Our approach for comparing the three-dimensional location of functional sites across members of the
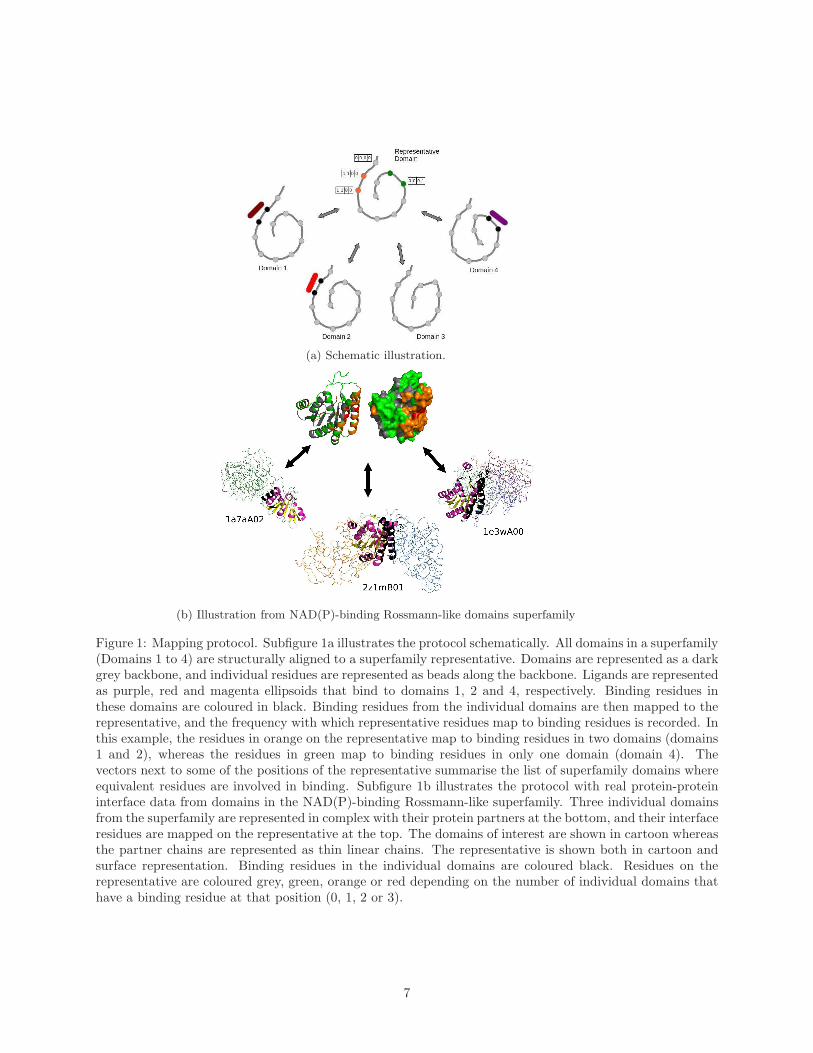
superfamily consists of three steps. The mapping protocol is illustrated in Figure 1.
First, we select a representative for each superfamily. The idea is to select the superfamily member that
is the best structural representative of the superfamily. In CATH, all 60% sequence identity clusters have
a pre-defined representative. We structurally align all these representatives pair-wise against one another
using the program SSAP [30]. The superfamily representative is then selected as the domain that has the
highest cumulative structural similarity SSAP score to all other sequence clusters in the superfamily. The
superfamily representative is therefore supposed to be the domain that is most structurally similar to all other
domains in the superfamily. This notably minimizes the risks of misalignments between the representative
and other superfamily members.
The SSAP algorithm has been benchmarked using manually validated structure comparisons and shown
to perform well in identifying equivalent regions between homologous domains [31]. Even very remote
homologues share a conserved structural core, usually comprising at least 50% of residues, which can be well
aligned between them. See Supplementary Material Figure A.11 for an example of the superposition of two
very diverse relatives (sequence identity 6%, RMSD 14A), showing the conserved core. Multiple pair-wise
superpositions of homologues within each CATH superfamily, revealing the structurally conserved core, can
be seen on the CATH website.
Once the representative is chosen, we then structurally align it against all superfamily members’ domains
(i.e. not just the sequence cluster representatives). This provides us with a structure-based residue-mapping
between all superfamily members and the representative. As before, we use SSAP for the structural align-
ments.
Finally, we map the functional site residues in individual superfamily members onto the superfamily
representative. Therefore for each position in the representative, we know whether it maps to functional
residues in any superfamily members, and what these superfamily members are. If a functional residue
5

from another domain in the superfamily maps to a gap in the structural alignment with the representative
domain, that residue is ignored in the rest of the analysis. The frequency at which individual residues on
the representative domain have their equivalent residues in other domains involved in functional interactions
can be counted (see Figure 1).
We decided not to limit our analysis to surface positions, for several reasons. First, there is no universally
accepted definition of surface residue. Secondly, it is common for residues that should be considered buried by
most standards, (e.g. relative surface accessibility lower than 0.05) to be involved in function. For example,
it was reported that catalytic sites have low relative solvent accessibilities, and up to 5% of them are fully
buried [32]. Also, a position that is buried in one structure may be surface-accessible in another structure of
the same protein due to conformational changes. Finally, functional residues used in this work are obtained
from the CSA and IBIS resources, and were originally defined as functional based on a careful analysis of
the literature, or using protein-ligand complexes of known structure in the PDB. In both resources, buried
residues may be considered functional, and in order not to lose any data, we chose not to include extra
constraints of surface accessibility.
In addition to performing a mapping of sites to a superfamily representative, we have used the same
strategy to map sites for a functional family (FineFam) to the FineFam representative, in order to examine
site coverage for a more functionally coherent grouping of relatives.
2.5. Conservation analysis
Sequences in functional families are aligned using MAFFT [33] and conservation scores for each position
in the alignments are computed using Scorecons [34]. A conservation score threshold of 0.7 was empirically
chosen to define conserved residues, based on previous studies in our group and comparison with known
functional residues in a subset of alignments.
2.6. Computing overlap between conserved and functional residues
Residue enrichment analysis has been used to assess the purity of different types of functional families
(i.e. FunFams or FineFams). Functional families ideally contain sequences that code for a protein with the
same molecular function, and therefore the same functional residues, e.g. catalytic residues, are expected to
feature in all of the sequences throughout the functional family as they will be highly conserved.
We have performed enrichment tests, for both FunFam and FineFam functional families, to ensure that
conserved residues are enriched in functional residues compared to the background dataset of residues, i.e.
all residues in the proteins. For this, we followed the procedure explained in a previous study [35]. The
idea is to compute the proportion of conserved residues that are also functional, Pc, and the proportion of
all residues that are also functional, Pa. The enrichment E, is equal to the difference Pc - Pa. Enrichment
values are then averaged over superfamilies, and a Wilcoxon Rank-Sum test [36] is performed over the set of
Enrichments to check whether Pc values tend to be significantly larger than Pa values. Wilcoxon Rank-Sum
tests were performed using the function wilcox.test in R [37].
6
(a) Schematic illustration.
(b) Illustration from NAD(P)-binding Rossmann-like domains superfamily
Figure 1: Mapping protocol. Subfigure 1a illustrates the protocol schematically. All domains in a superfamily(Domains 1 to 4) are structurally aligned to a superfamily representative. Domains are represented as a darkgrey backbone, and individual residues are represented as beads along the backbone. Ligands are representedas purple, red and magenta ellipsoids that bind to domains 1, 2 and 4, respectively. Binding residues inthese domains are coloured in black. Binding residues from the individual domains are then mapped to therepresentative, and the frequency with which representative residues map to binding residues is recorded. Inthis example, the residues in orange on the representative map to binding residues in two domains (domains1 and 2), whereas the residues in green map to binding residues in only one domain (domain 4). Thevectors next to some of the positions of the representative summarise the list of superfamily domains whereequivalent residues are involved in binding. Subfigure 1b illustrates the protocol with real protein-proteininterface data from domains in the NAD(P)-binding Rossmann-like superfamily. Three individual domainsfrom the superfamily are represented in complex with their protein partners at the bottom, and their interfaceresidues are mapped on the representative at the top. The domains of interest are shown in cartoon whereasthe partner chains are represented as thin linear chains. The representative is shown both in cartoon andsurface representation. Binding residues in the individual domains are coloured black. Residues on therepresentative are coloured grey, green, orange or red depending on the number of individual domains thathave a binding residue at that position (0, 1, 2 or 3).
7

Enrichment scores were also calculated for FunFam and FineFam alignments stripped of partial sequence
fragments. These fragments are expected to affect the quality of the alignments by introducing numerous
gaps between fragments and full-length protein domain sequences. Sequences with a length less than 80% of
the corresponding functional family average sequence length were removed. The remaining functional family
sequences were aligned using MAFFT and residue conservation scores were calculated using Scorecons.
Enrichment scores were then calculated as previously described.
2.7. Hub analysis
This section and the following one refer to analyses that we performed to help the interpretation of our
results on functional site diversity.
Data about hubs (from protein interaction networks) was collected by integrating interaction data from
IntAct [38], Mint [39], BioGrid [40], DIP [41], HPRD [42], Reactome [43] and Virus-Host-Net [44]. For all
proteins in the human genome (Ensembl [45], release 62), a network of interactions was built by filtering
to include only physical interactions. CATH domains were then mapped to their parent proteins in the
network, and the number of physical interactors for each parent protein was mapped back to the domain.
Hub superfamilies were defined as any superfamily in which at least one member is involved in at least 10
interactions. Other cut-offs were considered and did not result in significant changes of the overall distribution
of hub superfamilies (data not shown).
2.8. Structural diversity analysis
Structural diversity within superfamilies can be described quantitatively by clustering domains within
them according to structural similarity, and then counting the number of structural clusters in the superfamily
at a given cut-off of structural similarity.
Structural similarity was quantified using a normalised RMSD score, which consists of the RMSD mul-
tiplied by the length of the largest domain in the pair, and then divided by the number of aligned residue
pairs between the 2 domains (see [46] for more details).
The number of clusters then provides a global measure of structural diversity within superfamilies that
can be used to compare different superfamilies. The structural clusters are identified as described in the
CATH database, using a normalised RMSD cutoff of 9.0A to define the clusters. We then define structurally
diverse superfamilies as those superfamilies that have at least 2 structural clusters. We also repeated this
analysis using a cutoff of 5.0A rather than 9.0A.
3. Results
3.1. Functional site coverage
In order to evaluate the diversity of functional site spatial locations amongst members of the same
superfamily, we used a strategy whereby a superfamily representative is chosen, and sites from all members
of the superfamily are then mapped to it via pairwise structural alignments.
8
One simple measure of functional site diversity across a superfamily is the coverage of the representative
by functional sites, i.e. the number of positions on the representative that map to a functional site of a given
type (e.g. protein-protein binding sites), divided by the total number of positions in the representative.
If the representative domain is not too small, high coverage will generally mean that functional sites from
superfamily members can occur at different spatial locations, that when mapped onto the representative,
cover most of its positions.
Two confounding factors must be taken into account with this measure of diversity. First, if the repre-
sentative domain is very small, it is more likely to have a very high coverage. We avoid that problem by
considering only superfamilies where the representative has at least 100 residues. Of the 1456 superfamilies
in our initial dataset, 908 have a large enough representative.
Secondly, high coverage may in some cases be due to a single superfamily member. Indeed, if a single
domain in the superfamily has most of its residues involved in interactions with partner molecules, the
coverage on the representative may be very high. But in such cases, high coverage is not indicative of
diversity of functional sites between superfamily members. Although such cases are arguably of interest,
they are not the object of the present analysis, and we have kept them out for clarity. In practice, any
superfamily where one domain contributes more than 50% coverage of the representative is ignored from
our analysis. However, results obtained when including these superfamilies can be seen in Supplementary
Material Figure A.12.
The number of superfamilies that pass this second filter depends on the type of site being considered.
Table 1 shows, for each type of functional site, the number of superfamilies left in the dataset after all filters
have been applied.
Site Type #SuperfamiliesCatalytic Sites 328Protein-Protein In-terfaces
645
Nucleic Acid Bind-ing Sites
116
Small Ligand Bind-ing Sites
659
Table 1: Number of superfamilies considered in the dataset for each type of functional site, after applyingall filters.
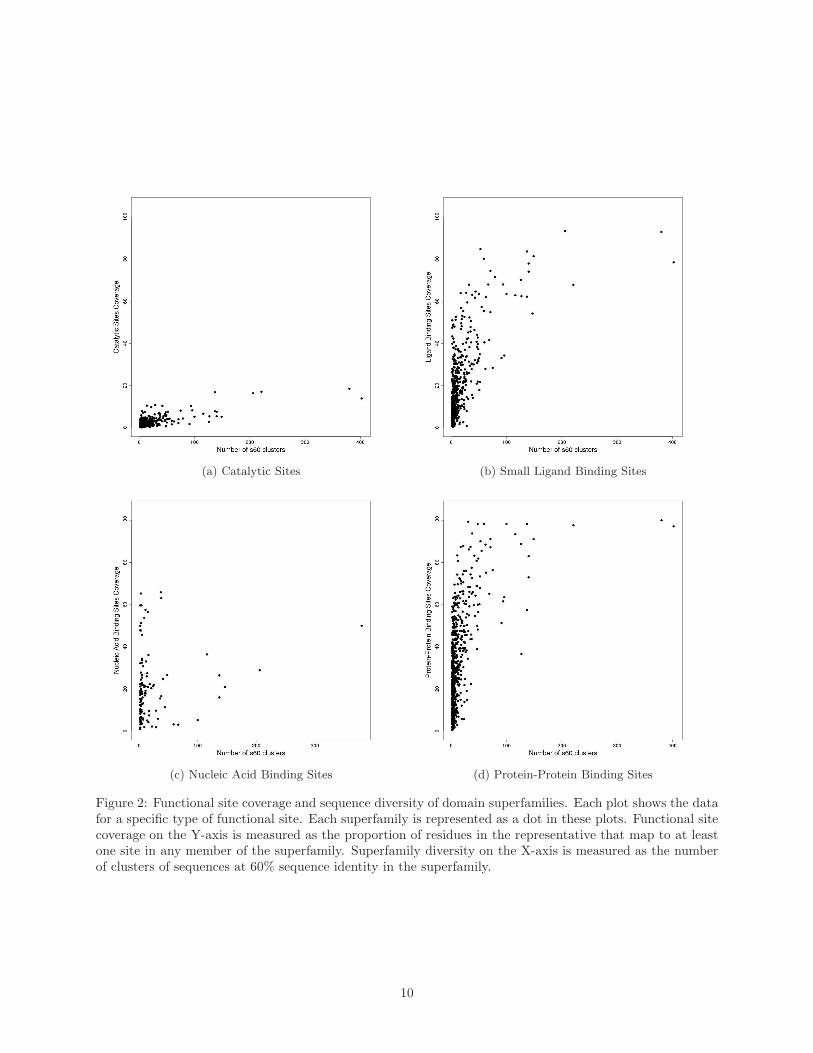
Figure 2 shows the functional site coverage against a simple measure of superfamily diversity, namely
the number of clusters of domains at 60% sequence identity. Four different types of functional sites, namely
catalytic sites, binding sites for small ligands, nucleic acid-binding sites, and protein-protein interfaces, were
considered separately.
We observe that coverage is rather limited for catalytic sites, confirming that these tend to co-occur
always in the same general location within superfamilies. This can be explained in part by their small size,
and from the fact that their location may be rather constrained by steric considerations, such as the need
9
(a) Catalytic Sites (b) Small Ligand Binding Sites
(c) Nucleic Acid Binding Sites (d) Protein-Protein Binding Sites
Figure 2: Functional site coverage and sequence diversity of domain superfamilies. Each plot shows the datafor a specific type of functional site. Each superfamily is represented as a dot in these plots. Functional sitecoverage on the Y-axis is measured as the proportion of residues in the representative that map to at leastone site in any member of the superfamily. Superfamily diversity on the X-axis is measured as the numberof clusters of sequences at 60% sequence identity in the superfamily.
10

for a pocket in which the reaction is performed [32]. Supplementary Material Figure A.13 shows that the
functional site coverage follows a highly similar trend when plotted against the the number of domains in a
superfamily.
In contrast, we observe large coverage of the representative by protein-protein binding sites, for a sig-
nificant number of superfamilies. This indicates that in these superfamilies, protein-protein interfaces can
occur in any topological location. Since we have summed protein protein sites from all relatives in the su-
perfamily onto the representative, this high coverage suggests that one or more relatives may have multiple
partners with different sites and also that binding partners and their sites may differ between relatives. In
particular, we can see that for the vast majority of superfamilies with significant diversity (e.g. more than
20 60% sequence identity clusters), more than 60% of residues in the representative map to protein-protein
interfaces.
Binding sites for small ligands are more limited in their distribution, which would be expected from
the fact that small ligands are generally smaller than macromolecules. Yet, we also note the presence of
several superfamilies with large coverage. A handful of superfamilies have coverage values over 80%, and a
significant fraction of superfamilies have coverage over 50%. This is somewhat unexpected as small-ligand
binding sites are generally quite small by definition. However, it can not be excluded that in some cases
confounding factors may also play a role. For example, in some relatives in the P-loop superfamily, some
artificial ligands have been used in a screening study that finds lots of potential binding sites.
Nucleic acid-binding site data is more sparse. Many superfamilies do not have any such binding sites,
and only a few have coverage values above 30% for these types of sites. A large number of superfamilies
have a representative coverage of 0 for nucleic acid binding, suggesting no domains within them are involved
in that type of function. This illustrates the fact that nucleic-acid binding is a more unusual ability than
binding other protein chains or small ligands.
Several DNA-binding domains exist within the promoter regions of transcription factors. These domains
include zinc fingers, homeobox domains, helix-turn-helices and leucine zippers [47, 48], which tend to favour
particular sites. These sites are represented as conserved consensus sequence motifs [49].
3.2. Site coverage increases with sequence diversity in the superfamily
Generally, we note that superfamilies with significant diversity tend to display large functional site cov-
erage values.
Supplementary Material Figure A.14 shows the functional site coverage firstly against the number of
superfamilies with this coverage and secondly against the number of domain sequences in superfamilies with
this coverage. Four different types of functional site have been analysed, as in Figure 2.
The functional site coverage of catalytic residues in Supplementary Material Figure A.14a is limited, as
previously shown in Figure 2a. Across Supplementary Material Figure A.14, a trend can be observed where
the superfamilies with very high functional site coverage are also the superfamilies with the highest number of
domain sequences. In the small ligand binding sites (Supplementary Material Figure A.14b) for example, at
11
97% functional site coverage, there is a single superfamily, which has a total of 727,424 sequences, the largest
number of domain sequences observed in this Figure. At 99% functional site coverage in the protein-protein
interface sites (Supplementary Material Figure A.14d), there are four superfamilies with a total of 129,941
domain sequences, which is a significant proportion of all the domain sequences. This suggests, as expected,
that superfamilies with large numbers of sequences are more likely to have higher diversity of functional site
location.
In the rest of the manuscript, we will mostly illustrate diversity by referring to the situation with protein-
protein interfaces, and small ligand binding sites to a lesser extent.
3.3. Illustrations of functional site coverage
In order to help further understand Figure 2, we illustrate them with examples taken from different regions
of the coverage plots (see Figures 3 to 5). We have chosen to focus on the specific case of protein-protein
interfaces.
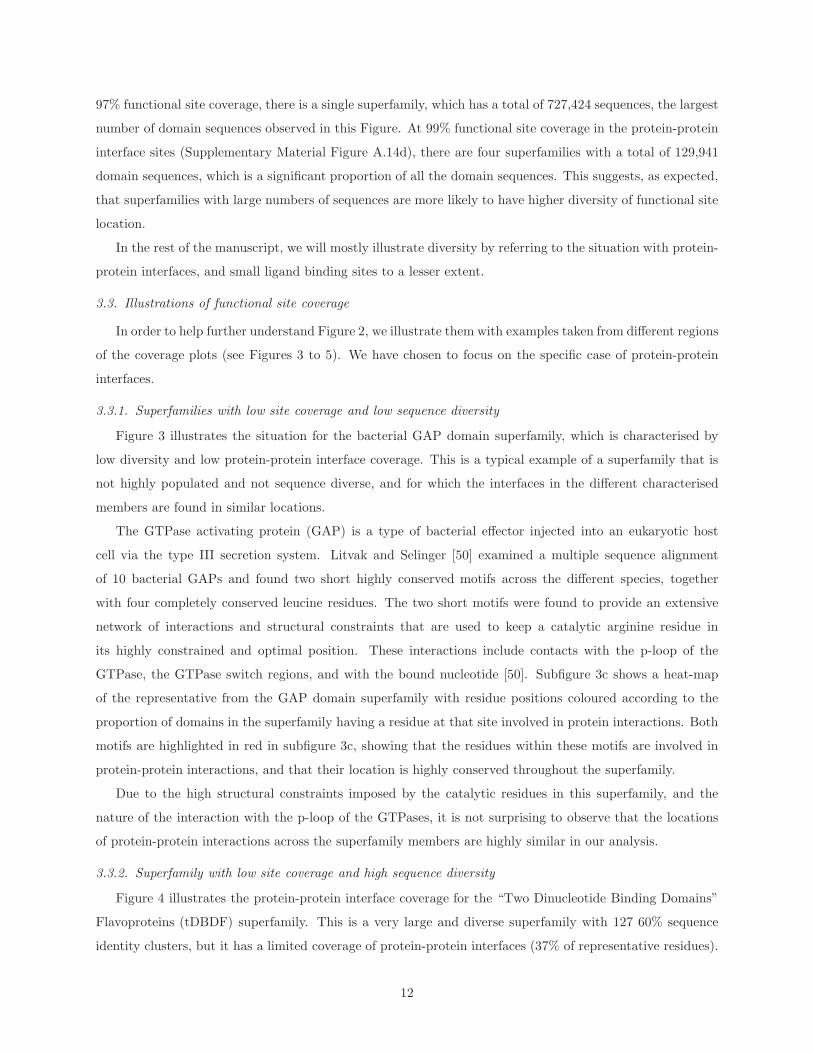
3.3.1. Superfamilies with low site coverage and low sequence diversity
Figure 3 illustrates the situation for the bacterial GAP domain superfamily, which is characterised by
low diversity and low protein-protein interface coverage. This is a typical example of a superfamily that is
not highly populated and not sequence diverse, and for which the interfaces in the different characterised
members are found in similar locations.
The GTPase activating protein (GAP) is a type of bacterial effector injected into an eukaryotic host
cell via the type III secretion system. Litvak and Selinger [50] examined a multiple sequence alignment
of 10 bacterial GAPs and found two short highly conserved motifs across the different species, together
with four completely conserved leucine residues. The two short motifs were found to provide an extensive
network of interactions and structural constraints that are used to keep a catalytic arginine residue in
its highly constrained and optimal position. These interactions include contacts with the p-loop of the
GTPase, the GTPase switch regions, and with the bound nucleotide [50]. Subfigure 3c shows a heat-map
of the representative from the GAP domain superfamily with residue positions coloured according to the
proportion of domains in the superfamily having a residue at that site involved in protein interactions. Both
motifs are highlighted in red in subfigure 3c, showing that the residues within these motifs are involved in
protein-protein interactions, and that their location is highly conserved throughout the superfamily.
Due to the high structural constraints imposed by the catalytic residues in this superfamily, and the
nature of the interaction with the p-loop of the GTPases, it is not surprising to observe that the locations
of protein-protein interactions across the superfamily members are highly similar in our analysis.
3.3.2. Superfamily with low site coverage and high sequence diversity
Figure 4 illustrates the protein-protein interface coverage for the “Two Dinucleotide Binding Domains”
Flavoproteins (tDBDF) superfamily. This is a very large and diverse superfamily with 127 60% sequence
identity clusters, but it has a limited coverage of protein-protein interfaces (37% of representative residues).
12
(a) Pseudomonas aeruginosa Exos toxin incomplex with human Rac.
(b) Salmonella Tyrosine Phosphatase SPTP in complex with hu-man Rac.
(c) GAP domain superfamily representative withmapped interface residues from other superfamily mem-bers.
Figure 3: Example of a small superfamily with limited coverage of protein-protein interfaces. This is theBacterial GTP-ase Activating Protein (GAP) domain superfamily (CATH code 1.20.120.260). The GAPdomain is always displayed in grey cartoon. In subfigures 3a and 3b, the interacting partner is colouredred and blue, respectively. Interface residues on the GAP domain are coloured black. Subfigures 3a and3b display PDB entries 1he1 and 1g4u, respectively. In subfigure 3c, the representative is displayed in greycartoons. Residues that map to interface residues in superfamily members are coloured according to thepercentage of members that have an interface residue at that position, using the following colour scale: 0 ingrey, 1-20% in blue, 20-40% in green, 40-60% in yellow, 60-80% in orange and 80-100% in red).
13

This superfamily is exceptional in that most other large, diverse superfamilies have a protein-protein interface
coverage of at least 50%. The bottom-right region of the plot is not occupied by many superfamilies (see
Figure 2d), suggesting as mentioned above, that with a few exceptions, diverse superfamilies have protein-
protein interfaces covering most spatial locations in the domain structure.
Ojha et al [51] performed a structural and functional analysis on 1,664 members belonging to the tDBDF
superfamily. As observed in our analysis, this enzymatic superfamily is very large and functionally diverse;
members have previously been shown to catalyse many types of oxidation/reduction reactions in events such
as energy metabolism, apoptosis, maintenance of redox homeostasis and cellular signalling. A wide variety of
substrates are used to carry out these functions, which are either small molecules or proteins. All superfamily
members have two dinucleotide binding Rossmann fold domains on a single chain, which both belong to the
same CATH superfamily (CATH code 3.50.50.60). In order to function correctly, both domains are required;
typically the N-terminal domain binds a flavin adenine dinucleotide (FAD) and the C-terminal domain binds
a pyridine nucleotide. Despite a high level of functional diversity across the superfamily, (largely due to the
variety of substrates), the position of these cofactors in the active site remains conserved so as to allow for
optimal stereospecific hydride transfer between the two cofactors. The pyridine nucleotide is structurally
restricted so that it has to interact with the FAD from the re-side, whose location is conserved across the
superfamily. Due to the structural constraints placed upon the two cofactors, the geometry of the binding
pockets is very highly conserved across the superfamily; the stacked configuration of the cofactors restricts
the nicotinamide ring of the pyridine nucleotide from interacting with the isoalloxazine ring from the re-side
of FAD [51]. This results in a single point of access to the FAD electron site, which in turn limits the number
of residues that can be involved in interactions with acceptor proteins [51]. These constraints are reflected in
our analysis where a limited number of residues are observed to be involved in protein-protein interactions.
3.3.3. Superfamily with high site coverage and high sequence diversity
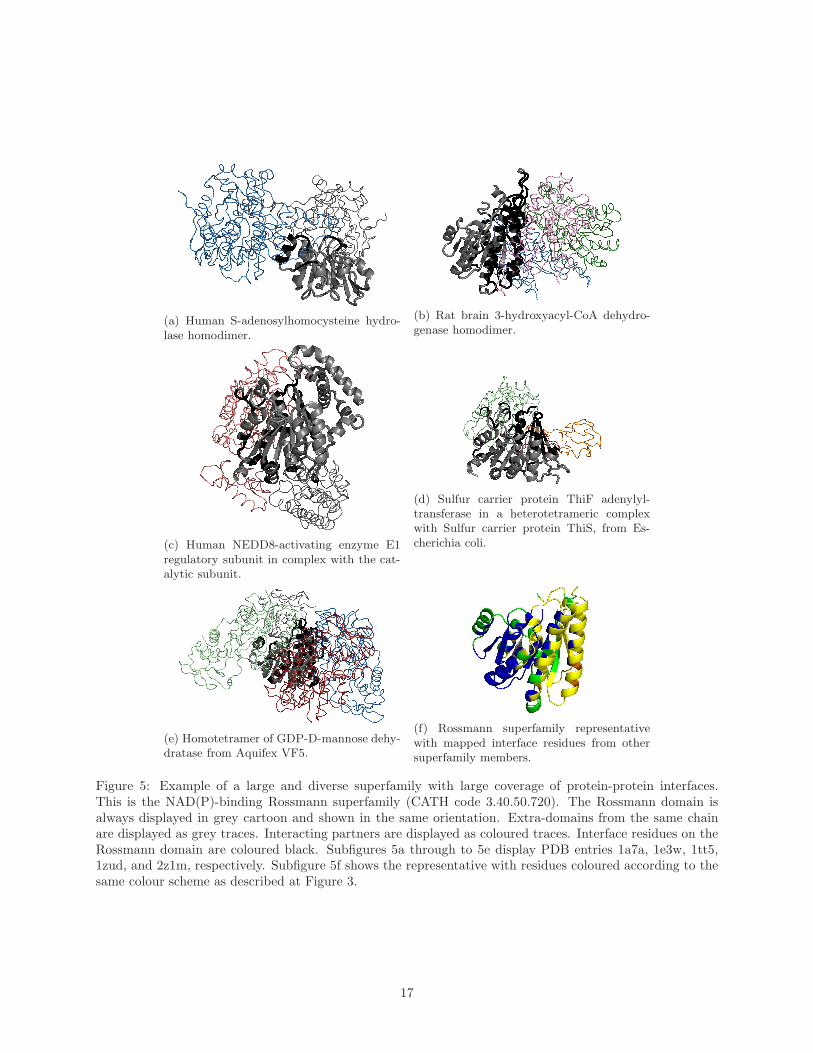
Figure 5 illustrates the protein-protein interface coverage for the NAD(P)-binding Rossmann superfamily.
This superfamily is extremely large with 402 60% sequence identity clusters. The NAD(P)-binding Rossmann
domains bind the coenzyme nicotinamide adenine dinucleotide (NAD+) and a large selection of catalytic
domains, which have been shown to come from at least seven different SCOP superfamilies [52]. NAD+ is
a co-factor in redox reactions in which the nicotinamide ring accepts a hydrogen in a reversible reaction.
The type of catalytic domain that is bound to the Rossmann domain determines the substrate specificity
and the exact catalytic reaction of the enzyme. Bashton and Chothia [52] discovered four different types of
connections between catalytic and Rossmann domains depending on whether the catalytic domain occurred
at the N- or C-terminus, in the middle of the Rossmann domain (subfigures 5c and 5e) or whether it includes
the Rossmann domain within it (subfigure 5a). For the majority of the examples illustrated in the Bashton
and Chothia paper [52], the catalytic domain lies close to the yellow region highlighted in subfigure 5f.
Figure 5 shows a summary of the mapping of protein-protein interfaces on the superfamily representative.
As this figure illustrates, protein-protein interfaces occur across a broad range of topological sites in this
14

(a) tDBDF domain from the subunitA of Adenylylsulfate reductase from Ar-chaeoglobus fulgidus in complex with sub-unit B.
(b) tDBDF domain from the flavoprotein subunit of E coliQuinol-fumarate reductase, in complex with other subunits.
(c) tDBDF superfamily representative with mapped in-terface residues from other superfamily members.
Figure 4: Example of a large and diverse superfamily with limited coverage of protein-protein interfaces. Thisis the “Two-Dinucleotide Binding Domains” Flavoprotein (tDBDF) superfamily (CATH code 3.50.50.60).The tDBDF domain is always displayed in grey cartoon. In subfigures 4a (PDB entry 1jnr) and 4b (PDBentry 1kf6), the interacting partners are represented as coloured traces. Interface residues on the tDBDFdomain are coloured black. The interface occurs in a similar location in these two distinct domains. Sub-figure 4c shows the representative with residues coloured according to the fraction of superfamily membersthat have an interface residue at that position, following the same colour scheme as described at Figure 3.
15

superfamily. Subfigure 5a, for example represents the human S-adenosylhomocysteine (AdoHcy) hydrolase
homodimer [53]. It consists of two chains, each comprising a NAD(P)-binding Rossmann domain nested
within a catalytic domain. The method with which this enzyme binds to its cofactor, NAD, is thought to
be unique and is important to its catalytic mechanism. Turner et al [53] found that the dimer has a unique
NAD-binding domain interface between helices α17 of the catalytic domain on one monomer and αC of the
NAD(P)-binding Rossmann domain on the second monomer (black helix in subfigure 5a), and between α18
of the catalytic domain on one monomer and residues at the adenine side of the NAD binding site in the
second monomer. In subfigure 5d the protein-protein interactions of ThiF differ from the previous example
as it uses helices located towards the N-terminal part of ThiF to form a mostly hydrophobic interface with
a second ThiF in the complex.
In spite of the fact that protein-protein interfaces occur at all topological sites in this superfamily,
Figure 5f shows that some regions (shown in yellow and orange) are clearly preferred over others (shown in
blue). This phenomenon of preferential colocation shall be discussed further in the next section.
3.4. Functional site preferential colocation
The fact that coverage is high for a particular type of functional site (e.g. Protein-Protein Interfaces),
in a given superfamily, does not necessarily mean that all the locations are used equally often by different
relatives, for function.
For example, as shown in Figure 5, in relatives in the Rossmann domain Superfamily discussed in Section
3.3.3 above, some protein partners bind close to the active site in the superfamily whilst others bind at more
remote sites. Furthermore, different relatives are binding diverse partners at different remote sites.
Throughout our analysis, numbers of non-redundant domains that have a site mapping at any position
on the representative are recorded, so that we can see if some positions are preferred over others.
Studying the tendency of functional sites to colocate in similar topological locations within superfamilies
was not a direct aim of this analysis. Indeed, previous studies have reported the existence of preferred sites
among remote homologues and even between structurally similar although not necessarily related proteins [6,
7]. However, we used our dataset to perform a very simple analysis of preferential colocation.
The approach we followed was to verify whether there was, in each superfamily, at least one position
where a majority of subfamilies (S60 clusters) have a functional site. As shown in Figure 6 we observe that
this seems to be the case for most superfamilies, thus confirming the existence of preferred locations.
The plots indicate that the majority of superfamilies have at least one position that is used as a functional
site in at least 50% of the subfamilies (S60 clusters) in the superfamily. The constraints to produce these
plots are rather strict as we considered only superfamilies with at least 10 60% sequence identity clusters
with functional site data. This explains why the data is so sparse for nucleic-acid binding sites and catalytic
sites. We chose these severe constraints to ensure that any preferential colocation of sites that was detected
was not caused by under-sampling.
16
(a) Human S-adenosylhomocysteine hydro-lase homodimer.
(b) Rat brain 3-hydroxyacyl-CoA dehydro-genase homodimer.
(c) Human NEDD8-activating enzyme E1regulatory subunit in complex with the cat-alytic subunit.
(d) Sulfur carrier protein ThiF adenylyl-transferase in a heterotetrameric complexwith Sulfur carrier protein ThiS, from Es-cherichia coli.
(e) Homotetramer of GDP-D-mannose dehy-dratase from Aquifex VF5.
(f) Rossmann superfamily representativewith mapped interface residues from othersuperfamily members.
Figure 5: Example of a large and diverse superfamily with large coverage of protein-protein interfaces.This is the NAD(P)-binding Rossmann superfamily (CATH code 3.40.50.720). The Rossmann domain isalways displayed in grey cartoon and shown in the same orientation. Extra-domains from the same chainare displayed as grey traces. Interacting partners are displayed as coloured traces. Interface residues on theRossmann domain are coloured black. Subfigures 5a through to 5e display PDB entries 1a7a, 1e3w, 1tt5,1zud, and 2z1m, respectively. Subfigure 5f shows the representative with residues coloured according to thesame colour scheme as described at Figure 3.
17
For catalytic sites and nucleic acid binding sites, the scarcity of data does not permit to draw any strong
conclusion.
Whilst Figure 6, suggesting preferential location, may appear to contradict the observation of high site
coverage shown in Figure 2, essentially there is no contradiction in the plots. A common binding site and
high site coverage are both possible in a superfamily. This arises from the fact that a relative can bind
multiple partners. So a common site may be used by many relatives but each of those relatives may bind
additional partners at different sites.
As well as examining site preference in superfamilies, we also investigated whether the site coverage tends
to be lower for a functional subfamily than for superfamilies i.e. lower site coverage for relatives sharing
similar functional properties and therefore more likely to have similar protein partners. Supplementary
Material Figure A.15 shows that most functional subfamilies examined have site coverage lower than 30%
for protein interactions. The trends observed are generally much lower than observed for superfamilies (see
Figure 6 and Supplementary Material Figure A.16) supporting the idea that the higher site coverage observed
when the whole superfamily is considered is largely due to the fact that functionally different relatives are
exploiting different sites on the domain for binding ligand/protein partners.
In Figure 7, we illustrate protein-protein interface coverage summaries for the most diverse superfamilies,
to show what the different patterns of preferential colocation are. As can be seen, all of these superfamilies
use most of their locations for protein-protein interfaces, but one region is generally preferred over others.
3.5. Functional site coverage compared with measures of function and structure diversity
Next, we attempt to interpret our results by using a number of measures of functional and structural
diversity of superfamilies and contrasting that with the coverage in functional sites.
For this, we check the distribution of superfamilies with different structural and functional features, and
see if any signal is observed that may help identify superfamilies that have greater functional site location
versatility.
3.5.1. Site coverage of enzyme and non-enzyme superfamilies
First we tested whether enzymatic superfamilies differed from non-enzymatic superfamilies in terms of
functional site coverage. The idea being that enzymes are generally thought to harbor one main canonical
active site, therefore being perhaps less likely to have high coverage. However, there does not seem to be an
obvious trend in the distribution of enzyme superfamilies in terms of functional site coverage of any type.
The lack of any obvious difference in coverage between enzyme and non-enzyme superfamilies may reflect
the fact that whilst enzymes have a preferred active site for binding substrates, they also use other regions
on the protein surface for binding protein partners e.g. in enzyme complexes. The plots are shown in
Supplementary Material Figure A.17.
18

(a) Catalytic Sites (b) Small Ligand Binding Sites
(c) Protein-Protein Interfaces (d) Nucleic Acid Binding Sites
Figure 6: Preferential location of functional sites in CATH superfamilies. Each dot represents a superfamily.The plots show, on the Y-axis, the maximum proportion of 60% sequence identity clusters that have afunctional site at a given position (or, in other words, it shows the proportion of 60% seq. id. clusters with afunctional site at the position where that proportion is highest). The X-axis shows the number of 60% seq.id. clusters that have functional site data of that type in the superfamily. Only superfamilies with at least10 60% seq. id. clusters are considered here. This is to avoid meaningless fractions on the Y-axis (50% of 2clusters is only one cluster).
19

(a) OB-fold Nucleic acid-bindingproteins (CATH code 2.40.50.140) (b) Periplasmic binding protein-like
II (CATH code 3.40.190.10)(c) Protein Kinase-like (PK-like)(CATH code 3.30.200.20)
(d) Thioredoxin-like (CATH code3.40.30.10)
(e) Trypsin-like serine proteases(CATH code 2.40.10.10) (f) Aldolases (CATH code
3.20.20.70)
(g) Winged Helix DNA Binding do-mains (CATH code 1.10.10.10)
(h) Immunoglobulins (CATH code2.60.40.10) (i) P-loop containing NTP Hydro-
lases (CATH code 3.40.50.300)
(j) NAD(P)-binding Rossmann-likedomains (CATH code 3.40.50.720)
Figure 7: Protein-protein interface coverage for 10 most populated superfamilies in the CATH database.The color scheme is the same as in Figure 3
20
3.5.2. Correlation of site coverage with tendency to be a hub protein
We then checked whether superfamilies that contain domains from protein interaction network hub pro-
teins display different patterns of functional site plasticity. At least some categories of hubs are thought to
interact with their many partners via several distinct sites on their surfaces. The distribution of hub-related
superfamilies is shown in Supplementary Material Figure A.18. As can be seen from the plots, the hub super-
families do not cluster in a particular area of the plot. Some hub superfamilies have low interface coverage,
whereas others have very high coverage. This can be explained by a number of factors. First hub-related
superfamilies may not always be directly involved in the interactions, because hubs are defined at the protein
level, not the domain level. Second, structural data is missing for a large number of interactions so that
although interactions are known, interfaces may not be. Finally, and as alluded to above, from a biological
standpoint, hubs may be using the same interface for many of their interactions.
However, clearly information collected by our analyses may be helpful for other researchers investigating
putative hub domains. For example, domains thought to be acting as hubs which belong to diverse super-
families, with low site coverage, may exploit a single specific surface in their interactions which would allow
them to regulate these interactions.
3.5.3. Structural diversity
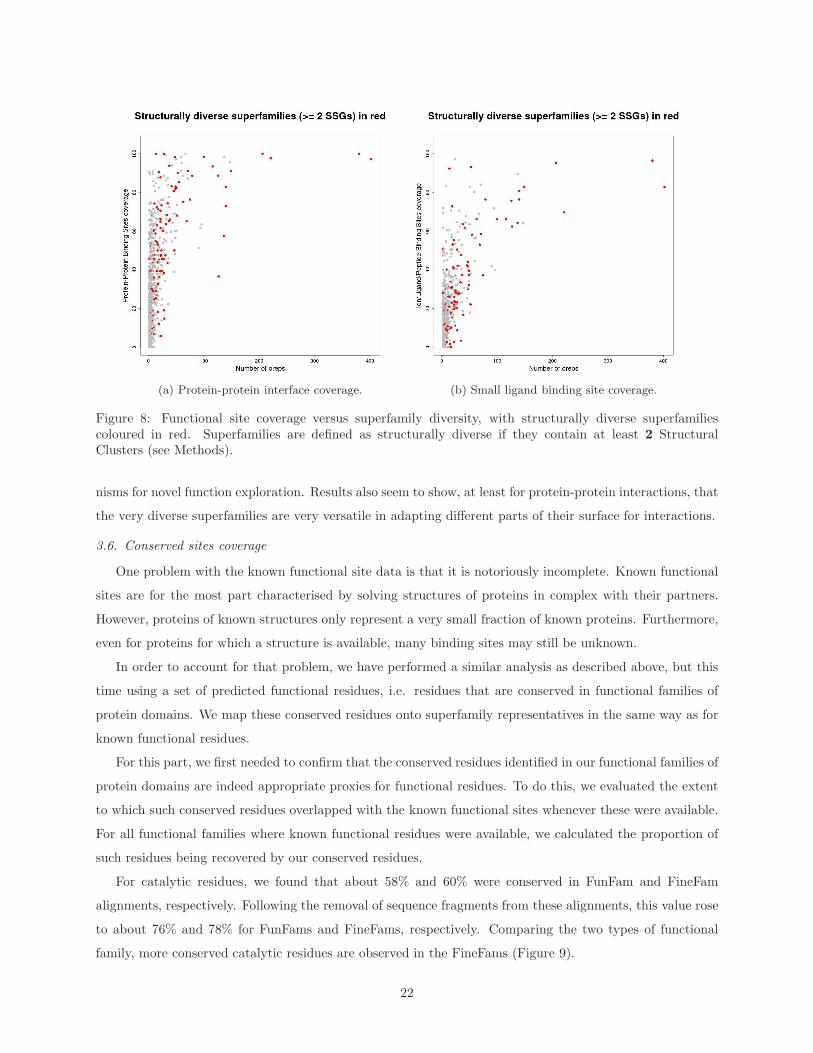
When displaying the structural diversity of superfamilies on the plots shown in Figure 2, we observe that
structurally diverse superfamilies mostly have high site coverage (see Figure 8). This is the case whether
we measure structural diversity by the number of clusters generated using a 9.0A RMSD threshold or 5.0A
RMSD threshold (see Supplementary Material Figures A.19 and A.20). Indeed, a Wilcoxon Rank-Sum test
performed to compare the distributions of coverage values for structurally diverse superfamilies vs the other
ones, shows that structurally diverse superfamilies have significantly higher coverage values, for all types of
sites except nucleic acid binding sites (see Table 2).
Site Type P-valueCatalytic Sites 4.894147 x 10⁻¹⁹
Protein-Protein Interfaces 9.74794 x 10⁻¹⁸
Nucleic Acid Binding Sites 0.04609505Small Ligand Binding Sites 6.176701 10−16
Table 2: Results from a Wilcoxon Rank-Sum test comparing functional site coverage values for structurallydiverse superfamilies versus structurally similar superfamilies
Previous work has shown that one of the ways by which homologous domains were able to explore new
regions of functional space, was by exploiting structural embellishments, for function. It was shown that
these structural embellishments have a tendency to be directly involved in binding or catalysis [16, 15]. It
should however be noted that superfamilies with high site coverage are not necessarily the most diverse ones,
suggesting that high site coverage is not exclusively a function of structural diversity.
Results here point at the existence of large and diverse superfamilies that may exploit different mecha-
21
(a) Protein-protein interface coverage. (b) Small ligand binding site coverage.
Figure 8: Functional site coverage versus superfamily diversity, with structurally diverse superfamiliescoloured in red. Superfamilies are defined as structurally diverse if they contain at least 2 StructuralClusters (see Methods).
nisms for novel function exploration. Results also seem to show, at least for protein-protein interactions, that
the very diverse superfamilies are very versatile in adapting different parts of their surface for interactions.
3.6. Conserved sites coverage
One problem with the known functional site data is that it is notoriously incomplete. Known functional
sites are for the most part characterised by solving structures of proteins in complex with their partners.
However, proteins of known structures only represent a very small fraction of known proteins. Furthermore,
even for proteins for which a structure is available, many binding sites may still be unknown.
In order to account for that problem, we have performed a similar analysis as described above, but this
time using a set of predicted functional residues, i.e. residues that are conserved in functional families of
protein domains. We map these conserved residues onto superfamily representatives in the same way as for
known functional residues.
For this part, we first needed to confirm that the conserved residues identified in our functional families of
protein domains are indeed appropriate proxies for functional residues. To do this, we evaluated the extent
to which such conserved residues overlapped with the known functional sites whenever these were available.
For all functional families where known functional residues were available, we calculated the proportion of
such residues being recovered by our conserved residues.
For catalytic residues, we found that about 58% and 60% were conserved in FunFam and FineFam
alignments, respectively. Following the removal of sequence fragments from these alignments, this value rose
to about 76% and 78% for FunFams and FineFams, respectively. Comparing the two types of functional
family, more conserved catalytic residues are observed in the FineFams (Figure 9).
22
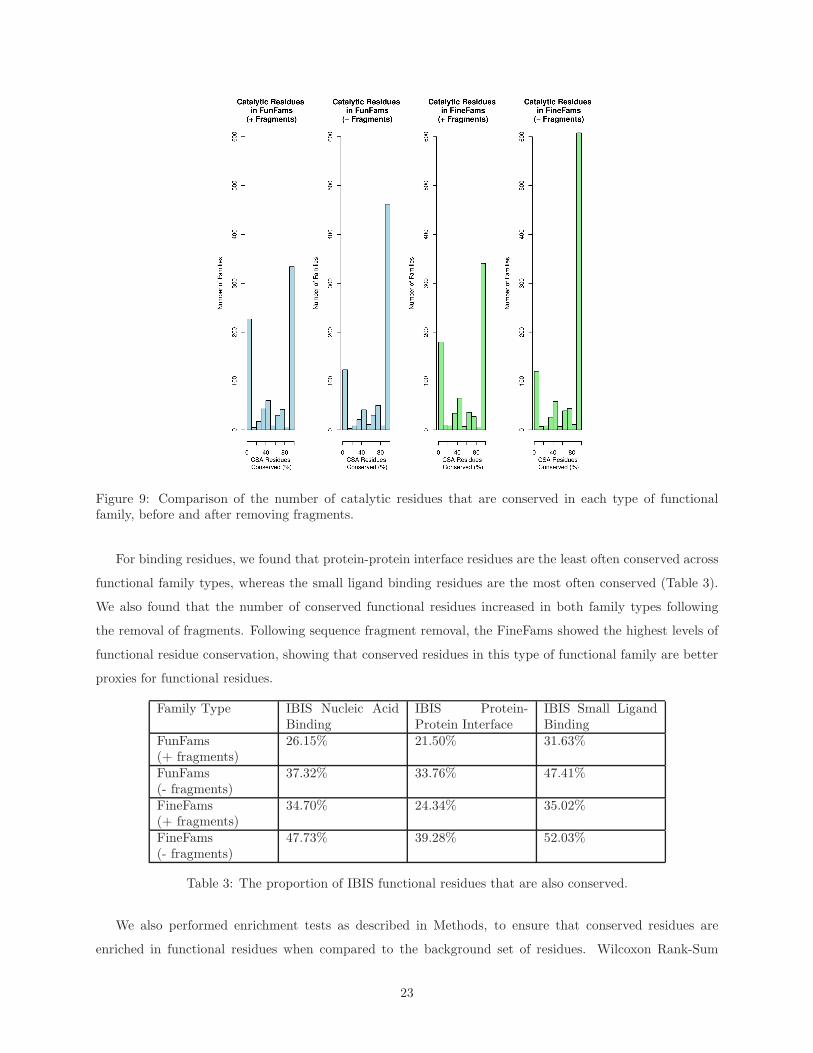
Figure 9: Comparison of the number of catalytic residues that are conserved in each type of functionalfamily, before and after removing fragments.
For binding residues, we found that protein-protein interface residues are the least often conserved across
functional family types, whereas the small ligand binding residues are the most often conserved (Table 3).
We also found that the number of conserved functional residues increased in both family types following
the removal of fragments. Following sequence fragment removal, the FineFams showed the highest levels of
functional residue conservation, showing that conserved residues in this type of functional family are better
proxies for functional residues.
Family Type IBIS Nucleic AcidBinding
IBIS Protein-Protein Interface
IBIS Small LigandBinding
FunFams(+ fragments)
26.15% 21.50% 31.63%
FunFams(- fragments)
37.32% 33.76% 47.41%
FineFams(+ fragments)
34.70% 24.34% 35.02%
FineFams(- fragments)
47.73% 39.28% 52.03%
Table 3: The proportion of IBIS functional residues that are also conserved.
We also performed enrichment tests as described in Methods, to ensure that conserved residues are
enriched in functional residues when compared to the background set of residues. Wilcoxon Rank-Sum
23
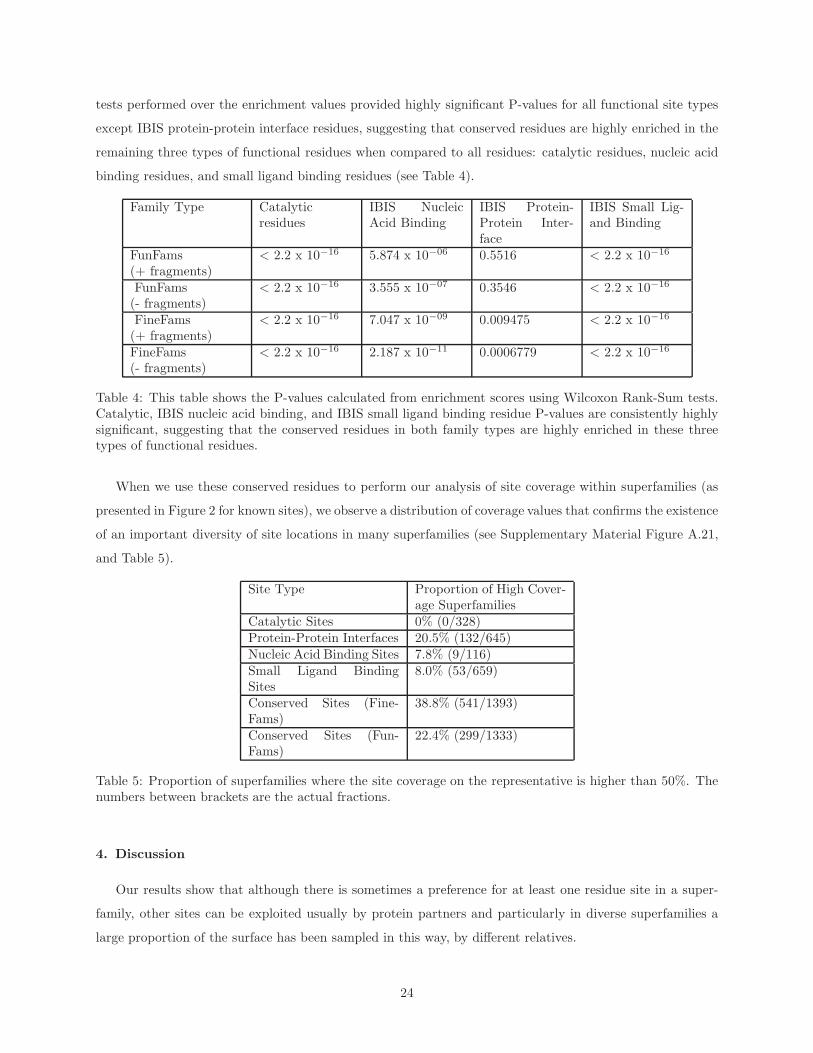
tests performed over the enrichment values provided highly significant P-values for all functional site types
except IBIS protein-protein interface residues, suggesting that conserved residues are highly enriched in the
remaining three types of functional residues when compared to all residues: catalytic residues, nucleic acid
binding residues, and small ligand binding residues (see Table 4).
Family Type Catalyticresidues
IBIS NucleicAcid Binding
IBIS Protein-Protein Inter-face
IBIS Small Lig-and Binding
FunFams(+ fragments)
< 2.2 x 10⁻¹⁶ 5.874 x 10−06 0.5516 < 2.2 x 10⁻¹⁶
FunFams(- fragments)
< 2.2 x 10⁻¹⁶ 3.555 x 10−07 0.3546 < 2.2 x 10⁻¹⁶
FineFams(+ fragments)
< 2.2 x 10⁻¹⁶ 7.047 x 10−09 0.009475 < 2.2 x 10⁻¹⁶
FineFams(- fragments)
< 2.2 x 10⁻¹⁶ 2.187 x 10⁻¹¹ 0.0006779 < 2.2 x 10⁻¹⁶
Table 4: This table shows the P-values calculated from enrichment scores using Wilcoxon Rank-Sum tests.Catalytic, IBIS nucleic acid binding, and IBIS small ligand binding residue P-values are consistently highlysignificant, suggesting that the conserved residues in both family types are highly enriched in these threetypes of functional residues.
When we use these conserved residues to perform our analysis of site coverage within superfamilies (as
presented in Figure 2 for known sites), we observe a distribution of coverage values that confirms the existence
of an important diversity of site locations in many superfamilies (see Supplementary Material Figure A.21,
and Table 5).
Site Type Proportion of High Cover-age Superfamilies
Catalytic Sites 0% (0/328)Protein-Protein Interfaces 20.5% (132/645)Nucleic Acid Binding Sites 7.8% (9/116)Small Ligand BindingSites
8.0% (53/659)
Conserved Sites (Fine-Fams)
38.8% (541/1393)
Conserved Sites (Fun-Fams)
22.4% (299/1333)
Table 5: Proportion of superfamilies where the site coverage on the representative is higher than 50%. Thenumbers between brackets are the actual fractions.
4. Discussion
Our results show that although there is sometimes a preference for at least one residue site in a super-
family, other sites can be exploited usually by protein partners and particularly in diverse superfamilies a
large proportion of the surface has been sampled in this way, by different relatives.
24
If we partition the superfamily into more functionally coherent subfamilies, we see that there is a greater
tendency to exploit a common site (see Supplementary Material Figures A.15 and A.16). Therefore, the
increase in coverage obtained when accumulating site data from all relatives across a superfamily, is due to
the fact that some of the functional subfamilies must exploit different sites on the domain surface.
These observations (i.e. preferred sites and multiple sites across the domain) are not contradictory. A
common binding site and high surface coverage are both possible in a superfamily. This notably arises from
the fact that a relative can bind multiple partners. So a common site may be used by many relatives but
each of those relatives may bind additional partners at different sites.
For example, in an enzyme superfamily, a domain may bind multiple protein partners in an enzyme
complex or oligomeric unit. One of these partners may bind at the common superfamily active site as it may
contribute additional catalytic residues to the site. Another may bind at a different site, quite remote from
the common active site. Summed over the whole superfamily this can result in one or more common sites
used by many relatives but also many additional unique sites over the surface corresponding to the binding
sites of different ligands/partners bound by different relatives.
Therefore, for the protein-protein interaction plots, the large coverage ie diversity of sites being exploited
by different relatives, could be associated with changes in the specificity of the proteins that they bind.
Previous analyses on protein families in yeast and E. coli, have shown by analysing GO terms, that different
paralogous relatives within a superfamily tend to bind to different protein partners [54]. Our results here
may suggest that these diverse protein partners bind at different sites on the domain surface. Similarly, when
considering an individual relative with multiple protein partners, it may be beneficial to have these partners
binding at different sites, to reduce cross effects, unless binding to a common site was somehow important
for regulation.
We believe that our observations relate to both physical considerations and evolutionary ones. For
example, in enzymes, one of the deepest surface pockets are frequently exploited for binding substrates [55]
and this is often used by all the relatives. This site is therefore highly conserved throughout evolution,
presumably because it has the best features to support a chemical reaction.
However, for metal binding or protein interactions where the activity does not need to be so exquisitely
tailored to provide the precise stereochemistry of catalytic residues, most parts of the surface may be able to
evolve the right characteristics for binding ligands/protein partners. Therefore different functional surfaces
can emerge during evolution in duplicated domains.
Relatives in different organisms often bind different metal ions and can sometimes exploit different co-
factors. The fact that it appears possible for domains to change their surfaces during evolution to bind
different molecules clearly contributes to the diversity in functional repertoires that we see between different
species.
Our analyses have been purely empirical and reflect what is currently observed in the PDB when all
relatives with known site data are sampled. They are not intended to infer probabilities of binding to
25
particular sites.
There are a number of issues to keep in mind when interpreting our results. First, the diversity of site
locations we present in this work is likely to be a lower bound. There are relatively few known functional
sites in biological databases. For example, if you consider all the known site data available for the functional
subfamilies in our analysis, Supplementary Material Figure A.22 shows that in the majority of superfamilies
only 30% or less of the subfamilies have annotations. The reason for this lack of site data is that the main
experimental method for identifying functional residues is still X-ray crystallography with a bound ligand.
These data can be difficult to obtain, and therefore, for many proteins, functional residues are yet unknown.
For example, there could be transient complexes formed between a domain relative and protein partners.
Our current observation on the proportions of relatives exploiting a common site will generally not take
account of these protein partners because of the difficulty of capturing transient interactions. If these
transient partners all exploit the same site, the tendency to use a preferred site within a superfamily becomes
higher.
Secondly, our analysis relies on structural alignment between domains for functional residue mapping. We
believe that by using the approach described here, we have minimized the risks of mis-alignments between
residues of the representative and those of other domains in the superfamily. Indeed, we rely on structural
alignments which are generally safer than sequence alignments, we use pairwise alignments rather than the
more difficult multiple structure alignments, and we focus on comparisons between individual domains within
superfamilies. This should generally ensure alignments that are as reliable-as-it-gets. However, we cannot
rule out odd mis-mappings between residues, especially when comparing very different domains. In general,
however, we expect such mis-mappings to occur between relatively small windows around the residues of
interest.
Third, IBIS uses a distance cut-off of 4 A from the ligand to define binding residues. This cut-off may
sometimes slightly over-estimate the amount of residues to include in functional sites. However, similar
and sometimes larger distance cut-offs are routinely used for defining functional sites. We trust that in the
majority of cases, this is a reasonable threshold to be used.
Fourth, structural diversity within superfamilies means that some members may sometimes include large
insertions or embellishments that are not present in other members. In particular, the representative may,
more often than not, not include some of the embellishments that are present in other members of the super-
family. In those cases, we are potentially missing all the functional sites that occur on these embellishments,
when we map functional residues on the representative. Again, this results in under-estimating functional
site diversity across the superfamily. Given the way we chose the representative, we should minimize the
risk of having the opposite situation, i.e. cases where the representative contains embellishments that are
not present in other members of the superfamily. Indeed, the presence of such embellishments reduce overall
structural similarity to other superfamily members, thus reducing the chance of a domain with large embel-
lishments being selected as representative. As a reminder, the representative is chosen as the domain with
26
largest cumulative structural similarity to all other members of the superfamily. In addition, even if a repre-
sentative with large and unique embellishments is selected, this means that once again we underestimate the
real diversity of functional sites, since that would mean that those embellishments cannot map to functional
sites in other domains, and therefore, the representative coverage in functional sites diminishes.
5. Conclusion
In this work, we have performed a comprehensive analysis of all superfamilies for which there is sufficient
data, to check whether functional sites are constrained to a few locations or can appear anywhere on the
domain.
We provide quantitative analyses that document superfamilies in which related domains differ in terms
of the location of their functional sites. We show that this phenomenon is pervasive and actually occurs
in a significant number of superfamilies, especially those that contain the largest numbers of domains. In
particular, we demonstrate that if a superfamily reaches a certain level of functional diversity, functional site
location diversity also ensues.
This diversity in functional sites has consequences in the way we understand proteins, in particular their
functional plasticity. It also has consequences on the approaches used for predicting functional sites. Since it
appears that functional sites can sometimes occur in many different locations among related domains, relying
too strictly on homology transfer for functional site prediction may sometimes result in missing potentially
interesting predictions. In that context, prediction methods that rely not only on transfer by homology but
also use a range of other features such as structural and physico-chemical properties of residues, may also
be helpful.
Our data can also be useful in highlighting which superfamilies are particularly versatile in terms of their
functional site location. All our data on functional site diversity within superfamilies are available from the
CATH website.
6. Acknowledgements
BHD is a Long-term Postdoctoral Fellow of the Japan Society for the Promotion of Science (JSPS). This
work was in part supported by JSPS KAKENHI Grant Number 23-01210. NLD acknowledges funding from
the MRC.
7. Conflict of interest statement
None declared.
References
[1] I. Ezkurdia, L. Bartoli, P. Fariselli, R. Casadio, A. Valencia, M. L. Tress, Progress and challenges
in predicting protein-protein interaction sites, Briefings in Bioinformatics 10 (3) (2009) 233–246.
27
doi:10.1093/bib/bbp021.
URL http://dx.doi.org/10.1093/bib/bbp021
[2] P. Aloy, H. Ceulemans, A. Stark, R. B. Russell, The relationship between sequence and interaction
divergence in proteins, J Mol Biol 332 (2003) 989–998.
[3] G. Lopez, A. Valencia, M. L. Tress, firestar–prediction of functionally important residues us-
ing structural templates and alignment reliability., Nucleic acids research 35 (Web Server issue).
doi:10.1093/nar/gkm297.
URL http://dx.doi.org/10.1093/nar/gkm297
[4] A. Roy, A. Kucukural, Y. Zhang, I-TASSER: a unified platform for automated protein structure and
function prediction., Nature protocols 5 (4) (2010) 725–738. doi:10.1038/nprot.2010.5.
URL http://dx.doi.org/10.1038/nprot.2010.5
[5] A. Roy, Y. Zhang, Recognizing protein-ligand binding sites by global structural alignment
and local geometry refinement., Structure (London, England : 1993) 20 (6) (2012) 987–997.
doi:10.1016/j.str.2012.03.009.
URL http://dx.doi.org/10.1016/j.str.2012.03.009
[6] R. B. Russell, P. D. Sasieni, M. J. Sternberg, Supersites within superfolds. binding site similarity in the
absence of homology., Journal of molecular biology 282 (4) (1998) 903–918. doi:10.1006/jmbi.1998.2043.
URL http://dx.doi.org/10.1006/jmbi.1998.2043
[7] Q. C. Zhang, D. Petrey, R. Norel, B. H. Honig, Protein interface conservation across struc-
ture space, Proceedings of the National Academy of Sciences 107 (24) (2010) 10896–10901.
doi:10.1073/pnas.1005894107.
URL http://dx.doi.org/10.1073/pnas.1005894107
[8] C. Chothia, J. Gough, Genomic and structural aspects of protein evolution., The Biochemical journal
419 (1) (2009) 15–28. doi:10.1042/BJ20090122.
URL http://dx.doi.org/10.1042/BJ20090122
[9] A. L. Cuff, I. Sillitoe, T. Lewis, A. B. Clegg, R. Rentzsch, N. Furnham, M. Pellegrini-Calace, D. Jones,
J. Thornton, C. A. Orengo, Extending CATH: increasing coverage of the protein structure uni-
verse and linking structure with function, Nucleic Acids Research 39 (suppl 1) (2011) D420–D426.
doi:10.1093/nar/gkq1001.
URL http://dx.doi.org/10.1093/nar/gkq1001
[10] A. Andreeva, D. Howorth, J.-M. M. Chandonia, S. E. Brenner, T. J. Hubbard, C. Chothia, A. G. Murzin,
Data growth and its impact on the SCOP database: new developments, Nucleic Acids Research 36 (suppl
28
1) (2008) D419–D425. doi:10.1093/nar/gkm993.
URL http://dx.doi.org/10.1093/nar/gkm993
[11] M. N. Wass, A. David, M. J. Sternberg, Challenges for the prediction of macromolecular interactions.,
Current opinion in structural biology 21 (3) (2011) 382–390. doi:10.1016/j.sbi.2011.03.013.
URL http://dx.doi.org/10.1016/j.sbi.2011.03.013
[12] A. E. Todd, C. A. Orengo, J. M. Thornton, Evolution of function in protein superfamilies, from a
structural perspective, J Mol Biol 307 (2001) 1113–1143.
[13] R. A. Goldstein, The structure of protein evolution and the evolution of protein structure., Current
opinion in structural biology 18 (2) (2008) 170–177. doi:10.1016/j.sbi.2008.01.006.
URL http://dx.doi.org/10.1016/j.sbi.2008.01.006
[14] O. Redfern, B. Dessailly, C. Orengo, Exploring the structure and function paradigm, Current Opinion
in Structural Biology 18 (3) (2008) 394–402. doi:10.1016/j.sbi.2008.05.007.
URL http://dx.doi.org/10.1016/j.sbi.2008.05.007
[15] G. A. Reeves, T. J. Dallman, O. C. Redfern, A. Akpor, C. A. Orengo, Structural diversity of do-
main superfamilies in the CATH database., Journal of molecular biology 360 (3) (2006) 725–741.
doi:10.1016/j.jmb.2006.05.035.
URL http://dx.doi.org/10.1016/j.jmb.2006.05.035
[16] B. H. Dessailly, O. C. Redfern, A. L. Cuff, C. A. Orengo, Detailed analysis of function divergence in
a large and diverse domain superfamily: toward a refined protocol of function classification., Structure
(London, England : 1993) 18 (11) (2010) 1522–1535. doi:10.1016/j.str.2010.08.017.
URL http://dx.doi.org/10.1016/j.str.2010.08.017
[17] D. Korkin, F. P. Davis, A. Sali, Localization of protein-binding sites within families of proteins, Protein
Science 14 (9) (2005) 2350–2360. doi:10.1110/ps.051571905.
URL http://dx.doi.org/10.1110/ps.051571905
[18] S. Addou, R. Rentzsch, D. Lee, C. A. Orengo, Domain-Based and Family-Specific sequence identity
thresholds increase the levels of reliable protein function transfer, Journal of Molecular Biology 387 (2)
(2009) 416–430. doi:10.1016/j.jmb.2008.12.045.
URL http://dx.doi.org/10.1016/j.jmb.2008.12.045
[19] J. Lees, C. Yeats, J. Perkins, I. Sillitoe, R. Rentzsch, B. H. Dessailly, C. Orengo, Gene3D: a domain-
based resource for comparative genomics, functional annotation and protein network analysis., Nucleic
acids research 40 (Database issue) (2012) D465–D471. doi:10.1093/nar/gkr1181.
URL http://dx.doi.org/10.1093/nar/gkr1181
29

[20] D. A. Lee, R. Rentzsch, C. Orengo, GeMMA: functional subfamily classification within super-
families of predicted protein structural domains., Nucleic acids research 38 (3) (2010) 720–737.
doi:10.1093/nar/gkp1049.
URL http://dx.doi.org/10.1093/nar/gkp1049
[21] R. Rentzsch, C. A. Orengo, Protein function prediction using domain families (submitted) (2012).
[22] W. Li, A. Godzik, Cd-hit: a fast program for clustering and comparing large sets of protein or nucleotide
sequences, Bioinformatics 22 (13) (2006) 1658–1659. doi:10.1093/bioinformatics/btl158.
URL http://dx.doi.org/10.1093/bioinformatics/btl158
[23] K. Katoh, K.-i. Kuma, H. Toh, T. Miyata, MAFFT version 5: improvement in accuracy of multiple
sequence alignment, Nucleic Acids Research 33 (2) (2005) 511–518. doi:10.1093/nar/gki198.
URL http://dx.doi.org/10.1093/nar/gki198
[24] R. Sadreyev, N. Grishin, COMPASS: a tool for comparison of multiple protein alignments with assess-
ment of statistical significance., Journal of molecular biology 326 (1) (2003) 317–336.
URL http://view.ncbi.nlm.nih.gov/pubmed/12547212
[25] S. C.-H. C. Pegg, S. D. Brown, S. Ojha, J. Seffernick, E. C. Meng, J. H. Morris, P. J. Chang, C. C.
Huang, T. E. Ferrin, P. C. Babbitt, Leveraging enzyme structure-function relationships for functional
inference and experimental design: the structure-function linkage database., Biochemistry 45 (8) (2006)
2545–2555. doi:10.1021/bi052101l.
URL http://dx.doi.org/10.1021/bi052101l
[26] C. T. Porter, G. J. Bartlett, J. M. Thornton, The catalytic site atlas: a resource of catalytic sites and
residues identified in enzymes using structural data, Nucleic Acids Res 32 (2004) D129–D133.
[27] B. A. Shoemaker, D. Zhang, M. Tyagi, R. R. Thangudu, J. H. Fong, A. Marchler-Bauer, S. H. Bryant,
T. Madej, A. R. Panchenko, IBIS (inferred biomolecular interaction server) reports, predicts and inte-
grates multiple types of conserved interactions for proteins., Nucleic acids research 40 (Database issue)
(2012) D834–D840. doi:10.1093/nar/gkr997.
URL http://dx.doi.org/10.1093/nar/gkr997
[28] E. Krissinel, K. Henrick, Inference of macromolecular assemblies from crystalline state., Journal of
molecular biology 372 (3) (2007) 774–797. doi:10.1016/j.jmb.2007.05.022.
URL http://dx.doi.org/10.1016/j.jmb.2007.05.022
[29] H. Berman, K. Henrick, H. Nakamura, Announcing the worldwide protein data bank, Nat Struct Mol
Biol 10 (12) (2003) 980. doi:10.1038/nsb1203-980.
URL http://dx.doi.org/10.1038/nsb1203-980
30

[30] C. A. Orengo, W. R. Taylor, [36] SSAP: Sequential structure alignment program for protein structure
comparison, Vol. 266 of Methods in Enzymology, Elsevier, 1996, pp. 617–635. doi:10.1016/S0076-
6879(96)66038-8.
URL http://dx.doi.org/10.1016/S0076-6879(96)66038-8
[31] O. C. Redfern, B. H. Dessailly, T. J. Dallman, I. Sillitoe, C. A. Orengo, FLORA: A Novel Method
to Predict Protein Function from Structure in Diverse Superfamilies, PLoS Comput Biol 5 (8) (2009)
e1000485+. doi:10.1371/journal.pcbi.1000485.
URL http://dx.doi.org/10.1371/journal.pcbi.1000485
[32] G. J. Bartlett, C. T. Porter, N. Borkakoti, J. M. Thornton, Analysis of catalytic residues in enzyme
active sites, J Mol Biol 324 (2002) 105–121.
[33] K. Katoh, H. Toh, Recent developments in the MAFFT multiple sequence alignment program, Briefings
in Bioinformatics 9 (4) (2008) 286–298. doi:10.1093/bib/bbn013.
URL http://dx.doi.org/10.1093/bib/bbn013
[34] W. S. J. Valdar, Scoring residue conservation, Proteins 48 (2) (2002) 227–241. doi:10.1002/prot.10146.
URL http://dx.doi.org/10.1002/prot.10146
[35] A. Rausell, D. Juan, F. Pazos, A. Valencia, Protein interactions and ligand binding: From protein
subfamilies to functional specificity, Proceedings of the National Academy of Sciences 107 (5) (2010)
1995–2000. doi:10.1073/pnas.0908044107.
URL http://dx.doi.org/10.1073/pnas.0908044107
[36] W. H. Kruskal, Historical notes on the wilcoxon unpaired two-sample test, Journal of the American
Statistical Association 52 (279) (1957) pp. 356–360.
URL http://www.jstor.org/stable/2280906
[37] R Core Team, R: A Language and Environment for Statistical Computing, R Foundation for Statistical
Computing, Vienna, Austria, ISBN 3-900051-07-0 (2012).
URL http://www.R-project.org
[38] S. Kerrien, B. Aranda, L. Breuza, A. Bridge, F. Broackes-Carter, C. Chen, M. Duesbury, M. Du-
mousseau, M. Feuermann, U. Hinz, C. Jandrasits, R. C. Jimenez, J. Khadake, U. Mahadevan, P. Mas-
son, I. Pedruzzi, E. Pfeiffenberger, P. Porras, A. Raghunath, B. Roechert, S. Orchard, H. Hermjakob,
The IntAct molecular interaction database in 2012., Nucleic acids research 40 (Database issue) (2012)
D841–D846. doi:10.1093/nar/gkr1088.
URL http://dx.doi.org/10.1093/nar/gkr1088
[39] L. Licata, L. Briganti, D. Peluso, L. Perfetto, M. Iannuccelli, E. Galeota, F. Sacco, A. Palma, A. P. P.
Nardozza, E. Santonico, L. Castagnoli, G. Cesareni, MINT, the molecular interaction database: 2012
31
update., Nucleic acids research 40 (Database issue) (2012) D857–D861. doi:10.1093/nar/gkr930.
URL http://dx.doi.org/10.1093/nar/gkr930
[40] C. Stark, B.-J. J. Breitkreutz, A. Chatr-Aryamontri, L. Boucher, R. Oughtred, M. S. Livstone, J. Nixon,
K. Van Auken, X. Wang, X. Shi, T. Reguly, J. M. Rust, A. Winter, K. Dolinski, M. Tyers, The BioGRID
interaction database: 2011 update., Nucleic acids research 39 (Database issue) (2011) D698–D704.
doi:10.1093/nar/gkq1116.
URL http://dx.doi.org/10.1093/nar/gkq1116
[41] I. Xenarios, L. Salwınski, X. J. J. Duan, P. Higney, S.-M. M. Kim, D. Eisenberg, DIP, the database
of interacting proteins: a research tool for studying cellular networks of protein interactions., Nucleic
acids research 30 (1) (2002) 303–305. doi:10.1093/nar/30.1.303.
URL http://dx.doi.org/10.1093/nar/30.1.303
[42] R. Goel, H. C. Harsha, A. Pandey, K. S. Prasad, Human protein reference database and human pro-
teinpedia as resources for phosphoproteome analysis., Molecular bioSystems 8 (2) (2012) 453–463.
doi:10.1039/c1mb05340j.
URL http://dx.doi.org/10.1039/c1mb05340j
[43] D. Croft, G. O’Kelly, G. Wu, R. Haw, M. Gillespie, L. Matthews, M. Caudy, P. Garapati, G. Gopinath,
B. Jassal, S. Jupe, I. Kalatskaya, S. Mahajan, B. May, N. Ndegwa, E. Schmidt, V. Shamovsky,
C. Yung, E. Birney, H. Hermjakob, P. D’Eustachio, L. Stein, Reactome: a database of reactions,
pathways and biological processes., Nucleic acids research 39 (Database issue) (2011) D691–D697.
doi:10.1093/nar/gkq1018.
URL http://dx.doi.org/10.1093/nar/gkq1018
[44] V. Navratil, B. de Chassey, L. Meyniel, S. Delmotte, C. Gautier, P. Andre, V. Lotteau, C. Rabourdin-
Combe, VirHostNet: a knowledge base for the management and the analysis of proteome-wide virushost
interaction networks, Nucleic Acids Research 37 (suppl 1) (2009) D661–D668. doi:10.1093/nar/gkn794.
URL http://dx.doi.org/10.1093/nar/gkn794
[45] P. Flicek, M. R. Amode, D. Barrell, K. Beal, S. Brent, D. Carvalho-Silva, P. Clapham, G. Coates, S. Fair-
ley, S. Fitzgerald, L. Gil, L. Gordon, M. Hendrix, T. Hourlier, N. Johnson, A. K. Kahari, D. Keefe,
S. Keenan, R. Kinsella, M. Komorowska, G. Koscielny, E. Kulesha, P. Larsson, I. Longden, W. McLaren,
M. Muffato, B. Overduin, M. Pignatelli, B. Pritchard, H. S. Riat, G. R. S. Ritchie, M. Ruffier, M. Schus-
ter, D. Sobral, Y. A. Tang, K. Taylor, S. Trevanion, J. Vandrovcova, S. White, M. Wilson, S. P. Wilder,
B. L. Aken, E. Birney, F. Cunningham, I. Dunham, R. Durbin, X. M. Fernandez-Suarez, J. Harrow,
J. Herrero, T. J. P. Hubbard, A. Parker, G. Proctor, G. Spudich, J. Vogel, A. Yates, A. Zadissa, S. M. J.
Searle, Ensembl 2012, Nucleic Acids Research 40 (D1) (2012) D84–D90. doi:10.1093/nar/gkr991.
URL http://dx.doi.org/10.1093/nar/gkr991
32
[46] B. H. Dessailly, R. Nair, L. Jaroszewski, J. E. Fajardo, A. Kouranov, D. Lee, A. Fiser, A. Godzik,
B. Rost, C. Orengo, PSI-2: structural genomics to cover protein domain family space., Structure (Lon-
don, England : 1993) 17 (6) (2009) 869–881. doi:10.1016/j.str.2009.03.015.
URL http://dx.doi.org/10.1016/j.str.2009.03.015
[47] S. Y. Cho, M. Chung, M. Park, S. Park, Y. S. Lee, ZIFIBI: Prediction of DNA binding sites for
zinc finger proteins, Biochemical and Biophysical Research Communications 369 (3) (2008) 845–848.
doi:10.1016/j.bbrc.2008.02.106.
URL http://dx.doi.org/10.1016/j.bbrc.2008.02.106
[48] D. Wilson, V. Charoensawan, S. K. Kummerfeld, S. A. Teichmann, DBDtaxonomically broad tran-
scription factor predictions: new content and functionality, Nucleic Acids Research 36 (suppl 1) (2008)
D88–D92. doi:10.1093/nar/gkm964.
URL http://dx.doi.org/10.1093/nar/gkm964
[49] G. D. Stormo, DNA binding sites: representation and discovery, Bioinformatics 16 (1) (2000) 16–23.
doi:10.1093/bioinformatics/16.1.16.
URL http://dx.doi.org/10.1093/bioinformatics/16.1.16
[50] Y. Litvak, Z. Selinger, Bacterial mimics of eukaryotic GTPase-activating proteins (GAPs)., Trends in
biochemical sciences 28 (12) (2003) 628–631. doi:10.1016/j.tibs.2003.10.001.
URL http://dx.doi.org/10.1016/j.tibs.2003.10.001
[51] S. Ojha, E. C. Meng, P. C. Babbitt, Evolution of Function in the ”Two Dinucleotide Binding Domains”
Flavoproteins, PLoS Comput Biol 3 (7) (2007) e121+. doi:10.1371/journal.pcbi.0030121.
URL http://dx.doi.org/10.1371/journal.pcbi.0030121
[52] M. Bashton, C. Chothia, The geometry of domain combination in proteins., Journal of molecular biology
315 (4) (2002) 927–939. doi:10.1006/jmbi.2001.5288.
URL http://dx.doi.org/10.1006/jmbi.2001.5288
[53] M. A. Turner, C.-S. Yuan, R. T. Borchardt, M. S. Hershfield, G. D. Smith, P. L. Howell, Structure
determination of selenomethionyl S-adenosylhomocysteine hydrolase using data at a single wavelength,
Nature Structural & Molecular Biology 5 (5) (1998) 369–376. doi:10.1038/nsb0598-369.
URL http://dx.doi.org/10.1038/nsb0598-369
[54] A. Reid, J. Ranea, C. Orengo, Comparative evolutionary analysis of protein complexes in E. coli and
yeast, BMC Genomics 11 (1) (2010) 79+. doi:10.1186/1471-2164-11-79.
URL http://dx.doi.org/10.1186/1471-2164-11-79
[55] R. A. Laskowski, N. M. Luscombe, M. B. Swindells, J. M. Thornton, Protein clefts in molecular recog-
nition and function, Protein Sci 5 (1996) 2438–2452.
33
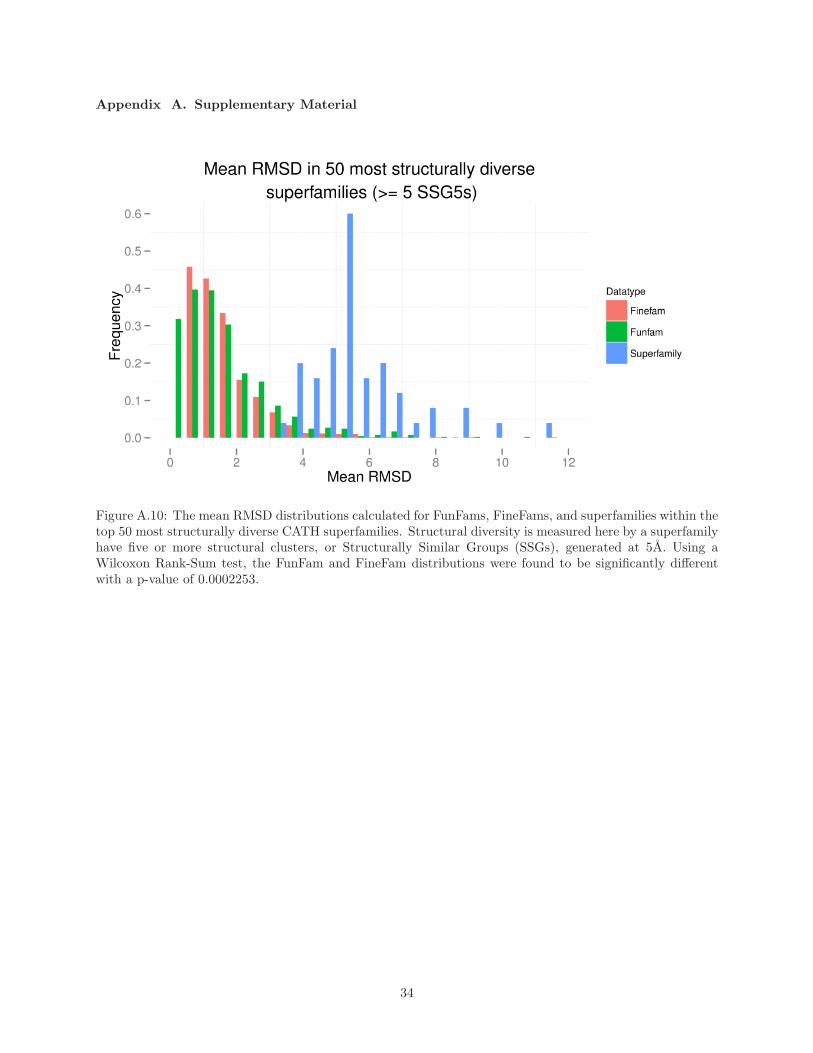
Appendix A. Supplementary Material
Figure A.10: The mean RMSD distributions calculated for FunFams, FineFams, and superfamilies within thetop 50 most structurally diverse CATH superfamilies. Structural diversity is measured here by a superfamilyhave five or more structural clusters, or Structurally Similar Groups (SSGs), generated at 5A. Using aWilcoxon Rank-Sum test, the FunFam and FineFam distributions were found to be significantly differentwith a p-value of 0.0002253.
34

Figure A.11: Two very diverse relatives (sequence identity 6%, RMSD 14A) from the highly structurallydiverse HUPs superfamily (3.40.50.620). The conserved core can be clearly seen upon superposing the twodomains, 1ej2A00 (light blue) and 1n3lA01 (red).
35
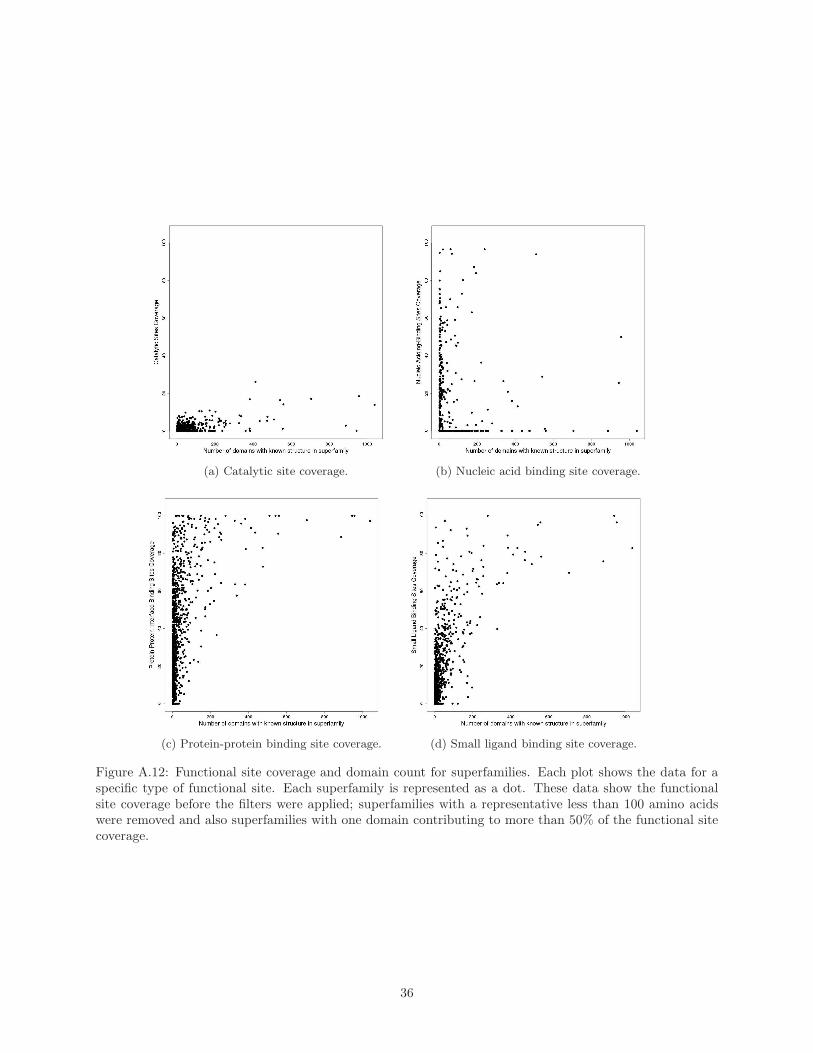
(a) Catalytic site coverage. (b) Nucleic acid binding site coverage.
(c) Protein-protein binding site coverage. (d) Small ligand binding site coverage.
Figure A.12: Functional site coverage and domain count for superfamilies. Each plot shows the data for aspecific type of functional site. Each superfamily is represented as a dot. These data show the functionalsite coverage before the filters were applied; superfamilies with a representative less than 100 amino acidswere removed and also superfamilies with one domain contributing to more than 50% of the functional sitecoverage.
36
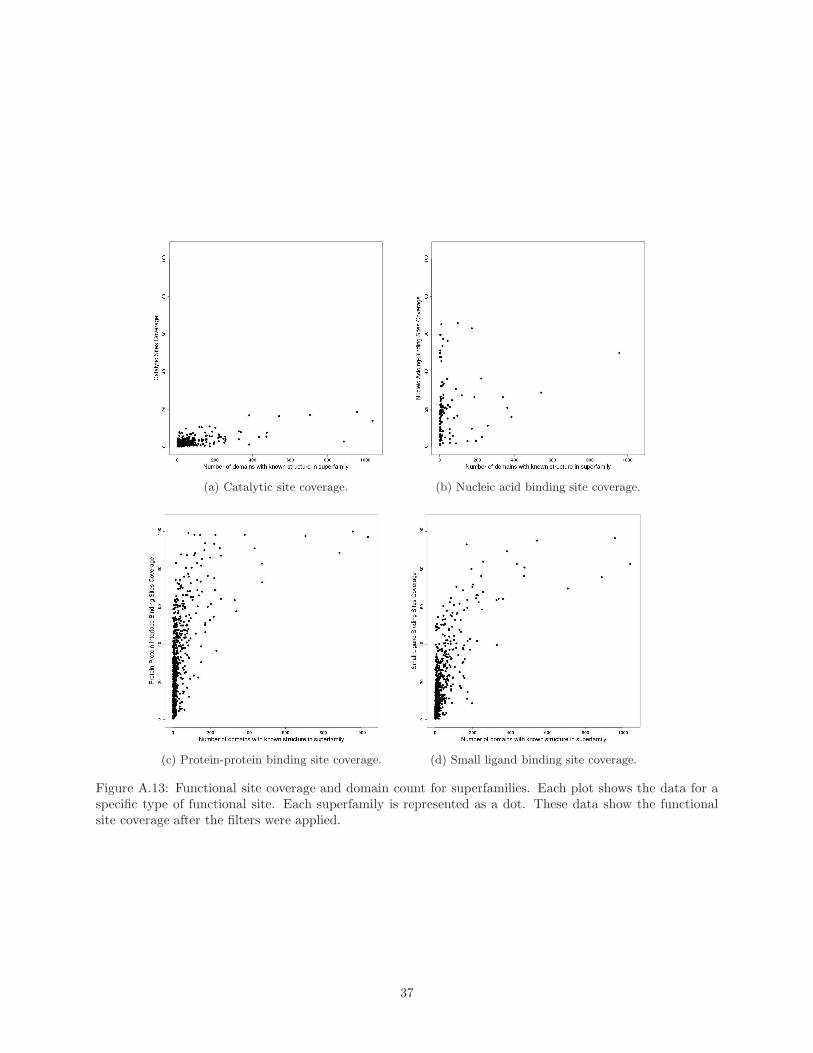
(a) Catalytic site coverage. (b) Nucleic acid binding site coverage.
(c) Protein-protein binding site coverage. (d) Small ligand binding site coverage.
Figure A.13: Functional site coverage and domain count for superfamilies. Each plot shows the data for aspecific type of functional site. Each superfamily is represented as a dot. These data show the functionalsite coverage after the filters were applied.
37

(a) Catalytic Sites (b) Small Ligand Binding Sites
(c) Nucleic Acid Binding Sites (d) Protein-Protein Binding Sites
Figure A.14: Functional site coverage, superfamily abundance and domain sequence abundance within su-perfamilies. On the X-axis, functional site coverage (defined in Figure 2) has been binned in one percentagebins, i.e 0-1%, 1-2%, 2-3% and so on. The number of superfamilies on the upper Y-axis is measured asthe number of superfamilies with a functional site coverage that falls within a given bin. The number ofdomains in the superfamilies on the lower Y-axis is measured as the number of domain sequences within thesuperfamilies measured on the upper Y-axis.
38
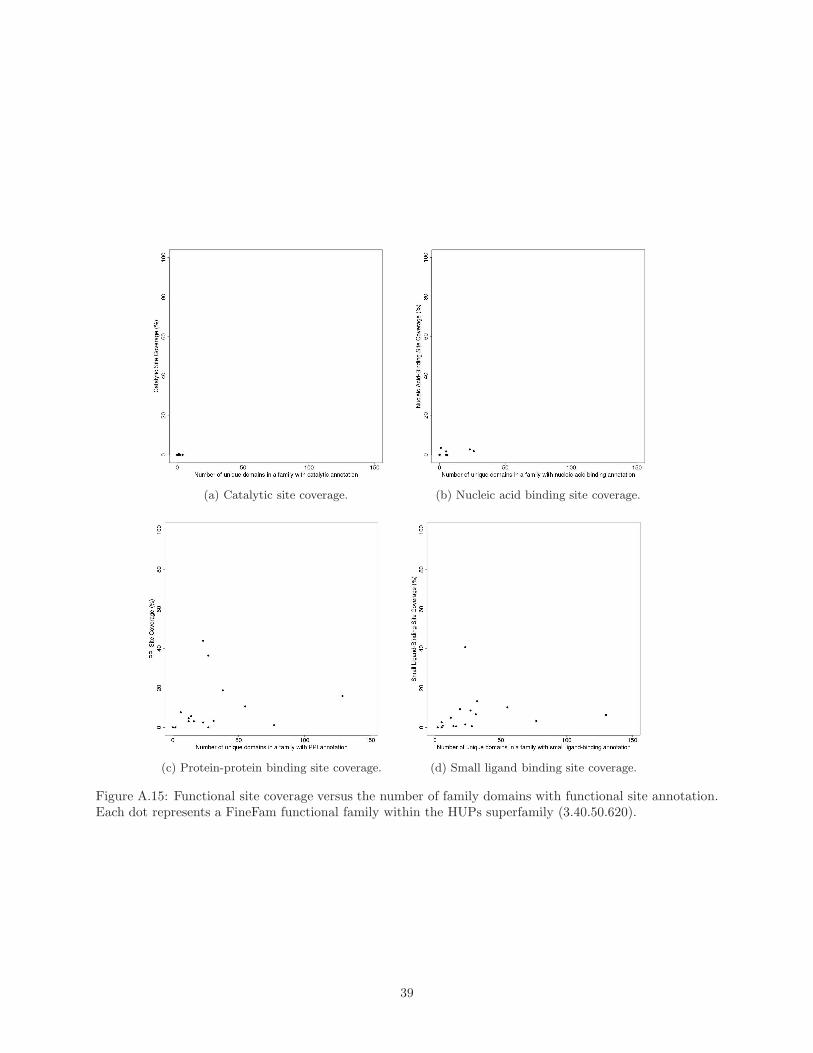
(a) Catalytic site coverage. (b) Nucleic acid binding site coverage.
(c) Protein-protein binding site coverage. (d) Small ligand binding site coverage.
Figure A.15: Functional site coverage versus the number of family domains with functional site annotation.Each dot represents a FineFam functional family within the HUPs superfamily (3.40.50.620).
39

(a) Catalytic site coverage.
(b) Nucleic acid binding site coverage.
(c) Protein-protein binding site coverage.
(d) Small ligand binding site coverage.
Figure A.16: Functional site coverage versus superfamily diversity, measured by the number of FineFamfunctional families. Each box-plot represents pooled data for those superfamilies with a given number ofFineFam functional families. The bottom of a box represents the lower (first) quartile, or 25% of the datapoints. The line inside the box represents the median, or the second quartile, containing 50% of the datapoints. The top of the box represents the upper (third) quartile, or 75% of the data points. The upperwhisker extends from the upper quartile to the highest data point that is within 1.5 x inter-quartile rangeof the upper quartile.
40
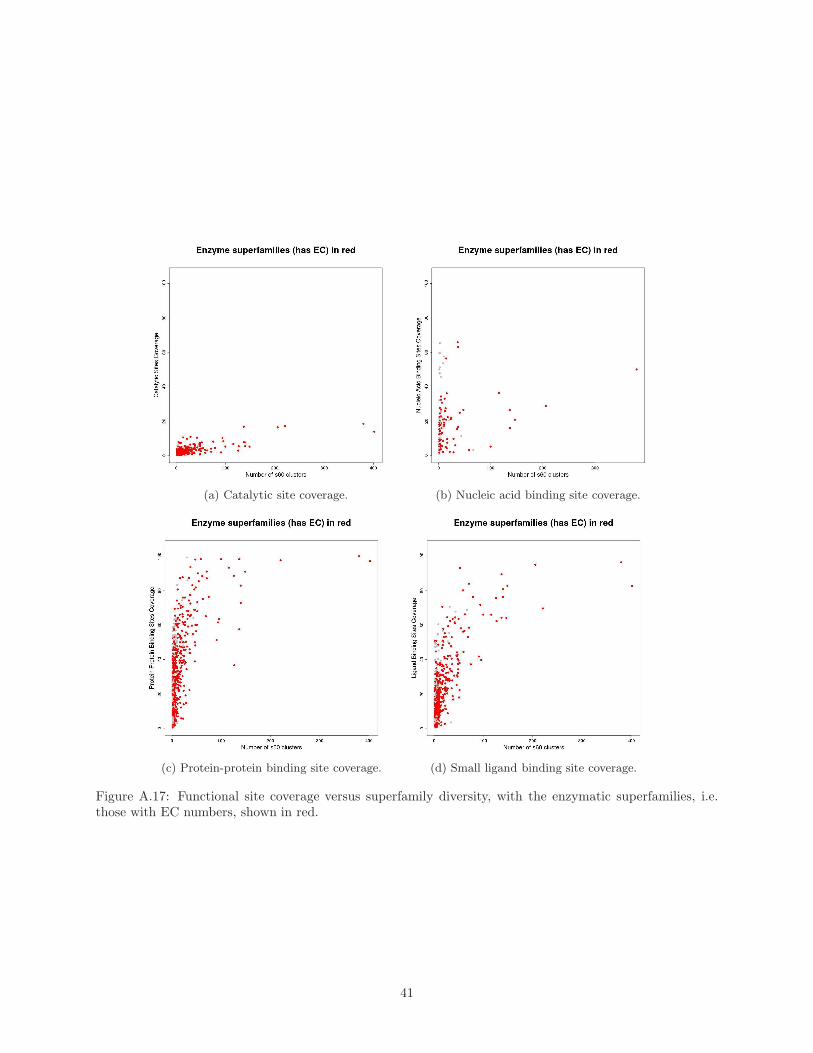
(a) Catalytic site coverage. (b) Nucleic acid binding site coverage.
(c) Protein-protein binding site coverage. (d) Small ligand binding site coverage.
Figure A.17: Functional site coverage versus superfamily diversity, with the enzymatic superfamilies, i.e.those with EC numbers, shown in red.
41
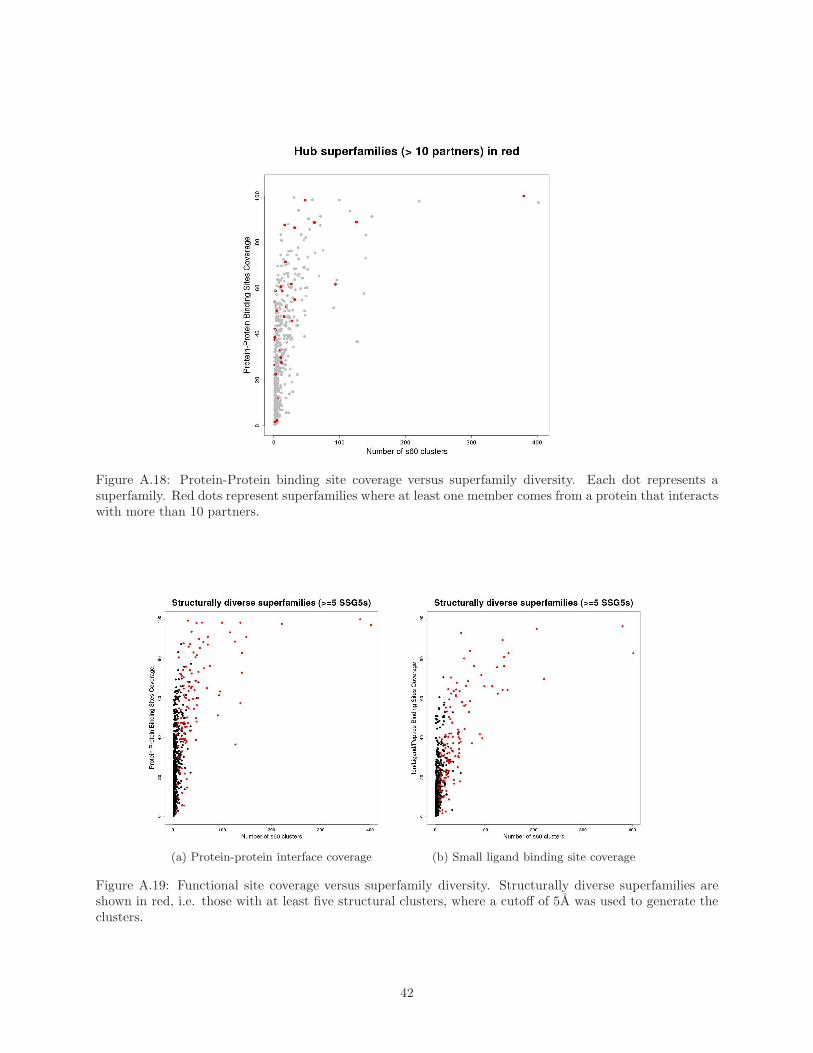
Figure A.18: Protein-Protein binding site coverage versus superfamily diversity. Each dot represents asuperfamily. Red dots represent superfamilies where at least one member comes from a protein that interactswith more than 10 partners.
(a) Protein-protein interface coverage (b) Small ligand binding site coverage
Figure A.19: Functional site coverage versus superfamily diversity. Structurally diverse superfamilies areshown in red, i.e. those with at least five structural clusters, where a cutoff of 5A was used to generate theclusters.
42
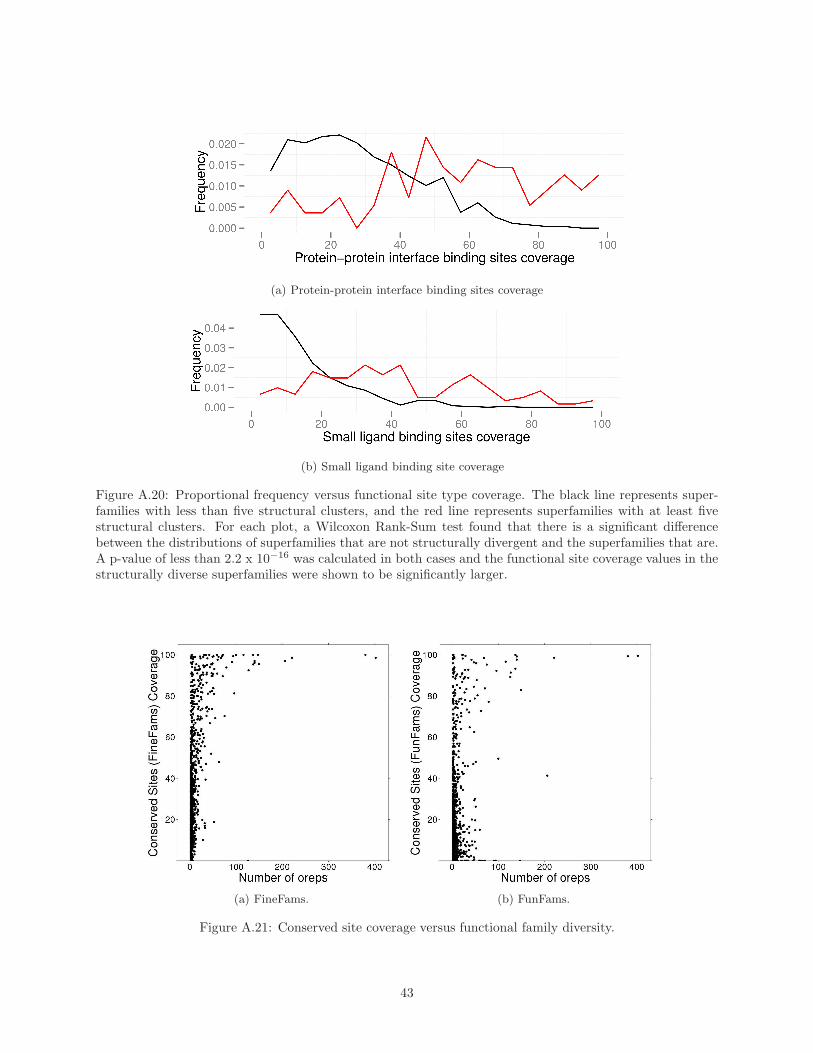
(a) Protein-protein interface binding sites coverage
(b) Small ligand binding site coverage
Figure A.20: Proportional frequency versus functional site type coverage. The black line represents super-families with less than five structural clusters, and the red line represents superfamilies with at least fivestructural clusters. For each plot, a Wilcoxon Rank-Sum test found that there is a significant differencebetween the distributions of superfamilies that are not structurally divergent and the superfamilies that are.A p-value of less than 2.2 x 10⁻¹⁶ was calculated in both cases and the functional site coverage values in thestructurally diverse superfamilies were shown to be significantly larger.
(a) FineFams. (b) FunFams.
Figure A.21: Conserved site coverage versus functional family diversity.
43
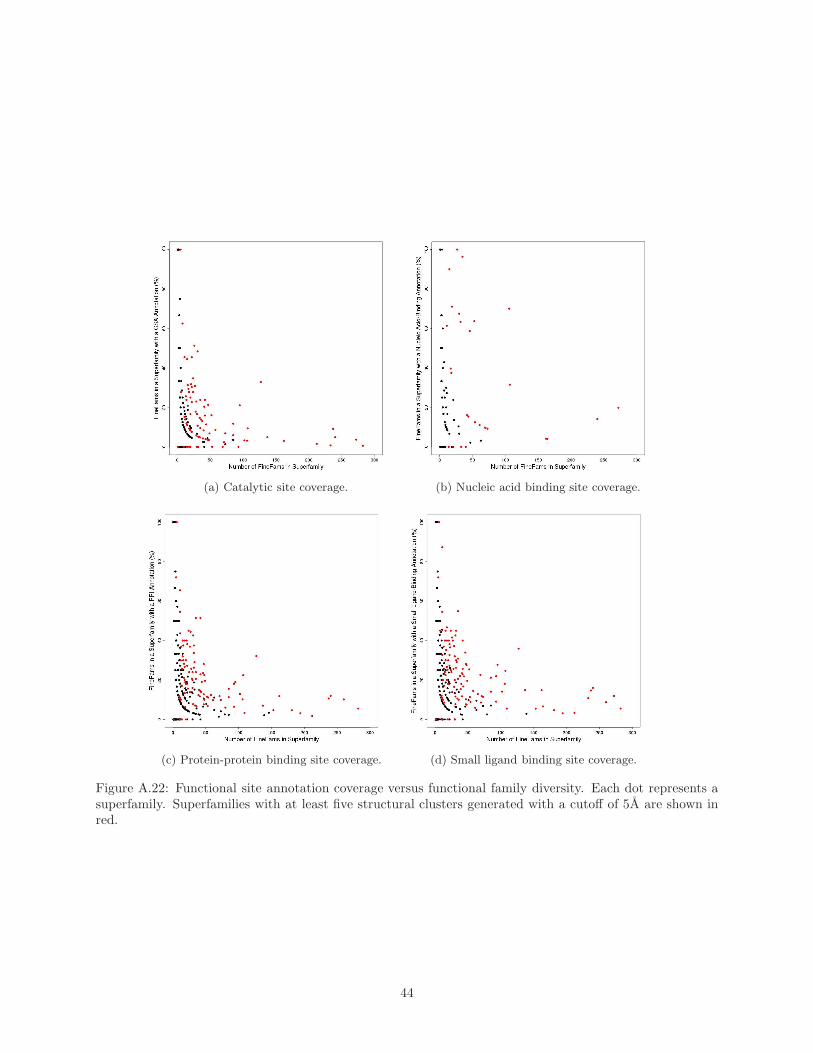
(a) Catalytic site coverage. (b) Nucleic acid binding site coverage.
(c) Protein-protein binding site coverage. (d) Small ligand binding site coverage.
Figure A.22: Functional site annotation coverage versus functional family diversity. Each dot represents asuperfamily. Superfamilies with at least five structural clusters generated with a cutoff of 5A are shown inred.
44