genetic architecture, genecology and phenotypic plasticity in ...
184
GENETIC ARCHITECTURE, GENECOLOGY AND PHENOTYPIC PLASTICITY IN SEED AND SEEDLING TRAITS OF YELLOW-CEDAR (Chamaecyparis nootkatensis (D.Don) Spach) by JOHN HULBERT RUSSELL B.Sc.F., The University of Toronto, 1980 M.Sc., The University of California at Berkeley, 1984 A THESIS SUBMITTED IN PARTIAL FULFILMENT OF THE REQUIREMENTS FOR THE DEGREE OF DOCTOR OF PHILOSOPHY in THE FACULTY OF GRADUATE STUDIES Department of Forest Sciences We accept this thesis as conforming to the required standard THE UNIVERSITY OF BRITISH COLUMBIA February 1993 © John Hulbert Russell, 1993
-
Upload
khangminh22 -
Category
Documents
-
view
3 -
download
0
Transcript of genetic architecture, genecology and phenotypic plasticity in ...
GENETIC ARCHITECTURE, GENECOLOGY AND PHENOTYPIC PLASTICITY IN SEED ANDSEEDLING TRAITS OF YELLOW-CEDAR
(Chamaecyparis nootkatensis (D.Don) Spach)
by
JOHN HULBERT RUSSELL
B.Sc.F., The University of Toronto, 1980M.Sc., The University of California at Berkeley, 1984
A THESIS SUBMITTED IN PARTIAL FULFILMENT OF
THE REQUIREMENTS FOR THE DEGREE OF
DOCTOR OF PHILOSOPHY
in
THE FACULTY OF GRADUATE STUDIES
Department of Forest Sciences
We accept this thesis as conforming
to the required standard
THE UNIVERSITY OF BRITISH COLUMBIA
February 1993
© John Hulbert Russell, 1993

In presenting this thesis in partial fulfilment of the requirements for an advanced
degree at the University of British Columbia, I agree that the Library shall make it
freely available for reference and study. I further agree that permission for extensive
copying of this thesis for scholarly purposes may be granted by the head of my
department or by his or her representatives. It is understood that copying or
publication of this thesis for financial gain shall not be allowed without my written
permission.
(Signature)
Department of ^Forest Sciences
The University of British ColumbiaVancouver, Canada
Date ^04/07/93
DE-6 (2/88)

ABSTRACT
The overall objective of the thesis was to estimate the amount and
distribution of genetic and environmental variation, and correlations between
genetic variability and seed source origin, of yellow-cedar (Chamaecyparis
nootkatensis (D. Don) Spach). Variation was measured for traits of seed, and
for morphological and physiological traits of seedlings grown in a common
garden, and in differing greenhouse environments. The study focused on
traits that sampled the developmental sequence of events that influence a
population's adaptation to its environment. These included growth rate,
phenology, drought resistance, cold acclimation, and dormancy.
Significant variability was evident at both the population and family
within population level in most traits measured. Substantially more genetic
variability (2 to 16 times) was found at the family within population level
as opposed to the population level in all but two traits. Narrow-sense
heritabilities varied from 0.16 for growth during third-year shoot initiation
to 0.64 for first-year height in the nurserybed.
There was little evidence of adaptive variation for seed and
germination traits: however, growth traits and cold-hardiness were moderately
to strongly correlated with latitude and elevation of seed origin. Seedlings
from more southerly and high elevation populations were taller, had greater
diameter, grew later into the growing season, and were more susceptible to
cold injury during acclimation and at maximum hardiness, than more northern
populations. The above trends were not apparent if southern populations
(Oregon) were excluded.
Environments had a large effect on growth and morphology of yellow-
cedar. Shoot elongation was extremely plastic, responding to both decreased
photoperiod and water-stress through decreased shoot growth. Upon release of
the stress treatments, growth increased to relative rates greater than the
non-stressed trees. In all growth and morphology traits, there was minimal
evidence for significant genotype by environment interactions at either the
population or family within population level, with both photoperiod
treatments and water regimes.
Genetic variation in gas exchange, water relation parameters, and
morphological traits, in response to a drought, was evident with 2-year-old
yellow-cedar seedlings among and within populations. Seedlings from
Coquihalla, a xeric habitat, had less shoot and lateral branch extension, and
less biomass allocated to branches and more to roots, as compared to mesic
sources, under both well-watered and drought conditions. As well, these
seedlings maintained greater rates of net photosynthesis and higher levels of
stomatal conductance under both well-watered and droughty conditions.
Yellow-cedar populations at the extremes of environment for the
species, i.e. southern and continental populations, have responded to
environmental selection pressures by changes in gene frequencies. The
changes most likely have been aided by reduced gene flow due to spatial
isolation and poor sexual reproduction (Russell et al. 1990). At the same
time, however, the species has maintained a substantial amount of both
genetic variation and phenotypic plasticity within populations. Yellow-cedar
seems to have evolved an intermediate mode of adaptation with less genetic
differentiation associated with geography than Douglas-fir, Sitka spruce, and
western hemlock, but more genetic differentiation than western white pine and
western redcedar.
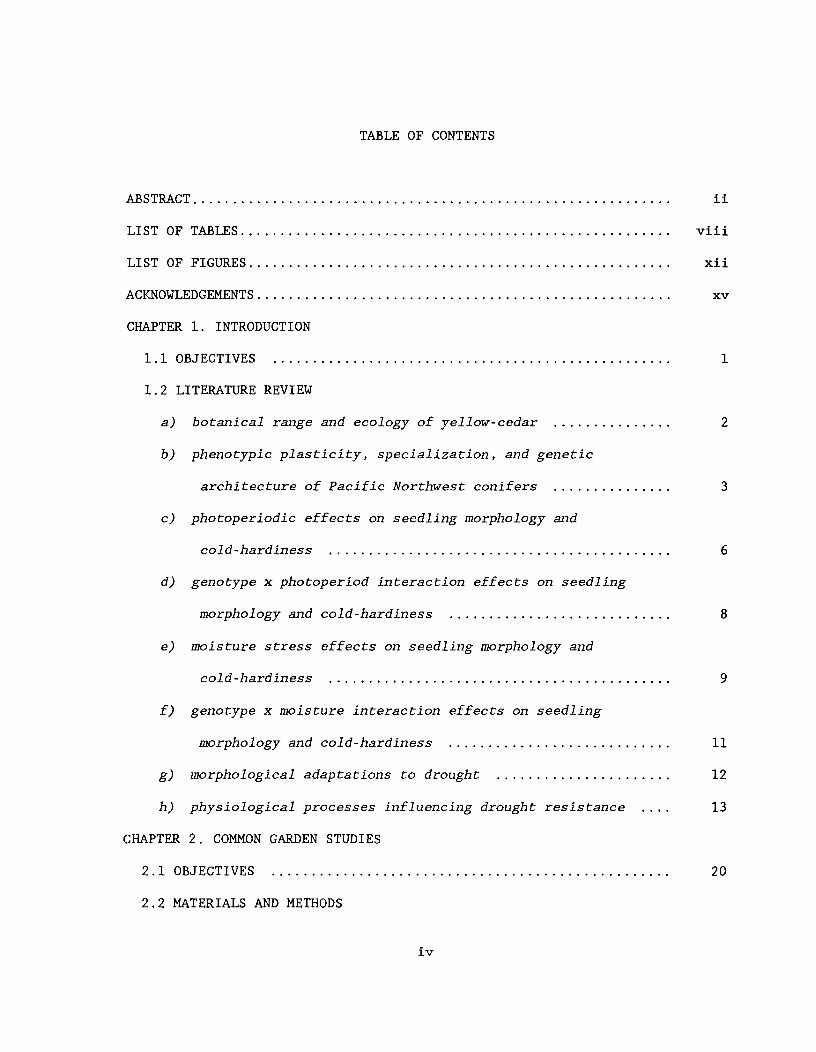
TABLE OF CONTENTS
ABSTRACT^
LIST OF TABLES^ viii
LIST OF FIGURES ^xii
ACKNOWLEDGEMENTS ^xv
CHAPTER 1. INTRODUCTION
1.1 OBJECTIVES ^1
1.2 LITERATURE REVIEW
a) botanical range and ecology of yellow-cedar ^2
b) phenotypic plasticity, specialization, and genetic
architecture of Pacific Northwest conifers ^3
c) photoperiodic effects on seedling morphology and
cold-hardiness ^6
d) genotype x photoperiod interaction effects on seedling
morphology and cold-hardiness ^8
e) moisture stress effects on seedling morphology and
cold-hardiness ^9
f) genotype x moisture interaction effects on seedling
morphology and cold-hardiness ^11
g) morphological adaptations to drought ^12
h) physiological processes influencing drought resistance .^13
CHAPTER 2. COMMON GARDEN STUDIES
2.1 OBJECTIVES ^20
2.2 MATERIALS AND METHODS
iv
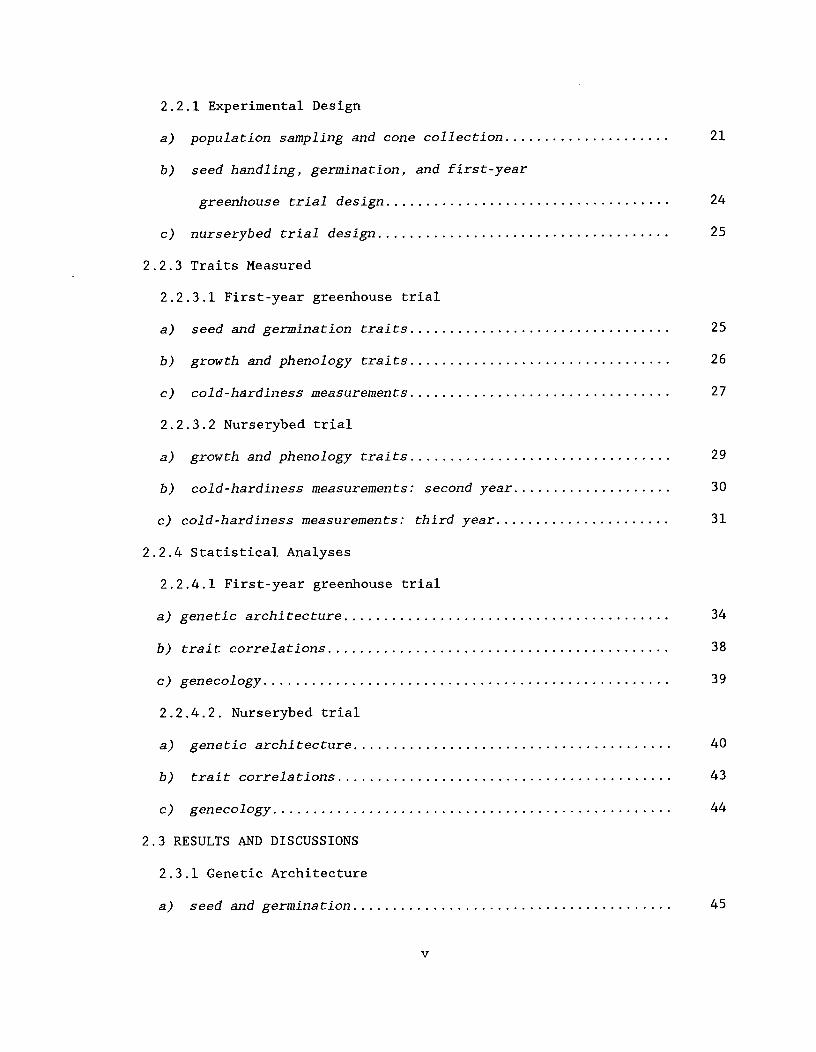
2.2.1 Experimental Design
a) population sampling and cone collection ^21
b) seed handling, germination, and first-year
greenhouse trial design ^24
c) nurserybed trial design ^25
2.2.3 Traits Measured
2.2.3.1 First-year greenhouse trial
a) seed and germination traits ^25
b) growth and phenology traits ^26
c) cold-hardiness measurements ^27
2.2.3.2 Nurserybed trial
a) growth and phenology traits ^29
b) cold-hardiness measurements: second year ^30
c) cold-hardiness measurements: third year ^31
2.2.4 Statistical Analyses
2.2.4.1 First-year greenhouse trial
a) genetic architecture ^34
b) trait correlations ^38
c) genecology ^39
2.2.4.2. Nurserybed trial
a) genetic architecture ^40
b) trait correlations ^43
c) genecology ^44
2.3 RESULTS AND DISCUSSIONS
2.3.1 Genetic Architecture
a) seed and germination ^45

b) growth and phenology ^46
c) cold-hardiness ^54
2.3.2 Trait Correlations
a) first-year greenhouse trial ^59
b) nurserybed trial ^64
2.3.3 Genecology
a) seed and germination ^67
b) growth and phenology ^67
c) multivariate analyses ^73
2.4 SUMMARY ^77
CHAPTER 3. GREENHOUSE ENVIRONMENT STUDY
3.1 OBJECTIVES ^79
3.2 MATERIALS AND METHODS
3.2.1 Experimental Design ^80
3.2.2 Traits Measured
a) morphological traits ^84
b) cold-hardiness measurements ^84
c) gas exchange and water potential measurements ^86
d) water relation measurements ^88
3.2.3 Statistical Analyses
3.2.3.1 Morphological traits
a) anova models ^89
b) analyses of covariance for dry matter partitioning ^94
c) nonparametric stability measurements ^96
d) correlations of morphology with geographic descriptors ^97
3.2.3.2 Cold-hardiness measurements ^97
vi
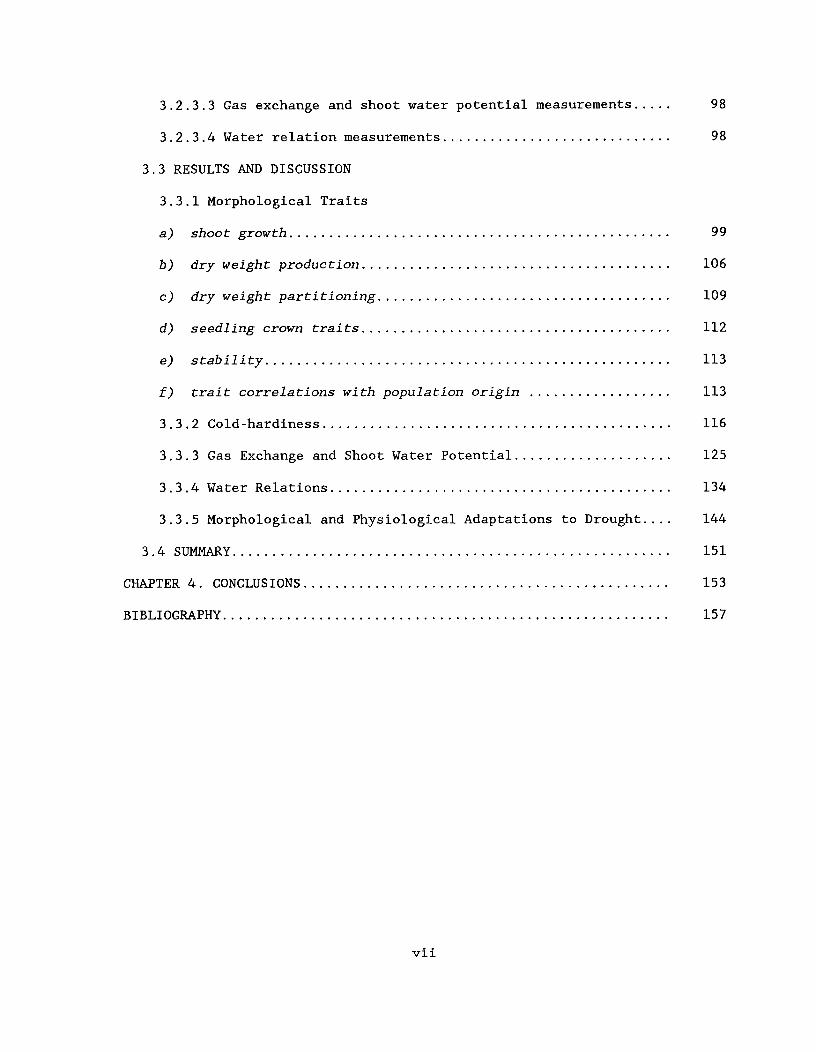
3.2.3.3 Gas exchange and shoot water potential measurements ^98
3.2.3.4 Water relation measurements ^98
3.3 RESULTS AND DISCUSSION
3.3.1 Morphological Traits
a) shoot growth ^99
b) dry weight production ^106
c) dry weight partitioning ^109
d) seedling crown traits ^112
e) stability ^113
f) trait correlations with population origin ^113
3.3.2 Cold-hardiness ^116
3.3.3 Gas Exchange and Shoot Water Potential ^125
3.3.4 Water Relations ^134
3.3.5 Morphological and Physiological Adaptations to Drought ^144
3.4 SUMMARY ^151
CHAPTER 4. CONCLUSIONS ^153
BIBLIOGRAPHY ^157
vi i

LIST OF TABLES
Table 1: Geographic location of yellow-cedar populations ^ 22
Table 2: Description of measured and derived traits used in theyellow-cedar genetic architecture and genecology study (symbolsused to describe trait in text in parenthesis)
^32
Table 3: ANOVA model for yellow-cedar seed and germinationtraits, and first-year greenhouse trial growth andphenology traits ^ 36
Table 4: ANOVA model for yellow-cedar first-year cold-hardinessstudy ^ 38
Table 5: ANOVA model for yellow-cedar nurserybed trial growthand phenology traits ^ 41
Table 6: ANOVA model for second-year nurserybed cold-hardinessstudy ^ 44
Table 7: Descriptive statistics for yellow-cedar seed, germinationand first-year greenhouse trial growth and phenology ^ 47
Table 8: Variance components (% of total), statistical significanceof differences among means, heritabilities (h2„5) and standarderrors of heritability (s.e.) for yellow-cedar first-yeargreenhouse trial germination, growth and phenology traits^. 48
Table 9: Descriptive statistics for yellow-cedar nurserybed trialseedling growth, phenology, and cold-hardiness traits^.^. 50
Table 10: Variance components (% of total), statistical significanceof differences among means, heritabilities (h2„5) and standarderrors of heritability (s.e.) for yellow-cedar nurserybed trialgrowth, phenology, and cold-hardiness trait
Table 11: Mean squares and significance levels for index of injuryof one-year-old yellow-cedar tested five times over the coldacclimation period ^
Table 12: LT50 values for one-year-old yellow-cedar from 10populations for five test dates over the cold acclimationperiod, and associated number of accumulated degree-hoursbelow 5° C and 0° C at Cowichan Lake Research Station ^
Table 13: Mean squares, variance components (% of total),statistical significance of differences among means,heritabilities (h2n5) and standard errors of heritability(s.e.) for index of injury of yellow-cedar 2-year-oldseedlings to cold, for two test dates
52
55
57
58
viii

Table 14: Simple linear correlation coefficients (r) for familymeans within population (below diagonal) and population means(above diagonal) for yellow-cedar seed and germination traits,and geographic descriptors of seed origin
Table 15: Simple linear correlation coefficients (r) for familymeans within population (below diagonal) and population means(above diagonal) for yellow-cedar germination and first-yeargreenhouse trial growth traits, and geographic descriptors ofseed origin
Table 16: Simple linear correlation coefficients (r) for family meanswithin population (P<.01) (below diagonal) and population means(P<.05) (above diagonal) for yellow-cedar nurserybed trialseedling growth, phenology, and cold-hardiness traits
Table 17: Simple linear correlation coefficients (r) for sixvariables in two models relating growth, phenology, and cold-hardiness of yellow-cedar to geographic variables of seedorigin (significance level in brackets) from nurserybedtrial^
68
Table 18: Factor loadings and eigenvalues of principalcomponents, percentage of variation accounted for by theprincipal components, and multiple regression equations forfactor scores of the first two principal components forrelating seedling germination and first-year greenhousetrial growth and phenology traits of yellow-cedar togeographic variables of seed origin^ 74
Table 19: Factor loadings and eigenvalues of principalcomponents and percentage of variation accounted forby the principal components for two models relatingyellow-cedar seedling growth, phenology and cold-hardinessfrom the nurserybed trial, to geographic variables ofseed origin
^75
Table 20: Multiple regression equations for two modelsrelating factor scores from the first two principalcomponents for yellow-cedar growth, phenology andcold-hardiness from the nurserybed trial, to geographicvariables of seed origin ^ 76
Table 21: Geographic location of yellow-cedar populationsused in the greenhouse environment study ^ 81
Table 22: Photoperiod schedule (hours of daylight) for yellow-cedargreenhouse environment study ^ 83
Table 23: Populations used for yellow-cedar gas exchange andwater relations drought study, and mean annual precipitationdata for the closest weather station
^87
59
60
65
ix

Table 24: Description of measured and derived traits used in thegreenhouse environment study for yellow-cedar (symbols used todescribe trait in text in parenthesis)
^90
Table 25: ANOVA model for yellow-cedar greenhouse environmentstudy: height, height growth, and diameter. a. Model 1:population structure only; b. Model 2: population and family(population)
^92
Table 26: ANOVA model for yellow-cedar greenhouse environmentstudy: dry weights and morphological traits. a. Model 1:population structure only; b. Model 2: population and family(population)
^93
Table 27: Least-square means (standard error) for shoot growthand morphology traits of yellow-cedar measured in thegreenhouse study during and after the second growing season,by environments ^ 100
Table 28: Mean squares for yellow-cedar growth traits from thegreenhouse environment study. a. Model 1: population structureonly; b. Model 2: population and family (population) ^ 101
Table 29: Mean squares for yellow-cedar dry-weight and branchingtraits from the greenhouse environment study. a. Model 1:population structure only; b. Model 2: population and family(population) ^ 107
Table 30: Mean squares from analysis of covariance for yellow-cedardry weight traits from the greenhouse environment study, byenvironment ^ 110
Table 31: Chi-squared tests for rank stability statistics of 18populations and 27 families of yellow-cedar grown over fourenvironments for shoot growth and morphological traits 114
Table 32: Simple linear coefficients for growth and morphologytraits based on population mean and geographic descriptorsof seed origin for 2-year-old yellow-cedar grown under fourenvironments (n=17) 115
Table 33: ANOVA model and mean squares for cold-hardiness testing(index of injury) of 2-year-old yellow-cedar seedlings fromthe greenhouse environment study ^ 117
Table 34: Regression model equations for index of injury and testtemperature, and LT50 values for yellow-cedar populations fromthe greenhouse environment study, by environment 118
Table 35: Regression equations for gas exchange and shootwater potential data for yellow-cedar populations 130
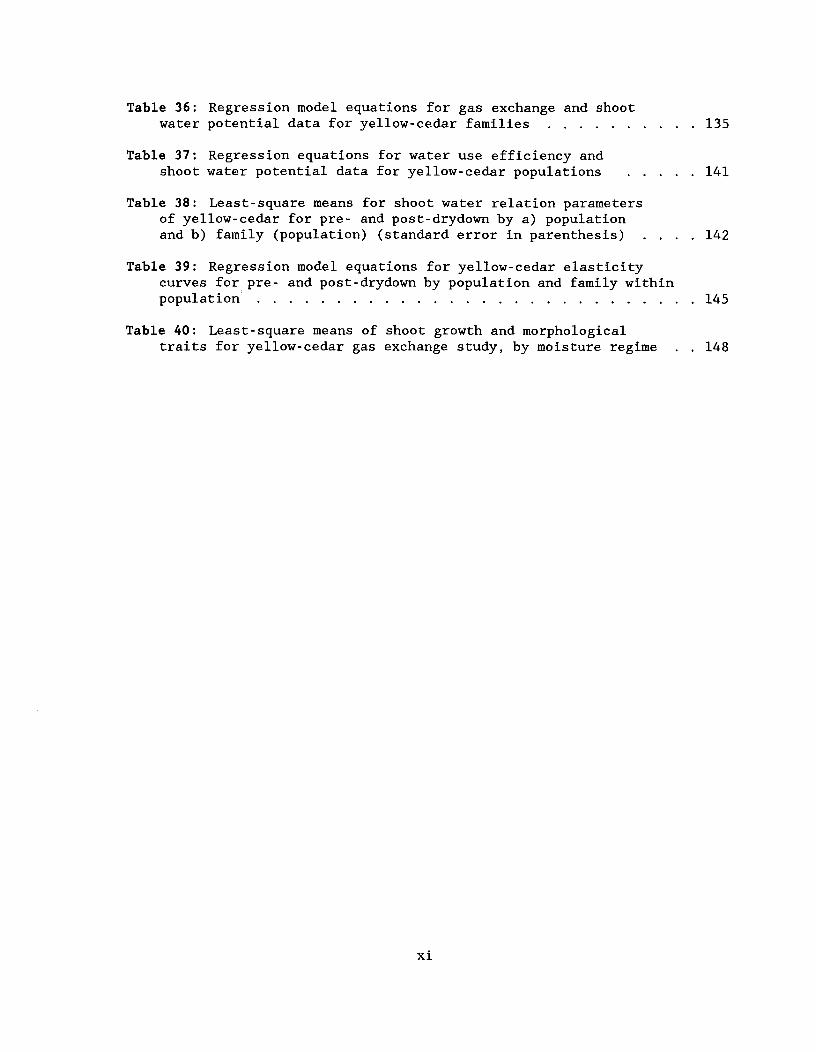
Table 36: Regression model equations for gas exchange and shootwater potential data for yellow-cedar families ^ 135
Table 37: Regression equations for water use efficiency andshoot water potential data for yellow-cedar populations 141
Table 38: Least-square means for shoot water relation parametersof yellow-cedar for pre- and post-drydown by a) populationand b) family (population) (standard error in parenthesis) .^. . 142
Table 39: Regression model equations for yellow-cedar elasticitycurves for pre- and post-drydown by population and family withinpopulation ^ 145
Table 40: Least-square means of shoot growth and morphologicaltraits for yellow-cedar gas exchange study, by moisture regime . . 148
xi

LIST OF FIGURES
Figure 1: Germination curves based on total viable seed forfive yellow-cedar open-pollinated families ^ 49
Figure 2: Relationship between LT50 and accumulated hoursbelow 5°C for five cold-hardiness testing dates during theacclimation period for six populations of 1-year-old yellow-cedar seedlings 56
Figure 3: First-year seedling growth curves for five yellow-cedaropen-pollinated families ^ 63
Figure 4: Relationship between second-year root collar diameterand latitude of seed source origin for 33 populations ofyellow-cedar grown in a common-garden trial ^ 69
Figure 5: Pattern of height growth cessation for four yellow-cedarpopulations after the third-growing season in acommon-garden trial^
71
Figure 6: Average predawn shoot water potential for 2-year-oldyellow-cedar seedlings during a 6-week drydown (+/- s.e.)^. 85
Figure 7: Average periodic relative growth rate over a 24-weekperiod for yellow-cedar during their second year grown in fourenvironments ^ 103
Figure 8: Index of injury predicted response to temperaturefrom regression analysis and relative growth rate for a6-week period prior to cold-hardiness testing for 2-year-oldyellow-cedar seedlings grown under four environments. Differentletters between environments for the growth data denotessignificance at p<.05 according to Duncan's New MultipleRange Test ^ 119
Figure 9: Index of injury predicted response to temperature fromregression analysis and relative growth rate for a six-weekperiod prior to cold-hardiness testing for 2-year-old yellow-cedar seedlings from Kwatna Inlet grown under four environments.Different letters between environments for the growth datadenotes significance at p<.05 according to Duncan's New MultipleRange Test ^ 120
Figure 10: Index of injury predicted response to temperaturefrom regression analysis and relative growth rate for a 6-weekperiod prior to cold-hardiness testing for 2-year-old yellow-cedarseedlings from Holberg grown under four environments. Differentletters between environments for the growth data denotessignificance at p<.05 according to Duncan's New MultipleRange Test ^ 121
xii
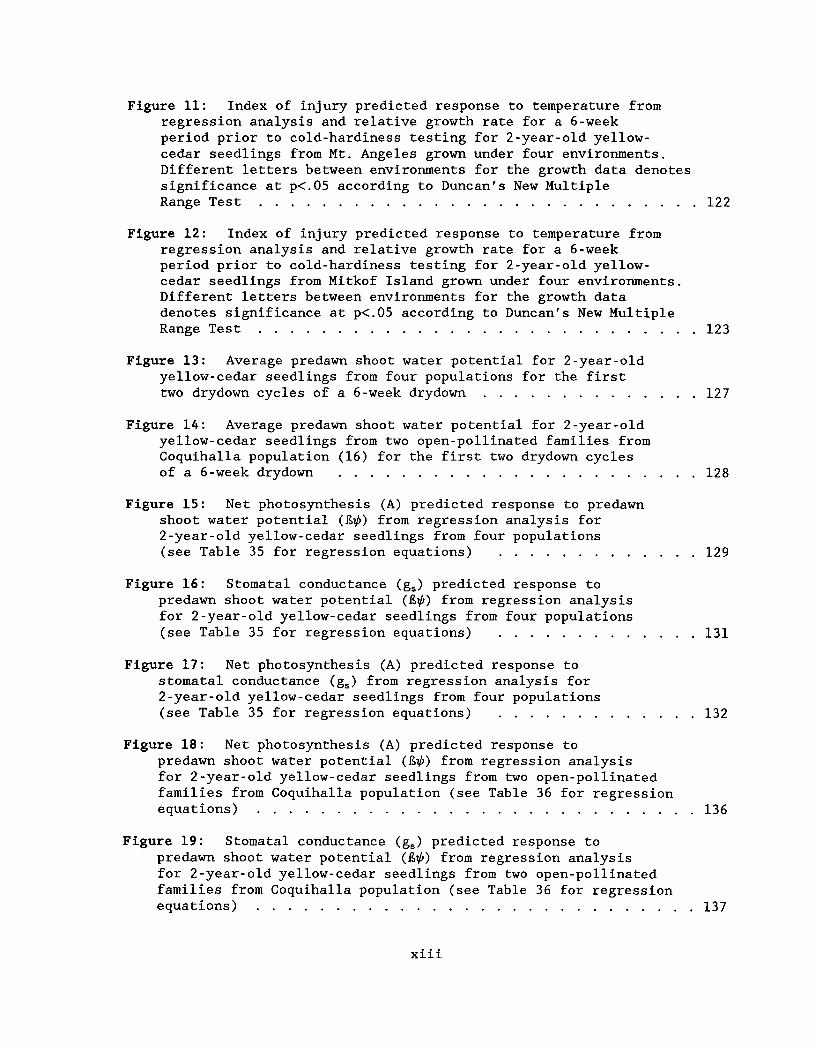
Figure 11: Index of injury predicted response to temperature fromregression analysis and relative growth rate for a 6-weekperiod prior to cold-hardiness testing for 2-year-old yellow-cedar seedlings from Mt. Angeles grown under four environments.Different letters between environments for the growth data denotessignificance at p<.05 according to Duncan's New MultipleRange Test ^ 122
Figure 12: Index of injury predicted response to temperature fromregression analysis and relative growth rate for a 6-weekperiod prior to cold-hardiness testing for 2-year-old yellow-cedar seedlings from Mitkof Island grown under four environments.Different letters between environments for the growth datadenotes significance at p<.05 according to Duncan's New MultipleRange Test ^ 123
Figure 13: Average predawn shoot water potential for 2-year-oldyellow-cedar seedlings from four populations for the firsttwo drydown cycles of a 6-week drydown ^ 127
Figure 14: Average predawn shoot water potential for 2-year-oldyellow-cedar seedlings from two open-pollinated families fromCoquihalla population (16) for the first two drydown cyclesof a 6-week drydown ^ 128
Figure 15: Net photosynthesis (A) predicted response to predawnshoot water potential (80) from regression analysis for2-year-old yellow-cedar seedlings from four populations(see Table 35 for regression equations) 129
Figure 16: Stomatal conductance (gs) predicted response topredawn shoot water potential (80) from regression analysisfor 2-year-old yellow-cedar seedlings from four populations(see Table 35 for regression equations) 131
Figure 17: Net photosynthesis (A) predicted response tostomatal conductance (g.) from regression analysis for2-year-old yellow-cedar seedlings from four populations(see Table 35 for regression equations) 132
Figure 18: Net photosynthesis (A) predicted response topredawn shoot water potential (80) from regression analysisfor 2-year-old yellow-cedar seedlings from two open-pollinatedfamilies from Coquihalla population (see Table 36 for regressionequations) ^ 136
Figure 19: Stomatal conductance (gs) predicted response topredawn shoot water potential (Elk) from regression analysisfor 2-year-old yellow-cedar seedlings from two open-pollinatedfamilies from Coquihalla population (see Table 36 for regressionequations) ^ 137
Figure 20: Net photosynthesis (A) predicted response tostomatal conductance (g.) from regression analysis for2-year-old yellow-cedar seedlings from two open-pollinatedfamilies from Coquihalla population (see Table 36 for regressionequations) ^ 138
Figure 21: Water use efficiency (WUE) predicted response topredawn shoot water potential (4) from regression analysisfor 2-year-old yellow-cedar seedlings from four populations(see Table 37 for regression equations) 139
Figure 22: Turgor pressure predicted response to relativewater content from regression analysis for 2-year-oldyellow-cedar seedlings from two populations before andafter a 6-week drydown (see Table 39 for regressionequations) ^ 146
Figure 23: Turgor pressure predicted response to relativewater content from regression analysis for 2-year-oldyellow-cedar seedlings from two open-pollinated familieswithin each of two populations (see Table 39 for regressionequations). Figure 23a: Kwatna Inlet, Figure 23b: Coquihalla^. . 147
xiv

ACKNOWLEDGEMENTS
This project spanned a long time and involved many people.^If Iinadvertently missed anyone, my apologies.^I would like to thank thefollowing people for their assistance with: cone collections: I.Karlsson,D.Pigott, C.Cartwright, G.Ritchie, J.Keeley, H.Kester; seed and seedlingtasks: E.Johnson, I.Cairns, J.Nahirnick, L.Donaldson, M.Yarrow, L.Bennett,C.Fernau, C.Cartwright, G.Long, L.Palmer, J.Ogg, N.Daintith, S.Cairns,B.Hawkins, H.Fleming, G.O'Neil, Y.E1Kassaby, R.Folk; statistical assistance:A.Yanchuk, V.Sit, V.Lemay; thesis proposal and review: D.Lester, D.Lavender,S.Grossnickle, V.LeMay, K.Klinka, R.Peterson, B.Holl, J.Worrall,K.Morgenstern.^Financial support was provided in part by B.C.F.S. andN.S.E.R.C.
I would like to thank C.Ferguson for supervising seed and seedling tasksat Cowichan Lake Research Station, and for bearing the weight of our researchprogramme during my absence. My sincere appreciation to the staff ofC.L.R.S., who under the guidance of D.Carson were always cheerfully availableto assist as needed. My grateful acknowledgement to H.Benskin for his solidand unwavering financial and moral support. D.Lester provided much-neededthoughtful and patient guidance throughout. S. Grossnickle providedinvaluable assistance in the development and interpretation of thephysiological aspect of the thesis. S.Silim provided assistance in cold-hardiness testing techniques. T.Ogg patiently typed the tables and assistedin preparing the final document. I would like to thank my parents for theirmoral and financial support throughout my educational sojourn. This thesisis dedicated to Valerie, who unselfishly supported me throughout my Ph'Ddespite two new children, Heather and Andrew, three moves, and forcedisolation in the wilderness of Mesachie Lake.
XV

1
CHAPTER 1: INTRODUCTION
1.1 OBJECTIVES
The overall objective of this study was to investigate the amount and
distribution of genetic and environmental variation of yellow-cedar
(Chamaecyparis nootkatensis (D. Don) Spach) seed, and seedling morphological
and physiological traits, and to elucidate any adaptive variation. The
thesis involves two main studies, a common-garden genetics study and a
greenhouse environment by genetics study.
The common-garden study extended over a 3-year period, and consisted of
33 populations and 171 open-pollinated families which sampled the botanical
range of yellow-cedar. The first year involved measuring seed and
germination traits prior to sowing, growth and phenology during the first
growing season in a greenhouse, and cold-hardiness during the acclimation
period following the growing season. The second and third year involved
measuring growth, phenology and cold-hardiness of seedlings planted in a
nurserybed. The objective of the common-garden study was to investigate the
extent and pattern of genetic variability in seed and seedling traits among
and within populations of yellow-cedar, and to correlate traits to seed
source origin. The study focused on traits that sampled the developmental
sequence of events that influence the adaptation of a population to the
environment including growth rate, phenology, acclimation, and dormancy.
The second study (Chapter 3) was comprised of 1-year-old seedlings from
18 populations and 27 open-pollinated families grown in four different
greenhouse environments represented as two photoperiods and two soil moisture
regimes. The study involved measuring growth, phenology, biomass

2
accumulation, gas exchange, water relations and cold-hardiness over the
second growing season. The objectives of the second study were to
investigate the effects of different environments on morphological expression
and physiological processes, determine the extent of genotype by environment
interactions for morphological and physiological traits, and elucidate the
presence of adaptive genetic variation in morphological expression and
physiological processes in response to changing photoperiods, and moisture
stress.
1.2 LITERATURE REVIEW
a) botanical range and ecology of yellow-cedar
The botanical distribution of yellow-cedar extends over 200 latitude
from northern California to southeast Alaska. Within this latitudinal range,
yellow-cedar occupies a unique geographic distribution. It occurs strictly
at high elevations (over 1200 m) in both the Siskiyou Mountains in northern
California and southwest Oregon, and the west side of the Cascade Mountains
in Washington and Oregon. It occurs at high elevations in both the Olympic
Mountains in Washington and in the Coastal Mountains in southern British
Columbia. From approximately 51° N. latitude and northward, yellow-cedar
occurs from sea level to timberline, however, it is restricted to a narrow
longitudinal band along the coast. A number of isolated stands occur over
200 km inland from the most easterly coastal populations, one in central
Oregon and at least two in southern British Columbia.
Throughout most of the range of yellow-cedar, the climate is very humid
with relatively cool summers and mild winters (Krajina 1969). Winter
temperatures rarely go below -20° C in both high elevation sites in the
Oregon Cascades and in low elevation coastal Alaska sites.
3
Yellow-cedar has a wide ecological amplitude throughout its
distribution. In the southern part of its range (south of Mt. Rainier,
Washington), yellow-cedar is found on wet to dry sites, and occurs in
generally open-habitats from bogs to rocky ridges (Antos and Zobel 1986). In
British Columbia, yellow-cedar occurs on moderately dry to wet soils, and on
nutrient very-poor soils to very-rich soils (Klinka 1991). The most
productive sites in British Columbia occur on very-moist and nitrogen very-
rich soils in montane, very-wet maritime climates where yellow-cedar competes
with amabilis fir (Abies amabilis (Dougl.) Forbes) (Krajina 1969).
Yellow-cedar does not occur on many sites that it seems capable of
occupying. On disturbed sites, amabalis fir comes in quicker and is more
shade tolerant, thus replacing yellow-cedar in a closed canopy forest (Antos
and Zobel 1986). On deep, well drained soils, other species such as redcedar
(Thuja plicata Donn), western hemlock (Tsuga heterophylla (Raf.) Sarg), and
Sitka spruce (Picea sitchensis (Bong.) Carr) outgrow yellow-cedar. The main
limiting factor to the distribution of yellow-cedar seems to be its inability
to compete because of slow initial growth, and not because of limited
ecological amplitude (Antos and Zobel 1986).
b) phenotypic plasticity, specialization, and genetic architecture of
Pacific Northwest conifers
Different conifer species in the Pacific Northwest region of North
America have been shown to follow alternative strategies, specialization or
phenotypic plasticity, in adapting to heterogeneous environments (Rehfeldt
1984). Specialization is a consequence of changes in gene frequencies of a
population in response to environmental differences. The genotype is
4
expressed phenotypically and selection acts directly on the genotype
(Rehfeldt 1984).
Phenotypic plasticity is the degree to which phenotypic expression of
a genotype varies under different environmental conditions (Bradshaw 1965,
Sultan 1987). It can be measured by the amount to which the expressions of
individual characteristics of a genotype are changed by different
environments (Bradshaw 1965). Phenotypic plasticity has been shown to exist
for a wide variety of species, to be trait and environmental specific, to be
under genetic control (for both direction and amount), and to be of adaptive
value (Bradshaw 1965, Scheiner and Goodnight 1984, Sultan 1987, Macdonald and
Chinnappa 1989).
Having both ample genetic variability and phenotypic plasticity within
a population had historically been thought of as unlikely (Bradshaw 1965),
since a population with a well developed plastic response has no need for
genetic variation (Schlichting 1986). Thus, it was expected that an inverse
relationship existed between plasticity and heterozygosity. Although
negative correlations have been reported (Jain 1979, Silander 1985), the
overwhelming evidence points to no relationship between plasticity and
heterozygosity (Scheiner and Goodnight 1984, Bagchi and Iyama 1983,
Schlichting and Levin 1984, Schlichting and Levin 1986, Macdonald and
Chinnappa 1989).
There is substantial evidence that ecotypes have evolved through
changes in gene frequencies brought about by selection. However, the ability
of selection to shape ecotypes is constrained by: 1) the relationship of
genotype to phenotype; 2) relative scales of the environment and the species;
and, 3) migration versus selection pressure (Sultan 1987). Lewontin (1957)
5
states that selection will favour individual plasticity unless a set of
narrowly adapted genotypes can survive a greater range of environments than
any single genotype. Phenotypic flexibility of plants, along with the nature
of their environment, can substantially buffer the effects of natural
selection (Sultan 1987).
Possible reasons for plasticity not evolving in a character are: 1)
canalization of highly conserved traits such as floral structures; 2)
environmental change is too sudden and plants can only survive by already
being adjusted to the sudden changes (such as frost or drought) through
permanent genetic change; 3) the plastic response is not reversible when
needed to be (i.e. shallow roots in flood, followed by a drought); 4) limits
to plasticity may be imposed by the genome which is in turn limited by the
organism's chemical system, and; 5) relationships among plasticities of
various fitness traits (i.e. genetic correlations) (Bradshaw 1965, Sultan
1987, Schlichting 1989, Stearns 1989).
The above limits to plasticity possibly explain why plants do not
evolve to a single genotype with an infinite array of plastic responses
(Bradshaw 1965). Bradshaw states that "although plasticity plays an
important role in adaptation, permanent adaptation by genetic change is more
common".
Adaptation through specialization is displayed by coastal Douglas-fir
(Pseudostuga menziesii (Mirb.) Franco var. menziesii (Griffin 1977, Campbell
1986, Loopstra and Adams 1989, Ying 1990), Sitka spruce (Roche 1969,
Falkenhagen 1977, Lines 1987, Ying 1990), and western hemlock (Kuser and
Ching 1980). These studies have focused on traits that describe the
developmental sequence of events that influence a population's adaptation to

6
its environment (e.g. growth rhythms, growth rate, acclimation, and
dormancy). In general, trees from seed collected in relatively mild and/or
wet climates, grow faster, cease growth later, and are more cold susceptible
than populations from colder and/or drier climates. Species showing weak or
no correlations of fitness traits with macrogeography, a generalist strategy,
include western white pine (Pinus monticola Dougl.) (Rehfeldt 1984), and
western redcedar (Rehfeldt pers. comm.).
If a species tends towards being a generalist, it should, according to
theory, exhibit more genetic variability within populations than among
(Rehfeldt 1984, Sultan 1987). Depending on the geographic range of the
species being studied, and the extent of sampling, range-wide provenance
testing with family structure in conifers has usually shown that the
variation among populations is substantially greater than the variation among
families within populations (Namkoong et al. 1972, Namkoong and Conkle 1976,
Fashler et al. 1985). This has especially been the case where a species has
shown a high degree of specialization in response to heterogeneous
environments (Campbell 1979, White et al. 1981, Loopstra and Adams 1989).
However, in white pine, which has exhibited a generalist mode of adaptation
(Rehfeldt 1984), genetic variation among families within populations was
substantially larger than among populations (Rehfelt 1979a).
c) photoperiodic effects on seedling morphology and cold -hardiness
It has long been known that woody tree species of the northern
temperate zone have a marked response to photoperiod with respect to shoot
growth (Kramer 1936, Wareing 1956, Lavender 1980). Exposure to short days
results in reduced shoot height extension either due to early budset or
7
reduced internode extension in bud-formed (determinate) species (e.g. Wareing
1956, Giertych and Farrar 1961, Heide 1974, Perry and Lotan 1978, Colombo et
al. 1982, Arnott et al. 1988) and reduced shoot growth in non-bud forming
(indeterminate) species (Grossnickle et al. 1988, Krasowski and Owens 1991,
Arnott et al. 1992, Major et al. 1993). Exposure to long days results in the
opposite effect (Wareing 1956).
Photoperiodic effects on dry weight allocation to roots and shoots of
conifer seedlings are less clear. For determinate species, exposure of
seedlings to artificial short days has been shown to decrease shoot dry
weight and to have no significant impact on root dry weight (Heide 1974,
Perry and Lotan 1978, Hawkins and Draper 1988), to decrease both shoot and
root dry weight (Giertych and Farrar 1961), or to have no significant impact
on either shoot or root dry weight allocation (Heide 1974, Burdett and
Yamamoto 1986, Arnott et al. 1988). Those studies that reported significant
decreases in shoot dry weight with short-day treatment also reported terminal
bud set in response to the shorter photoperiod. For indeterminate species,
studies have shown no significant impact on dry matter allocation
(Grossnickle et al. 1988, Krasowski and Owens 1991, Arnott et al. 1992, Major
et al. 1993).
Conflicting reports in the literature on the effects of photoperiod on
dry weight allocation may be due to the timing and duration of treatment, the
length of the photoperiods, and allometric relationships. Ledig and Perry
(1965) demonstrated that changes in dry weight allocation in response to
environmental stresses were confounded with correlations of individual dry
weight components with total dry weight. If these correlations were removed
through the use of allometric relationships, then only extreme environments
resulted in changes in allocation of dry weight (Ledig and Perry 1965, Ledig
8
et al. 1970).
Temperate woody plants in nature respond to shortening photoperiods and
decreasing temperatures during the later part of the growing season by
decreasing shoot growth and setting buds. Thus, growth cessation is a
prerequisite to cold-acclimation in woody plants (Levitt 1980a), and this is
considered to be the first stage of cold-acclimation (Weiser 1970, Levitt
1980a). For determinate species, artificial short days applied during the
growing season of seedlings in the nursery result in decreased shoot growth,
early onset of dormancy, and increased cold-acclimation (e.g. van den
Driessche 1970, Aronsson 1975, Christersson 1978, McCreary et al. 1978,
D'Aoust and Cameron 1982, Colombo et al. 1989, Grossnickle et al. 1991,
Bigras and D'Aoust 1992). A similar response has been reported for
indeterminate species (Colombo and Raitenan 1991, Arnott et al. 1992, Folk et
al 1993, Major et al. 1993).
d) genotype x photoperiod interaction effects on seedling morphology and
cold-hardiness
The significance of population by photoperiod interactions for shoot
growth and shoot rhythms with determinate conifer species is well documented
in the literature, and many of these interactions have been attributed to
adaptive responses to environmental selection pressures (Pauley and Perry
1954, Perry et al. 1965, Vaartaja 1959, Irgens-Moller 1957, Neinstadt and
Olson 1961, Irgens-Moller 1962, Heide 1974, Pollard et al. 1975, Pollard and
Ying 1979). Northern temperate tree populations from southern portions of a
species range or from low elevations, when grown under short photoperiods,
grow longer into the season, whereas northern or high elevation populations
set bud earlier resulting in decreased shoot extension. Thus, populations of

9
species with extended latitudinal or elevational ranges have responded to
environmental pressures (i.e. frost events) such that changes in gene
frequencies have resulted in differential responses to photoperiod with
respect to shoot growth extension and phenology.
There have been few studies for indeterminate species, although the
lack of a genetic influence on photoperiodic response has been reported for
redcedar (Vaartaja 1959) and for eastern white-cedar (Thuja occidentalis L.)
(Vaartaja 1962).
Family by photoperiod interactions are not as well documented. In a
study by Perry and Lotan (1978), 50 open-pollinated families from five
populations of lodgepole pine (Pinus contorta var. latifolia Dougl.) were
grown under four photoperiods during the first growing season. Significant
family within population and photoperiod variation was evident in shoot
growth, total dry weight, root and shoot dry weight, and shoot:root dry
weight ratio. Family within population by photoperiod interaction was
significant for all traits except root dry weight. The ratio of family
within population variance to family within population by photoperiod
variance ranged from 0.5 to 2.0.
In a study with 66 open-pollinated families from 11 populations of
white spruce (Picea glauca (Moench) Voss) (Pollard and Ying 1979) sampled
from a narrow range of latitude, significant family within population
variation in response to declining photoperiod was found for shoot extension,
whereas population effects were minimal.
e) moisture stress effects on seedling morphology and cold-hardiness
Moisture stress applied to seedlings during shoot growth has been
reported to decrease shoot extension in determinate species (e.g. Lavender

10
et al. 1968, Cheung 1973, Nelson and Lavender 1978, Macey and Arnott 1986,
Bongarten and Teskey 1987, Arnott et al. 1988, Joly et al. 1989), and
indeterminate species (Harry 1987, Krasowski and Owens 1991, Arnott et al.
1992, Major et al. 1993) and to result in early budset for determinate
species (Lavender et al. 1968, Cheung 1973, Young and Hanover 1978, Vance and
Running 1985, Macey and Arnott 1986). Cell enlargement, thus shoot
extension, is highly sensitive to water stress through the effects of drought
on cell turgor (Hsiao 1973).
In general, studies of moisture stress effects on allocation of dry
weight reported decreases in both shoot and root dry weight, with a larger
decrease in shoot dry weight resulting in a decrease in shoot:root dry weight
ratio (Perry et al. 1978, Blake et al. 1979, Seiler and Johnson 1988, Joly et
al. 1989). With indeterminate species, studies have reported that moisture
stress significantly decreased shoot dry weight, but had no significant
impact on root dry weight (Krasowski and Owens 1991, Arnott et al. 1992,
Major et al. 1993). The interpretation of these studies on dry weight
allocation may be tenuous because of the correlation of shoot and branch dry
weights with total dry weight (Ledig and Perry 1965, Bongarten and Teskey
1987).
If moisture stress is not too severe, or it is applied in conjunction
with short days during the growing season of seedlings, it can increase cold-
hardiness during the acclimation stage, for both determinate and
indeterminate species (Timmis and Tanaka 1976, Blake et al. 1979, Lavender
1980, Major et al. 1993). This is attributed to an indirect effect of
moisture stress resulting in decreased shoot extension and early budset
(Glerum 1985). If moisture stress is too severe, cold-acclimation may be

11
affected through the disruption of physiological processes correlated with
cold-hardiness (Blake et al. 1979, Glerum 1985).
f) genotype x moisture interaction effects on seedling morphology and
cold-hardiness
In nursery studies, significant population by moisture interactions for
growth and dry weight allocation have been reported for loblolly pine (Pinus
taeda L.) (van Buijtenen 1966, Bongarten and Teskey 1987). However, most
studies indicate minimal population by moisture interaction for both shoot
extension and dry weight allocation for determinate species (Ledig et al.
1970, Perry et al. 1978, Seiler and Johnson 1988, Joly et al. 1989), and for
shoot extension with indeterminate species (Harry 1987).
Significant family by moisture or family within population by moisture
interactions in nursery studies were found for shoot growth extension and dry
weight allocation in loblolly pine (Cannell et al. 1978, Waxier and van
Buijtenen 1981), for root dry weight in lodgepole pine (Perry et al. 1978),
and for budset and root dry weight in Douglas-fir (Joly et al. 1989). Except
for the study by Cannell et al. (1978), all interactions were scale effects
as opposed to rank changes.
No significant family by moisture or family within population by
moisture interactions were reported for shoot extension, root collar
diameter, and dry weight in Douglas-fir (Joly et al. 1989), for dry weight
allocation in loblolly pine (Seiler and Johnson 1988), and for shoot weight
in lodgepole pine (Perry et al. 1978). In the only study reported involving
an indeterminate species, Harry (1987), found no population by moisture or
family within population by moisture interactions for relative growth rate
12
measured periodically during the growing season of incense-cedar (Libocedrus
decurrens Torr).
g) morphological adaptations to drought
There are numerous morphological adaptations to drought including
decreased shoot growth, changes in phenology, allocation of relatively more
carbohydrates to roots than shoots, thicker needles and leaves, and decreased
number and length of branches (e.g. Ledig et al. 1970, Young and Hanover
1978, Harry 1987, Bongarten and Teskey 1987, Abrams et al. 1990, Joly et al.
1989, Kubiske and Abrams 1992).
Morphological adaptations are primarily drought avoidance mechanisms
which can result in the maintenance of high internal water potential despite
low soil water potential and high evaporative demands (Levitt 1980b).
Decreased shoot and branch growth restricts transpirational surface area and
more allocation of biomass to roots relative to shoots can increase
absorption efficiency (Levitt 1980b, Joly et al. 1989).
Evidence of drought ecotypes for woody tree species, with respect to
morphological adaptations, has been reported for many species including Scots
pine (Firms sylvestris) (Brown 1969), Douglas-fir (Ferrell and Woodward 1966,
White 1987, Joly et al. 1989), loblolly pine (van Buijtenen 1966, Bongarten
and Teskey 1987), lodgepole pine (Dykstra 1974), red maple (Acer rubra L.)
(Townsend and Roberts 1973), red oak (Quercus rubra L.) (Kubiske and Abrams
1992), and green ash (Fraxinus pennsylvanica Marsh.) (Abrams et al. 1990).

13
h) physiological processes influencing drought resistance
Genetic differences in physiological processes, such as gas exchange
and water relations, among and within populations may be important with
respect to fitness. As stated by Kramer (1986): "...physiological processes
are the machinery through which genetic potential and environment operate to
determine the quantity and quality of growth". The adaptation of plants to
water stress through the development of drought avoidance and tolerance
mechanisms are important for survival and growth, since physiological
processes are inhibited more often by water stress than by any other single
factor (Kramer 1986).
Pacific Northwest conifers, including yellow-cedar, experience periods
of drought when water deficits occur because of low soil water potential and
high atmospheric demands during the growing season. The ability to tolerate
or avoid injurious desiccation due to high atmospheric evaporative demand
determines the potential for survival and growth during periods of drought
(Hsiao et al. 1976).
There are many physiological and morphological factors that can result
in better adaptation to drought including both avoidance and tolerance
mechanisms. Drought avoidance is usually a result of drought-induced
alterations in anatomical and morphological structures that decrease
transpiration through increased resistance to water loss (Hsiao 1973, Levitt
1980b, Kramer 1983) (see Section 1.2 g)).
Drought tolerance, on the other hand, involves changes in physiological
processes that result in the ability to function under decreased relative
water content and lower water potential (Levitt 1980b, Blum 1988).
Physiological properties that confer drought tolerance, including both

14
dehydration avoidance and dehydration tolerance, are osmotic adjustment,
changes in cell wall physical properties, water use efficiency, and
respiration rate.
The evolution of drought resistant ecotypes in forest tree species
depends upon many factors including the presence of heritable genetic
variation in physiological processes and morphological structures that infer
drought resistance, and the presence of environmental selection pressures.
There have been numerous genetic studies on gas exchange processes of forest
trees at the population, family and clonal level. In most of the studies,
genetic variability has been detected, some attributed to adaptive responses
in gas exchange traits including total and net photosynthesis, stomatal
conductance, and transpiration (e.g. Bourdeau 1963, Campbell and Rediske
1966, Ledig and Perry 1967, Fryer and Ledig 1972, Pelkonen and Luukkanen
1974, Whitehead et al. 1983, Mebrahtu and Hanover 1991). In all of these
studies, gas exchange measurements were taken at one or a few times during a
normal growing season, usually on seedlings in a nursery. There have been
limited studies on the genetics of gas exchange processes and water relation
parameters with respect to extended water stress during the active growing
season. Drought may exert a stronger or different selection pressure than in
a mesic environment. Given the presence of heritable genetic variation in
the fundamental physiological processes that confer drought avoidance and
tolerance, these selection pressures can result in populations differing in
drought resistance capability and mechanisms.
Early studies on Douglas-fir seedlings from wet and dry habitats showed
that xeric ecotypes had a greater reduction in transpiration rate, and
stomata were more sensitive, during drought (Ferrell and Woodward 1966,
15
Zavitkovski and Ferrell 1968, Unterscheutz et al. 1974). Under well-watered
conditions, there were no differences in transpiration rates. Similar
results were reported for Scots pine under drought (Hellkvist 1970).
In loblolly pine, seedlings from xeric habitats exhibited increased
transpiration rates and stomatal conductance under well-watered conditions,
compared to mesic habitats (Bongarten and Teskey 1986). There was no
discernable pattern among seed sources in response to drought. In another
study with loblolly pine, an open-pollinated family from a xeric habitat had
a lower transpiration rate under well-watered conditions, and less decline in
transpiration rate during a drought, compared to seedlings from two mesic
habitats (Seiler and Johnson 1988). There was no difference in net
photosynthesis among the three seed sources under well-watered conditions or
during the drought.
Clones of eastern cottonwood (Populus deltoides Bartr.) from dry sites
had greater growth under both moist and dry soil conditions, and decreased
stomatal sensitivity compared to clones from wet sites (Kelliher and Tauer
1980, McGee et al 1981). In a study with red maple, transpiration was
greatest with seedlings from a very wet site under both well-watered and
drought conditions as compared to seedlings from a wet site and two dry sites
(Townsend and Roberts 1973). As well, growth was greater for the red maple
seedlings from the very wet and wet sites compared to seedlings from the dry
sites, at all water stress levels. Seedlings of green ash from a xeric
habitat exhibited greater net photosynthesis and stomatal conductance
throughout a drought compared to seedlings from a mesic habitat (Abrams et
al. 1990).
16
For species that are drought avoiders, water savers (Levitt 1980b),
stomata may close earlier in response to drought (i.e. more sensitive to
water stress) with seedlings from xeric sites compared to mesic sites, thus
decreasing growth, but reducing mortality. For species that are drought
avoiders, water-spenders (Levitt 1980b), stomata remain open at lower levels
of drought, thus allowing photosynthesis, and improving water use efficiency.
From the above discussion, Douglas-fir and red maple from xeric habitats had
greater stomatal sensitivity under increasing water stress, closing their
stomata earlier and decreasing growth, compared to seedlings from mesic
sites. Eastern cottonwood and green ash from xeric sites, on the other hand,
had decreased stomatal sensitivity with increasing drought, with stomata
remaining open at lower water potentials. In green ash, reduced stomatal
sensitivity reflected the greater photosynthetic rate of xeric seedlings
under stress, and in eastern cottonwood, resulted in greater growth than
plants from mesic sites. Loblolly pine studies reported conflicting results
with respect to stomatal sensitivity.
In studies comparing different species known to vary in drought
tolerance, water use efficiency has been both higher or lower in more drought
tolerant species or has shown no relationship to levels of drought tolerance
(DeLucia and Heckathorn 1989, Ni and Pallardy 1991). In population studies,
seedlings from more xeric sites have shown no difference in water use
efficiency compared to seedlings from more mesic sites (Seiler and Johnson
1988, Abrams et al. 1990). However, in both of these studies, water use
efficiency was averaged over the entire drought period.
A high water use efficiency may be advantageous if there is conserved
soil moisture available in the future (DeLucia and Heckathorn 1989). On the
17
other hand, if the conserved water is readily lost by evaporation or
transpiration by competing vegetation, a high water use efficiency may be
disadvantageous.
Studies on gas exchange among families in response to drought are rare.
Seedlings from eight full-sib families, of which only five had unrelated
parents, from a drought resistant population of loblolly pine, showed no
significant differences in stomatal conductance during a drought (Raley and
Tauer 1986). In a study with radiata pine (Pinus radiata D.Don), three open-
pollinated families differing in their response to weed competition,
exhibited significant differences in gas exchange and water use efficiency in
response to a drought (Sands et al. 1984). As well, the interaction of
family by shoot water potential was statistically significant with one family
having the greatest photosynthetic rate under well-watered conditions and the
poorest when under high water stress.
Genetic studies on shoot water relation parameters of forest trees are
not numerous, and most of the studies involve an extended drought on either
bulk populations or one family per population. In the study cited earlier on
green ash, seedlings from the most mesic source did not osmotically adjust
after an extended drought, whereas all other populations did (Abrams et al.
1990). Tissue elasticity increased after the drought in seedlings from the
most mesic site, and significantly decreased in seedlings from one of the
drier sites. Seed source differences in tissue water relation parameters
were only evident after the drought and not under well-watered conditions.
Significant differences in osmotic adjustment, tissue elasticity and
relative water content during drought were evident among eight open-
pollinated families of black walnut (Juglans nigra L.) from eight populations

18
selected along a longitudinal transect (Parker and Pallardy 1985). However,
there was no correlation of drought resistance traits with moisture
availability at seed source location. The two most xeric populations
differed in their ability to osmotically adjust, with one population
osmotically adjusting the most of all populations, and the other xeric
population the least.
Choi (1992) investigated the genetic differences in water relation
parameters among six open-pollinated families of shortleaf pine (Pinus
echinata Mill) from at least five different geographic areas. Significant
family differences were found for osmotic potential, symplastic water, and
modulus of elasticity after a drydown, as well as for osmotic adjustment and
change in elasticity between well-watered control seedlings and droughted
seedlings. There was no attempt to correlate the genetic variation with site
variation in moisture availability.
Studies by Bongarten and Teskey (1986) with six populations of loblolly
pine and Joly and Zaerr (1987) with three populations of Douglas-fir showed
no ecotypic variation in drought resistance with respect to water relation
parameters.
Osmotic adjustment can maintain positive turgor at low water potentials
allowing for stomata to remain open longer and thus assimilate carbon dioxide
(Hsiao et al. 1976, Turner and Begg 1981). However, accumulation of solutes
may have an adverse affect on photosynthetic capacity possibly due to
inhibition of enzymatic activity (Turner and Begg 1981). As well, cell wall
elasticity also affects the ability of a cell to maintain positive turgor
under internal plant water stress. Elastic cell walls will lose less turgor
pressure with a drop in relative water content, while inelastic cell walls

19
have a rapid loss of turgor pressure with a drop in relative water content
before turgor loss point (Abrams 1988).
In the water relation studies cited above, population differences in
water relation parameters were evident. However, only the study with green
ash (Abrams et al. 1990) showed any evidence of adaptive value of variation
in water relation parameters. Differences among families were shown in two
studies (Parker and Pallardy 1985, Choi 1992), but these differences were
confounded with seed source variation.

20
CHAPTER 2: COMMON-GARDEN STUDIES
2.1 OBJECTIVES
This chapter describes two common-garden genetic studies: first-year
greenhouse trial and the nurserybed trial. The greenhouse trial involved
measuring seed and germination traits prior to sowing, growth and phenology
measurements during the first growing season, and cold-hardiness during
acclimation, of seedlings originating from different populations and open-
pollinated families within populations. The nurserybed trial involved
measuring growth, phenology and cold-hardiness over two growing seasons of
seedlings originating from different populations and families within
populations. The two trials are considered separately with respect to
statistical analyses because of differences in genetic sampling and
experimental design.
The objectives of both trials were to investigate the extent and
pattern of genetic variability in seed and seedling traits among and within
populations of yellow-cedar that sampled the botanical range, and to
correlate seed and seedling traits to seed source origin.
Cold-hardiness was measured after each of the three growing seasons,
each time with different objectives. The first year involved investigating
patterns of cold-hardiness acclimation on a small subset of populations.
The objective of the second-year trials was to partition genetic variability
among populations and among families within populations for cold-hardiness
during acclimation and at maximum hardiness. Finally, the third year's
objective was to investigate adaptive patterns among populations in cold-
hardiness during acclimation and at maximum hardiness and correlations with
growth and phenological traits.

21
2.2 MATERIALS AND METHODS
2.2.1 Experimental Design
a) population sampling and cone collection
Yellow-cedar occurs in small, disjunct populations throughout most of
its range. Cone crops are infrequent, the percentage of viable seed is low,
and seed germination is poor. These factors mostly dictated the population
sampling pattern. Since one of the objectives of the study was to describe
the genecology of the species, it would be desirable to systematically sample
the latitudinal, longitudinal and elevational range of the species, however,
this was not feasible. In the southern part of its range, yellow-cedar
occurs along a narrow, discontinuous band only at high elevations in the
western Cascade Mountains. Populations in this area were sampled along a
latitudinal gradient.
In southern British Columbia, where the species range is more
extensive, populations were collected, where possible, to sample the range of
biogeoclimatic subzones in which yellow-cedar occurs (Krajina et al. 1982).
However, it was not possible to always sample along an elevational or
longitudinal transect at the macrogeographic level because of cone
availability or physical access.
From central British Columbia to Alaska, many of the areas are
isolated, thus populations were collected where possible, mostly along a
latitudinal gradient. Two populations were obtained from Alaska, however,
only one had viable seed. Thus, the overall collection strategy stressed
sampling the latitudinal range of yellow-cedar.
A total of 33 populations was used in this study (Table 1). At 26 of
the locations, cones were collected from, and kept separate by individual

Table 1:^Geographic location of yellow-cedar populations
Population' N. Latitude W. Longitude^Elevation (m)
Mitkof Island, AK 56° 49' 132°^57' 300
Kitimat Valley, B.C. 54° 7' 128°^43' 450
Porcher Island, B.C. 54° 00' 130°^20' 430
Queen Charlotte Islands, B.C. 53° 33' 132°^25' 400
King Island, B.C. 52° 22' 127°^22' 400
Clayton Falls, B.C. 52° 17' 126°^52' 732
Kwatna Inlet, B.C. 52° 8' 127°^23' 488
Holberg, V.I. 50° 42' 127°^40' 300
Coal Harbour, V.I. 50° 39' 127°^47' 500
Pemberton, B.C. 50° 32' 123°^29' 900
Pt.^McNeill,^V.I. 50° 32' 127°^15' 250
Beaver Cove, V.I. 50° 31' 126°^48' 731
Waukwass Creek, V.I. 50° 29' 127°^18' 750
Twin Peaks, V.I. 50° 29' 127°^15' 900
Kelsey Bay, V.I. 50° 22' 126°^03' 800
Bunster Hills, B.C. 50° 01' 124°^36' 800
Bullet Lake, V.I. 49° 56' 126°^21' 579
Squamish, B.C. 49° 47' 122°^55' 900
Mt. Washington, V.I. 49° 45' 125°^20' 1200
1.^B.C. — British Columbia, Canada; V.I. — Vancouver Island, B.C.; WA — Washington, U.S.A.;OR — Oregon, U.S.A.; AK — Alaska, U.S.A.

Table 1:^(con't)
Population' N. Latitude W. Longitude Elevation (m)
Coquihalla, B.C. 49° 37' 121° 02' 1350
Talc Creek,^B.C. 49° 30' 121° 40' 800
Statlu Creek, B.C. 49° 21' 122° 06' 975
Yellow Creek, B.C. 49° 12' 124° 41' 1000
Sparton Lake, V.I. 48° 56' 124° 12' 823
Valentine Mt., V.I. 48° 33' 123° 51' 760
Mt. Angeles, WA 47° 59' 123° 28' 1750
Johnson Creek, WA 47° 48' 121° 15' 1200
Huckleberry Ridge, WA 47° 03' 121° 37' 1350
Mt. Rainier, WA 46° 47' 121° 45' 1350
White Pass, WA 46° 38' 121° 25' 1350
Humbug Creek, OR 44° 48' 122° 09' 1200
County Creek, OR 44° 16' 122° 06' 1200
Jackass Mt., OR 43° 03' 122° 27' 1600
1.^B.C. — British Columbia, Canada; V.I. = Vancouver Island, B.C.; WA — Washington, U.S.A.;OR — Oregon, U.S.A.; AK = Alaska, U.S.A.
24
trees.^Cones were collected from 10 individual trees at each of 18
populations, and from three to seven trees at each of the eight remaining
populations, for a total of 223 trees. A minimal distance of 250 meters
between trees was imposed to limit relatedness. Up to one litre of cones was
collected from the upper crown of most trees. Limited cone crops required
that some cones had to be collected from lower in the crown. The limited
availability of trees with cones, as well as the small number of trees in
each stand, dictated the sampling strategy. Tree form ranged from large,
single stem, straight trees to low-lying shrubs.
In no case were all the sampled trees from one population more than 200
metres apart in elevation.
b) seed handling, germination, and first-year greenhouse trial design
Cones were air-dried and tumbled to extract seed. The seed were
stratified by soaking in water in plastic bags at room temperature for 48
hours then drained, kept in plastic bags at room temperature for one month,
and then at 4° C for an additional three months. After stratification, seed
were placed in petri dishes in a germinator with a day (16 hours) temperature
of 18° C and night (8 hours) temperature of 15° C. Germinants were sown at
1-week intervals starting at day 1, day 7 and day 13, dibbled into plastic
containers (93 cm3 soil volume per cavity, 96 cavities per container) and
placed in a fibreglass greenhouse with a photoperiod of 20 hours. A minimum
temperature of 15° C was maintained during early seedling development. The
greenhouse seedlings were arranged in a randomized design with three
replications of 24 seedlings per family per population, or bulked population.
Each plot was arranged in a 3x8 configuration. The containers were
25
rerandomized every 2 weeks during the greenhouse growing season to minimize
greenhouse edge effects.
The seedlings were watered and fertilized with a balanced (N:P:K)
soluble fertilizer including micronutrients. The seedlings were moved out of
the greenhouse near the end of the growing season in September to
acclimatize. They were placed under 50% shade-cloth for 4 weeks, then moved
into an outdoor compound.
c) nurserybed trial design
One-year-old seedlings were planted into a nurserybed at Mesachie Lake,
B.C. (48° 49' N. Latitude, 124° 09' W. Longitude, 175 m elevation) in March,
1990. All families were represented with 24 seedlings per family, and a
minimum of 24 seedlings per bulk population (depending upon availability of
seedlings). Seedlings were planted in a randomized complete block design
with six blocks and 4-tree square plots per block, at 5 cm x 5 cm spacing.
Approximately 4000 seedlings were planted with 33 populations, seven of which
were bulk, and the other 26 populations represented by 171 families.
2.2.3 Traits Measured
2.2.3.1 First-year greenhouse trial
a) seed and germination traits
One-hundred seed per family were x-rayed for three random families per
population from each of 24 populations and two random families from each of
two populations, as well as 100 seed from each of five bulk populations (n=31
populations). Two bulk populations were inadvertently misplaced. Number of
filled seed (fseed) was determined by visually counting the number of seed
26
which had white embryos which filled more than one-half of the embryo cavity
(El Kassaby pers. comm.). The subsequent filled seed were weighed to
determine the average weight of a filled seed (wfseed).
Germination was scored in each petri dish every 2 to 4 days for 20
days. A seed was considered germinated if the radicle had extruded 0.5 cm or
more from the seed coat. For the above 76 families there were three
replications (replication—petri dish) of 100 seed (n=300 seed per family) and
six replications of 100 seed per bulk population (n=600 seed per population).
Total germination (grml) and number of days to 50% germination of viable seed
(rr50) were calculated. After all germinants were removed, the petri dishes
were placed back into the darkened cooler until the following April, and then
moved back into the germinator under the same environmental conditions as the
previous year. Total germination after the second year was recorded (grm2).
b) growth and phenology traits
Starting 8 weeks after the first dibbling, periodic shoot heights were
measured at 2-week intervals 12 times (ht0.1 to ht0.12). Root collar
diameters (rcd1) were taken at the time of the last height measurement. All
height measurements were taken from the cotyledons to the growing tip. All
measurements were taken on 10 seedlings from each of the three plots per
family from the same 76 randomly-chosen families as in the seed and
germination measurements (n-30 seedlings per family and 90 seedlings per
population), and from 10 seedlings from each of the three plots for each of
the five bulk populations, plus the two bulk populations that were not x-
rayed (n=30 seedlings per population). In order to minimize competition
effects from surrounding families, the interior 8-tree row was measured in

27
each plot plus two seedlings from one of the edge rows. Every family (n-171)
was not measured periodically during the first growing season in the
greenhouse because of time constraints, however, every family had first-year
total shoot heights measured at the time of outplanting in the nurserybed
trial.
An additional 10 seedlings per plot were measured for final height and
root collar diameter on a subset of the above families (20 families from 8
populations) to determine if there were any effects of repeated measuring on
final shoot height and root collar diameter. Subsequent analysis of this
data as compared to the repeated measures data showed that repeated measuring
resulted in significantly reduced shoot height (17.9 cm compared to 19.1 cm)
and greater diameter (3.00 mm compared to 2.91 mm). However, there was no
significant family by measuring treatment interactions for either shoot
height or root collar diameter.
Since yellow-cedar has an indeterminate growth pattern, measuring
growth cessation at the end of the growing season involves describing both
the number of seedlings growing during a particular time interval and the
amount of growth during that specified interval. Shoot growth cessation
traits, the average number of seedlings growing (ngrwcl; average based on 10
seedlings per genetic identity per replication) and total shoot growth
(grwcl), were calculated for the period between ht0.8 and ht0.12.
c) cold -hardiness measurements
Cold-hardiness was tested at five different dates on a sample of 10
populations during acclimation starting in early November through to early
28
February, with the objective of describing patterns of cold-hardiness
acclimation among populations. The electrolyte leakage technique, as
described by van den Driessche (1976) and modified for yellow-cedar (Silim
1991), was used. At each of the five test dates, three seedlings from each
of five families per population were used (n=15 seedlings per population).
Two populations were represented by four families (n=12 seedlings per
population). The main stem from the top one-third of a seedling was cut into
0.5 cm pieces after removing side branches, and placed into 20 ml vials. The
15 or 12 samples from each population were mixed together. One ml of
distilled water was added to each vial along with two to five grains of
silver iodide to prevent super-cooling. Three temperatures and a control
were tested with five vials per population per temperature. Vials were
placed in a programmable freezer and cooled to each test temperature at a
rate of 5° C per hour and held for 1 hour. After the completion of the run,
the vials were placed in a darkened cooler (+4° C). After the tissue thawed,
15 ml of distilled water was added to each vial and the vials were kept at
room temperature for 20 hours. The first conductivity reading was taken at
this time; the vials were then heated in a convection oven for 2 hours at
100° C, and a second conductivity reading taken after 20 hours.
Index of injury at each test date (inj1.1 to inj1.5) was calculated for
each vial and temperature as follows:
[(ECfroz/ECkifr)-(ECctri/ECkict)1/[1-(ECctri/ECkict)1^(2.1)
where,
EC1= electrolyte leakage due to cutting control tissue;
ECIact=total electrolytes in control tissue;
ECfroz=electrolyte leakage due to freezing tissue;
ECklfr= total electrolytes of frozen tissue.

29
2.2.3.2 Nurserybed trial
a) growth and phenology traits
Total shoot heights were measured at the time of planting (htl), and
after the first (ht2) and second (ht3) growing season in the field. ' Root
collar diameter (rcd2) was measured after the first growing season in the
field. All seedlings from 33 populations and 171 families were measured.
Periodic growth during the second and third growing season (htgrw2, htgrw3,
respectively) was calculated for each seedling.
Growth initiation and cessation during the third growing season were
measured on a subset of the seedlings by placing stakes beside each tree to
be measured, and marking on the stake the top of the main stem on successive
dates. Fourteen populations representing the latitudinal spread of the
collections were selected with three randomly chosen families for each of 12
populations, and two bulk populations. Two seedlings were measured from each
of three blocks for each family (n=6 seedlings per family and 18 seedlings
per population) and four trees from each of three blocks for the bulk
populations (n=12 seedlings per population).
Growth initiation measurements were taken on 10 dates starting on April
12, 1991 with 2 to 3 days between measurements. Growth cessation
measurements were taken weekly on five dates starting on September 9, 1991.
For all measurement dates, the number of seedlings growing and the amount of
growth, were recorded.
The following variables were derived from the third-year shoot growth
initiation and cessation data:
1. ngrwi3, ngrwc3 — average number seedlings growing during a specific
measurement period during growth initiation at the beginning of the
30
third growing season, and during growth cessation at the end of the
third growing season, respectively, and;
2. grwi3, grwc3 = total growth during the growth initiation period at the
beginning of the third growing season, and during growth cessation
period at the end of the third growing season, respectively.
b) cold -hardiness measurements: second year
Cold-hardiness was tested on a sample of the populations and families
within populations from the nurserybed test, during acclimation (early
November) and during assumed maximum hardiness (mid-January), with the
objective of partitioning variation within and among populations. Given the
large number of genetic identities, only two test temperatures (and a
control) were used. Pretesting of a subsample of the populations was done
prior to each test date in order to approximate the current LT 50 for the main
cold-hardiness tests. Given this information, two temperatures were chosen
that would come close to the LT 50 for all populations. The electrolyte
leakage technique, as described in Section 2.2.3.1 c), was used. At both
test dates, the main stem from the top one-third of a seedling was cut into
0.5 cm pieces after removing side branches, and placed into 20 ml vials.
The November test involved six seedlings per family, three randomly
chosen families per population, and 20 populations. One population was
represented by two families. The six samples from each family were mixed
together. Two temperatures (-12° C, -15° C) and a control were tested with
four vials per family per temperature, as per the technique described above.
The January test of maximum hardiness involved five to six seedlings
per family, three families per population, and 14 populations, which were a
subset of the 20 populations tested in November. Two populations were
31
represented by two families. Identities of individual progeny of parent
trees were maintained. Two temperatures (-24° C, -27° C) and a control were
tested with four vials per seedling per family per temperature, as per the
technique described above.
Index of injury was calculated for each vial as previously defined, for
both the November test (injacc2) and the January test (injmax2).
c) cold -hardiness measurements: third year
Cold-hardiness was measured during the acclimation period in October
1991, and during assumed maximum hardiness in December 1991, on all
populations (n=33), with the objective of assessing adaptive variability
among seed sources. A mixture of a maximum of five families per population
and four seedlings per family (n=20 seedlings per population), or 24
seedlings per bulk population was tested, using the electrolyte leakage
technique as described above. Tissue for each test was cut from one to two
upper lateral branches from the current year's growth from each seedling.
Two test temperatures (-9° C and -12° C for the October test; -18° C and -21°
C for the December test) and a control were used, with five vials per
population per temperature.
Index of injury was calculated for each vial as previously defined, for
both the October test (injacc3) and the December test (injmax3). Pretesting
was done for each test date as described in Section 2.3.2.2 b).
Table 2 summarizes the measured and derived seed, germination, growth,
phenological, and cold-hardiness traits used for the studies described in
this chapter, along with their description, and abbreviations used in
subsequent text, tables, and figures.

32
Table 2:^
Description of measured and derived traits used in the yellow-cedar genetic architecture and genecology study (symbols used todescribe trait in text in parenthesis)
1. Seed and Germination
Filled seed (fseed)
Weight of filled seed (wfseed)
Completeness of germination(grml, grm2)
Speed of germination (rr50)
2. 1st Year Greenhouse Trial
Periodic heights (ht0.1-ht0.12)
Final root collar diameter ofperiodically-measured seedlings(rcdl)
Inflection point (inflec)
Growth cessation (ngrwcl, grwcl)
Injury to cold (inj1.1-inj1.5)
Lethal temperature (LT50.1-LT50.5)
percent seed with white embryosfilling more than one-half embryocavity
average weight of one filled seed,in grams
percent germination of filled seedafter the first and second year,respectively
number of days to 50% germinationof viable seed
height of seedling measured fromthe cotyledons over 12 2-weekgrowing periods during the firstgrowing season, in cm, respectively
final diameter measured at the rootcollar, in mm
time to inflection point ofpredicted heights over the firstgrowing season based on a logisticfunction (see page 34), in weekssince first measurement
number of trees growing (% of totaltrees measured) and their amount ofgrowth (cm) during an 8-week periodof height growth cessation at theend of the first growing season,respectively
percent index of injury to coldduring first-year acclimation forfive testing dates, respectively
temperature where index of injuryequals 50% during first yearacclimation for five testing dates,respectively, in °C
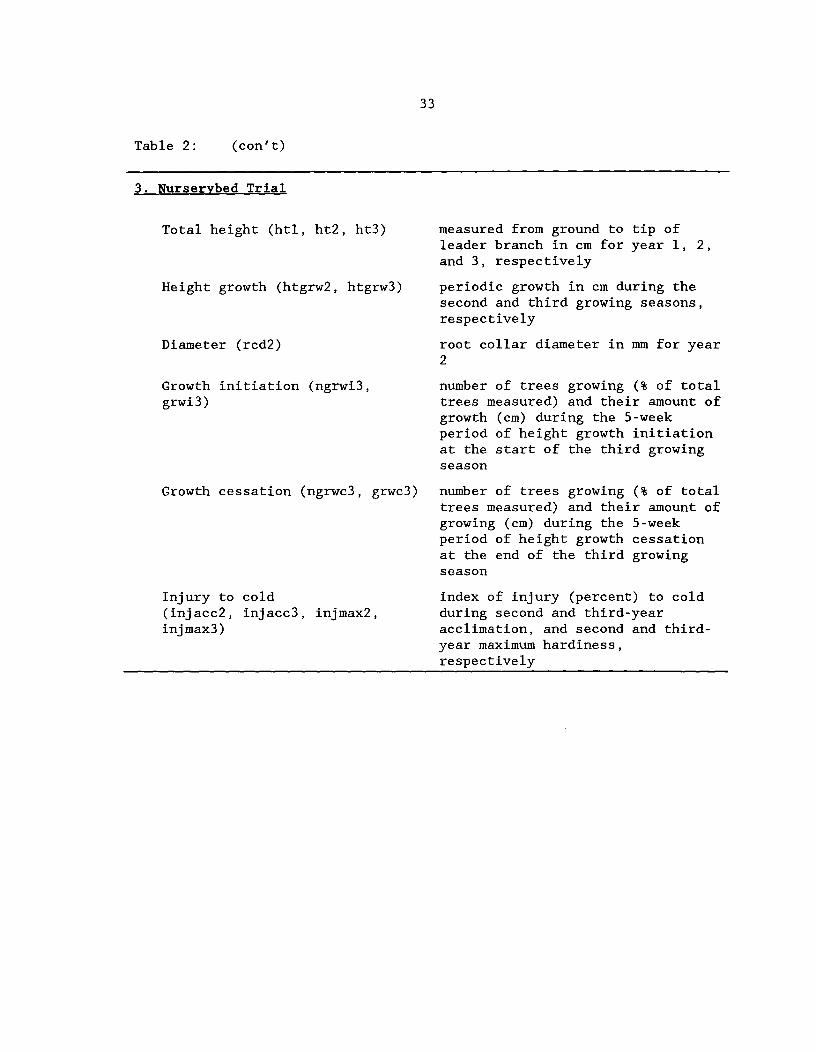
33
Table 2:^(con't)
3. Nurserybed Trial
Total height (htl, ht2, ht3)^measured from ground to tip ofleader branch in cm for year 1, 2,and 3, respectively
Height growth (htgrw2, htgrw3)^periodic growth in cm during thesecond and third growing seasons,respectively
Diameter (rcd2)^ root collar diameter in mm for year2
Growth initiation (ngrwi3,^number of trees growing (% of totalgrwi3)^ trees measured) and their amount of
growth (cm) during the 5-weekperiod of height growth initiationat the start of the third growingseason
Growth cessation (ngrwc3, grwc3) number of trees growing (% of totaltrees measured) and their amount ofgrowing (cm) during the 5-weekperiod of height growth cessationat the end of the third growingseason
Injury to cold^ index of injury (percent) to cold(injacc2, injacc3, injmax2,^during second and third-yearinjmax3)^ acclimation, and second and third-
year maximum hardiness,respectively
34
2.2.4 Statistical Analyses
2.2.4.1 First-year greenhouse trial
a) genetic architecture
A generalized logistic equation was fitted to individual seedlings for
periodic height over the growing season to determine if the time to maximum
growth rate differed among populations and families within populations. The
generalized logistic equation used was:
y=a/(d+eb')^ (2.2)
where,
= seedling height (cm);
= time from first measurement (weeks);
a,b,c,d = equation parameters.
SAS Proc NLIN (SAS Inst. 1985) was used to fit the nonlinear regression
to the data. Since this procedure is iterative, choosing starting values for
the four parameters was necessary. Equation 2.2 was linearized as follows:
log. (a/y - d) = b-cx.^ (2.3)
For each individual seedling, a was set to ht0.12 and d to 1 and linear
regression analysis performed using SAS Proc REG (SAS Inst. 1985) to estimate
starting values for b and c (intercept and slope). Nonlinear regression was
then used to fit the logistic equation for each individual seedling using
starting values of a=ht0.12, d-1, and b=intercept and c=slope from the above
linear regression analysis. The coefficient of determination (R2) was checked
for each curve to ensure a reasonable fit was achieved (R2>.90). The
inflection point (inflec) defined as b/c, measured in weeks from first
measurement (ht0.1), was used for determining time to maximum growth rate.
35
Analyses of variance were performed on the 26 populations with family
structure, using SAS Proc GLM, Type I sums of squares (SAS Instit. 1985) for
inflec, ht0.12, rcdl and grwc1 according to the following model:
Yijkl= U + Pi + F.^J(P.) + Rk(F.(P.)) + e (^)1^(2.4)J
where,
overall mean;
effect of the ith population;
effect of the jth family within the ith population;
effect of the kth replication within the jth
family within the ith population
e(k)1^— random error associated with measurement of
individual seedlings.
All main effects were considered random. Estimation of variance components
was performed using SAS Varcomp (SAS Instit. 1985) according to expected mean
squares, presented for a completely balanced model, in Table 3. Narrow-sense
heritabilities, the ratio of additive genetic variance to total phenotypic
variance, were calculated according to:
1,2 = 1,„.2^/I 2^ ,2ns^f(p)/^f(p)^r(f(p))
where,
(2.5)
= family(population) variance component;
= replication(family(population)) variance
component;
= error variance component.a2
=
Pi =
F3(P1) =
Rk(Fi(Pi)) =
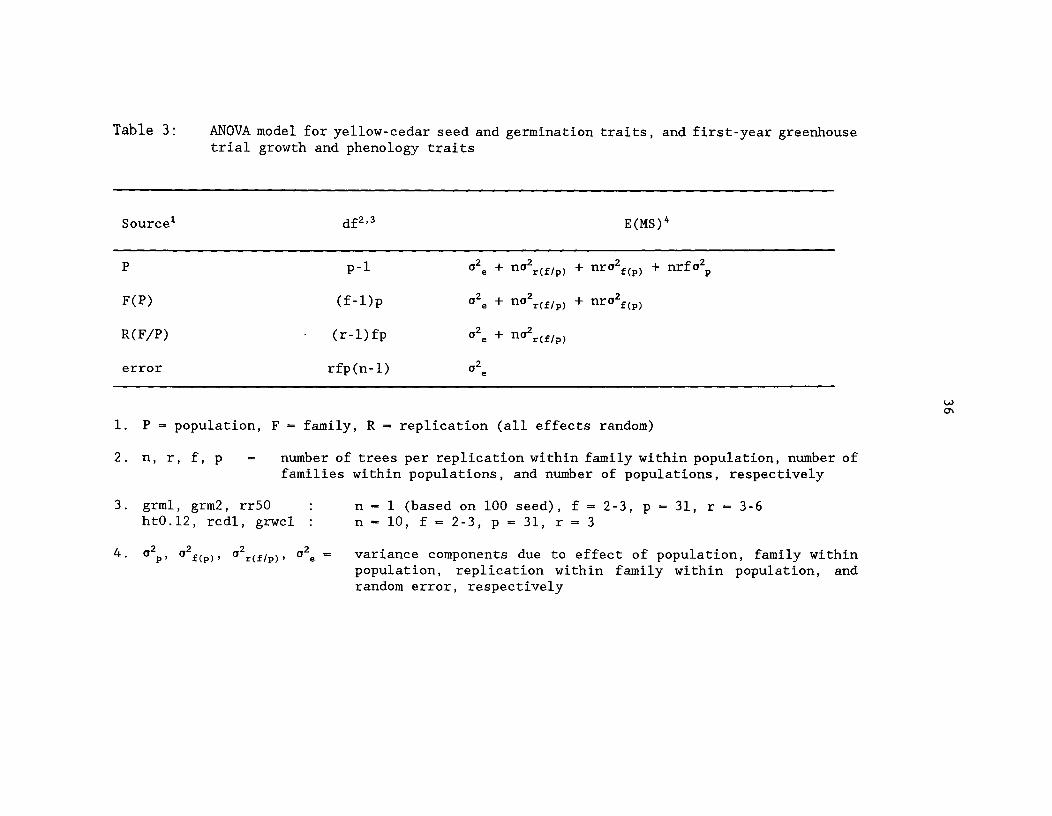
Table 3:^ANOVA model for yellow-cedar seed and germination traits, and first-year greenhousetrial growth and phenology traits
Sourcel^
df2,3^
E(MS)4
p-1
F(P)^ (f-1)p
R(F/P)^ (r-l)fp
error^ rfp(n-1)
a2e -I- na2 (f/ )^nra2f( )^nrLr a2r p
02e ± na2r(f/p)^nra2f(p)
n2 „2e ' "- r(f/P)
1. P — population, F = family, R — replication (all effects random)
2. n, r, f, p
-^
number of trees per replication within family within population, number offamilies within populations, and number of populations, respectively
3. grml, grm2, rr50
•^
n^1 (based on 100 seed), f — 2-3, p = 31, r = 3-6
^
ht0.12, rcdl, grwcl :^n — 10, f — 2-3, p = 31, r — 3
4 02p, 02 f(p)
02 ru/p), a
2e = variance components due to effect of population, family within,
population, replication within family within population, andrandom error, respectively
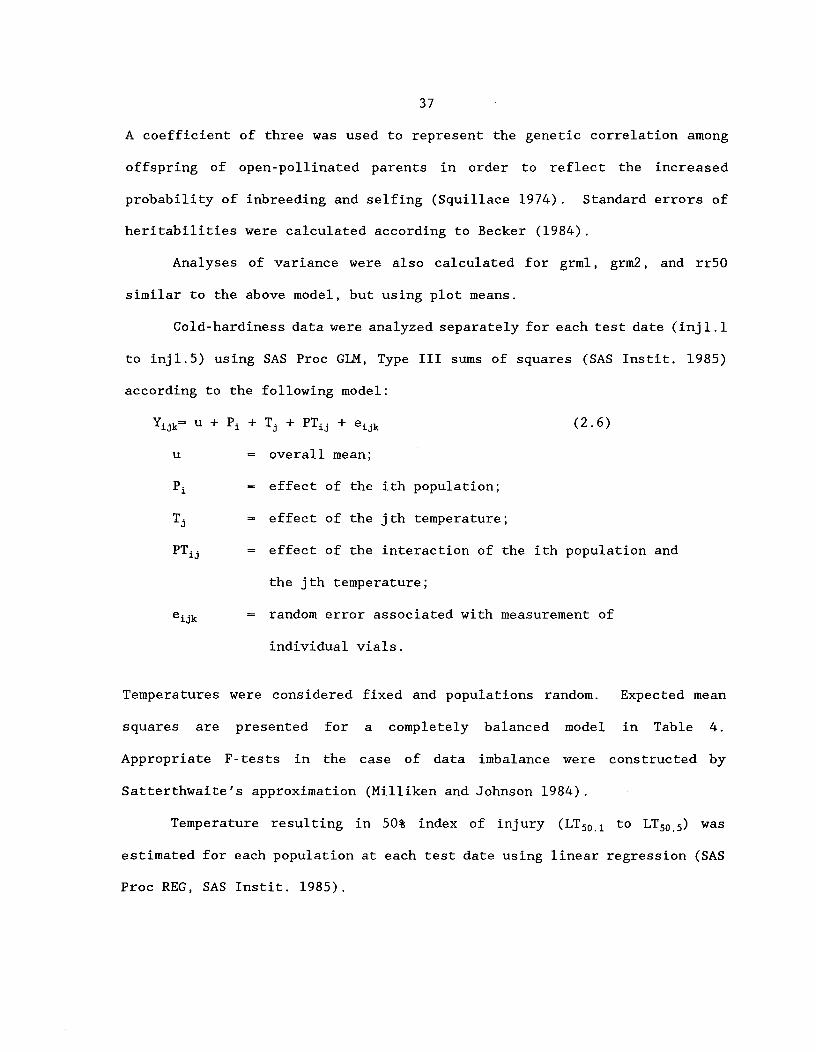
37
A coefficient of three was used to represent the genetic correlation among
offspring of open-pollinated parents in order to reflect the increased
probability of inbreeding and selfing (Squillace 1974). Standard errors of
heritabilities were calculated according to Becker (1984).
Analyses of variance were also calculated for grml, grm2, and rr50
similar to the above model, but using plot means.
Cold-hardiness data were analyzed separately for each test date (inj1.1
to inj1.5) using SAS Proc GLM, Type III sums of squares (SAS Instit. 1985)
according to the following model:
Yijk= U + Pi + T3 ^+^ (2.6)PTij^eijk
= overall mean;
Pi^— effect of the ith population;
— effect of the jth temperature;
= effect of the interaction of the ith population and
the jth temperature;
eijk^= random error associated with measurement of
individual vials.
Temperatures were considered fixed and populations random. Expected mean
squares are presented for a completely balanced model in Table 4.
Appropriate F-tests in the case of data imbalance were constructed by
Satterthwaite's approximation (Milliken and Johnson 1984).
Temperature resulting in 50% index of injury (LT50.1 to LT50.5) was
estimated for each population at each test date using linear regression (SAS
Proc REG, SAS Instit. 1985).
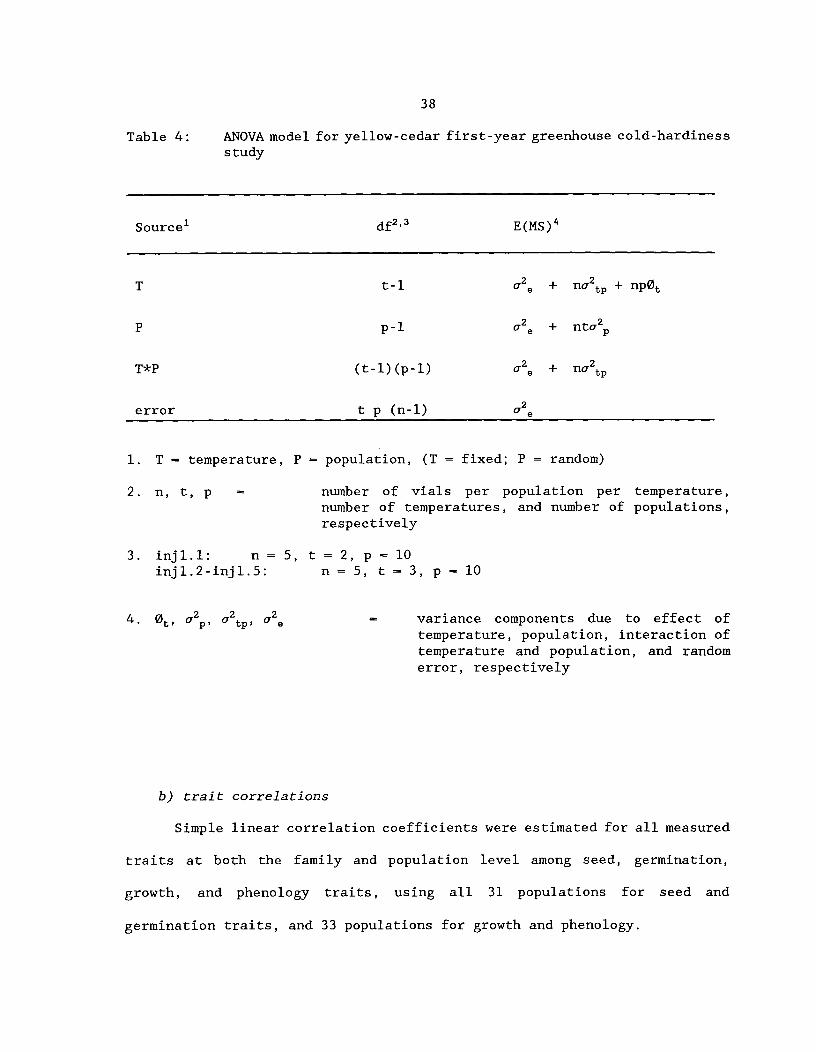
38
Table 4:^ANOVA model for yellow-cedar first-year greenhouse cold-hardinessstudy
Sourcel^ df"^E(MS)4
T^ t-1^a2e + no-2tp + npOt
P^ p-1^a-2e + nta2 P
T*P^ (t-1)(p-1)^a2, 4- 11(12tp
error^ t p (n-1)^0.2 e
1. T — temperature, P — population, (T — fixed; P = random)
2. n, t, p —^ number of vials per population per temperature,
number of temperatures, and number of populations,respectively
3. inj1.1:^n = 5, t — 2, p — 10inj1.2-inj1.5:^n = 5, t — 3, p — 10
4. 0t ) 0 p' a2 tp, a2e^—^variance components due to effect of
temperature, population, interaction oftemperature and population, and randomerror, respectively
b) trait correlations
Simple linear correlation coefficients were estimated for all measured
traits at both the family and population level among seed, germination,
growth, and phenology traits, using all 31 populations for seed and
germination traits, and 33 populations for growth and phenology.
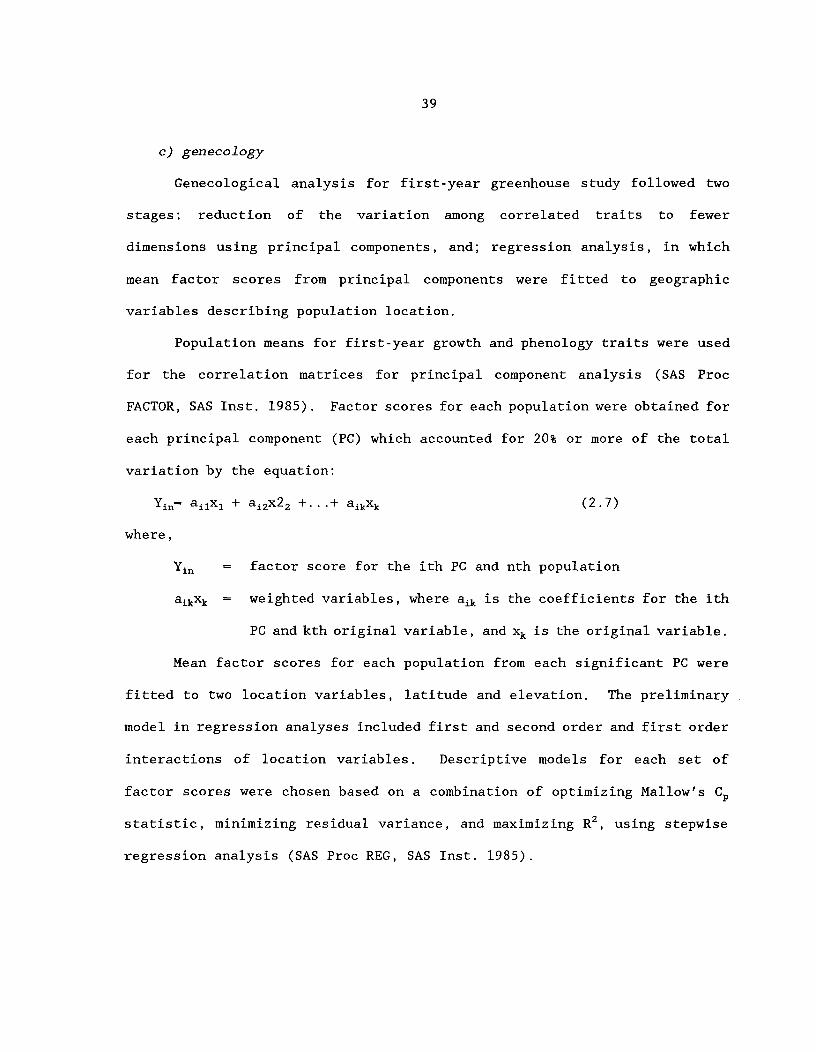
39
c) genecology
Genecological analysis for first-year greenhouse study followed two
stages: reduction of the variation among correlated traits to fewer
dimensions using principal components, and; regression analysis, in which
mean factor scores from principal components were fitted to geographic
variables describing population location.
Population means for first-year growth and phenology traits were used
for the correlation matrices for principal component analysis (SAS Proc
FACTOR, SAS Inst. 1985). Factor scores for each population were obtained for
each principal component (PC) which accounted for 20% or more of the total
variation by the equation:
Yin= a 11x1 + a12x22 + • . .+ aikxk^ (2.7)
where,
Yin^= factor score for the ith PC and nth population
aikxk = weighted variables, where aik is the coefficients for the ith
PC and kth original variable, and xk is the original variable.
Mean factor scores for each population from each significant PC were
fitted to two location variables, latitude and elevation. The preliminary
model in regression analyses included first and second order and first order
interactions of location variables. Descriptive models for each set of
factor scores were chosen based on a combination of optimizing Mallow's Cp
statistic, minimizing residual variance, and maximizing R2, using stepwise
regression analysis (SAS Proc REG, SAS Inst. 1985).
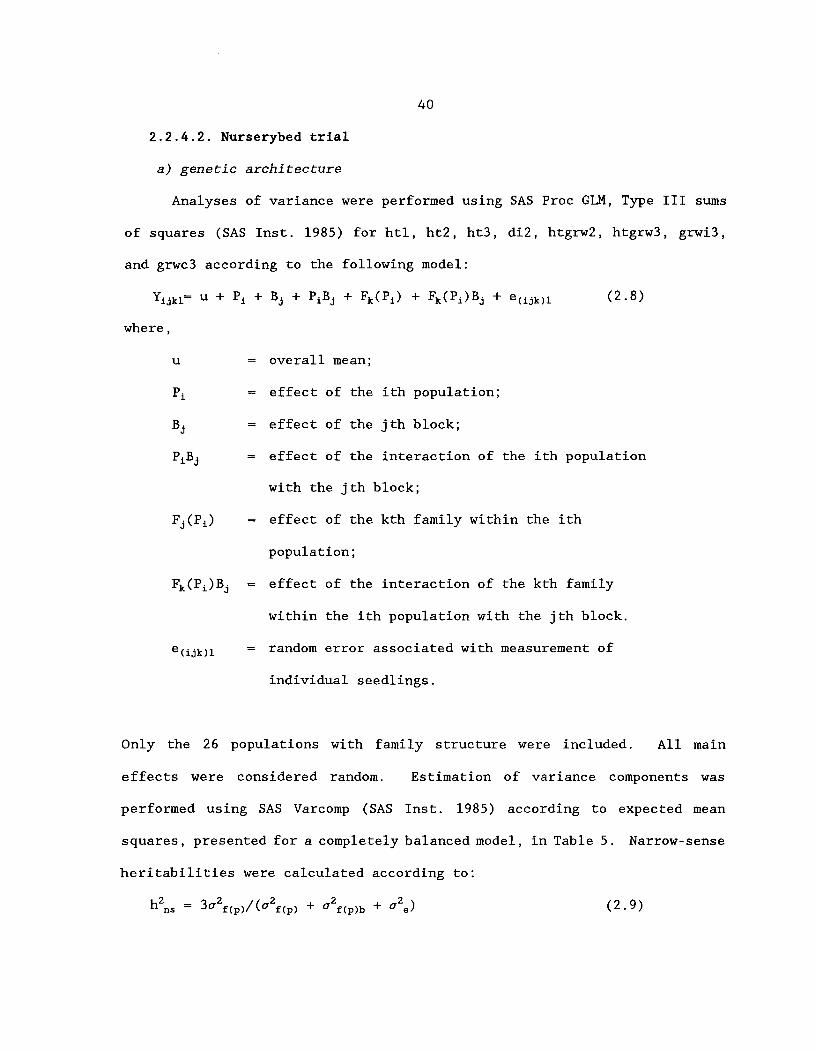
40
2.2.4.2. Nurserybed trial
a) genetic architecture
Analyses of variance were performed using SAS Proc GLM, Type III sums
of squares (SAS Inst. 1985) for htl, ht2, ht3, di2, htgrw2, htgrw3, grwi3,
and grwc3 according to the following model:
Yijki= U^Pi + Bj + PiBj + Fk(Pi) + Fk(POBj +^(2.8)
where,
— overall mean;
Pi^— effect of the ith population;
Bj^= effect of the jth block;
PiBj^— effect of the interaction of the ith population
with the jth block;
F(P1)^— effect of the kth family within the ith
population;
Fk(POBj — effect of the interaction of the kth family
within the ith population with the jth block.
— random error associated with measurement of
individual seedlings.
Only the 26 populations with family structure were included. All main
effects were considered random. Estimation of variance components was
performed using SAS Varcomp (SAS Inst. 1985) according to expected mean
squares, presented for a completely balanced model, in Table 5. Narrow-sense
heritabilities were calculated according to:
1,2^= 1,„.2^_2" ns^
_2f(p)/ ku f(p)
, u f(p)b ,
^ei (2.9)
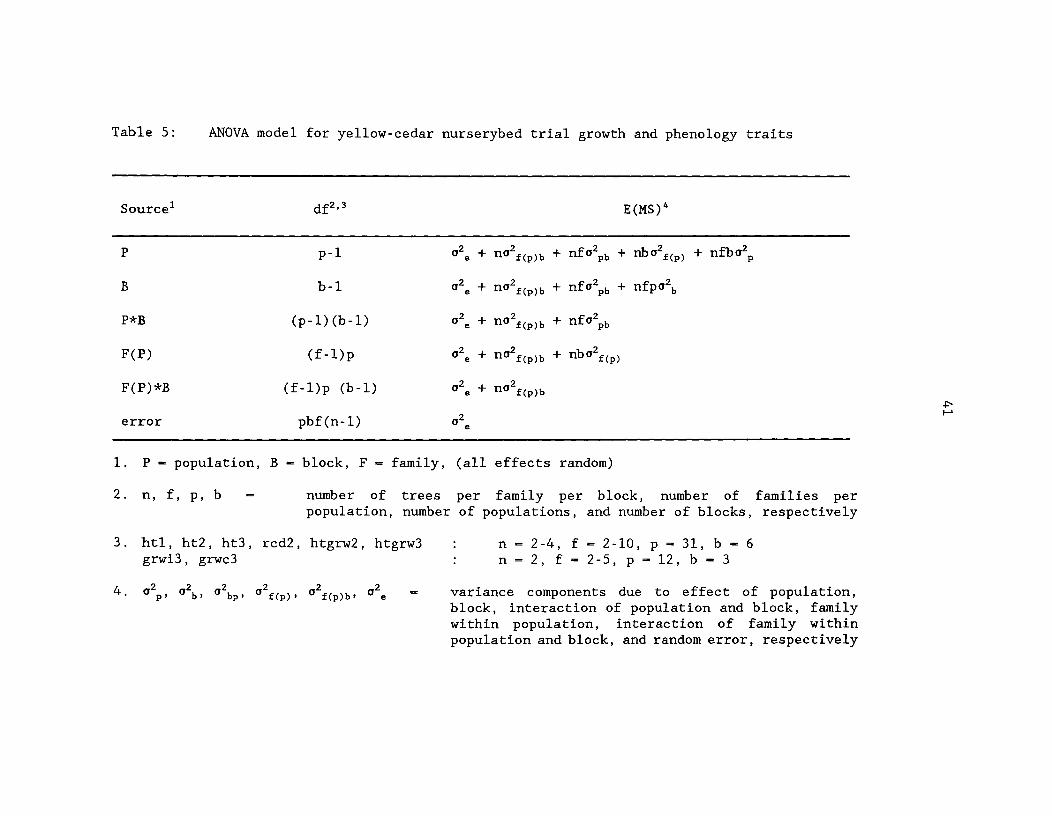
Table 5:^ANOVA model for yellow-cedar nurserybed trial growth and phenology traits
Source'^ df2'3^ E(MS)4
P p-1 ^,_ „,2-.-e...^ _LI,/ .• •• +^_ 0 b^ 2Pt(P)b^nf 2p + nba2f (0 ± nfb0
B b-1^a2e + n02f(p)b + nfa2pb + nfpa2b
P*B^ (p-1) (b-1)^02e + n02f(r)b + nfa2pb
F(P)^ (f-1)p^a2e + na2f(ob + nba2f(p)
F(P)*B^(f-1)p (b-1) ^,_ ,,,2s' e ' ''''' f(p)b
error^pbf(n-1)^02e
1. P - population, B - block, F - family, (all effects random)
2. n, f, p, b^number of trees per family per block, number of families perpopulation, number of populations, and number of blocks, respectively
3. htl, ht2, ht3, rcd2, htgrw2, htgrw3^n = 2-4, f - 2-10, p - 31, b - 6grwi3, grwc3^ n = 2, f^2-5, p = 12, b - 3
4. ,2p ,2,^b; n2
^02bp,^f(p), a2 f(p)131 a
2e
-^
variance components due to effect of population,block, interaction of population and block, familywithin population, interaction of family withinpopulation and block, and random error, respectively

where,
C f(p)
U f(p)b
a2
42
= family(population) variance component;
= interaction of family(population) and block
variance component;
— error variance component.
A coefficient of three was used to represent the genetic correlation among
offspring of open-pollinated parents in order to reflect the increased
probability of inbreeding and selfing (Squillace 1974). Standard errors of
heritabilities were calculated according to Becker (1984).
Analyses of variance were performed for index of injury from the November
test (injacc2) and from the December test (injmax2) using SAS Proc GLM Type
III sums of squares (SAS Inst. 1985) according to the following model:
Yijki= U^Ti + Pa + Fk(Pa) + TiPa + TiFk(P)a + e (ijk )1(2.10)
where,
— mean;
Ti^— effect of the ith temperature;
Pa^— effect of the jth population;
Fk(Pa)^= effect of the kth family within the jth
population;
TiPa^= effect of the interaction of the ith temperature by the jth
population;
TiFk(P)a = effect of the interaction of the ith temperature by the kth
family within the jth population;
e(ijk)1^= random error associated with measurement of
individual vials.
43
Temperature was considered fixed and populations and families within
populations, random. Appropriate F-tests were constructed using
Satterthwaite's approximation (SAS Inst. 1985).
Estimation of variance components was performed using SAS Varcomp (SAS
Inst. 1985) according to expected mean squares, presented for a completely
balanced model, in Table 6. Narrow-sense heritabilities were calculated as:
-L2 __ 0 2^ii 2^ +^e)a2n ns "'a f(p)/ ka f(P) + a2 t*f(p)
where,
(2.11)
2Cr f(p)^— family(population) variance component;
,...2u tf(p)^— interaction of temperature and
family(population) variance component;
a2e^— error variance component.
b) trait correlations
Simple linear correlation coefficients were estimated for all measured
traits at both the family and population level among growth, phenology and
cold-hardiness traits.
Index of injury at -12° C for injacc2, and at -24° C for injmax2 were
used for calculating population and family within population means for trait
correlations.
Population means for index of injury at -12° C for injacc3, and at -18°
C for injmax3 were calculated and used for correlations with growth and
phenology traits, and with geographic descriptors of population origin.

44
Table 6:^ANOVA model for second-year nurserybed cold-hardiness study
Source 1^
df2,3^
E(MS)4
T^ t-1^a2, + ri72tf(p) + nfa2tp + nfpOt
P^ p-1 ra2, + nta2f(p) + ntEa2p
T*P^ (t-1)(p-1)^a2, + riCi2tf(p) + nfa2tp
F(P)^ (f-1)(P)^a2, + nta2f(p)
T*F(P)^(t-1)(f-1)(p)^a2 . + na2tf(p)
error^ tpf(n-1)
1. T — temperature, P — population, F = family, (T — fixed; P, F(P) =random)
2. t = number of temperatures, p — number of populations, f — number offamilies per population, n = number of vials per family per populationper temperature
3. November test:^t = 2, p = 20, f — 2-3, n — 4, error df — 352January test:^t = 2, p = 14, f — 2-3, n — 5-6, error df — 390
4. fA^,...2^„.2^„.2^,...2^,...2wft., '-' p, '-' tp t '-' f(p) ) ' tf(p) ' ' e —^variance components due to effect
of^temperature,^population,interaction of temperature withpopulation,^family^withinpopulation,^interaction^oftemperature with family withinpopulation, and random error,respectively
c) genecology
Genecological analyses were performed as outlined in Section
2.2.4.1.c). Growth and phenology data from the nurserybed trial, and third-
year cold-hardiness traits were separated into two groups for genecological
statistical analyses according to genetic structure (common populations and
families within populations) and to biological interpretability. Group 1
included growth and cold-hardiness traits from all 33 populations with the
objective of exploring the relationships between growth, cold-hardiness, and
45
seed source descriptors. Traits included were those that described
vegetative growth during the field portion of the trial (third-year height
(ht3), second-year diameter (di2), and annual height growth during the 2
years in the nurserybed (htgrw2, htgrw3) and cold-hardiness (index of injury)
during acclimation (injacc3) and at maximum hardiness (injmax3), after the
third growing season. All 33 populations were used.
The objective of Group 2 was to investigate the relationships between
phenology, cold-hardiness, and seed source descriptors. Traits used were
number of seedlings growing and their total amount of growth during third-
year growth initiation (ngrwi3, grwi3) and cessation (ngrwc3, grwc3) and
cold-hardiness during acclimation (injacc3) and during assumed maximum
hardiness (injmax3), after the third-year growing season. Fourteen
populations were used in the analysis.
Population means were used in the correlation matrices for principal
component analyses. Factor scores from all factors that accounted for more
than 20% of the variation were used for regressing on first and second order
independent traits and first order interactions. Descriptive models for each
set of factor scores were chosen based on a combination of optimizing
Mallow's Cp statistic, minimizing residual variance, and maximizing R2, using
stepwise regression analysis (SAS Inst. 1985).
2.3 RESULTS AND DISCUSSION
2.3.1 Genetic Architecture
a) seed and germination
Collection, stratification, and germination of the seed was completed
without any major problems. Germination percentage, after adjusting for
number of filled seeds, averaged 61.5% for the first year and 29.8% for the

46
second year (Table 7). Seed and germination traits including percent filled
seed (fseed), weight of filled seed (wfseed), speed of germination (rr50),
and completeness of germination over the first and second years (grml, grm2)
varied relatively more as compared to growth and phenology traits, based on
the coefficients of variation (Table 7).
Variation in germination traits was statistically significant at the
family within population level only (Table 8). Differences among populations
accounted for 0.0% to 12.7% of total variation for rr50 and grml,
respectively, whereas, differences among families within populations
accounted for 63.6% (rr50) to 68.3% (grm2) (Table 8). Figure 1 illustrates
family variation among populations in rr50. Considerable family variation in
completeness of germination and rate of emergence has been shown in coastal
Douglas-fir (St. Clair and Adams 1991, El Kassaby et al. 1992), Scots pine
(Mikola 1984), and Virginia pine (Bramlett et al. 1983).
b) growth and phenology
The seedlings grew well in the greenhouse over the course of the first-
year averaging 16.3 cm in height and 3.00 mm in diameter (Table 7) and during
the course of the nurserybed trial, averaging around 70 cm in height after 3
years (Table 9). Survival was 100% in the nurserybed and all seedlings were
healthy. Substantial variation was evident for all traits measured (Tables
7 and 9). Growth and phenology traits such as amount of shoot growth during
first-year growth cessation (grwcl), height growth during the second and
third year in the nurserybed (htgrw2, htgrw3), and number of seedlings
growing during the period of vegetative growth cessation after the third
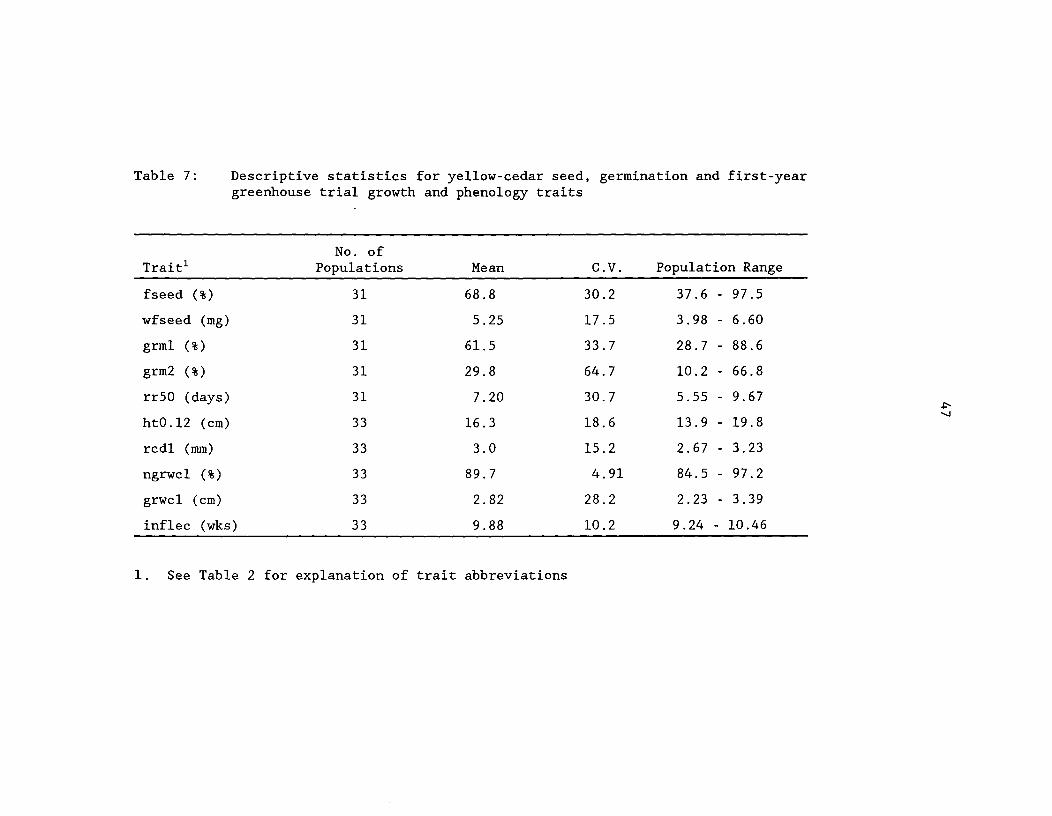
Table 7:^Descriptive statistics for yellow-cedar seed, germination and first-yeargreenhouse trial growth and phenology traits
Trait'No.^of
Populations^Mean C.V. Population Range
fseed (%) 31 68.8 30.2 37.6^-^97.5
wfseed (mg) 31 5.25 17.5 3.98^-^6.60
grml (%) 31 61.5 33.7 28.7^-^88.6
grm2 (%) 31 29.8 64.7 10.2^-^66.8
rr50 (days) 31 7.20 30.7 5.55^-^9.67
ht0.12^(cm) 33 16.3 18.6 13.9^-^19.8
rcdl (mm) 33 3.0 15.2 2.67^-^3.23
ngrwcl (%) 33 89.7 4.91 84.5^-^97.2
grwc1 (cm) 33 2.82 28.2 2.23^-^3.39
inflec (wks) 33 9.88 10.2 9.24^-^10.46
1. See Table 2 for explanation of trait abbreviations

Table 8: Variance components (% of total), statistical significance of differencesamong means, heritabilities (h2) and standard errors of heritability(s.e.) for yellow-cedar first-year greenhouse trial germination, growthand phenologytraits
Trait' % of total variance components h2ns (s.e.)
Pop Fam (Pop) Rep (Fam) Error
rr50 0.02 63.6 *** 36.4
grml 12.7 64.4 *** 22.9
grm2 3.7 69.3 *** 27.1
ht0.12 2.2 22.4 *** 1.5 *** 73.8 0.69 0.17
inflec 2.3 12.1 *** 1.3 *** 84.3 0.37 0.11
rcd1 2.2 9.8 *** 1.0 87.0 0.30 0.10
grwcl 0.6 19.1 *** 1.5 *** 78.8 0.58 (0.15)
1. See Table 2 for explanation of trait abbreviations2. Probability levels: * p<.05; ** p<.01; *** p<.001
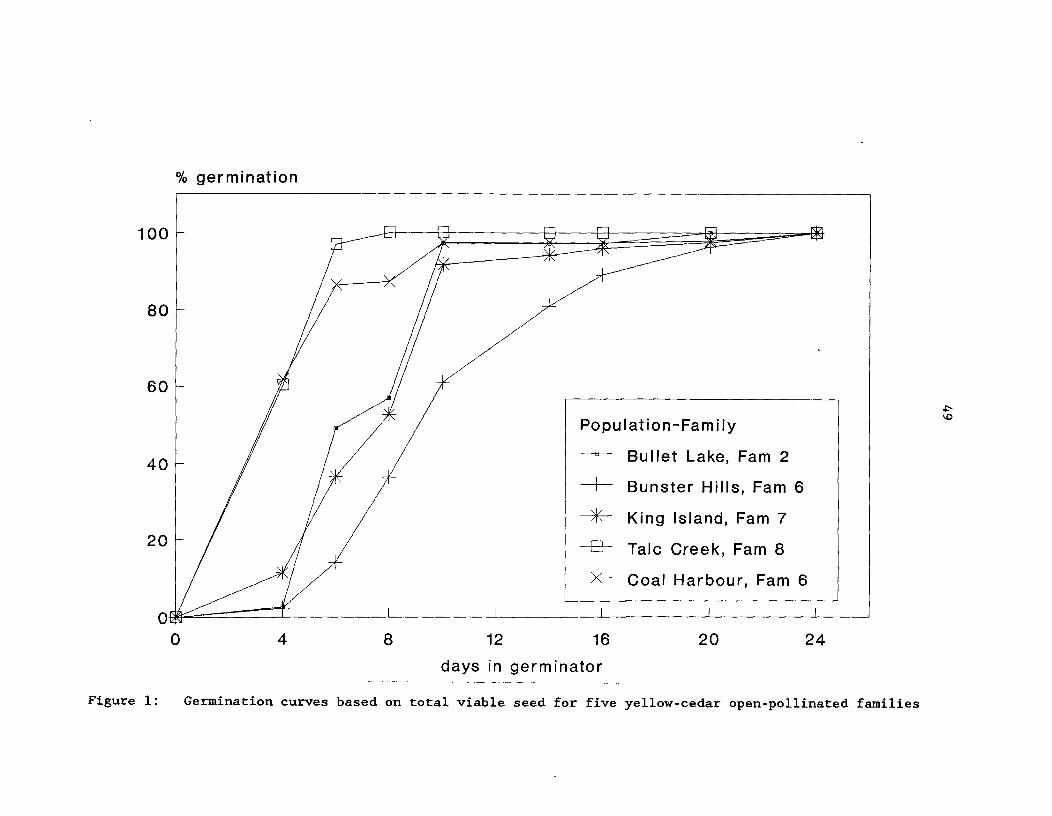
Population-Family
^ Bullet Lake, Fam 2
I^ Bunster Hills, Fam 6
^ King Island, Earn 7
—E^ Talc Creek, Earn 8
—›- Coal Harbour, Earn 6
% germination
0^
4^
8^12^16^
20^
24
days in germinator
Figure 1:^Germination curves based on total viable seed for five yellow-cedar open-pollinated families

Table 9:^Descriptive statistics for yellow-cedar nurserybed trial seedling growth, phenology, andcold-hardiness traits
Trait'
No. of FamiliesNo. of^per
Populations^Population Mean C.V.Population
Range
htl (cm) 33 2-10 18.8 18.7 16.5^-^21.1
ht2 (cm) 33 2-10 39.1 20.0 30.1^- 43.3
ht3 (cm) 33 2-10 70.3 19.2 61.4^-^75.3
rcd2 (mm) 33 2-10 5.86 17.3 5.41^-^6.72
htgrw2(cm) 33 2-10 20.3 31.8 13.2^-^22.5
htgrw3 (cm) 33 2-10 31.2 26.5 21.6^-^34.0 ui0
ngrwi3 (%) 14 3 36.1 12.9 24.9^-^42.2
grwi3 (cm) 14 3 2.78 10.8 2.45^-^3.15
ngrwc3 (%) 14 3 37.8 30.6 14.4^-^55.6
grwc3 (cm) 14 3 2.20 14.7 1.52^-^2.70
injacc2 (%) 20 3 40.3 24.9 34.7^-^46.0
injmax2 (%) 14 2-3 34.8 16.7 29.0^- 40.5
injacc3 (%) 33 2-5 40.9 16.8 26.3^-^55.6
injmax3 (%) 33 2-5 40.1 16.6 29.6^-^52.0
1. See Table 2 for explanation of trait abbreviations
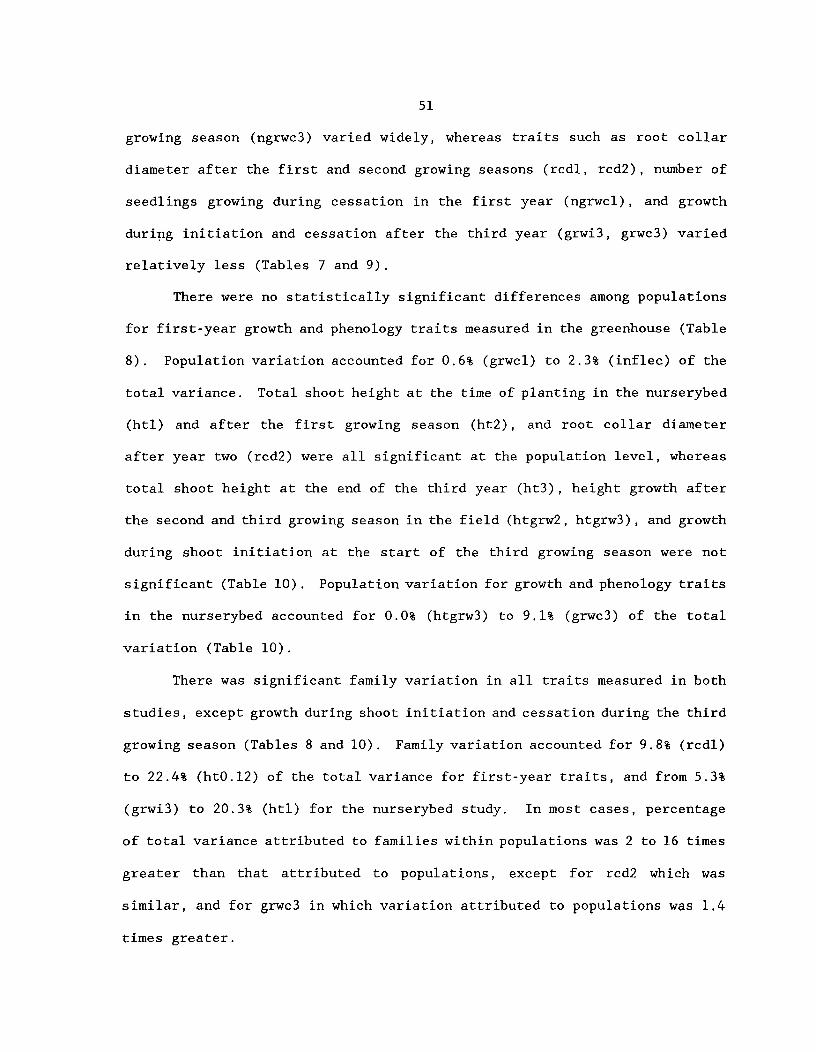
51
growing season (ngrwc3) varied widely, whereas traits such as root collar
diameter after the first and second growing seasons (rcdl, rcd2), number of
seedlings growing during cessation in the first year (ngrwcl), and growth
during initiation and cessation after the third year (grwi3, grwc3) varied
relatively less (Tables 7 and 9).
There were no statistically significant differences among populations
for first-year growth and phenology traits measured in the greenhouse (Table
8). Population variation accounted for 0.6% (grwcl) to 2.3% (inflec) of the
total variance. Total shoot height at the time of planting in the nurserybed
(htl) and after the first growing season (ht2), and root collar diameter
after year two (rcd2) were all significant at the population level, whereas
total shoot height at the end of the third year (ht3), height growth after
the second and third growing season in the field (htgrw2, htgrw3), and growth
during shoot initiation at the start of the third growing season were not
significant (Table 10). Population variation for growth and phenology traits
in the nurserybed accounted for 0.0% (htgrw3) to 9.1% (grwc3) of the total
variation (Table 10).
There was significant family variation in all traits measured in both
studies, except growth during shoot initiation and cessation during the third
growing season (Tables 8 and 10). Family variation accounted for 9.8% (rcdl)
to 22.4% (ht0.12) of the total variance for first-year traits, and from 5.3%
(grwi3) to 20.3% (htl) for the nurserybed study. In most cases, percentage
of total variance attributed to families within populations was 2 to 16 times
greater than that attributed to populations, except for rcd2 which was
similar, and for grwc3 in which variation attributed to populations was 1.4
times greater.

Table 10:^Variance components (% of total), statistical significance of differences among means, andheritabilities (h2n.s.) and standard error of heritability (s.e.) for yellow-cedarnurserybed trial growth and phenology traits
Traitl % of total variance components h2n.5 .(s.e.)
Pop Pop *Blk
Fam (Pop) Fam (Pop)* Blk
Error
htl 4.7 ***2 0.0 20.3 *** 17.8 *** 57.0 0.64 (.098)
ht2 3.6 *** 1.4 13.8 *** 13.2 *** 68.0 0.44 (.073)
ht3 1.0 1.5 10.0 *** 21.8 *** 65.6 0.31 (.066)
rcd2 5.1 *** 0.0 5.3 *** 17.0 *** 72.5 0.17 (.046)
htgrw2 0.9 * 1.9 * 10.0 *** 13.5 *** 73.6 0.31 (.58)
htgrw3 0.0 2.4 * 7.7 *** 25.4 *** 64.5 0.24 (.59)
grwi3 2.8 0.0 5.3 8.5 82.3 0.16 (.20)
grwc3 6.8 2.8 6.6 7.4 83.8 0.20 (.21)
1. See Table 2 for explanation of trait abbreviations2. Probability levels: * p<.05; ** p<.01; *** p<.001

53
In the nurserybed trial, there were significant block by family within
population interactions for all growth traits, except height growth during
shoot initiation and cessation. Thus, although there were significant family
within population main effects, these are not strictly interpretable. Given
that there was a significant block by family within popoulation interaction
for htl (i.e. seedlings had just been randomized and planted, and height
measurements taken prior to growth), significant block interactions are a
result of test design (i.e. large number of blocks and small plot size).
The distribution of genetic variability in seedling traits of yellow-
cedar appears to be intermediate between specialists such as Douglas-fir
(Griffin and Ching 1977, Rehfeldt 1984, Fashler et al. 1985) in which greater
variability can be attributed to among populations than within, and
generalists such as western white pine (Rehfeldt 1979, 1984) in which most of
the variation occurs within populations, when comparing seed from range-wide
sources.
Narrow-sense heritabilities varied from 0.30 (rcd1) to 0.69 (ht0.12)
for first year traits in the greenhouse, and from 0.16 (grwi3) to 0.64 (htl)
in the nurserybed (Tables 8 and 10). Similar levels and patterns of
heritability for early growth traits of Pacific Northwest conifers have been
reported elsewhere (Namkoong and Conkle 1976, Franklin 1979, Fashler et al.
1985).
Heritabilities decreased by 0.33 from first-year height to third-year
height in the nurserybed. Decreasing heritabilities in early growth traits
have been reported elsewhere (Namkoong and Conkle 1976, Franklin 1979,
Fashler et al. 1985). This decrease has been attributed to either an
increase in environmental variances (Franklin 1979), an increase in variation
due to population effects (Namkoong and Conkle 1976, Fashler et al. 1985), or

54
to a decrease in additive genetic variation (Gill 1987). The major influence
in the reduction of heritability for height from year one to year three in
this study was due to a reduction in additive genetic variation. The
decrease in additive genetic variation could be attributable to the onset of
competition since seedlings were planted at close spacings in the nurserybed,
(Foster 1986), or to photoperiodic effects due to displacement of seedlings
from their native environment (Morgenstern pers. comm.).
c) cold-hardiness
Significant differences among populations, temperatures and the
interaction of temperature and populations were evident from cold-hardiness
testing during acclimation after the first growing season (Table 11). A
typical curvilinear response of increasing cold-hardiness with increasing
degree-hours below 5° C was apparent (Figure 2), and has been reported
elsewhere for yellow-cedar (Silim 1991, Arnott et al. 1992), and for western
redcedar, another indeterminate species associated with yellow-cedar at lower
elevations (Silim 1991, Folk et al. 1993). Populationshardenedat different
rates during the acclimation period and reached different LT50's at maximum
hardiness in January (Table 12 and Figure 2), accounting for the significant
temperature by population interaction.
There were significant differences among temperatures,
family(populations) and temperature by family(populations) for index of
injury for the November 1991 cold-hardiness test after the first growing
season in the nurserybed (Table 13). Significant genetic variability was
evident at both the population and family within population level at maximum
hardiness (January 1991 test) (Table 13). Narrow-sense heritabilities were
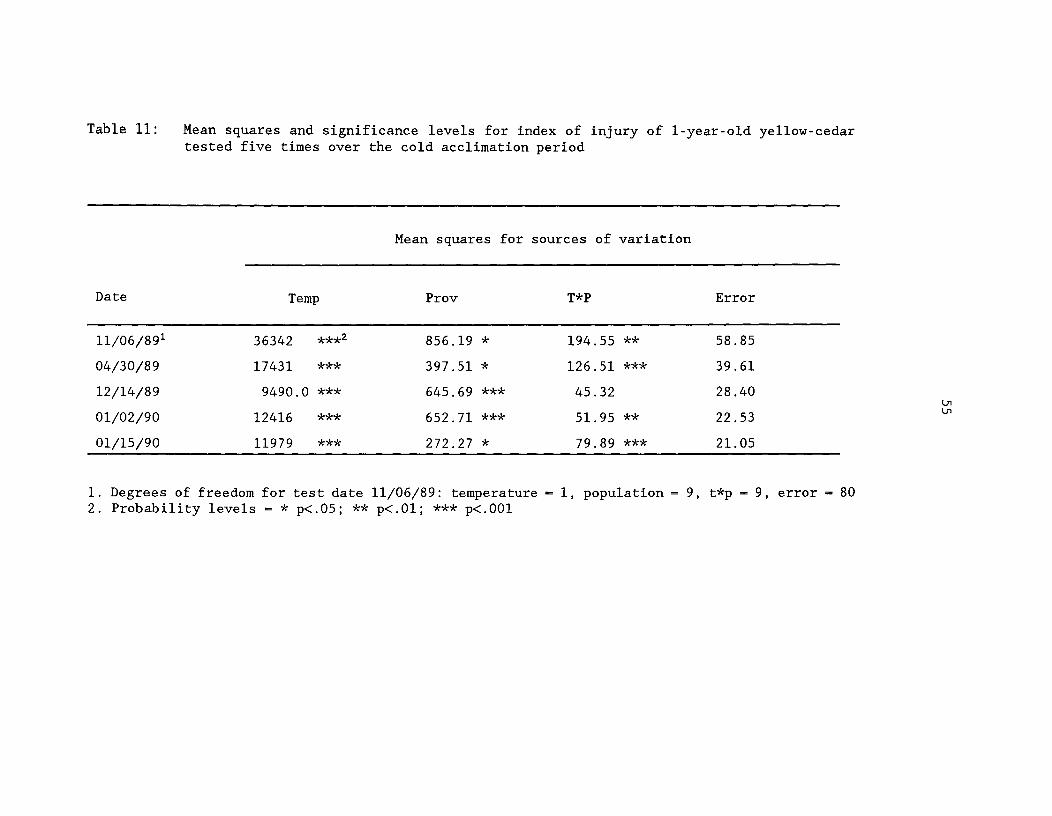
Table 11:^Mean squares and significance levels for index of injury of 1-year-old yellow-cedartested five times over the cold acclimation period
Mean squares for sources of variation
Date Temp Prov T*P Error
11/06/891 36342 ***2 856.19 * 194.55 ** 58.85
04/30/89 17431 *** 397.51 * 126.51 *** 39.61
12/14/89 9490.0 *** 645.69 *** 45.32 28.40
01/02/90 12416 *** 652.71 *** 51.95 ** 22.53
01/15/90 11979 *** 272.27 * 79.89 *** 21.05
1. Degrees of freedom for test date 11/06/89: temperature = 1, population = 9, t*p = 9, error — 802. Probability levels = * p<.05; ** p<.01; *** p<.001

LT ( °C)50
- 4
- 6
- 8
- 10
- 12
- 14
- 16
- 18
- 20
-224^6^8
hours < 5°C (hundreds)o^2 10
^12
Figure 2: Relationship between LT50 and accumulated hours below 5°C for five cold-hardiness testingdates during the acclimation period for six populations of 1-year-old yellow-cedar seedlings

Table 12:^LT50 values for 1-year-old yellow-cedar from 10 populations for five test dates over the coldacclimation period, and associated number of accumulated degree-hours below 5°C and 0°C atCowichan Lake Research Station
Population' Lat Elev (m) LT50
11/06/89 11/30/89 12/14/89 01/02/90 01/15/90
Kitimat,^B.C. 54°^07' 450 -7.1 -15.4 -17.5 -20.3 -20.8
Kwatna Inlet, B.C. 52°^08' 488 -7.6 -14.0 -18.8 -20.4 -21.2
Holberg,^V.I. 50°^42' 300 -6.9 -14.3 -16.5 -19.5 -21.7
Beaver Cove, V.I. 50°^31' 731 -5.9 -12.6 -15.5 -17.1 -18.8
Squamish,^B.C. 49°^47' 900 -6.7 -15.1 -14.8 -18.3 -19.6
Mt. Washington, V.I. 49°^45' 1200 -6.3 -13.8 -15.8 -18.5 -20.0
Coquihalla, B.C. 49°^37' 1350 -7.4 -15.3 -18.2 -20.7 -21.4
Sparton Lake, V.I. 48°^56' 823 -7.2 -14.7 -17.2 -18.9 -21.1
Mt. Angeles, WA 47°^59' 1750 -5.5 -14.3 -16.3 -19.9 -21.2
White Pass, WA 46°^38' 1350 -3.8 -13.6 -18.0 -18.8 -20.0
number hours s 5°C 159 420 597 849 1061
number hours s 0°C 17 55 100 131 173
1.^B.C. - British Columbia, Canada; V.I. = Vancouver Island, B.C.; WA = Washington, U.S.A.
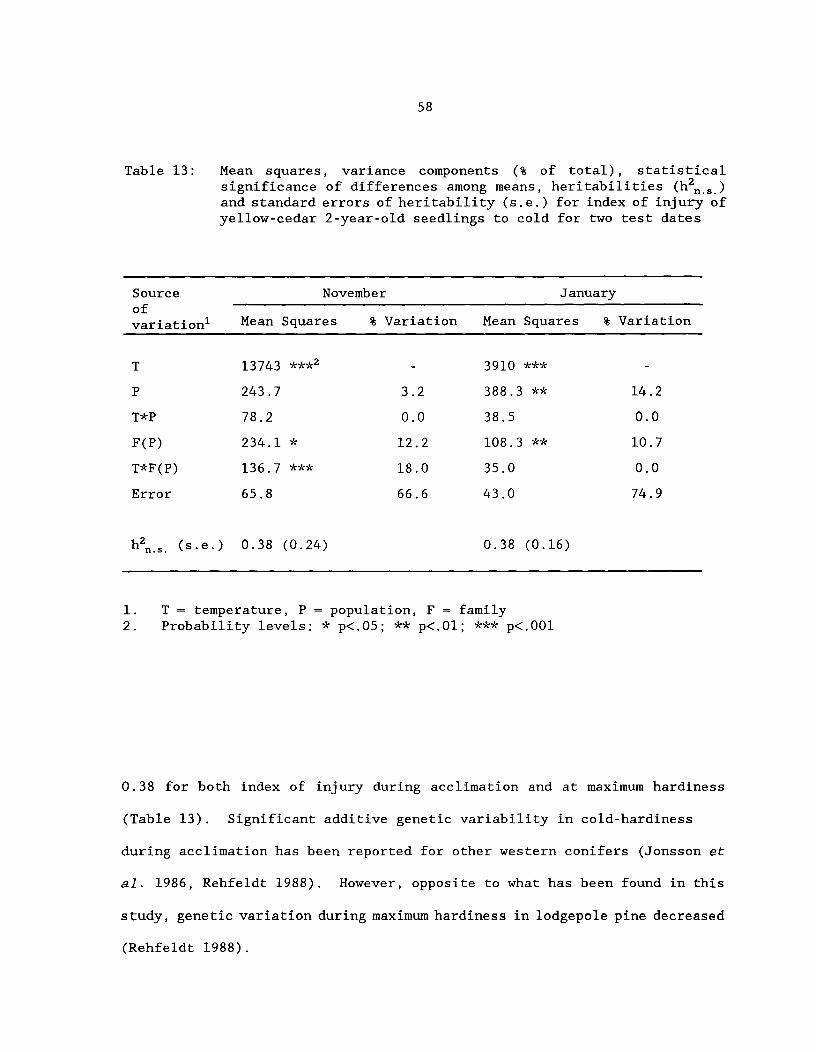
58
Table 13:^Mean squares, variance components (% of total), statisticalsignificance of differences among means, heritabilities (h2n.s.)and standard errors of heritability (s.e.) for index of injury ofyellow-cedar 2-year-old seedlings to cold for two test dates
Sourceofvariationl
November January
Mean Squares % Variation Mean Squares % Variation
T 13743 ***2 - 3910 *** -
P 243.7 3.2 388.3 ** 14.2
T*P 78.2 0.0 38.5 0.0
F(P) 234.1 * 12.2 108.3 ** 10.7
T*F(P) 136.7 *** 18.0 35.0 0.0
Error 65.8 66.6 43.0 74.9
h2r1.5.^(s.e.) 0.38^(0.24) 0.38^(0.16)
1. T = temperature, P = population, F = family2. Probability levels: * p<.05; ** p<.01; *** p<.001
0.38 for both index of injury during acclimation and at maximum hardiness
(Table 13). Significant additive genetic variability in cold-hardiness
during acclimation has been reported for other western conifers (Jonsson et
al. 1986, Rehfeldt 1988). However, opposite to what has been found in this
study, genetic variation during maximum hardiness in lodgepole pine decreased
(Rehfeldt 1988).

59
2.3.2 Trait Correlations
a) first -year greenhouse trial
There were no statistically significant correlations among seed and
germination traits except for a strong negative correlation between first-
and second-year percent germination (family mean r--.79) (Table 14). As
well, there were no significant correlations of seed and germination traits
with growth traits except between speed of germination and early height
(Table 15). Weak to moderate negative correlations indicate that families
that germinate quicker have a slight height advantage during the first 14
weeks (ht0.3 was measured 12 weeks after the first dibbling date) of growth.
However, this advantage is negligible from week 14 (ht0.4) and on. Seed
weight or completeness of germination had no measurable influence on height
growth or diameter.
Table 14:^Simple linear correlation coefficients (r) for family meanswithin population (below diagonal) and population means (abovediagonal) for yellow-cedar seed and germination traits, andgeographic descriptors of seed origin'
fseed2 wfseed^grml^grm2^rr50
latitude
elevation
fseed
wfseed
grml
grm2
rr50
1. r values with significance level >.05 have been omitted for ease ofinterpretation
2. See Table 2 for explanation of trait abbreviations
-.43
.43
-.74
-.79
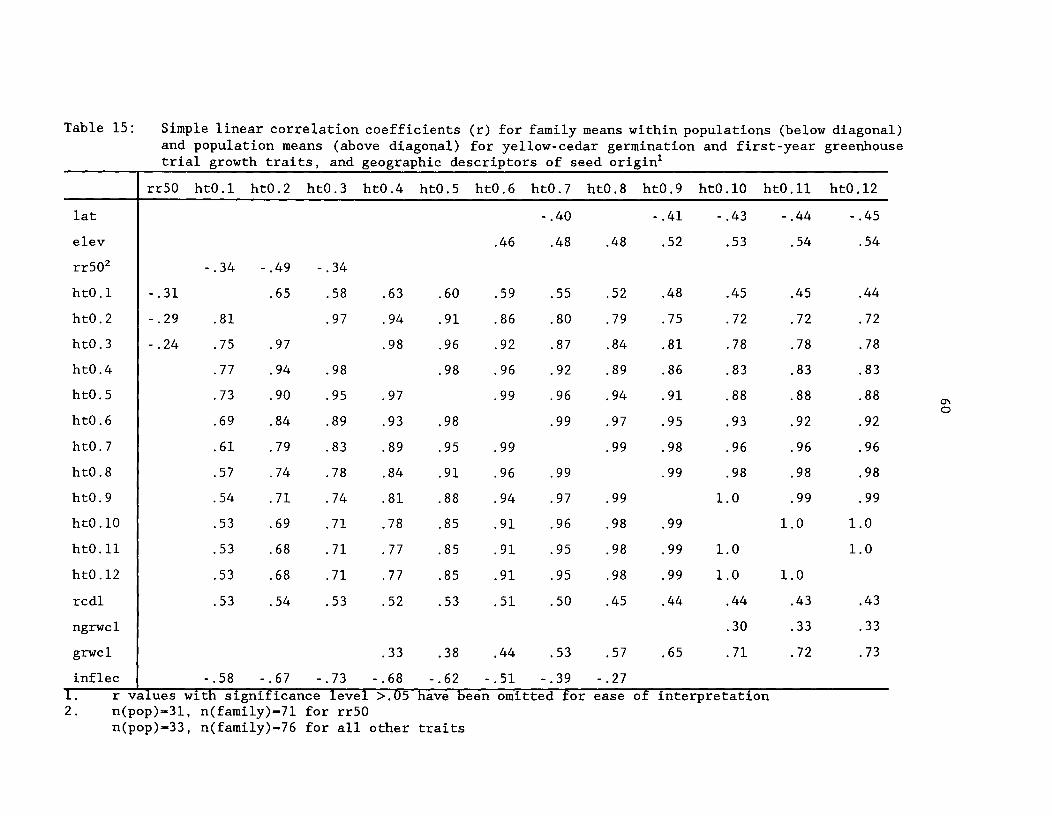
Table 15:^Simple linear correlation coefficients (r) for family means within populations (below diagonal)and population means (above diagonal) for yellow-cedar germination and first-year greenhousetrial growth traits, and geographic descriptors of seed origin'
rr50 ht0.1 ht0.2 ht0.3 ht0.4 ht0.5 ht0.6 ht0.7 ht0.8 ht0.9 ht0.10 ht0.11 ht0.12
lat -.40 -.41 -.43 -.44 -.45
elev .46 .48 .48 .52 .53 .54 .54
rr502 -.34 -.49 -.34
ht0.1 -.31 .65 .58 .63 .60 .59 .55 .52 .48 .45 .45 .44
ht0.2 -.29 .81 .97 .94 .91 .86 .80 .79 .75 .72 .72 .72
ht0.3 -.24 .75 .97 .98 .96 .92 .87 .84 .81 .78 .78 .78
ht0.4 .77 .94 .98 .98 .96 .92 .89 .86 .83 .83 .83
ht0.5 .73 .90 .95 .97 .99 .96 .94 .91 .88 .88 .88
ht0.6 .69 .84 .89 .93 .98 .99 .97 .95 .93 .92 .92
ht0.7 .61 .79 .83 .89 .95 .99 .99 .98 .96 .96 .96
ht0.8 .57 .74 .78 .84 .91 .96 .99 .99 .98 .98 .98
ht0.9 .54 .71 .74 .81 .88 .94 .97 .99 1.0 .99 .99
ht0.10 .53 .69 .71 .78 .85 .91 .96 .98 .99 1.0 1.0
ht0.11 .53 .68 .71 .77 .85 .91 .95 .98 .99 1.0 1.0
ht0.12 .53 .68 .71 .77 .85 .91 .95 .98 .99 1.0 1.0
rcdl .53 .54 .53 .52 .53 .51 .50 .45 .44 .44 .43 .43
ngrwc1 .30 .33 .33
grwcl .33 .38 .44 .53 .57 .65 .71 .72 .73
inflec -.58 -.67 -.73 -.68 -.62 -.51 -.39 -.271. r values with significance level >.05 have been omitted for ease of interpretation2. n(pop)-31, n(family)=7l for rr50
n(pop)-33, n(family)76 for all other traits
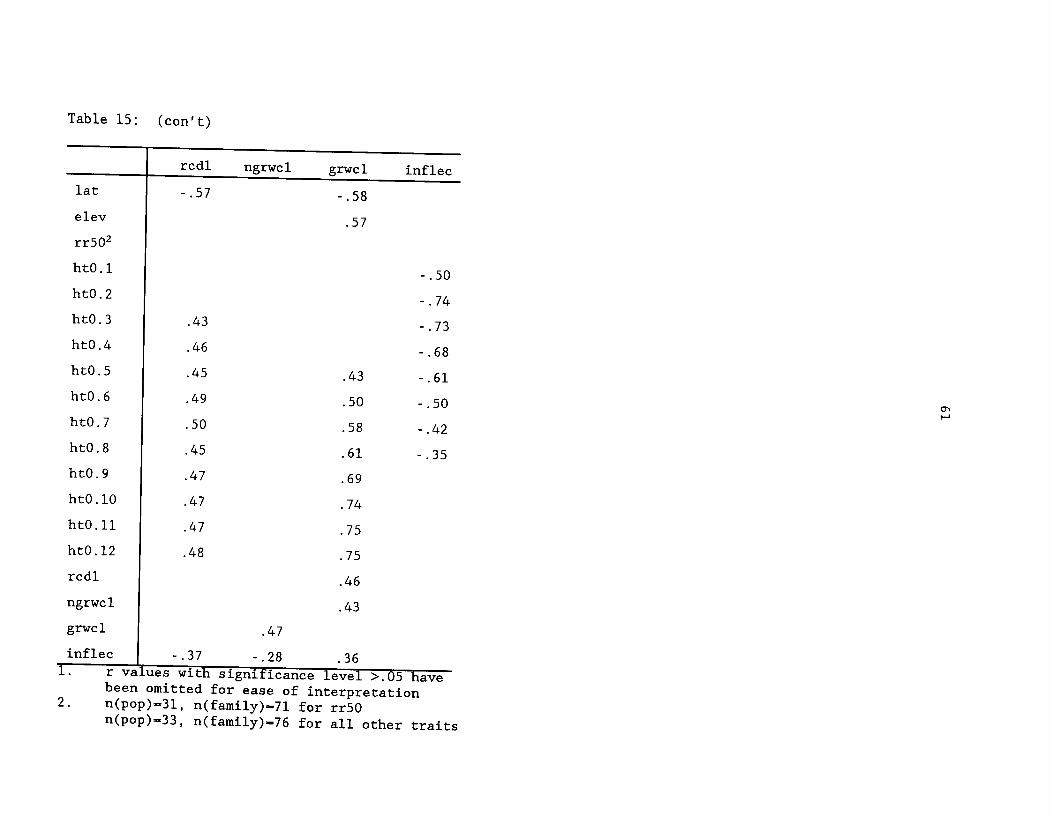
Table 15: (con't)
rcdl^ngrwc1^grwc1^inflec
lat^-.57^-.58
^
elev^ .57
rr502
ht0.1 -.50ht0.2 -.74
^
ht0.3^.43^ -.73
^
ht0.4^.46^ -.68
^
ht0.5^.45^.43^-.61
^
ht0.6^.49^.50^-.50
^
ht0.7^.50^.58^-.42
^
ht0.8^.45^.61^-.35
^
ht0.9^.47^.69
ht0.10^.47^.74
ht0.11^.47^.75
ht0.12^.48^.75
rcdl^ .46
ngrwcl^ .43
^
grwcl^ .47
inflec^-.37^-.28^.361. r values with significance level >.05 have
been omitted for ease of interpretation2. n(pop)3l, n(fami1y)-71 for rr50
n(pop)33, n(fami1y)-76 for all other traits

62
Seed weight of conifer species has been shown to have either no
relationship with rate of emergence (Burgar 1964, Perry and Hafley 1981), a
weak positive relationship (4ikola 1984, St. Clair and Adams 1991), or a
moderately positive relationship (Dunlop and Barnett 1983).
The influence of seed weight on early growth traits among families or
populations in other Pacific Northwest conifers varies from no correlation to
a weak or moderate positive correlation (Kuser and Ching 1981, Lines 1987,
Campbell et al. 1989, Loopstra and Adams 1989, St. Clair and Adams 1991).
Results similar to those shown here for correlations between rate of
emergence and early shoot growth has been demonstrated for loblolly pine with
positive correlations up to 11 weeks and no correlations with later growth
(Dunlop and Barnett 1983). Other studies with conifers have shown no
correlations between rate of emergence and first-year growth traits (Burgar
1964, Roche 1969, Griffin 1972, St. Clair and Adams 1991).
Height 8 weeks after dibbling (ht0.1) was moderately positively
correlated with final height (family r=.53), whereas ht0.2 to ht0.4 were more
strongly correlated (family r=.68 to .77), and all height measurements from
ht0.5 were correlated with r>.85 to final height (Table 15). Periodic
heights were all weakly to moderately correlated with final diameter, and in
fact, family r values decreased with later height measurements.
The predicted inflection point (inflec) from the fitted logistic
equation (b/c) had a strong negative correlation with early height (family
r=-.73 with ht0.3) (Table 15 and Figure 3). Thus, early inflection point
(measured in time from first measurement) is a good indicator of early fast
growth. However, the inflection point is not a good indication of later

6^8^10^12 14 16 18 20 22 24 26 28 30 32 34weeks since dibbling
shoot height (mm)
Figure 3:^First-year seedling growth curves for five yellow-cedar open-pollinated families
200
180
160
140
120
100
80
60
40
20
0
Population-Family
Sparton Lake, Earn 1
^ Sparton Lake, Earn 6
^
)1(^ Valentine Mt., Fam 3
^
—El^ Mt. Angeles, Fam 4
^
X^ Whitepass, Earn 1

64
growth as can be seen by the weak to lack of correlation of the inflection
point with ht0.7 to ht0.12 (week 20 and later) (Table 15) and the crossing of
height curves after week 20 in Figure 3.
b) nurserybed trial
First-year total height was strongly correlated with second-year total
height (family mean r=0.77), however, only moderately correlated with third-
year total height (family mean r=0.61) (Table 16). This was reflected in the
moderate correlation between second-year height growth and third-year height
growth (family mean r=0.51, population mean r=0.69). Both second-year total
height, and second-year and third-year height growth were strongly correlated
with third-year total height (family mean r=0.86, 0.79, and 0.86; population
mean r=0.68, 0.84 and 0.75, respectively).
Second-year root collar diameter (rcd2) was moderately correlated at
both the family and population mean level for all growth traits except with
third-year height growth (Table 16). The number of seedlings growing during
the early part of the third growth season (ngrwi3) was moderately correlated
with all second and third-year height growth traits (family mean r= .41 to
.66), (Table 16). The actual amount of growth during the early season
(grwi3) was weakly to moderately correlated with growth traits at the family
level only (family mean r=.29 to .49).
The average number of seedlings growing at the end of the third growing
season (ngrwc3) was moderately to strongly correlated with third-year height
growth (family mean r=0.60; population mean r=0.83), and weakly to moderately
correlated with third-year total height (family mean r=0.35, population mean
r=0.66) (Table 16). The actual amount of growth during the cessation period
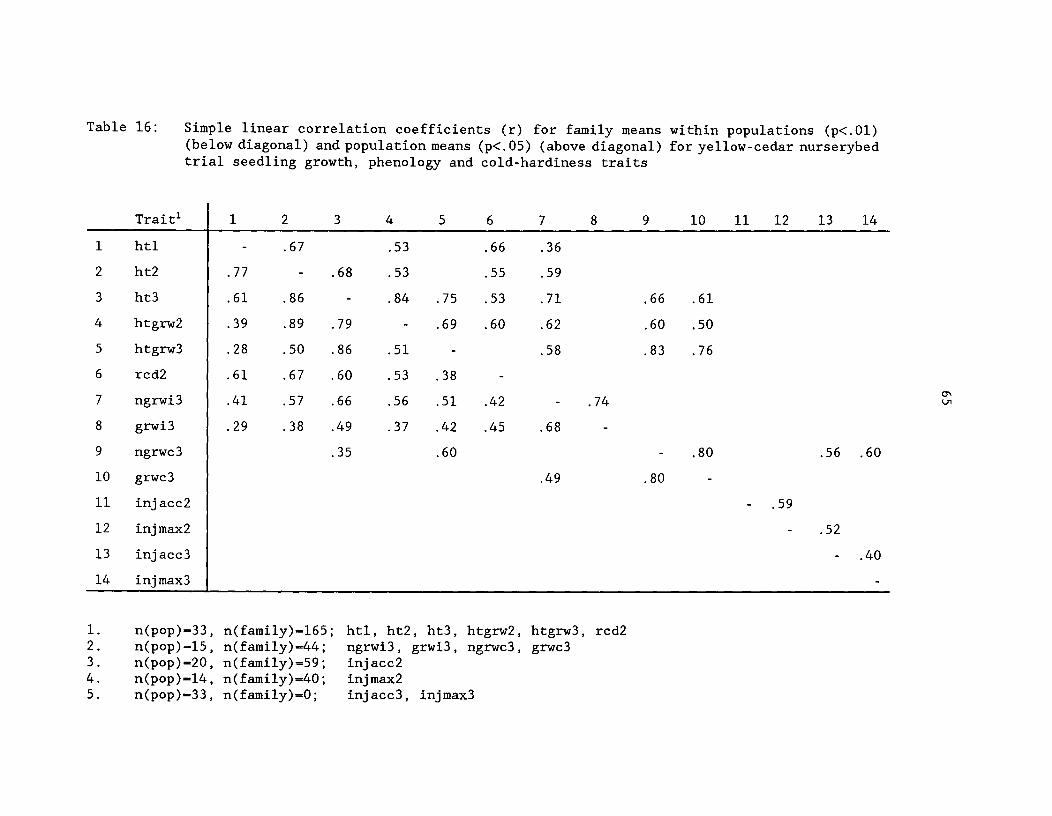
Table 16:^Simple linear correlation coefficients (r) for family means within populations (p<.01)(below diagonal) and population means (p<.05) (above diagonal) for yellow-cedar nurserybedtrial seedling growth, phenology and cold-hardiness traits
Trait' 1^2^3^4^5^6^7 8 9 10 11 12 13 14
1 htl .67^.53^.66^.36
2 ht2 .77^.68^.53^.55^.59
3 ht3 .61^.86^.84^.75^.53^.71 .66 .61
4 htgrw2 .39^.89^.79^.69^.60^.62 .60 .50
5 htgrw3 .28^.50^.86^.51^.58 .83 .76
6 rcd2 .61^.67^.60^.53^.38^-
7 ngrwi3 .41^.57^.66^.56^.51^.42 .74
8 grwi3 .29^.38^.49^.37^.42^.45^.68
9 ngrwc3 .35^.60 .80 .56 .60
10 grwc3 .49 .80
11 injacc2 .59
12 injmax2
n(pop)33 , n(family)=165;^htl, ht2, ht3, htgrw2, htgrw3,
.52
13 injacc3 .40
14 injmax3
1. rcd22. n(pop)-15 , n(family)=44;^ngrwi3, grwi3, ngrwc3, grwc33. n(pop)=20 , n(family)-59;^injacc24. n(pop)-14 , n(family)=40;^injmax25. n(pop)-33 , n(family)=0;^injacc3,^injmax3

66
(grwc3) was moderately correlated to third-year total height (population mean
r=0.61), and strongly correlated to third-year height growth (population mean
r=.76), at the population level only.
Correlations of timing of growth initiation (bud-burst) with early
growth traits of Pacific Northwest conifers with determinate growth have
usually been weak or nonsignificant, whereas similar correlations with bud-
set have been significant and strong (Roche 1969, Rehfeldt 1982, Lines 1987,
Campbell et al. 1989, Sorenson et al. 1990). In this study, the number of
seedlings growing during both the growth initiation and cessation period had
more of an influence on total height and height growth than the amount of
growth during these specific periods.
Cold injury after the second growing season was not statistically
(p>0.05) correlated with any growth or growth rhythm traits (Table 16). Cold
injury during the acclimation period was moderately correlated with cold
injury during the period of maximum hardiness (population mean r-0.59).
Cold injury after the third growing season (injacc3, injmax3) which was
tested on more populations at the expense of family structure, was moderately
correlated with the population average number of seedlings growing during
third-year growth cessation (r=0.56 for injacc3, and 0.60 for injmax3) (Table
16).
Development of cold hardiness seems to be more dependant upon the
number of seedlings growing into the fall, and less on the actual growth of
these seedlings. Cold-hardiness of other Pacific Northwest conifers is
related to bud-set in the same way as the number of seedlings growing during
growth cessation in this study (Rehfeldt 1982, Kuser and Ching 1980, Lines
1987).

67
Correlations between cold injury dates within and between the two years
of testing were, for the most part insignificant. There was a moderate
correlation between injacc2 and injmax2 (population mean r=0.59) and a weak
correlation between injmax2 and injacc3 (population mean r=0.40). Poor
correlations between injury traits is not surprising given data presented
from the first-year study which shows changes in population ranking with
respect to cold injury during acclimation.
2.3.3 Genecology
a) seed and germination
No significant correlation of either seed weight or percent filled seed
with seed source descriptors was found, although there were significant
population differences for both traits. Other studies in Pacific Northwest
conifers that have found significant population variation in filled seed
weight have reported varying results with respect to macrogeographic
correlations including no apparent adaptive pattern for Sitka spruce (Lines
1987), weak or moderate correlations in coastal Douglas-fir (White et al.
1981), and strong correlations in coastal Douglas-fir, with increasing seed
size on drier sites (Loopstra and Adams 1989).
The number of seed germinating in the second year (grm2) was weakly
correlated with latitude (r--.43) and elevation (.43) (Table 14). Thus, more
southern and high elevation populations tended to germinate more during the
second year than seed from northern populations or low elevations.
b) growth and phenology
Height 18 weeks after dibbling (ht0.6) and thereafter, was weakly
correlated with latitude (r---.40 to -.45) and moderately correlated with
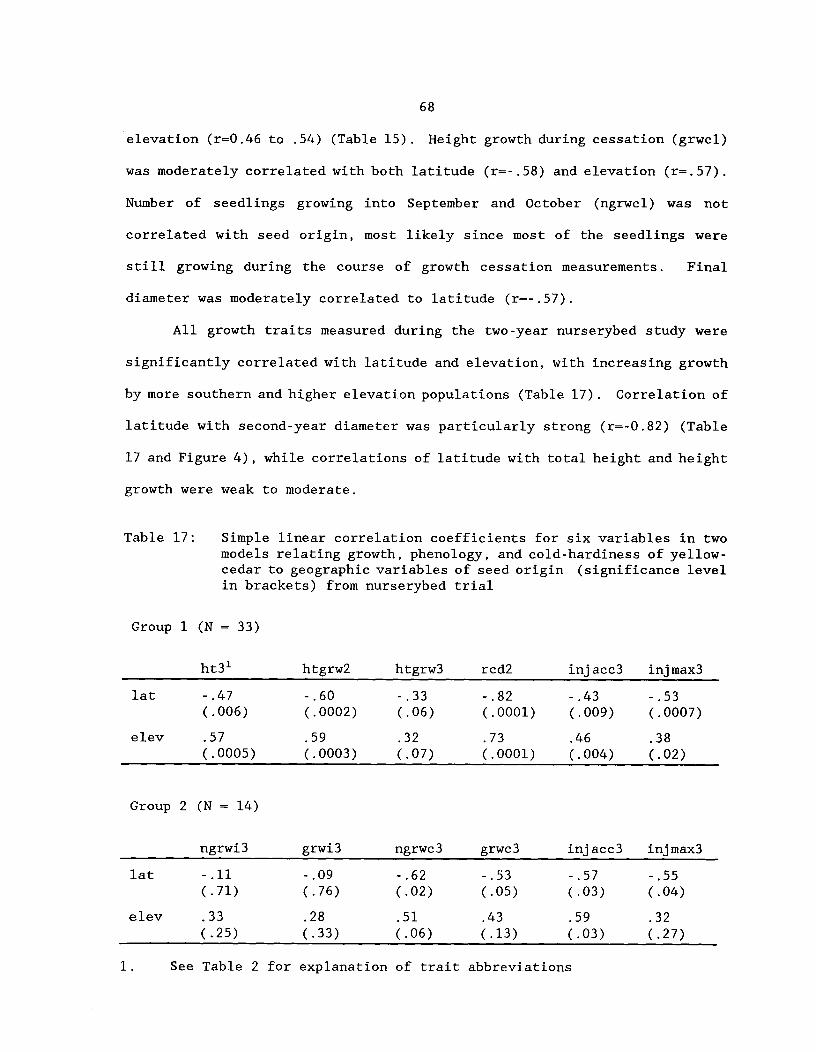
68
elevation (r=0.46 to .54) (Table 15). Height growth during cessation (grwcl)
was moderately correlated with both latitude (r=-.58) and elevation (r-.57).
Number of seedlings growing into September and October (ngrwcl) was not
correlated with seed origin, most likely since most of the seedlings were
still growing during the course of growth cessation measurements. Final
diameter was moderately correlated to latitude (r--.57).
All growth traits measured during the two-year nurserybed study were
significantly correlated with latitude and elevation, with increasing growth
by more southern and higher elevation populations (Table 17). Correlation of
latitude with second-year diameter was particularly strong (r-0.82) (Table
17 and Figure 4), while correlations of latitude with total height and height
growth were weak to moderate.
Table 17:^Simple linear correlation coefficients for six variables in twomodels relating growth, phenology, and cold-hardiness of yellow-cedar to geographic variables of seed origin (significance level
Group 1
in brackets) from nurserybed trial
(N - 33)
ht31^htgrw2^htgrw3^rcd2 injacc3 injmax3
lat -.47 -.60 -.33 -.82 -.43 -.53(.006) (.0002) (.6) (.0001) (.009) (.0007)
elev .57 .59 .32 .73 .46 .38(.0005) (.0003) (.7) (.0001) (.004) (.02)
Group 2 (N - 14)
ngrwi3 grwi3 ngrwc3 grwc3 injacc3 injmax3
lat -.11 -.09 -.62 -.53 -.57 -.55(.71) (.76) (.02) (.05) (.03) (.04)
elev .33 .28 .51 .43 .59 .32(.25) (.33) (.06) (.13) (.03) (.27)
1.^See Table 2 for explanation of trait abbreviations

2nd-year diameter (mm)
5654 58
7
6.8
6.6
6.4
6
5.8
5.6
5.2
542 44^46^48^50^52
N. latitude (degrees)
6.2
5.4
alk0
Figure 4: Relationship between second-year root collar diameter and latitude of seed source origin for 33populations of yellow-cedar grown in a common-garden trial

70
Growth initiation traits (ngrwi3, grwi3) exhibited no significant
trends with geographic descriptors, while growth cessation traits (ngrwc3,
grwc3) were significantly correlated with latitude (Table 17).
A plastic response of growth cessation during a late-season warming
trend, and differences among populations in this response, can be seen
qualitatively among four populations which span the latitudinal distribution
of yellow-cedar (Figure 5). Despite significant correlations between number
of seedlings growing during cessation and latitude, an increase in
temperature before and during days 21 and 28 of measurements for growth
cessation (between September 30 and October 7), resulted in an increase in
either, or both, the number of seedlings growing, and amount of growth,
depending on the population. The number of seedlings growing between day 21
and day 28 decreased for the Oregon population (44% to 35%) while the amount
of growth approximately doubled (3.0 mm to 5.9 mm). On the other hand, the
Washington population doubled both the number of seedlings growing (33% to
67%) and the amount of growth (2.8 mm to 5.9 mm) during the same period. The
British Columbia population doubled the number of seedlings growing (10% to
20%), however, the amount of growth increased by only 57%. Although the
Alaska population did not increase in either of the cessation traits, it
temporarily halted the declining trend.
Injury to cold after the third-growing season showed trends similar to
growth traits with respect to seed source descriptors (Table 17).
Correlations of geographic descriptors with cold-injury during both
acclimation and assumed maximum hardiness were statistically significant and
moderate (r=-0.43 and -0.53 for latitude with injacc3 and injmax3,
respectively).
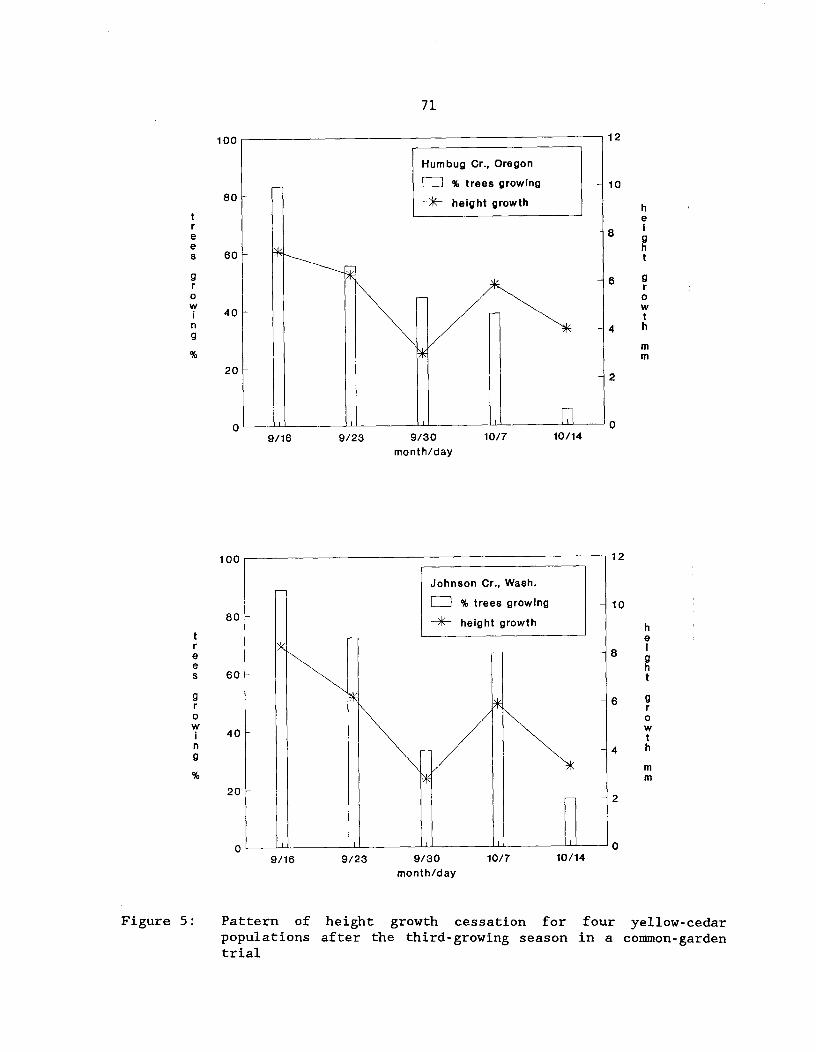
80
20
100
heI9ht
9rowth
mm
71
Humbug Cr., Oregon
I I % trees growing
* height growth-
-
12
- 10
- 8
- 6
- 4
- 2
09/16^9/23^9/30^10/7^10/14
month/day
100
80
treeS 60
9rowi^40n9
%
20
12
-
_
-
-
Johnson Cr., Wash.
I^I % trees growing
* height growth
- 10
- 2
09/16^9/23^9/30^10/7^10/14
month/day
Figure 5:^Pattern of height growth cessation for four yellow-cedarpopulations after the third-growing season in a common-gardentrial
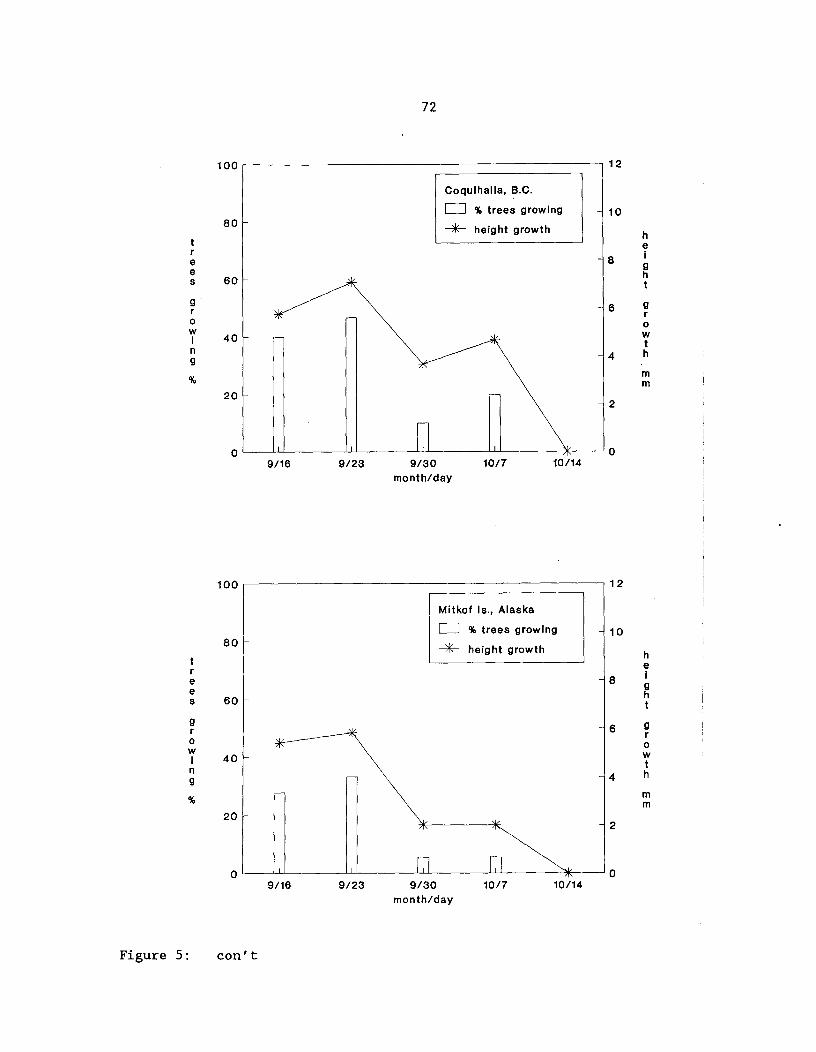
9/23 9/30^
10/7month/day
I^IMitkof Is., Alaska
% trees growing
* height growth
12100
I^ICoquihalla, B.C.
% trees growing
* height growth
9/16
72
80
60
40
9
20
- 6
- 4
- 2
010/14
- 10
- 8
12100
80
60
40
20- 2
0
- 10
9/16^9/23^9/30^10/7^10/14month/day
Figure 5:^con't
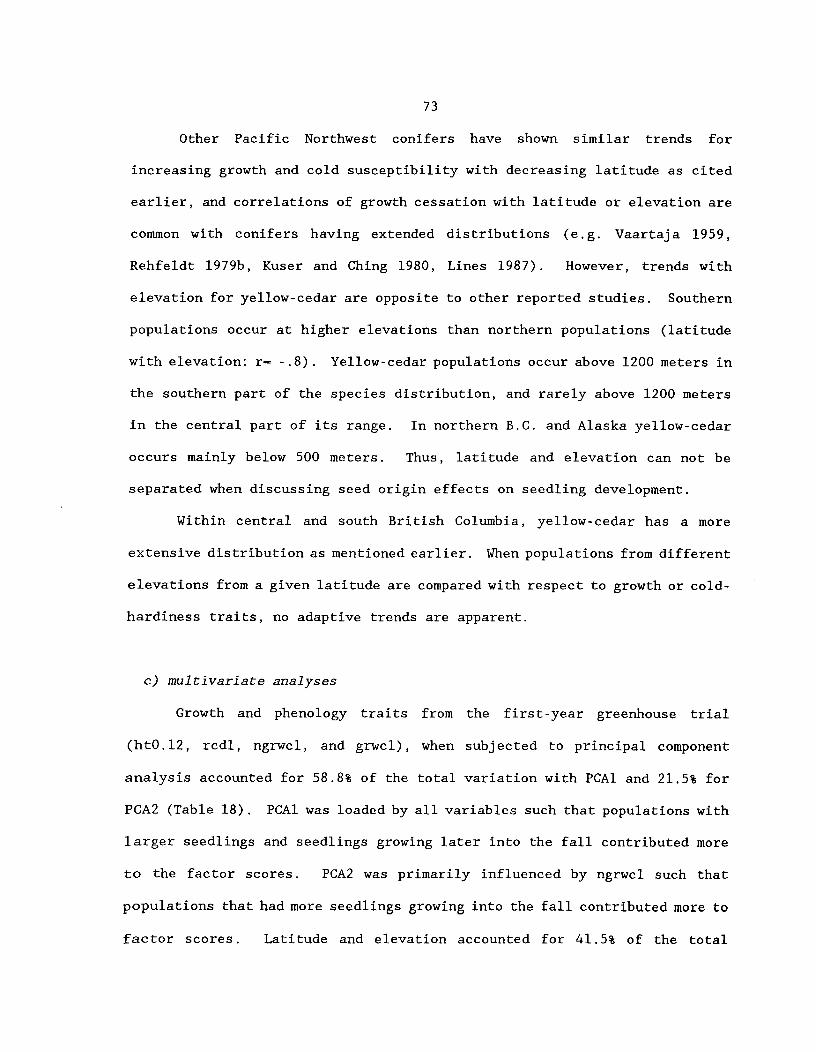
73
Other Pacific Northwest conifers have shown similar trends for
increasing growth and cold susceptibility with decreasing latitude as cited
earlier, and correlations of growth cessation with latitude or elevation are
common with conifers having extended distributions (e.g. Vaartaja 1959,
Rehfeldt 1979b, Kuser and Ching 1980, Lines 1987). However, trends with
elevation for yellow-cedar are opposite to other reported studies. Southern
populations occur at higher elevations than northern populations (latitude
with elevation: r= -.8). Yellow-cedar populations occur above 1200 meters in
the southern part of the species distribution, and rarely above 1200 meters
in the central part of its range. In northern B.C. and Alaska yellow-cedar
occurs mainly below 500 meters. Thus, latitude and elevation can not be
separated when discussing seed origin effects on seedling development.
Within central and south British Columbia, yellow-cedar has a more
extensive distribution as mentioned earlier. When populations from different
elevations from a given latitude are compared with respect to growth or cold-
hardiness traits, no adaptive trends are apparent.
c) multivariate analyses
Growth and phenology traits from the first-year greenhouse trial
(ht0.12, rcdl, ngrwcl, and grwcl), when subjected to principal component
analysis accounted for 58.8% of the total variation with PCA1 and 21.5% for
PCA2 (Table 18). PCA1 was loaded by all variables such that populations with
larger seedlings and seedlings growing later into the fall contributed more
to the factor scores. PCA2 was primarily influenced by ngrwcl such that
populations that had more seedlings growing into the fall contributed more to
factor scores. Latitude and elevation accounted for 41.5% of the total

74
variation in factor scores from PCA1 and 24.3% of total variation in PCA2
(Table 18).
Table 18:^Factor loadings and eigenvalues of principal components,percentage of variation accounted for by the principalcomponents, and multiple regression equations for factor scoresof the^first^two principal^components^for relating seedlinggermination and first-year greenhouse trial growth and phenologytraits of yellow-cedar to geographic variables of seed origin
Trait' Loading
pcl pc2
ngrwcl .57 .76
grwcl .90 .03
ht0.12 .87 -.13
rcd1 .68 -.51
Eigenvalue 2.35 0.86
% of variation 58.80 21.501.^See Table 2 for explanation of trait abbreviations
Factor 1:^Yi — 0.447 - .0019 (LAT) + 5.0 x 10⁻⁷ (ELEV)2
r2 = 41.5%
Factor 2:^
Yi = -1.16 + 4.1 x 10⁻⁶ (LAT * ELEV) -3.8 x 10⁻⁷ (ELEV)2
r2 — 24.3%
Table 19 summarizes the results of principal component analysis for the
nurserybed trial, for each of the two groups of traits. All growth traits in
Group I contributed to the loading of the first principal component and
accounted for 51.1% of the variability attributed to populations.
Populations with larger seedlings contributed to larger factor scores. Index
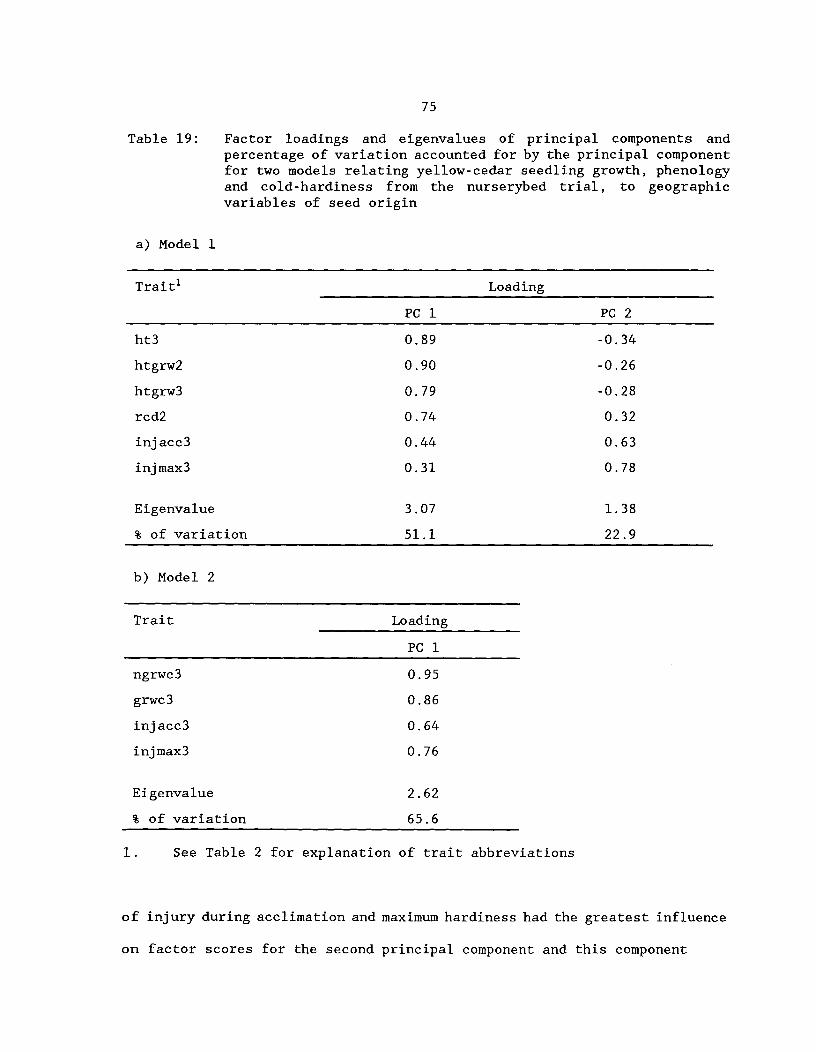
75
Table 19:^Factor loadings and eigenvalues of principal components andpercentage of variation accounted for by the principal componentfor two models relating yellow-cedar seedling growth, phenologyand cold-hardiness from the nurserybed trial, to geographicvariables of seed origin
a) Model 1
Traitl Loading
PC 1 PC 2
ht3 0.89 -0.34
htgrw2 0.90 -0.26
htgrw3 0.79 -0.28
rcd2 0.74 0.32
injacc3 0.44 0.63
injmax3 0.31 0.78
Eigenvalue 3.07 1.38
% of variation 51.1 22.9
b) Model 2
Trait^ Loading
PC 1
ngrwc3^ 0.95
grwc3^ 0.86
injacc3^ 0.64
injmax3^ 0.76
Eigenvalue^ 2.62
% of variation^ 65.6
1.^See Table 2 for explanation of trait abbreviations
of injury during acclimation and maximum hardiness had the greatest influence
on factor scores for the second principal component and this component

76
accounted for an additional 22.9% of the population variability. For PC2,
seedlings from populations that were more susceptible to cold contributed
more to factor scores.
The quadratic term of latitude and the interaction of latitude with
elevation when regressed with factor scores from the first principal
component explained 60.4% of the variability (Table 20). Both quadratic
terms of latitude and elevation and the interaction of latitude with
elevation explained 40.5% of the variability within the second principal
component factor scores.
Table 20: Multiple regression equations for two models relating factorscores from the first two principal components for yellow-cedargrowth, phenology and cold-hardiness from the nurserybed trial,to geographic variables of seed origin
Model 1
Factor 1:^Yi — 0.211 -3.27 x 10⁻⁶ (LAT)2 + 7.32 x 10⁻⁴ (LAT*ELEV)
r2^60.4%
Factor 2:^Yi = -0.316 + 2.79 x 10⁻⁶ (LAT)2 + 1.24 x 10⁻⁶ (ELEV)2 -4.17x 10⁻⁶ (LAT*ELEV)
r2 = 40.5%
Model 2
Factor 1:^Yi = 0.980 - 3.61 x 10⁻⁶ (LAT)2
r2^55.6%
Only growth cessation traits and cold-hardiness at acclimation were used
for multivariate analysis in Group 2 since growth initiation was not
statistically correlated with any of the dependant or independent traits.
The first principal component explained 65.0% of the variability attributed

77
to populations with all traits contributing (Table 19). Seedlings from
populations that grew longer into the fall and were more susceptible to cold
contributed more to the factor scores. Multiple regression of factor scores
from the first principal component explained 55.0% of the variability when
regressed on the quadratic term of latitude (Table 20). Thus, southerly and
high elevation populations had seedlings which grew longer into the fall and
were more frost-susceptible.
2.4 SUMMARY
Significant variability was evident at both the population and family
within population level in growth and cold-hardiness traits, and at the
family within population level for seed and shoot phenology traits.
Substantially more genetic variability was found at the family within
population level as opposed to the population level in all but two traits,
with 2 to 16 times more variation. Narrow-sense heritabilities varied from
0.16 for growth during third-year shoot initiation to 0.64 for first-year
height in the nurserybed. Family within population effects for growth traits
in the nurserybed are difficult to interpret because of significant
interactions of block by family within population.
There were no significant correlations of seed weight with speed of
germination or shoot growth. Speea of germination was positively correlated
with early shoot growth (ht0.1 to ht0.3) but was negligible with further
shoot growth. Time to largest relative growth rate during the first year was
a good indication of early growth but not final first-year height. The
amount of growth in the late season (grwcl, grwc3) was a good indication of
final shoot height (ht0.12, ht3, respectively). Acclimation of cold-
hardiness (injacc3, injmax3) was partly dependant upon the number of
78
seedlings growing in the fall (ngrwc3), and less so on the actual amount of
growth of these seedlings.
There was little evidence of adaptive variation for seed and
germination traits, however, early growth traits were moderately to strongly
correlated with latitude and elevation of seed origin. Growth initiation
exhibited no significant trends with geographic descriptors of seed origin,
whereas second and third-year shoot height and diameter growth, growth
cessation, and injury to cold were correlated to latitude and elevation, such
that seedlings from more southerly and high elevation populations were
taller, had greater diameter, grew later into the growing season, and were
more susceptible to cold injury during acclimation and at maximum hardiness,
than more northern populations. Regression of principal component scores on
geographic descriptors confirmed the above trends.
There was evidence of phenotypic plasticity of shoot height growth
cessation in response to a late warming trend, and substantial population
variation in this response.

79
CHAPTER 3: GREENHOUSE ENVIRONMENT STUDY
3.1 OBJECTIVES
This study involved the testing of different genetic entries in
different environments. Yellow-cedar seedlings from a subset of populations
and families within populations from the common-garden study were grown under
two photoperiods and two moisture regimes during their second growing season.
The objectives of the study were to:
1. investigate the effects of different environments on morphological
expression and physiological processes;
2. determine the extent of genotype by environment interactions for
morphological and physiological traits, and;
3.^elucidate the presence of adaptive genetic variation in
morphological expression and physiological processes in response to
varying environments.
The main study was designed primarily to address objective 2, the
extent and presence of genotype by environment interactions. Thus, the
design of the trial, and traits measured, were not optimal in detecting
adaptive genetic variation. In particular, the southern populations from
Oregon were not included, and only one population from the drier coast-
transition area was included, because of a lack of seedlings.
However, a trial was performed on a subset of the populations and
treatments in the above study, with the purpose of investigating adaptive
variation in response to drought. The objective of this study was to
investigate the effects of drought on growth and biomass allocation, gas

80
exchange and water relations of yellow-cedar seedlings from relatively mesic
and xeric populations, and from open-pollinated families within these
populations.
3.2 MATERIALS AND METHODS
3.2.1 Experimental Design
One-year-old seedlings from 18 of the 33 populations sown for the
common-garden experiment were used for this study. Nine of the populations
were represented each by three open-pollinated families, and the other nine
were bulked populations consisting of a minimum of six families (Table 21).
One-year-old seedlings were lifted from the styro 313 containers (see Chapter
2, Section 2.2.1.6) and repotted into styro 615 containers (volume of
cavity-336 ml) with sand. Seedlings were placed in alternative cavities to
minimize crown competition for light. The experimental design was a split-
plot with the main plot including two blocks each with four greenhouse
benches in which one treatment from a 2x2 factorial of two photoperiods and
two moisture regimes was randomly assigned to each bench within a block.
There were four replications nested within each treatment and block. Each of
the 27 open-pollinated families from the nine populations with family
structure was randomly assigned to a 3-tree row plot within each replication.
Thus, each family was represented by 24 seedlings per treatment (two blocks
x four replications x 3-tree row plots) and 96 seedlings in total (four
treatments). Six of the bulk populations were represented by one 3-tree row
plot per replication (24 seedlings per treatment) and the final three
populations by two 3-tree row plots per replication (48 seedlings per
population per treatment).

Table 21:^Geographic location of yellow-cedar populations used in the greenhouse environment study
Population' N. Latitude W. Longitude Elevation (m)
Mitkof Island, AK2 56° 49' 132° 57' 300
Porcher Island, B.C. 54° 00' 130° 20' 430
Kwatna Inlet, B.C.2'3 52° 08' 127° 23' 488
Holberg,^V.I.2'3 50° 42' 127° 40' 300
Coal Harbour, V.I. 50° 39' 127° 47' 500
Beaver Cove, V.I.3 50° 31' 126° 48' 731
Waukwass Creek, V.I. 50° 29' 1270 18' 750
Bullet Lake, V.I. 49° 56' 1260 21' 579
Squamish,^B.C.3 49° 47' 122° 55' 900
Mt. Washington, V.I. 49° 45' 125° 20' 1200
Coquihalla,^B.C.3 49° 37' 121° 02' 1350
Talc Creek,^B.C.3 49° 30' 121° 40' 800
Yellow Creek, B.C. 49° 12' 1240 41' 1000
Sparton Lake, V.I. 48° 56' 1240 12' 823
Valentine Mt., V.I.3 48° 33' 1230 51' 760
Mt. Angeles, WA2'3 47° 59' 123° 28' 1750
Huckleberry Ridge, WA3 47° 03' 121° 37' 1350
White Pass, WA 46° 38' 121° 25' 1350
1. B.C. — British Columbia, Canada; V.I. — Vancouver Island, B.C.; WA — Washington, U.S.A.;AK — Alaska, U.S.A.
2. Denotes populations used for cold-hardiness testing3. Denotes populations with family structure (3 families/population)

82
Seedlings were placed in a fibreglass greenhouse on May 12, 1990. The
seedlings experienced ambient photoperiod for the first four days, however,
seedlings were not actively growing at this time. Photoperiod treatments
began on May 16 with one treatment simulating the daylength of the southern
extreme of yellow-cedar's natural range at 41° 30' latitude (short-day: SD),
and the other the northern extreme at 600 latitude (long-day: LD).
Photoperiods were adjusted every two weeks to approximate the normal changes
occurring at each latitude (Table 22). Blackout cloth was placed on all
seedlings at the same time, and incandescent lights were used within the
blackout to reach the required daylengths. Photoperiod lights were turned on
at 0600 and blackout cloth removed at 0800. Blackout cloth was put on
between 1800 and 2000, and lights were turned on according to length of
photoperiod at the particular time (Table 22). Thus, any effects of blackout
on seedling growth were similar across all treatments. Photoperiod
treatments were discontinued on September 15, at which time all seedlings
received the natural daylength for Cowichan Lake. Light levels under the
blackout varied from 10 to 20 pmol/m2/s, which is below the compensation point
for yellow-cedar (Grossnickle and Russell 1991). Thus, the light levels
under the blackout were designed to elicite a phytochrome response as opposed
to active photosynthesis.
All seedlings were regularly watered as needed and fertilized with a
balanced (20:20:20) soluble fertilizer at 0.5 g/1 until the moisture regime
treatments began on July 16. During the six weeks following July 16, the
seedlings in the wet treatment (W) were watered as needed but not fertilized.
Seedlings in the dry treatment (D) were not watered until a subsample of
seedlings reached predawn shoot water potentials of -1.5 MPa or less, on

Table 22:^Photoperiod schedule (hours of daylight) for yellow-cedar greenhouse environment study
TreatmentHours of Daylight
05/16 06/1 06/15 07/1 07/151 08/1 08/15 09/12 09/153SD (410^30')
LD (60°)
14.0
17.0
14.5
18.0
15.0
19.0
15.0
19.0
14.5
18.0
14.0
17.0
13.5
15.0
13
13.5
12
12
1. Start of drydown treatment2. End of drydown treatment3. Photoperiod treatment ended, seedlings
received natural photoperiod for Cowichan Lake
84
average, as measured by a pressure chamber (Soil Moisture Corp. Model 3005)
according to Ritchie and Hinkley (1975). At this time, the seedlings were
watered enough to completely moisten the dry soil and to raise the next day's
predawn shoot water potential to between -0.8 and -1.0 MPa. This cycle was
repeated a number of times (Figure 6) during the six-week period, after which
the droughted seedlings were watered to saturation, and all seedlings were
fertilized on a regular schedule for the rest of the growing season.
3.2.2 Traits Measured
a) morphological traits
Heights of the main stem were taken on every seedling every 3 weeks
from May 14 to September 17 (ht1.1 to ht1.7). Six weeks after the last
periodic measurement, final height (ht2) and root collar diameter (rcd2) were
measured. As well, seedlings from replicates 1, 3, and 4 in block 1 were
destructively sampled after the growing season, and the following additional
traits measured:
1) number of secondary branches greater than 1 mm (brno);
2) length of largest branch mid-way up seedling (brlgth);
3) acute angle of branch measured in 2) above, from main stem (brang);
4) root dry weight (rtwt);
5) main-stem dry weight (stwt), and;
6) secondary branch dry weight (brwt).
At the time of sampling, root volume was less than soil volume for all
seedlings.
b) cold -hardiness measurements
On November 5, cold-hardiness was measured using the same techniques as
described in Chapter 2, Section 2.2.3.1 c). Five populations from each
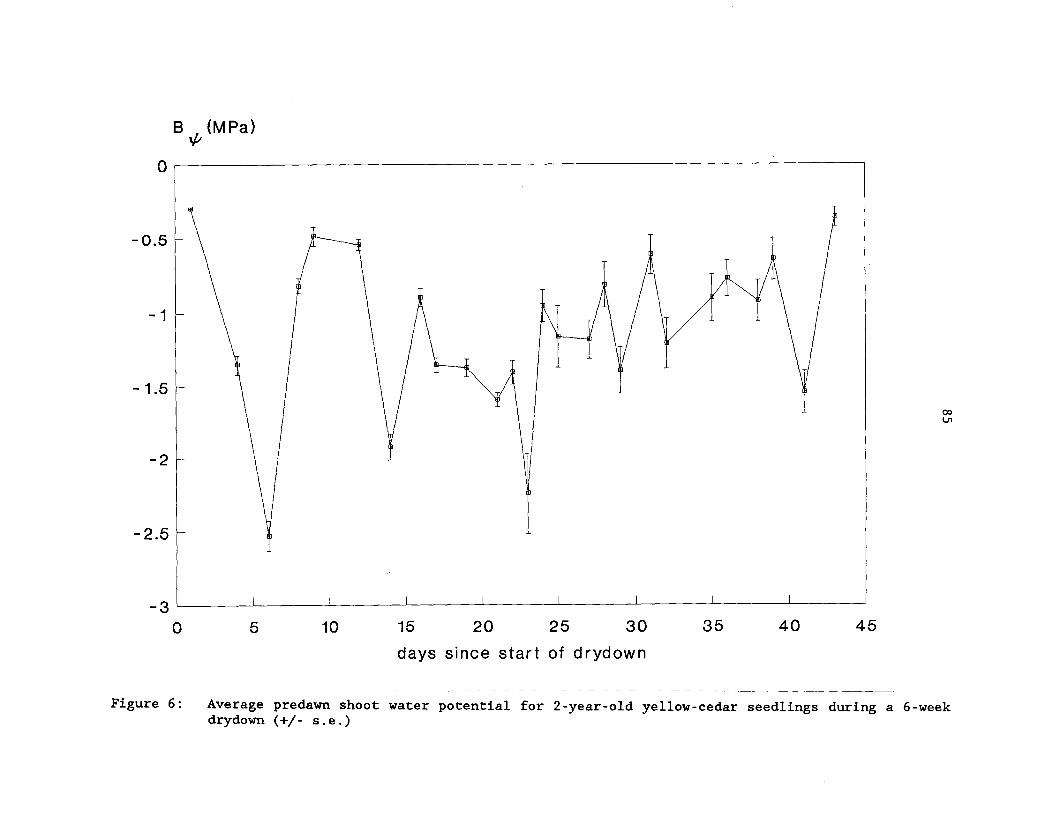
O 5^10^15^20^25^30
days since start of drydown
35^
40^
45
- 0.5
- 1.5
- 2.5
_
- 2
- 3
Bi(MPa)
V
0
1
coln
Figure 6: Average predawn shoot water potential for 2-year-old yellow-cedar seedlings during a 6-weekdrydown (+/- s.e.)

86
treatment were tested with bulk tissue taken from either two seedlings from
each of three open-pollinated families or six seedlings from each bulk
population (Table 21). Populations were chosen to maximize the latitudinal
differences among the sources included in the greenhouse environment study.
Three freezing temperatures were used, along with a control, with five vials
per population per treatment per temperature.^Samples were taken from
replicates 3 and 4, block 2.^Index of injury (injacc) at each test
temperature was calculated as previously described in Chapter 2, Section
2.2.3.1 c).
c) gas exchange and water potential measurements
At 13 times during the cyclic soil drying, seedlings in the long-day,
dry treatment (LDD) were measured for gas exchange. One hour after blackout
was removed (0800), stomatal conductance (gs), CO2 assimilation rate (A), and
transpiration rate (Tr) were measured using a closed system, gas exchange
analyzer (LI-6200, LI-COR Inc., Lincoln, NE). Measurements were taken on six
seedlings from two families from each of three populations: Kwatna Inlet,
mid-coast, windward slope, low elevation; Coquihalla, coast-interior
transition, high elevation, and; Mt. Angeles, high elevation, coastal leeward
slope,and six seedlings from one bulk population: Mitkof Island, Alaska,
northern coast, windward slope, low elevation (Table 23). A lateral branch
(4-6 cm) in the upper crown of each seedling was enclosed in a 0.25 1
cuvette. Three seedlings per family or bulk population from replicate 2,
block 1 were measured during the first 45 minutes, and the next three
seedlings (replicate 3, block 1) from each family or bulk population were
measured during the next 45 minutes. Measurements were only taken on clear
days.
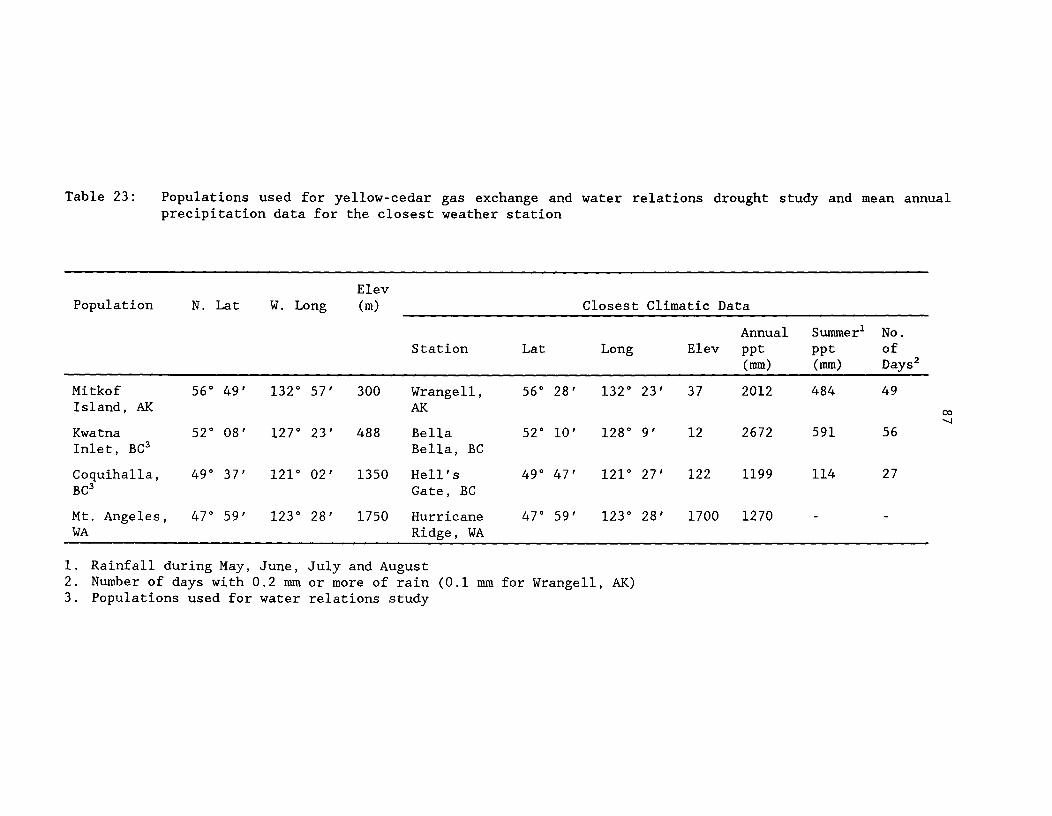
Table 23:^Populations used for yellow-cedar gas exchange and water relations drought study and mean annualprecipitation data for the closest weather station
ElevPopulation^N. Lat^W. Long^(m) Closest Climatic Data
Annual Summerl No.Station^Lat^Long^Elev ppt^ppt^of
^
(mm)^(mm)^Days2
Mitkof^56° 49'^132° 57'^300^Wrangell,^56° 28'^132° 23'^37^2012^484^49Island, AK^ AK
Kwatna^52° 08'^127° 23'^488^Bella^52° 10'^128° 9'^12^2672^591^56Inlet, BC3^ Bella, BC
Coquihalla,^49° 37'^121° 02'^1350^Hell's^490 47'^121° 27'^122^1199^114^27BC3^ Gate, BC
Mt. Angeles,^47° 59'^123° 28'^1750^Hurricane^470 59 ^123° 28'^1700^1270WA^ Ridge, WA
1. Rainfall during May, June, July and August2. Number of days with 0.2 mm or more of rain (0.1 mm for Wrangell, AK)3. Populations used for water relations study

88
The above design, measurements taken mid-morning on clear days, and
split into two replications, minimized environmental differences within and
between measurement dates. PAR averaged 430 Amol m-2 s-1 (s.e.=7.1) and 512
Amol m-2 s-1 (s.e.=6.9), and VPD 1.8 kPa (s.e.=0.22) and 1.95 kPa (s.e. =0.29)
during the first and second replications respectively, over all measurement
dates. These values of PAR and VPD represent ranges which have a minimal
effect on A and gs of yellow-cedar seedlings (Grossnickle and Russell 1991).
Prior to each gas exchange date, predawn shoot water potentials (4)
were measured on the same seedlings using a pressure chamber, for the first
five measurement dates only.
Foliage surface areas were estimated after the drydown period using a
LI-3100 area meter (Li-COR Inc., Lincoln, NE). Foliage areas were multiplied
by 2.45 to geometrically convert the foliage surface. As well, surface areas
were adjusted to allow for differential growth during the drydown period.
Gas exchange measurements were adjusted to reflect actual surface areas.
d) water relation measurements
Pressure-volume analysis was performed on six seedlings from each of
two families from each of two populations, Kwatna Inlet, B.C. and Coquihalla,
B.C. (Table 23), before, and after, the 6-week cyclic drydown period. Due to
a lack of seedlings, only one family (16-5) was in common with the gas
exchange study. Pressure-volume data were collected for two seedlings from
each family (n=8) on each of 3 days for both pre- and post-drydown.
Seedlings were removed from the greenhouse, transplanted in 11-litre pots,
rehydrated, sealed in plastic, and placed in the dark for 12 hours prior to
data collection. A lateral shoot was removed from a seedling at 0800 hours
89
and its saturated weight measured.^Pressure-volume curves were then
determined on the lateral shoot for each seedling by collecting measurements
of water potential and shoot mass at periodic intervals while, between
measurements, shoots transpired outside the pressure chamber on the
laboratory bench (Hinckley et al. 1980). Approximately 12-18 paired pressure
chamber and weight measurements were taken over a 6-8 hour period. Dry
weights of shoots were measured after oven-drying at 70° C for 24 hours.
Table 24 summarizes all traits that were either measured or derived in
the greenhouse environment study, along with the codes or symbols used in the
text, and in tables and figures.
3.2.3 Statistical Analyses
3.2.3.1 Morphological traits
a) anova models
Data were analyzed by ANOVA using PROC GLM TYPE III sums of squares
(SAS Inst. 1985). Four different linear models were used depending on the
objective of the analyses and the trait (Tables 25 and 26). Height, root
collar diameter, and growth (periodic and relative) were analyzed using the
complete data set (two blocks and four replications per block) (Table 25a and
25b), whereas the traits from destructive sampling (dry weights) and
additional seedling crown descriptors were measured and analyzed on a subset
of the data (three replications within block one) (Table 26a and 26b). Using
the appropriate ANOVA model described above, each trait was analyzed
according to two additional models: population structure only (all 18
populations included) (Model 1, Tables 25a and 26a), and; population and

90
Table 24: Description of measured and derived traits used in the greenhouseenvironment study for yellow-cedar (symbols used to describetrait in text in parenthesis)
1. Morphological traits
Total height (htl,ht2)
Height growth (htgrw2)
Relative growth rate (rgr2)
Periodic heights (ht1.1-ht1.7)
Periodic relative growth rate(rgr1.1-rgr1.7)
Root collar diameter (rcd2)
Root, mainstem, and branch dryweights (rtwt, stwt, brwt), andtotal dry weight (totdw)
Branch number (brno)
Branch length (brlgth)
Branch angle (brang)
2. Cold-hardiness traits
Injury to cold (injacc)
Lethal temperature (LT50)
3. Gas exchange traits
Predawn shoot water potential(4)
CO2 assimilation rate (A)
Stomatal conductance (gs)
main stem length measured from soilto tip of leader in cm for initialand final dates, respectively
total shoot elongation in cm duringthe study period
relative growth in mm/mm/yearduring the study period
growth in mm over seven 3-weekperiods during the study
relative growth rates in mm/mm/weekover seven 3-week periods duringthe study
final diameter measured at the rootcollar diameter in mm
dry weights in gm of 2-year-oldseedlings after the study period
number of branches greater than lmmon 2-year-old seedlings after thestudy period
length of longest branch inmidcrown in mm of 2-year-oldseedlings after the study period
acute angle of longest branch inmidcrown in degrees of 2-year-oldseedlings after the study period
index of injury (%) to cold afterthe study period during acclimation
temperature (°C) at which index ofinjury equals 50%
MPa
pmol/m2/s
cm/s
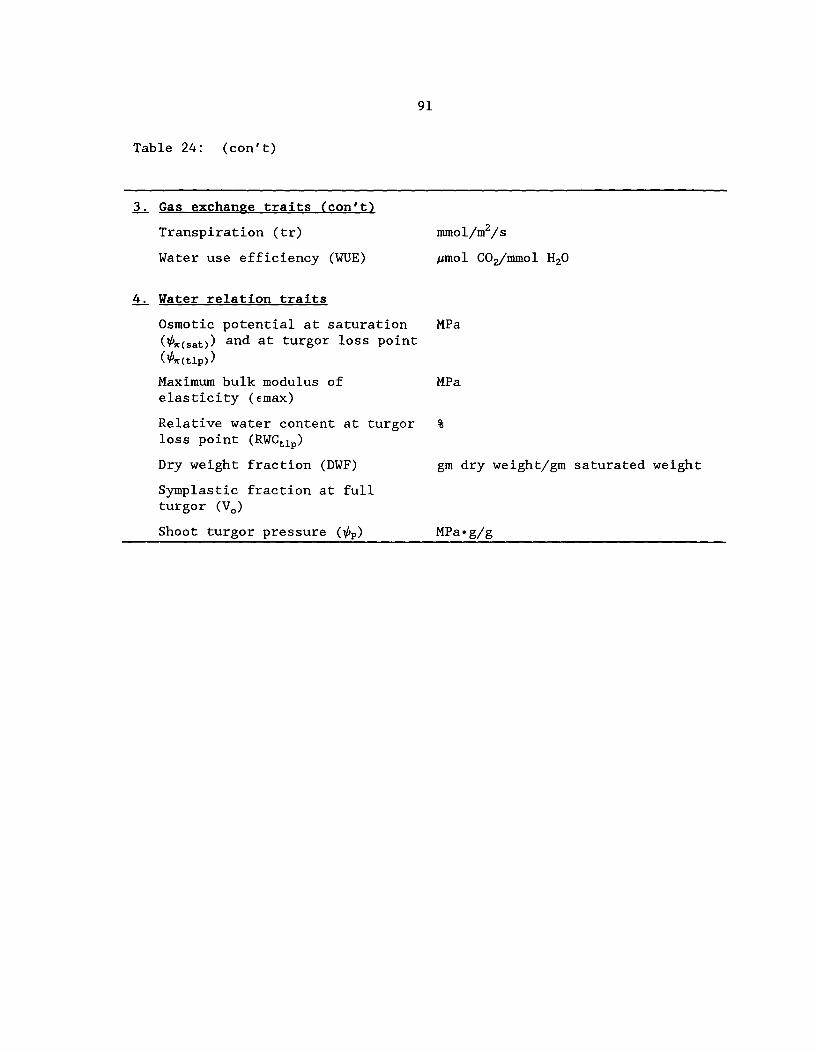
91
Table 24: (con't)
3. Gas exchange traits (con't)
Transpiration (tr)^mmol/m2/s
Water use efficiency (WUE)^pmol CO2/mmol H20
4. Water relation traits
Osmotic potential at saturation^MPa(14r(sat)) and at turgor loss point
(07r(m40)
Maximum bulk modulus of^MPaelasticity (Emax)
Relative water content at turgorloss point (RWCup)
Dry weight fraction (DWF)^gm dry weight/gm saturated weight
Symplastic fraction at fullturgor (V.)
Shoot turgor pressure (0p)^MPa.g/g

1
1
1
R(LWB)^
18
17
P*R(LWB)^408
error^*2
2e + nprbw01
" e_2 + nprblOw
+ nprlwa2b_2" e
^Ce ^2+ na2pr(b1w)^nPa r(b1w)
+ nrblwa2p^2 ^2
e '^pr(b1w)„2
e
92
Table 25:^ANOVA model for yellow-cedar greenhouse environment study:
height, height growth and diameter.^a. Model 1: populationstructure only; b. Model 2: population and family (population)
a.
Sourcel^df^
E(ms)4,5
b.
Sourcel^df^
E(MS)4.5
R(LWB)
P*R(LWB)
F(P)
F(P)*R(LWB)
error
1
1
1
18
8
192
18
432
*3
Ce
_2e
„.2e
c2e
„.2e
„.2e
„.2e
„2" e_2" e
+ nfprbw01
+ nfprblOw
+ nfprlwa2b
• na2f(p)r(b1w)
+ nbriWa2f(p) +
+ na2f(p)r(b1w)
+ na2 f(p)r(b1w)
+ na2f(p)r(b1w)
nfu2pr(biw)
▪
nfPa2r(b1w)
nfbrlwa2p
nfa2pr(b1w)
nbrlwa2f(p)
1. L = light, W — water, B — block, R — replication, P — population,F — family, (L,W — fixed; B, R(LWB), P, F(P) — random)
2. Error df vary from 3227 to 32353. Error df vary from 1862 to 18694. n, f, p, r, b, w, 1^— number of trees per family per population per
replication per block per watering regime per photoperiod treatment,number of families per population, number of populations, number ofreplications per block, number of blocks, number of watering regimes,and number of photoperiod treatments, respectively
5.^01, Ow, 0.2b, 0.2r(biw), „.2p c2 pr^„ f(p)r(lwb),
.2^_2"^awb),^f(p),"^"^" e —
variance components due to effect of photoperiod, watering regime,block, replication within the interaction of photoperiod, wateringregime and block, population, interaction of population andreplication, family within population, interaction of family withinpopulation and replication, and random error, respectively
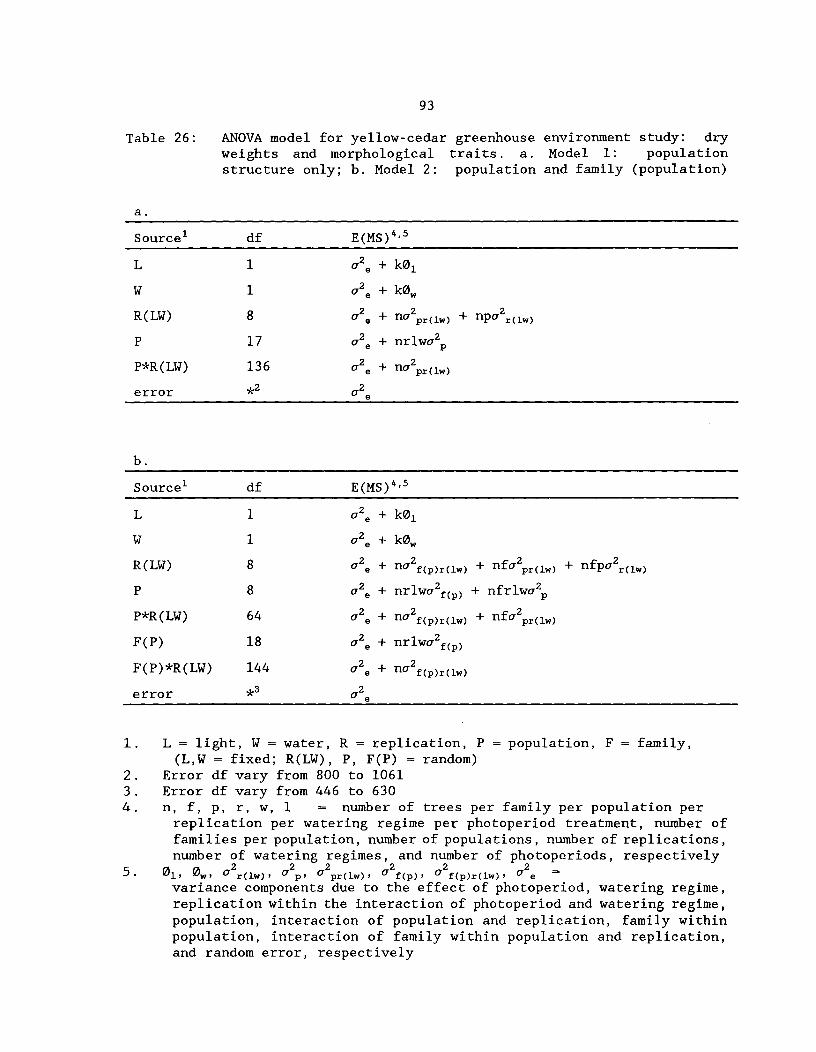
93
Table 26: ANOVA model for yellow-cedar greenhouse environment study: dryweights and morphological traits. a. Model 1: populationstructure only; b. Model 2: population and family (population)
a.
Sourcel^
df^E(MS)"
L 1^ 02e ± WI
W 1^02e + kOw
R(LW)^8^„,.2 _i_ „2^..„.„.2'-' e ' "" praw) 4- "1"`" r(lw)
P 17^02, + nrlwa2p
P*R (LW)^136^a2e ÷ 11.02pr(1m)
*2^„,.2error^ ‘-' e
b.
Sourcel^
df^E(MS)"
1^ + k0i
1
R(LW)^8
8
P*R(LW)^64
F(P)^18
F(P)*R(LW)^144
error^*3
a2e^kOw
„,2a2e^na2f(p),030^nfa2praw)^If.t,pu r(1w)
02e^nrlwa2f(p) + nfr1wa2p
a2e^na2f(p)r(1w)^pr(1w)
a2, + nr1wcr2f(p)
,r2 4_e 1 LI.LO f (p )r (iw)
1. L — light, W — water, R = replication, P — population, F — family,(L,W — fixed; R(LW), P, F(P) — random)
2. Error df vary from 800 to 10613. Error df vary from 446 to 6304. n, f, p, r, w, 1^— number of trees per family per population per
replication per watering regime per photoperiod treatment, number offamilies per population, number of populations, number of replications,number of watering regimes, and number of photoperiods, respectively
5.^01, Ow ,^ „.2^,2a 2r (1w)^C121)2 U2Pr (1W)^f(p)2^f(P)r(1W)^e -
variance components due to the effect of photoperiod, watering regime,replication within the interaction of photoperiod and watering regime,population, interaction of population and replication, family withinpopulation, interaction of family within population and replication,and random error, respectively

94
family within population (only the nine populations with family structure
included) (Model 2, Tables 25b and 26b).
In all of the above models, the photoperiod and watering regime
treatments were considered fixed. In the growth models, populations,
families within populations, blocks, and replications within blocks were
considered random, and in the dry weights and crown descriptor models,
populations, families within populations and replications were considered
random. Appropriate F-tests were constructed using Satterthwaite's
approximation Milliken and Johnson 1984).
For each of the four above models, and all traits, a full model
including all interactions was run. In no case were any genetic (population
or family within population) interactions with photoperiod, watering regime,
and photoperiod by watering regime interactions, large or significant. Thus,
Tables 25 and 26 represent reduced models, with non-significant interactions
pooled into the error term. Tables 25 and 26 outline the expected mean
squares for a completely balanced model.
b) analyses of covariance for dry matter partitioning
In order to investigate differential partitioning of dry matter to
roots, stems, and branches in response to varying environment and genetic
treatments, dry weight components were adjusted for correlative effects with
total dry weight. In general, seedling growth conforms to the theory of
allometric growth, such that:
Oi a(0)'^ (3.1)

95
where, Oi and Oj are the dry weights of two different organs, and a and b are
allometric constants (Ledig and Perry 1965, Bongarten and Teskey 1987). If
Oi represents either root, stem, or branch dry weight, and Oj total plant dry
weight, then the above equation suggests that Oi changes in a linear fashion
with an increase in plant size, such that,
log(01) = a + b*log(03). (3.2)
By testing for parallel or divergent regression lines, differences in dry
matter allocations by treatments can be investigated.
In order to investigate differences in allocation of dry matter in
response to the four environments used in this study, long-day, dry (LD),
long-day, wet (LW), short-day, dry (SD) and short-day, wet (SW), dry weight
data (roots (rtwt), stems (stwt), and branches (brwt)) were submitted to an
analysis of covariance using Proc GLM (SAS Inst 1985) individually for each
of the nine populations that had family structure (n=27 per population per
environment), and all populations considered together according to the
following model:
Yijk--- + Boi 81Xijk 81iXijk aj(i) (3.3)
where, Yijk is the log(root, stem, or branch dry weight) of the kth seedling,
k=1,...,27, in the jth replication j=1,...,3, of the ith environment,
1=1,...,4, 80 and 81 are average regression coefficients, E Eli are
environment effect coefficients, xijk, the covariate, is the log(total dry
weight), and aju) is the replication(environment) effect. Significant
differences among environments is indicative of differences in environment
means (intercept) and significant differences in environment by log(total dry
weight) effects are indicative of differences in regression slopes between
environments (Bongarten and Teskey 1987).
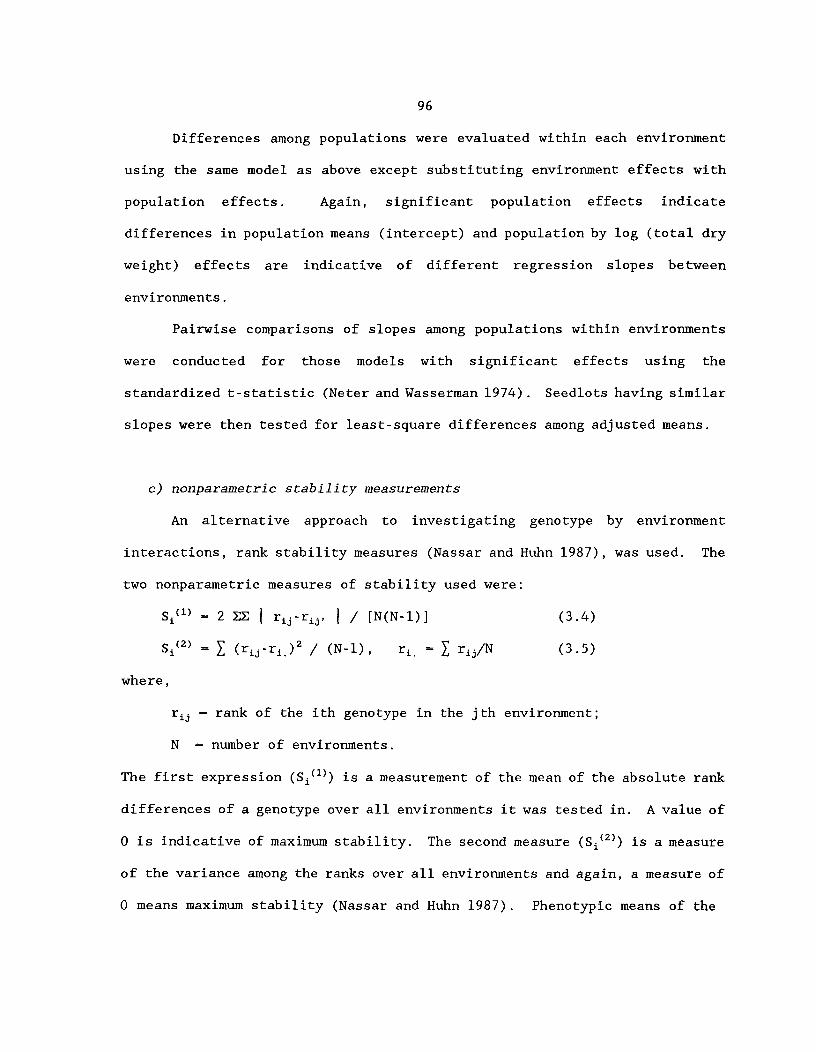
96
Differences among populations were evaluated within each environment
using the same model as above except substituting environment effects with
population effects. Again, significant population effects indicate
differences in population means (intercept) and population by log (total dry
weight) effects are indicative of different regression slopes between
environments.
Pairwise comparisons of slopes among populations within environments
were conducted for those models with significant effects using the
standardized t-statistic (Neter and Wasserman 1974). Seedlots having similar
slopes were then tested for least-square differences among adjusted means.
c) nonparametric stability measurements
An alternative approach to investigating genotype by environment
interactions, rank stability measures (Nassar and Huhn 1987), was used. The
two nonparametric measures of stability used were:
2 EZ^rij-rip^/ [N(N-1)]^(3.4)
si(2) (r1 -r1)2 / (N-1),^r ^rii/N^(3.5)
where,
rij = rank of the ith genotype in the jth environment;
N — number of environments.
The first expression (Si")) is a measurement of the mean of the absolute rank
differences of a genotype over all environments it was tested in. A value of
0 is indicative of maximum stability. The second measure (Si(2)) is a measure
of the variance among the ranks over all environments and again, a measure of
0 means maximum stability (Nassar and Huhn 1987). Phenotypic means of the

97
ith genotype in the jth environment were corrected for genotypic effects as
follows:
Xii =^(x ^x.^ (3.6)
where,
— = corrected mean of the ith genotype in the jth
environment;
— mean of ith genotype over N environments;
x ^overall mean of K genotypes and N environments.
Since each genotype is ranked separately by environment, and genotypic
effects are removed, the rank stability measures are attributed to genotype
by environment interactions only. A Chi-square test statistic was used to
test the null hypothesis that all genotypes are equally stable for each trait
measured (see Nassar and Huhn 1987).
d) correlations of morphology with geographic descriptors
Simple linear correlations were performed using SAS Proc CORR (SAS
Inst. 1985) for all growth and morphology traits within each environment,
with geographic descriptors.
3.2.3.2 Cold-hardiness measurements
Index of injury was calculated for each population at each test
temperature for each vial as described in Section 2.2.3.1 c). Index of
injury data were subjected to ANOVA using SAS PROC GLM Type III sums of
squares (SAS Inst. 1985). All main effects were considered fixed.
Temperature at which 50% index of injury occurs (LT50) was determined after
regressing index of injury values for each combination of population and
environment on test temperature using SAS Proc REG (SAS Inst. 1985).

98
3.2.3.3 Gas exchange and shoot water potential measurements
Response models for paired values of predawn shoot water potential to
A, gs, and water use efficiency (WUE—A/Tr) and A to gs, were developed using
curve-fitting regression analysis separately by population and by family
within population. Model selection was determined using SAS REG (SAS Inst.
1985) with stepwise selection of dependant variables, with variables being
entered/dropped if p>0.05 for partial F-test. Dependant variables included
x, x2, x3, l/x, 1/x2, and ln(x).
3.2.3.4 Water relation measurements
Pressure-volume curves were developed using a software program
developed by Schulte (1988), using non-linear, least-squares analysis
(Schulte and Hinckley 1985). Pressure-volume curves define the osmotic
potential at saturation (4(sat)) and turgor loss point(14(m4)), maximum bulk
modulus of elasticity (max), relative water content at turgor loss point
(RWC(tar)), and symplastic fraction at full turgor (V.). Dry weight fraction
(DWF) was calculated as grams dry weight/grams saturated weight for each
shoot. Least-square means for each trait by population and by family within
population were calculated for both pre- and post-drydown pressure-volume
curves, and multiple pair-wise tests performed (SAS Inst. 1985).
Response models for shoot turgor pressure (0p) to relative water content
were fitted using the same methods as described above for gas exchange data,
by population and family within population for both pre- and post-drydown.

99
3.3 RESULTS AND DISCUSSION
3.3.1 Morphological Traits
a) shoot growth
Overall, seedlings from the long-day, wet (LW) environment were taller
and had both the greatest height growth and relative height growth (Table
27). Seedlings grown under the short-day, dry (SD) regime were the shortest,
and had the least height growth. Seedlings grown under both the short-day,
wet (SW) and long-day, dry (LD) environments were similar, and intermediate,
between the LW and SD regimes, for shoot height growth response (Table 27).
Seedlings grown under the SW had the greatest root collar diameter, and
seedlings grown under both the LD and SD treatments the least. The root
collar diameter of seedlings grown under the LW were intermediate (Table 27).
The above results are similar to the results presented for other
Cupressaceae species when grown under similar environmental stresses,
including yellow-cedar (Arnott et al. 1992) and western redcedar (Major et
al. 1993).
Significant differences (p<0.01) were evident for total height, height
growth, and relative height growth for both the photoperiod and soil moisture
treatments, and for the soil moisture treatment only, for root collar
diameter (Table 28). There were no significant interactions of photoperiod
with soil moisture for any of the growth traits, as mentioned earlier.
Periodic shoot elongation presented as relative growth rate (mm/mm/wk)
was sensitive to environments (Tables 27 and 28, Figure 7). Significant
differences were apparent between the short and long photoperiod treatments
during weeks four to six (rgr1.2) and between weeks seven and nine (rgr1.3).
Photoperiod treatments started at the beginning of the study.
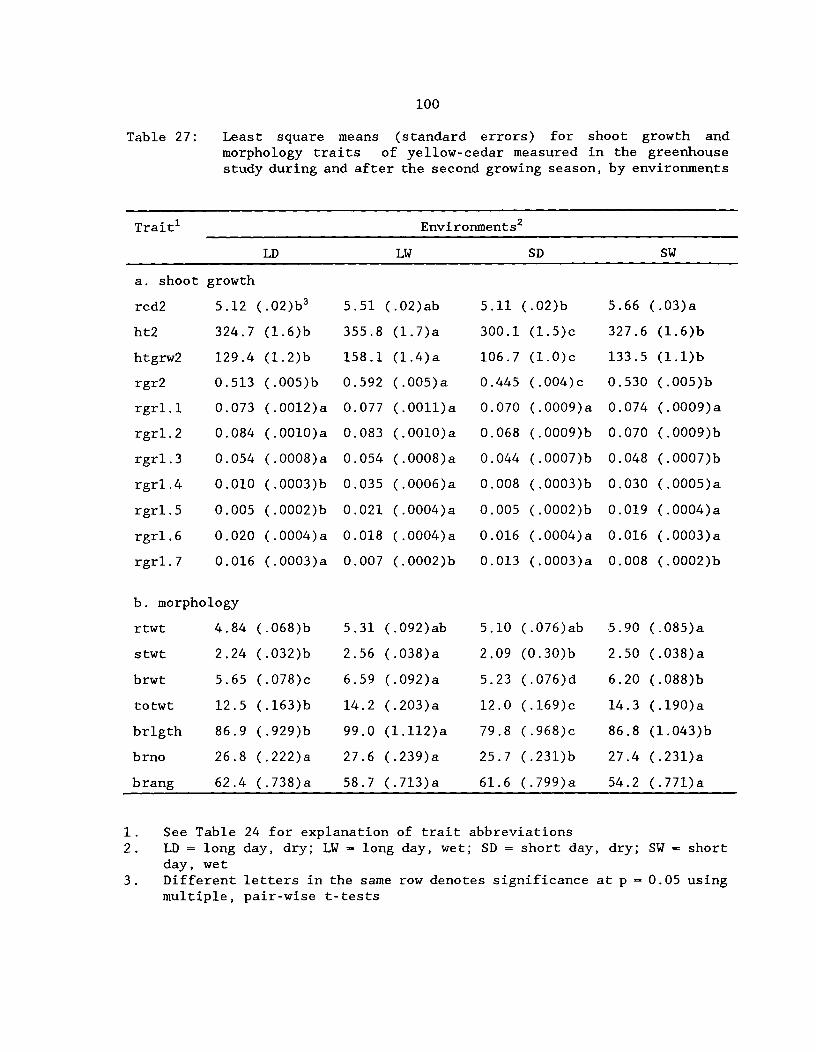
100
Table 27:^
Least square means (standard errors) for shoot growth andmorphology traits of yellow-cedar measured in the greenhousestudy during and after the second growing season, by environments
Traitl Environments2
LD LW SD SW
a. shoot growth
rcd2 5.12 (.02)b3 5.51 (.02)ab 5.11 (.02)b 5.66 (.03)a
ht2 324.7 (1.6)b 355.8 (1.7)a 300.1 (1.5)c 327.6 (1.6)b
htgrw2 129.4 (1.2)b 158.1 (1.4)a 106.7 (1.0)c 133.5 (1.1)b
rgr2 0.513 (.005)b 0.592 (.005)a 0.445 (.004)c 0.530 (.005)b
rgr1.1 0.073 (.0012)a 0.077 (.0011)a 0.070 (.0009)a 0.074 (.0009)a
rgr1.2 0.084 (.0010)a 0.083 (.0010)a 0.068 (.0009)b 0.070 (.0009)b
rgr1.3 0.054 (.0008)a 0.054 (.0008)a 0.044 (.0007)b 0.048 (.0007)b
rgr1.4 0.010 (.0003)b 0.035 (.0006)a 0.008 (.0003)b 0.030 (.0005)a
rgr1.5 0.005 (.0002)b 0.021 (.0004)a 0.005 (.0002)b 0.019 (.0004)a
rgr1.6 0.020 (.0004)a 0.018 (.0004)a 0.016 (.0004)a 0.016 (.0003)a
rgr1.7 0.016 (.0003)a 0.007 (.0002)b 0.013 (.0003)a 0.008 (.0002)b
b. morphology
rtwt 4.84 (.068)b 5.31 (.092)ab 5.10 (.076)ab 5.90 (.085)a
stwt 2.24 (.032)b 2.56 (.038)a 2.09 (0.30)b 2.50 (.038)a
brwt 5.65 (.078)c 6.59 (.092)a 5.23 (.076)d 6.20 (.088)b
totwt 12.5 (.163)b 14.2 (.203)a 12.0 (.169)c 14.3 (.190)a
brlgth 86.9 (.929)b 99.0 (1.112)a 79.8 (.968)c 86.8 (1.043)b
brno 26.8 (.222)a 27.6 (.239)a 25.7 (.231)b 27.4 (.231)a
brang 62.4 (.738)a 58.7 (.713)a 61.6 (.799)a 54.2 (.771)a
1. See Table 24 for explanation of trait abbreviations2. LD = long day, dry; LW - long day, wet; SD = short day, dry; SW - short
day, wet3.^Different letters in the same row denotes significance at p 0.05 using
multiple, pair-wise t-tests
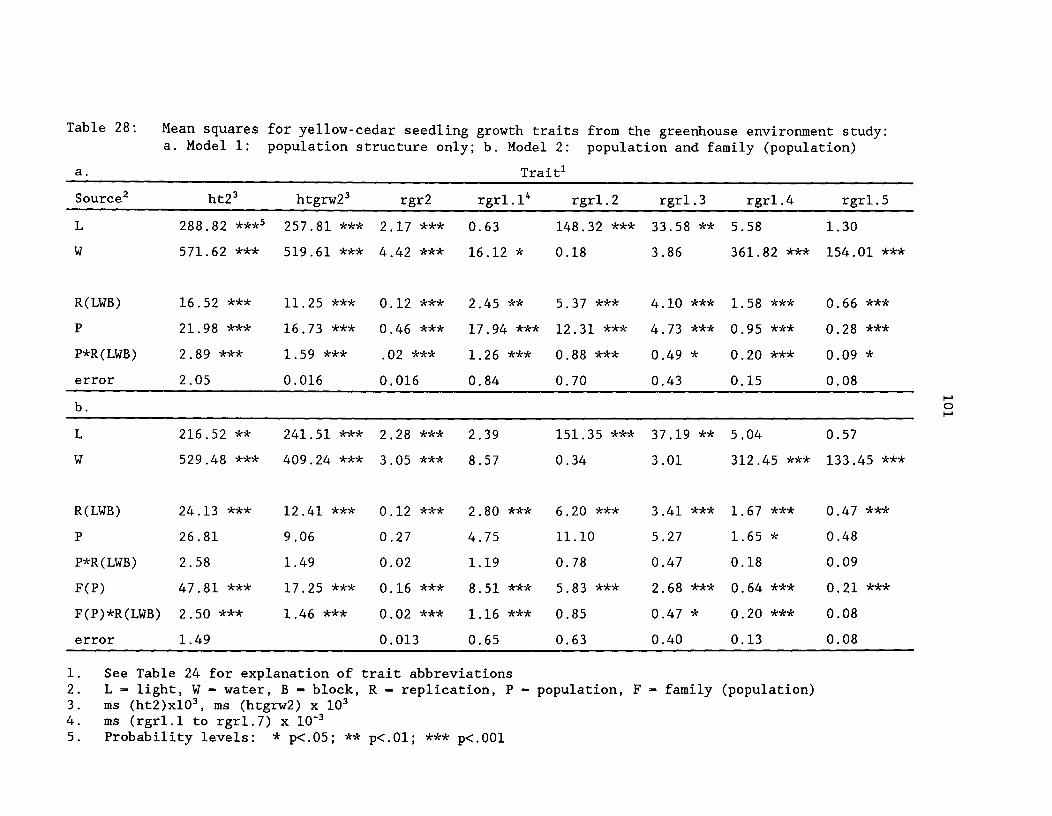
Table 28:
a.
Mean squares for yellow-cedar seedling growth traits from the greenhouse environment study:a. Model 1:^population structure only; b. Model 2:^population and family (population)
Trait'
Source2 ht23 htgrw23 rgr2 rgr1.14 rgr1.2 rgr1.3 rgr1.4 rgr1.5
L 288.82 ***5 257.81 *** 2.17 *** 0.63 148.32 *** 33.58 ** 5.58 1.30
W 571.62 *** 519.61 *** 4.42 *** 16.12 * 0.18 3.86 361.82 *** 154.01 ***
R(LWB) 16.52 *** 11.25 *** 0.12 *** 2.45 ** 5.37 *** 4.10 *** 1.58 *** 0.66 ***
P 21.98 *** 16.73 *** 0.46 *** 17.94 *** 12.31 *** 4.73 *** 0.95 *** 0.28 ***
P*R(LWB) 2.89 *** 1.59 *** .02 *** 1.26 *** 0.88 *** 0.49 * 0.20 *** 0.09 *
error 2.05 0.016 0.016 0.84 0.70 0.43 0.15 0.08
b.
L 216.52 ** 241.51 *** 2.28 *** 2.39 151.35 *** 37.19 ** 5.04 0.57
W 529.48 *** 409.24 *** 3.05 *** 8.57 0.34 3.01 312.45 *** 133.45 ***
R(LWB) 24.13 *** 12.41 *** 0.12 *** 2.80 *** 6.20 *** 3.41 *** 1.67 *** 0.47 ***
P 26.81 9.06 0.27 4.75 11.10 5.27 1.65 * 0.48
P*R(LWB) 2.58 1.49 0.02 1.19 0.78 0.47 0.18 0.09
F(P) 47.81 *** 17.25 *** 0.16 *** 8.51 *** 5.83 *** 2.68 *** 0.64 *** 0.21 ***
F(P)*R(LWB) 2.50 *** 1.46 *** 0.02 *** 1.16 *** 0.85 0.47 * 0.20 *** 0.08
error 1.49 0.013 0.65 0.63 0.40 0.13 0.08
1. See Table 24 for explanation of trait abbreviations2. L - light, W - water, B - block, R - replication, P - population, F - family (population)3. ms (ht2)x103, ms (htgrw2) x 1034. ms (rgr1.1 to rgr1.7) x 10-35.^Probability levels: * p<.05; ** p<.01; *** p<.001
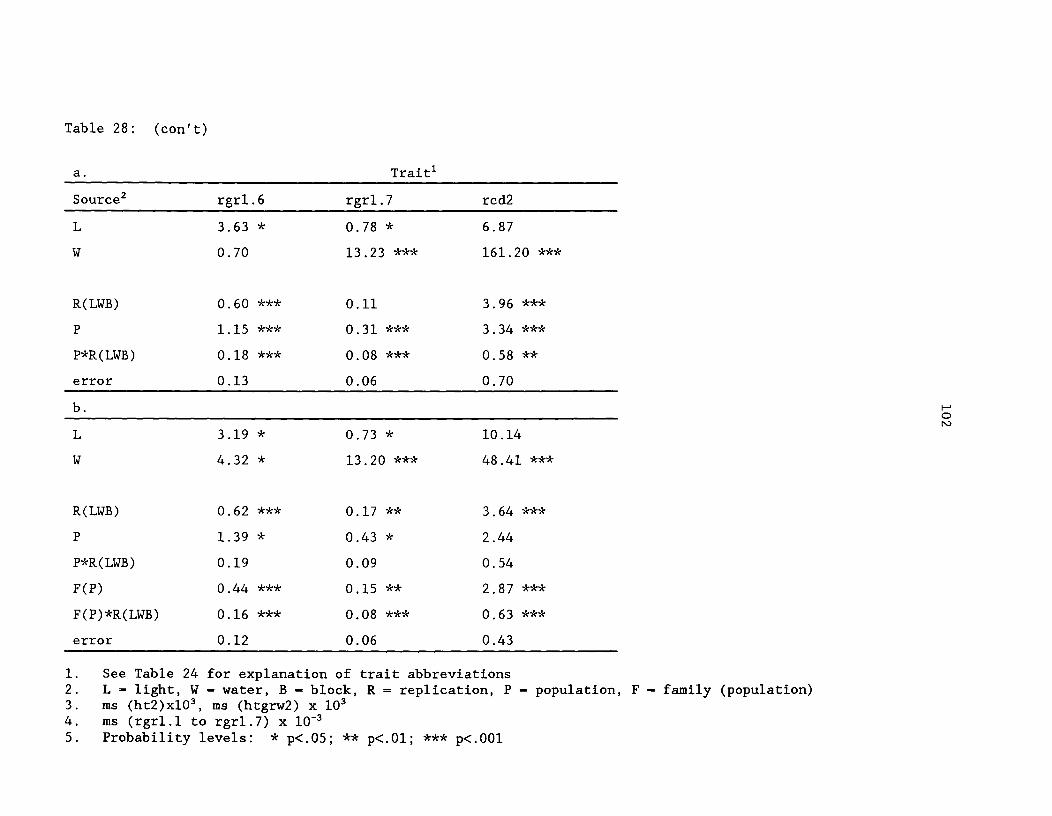
Table 28:^(con't)
a. Traitl
Source2 rgr1.6 rgr1.7 rcd2
L 3.63 * 0.78 * 6.87
W 0.70 13.23 *** 161.20 ***
R(LWB) 0.60 *** 0.11 3.96 ***
P 1.15 *** 0.31 *** 3.34 ***
P*R(LWB) 0.18 *** 0.08 *** 0.58 **
error 0.13 0.06 0.70
b.
L 3.19 * 0.73 * 10.14
W 4.32 * 13.20 *** 48.41 ***
R(LWB) 0.62 *** 0.17 ** 3.64 ***
P 1.39 * 0.43 * 2.44
P*R(LWB) 0.19 0.09 0.54
F(P) 0.44 *** 0.15 ** 2.87 ***
F(P)*R(LWB) 0.16 *** 0.08 *** 0.63 ***
error 0.12 0.06 0.43
1. See Table 24 for explanation of trait abbreviations2. L - light, W - water, B - block, R - replication, P - population, F - family (population)3. ms (ht2)x103, ms (htgrw2) x 1034. ms (rgr1.1 to rgr1.7) x 10-35.^Probability levels: * p<.05; ** p<.01; *** p<.001

rgr (mm/mm/wk)
0.08
0.06
0.04
0.02
0
0^3^6^9^12^15^18^
21^
24^
27
weeks in greenhouse
Figure 7: Average periodic relative growth rate over a 24-week period for yellow-cedar during their secondyear grown in four environments

104
Differences among the soil moisture treatments became pronounced during
the 10- to 12-week period (rgr1.4) which immediately followed the start of
the cyclic drydown, and continued for the duration of the drydown (week 13 to
15; rgr1.5). Photoperiodic effects were not significant during the drought
period, although seedlings from the long-day, wet environment had a greater
relative growth rate than seedlings from the short-day, wet environment.
During the three-week period following the drought, depending on the
model, there were no, or small, significant effects between the wet and dry
environments, and photoperiodic effects were again significant (Table 28).
During the last 6 weeks (rgr1.7), the relative growth rate of the seedlings
that had undergone a drought was significantly greater than seedlings growing
under the normal watering regime (p<0.001). Similarly, growth of the
seedlings that had experienced the short photoperiod, the photoperiods being
equal since September 15, was greater than the seedlings that had experienced
the longer photoperiod (p<0.05).
Again, these results are similar to those reported in the literature
for Cupressaceae species. In studies with seedlings of incense-cedar (Harry
1987), western redcedar (Krasowski and Owens 1991), and yellow-cedar (Arnott
et al. 1992), growth was either slowed or arrested, depending on the
treatment, during the treatment period, and growth rapidly increased, and in
most cases, surpassed, the growth of the controls upon release of the stress.
The results reported here, and in the literature for indeterminate species,
are different than those for determinate species. It has been shown that for
determinate species, short photoperiods and moisture stress applied during
the active growing season, usually results in decreased growth, formation of
a vegetative bud, and subsequent dormancy (e.g. Wareing 1956, Irgens-Moller

105
1957, Vaartaja 1959, Nienstadt and Olson 1961, Lavender et al. 1968, Heide
1974, Nelson and Lavender 1976, Bongarten and Teskey 1987, Joly et al. 1989,
Grossnickle et al 1991).
In Model 1, in which all 18 populations were included without family
structure, differences among populations were evident for all shoot growth
traits measured (Table 28a). When family structure was included in the ANOVA
with the nine populations and three families per population (Model 2),
populations accounted for little of the variability and were significant
(p<.05) for only three of the traits measured (rgr1.4, rgr1.6, and rgr1.7)
(Table 28b). All traits had significant family within population effects.
More variation was attributed to populations under Model 1 as compared
to Model 2. This difference can be explained by a combination of more
southern and northern populations included in Model 1, and the effect of
families within population on estimation of population mean squares. Levels
of variance attributed to families within populations (Model 2) and
populations (Model 1) are similar to those presented in Chapter 2, with two
to six times more variation attributed to families within populations for
second-year growth traits.
No population or family within population interactions with
environments were evident in either model for all shoot growth traits. In
most cases, the mean squares for these interactions were very small, with F
ratios resulting in p>0.5.
There were significant replication by population interactions in Model
1 and replication by family within population interactions in Model 2 for
shoot growth traits (Table 28). Thus, although population effects were
significant in Model 1 and family within population effects in Model 2,
106
these are not strictly interpretable. However, the amount of variation
attributed to these interactions are minimal relative to genetic effects.
The major cause of these interactions is most likely small plot size.
In the only other comprehensive study reported in the literature with
a Cupressaceae species involving genetic structure and environment stress,
Harry (1987) showed that shoot relative growth rate response to moisture
stress was very sensitive, showed very little genetic variability, and no
significant genotype by environment interactions. Genetic differences among
families within stands were apparent at the beginning of the study prior to
the start of moisture stress, however, during the study very little variation
was attributed to genetics and most to differences among environments (Harry
1987). In the present study, genetic variability among families within
populations, although significant, did decrease substantially during the
course of the study and most of the variability was attributed to differences
between either or both the photoperiod and soil moisture treatments.
b) dry weight production
Seedlings grown under both the LW and SW environment produced the
greatest total dry weight, seedlings grown under SD the least, and LD
intermediate (Table 27). Distribution of dry matter was influenced by the
environments such that seedlings grown under LW and SW had more stem weight
and branch weight than those in the LD and SD environments, and seedlings
grown under the SW regime had more root weight than those grown under LD.
Total dry weight differed only between the two soil moisture treatments
according to ANOVA (Table 29). Stem weight was strongly influenced by
drought, but only marginally so by photoperiod, whereas branch weight was
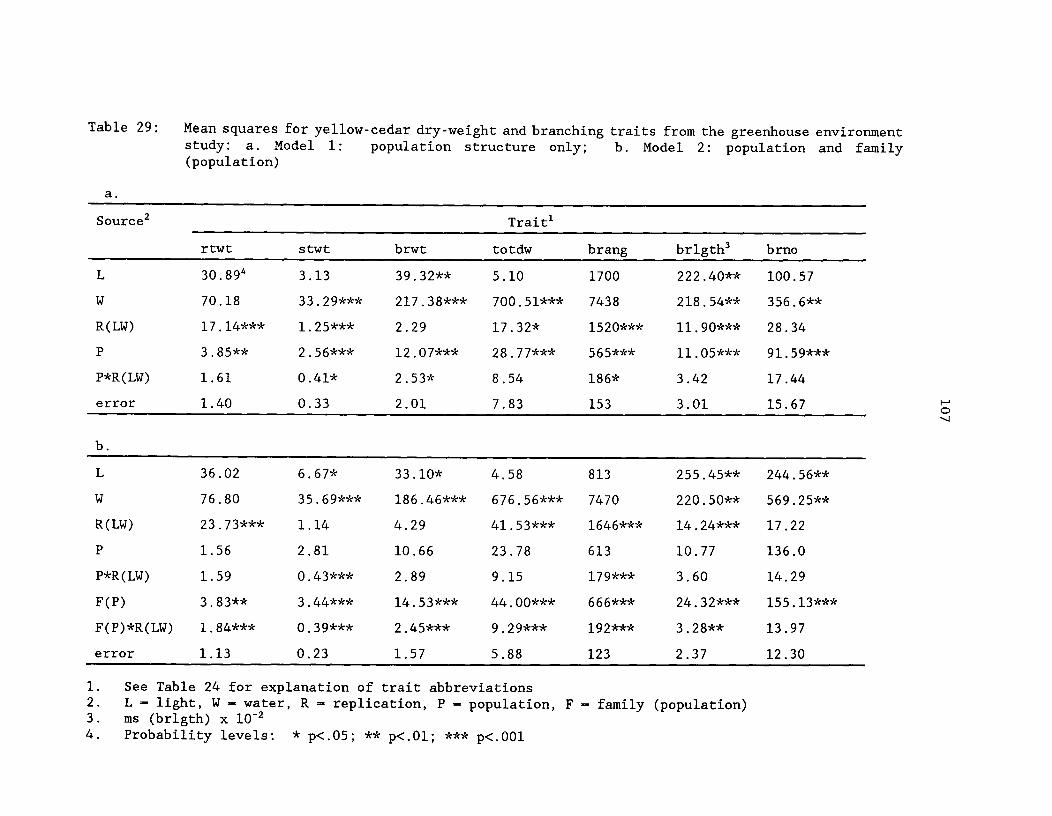
Table 29:
a.
Mean squares for yellow-cedar dry-weight and branching traits from the greenhouse environmentstudy: a. Model 1: population structure only; b. Model 2: population and family(population)
Source2 Traitl
rtwt stwt brwt totdw brang brlgth3 brno
L 30.894 3.13 39.32** 5.10 1700 222.40** 100.57
W 70.18 33.29*** 217.38*** 700.51*** 7438 218.54** 356.6**
R(LW) 17.14*** 1.25*** 2.29 17.32* 1520*** 11.90*** 28.34
P 3.85** 2.56*** 12.07*** 28.77*** 565*** 11.05*** 91.59***
P*R(LW) 1.61 0.41* 2.53* 8.54 186* 3.42 17.44
error 1.40 0.33 2.01 7.83 153 3.01 15.67
b.
L 36.02 6.67* 33.10* 4.58 813 255.45** 244.56**
W 76.80 35.69*** 186.46*** 676.56*** 7470 220.50** 569.25**
R(LW) 23.73*** 1.14 4.29 41.53*** 1646*** 14.24*** 17.22
P 1.56 2.81 10.66 23.78 613 10.77 136.0
P*R(LW) 1.59 0.43*** 2.89 9.15 179*** 3.60 14.29
F(P) 3.83** 3.44*** 14.53*** 44.00*** 666*** 24.32*** 155.13***
F(P)*R(LW) 1.84*** 0.39*** 2.45*** 9.29*** 192*** 3.28** 13.97
error 1.13 0.23 1.57 5.88 123 2.37 12.30
1. See Table 24 for explanation of trait abbreviations2. L - light, W - water, R - replication, P - population, F - family (population)3. ms (brlgth) x 10-24. Probability levels: * p<.05; ** p<.01; *** p<.001
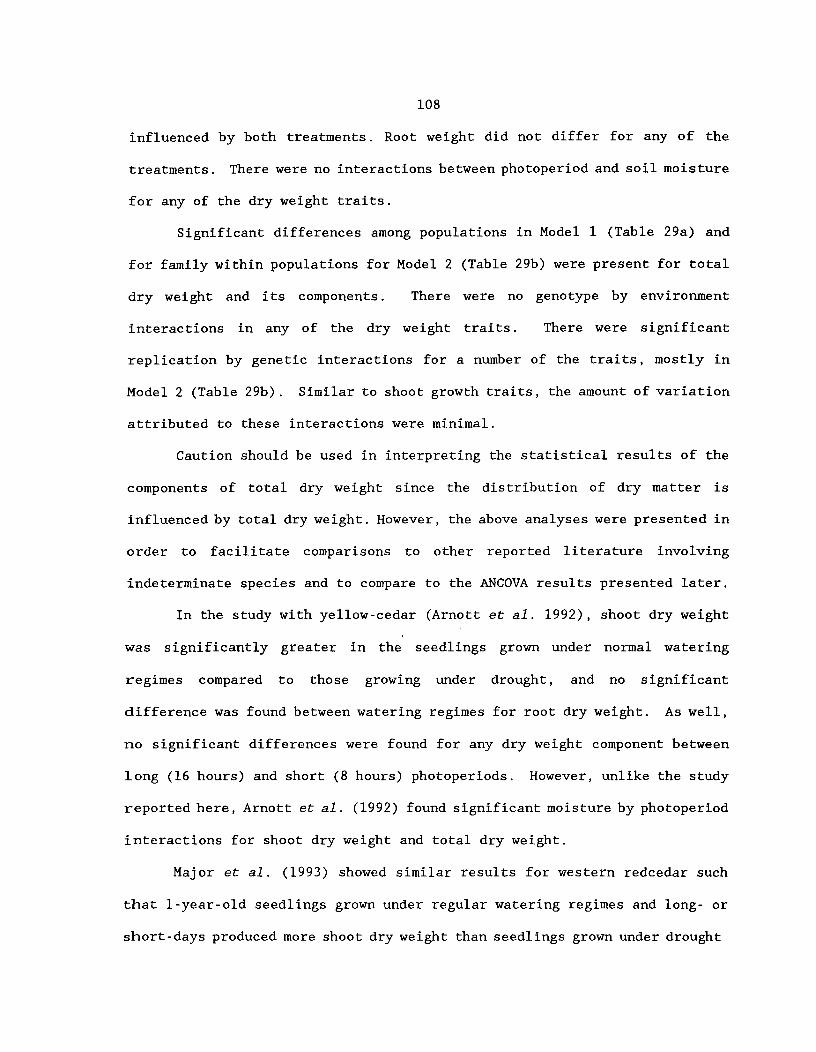
108
influenced by both treatments. Root weight did not differ for any of the
treatments. There were no interactions between photoperiod and soil moisture
for any of the dry weight traits.
Significant differences among populations in Model 1 (Table 29a) and
for family within populations for Model 2 (Table 29b) were present for total
dry weight and its components. There were no genotype by environment
interactions in any of the dry weight traits. There were significant
replication by genetic interactions for a number of the traits, mostly in
Model 2 (Table 29b). Similar to shoot growth traits, the amount of variation
attributed to these interactions were minimal.
Caution should be used in interpreting the statistical results of the
components of total dry weight since the distribution of dry matter is
influenced by total dry weight. However, the above analyses were presented in
order to facilitate comparisons to other reported literature involving
indeterminate species and to compare to the ANCOVA results presented later.
In the study with yellow-cedar (Arnott et al. 1992), shoot dry weight
was significantly greater in the seedlings grown under normal watering
regimes compared to those growing under drought, and no significant
difference was found between watering regimes for root dry weight. As well,
no significant differences were found for any dry weight component between
long (16 hours) and short (8 hours) photoperiods. However, unlike the study
reported here, Arnott et al. (1992) found significant moisture by photoperiod
interactions for shoot dry weight and total dry weight.
Major et al. (1993) showed similar results for western redcedar such
that 1-year-old seedlings grown under regular watering regimes and long- or
short-days produced more shoot dry weight than seedlings grown under drought

109
stress in either long- or short-days. As well, no differences were evident
among treatments for root dry weight.
c) dry weight partitioning
Within each population, and considering all populations together, there
were no significant differences in either environment means (intercept) or
environment by log(total dry weight) effects (results not shown). The
covariate, log(total dry weight), was significant (p<0.001) in every case.
Thus environments did not significantly change yellow-cedar growth allometric
parameters. Allocation of dry matter to roots, stems and branches within
each environment did not differ among populations and was only significant
for slope for roots and stems in the long-day, dry environment (Table 30).
The above results are in contrast to those presented in the last
section for dry weight traits not adjusted for total weight. With total dry
weight taken into consideration, moisture and photoperiodic effects had no
significant impact on dry matter allocation and populations had minimal
impact. Bongarten and Teskey (1987), reported significant differences in dry
weight allocation in loblolly pine populations in response to moisture. In
general, seedlings grown under the dry regime had an increase in the
allocation of root weight at the expense of stem weight. This response
varied significantly by population. There was no significant change in dry
matter allocation to branches in response to moisture, however, there was a
significant difference among populations (Bongarten and Teskey 1987).
The allometric relationship has been used in past studies to
investigate the changes in root:shoot dry weight ratios with environment
treatments or genetics (e.g. Ledig and Perry 1965, Ledig et al. 1970, Cannell

Table 30:^Mean squares from analysis of covariance for yellow-cedar dry weight traits from thegreenhouse environment study, by environment
Source2^
Environments'
LD LW SD
root 3 stem branch root stem branch root stem branch
0.0374
0.077
0.068
0.021
0.012
0.038*
0.005
0.154***
0.023
0.116*
0.003
0.042**
0.017
0.041
0.025
0.044
0.017
0.025
P*R 0.031* 0.032 0.015* 0.024 0.026 0.006 0.025* 0.048* 0.018*
Coy 4.973*** 4.978*** 7.418*** 6.917*** 8.02*** 8.58*** 4.978*** 5.976*** 10.06***
P*Cov 0.035* 0.067*** 0.011 0.004 0.019 0.003 0.015 0.022 0.015
R*Cov 0.063* 0.017 0.030* 0.083* 0.063 0.027* 0.043* 0.040 0.026
error 0.015 0.020 0.008 0.020 0.027 0.006 0.013 0.025 0.009
1. LD - long day, dry; LW - long day, wet; SD - short day, dry; SW - short day, wet2. P - population, R - replication, Coy - log. (total dry weight)3. Root - log. (root dry weight), stem - log. (stem dry weight), branch - log. (branch dry weight)4. Probability levels: * p<.05; ** p<.01; *** p<.001
cp
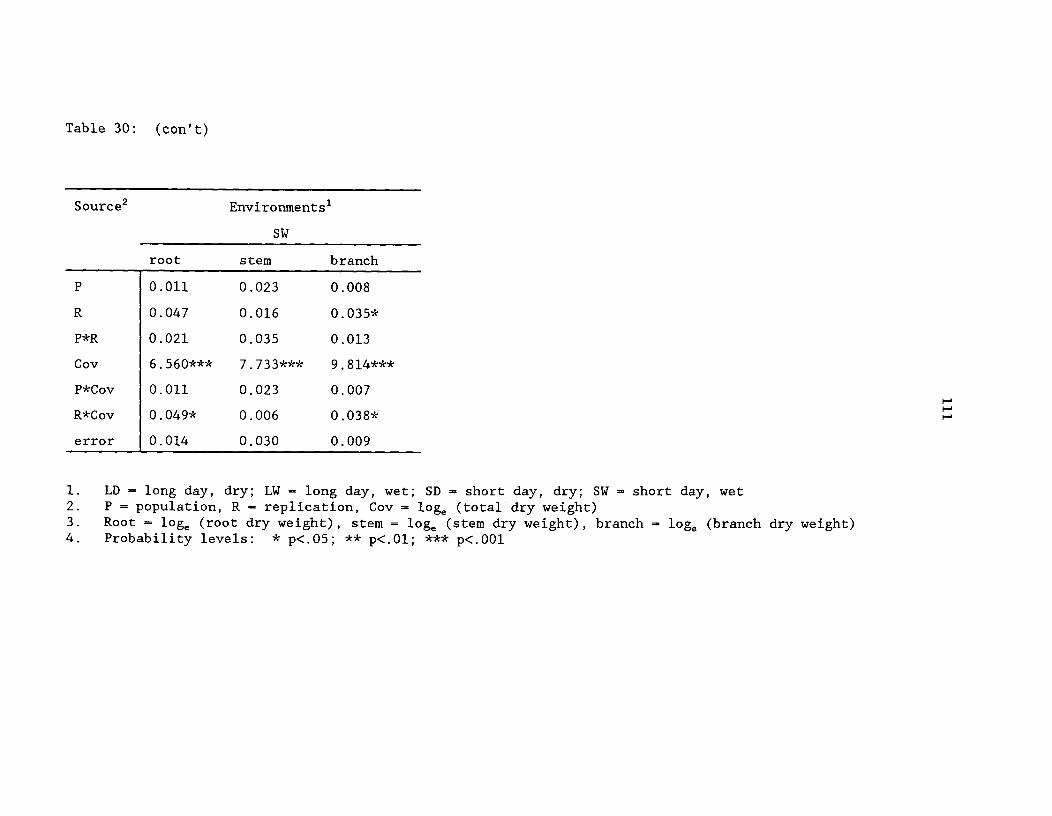
Table 30: (con't)
Source2^Environments'
SW
root stem branch
P 0.011 0.023 0.008
R 0.047 0.016 0.035*
P*R 0.021 0.035 0.013
Coy 6.560*** 7.733*** 9.814***
P*Cov 0.011 0.023 0.007
R*Cov 0.049* 0.006 0.038*
error 0.014 0.030 0.009
1. LD — long day, dry; LW — long day, wet; SD — short day, dry; SW — short day, wet2. P — population, R — replication, Coy — loge (total dry weight)3. Root — loge (root dry weight), stem = loge (stem dry weight), branch — loge (branch dry weight)4. Probability levels: * p<.05; ** p<.01; *** p<.001
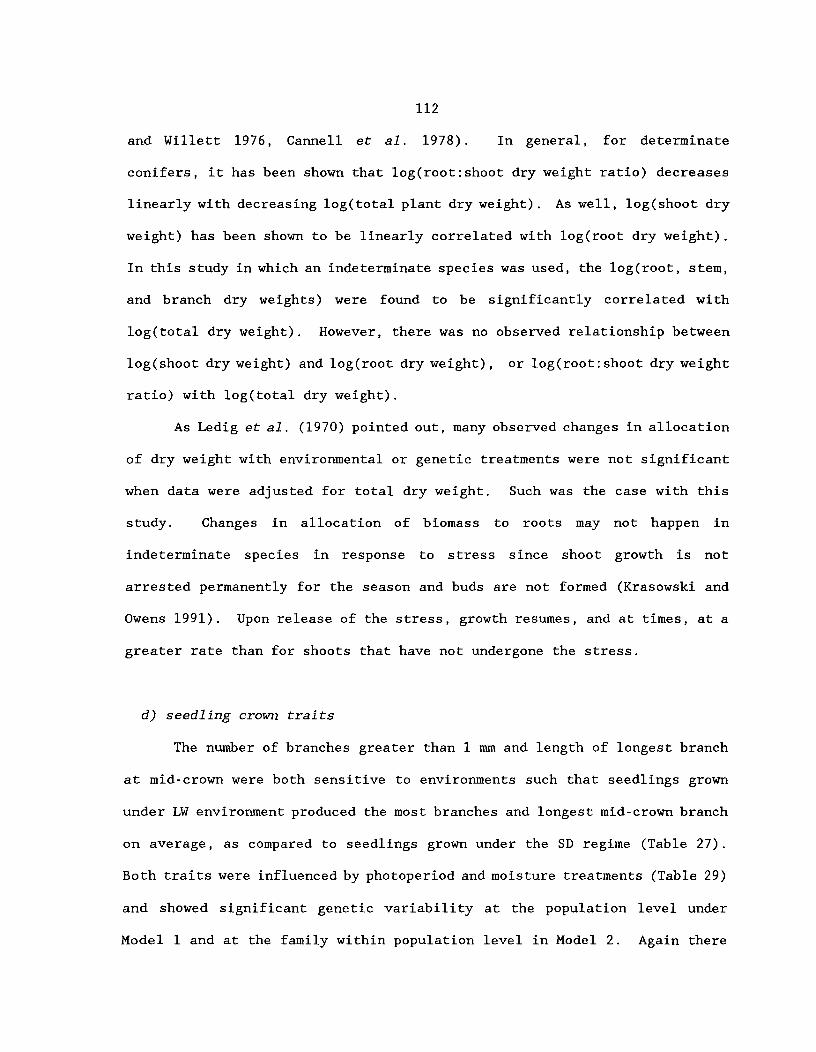
112
and Willett 1976, Cannell et al. 1978). In general, for determinate
conifers, it has been shown that log(root:shoot dry weight ratio) decreases
linearly with decreasing log(total plant dry weight). As well, log(shoot dry
weight) has been shown to be linearly correlated with log(root dry weight).
In this study in which an indeterminate species was used, the log(root, stem,
and branch dry weights) were found to be significantly correlated with
log(total dry weight). However, there was no observed relationship between
log(shoot dry weight) and log(root dry weight), or log(root:shoot dry weight
ratio) with log(total dry weight).
As Ledig et al. (1970) pointed out, many observed changes in allocation
of dry weight with environmental or genetic treatments were not significant
when data were adjusted for total dry weight. Such was the case with this
study. Changes in allocation of biomass to roots may not happen in
indeterminate species in response to stress since shoot growth is not
arrested permanently for the season and buds are not formed (Krasowski and
Owens 1991). Upon release of the stress, growth resumes, and at times, at a
greater rate than for shoots that have not undergone the stress.
d) seedling crown traits
The number of branches greater than 1 mm and length of longest branch
at mid-crown were both sensitive to environments such that seedlings grown
under LW environment produced the most branches and longest mid-crown branch
on average, as compared to seedlings grown under the SD regime (Table 27).
Both traits were influenced by photoperiod and moisture treatments (Table 29)
and showed significant genetic variability at the population level under
Model 1 and at the family within population level in Model 2. Again there
113
were no significant interactions of photoperiod and watering regime or
environments and genotypes.
The acute angle of the mid-crown branch was not influenced by
environment (Tables 27 and 29), however, there were genetic differences at
both the population (Model 1) and family within population (Model 2) level.
It is well documented in the literature that branch angle is a highly
heritable trait, and as such, environment has a minimal impact on its
phenotypic expression.
e) stability
According to Huhn's rank stability measures (Table 31), there were no
significant differences in stability among the 18 populations or the 27
families for all traits measured. Only three of the test statistics were
significant for the variance of rank deviations (p<0.05). Thus, results
from both the ANOVA and rank stability measures are consistent and indicate
the lack of genotype by environment interactions. Consistent results between
mean squares for genotype by environment and rank stability measures have
been reported elsewhere (Skroppa 1984, St. Clair and Kleinschmit 1986).
f) trait correlations with population origin
Correlations of growth and morphology traits with geographic
descriptors were minimal. This is not surprising since the populations used
in this study did not represent the entire range of yellow-cedar's geographic

114
Table 31:^Chi-square tests for rank stability statistics of 18 populationsand 27 families of yellow-cedar grown over four environments forshoot growth and morphological traits
Traitl Population2 Family3
Si S2 Si S2
ht2 23.624 25.14 26.33 37.15
htgrw2 25.20 37.77 ** 22.76 33.35
rgr2 27.32 35.47 ** 25.48 29.92
rcd2 20.41 23.15 29.19 36.17
rtwt 20.26 20.98 23.51 28.27
stwt 19.66 20.25 17.76 25.33
brwt 18.78 21.97 29.14 42.58 *
totdw 12.48 14.73 26.35 29.09
brno 19.89 27.24 31.42 35.56
brlgth 19.76 19.41 23.87 35.33
1.^See Table 24 for explanation of trait abbreviations••^X20.0517 = 27.63. X2 0.05;26 = 38.94. Probability levels: * p<.05; ** p<.01
distribution. The more southerly populations from Oregon were not included
in this study (lack of seedlings) and, as discussed in Chapter 2, significant
adaptive trends are only apparent when seedlings from these populations are
included.
Correlations of growth and morphology traits with latitude and
elevation by environment are presented in Table 32 for those combinations
which were significant (p<0.05). The most striking result is the stronger
and more abundant correlations using plants grown under the intermediate

115
Table 32:^Simple linear correlation coefficients' for growth and morphology
traits based on population mean and geographic descriptors ofseed origin for 2-year-old yellow-cedar grown under fourenvironments (n-17)
Environment3 Trait2
ht2 rcd2 rtwt stwt brwt
LDlatitude -.47 -.58 -.52 -.48elevation -.57
LWlatitude -.46elevation .48
SDlatitude -.57 .43elevation .46
SWlatitude -.50 -.40elevation .57 -.43
1. Only those correlation coefficients in which p<.05 are presented2. See Table 24 for explanation of trait abbreviations3.^LD — long day, dry; LW — long day, wet; SD — short day, dry; SW — short
day, wet
stressful environments (LD and SW). Seedlings grown under only one stress,
for example drought, had significant correlations between latitude of seed
origin and total height, root collar diameter, root weight and shoot weight.
When grown under no moisture or light stress, only root collar diameter was
significantly correlated with latitude.
There was no evidence from this study of photoperiodic ecotypes. If
photoperiodic ecotypes are present, then seedlings originating from
populations with lower probabilities of early fall frosts (i.e. more
116
southerly populations) should grow relatively more into the fall than
seedlings from populations with a greater chance of early fall frost (i.e.
more northern populations) when grown under shortened photoperiods (Vaartaja
1959, 1962). This was not the case for the results presented from this study
for all morphological traits analyzed. Apparent discrepancies with the
results from Chapter 2, in which more southerly populations inherently had
greater shoot elongation and diameter growth, and grew longer into the fall
in a common-garden at approximately 490 latitude could be explained by the
small differences in duration of daylength between the two photoperiods and
by the lack of Oregon populations in this study. Demonstration of
photoperiodic ecotypes for indeterminate species (Vaartaja 1959, 1962)
required the comparisons of very long photoperiods (18-20 hours) versus very
short periods (<8 hours).
On the other hand, the evidence of strong plastic control of shoot
growth and other morphological traits, along with the apparent lack of
population by environment interactions, is indicative of less population
differentiation in photoperiodic response for yellow-cedar.
3.3.2 Cold-hardiness
All main effects except photoperiod treatments were large and
significant for index of injury (Table 33). There were significant
interactions for watering regime and population, temperature and population,
and watering regime, temperature and population. Seedlings from the short-
day, dry environment were the most cold-susceptible with an LT50 of -12.6° C,
and seedlings from the long-day, wet environment were the least susceptible
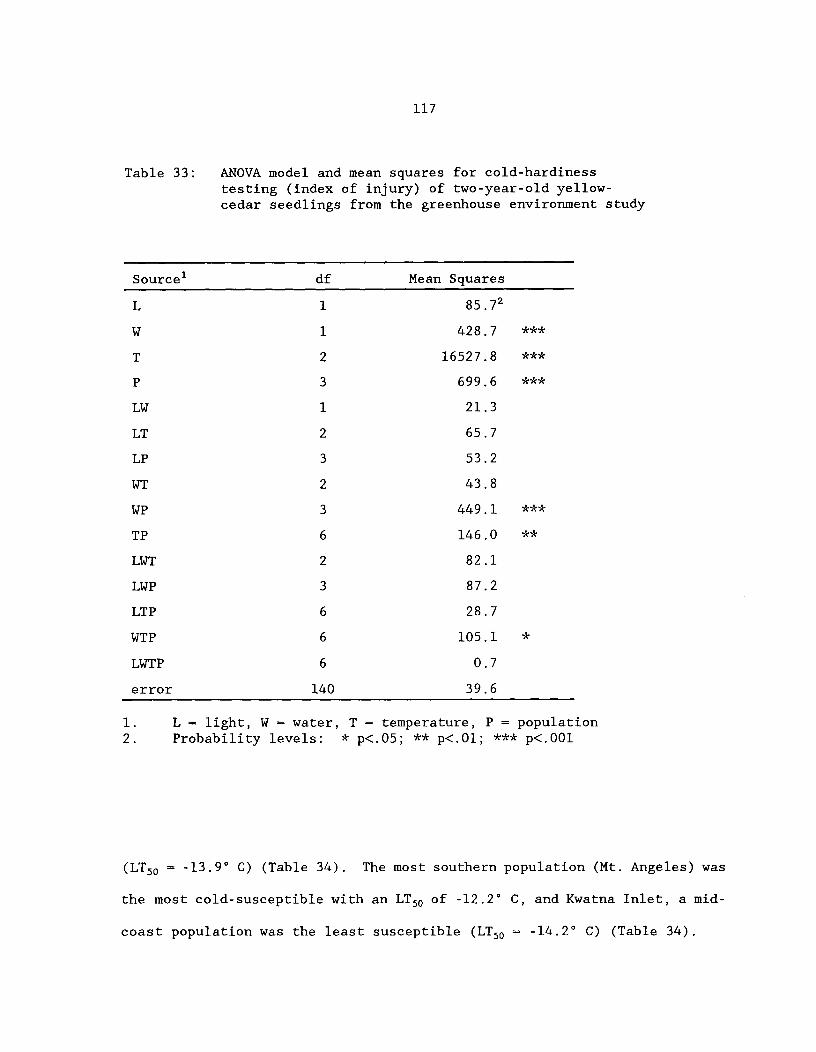
117
Table 33: ANOVA model and mean squares for cold-hardinesstesting (index of injury) of two-year-old yellow-cedar seedlings from the greenhouse environment study
Sourcel df Mean Squares
L 1 85.72
W 1 428.7 ***
T 2 16527.8 ***
P 3 699.6 ***
LW 1 21.3
LT 2 65.7
LP 3 53.2
WT 2 43.8
WP 3 449.1 ***
TP 6 146.0 **
LWT 2 82.1
LWP 3 87.2
LTP 6 28.7
WTP 6 105.1 *
LWTP 6 0.7
error 140 39.6
1. L = light, W = water, T = temperature, P = population2. Probability levels: * p<.05; ** p<.01; *** p<.001
(LT50 = -13.9° C) (Table 34). The most southern population (Mt. Angeles) was
the most cold-susceptible with an LT50 of -12.2° C, and Kwatna Inlet, a mid-
coast population was the least susceptible (LT50 — -14.2° C) (Table 34).
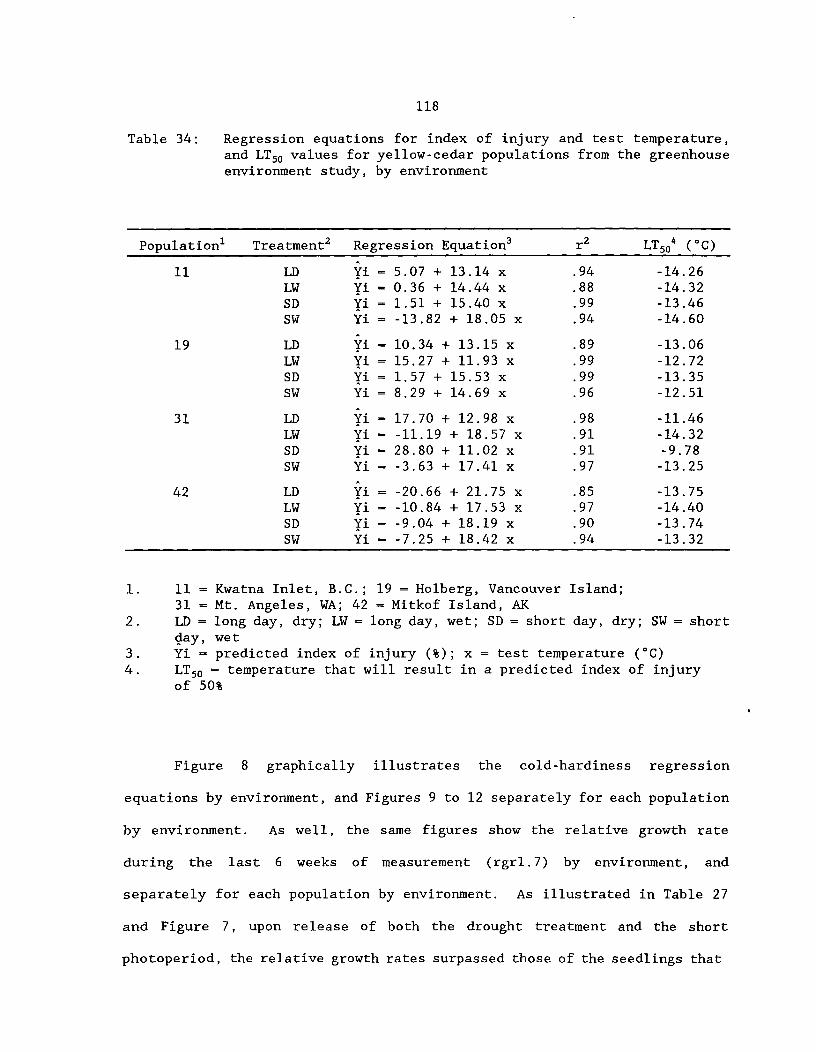
118
Table 34:^Regression equations for index of injury and test temperature,and LT50 values for yellow-cedar populations from the greenhouseenvironment study, by environment
Population'^Treatment2 Regression Equation2^
r2^LT504 (°C)
11 LD^ii = 5.07 + 13.14 x^.94^-14.26LW^yi - 0.36 + 14.44 x^.88^-14.32SD^yi - 1.51 + 15.40 x^.99^-13.46SW^Yi = -13.82 + 18.05 x^.94^-14.60
19^LD^yi - 10.34 + 13.15 x^.89^-13.06LW^yi = 15.27 + 11.93 x^.99^-12.72SD^yi - 1.57 + 15.53 x^.99^-13.35SW^Yi = 8.29 + 14.69 x^.96^-12.51
31^LD^Yi - 17.70 + 12.98 x^.98^-11.46LW^yi = -11.19 + 18.57 x^.91^-14.32SD^yi - 28.80 + 11.02 x^.91^-9.78SW^Yi - -3.63 + 17.41 x^.97^-13.25
42^LD^14 = -20.66 + 21.75 x^.85^-13.75LW^yi - - 10.84 + 17.53 x^.97^-14.40SD^yi = - 9.04 + 18.19 x^.90^-13.74SW^Yi = -7.25 + 18.42 x^.94^-13.32
1. 11 = Kwatna Inlet, B.C.; 19 = Holberg, Vancouver Island;31 = Mt. Angeles, WA; 42 - Mitkof Island, AK
2. LD - long day, dry; LW = long day, wet; SD = short day, dry; SW = shortday, wet
3. Yi - predicted index of injury (%); x = test temperature (°C)4. LT50 = temperature that will result in a predicted index of injury
of 50%
Figure 8 graphically illustrates the cold-hardiness regression
equations by environment, and Figures 9 to 12 separately for each population
by environment. As well, the same figures show the relative growth rate
during the last 6 weeks of measurement (rgr1.7) by environment, and
separately for each population by environment. As illustrated in Table 27
and Figure 7, upon release of both the drought treatment and the short
photoperiod, the relative growth rates surpassed those of the seedlings that
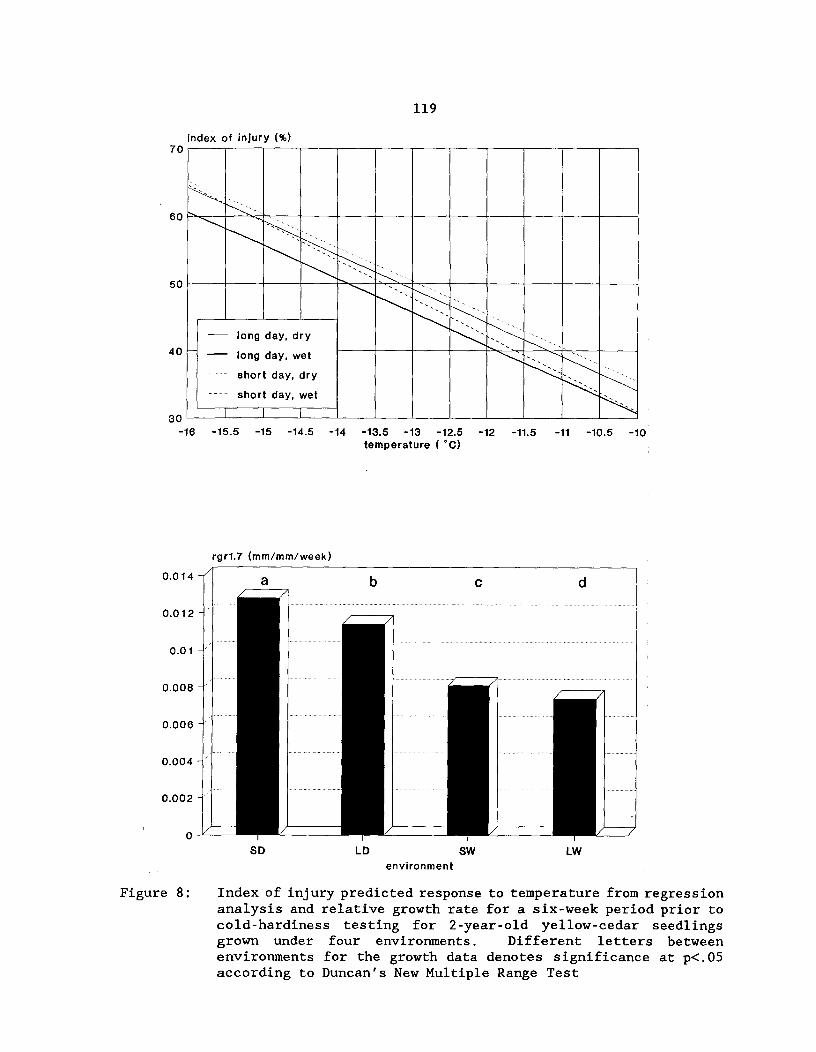
long day, dry
long day, wet
short day, dry
short day, wet
0.014
0.012-
0.01-
0.008 -
0.006 —
0.004 -
0.002 -
119
index of injury (%)70
60
50
40
30-16^-15.5^-15^-14.5^-14^-13.5 -13^-12.5^-12^-11.5^-11^-10.5^-10
temperature ( °C)
rgr1.7 (mm/mm/week)
SD^
LD^
SW^
LWenvironment
Figure 8:^
Index of injury predicted response to temperature from regressionanalysis and relative growth rate for a six-week period prior tocold-hardiness testing for 2-year-old yellow-cedar seedlingsgrown under four environments. Different letters betweenenvironments for the growth data denotes significance at p<.05according to Duncan's New Multiple Range Test

0.014
0.012 -
0.01 -
0.008 -
0.006 -
0.004 -
0.002 -
index of injury (%)
120
70
60
40^Kwatna (11)
long day, dry
long day, wet30
short day, dry
short day, wet
50
20-16^-15.5^-15^-14.5^-14^-13.5^-13^-12.5 -12^-11.5^-11^-10.5^-10
temperature ( °C)
rgr1.7 (mm/mm/week)
environment
Index of injury predicted response to temperature from regressionanalysis and relative growth rate for a six-week period prior tocold-hardiness testing for 2-year-old yellow-cedarseedlings fromKwatna Inlet grown under four environments. Different lettersbetween environments for the growth data denotes significance atp<.05 according to Duncan's New Multiple Range Test
Figure 9:

121
Index of Injury (%)
Holberg (19)
long day, dry
long day, wet
short day, dry
short day, wet
I^1^1
70
60
50
40
30
20-16^-15.5^-15^-14.5^-14^-13.5^-13^-12.5^-12^-11.5^-11^-10.5^-10
temperature ( °C)
rgr1.7 (mm/mm/week)
SD^
LD^
SW^
LWenvironment
Figure 10: Index of injury predicted response to temperature from regressionanalysis and relative growth rate for a six-week period prior tocold-hardiness testing for 2-year-old yellow-cedar seedlings fromHolberg grown under four environments. Different letters betweenenvironments for the growth data denotes significance at p<.05according to Duncan's New Multiple Range Test
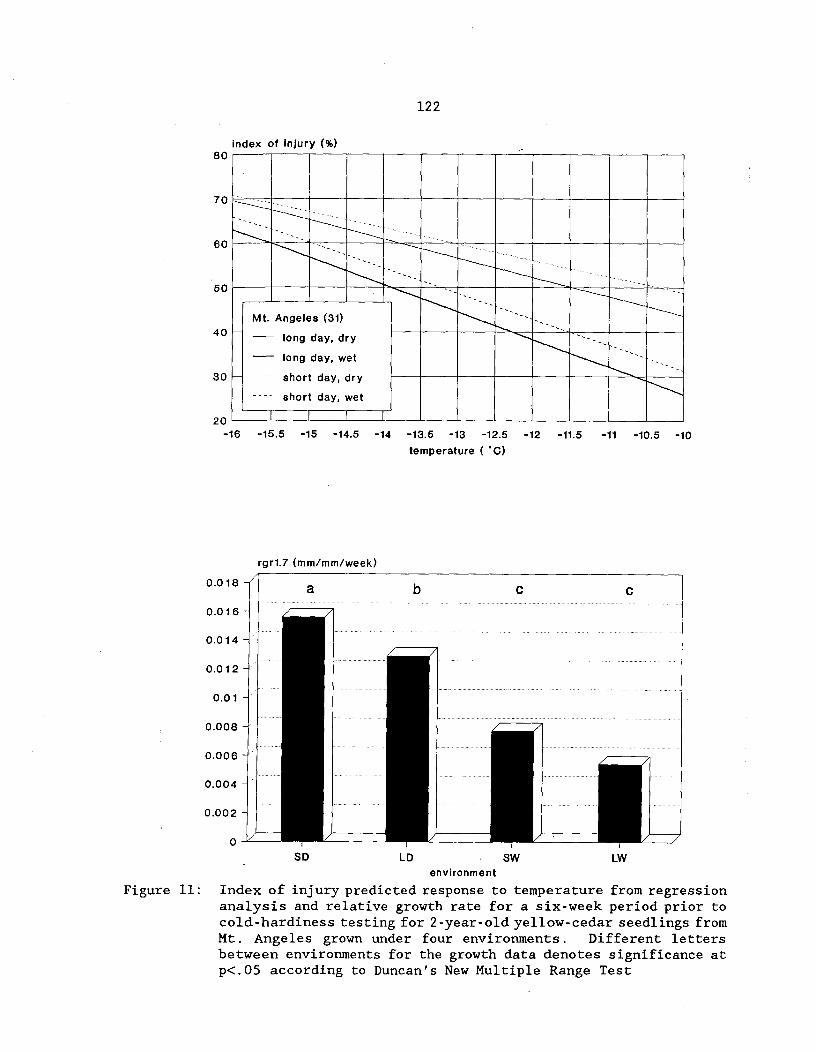
0.018
0.016 -
0.014 -
0.012 -
0.01 -
0.008 —
0.006 -
0.004 -
0.002 -
SD
Mt. Angeles (31)
long day, dry
long day, wet
short day, dry
short day, wet
122
index of injury (%)80
70
60
50
40
30
20-16^-15.5^-15^-14.5^-14^-13.5^-13^-12.5^-12^-11.5^-11^-10.5 -10
temperature ( °C)
rgr1.7 (mm/mm/week)
environment
Figure 11: Index of injury predicted response to temperature from regressionanalysis and relative growth rate for a six-week period prior tocold-hardiness testing for 2-year-old yellow-cedar seedlings fromMt. Angeles grown under four environments. Different lettersbetween environments for the growth data denotes significance atp<.05 according to Duncan's New Multiple Range Test

SD LD SW LW
0.014 -(^a a^aa
0.012 -
0.01 -
0.008 -
0.006 -
0.004 -
0.002 -
Mitkof I. (42)
^ long day, dry
long day, wet
short day, dry
short day, wet
1^1
123
index of injury (%)70
60
50
40
30
20-16 -15.5 -15 -14.5 -14 -13.5 -13 -12.5 -12 -11.5 -11 -10.5 -10
degrees celsius
rgr1.7 (mm/mm/week)
environment
Figure 12: Index of injury predicted reponse to temperature from regressionanalysis and relative growth rate for a six-week period prior tocold-hardiness testing for 2-year-old yellow-cedarseedlings fromMitkof Island grown under four environments. Different lettersbetween environments for the growth data denotes significance atp<.05 according to Duncan's New Multiple Range Test

124
were growing in the wet and long photoperiod environment, respectively.
Thus, as can been seen in Figure 8, seedlings from the short-day, dry
environment continued to grow the most into late September and October, and
were the most susceptible to cold. Seedlings from the long-day, wet
environment had the slowest relative growth rate and were the most cold-
resistant.
This trend generally can be seen at the population level, however,
deviations from this pattern are evident, and account for the significant
genotype by environment interactions shown in Table 33. Seedlings
originating from Mt. Angeles population illustrate the above relationship the
best (Figure 11), with a three-fold difference in relative growth rate and a
4.5° C difference in LT50 between seedlings from the short-day, dry
environment and those from the long-day, wet environment.
The above results for the effects of environment on cold-hardiness are
different than most of the literature. As stated earlier, short photoperiod
or mild drought stress during the growing season, can result in greater cold-
hardiness during the acclimation period for determinate conifer species.
This is an indirect response related to decreased shoot growth and earlier
budset for seedlings grown under stress (Glerum 1985).
Increased cold-hardiness for indeterminate species grown under short
photoperiods has been reported for yellow-cedar (Arnott et al. 1992), eastern
white cedar (Colombo and Raitenan 1991) and for western redcedar (Major et
al. 1993). However, in the yellow-cedar study (Arnott et al. 1992), cold-
hardiness was measured immediately following the end of the photoperiod
treatment, in the study on eastern white cedar (Colombo and Raitenan 1991),
the short photoperiod was never released during cold-hardiness testing, and
125
in the western redcedar study (Major et al. 1993), the seedlings were
immediately planted in the field upon release of the photoperiod treatment.
Thus, shoot growth was not able to resume in any of the above studies prior
to cold-hardiness testing. Silim (1991) reported minimal differences in
cold-hardiness of both yellow-cedar and redcedar seedlings in response to
decreasing photoperiod or moisture stress.
The results of this study are consistent with others (Arnott et al.
1992, Krasowski and Owens 1991) with respect to increased shoot growth of
stressed seedlings following release of the stress. In this study, and the
above reported studies, measurements of shoot growth continued after release
of the environment treatments while the seedlings remained in containers in
a nursery environment. Thus, because cold-hardiness testing in this study
was done 6 weeks after the release of the stress treatments, the results were
influenced by the plastic response of yellow-cedar shoot growth. In
subsequent cold-hardiness testing in the study by Arnott et al (1992), it was
found that decreased photoperiods and moisture stress had a transitory effect
on increasing cold-hardiness of yellow-cedar seedlings (P. Puttonen, B.C.
Ministry of Forests, pers. comm.).
Increased cold susceptibility of more southern populations is
consistent with results presented earlier (Chapter 2). Significant
interactions of watering regime with population and temperature with
population, are for the most part, scale effects.
3.3.3 Gas Exchange and Shoot Water Potential
The initial drydown cycle resulted in considerable variation in predawn
shoot water potential (RO) at day 6, with seedlings from Coquihalla (16)
126
having the highest (-2.2 MPa), and Mitkof Island (42) the lowest (-3.7 MPa)
average 80 (Figure 13). Figure 14 illustrates the variation between two
families within the Coquihalla population.
Both A and gs responded to decreasing predawn shoot water potential in
a pattern typical for yellow-cedar (Grossnickle and Russell 1991, Arnott et
al. 1992). Net photosynthesis declined in a steady concave fashion from
approximately -0.4 MPa and reached the compensation point between -2.0 and -
2.7 MPa (Figure 15 and Table 35), similar to results presented for yellow-
cedar 1-year-old seedlings by Grossnickle and Russell (1991) during a winter
drydown and by Arnott et al. (1992) for 1-year-old yellow-cedar rooted
cuttings during a summer drydown. Stomatal conductance declined rapidly at
high 80 values from -0.25 to -0.75 MPa, and tapered off until gs reached near
zero at 80 less than -2.0 to -3.0 MPa (Figure 16 and Table 35). Grossnickle
and Russell (1991) reported similar results, however, gs declined more rapidly
in response to soil moisture deficits and reached near zero at higher 80.
In the study by Grossnickle and Russell (1991), gs declined more rapidly
than A with decreasing shoot water potential, and declined gradually well
above the winter turgor loss point (-2.4 MPa), owing to stomatal limitations.
This study showed similar patterns, however, stomata closed at or near the
turgor loss point after the drydown (see Table 38).
As the severity of drought increased, A decreased gradually with a
decrease in gs until approximately 0.4 cm s-1 at which time A decreased
rapidly with a decrease in gs (Figure 17). Arnott et al. (1992) reported a
similar response for 1-year-old yellow-cedar rooted cuttings during a summer
drydown.
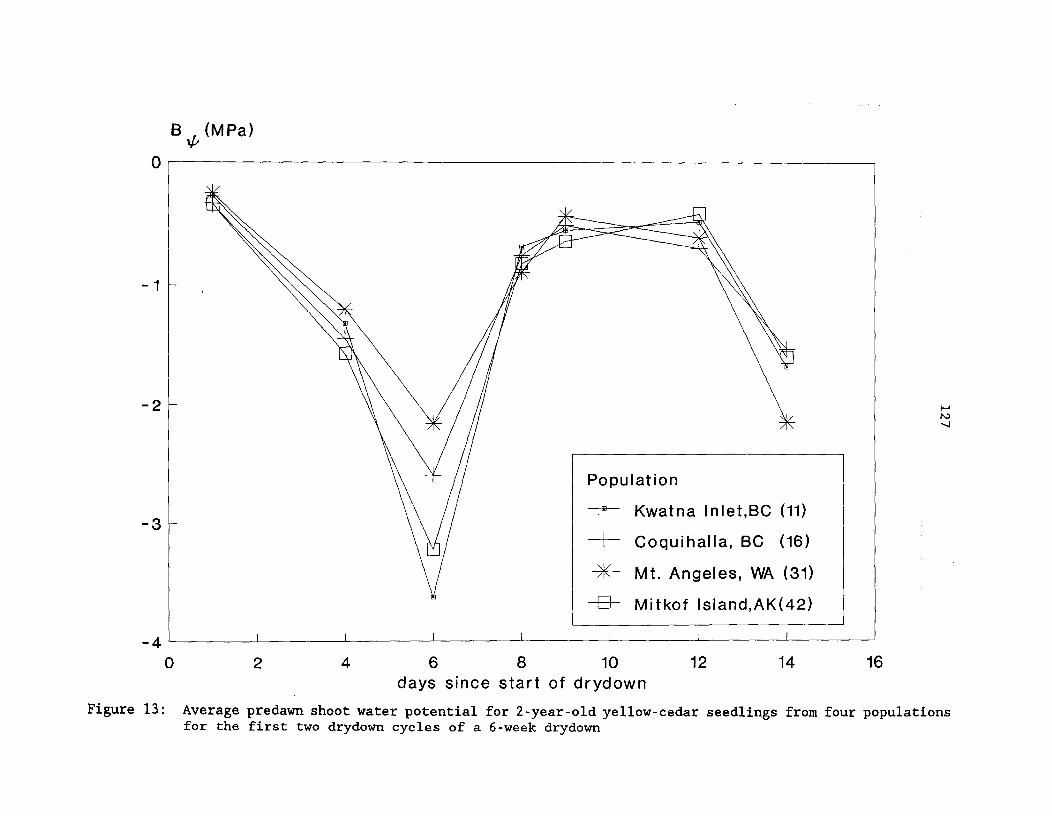
-
- 2
- 3
- 4
B ,(MPa)V
0
1
0^2^4^6^8^10^
12^
14^
16days since start of drydown
Figure 13: Average predawn shoot water potential for 2-year-old yellow-cedar seedlings from four populationsfor the first two drydown cycles of a 6-week drydown

20 4^6^8^10^
12^
14^
16days since start of drydown
B(M Pa )
1
2
-3
4
Figure 14: Average predawn shoot water potential for 2-year-old yellow-cedar seedlings from two open-pollinated families from Coquihalla population (16) for the first two drydown cycles of a 6-weekdrydown
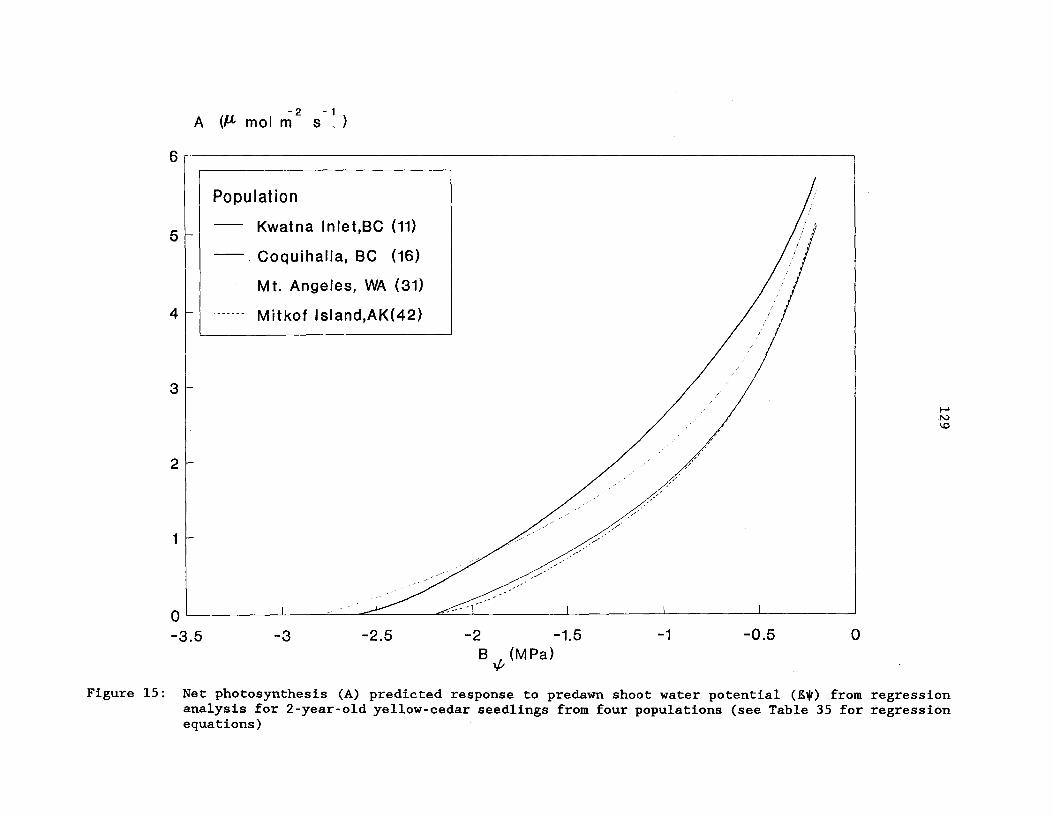
-0.5 0-1-2^-1.5B (MPa)
-2.5-3-3.5
A VI mo I m-2 S-1, )
6
^ Kwatna Inlet,BC (11)
Coquihalla, BC (16)
Mt. Angeles, WA (31)
^ Mitkof Island,AK(42)4
5
3
2
1
Figure 15: Net photosynthesis (A) predicted response to predawn shoot water potential (E*) from regressionanalysis for 2-year-old yellow-cedar seedlings from four populations (see Table 35 for regressionequations)

130
Table 35:^Regression equations for gas exchange and shoot water potentialdata for yellow-cedar populations
a. y - A; x = 1301
Population2 Regression Equation r2
11 Yi = 1.66^-^2.14 (in x) 0.83 51
16 Yi - 2.73^- 0.152^(1/x2)^-^2.97^(in x) 0.58 49
31 Yi - 2.15^-^2.12^(in x) 0.75 48
42 Yi = 1.61^-^2.21^(ln x) 0.91 25
b. y^gs; x = RO
Population Regression Equation r2
11 iri - -0.009 + 0.029^(l/x) 0.84 51
16 Yi = -0.018 + 0.054 (l/x)^- 0.005^(1/x2) 0.72 49
31 ii = -0.005 + 0.028^(l/x) 0.82 48
42 Yi = -0.014 + 0.033^(l/x) 0.77 25
c. y - A; x = gs
Population^Regression Equation^ r2
11^Yi - 8.21 + 0.002 (l/x) + 1.58 (in x)^0.83 128
16^Yi = 10.74 + 0.006 (l/x) + 2.26 (in x)^0.73 127
31^Yi = 10.99 - 347 (x3) + 0.009 (l/x) + 2.36 (in x)^0.83 118
42^Yi - 7.54 + 5.6x10⁻⁶ (1/x2) + 1.40 (in x)^0.89^64
1. A = net photosynthesis (pmol/m2/s)130 - predawn shoot water potential (MPa)gs^stomatal conductance (cm/s)
2. 11^Kwatna Inlet, B.C.; 16 = Coquihalla, B.C.; 31 - Mt. Angeles, WA;42 - Mitkof Island, AK
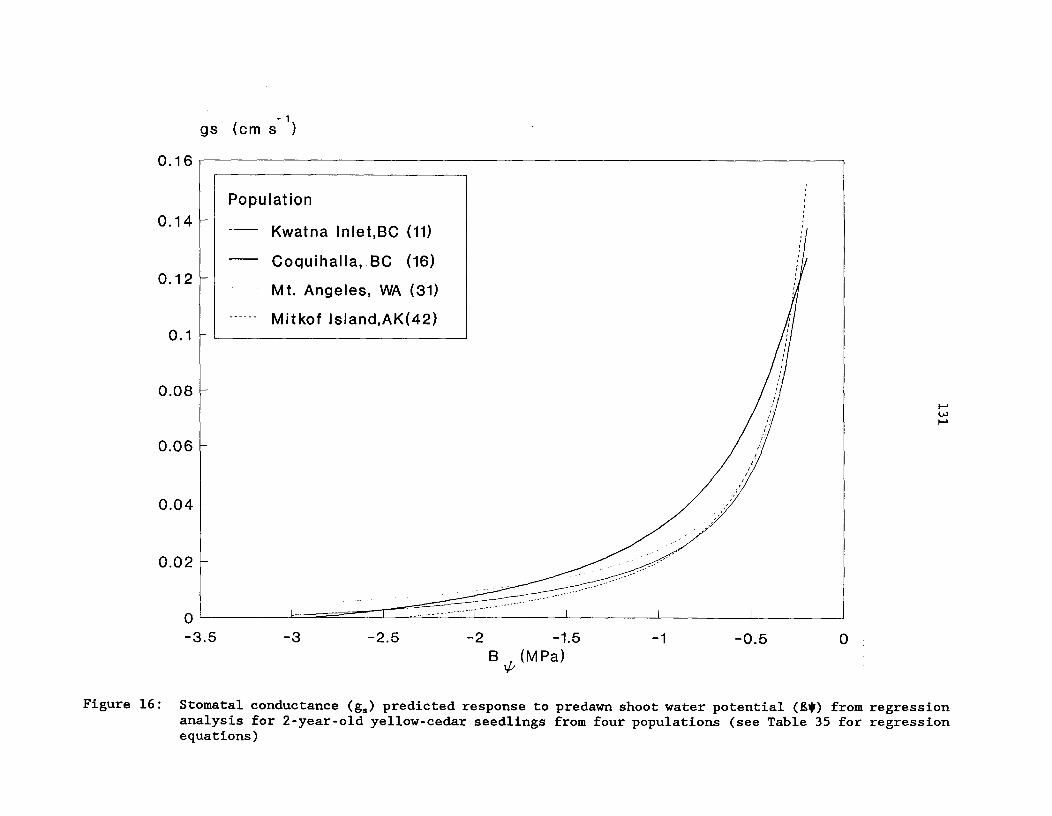
-1 -0.5- 3.5^-3^-2.5^-2^-1.5B (MPa)
gs (cm s-1)
LAI
Figure 16: Stomatal conductance (g.) predicted response to predawn shoot water potential (B*) from regressionanalysis for 2-year-old yellow-cedar seedlings from four populations (see Table 35 for regressionequations)
0.16
0.14
0.12
0.1
0.08
0.06
0.04
0.02
Population
^ Kwatna Inlet,BC (11)
Coquihalla, BC (16)
Mt. Angeles, WA (31)
^ Mitkof Island,AK(42)

0.12 0.14 0.160.08^0.1
gs (cm s-1)
0.04^0.060 0.02
A ( mol m-2 $-1au, ^)
7
6
5
4
3
Kwatna Inlet,BC (11)
Coquihalla, BC (16)
Mt. Angeles, WA (31)
Mitkof Island,AK(42)
2
0
1
Figure 17: Net photosynthesis (A) predicted response to stomatal conductance (g.) from regression analysis for2-year-old yellow-cedar seedlings from four populations (see Table 35 for regression equations)
133
Kwatna- Inlet and Mitkof Island, both windward, northern coastal, low
elevation populations with relatively wet and mild summers (see Table 23),
showed a more rapid decline in A and gs with a decrease in Elk than Coquihalla,
a high elevation, coastal:interior transition population with relatively
drier and warmer summers (Figures 15 and 16). Mt. Angeles, a coastal,
leeward, southern exposure, high elevation population was intermediate. As
well, seedlings from both Kwatna Inlet and Mitkof Island populations showed
a more gradual increase in A with an increase in gs, while Coquihalla
seedlings had the greatest increase, and Mt. Angeles seedlings, intermediate
(Figure 17). At a given gs, both Coquihalla and Mt. Angeles seedlings
maintained higher levels of A than Kwatna Inlet or Mitkof Island, except at
values greater than 0.25 cm s-1.
Seedlings from Coquihalla had higher A and gs under well-watered
conditions (>-0.5 MPa) and were able to maintain higher levels of A and gs
under greater water stress. Seedlings from Mt. Angeles maintained
intermediate levels of A with increasing water stress. Seedlings from Kwatna
Inlet and Mitkof Island essentially reached the compensation point for CO2
uptake at -2.0 MPa, whereas seedlings from Coquihalla and Mt. Angeles
continued photosynthesis until -2.6 and -2.75 MPa, respectively.
These results compare favourably to those of Kelliher and Tauer (1980)
with eastern cottonwood and Abrams et al. (1990) with green ash, in which
plants from xeric habitats exhibited less stomatal sensitivity to drought,
and greater photosynthesis (Levitt's (1980b) drought avoiders, water
spenders). Seedlings from both Coquihalla and Mt. Angeles populations, both
areas that receive substantially less summer rainfall than Kwatna Inlet and
Mitkof Island populations, had less stomatal sensitivity and higher
photosynthetic capacity under drought.
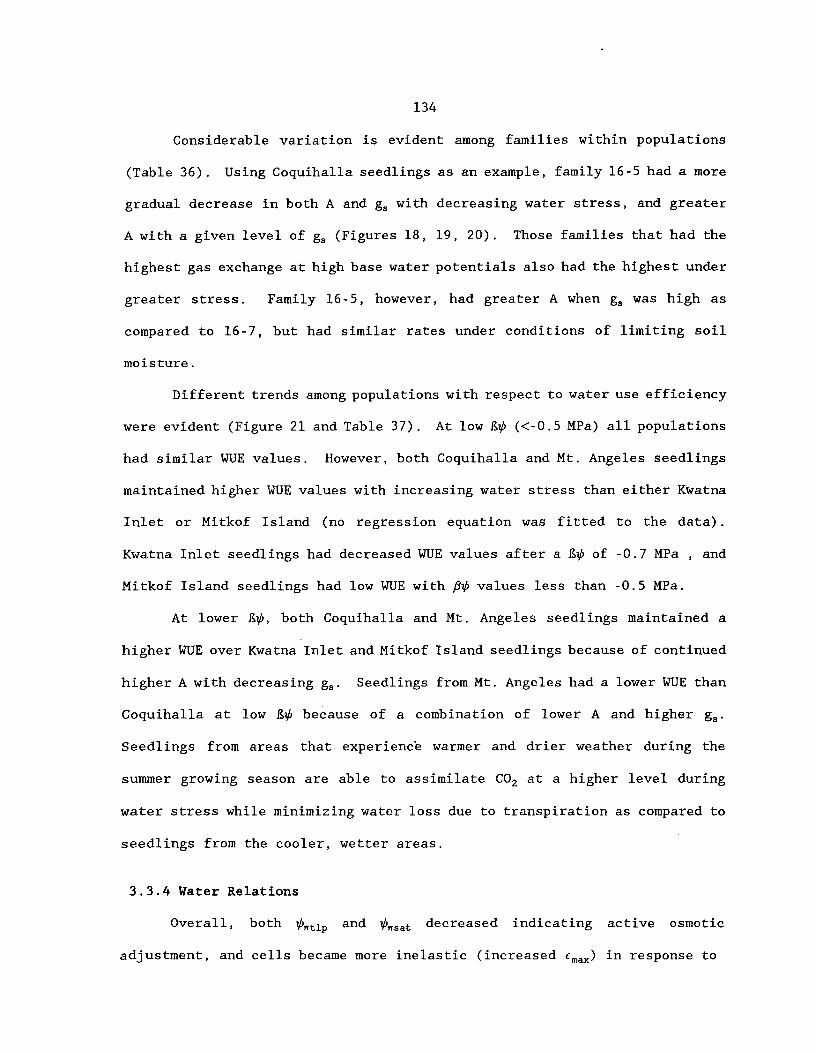
134
Considerable variation is evident among families within populations
(Table 36). Using Coquihalla seedlings as an example, family 16-5 had a more
gradual decrease in both A and gs with decreasing water stress, and greater
A with a given level of gs (Figures 18, 19, 20). Those families that had the
highest gas exchange at high base water potentials also had the highest under
greater stress. Family 16-5, however, had greater A when gs was high as
compared to 16-7, but had similar rates under conditions of limiting soil
moisture.
Different trends among populations with respect to water use efficiency
were evident (Figure 21 and Table 37). At low 80 (<-0.5 MPa) all populations
had similar WOE values. However, both Coquihalla and Mt. Angeles seedlings
maintained higher WUE values with increasing water stress than either Kwatna
Inlet or Mitkof Island (no regression equation was fitted to the data).
Kwatna Inlet seedlings had decreased WUE values after a 80 of -0.7 MPa , and
Mitkof Island seedlings had low WOE with PO values less than -0.5 MPa.
At lower 80, both Coquihalla and Mt. Angeles seedlings maintained a
higher WOE over Kwatna Inlet and Mitkof Island seedlings because of continued
higher A with decreasing gs• Seedlings from Mt. Angeles had a lower WOE than
Coquihalla at low 80 because of a combination of lower A and higher gs.
Seedlings from areas that experience warmer and drier weather during the
summer growing season are able to assimilate CO2 at a higher level during
water stress while minimizing water loss due to transpiration as compared to
seedlings from the cooler, wetter areas.
3.3.4 Water Relations
Overall, both 0r ntlp and'r R. s ta decreased indicating active osmotic
adjustment, and cells became more inelastic (increased ems.) in response to

135
Table 36:^Regression equations for gas exchange and shoot water potential datafor yellow-cedar families
a. y = A; x = R01
Family2^Regression Equation r2
^11-1^Yi = 1.62 + 0.079^(x3)^-^2.98^(in x)
^
11-5^Yi^1.42^-^1.88^(in x )
^
16-5^= 3.04^-^2.87^(in x)
^
16-7^Yi^1.23 + 0.03^(x3)^-^1.89^(in x)
^
31-2^Yi = 1.60 + 0.066^(x3)^-^2.76^(in x)
^
31-4^Yi = 8.47^-^6.88^(x)^-0.798^(x3)^-^0.131 (1/x2)
0.91
0.90
0.78
0.80
0.94
0.70
26
24
23
26
21
26
b. y = gs; x = BO
Family^Regression Equation r2
11-1^Yi = -0.013 + 0.036^(l/x) 0.87 26
11-5^Yi = -0.023 + 0.037^(l/x) + .022^(in x) 0.91 24
16-5^Yi = -0.01 + 0.048^(l/x) 0.79 23
16-7^Yi = -0.015 + 0.001 (x2) + 0.03^(l/x) 0.95 26
31-2^Yi = -0.005 + 0.029^(l/x) 0.92 21
31-4^Yi = -0.005 + 0.028^(l/x) 0.73 26
c. y = A; x = gs
Family^Regression Equation r2
11-1^Yi = 8.95 + 0.003^(l/x) + 1.74 (in x) 0.86 64
11-5^Yi = 6.76^- 0.012^(l/x) + 3.3x10⁻⁵ (1/x2) + 1.06 (in x) 0.84 63
16-5^Yi = 11.8^-^520^(x3) + 0.012^(l/x) + 3.13 (in x) 0.66 62
16-7^ii = 7.41 + 0.003^(l/x) + 1.45 (in x) 0.80 64
31-2^Yi = 9.94 + 0.008^(l/x) + 2.13 (ln x) 0.88 53
31-4^i'i = 9.10 + 1.69^(in x) 0.76 64
1. A = net photosynthesis (Amol/m2/s)130 = predawn shoot water potential (MPa)gs = stomatal conductance (cm/s)
2. 11 = Kwatna Inlet, B.C.; 16 = Coquihalla, B.C.; 31 = Mt. Angeles, WA

0
2
4
6
A (14 mot m-2 $-1 )
8
136
-3^
-2_5^
-2^-1.5
^-1^-0_5
^0
B (MPa)
Figure 18: Net photosynthesis (A) predicted response to predawn shoot waterpotential (4) from regression analysis for 2-year-old yellow-cedarseedlings from two open-pollinated families from Coquihallapopulation (see Table 36 for regression equations)

0.2
0.4
0.6
0.8
1.2
1.4
gs (cm s-1)
1.6
0
1
137
-3^-2.5^-2^-1.5^-0.5
B (MPa)
Figure 19: Stomatal conductance (g.) predicted response to predawn shoot waterpotential (E0) from regression analysis for 2-year-old yellow-cedarseedlings from two open-pollinated families from Coquihallapopulation (see Table 36 for regression equations)
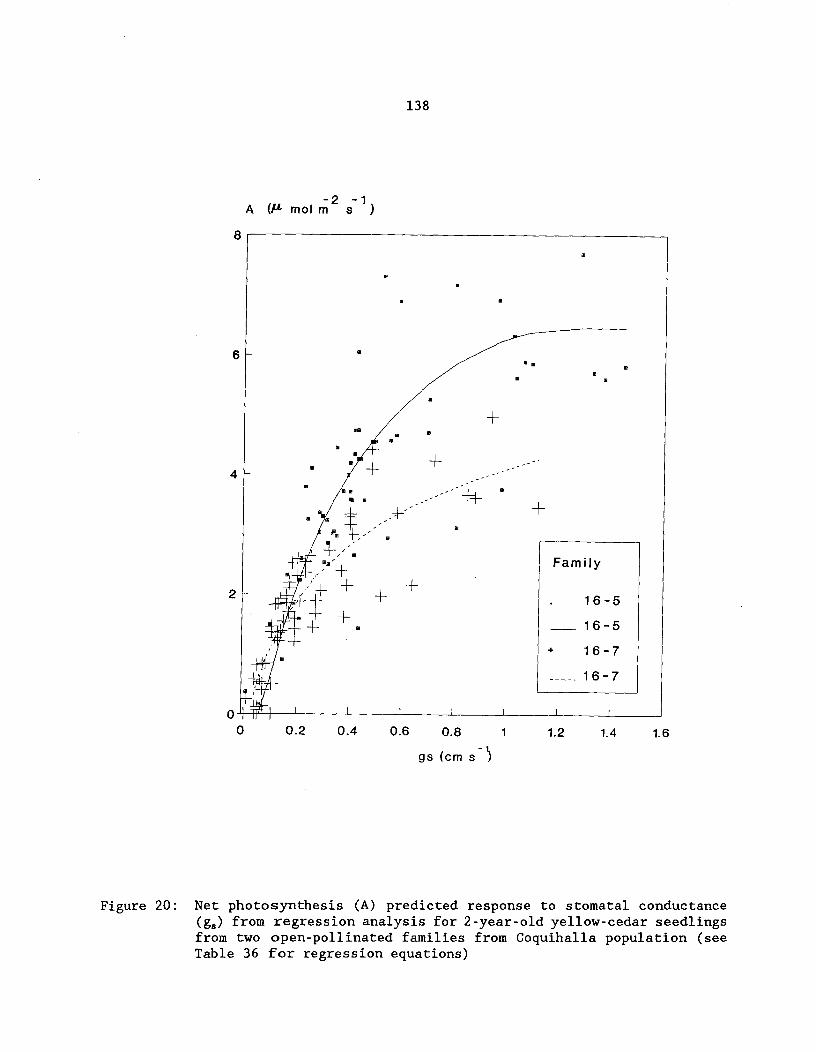
Family
16-5
16-5
16-7
16-7
-I
0.2^0.4^0.6^0.8^1^1.2
gs (cm sl
1.4^1.60
-2 -1A VI, mol m s )
138
Figure 20: Net photosynthesis (A) predicted response to stomatal conductance(g.) from regression analysis for 2-year-old yellow-cedar seedlingsfrom two open - pollinated families from Coquihalla population (seeTable 36 for regression equations)
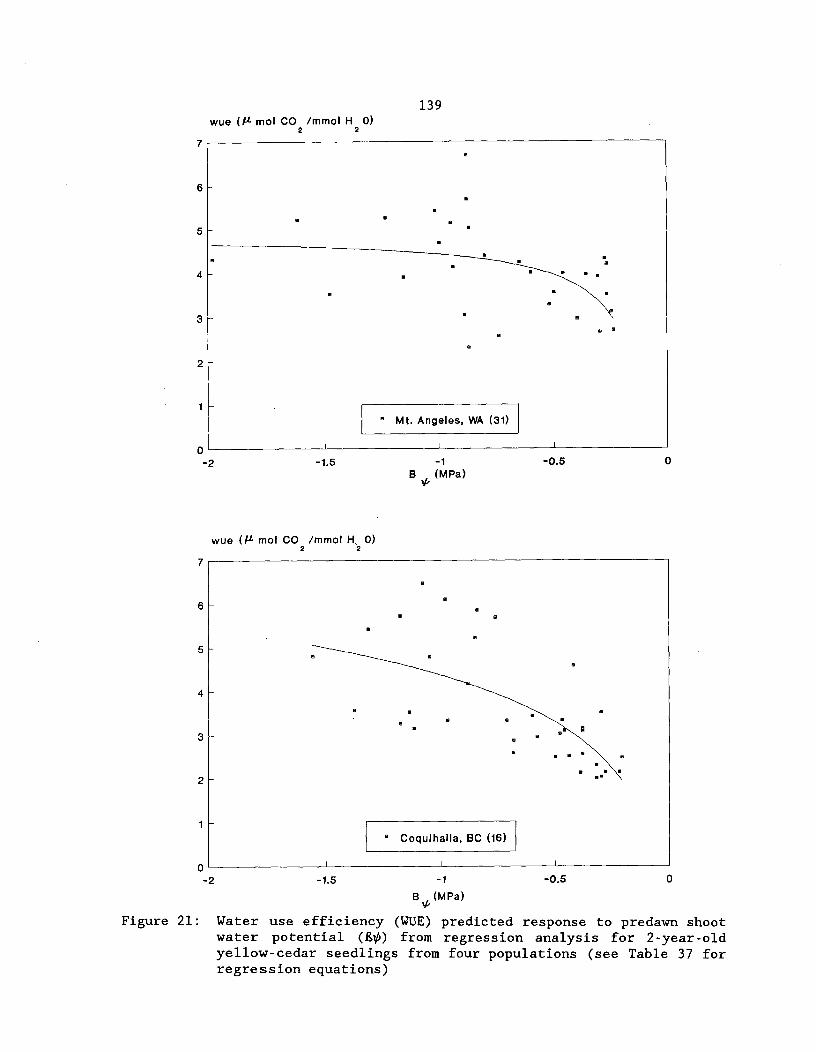
139wue (Arno' CO immoi H 0)
2^2
wue (IL mol CO /mmol H, 0)2^2
-1.5^ -1
B (MPa)1G
Figure 21: Water use efficiency (WUE) predicted response to predawn shootwater potential (80) from regression analysis for 2-year-oldyellow-cedar seedlings from four populations (see Table 37 forregression equations)
140
wue (IL mol CO /mmol H 0)2^2
7
6
5
4
3
2
1
-2^ -1.5^ -1^ -0.5B (MPa)
wue (P. mol CO /mmol H 0)2^2
7
6
° Mitkof Island,AK(42)
5
4
•
3
2
• • •
1
-2^ -1.5^ -0.5^
0B (MPa)
Figure 21: (con't)

141
Table 37:^Regression equations for water use efficiency and shoot waterpotential data for yellow-cedar populations
y^WUE; x^1301
Population2 Regression Equation r2
11 5.09^-^0.48^(x3)^-^0.598^(l/x) 0.49 41
16 4.38 + 1.55^(in x) 0.45 41
31 4.89^-^0.468^(1/x) 0.33 36
1. WUE = water use efficiency (Amol CO2/mmol H20)130 — predawn shoot water potential (MPa)
2. 11^Kwatna Inlet, B.C.; 16 — Coquihalla, B.C.; 31 = Mt. Angeles, WA
the summer drought (Table 38). This is in contrast to the results of Arnott
et al. (1992) in which 1-year-old yellow-cedar rooted cuttings did not
osmotically adjust or change cell wall elasticity properties after a drydown.
Osmotic adjustment in response to a drought has been reported in some woody
species (Seiler and Johnson 1985, Abrams et al. 1990, Parker and Pallardy
1985) while not in others (Bahari et al. 1985, Joly and Zaerr 1987, Seiler
and Cazell 1990). Cell wall elasticity as measured by c.ax has been reported
to increase (Ellsworth and Reich 1992, Grossnickle 1992), decrease (Bahari
et al. 1985, Joly and Zaerr 1987), not change (Arnott et al. 1992,
Grossnickle 1992), or vary according to ecotype (Parker and Pallardy 1985,
Abrams et al. 1990) following a drought during the active growing season.
Coquihalla seedlings had significantly lower ,sat and higher symplastic
water at full turgor (V.) as compared to Kwatna Inlet seedlings prior to the
drydown (Table 38). Both 0ntlp and em„„ were also lower, but not
significantly. After the 6-week drydown, none of the shoot water parameters
were significantly different between the two populations, except for V..
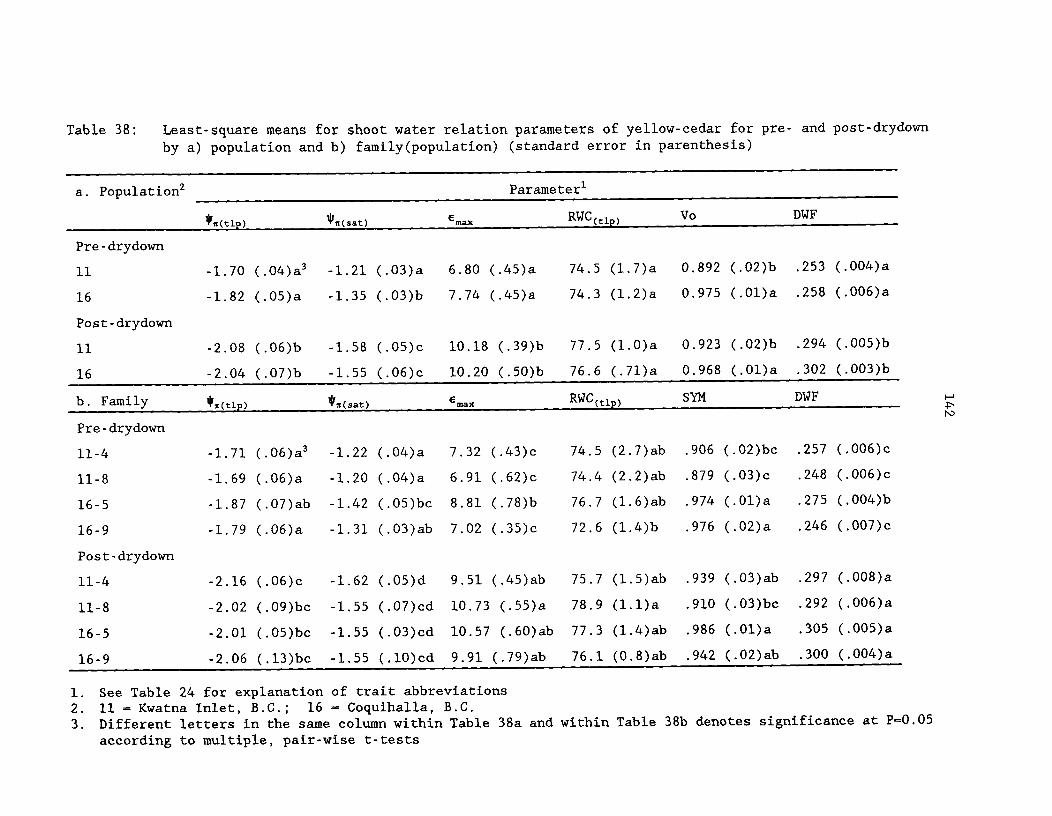
Table 38:^
Least-square means for shoot water relation parameters of yellow-cedar for pre- and post-drydownby a) population and b) family(population) (standard error in parenthesis)
a. Population2 Parameter'
4in(t1p) 4rit(sat) max RWC (t1p) Vo DWF
Pre-drydown
11 -1.70 (.04)a3 -1.21 (.03)a 6.80 (.45)a 74.5 (1.7)a 0.892 (.02)b .253 (.004)a
16 -1.82 (.05)a -1.35 (.03)b 7.74 (.45)a 74.3 (1.2)a 0.975 (.01)a .258 (.006)a
Post-drydown
11 -2.08 (.06)b -1.58 (.05)c 10.18 (.39)b 77.5 (1.0)a 0.923 (.02)b .294 (.005)b
16 -2.04 (.07)b -1.55 (.06)c 10.20 (.50)b 76.6 (.71)a 0.968 (.01)a .302 (.003)b
b. Family Itin (t1p) *(sat) 6max RWC(tiP) SYM DWF
Pre-drydown
11-4 -1.71 (.06)a3 -1.22 (.04)a 7.32 (.43)c 74.5 (2.7)ab .906 (.02)bc .257 (.006)c
11-8 -1.69 (.06)a -1.20 (.04)a 6.91 (.62)c 74.4 (2.2)ab .879 (.03)c .248 (.006)c
16-5 -1.87 (.07)ab -1.42 (.05)bc 8.81 (.78)b 76.7 (1.6)ab .974 (.01)a .275 (.004)b
16-9 -1.79 (.06)a -1.31 (.03)ab 7.02 (.35)c 72.6 (1.4)b .976 (.02)a .246 (.007)c
Post-drydown
11-4 -2.16 (.06)c -1.62 (.05)d 9.51 (.45)ab 75.7 (1.5)ab .939 (.03)ab .297 (.008)a
11-8 -2.02 (.09)bc -1.55 (.07)cd 10.73 (.55)a 78.9 (1.1)a .910 (.03)bc .292 (.006)a
16-5 -2.01 (.05)bc -1.55 (.03)cd 10.57 (.60)ab 77.3 (1.4)ab .986 (.01)a .305 (.005)a
16-9 -2.06 (.13)bc -1.55 (.10)cd 9.91 (.79)ab 76.1 (0.8)ab .942 (.02)ab .300 (.004)a
1. See Table 24 for explanation of trait abbreviations2. 11^Kwatna Inlet, B.C.; 16 - Coquihalla, B.C.3. Different letters in the same column within Table 38a and within Table 38b denotes significance at P-0.05
according to multiple, pair-wise t-tests

143
Both families from Coquihalla (16-5 and 16-9) had lower Offtlp and nsat
prior to drydown than the families from Kwatna (11-4 and 11-8), with family
16-5 being significantly lower for 0„..t. (Table 38). Family 16-5 also had the
highest en,„„ value and DWF prior to drydown. Both families from Coquihalla
had significantly higher symplastic water than seedlings from the Kwatna
families.
Seedlings from both populations osmotically adjusted (i.e. significant
decreases in both 7,bt1p and 0„sat after the drydown), with seedlings from Kwatna
adjusting more than Coquihalla (Table 38). Family 11-4 had the greatest
reduction and family 16-5, the least. After the 6-week drydown, none of the
shoot water parameters were significantly different among the four families.
Cell walls became more inelastic in both populations after experiencing
the 6-week drydown (Table 38). Although both increases in em,.x were
significant, seedlings from Kwatna had a greater change (3.4 MPa). At the
family level, Kwatna family 11-8 had the greatest increase (3.8 MPa), and
Coquihalla family 16-5 the least (nonsignificant change of 1.8 MPa).
There was a slight, though insignificant increase in relative water
content at turgor loss point for both populations, and little change in
symplastic water (Table 38). All four families showed no significant changes
in both RWC and symplastic water. Dry weight fraction increased
significantly for both populations (approximately 4.1% for both populations),
and all four families significantly increased their dry weight fraction,
following the drydown.
Thus, following a 6-week drought, both populations reacted similar in
adaptation to drought, with osmotic adjustment and increased cell wall
inelasticity, resulting in more solutes per cell which would allow for
greater maintenance of turgor during drought. Inelastic cell walls allow

144
tissue water potential to decrease rapidly with a change in water content.
This may help to maintain a favourable gradient for moisture uptake from
drying soils without resulting in large tissue water deficits (Abrams et al.
1990).
Overall, yellow-cedar seedlings from both populations, had a decrease
in shoot turgor potential (0p) at a given RWC following the drydown (Table 39,
Figure 22). However, the post-drydown curves had a steeper slope resulting
in the turgor loss point occurring at a greater RWC than pre-drydown
seedlings. Seedlings from Kwatna had a lower Op with decreasing RWC than
Coquihalla seedlings both before and after the drydown (Figure 22). The
slope of the curves between the two populations either at pre- or post-
drydown were similar.
Coquihalla family 16-5 had a greater decrease in Op with a drop in RWC
before drydown, reaching turgor loss point at a RWC of 76%, whereas the other
three families reached turgor loss point at below 70% (Figure 23 and Table
39). Although Kwatna families 11-4 and 11-8 had similar Op at high RWC,
family 11-8 had a greater decrease in Op after the drydown, reaching turgor
loss point at approximately 78% RWC, and 11-4 the least drop in Op reaching
turgor loss point at a RWC of 74% (Figure 23). Both families 16-5 and 16-9
had similar post-drydown curves starting at higher Op than both Kwatna
families 11-4 and 11-8, and having similar RWC at turgor loss point, which
was intermediate between the two Kwatna families.
3.3.5 Morphological and Physiological Adaptations to Drought
Table 40 summarizes shoot growth traits and dry weight allocation by
population and moisture regime averaged for only those families and
populations in which gas exchange data was taken. As stated earlier, yellow
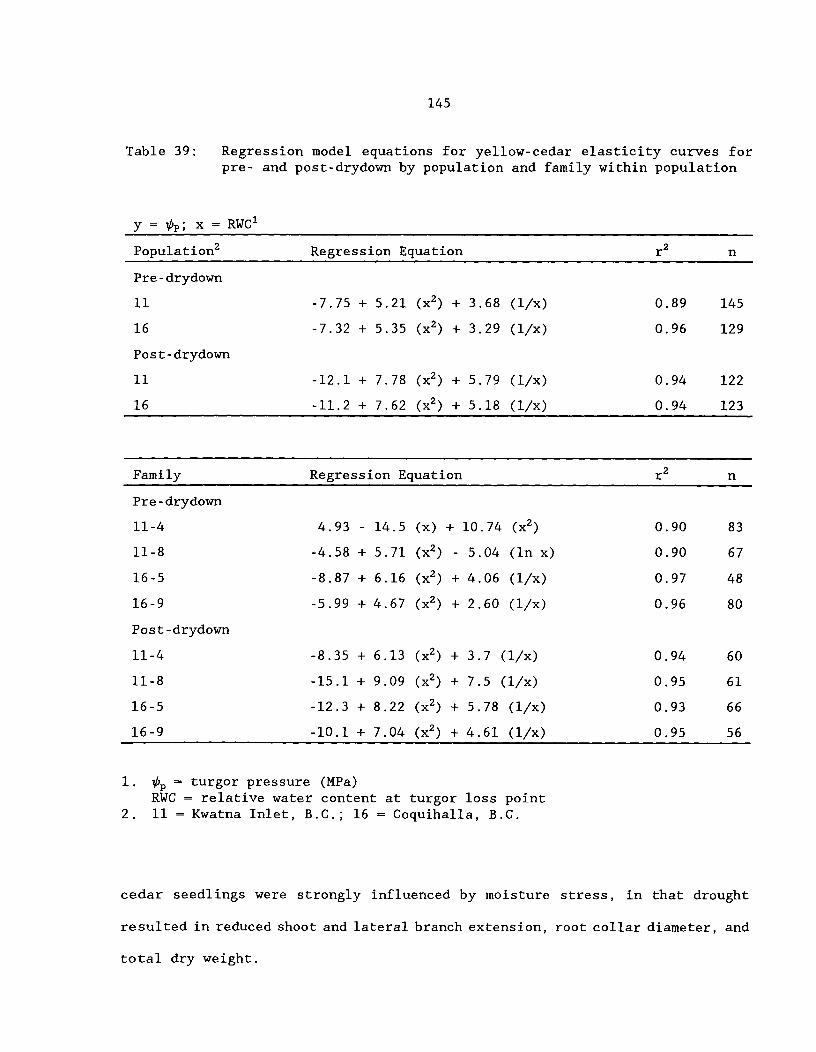
145
Table 39:^Regression model equations for yellow-cedar elasticity curves forpre- and post-drydown by population and family within population
y =^x^RWC1
Population2 Regression Equation r2
Pre-drydown
11 -7.75 + 5.21^(x2) + 3.68^(l/x) 0.89 145
16 -7.32 + 5.35^(x2) + 3.29^(1/x) 0.96 129
Post-drydown
11 -12.1 + 7.78^(x2)^+ 5.79^(l/x) 0.94 122
16 -11.2 + 7.62^(x2) + 5.18^(1/x) 0.94 123
Family Regression Equation r2
Pre-drydown
11-4 4.93^-^14.5^(x) + 10.74^(x2) 0.90 83
11-8 -4.58 + 5.71^(x2)^-^5.04^(ln x) 0.90 67
16-5 -8.87 + 6.16^(x2) + 4.06^(l/x) 0.97 48
16-9 -5.99 + 4.67^(x2)^+ 2.60^(l/x) 0.96 80
Post -drydown
11-4 -8.35 + 6.13^(x2) + 3.7^(l/x) 0.94 60
11-8 -15.1 + 9.09^(x2) + 7.5^(l/x) 0.95 61
16-5 -12.3 + 8.22^(x2) + 5.78^(l/x) 0.93 66
16-9 -10.1 + 7.04 (x2) + 4.61^(l/x) 0.95 56
1. Op^turgor pressure (MPa)RWC = relative water content at turgor loss point
2. 11 = Kwatna Inlet, B.C.; 16 = Coquihalla, B.C.
cedar seedlings were strongly influenced by moisture stress, in that drought
resulted in reduced shoot and lateral branch extension, root collar diameter, and
total dry weight.

70 75 80 85 90 95 100
1.8
1.6^ 11 pre-drydown
— 16 pre-drydown
11 post-drydown
^ 16 post-drydown
1.4
1.2
1
0.8
0.6
0.4
0.2
shoot turgor pressure (MPa g/g)
cr.
relative water content (To)
Figure 22: Turgor pressure predicted response to relative water content from regression analysis for 2-year-old yellow-cedar seedlings from two populations before and after a 6-week drydown (see Table 39 forregression equations)
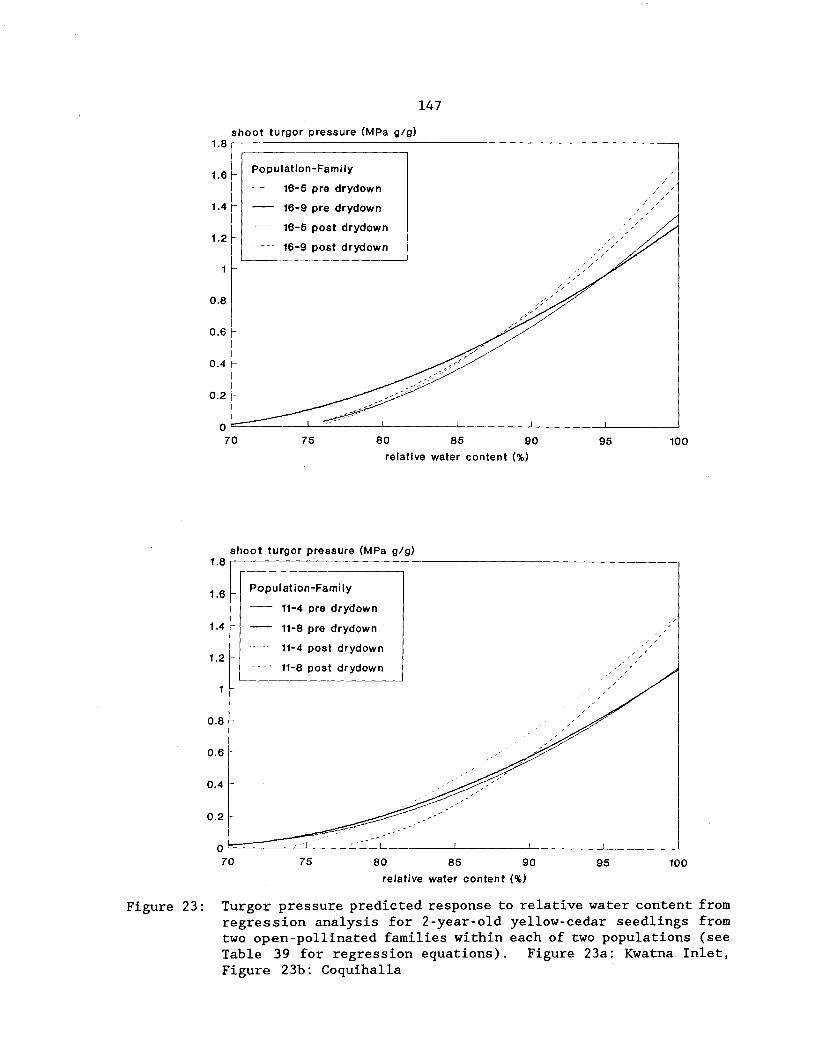
1.8
1.6
1.4
1.2
1
OM
OM
OA
0.2
070^75^80^85^90
relative water content (%)
95 100
16-5 pre drydown
16-9 pre drydown
16-5 post drydown
16-9 post drydown
Population-Family
^ 11-4 pre drydown
11-8 pre drydown
11-4 post drydown
11-8 post drydown
shoot turgor pressure (MPa g/g)
147
shoot turgor pressure (MPa g/g)
70^75^80^85^90^
95^
100
relative water content (%)
Figure 23: Turgor pressure predicted response to relative water content fromregression analysis for 2-year-old yellow-cedar seedlings fromtwo open-pollinated families within each of two populations (seeTable 39 for regression equations). Figure 23a: Kwatna Inlet,Figure 23b: Coquihalla
1.8
1.6
1.4
1.2
0.8
0.6
0.4
0.2

Table 40:^Least-square means of morphological traits for yellow-cedar gas exchangestudy, by moisture regime
Trait'
ht2 rgr2 rcd2 brlgth totdw root2 stem2 branch2
dry
113 323.7ab4 0.589a 4.91b 82.1a 11.5b 1.50b 0.737a 1.68a
16 307.6b 0.465b 5.02b 73.3b 11.4b 1.63a 0.719a 1.55b
31 338.9a 0.500b 5.38a 86.7a 13.8a 1.54ab 0.797a 1.61a
42 324.7ab 0.528ab 5.19ab 83.8a 12.7ab 1.51b 0.710a 1.67a
wet
11 355.9c 0.641a 5.44b 97.5a 15.0a 1.62b 0.930b 1.87a
16 344.5d 0.572b 5.75ab 79.8b 13.3a 1.74a 0.885b 1.77b
31 392.0a 0.623a 5.91a 104.6a 15.9a 1.67ab 1.05a 1.77b
42 367.6b 0.680a 5.82ab 87.7ab 15.4a 1.63b 0.818b 1.90a
1. See Table 24 for explanation of trait abbreviations2. loge (dry weight) adjusted for loge (total dry weight)3. 11^Kwatna Inlet, B.C.; 16 - Coquihalla, B.C.; 31 - Mt. Angeles, WA;
42 - Mitkof Island, AK4. Different letters in the same column within each environment denotes significance
at the p<0.05 level using multiple, pair-wise t-tests
149
Rankings of populations were similar between the two moisture regimes for all
traits, especially for those populations in which traits were significantly
different (i.e. no genotype by environment interaction).
Seedlings from the Coquihalla population, an interior:coastal
transition site which receives 20% of the average summer rainfall at Kwatna
Inlet (see Table 23), had less shoot and lateral branch growth, and less
allocation of carbohydrates to branches, than seedlings from the three
coastal populations. However, Coquihalla seedlings allocated more dry matter
production to root dry weight than Kwatna Inlet or Mitkof Island seedlings
under both moisture regimes. Seedlings from the more xeric site (Coquihalla)
developed a more conservative phenotype, smaller height and diameter growth,
decreased lateral branch growth, and more allocation of carbohydrates to
roots and less to stem and branches. This seedling morphology should allow
for increased soil water absorption through the exploration of a larger
volume of soil and increased absorption efficiency per unit root area, and
decreased transpirational surface (Levitt 1980b).
Seedlings from Mt. Angeles population, a south-facing coastal leeward
site which also receives substantially less rainfall than Kwatna Inlet or
Mitkof Island (see Table 23), also allocated more carbohydrates to roots
under both moisture regimes.
In this study, seedlings from Coquihalla had the greatest ability to
assimilate CO2 at all levels of stress studied and to maintain greater CO2
uptake at a given level of stomatal conductance greater than 0.2 cm sec -1 .
As well, these seedlings had the greatest water use efficiency when under
stress. Seedlings from both populations osmotically adjusted, however,
seedlings from Coquihalla, a xeric habitat, had lower Ar(sat) prior to the

150
drydown. A similar result was found for green ash (Abrams et al. 1990).
Lower osmotic potentials under saturation would allow for the maintenance of
positive turgor if osmotic adjustment was not possible such as a rapid
increase in soil water deficit.
Both populations had similar tissue capacitance before and after the
drought, with similar changes in shoot turgor pressure with decreasing RWC.
Coquihalla seedlings, however, consistently maintained higher Op at a given
RWC, thus possibly being able to maintain stomatal opening at lower RWC.
Thus, besides their conservative morphology, seedlings from Coquihalla
had increased photosynthetic efficiency per unit area foliage and greater
stomatal conductance under both well-watered and drought conditions, lower
osmotic potential prior to drought, and higher turgor pressure at a given
relative water content. These physiological adaptations to drought, as well
as the ability to osmotically adjust and increase cell wall inelasticity
following a drought, will allow for the maintenance of positive turgor and
cell growth (Hsiao 1973), and minimize physical damage to cellular processes
due to drought (Levitt 1980a). The above morphological and physiological
adaptations to drought have been reported for other woody tree species from
xeric habitats (Kelliher and Tauer 1980, Parker and Pallardy 1985, Bongarten
and Teskey 1986, Joly et al. 1989, Abrams et al. 1990, Kubiske and Abrams
1992).
The environments used in this study were not completely indicative of
environments where yellow-cedar occurs. In particular soil temperature,
which has shown to have an influence on gas exchange in yellow-cedar
(Grossnickle and Russell 1991), may influence a population's adaptive
response to moisture stress with respect to morphological development.

151
3.4 SUMMARY
Environments had a large effect on growth and morphology of yellow-
cedar. Shoot elongation exhibited phenotypic plasticity, responding to both
decreased photoperiod and water-stress through decreased shoot growth, and
relative growth rates greater than the non-stressed seedlings upon release of
the treatments. There were no significant treatment interactions of
photoperiod and moisture regime.
Significant differences were evident among the 18 populations analyzed
without family structure for all growth and morphology traits. In the
reduced dataset in which only nine populations were included, differences
among families within populations were large and significant for all traits,
and accounted for most of the genetic variation, with little or none
attributed to populations. Significant interactions of replication by
genetic entry for some of the traits, makes the interpretation of genetic
main effects difficult.
In all growth and morphology traits analyzed, there was minimal
evidence for significant genotype by environment interactions at both the
population and family within population level, with both photoperiod
treatments and water regimes.
Environments had minimal impact on dry weight partitioning. Population
differences were also small, except when seedlings were grown under long-days
and moisture stress. As well, there were no interactions of populations with
environments.
Genetic variation in gas exchange and water relation parameters in
response to a drought was evident with 2-year-old yellow-cedar seedlings
among and within populations. With respect to gas exchange, seedlings from

152
the most xeric site (Coquihalla) had less stomatal sensitivity to drought,
resulting in greater carbon assimilation and water use efficiency at lower
predawn shoot water potentials as compared to seedlings from more mesic sites
(Kwatna Inlet and Mitkof Island). Seedlings from Mt. Angeles, an
intermediate site with respect to moisture availability, had an intermediate
response. Within population variation was evident in gas exchange response
to drought in all populations with family structure.
Both populations studied with respect to water relation parameters
(Kwatna Inlet and Coquihalla) exhibited similar responses to drought,
osmotically adjusting and increasing cell wall inelasticity, and reaching
similar levels of osmotic potential and cell wall elasticity after the
drought. Seedlings from Coquihalla had lower osmotic potentials at
saturation before the drydown as compared to seedlings from Kwatna Inlet.
There were significant differences among families for osmotic potential at
saturation, cell wall elasticity, symplastic water, and dry weight prior to
the drydown, and for symplastic water after the drydown.
Seedlings from Coquihalla, a xeric habitat, had less shoot and lateral
branch extension and less biomass allocated to branches and more to roots as
compared to mesic sources under both well-watered and drought conditions.

153
CHAPTER 4: CONCLUSIONS
Although yellow-cedar appears to occupy a unique and limited niche
within the Pacific Northwest, its range is extensive latitudinally and it
exhibits a wide ecological amplitude in response to soil moisture and
nutrient availability. In the absence of competition from other associated
conifers, the range of yellow-cedar would most likely be (or has been in the
past) more extensive. This view is supported by past climatic and geological
events (Critchfield 1984) and the existence of isolated, inland populations
in central Oregon and southern British Columbia. The combination of an
extensive latitudinal range and geographic isolation, coupled with a wide
ecological amplitude and indeterminate growth habit, would seem to suggest
aspects of both a specialist and generalist adaptive mode.
In this study, the following generalities for morphological and
physiological seedling traits that measured the range of the annual
developmental sequence of yellow-cedar, can be stated:
1. significant population and family within population genetic variation
exists for many of the traits measured;
2. genetic variation among families, for most traits, is 2 to 16 times
greater than population variability;
3. seedling traits are under moderate to strong additive genetic
control;
4. genetic variation at the population level is moderately correlated
with seed origin for most traits, and;
5. seedlings exhibit phenotypic plasticity in response to environmental
changes.
154
The above generalities on population effects and associations with
geography are more relevant when all populations measured in this study are
considered. If southern populations are removed, (i.e. Oregon populations),
then correlations of traits with seed origin are, for the most part,
nonsignificant. This can be seen by the minimal trait correlations with seed
origin and the lack of evidence for photoperiodic ecotypes in the environment
study presented in Chapter 3, in which no Oregon populations were included.
A result similar to the above can be seen for population differences in
adaptive responses to drought. In this study, morphological and
physiological responses to drought were only apparent among populations from
areas that greatly differed in moisture availability (i.e. coastal, windward
versus coast:interior transition).
Thus, it seems possible that yellow-cedar populations in the extreme
environmental ranges of the species, (i.e. southern and continental
populations), have responded to environmental selection pressures, most
likely aided by reduced gene flow due to spatial isolation and poor sexual
reproduction (Russell et al. 1990), by changes in gene frequency. At the
same time, however, the species has maintained a substantial amount of both
genetic variation and phenotypic plasticity within populations. Yellow-cedar
seems to have evolved an intermediate adaptation mode with less genetic
differentiation associated with geography than coastal Douglas-fir, Sitka
spruce, and western hemlock, and more geographic differentiation than western
white pine and western redcedar.
This study has shown that yellow-cedar responds readily to changes in
environment. However, there was minimal evidence that phenotypic plasticity
was under genetic control as illustrated by the lack of interaction of

155
populations and environments and families and environments.^Possible
explanations for this are:
1. Responding to photoperiod for initiating shoot growth cessation is
not a primary adaptation signal for indeterminate species. In studies with
Thuja plicate and T. occidentalis, Vaartaja (1959, 1962) showed that very
short days (less than 8 hours) were required to generate a significant
morphological response between seedlings from southern and northern
populations. Thus, in this study, the minimal difference between the two
photoperiod treatments was enough to produce an overall species response, but
not any differential response among populations or families within
populations;
2. The moisture stress applied in this study was quite severe, and
most seedlings completely stopped growing. This may have completely masked
any interactions of genotype and environment. Perhaps a milder stress would
have been more appropriate for detecting genetic variability in plasticity.
3. Temperature, possibly in combination with photoperiod, may be a
more important environmental signal for yellow-cedar growth rhythms. This
was illustrated qualitatively in Chapter 2 by the differential response of
populations in growth cessation in the fall to an ambient warming trend.
Thus, the lack of genetic control of phenotypic plasticity in yellow-
cedar may be more an artifact of the actual treatments and their levels
chosen for this study, as opposed to any real biological absence.
This thesis represents a comprehensive study on the effects of
genetics, environments, and their interactions, for seedlings of a non-bud
forming species. Interpreting and integrating morphological and
physiological characteristics which infer fitness attributes to seedlings of
156
yellow-cedar, allowed for an indepth look at adaptive strategies to
heterogeneous environments for an indeterminate species. In particular, the
following approaches were new for indeterminate species:
1. describing shoot growth initiation and cessation components for
populations and environments and correlating them to cold-hardiness,
growth, and geographic parameters of seed origin, and;
2. describing drought resistant populations, integrating morphological
and physiological characteristics, including gas exchange and water
relations.

157
BIBLIOGRAPHY
Abrams,M.D. 1988. Sources of variation in osmotic potentials with specialreference to North American tree species. For. Sci. 34:1030-1046.
Abrams,M.D., Kubiske,M.E. and Steiner,K.C. 1990. Drought adaptations andresponses in five genotypes of Fraxinus pennsylvanica Marsh.: photosynthesis,water relations and leaf morphology. Tree Physiol. 6:305-315.
Antos,J.A. and Zobel,D.B. 1986. Habitat relationships ofChamaecyparis nootkatensis in southern Washington, Oregon, and California.Can. J. of Bot. 64:1898-1909.
Arnott,J.T., Dunsworth,B.G. and O'Reilly,C.O. 1988. Effect of nursery cultureon morphological and physiological development of western hemlock seedlings.p. 38-44. In: Proc. Comb Mtg of the Western Forest Nursery Associations,Vernon, British Columbia. USDA Rocky Mount. For. and Range Exp. Sta. Gen.Tech. Rep. RM-167.
Arnott,J.T., Grossnickle,S.C., Puttonen,P., Mitchell,A.K. and Folk,R.S. 1992.Morphological development and physiological response of yellow cypressstecklings to nursery culture. Subm. to Can. J. For. Res.
Aronsson,A. 1975. Influence of photo- and thermoperiod on initial stages offrost hardening and dehardening of phytotron-grown seedlings of Scots pine(Pinus silvestris L.) and Norway spruce (Picea abies (L.) Karst). Stud. For.Suec. 128:1-20.
Bagchi,S. and Iyama,S. 1983. Radiation induced developmental instability inArapidopsis thaliana. Theor. Appl. Genet. 65:85-92.
Bahari,Z.A^
Pallardy,S.G. and Parker,W.C. 1985. Photosynthesis,^waterrelations, and drought adaptation in six woody species of Oak-Hickory forestsin central Missouri. For. Sci. 31:557-569.
Becker,W.A . 1984. Manual of Quantitative Genetics. Academic Press, Pullman,WA. 190 p.
Bigras,F.J. and D'Aoust,A.L. 1992. Hardening and dehardening of shoots androots of containerized black spruce and white spruce seedlings under shortand long days. Can. J. For. Res. 22:388-396.
Blake,J., Zaerr,J. and Hee,S. 1979. Controlled moisture stress to improvecold hardiness and morphology of Douglas-fir seedlings. For. Sci. 25:576-582.
Blum,A. 1988. Plant Breeding for Stress Environments. CRC Press, Boca Raton,FL. 223 p.
Bongarten,B.C. and Teskey,R.O. 1986. Water relations of loblolly pine fromdiverse geographic origins. Tree Physiol. 1:265-276.
158
Bongarten,B.C. and Teskey,R.O. 1987. Dry weight partitioning and itsrelationship to productivity in loblolly pine seedlings from seven sources.For. Sci. 33:255-267.
Bourdeau,P.F. 1963. Photosynthesis and respiration of Pinus strobus L.seedlings in relation to provenance and treatment. Ecol. 44:710-716.
Bradshaw,A.D. 1965. Evolutionary significance of phenotypic plasticity inplants. Adv. Gen. 13:115-155.
Bramlett,D.L., Dell,T.R. and Pepper,W.D. 1983. Genetic and maternalinfluences on Virginia pine seed germination. Silvae Genet. 32:1-4.
Brown,J.H. 1969. Variation in roots of greenhouse grown seedlings ofdifferent Scotch pine provenances. Silvae Genet. 18:111-117.
Burdett,A.N. and Yamamoto,S. 1986. Growth rate and shoot:root allometry inPseudotsuga menziesii (Mirb.) Franco and Pinus contorta Dougl. seedlingsraised under two photoperiod regimes. Scand. J. For. Res. 1:397-402.
Burgar,R.J. 1964. The effect of seed size on germination, survival andinitial growth in white spruce. For. Chron. 40:93-97.
Campbell,R.K. 1979. Genecology of Douglas-fir in a watershed in the OregonCascades. Ecol. 60:1036-1050.
^ 1986. Mapped genetic variation of Douglas-fir to guide seed transferin southwest Oregon. Silvae Genet. 35(2-3):85-96.
Campbell,R.K. and Rediske,J.H. 1966. Genetic variability of photosyntheticefficiency and dry-matter accumulation in seedling Douglas-fir. Silvae Genet.15:65-72.
Campbell,R.K. and Sorenson,F.C. 1978. Effect of test environment onexpression of clines and on delimitation of seed zones in Douglas-fir. Theor.Appl. Genet. 51:233-246.
Campbell,R.K., Pawuk,W.L. and Harris,A.S. 1989. Microgeographic geneticvariation of Sitka spruce in southeastern Alaska. Can. J. For. Res. 19:1004-1013.
Cannell,M.G.R. and Willet,S.C. 1976. Shoot growth phenology, dry matterdistribution and root:shoot ratios of provenances of Populus trichocarpa,Picea sitchensis and Pinus contorta growing inScotland. Silvae Genet. 25:49-59.
Cannell,M.G.R.,Bridgewater,F.E. and Greenwood,M.S. 1978. Seedling growthrates, water stress responses and root-shoot relationships related to eight-year volumes among families of Pinus taeda L. Silvae Genet. 27:237-248.
Cheung,K-W. 1973. Induction of dormancy in container-grown western hemlock(Tsuga heterophylla (Raf.) Sarg.). B.C.F.S. Res. Note No. 59. 5 p.
159
Choi,H.S. 1992. Variation in water potential components among half-sibfamilies of shortleaf pine (Pinus echinata) in response to soil drought. Can.J. For. Res. 22:111-116.
Christersson,L. 1978. Influence of photoperiod and temperature on thedevelopment of frost hardiness in seedlings of Pinus sylvestris and Piceaabies. Physiol. Plant. 44:288-294.
Colombo,S.J. and Raitenan,E.M. 1991. Frost hardening in white cedar containerseedlings exposed to intermittent short days and cold temperatures. For.Chron. 67:542-544.
Colombo,S.J., Glerum,C. and Webb,D.P. 1989. Winter hardening in first-yearblack spruce (Picea mariana) seedlings. Physiol. Plant. 76:1-9.
Colombo,S.J., Webb,D.P. and Glerum,C. 1982. Cold hardiness and buddevelopment under short days in black spruce and white spruce seedlings. p.171-176. In: Proc. Canadian Containerized Tree Seedling Symposium, 14-16Sept. 1981, Toronto, Ont. Eds Scarrat,J.B.,Glerum,C and Plexman,C.A. Can.For. Serv., Great Lakes for. Cent., COJFRC Symp. Proc. 0-P-10.
Critchfield,W.B. 1984. Impact of the Pleistocene on the genetic structure ofNorth American conifers. p. 70-118. In: Ed. R.M.Lanner. Proceedings 8th NorthAmerican Forest Biology Workshop, Logan, Utah.
D'Aoust,A.L. andtemperatures andspruce seedlings.Symposium, 14-16Plexman,C.A. Can.10.
Cameron,S.I. 1982. The effect of dormancy induction, lowmoisture stress on cold hardening of containerized blackp. 153-161. In: Proc. Canadian Containerized Tree SeedlingSept. 1981, Toronto, Ont. Eds. Scarrat,J.B.,Glerum,C andFor. Serv., Great Lakes for. Cent., COJFRC Symp. Proc. O-P-
DeLucia,E.H. and Heckathorn,S.A. 1989. The effect of soil drought on water-use efficiency in a contrasting Great Basin desert and Sierran montanespecies. Plant, Cell and Env. 12:935-940.
Dunlop,J.R. and Barnett,J.P. 1983. Influence of seed size on germination andearly development of loblolly pine (Pinus taeda) germinants. Can. J. For.Res. 13:40-44.
Dykstra,G.F. 1974. Drought resistance of lodgepole pine seedlings in relationto provenance and tree water potential. B.C.F.S. Res. Note No. 62. 11 p.
El Kassaby,Y.A., Edwards,D.G.W. and Taylor,D.W. 1992. Genetic control ofgermination parameters in Douglas-fir and its importance for domestication.Silvae Genet. 41:48-54.
El Kassaby,Y.A.,Maze,J.,MacLeod,D.A. and Banerjee,S. 1991. Reproductivedevelopment plasticity in yellow-cedar (Chamaecyparis nootkatensis (D.Don)Spach). Can. J. For. Res. 21:1360-1364.

160
Ellsworth,D.S. and Reich,P.B. 1992. Water relations and gas exchange of Acersaccharum seedlings in contrasting natural light and water regimes. TreePhysiol. 10:1-20.
Falkenhagen,E.R. 1977. Genetic variation in 38 populations of Sitka spruce.Silvae Genet. 26:67-75.
Fashler,A.,E1 Kassaby,Y.A. and Sziklai3O. 1985. Interprovenance variabilityin an IUFRO Douglas-fir provenance-progeny trial. p. 187-204. In:Proceedings IUFRO Working Party S.2.02.05, Eds. W.Ruetz and J.Nather, Vienna,Austria.
Ferrell,W.K. and Woodward,S. 1966. Effect of seed origin on droughtresistance of Douglas-fir. Ecol. 47:499-503.
Folk,R.S., Grossnickle,S.C. and Major,J.E. 1993. Influence of nursery cultureon western redcedar. II. Freezing tolerance of fall-planted seedlings andmorphological development of fall- and spring-planted seedlings. Subm. to NewForests.
Foster,G.S. 1986. Trends in genetic parameters with stand development andtheir influence on early selection for volume growth in loblolly pine. For.Sci. 32(4):944-959.
Franklin,E.C. 1979. Model relating levels of genetic variance to standdevelopment of four North American conifers. Silvae Genet. 28(5-6):207-212.
Fryer,J.H. and Ledig,F.T. 1972. Microevolution of the photosynthetictemperature optimum in relation to the elevational gradient complex. Can. J.Bot. 50:1231-1235.
Giertych,M.M. and Farrar,J.L. 1961. The effect of photoperiod and nitrogen onthe growth and development of seedlings of jack pine. Can. J. Bot. 39:1247-1254.
Gill,J.G.S. 1987. Juvenile-mature correlations and trends in geneticvariances in Sitka spruce in Britain. Silvae Genet. 36(5-6):189-194.
Glerum,C. 1985. Frost hardiness of coniferous seedlings: principles andapplications. p. 107-122. In. Proc: Evaluating seedling quality: principles,procedures, and predictive abilities of major tests. Ed. Duryea,M.L. Workshopheld Oct. 16-18, 1984. Forest Research Lab., Oregon State University,Corvallis.
Griffin,A.R. 1972. The effects of seed size, germination time and sowingdensity on seedling development in radiata pine. Aust. For. Res. 5:25-28.
Griffin,A.R. 1977. Geographic variation in Douglas-fir from the^Coastalranges of California: II.Predictive value of a regression model for seedlinggrowth variation. Silvae Genet. 26(5-6):158 163.

161
Griffin,A.R. and Ching,K.K. 1977. Geographic variation in Douglas-fir fromthe Coastal ranges of California: I. Seed, seedling growth and hardinesscharacteristics. Silvae Genet. 26(5-6):149-157.
Grossnickle,S.C. 1992. Shoot water relations and gas exchange of westernhemlock and western redcedar seedlings during establishment on areforestation site. Tree Struct. and Funct. (in press).
Grossnickle,S.C. and Russell,J.H. 1991. Gas exchange processes of yellow-cedar (Chamaecyparis nootkatensis) in response to environmental variables.Can. J. Bot. 69:2684-2691.
Grossnickle,S.C., Arnott,J.T. and Major,J.E. 1988. A stock quality assessmentprocedure for characterizing nursery-grown seedlings. p. 77-88. In: Proc.Comb Mtg of the Western Forest Nursery Associations, Vernon, BritishColumbia. USDA Rocky Mount. For. and Range Exp. Sta. Gen. Tech. Rep. RM-167.
Grossnickle,S.C., Arnott,J.T., Major,J.E., and Tschaplinski,T.J. 1991.Influence of dormancy induction treatment on western hemlock seedlings I.Seedling development and stock quality assessment. Can. J. For. Res. 21:164-174.
Harry,D.E. 1987. Shoot elongation and growth plasticity in incense-cedar.Can. J. For. Res. 17:484-489.
Hawkins,C.D.B. and Draper,D.A. 1988. Height control of interior spruce bymeans of photoperiodic reduction. p . 45-49. In: Proc. Comb. Mtg. of theWestern Forest Nursery Associations, Vernon, British Columbia. USDA RockyMount. For. and Range Exp. Sta. Gen. Tech. Rep. RM-167.
Heide,O.M. 1974. Growth and dormancy in Norway spruce ecotypes (Picea abies)I. Interaction of photoperiod and temperature. Physiol. Plant. 30:1-12.
Hellkvist,J. 1970. The water relations of Pinus sylvestris. Physiol. Plant.23:631-646.
Hinckley,T.M., Duhme,F.,Hinckley,A.R. and Ritcher,H. 1980. Water relations ofdrought hardy shrubs: osmotic potential and stomatal reactivity. Plant, Celland Environ. 3:131-140.
Hsiao,T.C. 1973. Plant response to water stress. Ann. Rev. Plant Physiol.24:519-570.
Hsiao,T.C., Acevedo,E., Fereres,E. and Henderson,D.W. 1976. Water stress,growth and osmotic adjustment. Phil. Trans. Royal Soc. London B. 273:479-500.
Irgens-Moller,H. 1957. Ecotypic response to temperature and photoperiod inDouglas-fir. For. Sci. 3:79-83.
Irgens-Moller,H. 1962. Genotypic variation in photoperiodic response ofDouglas-fir seedlings. For. Sci. 8:360-362.

162
Jain,S. 1979. Adaptive strategies: polymorphism, plasticity, and homeostasis.p. 160-187. In: Topics in Plant Population Biology. Eds. O. Solbrig et al.Acad. Press, N.Y.
Joly,R.J. and Zaerr,J.B. 1987. Alteration of cell-wall water content andelasticity in Douglas-fir during periods of water deficit. Plant Physiol.83:418-422.
Joly,R.J., Adams,W.T. and Stafford,S.G. 1989. Phenological and morphologicalresponses of mesic and dry site sources of coastal Douglas-fir to waterdeficit. For. Sci. 35:987-1005.
Jonsson,A.,Eriksson,G and Franzen,A. 1986. Within-population^variationin frost damage in Pinus contorta Dougl. seedlings after simulated autumn orlate-winter conditions. Silvae Genet. 35(2-3):96-102.
Kelliher,F.M. and Tauer,C.G. 1980. Stomatal resistance and growth of drought-stressed eastern cottonwood from a wet and dry site. Silvae Genet. 29:166-171.
Klinka,K. 1991. Ecology of yellow-cedar sites. p. 23-28. In:^Ed.Lousier,J.D. Proceedings Yellow Cypress Symposium: Can We Grow It? Can WeSell It? B.C.F.S. FRDA Report No. 171.
Krajina,V.J. 1969. Ecology of forest trees in British Columbia.^Ecol. ofWest. Nor. Amer. 2(1):1-146.
Krajina,V.J.,Klinka,K.,Worrall,J.^1982.^Distribution^and^ecologicalcharacteristics of trees and shrubs of British Columbia. University ofBritish Columbia, Faculty of Forestry. 131 p.
Kramer,P.J. 1936. Effect of variation in length of day on growth and dormancyof trees. Plant Physiol. 11:127-137.
Kramer,P.J. 1983. Water Relations of Plants. Academic Press. 489 p.
Kramer,P.J. 1986. The role of physiology in forestry. Tree Physiol. 2:1-16.
Krasowski,M.J. and Owens,J.N. 1991. Growth and morphology of western redcedarseedlings as affected by photoperiod and moisturestress. Can J. For. Res. 21:340-352.
Kubiske,M.E. and Abrams,M.D. 1992. 1992. Photosynthesis, water relations, andleaf morphology of xeric versus mesic Quercus rubra ecotypes in centralPennsylvania in relation to moisture stress. Can. J. For. Res. 22:1402-1407.
Kuser,J.E. and Ching,K.K. 1980. Provenance variation in phenology and coldhardiness of western hemlock seedlings. For. Sci. 26(3):463-470.
^ . 1981. Provenance variation in seed weight, cotyledon number, andgrowth rate of western hemlock seedlings. Can. J. For. Res. 11:662-670.

163
Lavender,D.P. 1980. Effects of environment upon the shoot growth of woodyplants. p. 76-106. In: Proc. Joint Workshop IUFRO Working Parties on XylemPhysiology and Shoot Growth Physiology, July 20-24, 1980, Frederiction, NewBrunswick.
Lavender,D.P., Ching,K.K. and Hermann,R.K. 1968. Effect of environment on thedevelopment of dormancy and growth of Douglas-fir seedlings. Bot. Gaz.129:70-83.
Ledig,F.T. and Perry,T.O. 1965. Physiological genetics of the shoot-rootratio. p. 39-43. In: Proc. Soc. Amer. For., 1960, Detroit, Michigan.
Ledig,F.T. and Perry,T.O. 1967. Variation in photosynthesis and respirationamong loblolly pine progenies. p. 120-128. In: Proc. 9th Southern Conf. For.Tree Improv. Knoxville, Tennessee.
Ledig,F.T., Bormann,F.H. and Wenger,K.F. 1970. The distribution of dry mattergrowth between shoot and roots of loblolly pine. Bot. Gaz. 131:349-359.
Levitt,J. 1980a. Response of Plants to Environmental Stresses. Vol. I.Chilling, Freezing, and High Temperature Stresses. Academic Press. 497 p.
Levitt,J. 1980b. Response of Plants to Environmental Stresses. Vol. II.Water, Radiation, Salt, and Other Stresses. Academic Press. 607 p.
Lewontin,R.C. 1957. The adaptation of populations to varying environments.Cold Spring Harbour Symp. Quant. Biol. 22:395-408.
Lines,R. 1987. Seed origin variation in Sitka spruce. In:^Eds.Henderson,D.M. and Faulkner,R. Proc. Royal Soc. Edinburgh 93B:25-39.
Loopstra,C.A. and Adams,W.Th. 1989. Patterns of variation in first yearseedling traits within and among Douglas-fir breeding zones in southwestOregon. Silvae Genet. 38(5-6):235-243.
MacDonald,S.E. and Chinnappa,C.C. 1989. Population differentiation forphenotypic plasticity in the Stellaria longpipes complex. Am. J. Bot.76(11):1627-1637.
McGee,A.B., Schmierbach,M.R. and Bazzaz,F.A. 1981. Photosynthesis and growthin populations of Populus deltoides from contrasting habitats Am. Mid. Nat.105:305-311.
McCreary,D.D., Tanaka,Y. and Lavender,D.P. 1978. Regulation of Douglas-firseedling growth and hardiness by controlling photoperiod. For. Sci. 24: 142-152.
Macey,D.M. and Arnott,J.T. 1986. The effect of moderate moisture and nutrientstress on bud formation and growth of container-grown white spruce seedlings.Can. J. For. Res. 16:949-954.
Major,J.E., Grossnickle,S.C., Folk,R.S. and Arnott,J.T. 1993. Influence of

164
nursery culture on western redcedar. I. Seedling quality assessment beforefall and spring. Subm. to New Forests.
Mebrahtu,T. and Hanover,J.W. 1991. Family variation in gas exchange, growthand leaf traits of black locust half-sib families. Tree Physiol. 8:185-193.
Mikola,J. 1984. Relationships between height growth differences of Scots pinefull-sib families and variation in seed size, annual growth rhythm, and somefoliage characteristics. p. 233-243. In: Crop physiology of forest trees.Eds. Tigerstedt,P.M.A., Puttonen,P. and Koski,V. Helsinki Univ. Press,Helsinki, Finland.
Milliken,G.A. and Johnson,D.E. 1984. Analysis of Messy Data. van NostrandReinhold, N.Y. 473 p.
Namkoong,G. and Conkle,M.T. 1976. Time trends in genetic control of heightgrowth in ponderosa pine. For. Sci. 22:2-12.
Namkoong,G., Usanis,R.A. and Silen,R.R. 1972. Age-related variation ingenetic control of height growth in Douglas-fir. Theor. Appl. Genet. 42:151-159.
Nassar,R. and Huhn,M. 1987. Studies on estimation of phenotypic stability.Biomet. 43:45-53.
Nelson,E.A. and Lavender,D.P. 1976. Dormancy of western hemlock seedlings. p.103-107. In: Proc. Western Hemlock Management Conference. Eds. Atkinson,W.A.and Zasoski,R.J. Coll. Forest Resources, Univ. Wash., Inst. For. Prod.Contrib. No. 34.
Neter,J. and Wasserman,W. 1974. Applied Linear Statistical Models. R.D.Irwin, Inc. 842 p.
Ni,B-R. and Pallardy,S.G. 1991. Response of gas exchange to waterstress in seedlings of woody angiosperms. Tree Physiol. 8:1-9.
Nienstadt, H. and Olson,J.S. 1961. Effects of photoperiod and source onseedling growth of eastern hemlock. For. Sci. 7:81-96.
Parker,W.C. and Pallardy,S.G. 1985. Genotypic variation in tissue waterrelations of leaves and roots of black walnut (Juglans nigra) seedlings.Physiol. Plant. 64:105-110.
Pauley,S.S. and Perry,T.O. 1954. Ecotypic variation in the photoperiodicresponse in Populus. J. Arnold Arbor. 35:167-188.
Pelkonen,P. and Luukkanen,O. 1974. Gas exchange in three populations ofNorway spruce. Silvae Genet. 23:160-164.
Perry,D.A. and Lotan,J.E. 1978. Variation in lodgepole pine (Pinus contortavar. latifolia): greenhouse response of wind pollinated families from fivepopulations to day length and temperature-soil. Can. J. For. Res. 8:81-89.

165
Perry,D.A., Lotan,J.E., Hinz,P. and Hamilton,M.A. 1978. Variation inlodgepole pine: Family response to stress induced by polyethylene glycol6000. For. Sci. 24:523-526.
Perry,T.O. and Hafley,W.L. 1981. Variation in seedling growth rates: Theirgenetic and physiological bases. p. 288-301. In: Proc. 16th South. For. TreeImprov. Conf., Blacksburg, VA.
Perry,T.O., Chi-Wu,W. and Schmitt,D. 1965. Height growth for loblolly pineprovenances in relation to photoperiod and growing season. Silvae Genet.15:61-64.
Pollard,D.F.W. and Ying,C.C. 1979. Variation in response to decliningphotoperiod among families and stands of white spruce in southeasternOntario. Can. J. For. Res. 9:443-448.
Pollard,D.F.W., Teich,A.H. and Logan,K.T. 1975. Seedling shoot and buddevelopment in provenances of Sitka spruce, Picea sitchensis (Bong.) Carr.Can. J. For. Res. 5:18-25.
Raley,E.M. and Tauer,C.G. 1986. Examination of several drought resistanceparameters in loblolly and Virginia pine. p. 144-152. In: Proc.9th NorthAmer. For. Biology Workshop. Stillwater, Oklahoma.
Rehfeldt,J. 1979a. Ecotypic differentiation in populations of Pinus monticolain northern Idaho - myth or reality? The Amer. Natur. 114(5):627-636.
^ . 1979b. Ecological adaptations in Douglas-fir populations. 1. NorthIdaho and north-east Washington. Heredity 43(3):383-397.
^ . 1982. Ecological adaptations in Douglas-fir populations. II. WesternMontana. Res. Pap. INT-295. U.S.D.A. For. Ser. Intermountain Forest and RangeExperiment Station. 8 p.
^ . 1984. Microevolution of conifers in the northern Rocky Mountains: Aview from common gardens. p. 32-46. In: R.M.Lanner, editor. Proceedings 8thNorth American Forest Biology Workshop, Logan, Utah.
^ . 1988. Genetic variances and covariances in freezing tolerance oflodgepole pine during early winter acclimation. Silvae Genet. 38(3-4):133-137.
Ritchie,G.A. and Hinckley,T.M. 1975. The pressure chamber as an instrumentfor ecological research. Adv. Ecol. Res. 9:165-254.
Roche,L. 1969. A genecological study of the genus Picea in British Columbia.New Phytol. 68:505-554.
Russell,J.H. 1992. Clonal forestry with yellow-cedar. In: Clonal Forestry:Genetics, Biotechnology and Application. Springer Verlag (in press).
Russell,J.H., Grossnickle,S.C., Ferguson,C. and Carson,D.W. 1990. Yellow-cedar stecklings: Nursery production and field performance. B.C.F.S. FRDA

166
Report No. 148. 20 p.
St. Clair,J.B. and Adams,W.T. 1991. Effects of seed weight and rate ofemergence on early growth of open-pollinated Douglas-fir families. For. Sci.37(4):987-997.
St. Clair,J.B. and Kleinschmit,J. 1986. Genotype-environment interaction andstability in ten-year height growth of Norway spruce clones (Picea abiesKarst.). Silvae Genet. 35:177-186.
Sands,R., Kriedemann,P.E. and Cotterill,P.P. 1984. Water relations andphotosynthesis in three families of radiata pine seedlings known to differ intheir response to weed control. For. Ecol. and Manag. 9:173-184.
SAS Institute Inc. 1985. SAS Statistical Procedures for Personal Computers,Version 6 Edition. Cary, N.C. 378 p.
Scheiner,S.M. and Goodnight,C.J. 1984. The comparison of phenotypicplasticity and genetic variation in populations of the grass Danthoniaspicata. Evol. 38(4):845-855.
Schlichting,C.D. 1986. The evolution of phenotypic plasticity in plants. Ann.Rev. Ecol. Syst. 17:667-693.
Schlichting,C.D. 1989. Phenotypic integration and environmental change.BioSci. 39(7):460-464.
Schlichting,C.D. and Levin,D.A. 1984. Phenotypic plasticity of annual Phlox:Tests of some hypotheses. Am. J. Bot. 71:252-260.
Schlichting,C.D. and Levin,D.A. 1986. Effects of inbreeding on phenotypicplasticity in cultivated Phlox. Theor. Appl. Genet. 72:114-119.
Schulte,P.J. 1988. Pressure-volume curve analysis program: User's Guide.Univ. Calif. 7 p.
Schulte,P.J. and Hinckley,T.M. 1985. A comparison of pressure-volume curvedata analysis techniques. J. Exp. Bot. 36:1590-1602.
Seiler,J.R. and Cazell,B.H. 1990. Influence of water stress on the physiologyand growth of red spruce seedlings. Tree Physiol. 6:69-77.
Seiler,J.R. and Johnson,J.D. 1985. Photosynthesis and transpiration ofloblolly pine seedlings as influenced by moisture-stress conditioning. For.Sci. 31:742-749.
Seiler,J.R. and Johnson,J.D. 1988. Physiological and morphological responsesof three half-sib families of loblolly pine to water-stress conditioning.For. Sci. 2:487-495.
Silander,J.A. 1985. The genetic basis of the ecological amplitude of Spartinapatens. II. Variance and correlation analysis. Evol. 39(5):1034-1052.

167
Silim,S. 1991. The regulation of cold-hardiness in seedlings of westernredcedar, yellow-cedar, and white spruce. Ph'D Dissertation. U.B.C. 142 p.
Skroppa,T. 1984. A critical evaluation of methods available to estimate thegenotype x environment interaction. p. 3-14. In: Proc. Conf. on Genotype xEnvironment Interaction, Aug. 23-27, 1982. Uppsala, Sweden. Studia ForestaliaSuecica 166.
Sorenson,F.C., Campbell,R.K. and Franklin,J.F. 1990. Geographic variation ingrowth and phenology of seedlings of the Abies procera/A. Magnifica complex.For. Ecol. Manag. 39:205-232.
Squillace,A.E. 1974. Average genetic correlations among offspring from open-pollinated trees. Silvae Genet. 23:149-156.
Stearns,S.C. 1989. The evolutionary significance of phenotypic plasticity.BioSci. 39(7):436-445.
Sultan,S.E. 1987. Evolutionary implications of phenotypic plasticity inplants. Evol. Biol. 21:127-178.
Timmis,R. and Tanaka,Y. 1976. Effects of container density and moisturestress growth and cold hardiness of Douglas-fir seedlings. For. Sci. 22:167-172.
Townsend,A.M. and Roberts,B.R. 1973. Effect of moisture stress on red mapleseedlings from different seed sources. Can. J. Bot. 51:1989-1995.
Turner,N.C. and Begg,J.E. 1981. Plant-water relations and adaptation tostress. Plant and Soil 51:97-131.
Unterscheutz,P., Ruetz,W.F., Geppert,R.R. and Ferrell,W.K. 1974. The effectof age, pre-conditioning, and water stress on the transpiration rates ofDouglas-fir (Pseudostuga menziessii) seedlings of several ecotypes. Physiol.Plant. 32:214 - 221.
Vaartaja,O. 1959. Evidence of photoperiodic ecotypes in trees.Ecolo. Monogr. 29:91-111.
Vaartaja,O. 1962. Ecotypic variation in photoperiodism of trees with specialreference to Pinus resinosa and Thuja occidentalis. Can. J. Bot. 40:849-856.
van Buijtenen,J.P. 1966. Testing loblolly pine for drought resistance. TexasFor. Serv. Tech. Rep. No. 13. 15 p.
van den Driessche,R. 1970. Influence of light intensity and photoperiod onfrost-hardiness development in Douglas-fir seedlings. Can. J. Bot. 48:2129-2134.
van den Driessche,R. 1976. Prediction of cold hardiness in Douglas firseedlings by index of injury and conductivity methods. Can. J. For. Res.6:511-515.

168
Vance,N.C. and Running,S.W. 1985. Light reduction and moisture stress:effectson growth and water relations of western larch seedlings. Can. J. For. Res.15:72-77.
Wareing,P.F. 1956. Photoperiodism in woody plants. Ann. Rev. Plant Phys.7:191-214.
Waxler,M.S. and van Buijtenen,J.P. 1981. Early genetic evaluation of loblollypine. Can. J. For. Res. 11:351-355.
Weiser,C.J. 1970 . Cold resistance and injury in woody plants. Science169:1269-1278.
White,T.L. 1987. Drought tolerance of southwestern Oregon Douglas-fir. For.Sci. 33:283-293.
White,T.L.,Lavender,D.P.,Ching,K.K. and Hinz,P. 1981. First-year growth ofsouthwestern Oregon Douglas-fir in three test environments. Silvae Genet.30(6):173-178.
Whitehead,D., Sheriff,D.W. and Greer,D.H. 1983. The relationship betweenstomatal conductance, transpiration rate and tracheid structure in Pinusradiata clones grown at different water vapoursaturation deficits. Plant, Cell and Environ. 6:703-710.
Ying,C.C. 1990. Adaptive variation in Douglas-fir, Sitka spruce, and truefir: A summary of provenance research in coastal British Columbia. In:Proceedings Joint Meeting of Western Forest Genetics Association and IUFROWorking Parties S2.02, 05, 06, 12, and 14. Olympia, WA.
Young,E. and Hanover,J.W. 1978. Effects of temperature, nutrient, andmoisture stress on dormancy of blue spruce seedlings under continuous light.For. Sci. 24:458-467.
Zavitkovski,J. and Ferrell,W.K. 1968. Effect of drought upon rates ofphotosynthesis, respiration and transpiration of seedlings of two ecotypes ofDouglas-fir. Bot. Gaz. 129:346-350.