Polycrystalline Plasticity - DSpace@MIT
215
Polycrystalline Plasticity: Application to Deformation Processing of Lightweight Metals by Srihari Balasubramanian B.Tech., Mechanical Engineering, Indian Institute of Technology, Madras, 1992 S.M., Mechanical Engineering, Massachusetts Institute of Technology, 1995 Submitted to the Department of Mechanical Engineering in partial fulfillment of the requirements for the degree of Doctor of Philosophy at the MASSACHUSETTS INSTITUTE OF TECHNOLOGY February 1998 () Massachusetts Institute of Technology 1998. All rights reserved. Author ........................................................................... Department of Mechanical Engineering September 12, 1997 Certified by ............ .. ...- ................... Lallit Anand Professor Thesis Supervisor Accepted by ..................... r.... ....................................... Ain Sonin Chairman, Departmental Committee on Graduate Students APR 277 LIMAIRgr5
-
Upload
khangminh22 -
Category
Documents
-
view
0 -
download
0
Transcript of Polycrystalline Plasticity - DSpace@MIT
Polycrystalline Plasticity: Application to DeformationProcessing of Lightweight Metals
by
Srihari BalasubramanianB.Tech., Mechanical Engineering, Indian Institute of Technology, Madras, 1992
S.M., Mechanical Engineering, Massachusetts Institute of Technology, 1995
Submitted to the Department of Mechanical Engineeringin partial fulfillment of the requirements for the degree of
Doctor of Philosophy
at the
MASSACHUSETTS INSTITUTE OF TECHNOLOGY
February 1998
() Massachusetts Institute of Technology 1998. All rights reserved.
Author ...........................................................................Department of Mechanical Engineering
September 12, 1997
Certified by ............ . . ...- ...................Lallit Anand
ProfessorThesis Supervisor
Accepted by ..................... r.... .......................................Ain Sonin
Chairman, Departmental Committee on Graduate Students
APR 277
LIMAIRgr5
Polycrystalline Plasticity: Application to Deformation Processing of
Lightweight Metals
by
Srihari Balasubramanian
Submitted to the Department of Mechanical Engineeringon September 12, 1997, in partial fulfillment of the
requirements for the degree ofDoctor of Philosophy
AbstractThe major cause of anisotropic plastic response in polycrystalline metals is crystallographictexturing resulting from the reorientation of the crystal lattices of grains during deformation.There has been considerable recent progress in the continuum modeling of texture effects onthe plastic deformation of polycrystalline materials. Most of the previous work is based ona simple power-law description for the shearing rates on the crystallographic slip systems.Although this is a useful description of the viscoplastic response of crystals in a narrowrange of strain rates and temperatures, it is not able to capture the real strain-rate andtemperature sensitivity of flow of crystalline materials under high strain rates and/or lowtemperatures.
A physically motivated constitutive function based on the thermally-activated theory forplastic flow in face-centered-cubic (f.c.c.) materials together with the slip system hardeningequations has been incorporated in a polycrystalline plasticity model. The constitutivemodel has been implemented in a finite element program to facilitate simulations of quasi-static as well as dynamic non-homogeneous deformations of polycrystalline f.c.c. materials.The material parameters in the model have been determined by calibrating it againstexisting experimental data for aluminum. The physical description for the plastic flowenables the model to reproduce the macroscopic stress-strain response and crystallographictexture evolution upto large strains ( 100%) for a wide range of strain-rates (10- 3 - 102
sec- 1) and temperatures (77 - 298 K). The important differences in the behavior of f.c.c. andb.c.c. materials with regards to strain hardening and strain-rate and temperature historyeffects are also shown to be captured by the constitutive model.
In order to evaluate the applicability of the crystal plasticity model to actual deformationprocessing operations, the phenomenon of formation of earing defects in cup-drawing hasbeen studied. Cup-drawing experiments were carried out on aluminum 2008-T4 sheets.The predictions from the model for the load-displacement response, the number of ears,their locations, and heights are shown to be in very good quantitative agreement with theexperiments.
The recent progress in the formulation of a mathematical theory of polycrystallineplasticity has occurred primarily for materials with cubic structure. Much less work ofthis type has been carried out for materials with hexagonal-close-packed (h.c.p.) crystalstructure, e.g., titanium. A large deformation, crystal-plasticity based constitutive modelfor high-temperature deformation of titanium has been developed. The constitutivemodel and the computational procedures have been implemented in a finite-element

scheme. Nominally homogeneous experiments have been conducted on commercially-puretitanium at 750C, and the resulting macroscopic stress-strain response and evolution incrystallographic texture have been measured. Full 3D finite element simulations of thesedeformation modes have also been carried out. The predictions are in very good agreementwith the corresponding experimental measurements.
Thesis Supervisor: Lallit AnandTitle: Professor

Acknowledgments
The past five years at MIT have been very stimulating and enriching. I would like to
express my sincere acknowledgements to everyone whose input has proved invaluable in my
endeavor. I begin by thanking my thesis advisor and mentor, Prof. Lallit Anand, without
whose guidance and encouragement this work would not have been possible. Discussions
with him have always been educative. I am very grateful to him for helping me hone my
analytical skills. He has instilled in me the motivation and confidence necessary to pursue
a career in research and I am very thankful to him for the same. I express my sincere
thanks to Prof. Ali Argon, Prof. David Parks and Prof. Jung-Hoon Chun for serving on
my thesis committee. Their thoughtful and insightful suggestions have been very helpful
in my research. I would also like to thank Prof. David Hardt for kindly allowing me to
perform the deep-drawing experiments at the Laboratory for Manufacturing Productivity
and Dr. Barlat at ALCOA Technical Center who kindly provided us the aluminum sheets.
Research support for this work was provided by U. S. National Science Foundation under
Grant Numbers 9215246-DDM and CMS-9610130.
I am grateful to my colleagues in the Mechanics and Materials Lab, Manish Kothari,
Clarence Chui, Brian Gally, Suryaprakash Ganti, Chunguang Gu, Chuang-Chia Lin,
Hong Dai, Prakash Thamburaja, Michael Kim, Brian Gearing, Ronald Rezac, Alexander
Staroselsky, Oscar Yeh for their fruitful discussions and help, technical and otherwise. They
were instrumental in making the five years very enjoyable. I would like to thank my close
friend and colleague, Manish Kothari, for his important contributions in my work. I owe
him a debt of gratitude for being patient in teaching me valuable experimental skills. I
thank Ray Hardin for his help and patience. I acknowledge Peter Morley at the Laboratory
for Nuclear Science Machine Shop, for his kind help in designing experimental setups and
machining test specimens.
My special thanks go to my parents, brother, sister-in-law and sister whose affection
and constant encouragement has given me tremendous impetus in my academic pursuits.

Contents
1 Introduction
2 Plasticity of Polycrystalline F.C.C. and B.C.C. materials
2.1 Single Crystal Constitutive Model .......................
2.1.1 Constitutive Equation For Stress ....................
2.1.2 Flow Rule . ..................... . . . . . . . . .
2.1.3 Evolution Equations For Slip System Resistances ...........
2.2 Polycrystal Constitutive Model .........................
2.3 Computational Procedures ............................
2.4 Evaluation of the Constitutive Model ......................
2.4.1 Estimation of Material Parameters for Aluminum. ..........
2.4.2 Material Parameters for Tantalum ...................
2.4.3 Predictions of the Constitutive Model .................
3 Application to Deformation Processing of F.C.C. materials
3.1 Earing in Single Crystal Cups of Aluminum ..................
3.1.1
3.1.2
3.2 Earing
3.2.1
3.2.2
3.2.3
Material Parameters for Single-Crystal sheets of Aluminum . .
Cup-drawing simulation for the [001] and [111] oriented blanks
in Polycrystal Cups of A12008-T4 .................
Characterization of A12008-T4 Sheet ...............
Cup-Drawing Experiment .....................
Simulation of Cup-Drawing ....................
. . 73
. 74
.. 75
.. 75
. . 76
. 77
4 Plasticity of Polycrystalline H.C.P materials
4.1 Single Crystal Constitutive Model ....................
93
96
5
7
13
13
15
15
19
22
23
25
25
29
32
72
72

4.2 Study of Single Crystal Response ........................ 99
4.3 Polycrystalline Plasticity of h.c.p. Titanium ............... . 101
4.3.1 Simple Tension and Simple Compression of CP-Titanium at 7500C . 101
4.3.2 Plane-Strain Compression of CP-Titanium at 7500C ......... 110
4.3.3 Tubular Torsion of CP-Titanium at 750°C .......... . 112
5 Conclusions 171
5.1 Suggestions for Future Work .......................... 172
A Time Integration Procedures 174
A.1 Implicit Finite Element Procedure .. .............. .. 174
A.2 Explicit Finite Element Procedure ....................... 177
B Analytical Jacobian for ABAQUS/Standard 179
B.1 Calculation of Relevant Quantities ....................... 181
B.2 Algorithm for computation of the Jacobian ................. 185
C Procedures for Measuring Pole Figures 187
D Single Crystal Studies on Titanium 189
D.1 Simple Tension .................................. 190
D.2 Simple Compression . . . . . . . . . . . . . . . . . . . . . . . . ..... 191
D.3 Conclusions .................................... 191
E Effect of Latent Hardening on the Polycrystalline Response of h.c.p.
Titanium 199
6

Chapter 1
Introduction
The major factors that influence the degree of deformation that can be achieved in any
deformation processing operation without failure are: (i) the external process variables
such as stress, temperature, strain, strain rate, frictional and heat-transfer boundary
conditions and their evolution and (ii) the internal microstructural features such as
porosity, crystallographic texture, deformation localization and their evolution. In order to
optimize a particular deformation processing scheme (Process Design) and/or to improve
the performance of a structural component (Product Design), a complete understanding of
the individual effects of these factors and their interactions is desired. This investigation is
aimed at developing accurate anisotropic thermo-elastic-viscoplastic constitutive equations
and computational procedures for the modeling and simulation of inelastic deformations
in some industrially important face-centered-cubic (f.c.c.) and hexagonal-close-packed
(h.c.p.) metals and alloys. The computational capability will be useful in simulating
the development of anisotropy due to the evolution of crystallographic texture and the
development of some material processing defects such as earing in cup-drawing associated
with the evolution in texture during deformation processing.
The major cause of anisotropic plastic response in polycrystalline metals is
crystallographic texturing resulting from the reorientation of the crystal lattices of grains
during deformation. There has been considerable recent progress in the continuum modeling
of texture effects on the plastic deformation of polycrystalline materials (e.g., Gil Sevillano
et al. [1980]; Wenk [1985]; Asaro and co-workers [1983a, 1983b, 1988, 1989], Anand and
co-workers [1992, 1994], Dawson and co-workers [1989, 1990, 1994]; and various proceedings
7

of ICOTOM [1991]). The theory is able to predict the macroscopic anisotropic stress-
strain response, shape changes and the evolution of crystallographic texture in complex
deformation modes.
Most of the previous work on crystal plasticity is based on a simple power-law description
for the shearing rates 4a on the slip systems:
1Ta l/r
y - [ a| sign(ra) (1.1)
In the equation above, Tr is the resolved shear stress on the slip system, and s (> 0) is
the slip system deformation resistance. The parameter -oo is a reference rate of shearing,
and the parameter m characterizes the material rate sensitivity. The rate-independent
limit is m - 0. The slip system shear rate is uniquely specified by this equation, and is
nonvanishing as long as the resolved shear stress r"' on that system is not identically zero.
Although this simple power-law description is a useful simplification of the viscoplastic
response of crystals in a narrow range of strain-rates and temperatures, it is not able to
capture the real strain-rate and temperature sensitivity of flow of crystalline materials under
dynamic loading conditions and/or low homologous temperatures. Deformation processing
operations are typified by wide range of strain-rates (10 - 3 - 103sec - 1) and temperatures
(0.2 8m - 0.6 Om). Hence, there is a need for an improved kinetic equation for plastic flow,
and this issue is addressed in this work.
The recent progress in the formulation of a mathematical theory of polycrystalline
plasticity has occurred primarily for materials with cubic structure. Much less work
of this type has been accomplished for materials with hexagonal-close-packed crystal
structure. Titanium is a h.c.p. metal which serves as an excellent candidate for applications
demanding high strength and light-weight. The development of constitutive models and
computational procedures for simulating the deformation processing of titanium is of
substantial technological importance.
The hexagonal materials, owing to their lower symmetry in comparison with the f.c.c.
materials, exhibit more complex modes of deformation. Inelastic deformation by slip in
hexagonal materials at the single-crystal level is highly anisotropic, i.e., the deformation
resistances of different classes of slip systems can be substantially different. Also, due
to the difficulty in operating certain slip systems at low homologous temperatures the
8

accomodation of arbitrary strains through deformation twinning is quite common in these
materials. As a result of mechanical twinning, the yield loci of textured h.c.p. materials
are usually not centered around the origin in stress space. Plane stress yield loci for sheets
of titanium are given by Lee and Backofen [1966].
This work is focused on the plastic deformation of h.c.p. titanium. Titanium exists
in two allotropic forms: the a-phase which has a h.c.p. structure, and the /3-phase which
has a b.c.c. structure. In pure titanium, the h.c.p. a-phase is stable up to 8830 C, the /3
transus temperature, above which it transforms to the b.c.c. -phase. The most common
slip modes that have been reported in pure h.c.p. titanium are the prismatic slip systems
{1010} < 1120 >, the pyramidal slip systems {1011} < 1120 > and the basal slip systems
(0001) < 1120 > with a marked difference in their slip system deformation resistances (Rosi
et al. [1953]; Churchman [1954]).
Two important factors that influence the nature of plastic deformation in titanium are
the temperature and the impurity content. Conrad [1981] observed a dramatic decrease
in the critical resolved shear stress with temperature for basal and prismatic slip in single
crystals of h.c.p. titanium. Also, the ratio of the critical resolved shear stress for these two
families of slip systems changes significantly with temperature. The studies of slip traces
by Rosi, Dube and Alexander [1953] showed no evidence of basal slip at room temperature
owing to the large critical resolved shear stress associated with the basal slip system at
this temperature. At higher temperatures, the critical resolved shear stress for both types
of slip become less disparate, which then allows for the possibility of slip on either of the
planes. Rosi, Perkins and Seigle [1956] observed that the propensity for pyramidal slip
along < 1120 > directions also increased with increase in temperature.
The studies by Churchman [1954] and Conrad [1981] indicate that the nature of plastic
deformation in titanium is significantly affected by the presence of impurities like nitrogen,
oxygen, carbon and hydrogen. These authors noticed that an increase in impurity content
affected not only the critical resolved shear stresses on the slip systems but also their relative
values.
The < a >-slip on the basal, prismatic and pyramidal slip systems does not provide for
a mechanism for strain parallel to the c-axis of the crystals. Other slip or twin systems are
required to supply this missing degree of kinematic freedom. These additional mechanisms,
whether pyramidal slip on systems with < c + a > slip-directions or twinning, have a
9

strong influence on the overall inelastic behavior of the polycrystal. At low temperatures,
due to the inability in activating < c + a >-slip, most of the deformation is accomodated
through twinning. The two common twinning modes for titanium that have been observed
at room temperature are the six equivalent "tensile" systems {1012} < i011 >, and
the six equivalent "compressive" systems {1122 < 1123 >; the first set of twinning
systems produces an extension parallel to the c-axis, and the second a shortening. Paton
and Backofen [1970] have reported that other twin systems are operational at elevated
temperatures (> 4000C), namely, the tensile systems {1121 < 1126 > and {1123 <
1122 > and the compressive systems {1124} < 2243 > and {1011} < 1012 >. However,
the tendency for titanium crystals to twin decreases with increase in temperature. At high
temperatures, slip along < 1123 > directions (< c + a >-slip) on pyramidal planes of the
{10il} and {1122} families has been observed to provide straining along the c-axis (Paton
and Backofen [1970]; Williams and Blackburn [1968]). Above 700°C, the mechanism of
plastic deformation seems to be predominantly crystallographic slip. This can be attributed
to the ease of operation of < a >-slip on all the three slip-planes at these temperatures,
plus < c + a >-slip on the pyramidal systems.
Crystal mechanics based treatments of plasticity of titanium are incomplete
and scattered. There does not exist a coherent set of data - stress-strain
curvesl , microstructure, and crystallographic texture evolution under controlled simple
tension/compression, plane strain compression and torsion. Further, the constitutive
modeling of the deformation of polycrystalline titanium taking into account the variety of
deformation modes is still an active field of research. The deformation resistances of different
classes of slip systems can be substantially different. In this context, a Taylor approximation
in which each grain is assumed to undergo the same deformation as the polycrystalline
aggregate would yield incorrect macroscopic stress-strain response. Hutchinson [1977]
proposed a self-consistent scheme2 that allows for variations in deformation from grain
to grain depending on the orientations. Accordingly, grains whose c-axes are aligned along
'Doner and Conrad [1973] provide stress-strain curves of CP-Titanium in the high-temperature regime(0.31 to 0.59 Om) while dynamic stress-strain curves of CP-Titanium at low temperatures are provided byEleiche [1980]. However, the measurements of texture in conjunction with the stress-strain response arelacking.
2Self-consistent theory (Hill [1965]) assumes that each grain is a spherical inclusion embedded in aninfinite matrix whose properties are those desired of the polycrystal. The overall stress and strain-rate aredetermined by self-consistent averaging over all grain orientations.
10

the loading direction are "hard" inclusions that do not deform while the grains in "softer"
orientations undergo deformation. Hutchinson has applied this model to provide estimates
for the overall uniaxial yield stress of a polycrystalline aggregate for different ratios of
critical resolved shear stress of the basal and prismatic slip systems. Hutchinson's analysis
is limited to small strains and does not deal with the aspects of texture development with
large straining of hexagonal crystals. Parks and Ahzi [1990] have proposed a Taylor-
type rigid-viscoplastic "constrained-hybrid" model which not only accounts for the local
kinematic constraints in hexagonal crystals lackiLg five independent slip systems but also
provides a method to calculate the "kinematically indeterminate" part of the deviatoric
stress tensor. The model has been used to accurately predict the deformation textures
as well as macroscopic stress-strain response in polymers with orthorhombic structure
e.g., High-density Polyethylene. Shoenfeld et al. [1995] have extended the same model
to account for elasticity. Recently, Prantil, Jenkins and Dawson [1995] have formulated a
model for simulating the large deformation behavior of polycrystalline titanium under slip-
dominated conditions. However, the predictions of their analyses have not been compared
with experimental results.
With this as background, the following tasks have been accomplished in this work:
1. A physically-motivated constitutive function based on the thermally-activated theory of
plastic flow in f.c.c. and b.c.c. materials together with the slip system hardening equations
are presented in Chapter 2. These constitutive equations have been incorporated in a
large deformation Taylor-type crystal plasticity model. The constitutive model has been
implemented in a "static,implicit" finite element program (ABAQUS/Standard) as well as
in a "dynamic,explicit" finite element program (ABAQUS/Explicit).
2. In Chapter 2, the ability of the constitutive model to reproduce the macroscopic stress-
strain response and the crystallographic texture evolution in f.c.c. aluminum for strains up
to 100%, at strain rates from 10- 3 to 103 sec-1 and at temperatures from 77K to 298K are
evaluated. The capability of the model to describe important differences in the behavior of
f.c.c. and b.c.c. materials with regards to strain-hardening and strain-rate and temperature
history effects has also been investigated.
3. In Chapter 3, the constitutive equations and computational procedures are used to
simulate the formation of earing defects during cup-drawing of face-centered cubic materials.
The results of the numerical simulations have been compared with existing experimental
11

results on earing in single crystalline sheets of aluminum. In order to be useful in improving
designs of the cup-drawing process, a quantitative prediction of the location and the heights
of the ears is desired. To achieve this end, quasi-static cup-drawing experiments have been
conducted on sheets of A12008-T4 with an initial anisotropic texture. Numerical simulations
of the deep-drawing process have also been performed, and the predictions of the earing
profile and loads are compared with the same from the experiments.
4. In Chapter 4, results from simple tension, simple compression, plane-strain compression
and torsion experiments conducted on commerically-pure polycrystalline titanium in
the vicinity of 750°C are described. A large-deformation constitutive model for high
temperature deformation of single-crystal titanium is presented. The predictions of the
stress-strain response and lattice reorientation in simple tension of a titanium single crystal
are compared with existing experimental results. Full 3D finite-element calculations, where
each element represents a grain and the constitutive response is given through a single-
crystal constitutive model, have been performed. The slip systems operative during high-
temperature deformation of polycrystalline CP-Titanium are identified. The ability of the
constitutive model to predict the texture evolution and macroscopic stress-strain response
up to large strains for the different deformation modes are evaulated.
The conclusions and suggestions for future work are presented in Chapter 5.
12

Chapter 2
Plasticity of Polycrystalline F.C.C.
and B.C.C. materials
In this chapter, a finite-deformation, rate- and temperature-dependent constitutive model
for plasticity of single crystals of face-centered-cubic (f.c.c.) and body-centered-cubic
(b.c.c.) materials is first described. For the shearing rates on slip systems, a physically-
motivated constitutive function based on the thermally-activated theory for plastic flow
is employed. For polycrystalline materials, the classical Taylor assumption is invoked.
The implementation of the constitutive model in a finite-element program is briefly
discussed. A procedure for estimating the material parameters in the model is described,
and the predictions of the stress-strain response and texture evolution are compared with
corresponding experimental results. Face-centered-cubic aluminum and body-centered-
cubic tantalum are taken as representative model materials. Important differences in the
behavior of the two model materials with regards to strain-hardening and strain-rate and
temperature history effects are highlighted and the capability of the constitutive model to
describe the distinguishing behaviors is demonstrated.
2.1 Single Crystal Constitutive Model
The foundations for the constitutive model for single crystal elasto-plasticity considered
here may be traced to the papers by Teodosiu [1970], Rice [1971], Hill and Rice [1972],
Mandel [1974], Teodosiu and Sidoroff [1976], Asaro and Rice [1977] and Asaro [1983a, 1983b]
from a continuum mechanics viewpoint, and Conrad [1964], Kocks et al. [1975], Frost and
13

Ashby [1982] and Argon [1995] from a materials science viewpoint.
The deformation of a crystal is taken as the sum of contributions from two independent
atomic mechanisms: (i) an overall "elastic" distortion of the lattice, and (ii) a "plastic"
deformation that does not disturb the lattice geometry. In a large range of low (< 0.3)
homologous temperatures and at sufficiently high stress levels, the major mechanism
of plastic deformation in ductile single crystals is dislocation glide on well-defined
crystallographic slip systems in the crystal. Attention is confined to this type of plastic
deformation.
The governing variables in the constitutive model are: (i) The Cauchy stress, T. (ii)
The deformation gradient, F. (iii) The absolute temperature . (iv) Crystal slip systems,
labeled by integers a. Each slip system is specified by a unit normal no to the slip plane,
and a unit vector m o denoting the slip direction. The slip systems (a, n1o) are assumed
to be known in the reference configuration. (iv) A plastic deformation gradient, FP, with
detF p = 1. (v) The slip system deformation resistance s a > 0, with units of stress.
An elastic deformation gradient is defined by
F e FF p- 1, detFe > 0. (2.1)
This equation may be rearranged as F = F e FP. The plastic part FP in this multiplicative
decomposition of F represents the cumulative effect of dislocation motion on the active slip
systems in the crystal, and the elastic part Fe describes the elastic distortion of the lattice.
Next, with S = (det F)TF - T denoting the first Piola-Kirchoff stress, the stress power
per unit reference volume is dj = S F, which, since det Fp = 1, is also equal to the stress
power per unit volume of the isoclinic relaxed configuration determined by F p. This stress
power may be additively decomposed as cD = e + Cip, where woe = T* Ee is the elastic
stress power per unit volume of the relaxed configuration, with
Ee -(1/2) {FeTFe - 1 and T* (detFe) Fe-lTF e - T (2.2)
the Green elastic strain measure and the symmetric second Piola-Kirchoff stress tensor
relative to the relaxed configuration, respectively, and
:P - (C T*) (P FP-1), e = FeTFe, (2.3)
14

is the plastic stress power per unit volume of the relaxed configuration.
2.1.1 Constitutive Equation For Stress
Elastic stretches in metallic single crystals are generally small. Temperature changes need
not be small, but for simplicity attention here is restricted to small temperature changes
about a reference temperature 00. Accordingly, the constitutive equation for the stress in a
metallic single crystal is taken as the linear relation
T* = C [Ee - A ( - 80)], (2.4)
where C is a fourth-order anisotropic elasticity tensor, and A is a second-order anisotropic
thermal expansion tensor. Also, Ee and T* are the strain and stress measures defined in
equation (2.2).
2.1.2 Flow Rule
The evolution of the plastic deformation gradient is given by
tPF -1 = E -,a Sa, SO _ m ® n, (2.5)
where SI is the Schmid tensor, and
4a = pbi b a (2.6)
is the plastic shearing rate on the a-th slip system. The expression a = Pm b i is due to
Orowan [1940], and it represents the physical picture that the strain rate A1 is produced by
a density Pm of mobile dislocations with Burgers vector magnitude b (in the slip direction
mo), moving with an average velocity v through a field of obstacles.
Using (2.5) and (2.3), the resolved shear stress ar' for the slip system a is defined through
the relation iP = A-ft Tr7a, which yields
(CeT*) SI. (2.7)
With the resolved shear stress so defined, the average dislocation velocity on the slip system
15

a is taken to be governed by a constitutive function,
e° = v (, , >), (2.8)
where
sa -s- a(, microstructural state) > 0
is a temperature dependent critical slip resistance (units of stress) for the slip system a.
The average dislocation velocity Va at applied shear stress ra and a temperature 0 depends
on the waiting time of mobile dislocations at obstacles, and sa reflects the strength, density
and arrangement of these obstacles.
The constitutive equation for the average dislocation velocity is formulated as follows.
At a temperature of absolute zero let ha(O) denote the critical slip resistance; then the sign
of 0I is the same as that of the resolved shear stress ra , and its magnitude is idealized as
= if 7ra < (O), (2.9)> 0 (and large) if Ira[ = 9a(O),
with stress levels Ira1 > sa(O) unattainable. The slip resistance 9a(O) at absolute zero is
called the mechanical threshold (Kocks et al. [1975]; Argon [1995]). Because of the usual
variability of the microstructural state of real materials the transition from no dislocation
velocity to a high velocity will not be as sharp as idealized in equation (2.9), but it should
still exhibit a "threshold" behavior. At a temperature > 0 this response is modified in
two important ways. First, since the underlying mechanism which governs the magnitude
of sa is an elastic interaction on the atomic scale of a mobile dislocation segment with the
microstructural state, an increase in temperature results in a decrease in the magnitude of
sa , primarily due to the attendant decrease in the elastic moduli, that is Pa(O) < Ja(0).
Second, and more importantly, with increasing temperature the local energy barriers to
dislocation motion due to short-range obstacles (less than :10 atomic diameters) can
be overcome at a lower applied shear stress with the help of thermal fluctuations, and
a finite dislocation velocity should be observable below the slip resistance so. Accordingly,
it is useful to distinguish between barriers that can be overcome with the aid of thermal
fluctuations, and those that cannot - thermal and athermal, respectively; and to assume
16

that the slip resistance sa is decomposable as
sa microstructural state) + s('(, microstructural state), (2.10)
where sa represents the part of the resistance due to thermally-activatable obstacles to slip,
and sa the part of the resistance due to the athermal obstacles to slip. Typical examples
of athermal barriers are dislocation groups and large incoherent precipitates, whereas the
Peierls resistance, solute atoms, and forest dislocations typify thermally-activatable barriers.
In pure f.c.c. and h.c.p. materials the dislocations glide easily without any appreciable
Peierls resistance, and s is governed by interactions with localized forest dislocations. In
pure b.c.c. crystals, s is controlled by the interactions with the Peierls resistance, which
increases rapidly with decreasing temperature.
Let
-7.a = ir_ - Sa (2.11)
denote an effective stress, then equation (2.8) is modified as
Va = (, , so) (2.12)
At temperatures 0 > 0 the motion of the mobile dislocation segments is thermally activated.
Using the framework of transition-state theory (e.g. Krausz and Eyring [1975]), with
AGa denoting the difference in the free enthalpy between the saddle point and the ground
point for a shear increment, the quantity [exp is the probability that a thermal
fluctuation of the required energy (or larger) for a shear increment can be supplied at a
temperature 0 > 0. AGa is called the activation free enthalpy or the Gibbs' free energy for
activation, and kB is the Boltzmann's constant. The rate at which dislocations overcome
the obstacles is given by v [exp { k -IJ], where v is a characteristic frequency factor of
the order of 1012 sec- (10-2 - 10-1 times the Debye frequency of atoms). Then, with la
denoting the mean distance of advance of a mobile dislocation segment, the magnitude of
the average dislocation velocity may be written as
0 if °a <0 O,[0a[ = (2.13)av exp { ac~?O'?'s')} if 0 < < C,v exp ~ kB 8
17
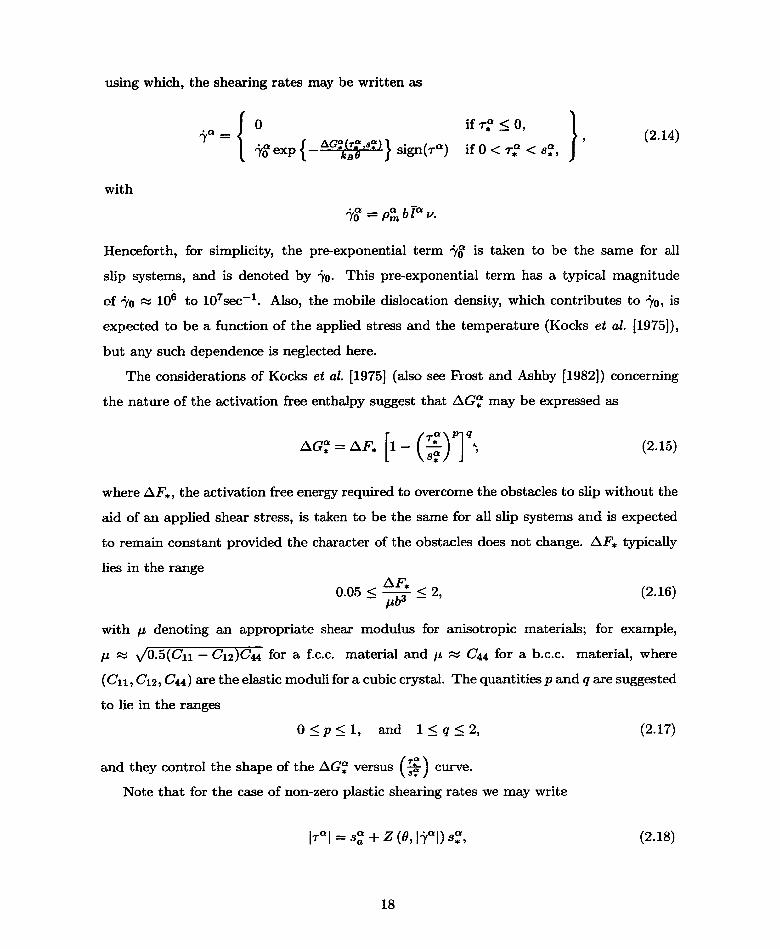
using which, the shearing rates may be written as
{ exp{ a( ) sign(ra) if o <, , (2.14)
with
ria = Pm b 1,.
Henceforth, for simplicity, the pre-exponential term -'% is taken to be the same for all
slip systems, and is denoted by o. This pre-exponential term has a typical magnitude
of to 106 to 107 sec-1. Also, the mobile dislocation density, which contributes to %yo, is
expected to be a function of the applied stress and the temperature (Kocks et al. [1975]),
but any such dependence is neglected here.
The considerations of Kocks et al. [1975] (also see Frost and Ashby [1982]) concerning
the nature of the activation free enthalpy suggest that AGa may be expressed as
AG *[ = AF* [ (2.15)
where AF*, the activation free energy required to overcome the obstacles to slip without the
aid of an applied shear stress, is taken to be the same for all slip systems and is expected
to remain constant provided the character of the obstacles does not change. AF* typically
lies in the rangeAF,0.05 < F < 2, (2.16)
with ;t denoting an appropriate shear modulus for anisotropic materials; for example,
p O 0.5(C1 - C12)C44 for a f.c.c. material and jI P: C44 for a b.c.c. material, where
(Cll, C12, C44) are the elastic moduli for a cubic crystal. The quantities p and q are suggested
to lie in the ranges
O<p<l 1, and 1<q<2, (2.17)
and they control the shape of the AG versus (-- ) curve.
Note that for the case of non-zero plastic shearing rates we may write
7IrI = S + Z (, I'al) S, (2.18)
18

where
Z = [1- < 1, with c = { In ( ) (2.19)
These equations show the temperature and strain rate sensitivity of resolved shear stress at
a fixed value of the deformation resistance sa = sa + sa, Fig. 2-1. At = 0 the parameter
Z = 1, and at = 0c, Z = 0. That is, at temperatures above 0c there is enough thermal
energy for the barriers to be overcome by thermal activation alone, without the aid of a
stress. At a given strain rate jA, the temperature Oc sets the limit of applicability of the
thermal-activation model for the plastic flow of metals at low homologous temperatures.
2.1.3 Evolution Equations For Slip System Resistances
The slip system resistance parameters sa are taken to evolve according to
a= Z hap It$|
where j'y is the shearing rate on slip system f,, and the matrix had describes the rate of
increase of the deformation resistance on slip system a due to shearing on slip system i3;
it describes both self-hardening and latent hardening of the slip systems. The use of the
absolute value of -y3 in the hardening equation reflects the assumption that the hardening
behavior is not significantly affected by the direction of shearing on a slip system. Each
element ha depends on the deformation history.
Since s has been decomposed as
s= s (9, microstructural state) + s (, microstructural state),
it is important to distinguish whether the source of macroscopic strain hardening is due to
the change of sa or sa, or both.
For pure f.c.c. materials, since the magnitudes of both sa and sa are controlled by the
interactions of glide dislocations with forest dislocations (Argon and East [1979]), both sa
and sa evolve with strain and contribute to the macroscopic strain hardening. Cottrell
and Stokes [1955] performed temperature-jump tension tests on aluminum single crystals
oriented for single slip. Fig. 2-2 is a schematic representation of their measured stress-strain
19

curves. In Cottrell and Stokes' experiments, let al and 2, respectively, denote the flow
stresses immediately before and after the temperature-jump from 0l to 02. Let e be the
tensile strain at which the temperature-jump is performed. They report that the ratio of the
flow stresses obtained by changing the temperature from 81 to 02 (< 01) was essentially
independent of the level of strain at which the ratio was measured. That is, with a1 and
denoting the stress ratios measured in temperature jump experiments at strains e and e',
respectively,0- : -2 (2.20)
a1 01
Let the resolved shear stress on the primary slip system corresponding to the flow stress
levels of al, a2, al and a be r1, T2, Tr and r- respectively. Since the Schmid factor pertaining
to this slip system is the same immediately before and after the temperature-jump, equation
(2.20) can be rewritten as
-- ~ -. (2.21)
Substituting for the expression for the resolved shear stress (2.18) in equation (2.21), we
obtain,(s ) Z(), 92) 1 + () Z(' ,02) 222
\ ra .S (2.22))Z(-a, 1) 1 A ( , 1)where s and Sa are the thermal and athermal parts of the slip resistance at the tensile
strain e respectively and s and s are the corresponding quantities at the tensile strain E'.
Equation (2.22) implies thatS* S-- -I" (2.23)Sa Sa
Since e and e' were arbitrary, the ratio is essentially independent of the strain. This ratio
is denoted by the parameter X, and for simplicity, X is assumed to be the same for all the
slip systems:se
X = (2.24)
Cottrell and Stokes' experimental observations suggest that X lies in the range
0.5 < X < 1
for aluminum single crystals.
20

Using the relation (2.24) the evolution equation for s a for f.c.c. crystals may be written
as
= a + 8a a I{1 + X} = E ha# 9~. | (2.25)
In contrast with the behavior of f.c.c. materials, for pure b.c.c. materials, since s,* is
controlled by the interactions with the Peierls lattice resistance, it is reasonable to assume
that it is a constant:
s* constant. (2.26)
Hence,
hsa-a=E ha 1|a1. (2.27)
Several simple phenomenological forms for the hardening matrix have been proposed
in the past; these have been reviewed by Peirce et al. [1982], and more recently by
Havner [1992], and Bassani [1993]. In their numerical calculations Peirce et al. [1982] (also
see Asaro and Needleman [1985]) used the following simple form for the hardening moduli:
hab = [ql + (1 - q)6a ] h, (2.28)
with h denoting the self-hardening rate and the parameter q representing a latent-
hardening parameter. The latent hardening parameter q is not necessarily a constant,
and may of course be history-dependent just as the self-hardening parameter hP is. This
simple form for h ad yields an acceptable description of the physical phenomena of latent
hardening, and this form is adopted here without modification.
The eventual goal in this study is to formulate constitutive equations for polycrystalline
ductile metals undergoing complex deformations encountered in metal-forming operations.
Thus the typical fine-scale description of hardening (Stage I, Stage II, etc.) during single
slip of single crystals is not considered here; instead, following Kalidindi et al. [1992], the
following specific form is adopted for the f:c.c. single-crystals:
h = o 1- - |sign 1- , (2.29)
where
h I(1-'I , ) (2.30)
21
is the initial hardening rate, and
S = AP (li I,1) (2.31)
is a saturation value of sO. Both hg and s are in general expected to be strain rate- and
temperature-dependent.
For the b.c.c. single-crystals, a hardening form similar to (2.29) is adopted for the
change in :
h# = h 1 -- A sign - s (2.32)Sa,8
where
hw = h (11 ' ) (2.33)
is the initial hardening rate, and
SS =, s ( I ,) (2.34)
is a saturation value of sO.
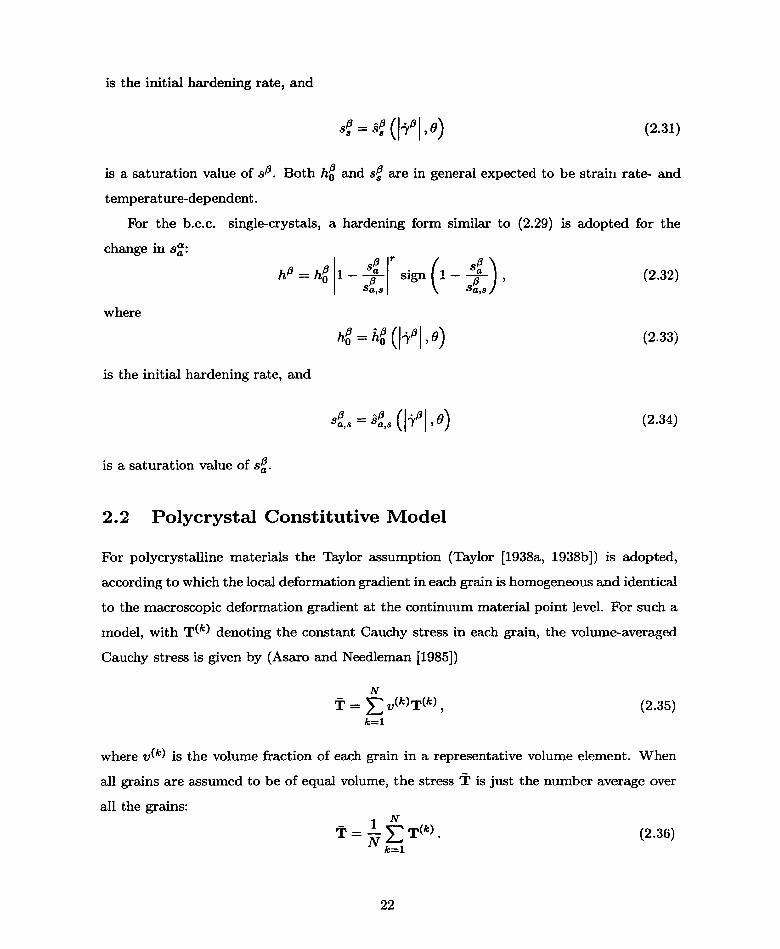
2.2 Polycrystal Constitutive Model
For polycrystalline materials the Taylor assumption (Taylor [1938a, 1938b]) is adopted,
according to which the local deformation gradient in each grain is homogeneous and identical
to the macroscopic deformation gradient at the continuum material point level. For such a
model, with T(k) denoting the constant Cauchy stress in each grain, the volume-averaged
Cauchy stress is given by (Asaro and Needleman [1985])
N
- = E v(k)T(k) , (2.35)k=1
where v(k) is the volume fraction of each grain in a representative volume element. When
all grains are assumed to be of equal volume, the stress T is just the number average over
all the grains:1 N
T = N T(k). (2.36)k=l
22

The accuracy of such an approximate Taylor-type polycrystal constitutive model (with a
simple power-law type of flow rule) has been previously evaluated by Bronkhorst et al. [1992].
Their experiments and calculations showed that the Taylor-type model is in reasonable
agreement with experiments with regards to the texture evolution and the macroscopic
stress-strain response for single-phase f.c.c. materials. Recently, Kothari and Anand [1997]
have shown that the Taylor-type polycrystal model is also reasonably accurate for b.c.c.
tantalum which possesses numerous slip systems.
2.3 Computational Procedures
The constitutive model has been implemented in a finite element program ABAQUS [1994],
which contains capabilities for both "static, implicit," and "dynamic, explicit" solution
procedures. In a finite-element implementation, (i) the time-independent slip systems
(m , ncl) are known; (ii) the list of variables {F(t), FP(t), s'(t), T(t)} and an estimate of
F(t+At) are given. The computational task is the stable, accurate and efficient computation
of {FP(t + At), s(t + At), T(t + At)}.
A brief summary of the constitutive time-integration procedures for use in
ABAQUS/Standard and ABAQUS/Explicit is given in Appendix A. For the implementation
in ABAQUS/Standard a stable implicit time-integration procedure is used for the
constitutive equations. However, for the implementation in ABAQUS/Explicit, a simple
Euler-foward scheme is used to solve for the list of constitutive variables at time t+ At. Note
that a central-difference integration rule is used in the "dynamic, explicit" procedure to solve
for velocities and accelerations from the momentum balance equations. This integration
procedure is only conditionally stable, and the stable time increment is given by
Atcr = min ( c)
where Le is the characteristic element length, and cd is the dilatational elastic wave speed 1
in the material. For the Euler-forward scheme used in the constitutive time-integration
procedure to be stable, the strain increment is bounded from above as given by the following
1For a cubic material Cd = /'9+p2C4 4 where C 12, C44 are the elastic moduli and p is the density.
23

inequality (Lush [1990]),
eAt < 3mev, (2.37)
where m is the rate-sensitivity 2 parameter, e is the yield strain and @ is a small fraction
0.5.
With AE = At and At = ., Equation (2.37) yields
Cde < /me yCd (2.38)
For instance, with 1 0.5, m = 0.02, ey = 0.001, d = 5000m sec- 1 and Le = 10- 4m,
we have < 500 sec- 1. For situations where > 500 sec- 1, an unconditionally stable
Euler-backward scheme (e.g., Kalidindi et al. [1992]), which allows for large time steps, is
used.
For ABAQUS/Standard, the implicit finite-element procedure requires the computation
of a Jacobian matrix to be used in a Newton-Raphson type iterative method for revising the
estimated displacement field. A detailed computation of the analytical Jacobian matrix3 for
the constitutive model and the attendant fully-implicit Euler-backward method is presented
in Appendix B.
The sheet-metal forming application that is considered in the next chapter is essentially
quasi-static. Although a static, implicit finite element procedure is preferable for modeling
such processes, it has been found that the dynamic explicit procedure in which the solution
of individual time increments is inexpensive, is computationally more efficient for large
three-dimensional problems which are dominated by contact (Nagtegaal and Taylor [1968]).
The computational procedures are at present limited to the isothermal case for
ABAQUS/Implicit, and to the isothermal or completely adiabatic case for
ABAQUS/Explicit. For the adiabatic case, the temperature rise is calculated using
N (k)pc6 = E E Pay (2.39)
k= (2.39)
2 The rate-sensitivity parameter for the kinetic equation of the plastic flow used in the crystal plasticitymodel is given by m -.
3In contrast with the numerical Jacobian employed by Kalidindi et al. [1992], the Jacobian used in thiswork is analytical. A comparative study has shown that the analytical Jacobian provides a faster rate ofconvergence to the solution, resulting in substantial reduction in computational times. A preliminary versionof the analytical Jacobian was first suggested by Dr. Simona Socrate, MIT.
24
Here, the first sum is over all slip systems in a grain, and the second sum is over all grains
in a polycrystalline aggregate comprising a material point. Also, p = (9) denotes the mass
density, c = (0) the specific heat, and 0.85 < C < 1 denotes the fraction of plastic work
converted to heat.
2.4 Evaluation of the Constitutive Model
In this section a procedure for estimating the material parameters in the model is given.
The experimental results of Carreker and Hibbard [1957] on 99.987% pure polycrystalline
aluminum, and those of Senseny, Duffy and Hawley [1978] on aluminum alloy 1100-0 are
used for this purpose. The predictions of the model of the macroscopic stress-strain response
and the crystallographic texture evolution are compared with our own experiments on
commercially-pure 1100 at two different temperatures.
Recently, Kothari and Anand [1997] have demonstrated the applicability of the model
for large-strain deformations of b.c.c. tantalum for a wide range of strain rates and
temperatures. The material parameters estimated for tantalum and the results for the
predictions of the crystallographic texture evolution and macroscopic stress-strain response
reported by these authors are also briefly summarized here to contrast the response of a
b.c.c. material with that of a f.c.c. material. The material parameters estimated for f.c.c.
aluminum and those reported by Kothari and Anand [1997] for b.c.c. tantalum are used
to simulate strain-rate jump and temperature jump tests at different levels of strain. The
predictions of the model are compared against existing experimental results to demonstrate
the model's ability to capture strain-rate history and temperature-history effects in both
f.c.c. aluminum and b.c.c. tantalum.
2.4.1 Estimation of Material Parameters for Aluminum
Elastic Moduli
For f.c.c. crystals the anisotropic elasticity tensor C may be specified in terms of three
stiffness parameters, Cll, C12 and C44. The values of the elastic parameters for aluminum
vary significantly in the range of temperatures of interest, Fig. 2-3 (from Simmons and
25

Wang [1971]). This variation is approximated by a polynomial fit:
C1 = (123.323 + 6.7008 x 10-883 -1.1342 x 10-482 - 7.8788 x 10⁻³⁰) GPa,
C12 = (70.6512 + 4.4105 x 10-883 - 7.5498 x 10-502 + 3.9992 x 10⁻³⁰) GPa,
C4 4 = (31.2071 + 7.0477 x 10⁻⁹ 3 - 1.2136 x 10-52 - 8.3274 x 10⁻³⁰) GPa.
Slip Systems
For f.c.c. crystals crystallographic slip is assumed to occur on the twelve
{111} < 110 > slip systems. The components of the slip plane normals and slip directions
with respect to an orthonormal basis associated with the crystal lattice, for these slip
systems are presented in Table 2-1. The Schmid and Boas [1935]) convention of labeling
the slip systems is also shown in this table.
Table 2-1.C [n],
1 111
2 1113 1114 1115 ill6 1117 1118 1119 11110 11111 11112 111
Slip Systems[m]c Label110 A2101 A3011 A6101 D4110o D1
011 D6101 C3011 C5110 C1110 B2101 B4011 B5
Flow Parameters
The flow parameters are determined by calibrating the model against experimental data of
Carreker and Hibbard [1957] on 99.987% pure aluminum and Duffy [1974] on 1100-0 for the
temperature sensitivity of the yield strength. Since the initial material in both these cases
have been reported to be well-annealed, in the calculations the initial texture is assumed to
be isotropic. This was represented by a set of 400 unweighted grain orientations. In order to
26

speed-up the curve-fitting procedure, the data is first fit to an isotropic version of the model,
and the values of the material parameters so determined are then used as initial estimates
for the numerical calculations based on the crystal-plasticity model. In particular, the flow
parameters {AF*,p, q} are taken to be equal to those obtained for the isotropic model, and
the parameter A(o is obtained from the corresponding quantity o in the isotropic model by
setting o = V3 ~o. Initial estimates for the resistance parameters s,,o and sa,O are taken
as the values obtained for the isotropic model, divided by a "Taylor Factor" of M 3.06
that corresponds to a random texture. In order to account for the significant change in the
elastic modulus with temperature, the data for the initial yield have been normalized by
the factor E where Eo is the Young's modulus at absolute zero. Also, for simplicity, s,,0
and Sa,o are assumed to be identical for all the slip systems.
The fit of the model against Carreker and Hibbard's data and Duffy's data are shown
in Figs. 2-4(a) and 2-4(b) respectively. The flow parameters obtained from these fits are:
Table 2-2. Flow Parameters_jyo AF* P q S*,O Sa,O X
Carreker & 1.732 x 10⁶s - 1 3 x 10-19 J 0.141 1.1 8.76MPa 8.76MPa 1Hibbard [1957]Duffy [1974] 1.732 x 10⁶s - 1 3 x 10- 19 J 0.141 1.1 8.82MPa 12.09MPa 0.73
The fit parameters for both cases are identical except for a difference in the initial value
of the athermal resistance which could be attributed to the difference in the alloy content in
the materials. Also, the parameter X is in the range suggested by Cottrell and Stokes [1955]
for both the sets of data.
Hardening Parameters
The hardening parameters are determined by fitting the predictions of the crystal plasticity
model against the stress-strain data of Carreker and Hibbard [1957] and Senseny, Duffy and
Hawley [1978]. The experimental data was obtained by digitizing the curves presented in
the papers by these authors. Carreker and Hibbard's tests (tensile) were all performed at
a constant true strain rate of 6.667 x 10⁻⁴s- 1 and temperatures ranging from 20 K to 300
K. Senseny, Duffy and Hawley provide data for the stress-strain response at two different
27

strain rates, one at a quasi-static rate of 1.155 x 10⁻⁴s- 1 and the other at a high rate of
173.2s-1; and at two different temperatures of 77 K and 298 K.
In order to determine the hardening parameters, a two step procedure is followed.
In the first step, s, is taken to, be a free parameter. Finite-element calculations are
performed in ABAQUS/Explicit for simple tension on a single ABAQUS-C3D8R element
subjected to the appropriate strain rate and initial temperature, and the predicitons are
fit to the experimental results. The integration point in the element is assigned the
400 random unweighted grain orientations and the macroscopic stress is calculated using
Taylor-averaging. For the stress-strain data of Senseny et al. [1978] corresponding to the
strain rate of 173.2sec- 1, we expect appreciable temperature rise in the sample owing to
adiabatic heating. Hence, the stress-strain curve for this case is simulated by computing
the temperature rise according to equation (2.39), by assuming that all the plastic work is
converted into heat (C = 1.0), and using values of p = 2.77Mg/m3, and c = 920 J/kg K for
aluminum. Figs. 2-5(a) and 2-5(b) show the fits of the finite-element calculations to the
experimental data. As indicated earlier, the hardening quantities ({ho (I-YI, 9), s,(lral, 9a)
are in general expected to be strain rate and temperature-dependent. However, for
aluminum in the range of strain rates and temperatures examined, the initial hardening
rate ho was found to be essentially independent of both temperature and strain rate.
However, the saturation value of slip system resistance ss, was found to be dependent
both on temperature and strain rate
In the second step, the strain-rate and temperature sensitivity of ss is fit to the the
following phenomenological form suggested by Kocks [1976]:
S {70 } (2.40)
Here , %yo,, and AF1 are additional material parameters. This form is meant to capture
the observed increase in the saturation stress with increase in the strain rate, and with
decrease in temperature. The results from this fit are shown in Figs. 2-6(a) and 2-6(b). As
shown in Fig. 2-7, the goodness of the fit is preserved up to a temperature of 600 K . The
extrapolated plot captures the variation in the saturation value of the slip resistance with
temperature indicated by the data of Kocks [1976] for 99.99% pure aluminum.
28

The values of the hardening parameters estimated4 by this procedure for the two sets
of data are:
Table 2-3. Hardening Parametersho r i AF. ',o qt
Carreker & 250 MPa 2 210 MPa 0.85 x 10⁻¹⁹J 1 x 10¹² s -1 1.4Hibbard [1957]Senseny, Duffy & 250 MPa 2 200 MPa 1.4 x 10- 19J 1 x 10¹² s -1 1.4Hawley [1978]
Again, the hardening parameters for both sets of data agree closely with each other.
In order to evaluate the accuracy of the constitutive model, numerical simulations are
performed using the final set of material parameters listed in Table 2-2 and Table 2-3 for
each of the experimental data that was used to obtain the parameters. Figs. 2-8(a) and
2-8(b) show the final curve-fits of the model for the stress-strain response for both sets
of data compared against their corresponding experimental results. The fits are in good
agreement with the experiments.
2.4.2 Material Parameters for Tantalum
Elastic Moduli
The values of the elastic parameters for tantalum as a function of temperature are taken as
(Simmons and Wang [1978]):
C1l = (268.2 - 0.0248) GPa,
C12 = (159.6 -0.0118) GPa,
C44 = (87.1 -0.015 ) GPa.
4As for the flow parameters, the hardening parameters are also first estimated for the isotropic model,and the values so determined are used as initial estimates for the corresponding quantities in the anisotropicmodel. Specifically, initial estimates for s are taken to be equal to those obtained in the isotropic modeldivided by a Taylor factor of M 3.06, and the initial estimate for ho is taken to be equal to the valueobtained in the isotropic model divided by M 2 : 9.36.
29

Slip systems
Plastic deformation of b.c.c. tantalum is modeled to occur solely due to crystallographic slip
on the twelve {110} < 111 >, plus the twelve {112} < 111 > slip-systems. The slip-systems
are listed in Table 2-4.
Table 2-4. Slip Systemsc na ma a na mo1 110 111 13 211 1112 011 111 14 112 1113 110 111 15 112 1114 011 111 16 112 I115 011 111 17 121 1116 101 11 18 121 111
7 101- 11 19 121 1118 110 111 20 121 1119 110 111 21 121 11110 101 111 22 211 11111 101 111 23 211 11112 011 111 24 211 111
Flow Parameters
The other necessary material parameters are the quantities {yo, AF*,p,q, s*} in the flow
equations, the quantities {h (I-Y , ), a, as8 (l1I , 0), qt} in the hardening equations, and the
initial value of the athermal slip-system resistance sa,o, which are taken to be identical for
all the slip-systems. Kothari and Anand [1997] have determined these material parameters
and functions by calibrating the model against existing experimental results of Hoge and
Mukherjee [1977] on commercially pure tantalum.
The flow parameters are determined by fitting the experimental data of Hoge and
Mukherjee (1977) for the strain-rate and temperature sensitivity of the yield strength of
a tantalum rod. The initial texture of the tantalum rod was not reported by Hoge and
Mukherjee [1977]. To approximate this initial texture, Kothari and Anand [1997] measured
the texture of their own commercially-procured and annealed tantalum rod, and represented
this texture by a set of 400 weighted grain orientations by using the texture conversion
program popLA (Kallend, et al. [1994]). The experimentally-measured and numerically-
30

represented pole figures are presented in Fig. 2-9. The flow parameters obtained by the
fitting procedure are:
o = 1.73 x 10⁷ sec - 1, AF* = 2.77 x 10- 19J, p = 0.28, q = 1.34, s = 400MPa, (2.41)
with
sa,o = 22MPa.
The quantities s, and s,o are taken to be the same for all slip-systems. The fit of the
model against the experimental data of Hoge and Mukherjee [1977] for the strain-rate and
temperature sensitivity of the yield strength of tantalum is presented in Figs. 2-10 and 2-11,
respectively.
Hardening Parameters
Kothari and Anand [1997] determine the hardening parameters for pure tantalum by fitting
the predictions from the crystal plasticity model against data from the compression split
Hopkinson bar experiments of Vecchio [1994] and Nemat-Nasser, Li and Isaacs [1994]. These
experiments were performed on specimens cored from tantalum discs which were produced
by cross-rolling the initial ingots. Since these authors do not report the initial texture of
these discs, Kothari and Anand [1997] approximated the initial texture by using their own
texture measurements of a similarly-produced tantalum plate, and representing this texture
by a set of 400 weighted grain orientations by using popLA, Fig. 2-12. For the curve-
fitting procedure, both the isothermal5 and adiabatic stress-strain curves of tantalum at
different temperatures and strain rates were calculated by performing Taylor-model simple
compression ABAQUS/Explicit simulations on a single ABAQUS-C3D8R element subjected
to the appropriate strain rate and initial temperature in the experiment. For tantalum, the
hardening quantities {hig(lal, 9), , s(lhal , 9), qI}, are adequately described by taking the
initial hardening rate ho and the saturation value of the athermal slip-system resistance sa,s
to be independent of both temperature and strain rate, and the latent-hardening parameter
5 The technique used by Nemat-Nasser and co-workers to deduce the isothermal stress-strain curves at highrates is to strain the specimen incrementally and unload, allow the specimen to cool to the test temperature,and then re-load at the same initial strain rate. The curve connecting the peaks of these incremental testsprovides an estimate of the isothermal stress-strain curve at a high strain rate. For additional details, seeNemat-Nasser, Li and Isaacs [1994].
31

ql as a constant 6 equal to 1.4. The adiabatic stress-strain curves are simulated by computing
the temperature rise according to equation (2.39), by assuming that all the plastic work is
converted into heat ( = 1.0), and using values of p = 16.6 Mg/m 3, and c = 138 J/kg K. In
the simulations, the flow parameters are the same as those determined above from the data
of Hoge and Mukherjee [1977], equation (2.41). The values of the hardening parameters
estimated by the fitting procedure for the three sets of data are: Kothari and Anand [1997]
Table 2-5. HardeningParameters8 aO o s8 as r qj
Nemat-Nasser and Isaacs [1994] 20 MPa 80 MPa 110 MPa 1.1 1.4Vecchio [1994] 49 MPa 160 MPa 100 MPa 1.1 1.4
attribute the different values of the hardening parameters to the different initial states of
the specimens used in the two sets of experiments by the two sets of authors. The quality
of the fit to the data is shown in Figs. 2-13 and 2-14.
2.4.3 Predictions of the Constitutive Model
Strain Hardening to Large Strains and Evolution of the CrystallographicTexture
The stress-strain data of Carreker and Hibbard and Duffy and co-workers are limited to
strains of EP 0.125. Since the strains in typical deformation processes are considerably
larger, and since there is a scarcity of stress-strain data for large strains, quasi-static
compression tests were performed at a constant true strain rate of 3 x 10⁻³s-1 on 1100-0
at 84 K and 298 K up to true strains of el = 1. The cryogenic temperature of 84 K was
obtained by immersing the sample in a liquid nitrogen bath while testing. The temperature
was measured using a K-type nickel-10% chromium (+) and nickel-5% aluminum and
silicon(-)} thermocouple. Teflon sheets were used to minimize the friction in the platen-
sample interface. The samples showed very little barreling.
Cylindrical samples of aluminum 1100 0.5" diameter and 0.75" tall were machined with
the axis of the sample coinciding with the initial rod axis. Prior to the tests the samples
6Kothari and Arnand [1997]) report that their predictions were not very sensitive to the value of thelatent-hardening parameter.
32
=

were annealed. The annealing schedule consisted of heating the specimens in an inert
atmosphere (Argon) in a Lindberg furnace to 2600 C, holding for 1 hour, increasing the
temperature to 5380 C holding for another 15 minutes, and then furnace cooling to room
temperature (Brown, Kim and Anand [1989]). The initial crystallographic texture of the
as-annealed specimen was measured by x-ray irradiation. The details of the procedure
adopted for the preparation of the specimen and the methodology adopted for texture
measurement are described in Appendix C. Fig. 2-15(a) shows the measured pole-figures
(equal-area projections). Under the specified annealing schedule, the specimens retain a
large amount of the initial rod texture. The initial measured texture was represented by a
set of discrete weighted Euler angles using the popLA package7 . The ratio of the weight of
a grain orientation divided by the sum of the weights of all grain orientations comprising
the representation approximates the volume fraction of the grains that are oriented in a
small neighborhood of a particular grain orientation, assuming that all grains are of equal
volume. Since, in the computational procedure to follow unweighted grain orientations
are used to represent the initial texture, each weighted grain orientation computed by the
popLA package is replaced by a number of grain orientations equal to the integer nearest
to the weight and these grains are distributed in a small neighborhood (of 5 in each
of the three dimensions in Euler angle space) around the given orientation s . To increase
(decrease) the total number of represented discrete orientations used to represent the initial
texture, the weights are simply multiplied (divided) by an appropriate numerical constant.
Using this procedure, the initial texture, Fig. 2-15(a), is represented by 400 unweighted
discrete orientations. The numerical representation is shown in Fig. 2-15(b).
The same set of flow parameters as obtained from fitting the data of Duffy and co-
workers' are used for the following simulations. These parameters are repeated below for
convenience:
s*,o = 8.82 MPa, sa,o = 12.09 MPa, o = 1.732 x 10⁶ sec-1 , AF. = 1.38 x 10⁻²³ J,
p = 0.141, q = 1.1.
The values of the initial thermal and athermal part of the slip resistances of all the slip
7A detailed outline of the scheme for generating the weights is reported in Kocks, Kallend andBiondo [1991].
8 The discrete numerical representation of measured crystallographic texture is still an area of research thatrequires considerable additional work. A more rigorous methodology would facilitate a direct quantitativecomparison between measured and computed textures.
33
systems in the representative polycrystalline aggregate are assumed to be equal. The
slip system hardening parameters and saturation value of the slip system resistance are
estimated from the stress-strain curve for simple compression at room-temperature. The
numerical simulation was performed using ABAQUS/Standard on a single ABAQUS-C3D8
continuum element where the faces of the element initially perpendicular to the compression
axis were constrained to remain plane and perpendicular to the loading axis through out
the deformation. The bottom face of the element was fixed in the loading direction while
the top face was subjected to displacement boundary condition which resulted in an axial
true strain rate of -0.003 sec-'. Each integration point in the finite-element was assigned
the set of 400 orientations employed for the representation of the initial texture. Fig. 2-16
shows the numerical fit to the measured stress-strain response. This fit yields the following
material parameters:
ho = 200 MPa, = 220 MPa, r = 2, 4o,s = 1 x 101 2sec- 1, AF = 1.4 x 10 - 19 J.
Here, the values for the parameters O,, and AF 1 are taken as shown in Table 2-3. Fig. 2-
17 shows the measured9 and the numerically calculated crystallographic texture at a true
strain level of-1.0. We observe that the final texture is the ideal compression texture with
{110} planes oriented perpendicular to the compression axis in contrast with the initial
texture which had a strong concentration of {111} and {100} poles along the rod axis,
Fig. 2-15. Both {111} and {100} textures are unstable under simple compression. The
texture departs from these components rapidly with progressive deformation leading to the
stable {110} texture at large strains. The constitutive model captures this evolution of
texture quite accurately.
Next, we simulate the stress-strain response and the evolution of texture for the simple
compression test at 84 K using the material parameters estimated above. Fig. 2-18 shows the
predicted stress-strain curve compared with the measured response, the prediction closely
matches the experimental stress-strain curves. Fig. 2-19 shows a comparison of the measured
and predicted texture at e = -0.75. The numerical predictions are in good agreement with
the experimental results.
In order to evaluate the accuracy of the constitutive model for a different mode of
deformation, plane-strain compression experiments were performed on the same 1100-0.
The plane-strain compression specimens were machined such that the constrained direction
9 The tested specimens were sectioned approximately along their mid-plane prior to texture measurement.
34
was along the rod axis. The dimensions of the specimens were 7.62 mm in the compression
direction (e2), 9.53 mm in the free direction (el) and 14.73 mm in the constrained direction
(e3). The specimen and the sliding contact surfaces of the channel-die fixture were lubricated
with two sheets of teflon film containing a layer of MoS2 between them. The initial texture
was represented by the same set of 400 grain orientations, Fig. 2-15. The simulations
were performed on an ABAQUS-CPE4 plane-strain element. The measured and calculated
stress-strain response are shown in Fig. 2-20. The prediction is in reasonable agreement with
the experimental result. Fig. 2-21 shows the experimental and simulated textures, at a true
axial strain of-0.9. We observe that the measured texture is quite different from the usually
reported plane-strain compression texture for f.c.c. materials deforming by crystallographic
slip (e.g., Bronkhorst, Kalidindi and Anand [1992]). This is directly attributable to the
initial texture in the specimens. Unlike the situation studied by Bronkhorst, Kalidindi and
Anand [1992], the specimen in our experiments were strongly textured along the constrained
direction' °. We observe a reasonably good agreement between the measurements and
predictions indicating that the constitutive model provides good predictions for stress-strain
response and texture evolution to large strains even for initially anisotropic materials.
Kothari and Anand [1997] have evaluated the ability of the constitutive model to predict
the texture evolution and the stress-strain response of b.c.c. tantalum in some quasi-
static experiments. In the following, their results for simple compression and plane-strain
compression are summarized.
The simple compression and plane-strain compression tests were performed on specimens
machined from a tantalum rod. The initial crystallographic texture of the annealed rod
and its representation by 400 weighted grain orientations are shown in Fig. 2-9. Kothari
and Anand [1997] take the flow parameters to be the same as estimated from Hoge and
Mukerjee [1977] data. They estimate the initial value of the athermal part of the slip
system resistance and its hardening parameters by fitting the data from a constant true
strain-rate simple compression test performed along the rod axis, Fig. 2-22. The values
estimated from the curve-fitting procedure are:
l°In their experiments with initially anisotropic polycrystalline f.c.c. materials, Kalidindi and Anand [1994]have also previously observed that initial texture had a significant effect on the texture evolution even atlarge strains.
35
sa,o = 15MPa, ho = 70MPa, s,,. = 160MPa, r = l.1,ql = 1.4
The experimentally-measured and numerically-predicted 222}, 110} and 200} pole
figures at a strain of -1.1 are presented in Fig. 2-23. The initial 110} texture of the rod is
unstable under simple compression and the texture evolves to the stable, ideal compression
texture of {222} and (200} components for b.c.c. materials.
Similar to the plane-strain compression tests on 1100-0, the specimen in the plane-strain
compression of tantalum was oriented with the rod axis along the constraint direction.
The predicted stress-strain response is compared with the experimental measurement in
Fig. 2-24, and the predicted crystallographic texture is compared with the experimentally
measured one in Fig. 2-25. The predicted stress-strain curve and texture approach the
corresponding experimental measurements, but the agreement could be better. We observe
in passing that the plane strain compression texture for b.c.c. tantalum, Fig. 2-25 bears a
close resemblance to that measured for f.c.c. aluminum, Fig. 2-21. The (110} pole-figure
in Fig. 2-21 is quite similar to {222} pole figure in Fig. 2-25 while the {111) pole-figure in
Fig. 2-21 is strikingly similar to the {110} pole figure in Fig. 2-25.
Strain Rate and Temperature History Effects
It is well known that the plastic behavior of metals is influenced by previous plastic flow and,
generally, by the strain rate and temperature at which that flow occured (Lindholm [1964];
Klepaczko [1967, 1968, 1975]; Campbell and Dowling [1970]). The magnitude of these
strain-rate and temperature history effectsll depends among other factors on the particular
material and its structure. These effects become evident in experiments in which a
rapid change in strain-rate or temperature is imposed during the deformation. There are
interesting differences in the stress-strain behavior of f.c.c. and b.c.c. materials when they
are subjected to strain-rate or temperature jumps. In this subsection, the ability of the
constitutive model to capture these important differences is demonstrated.
Fig. 2-26(a) illustrates schematically the typical stress-strain response of f.c.c. metals
for constant strain-rate and strain-rate jump tests. The flow-stresses immediately before
"'A comprehensive review of the investigations of history effects in f.c.c., b.c.c and h.c.p. metals is providedby Duffy [1982].
36

and after the jump reflect the constant state, strain-rate dependence of the flow stress. The
difference in the flow-stress levels in the constant strain-rate and strain-rate jump tests at
a strain ej, - 02, is an outcome of the strain-rate history. The flow-stresses a2 and a2
correspond to the same strain level but different states. The difference in the states is due
to the strain-rate dependence of the slip system hardening. As the strain level at which the
jump is performed increases, this difference in the states increases and as a consequence
a - a2 also increases. However, since the steady-state structure is the same for both
types of tests, at large strains beyond the jump, the stress-strain curve for the jump test
asymptotically approaches the curve for the constant strain-rate test. This pronounced
strain-rate history effect is a characteristic of f.c.c. metals.
Fig. 2-27(a) shows the stress-strain curves reported by Senseny et al. [1978]
demonstrating the effects of strain-rate history. At each temperature, the results from
two types of tests are shown: (i) Constant true strain-rate tests performed at two strain
rates, 1.155 x 10⁻⁴s- 1 and 173.2s- 1. (ii) Strain rate jump tests conducted between these
strain rates at three different levels of strain. The experimentally observed strain-rate
history effects are captured quite well by the predictions from the model which are shown
in Fig. 2-27(b).
Analogous to tests probing strain-rate history effects, temperature jump tests can be
performed to study the temperature-history effects. Fig. 2-26(b) shows a schematic typifying
the stress-strain response from an isothermal and a temperature-decrement test. Here, the
flow-stresses immediately before and after the temperature jump signify constant state,
temperature dependence of the flow stress. As in the strain-rate jump tests, the constant
temperature and temperature jump tests essentially highlight the difference in the flow stress
levels due to difference in the states, the latter arising from the temperature dependence
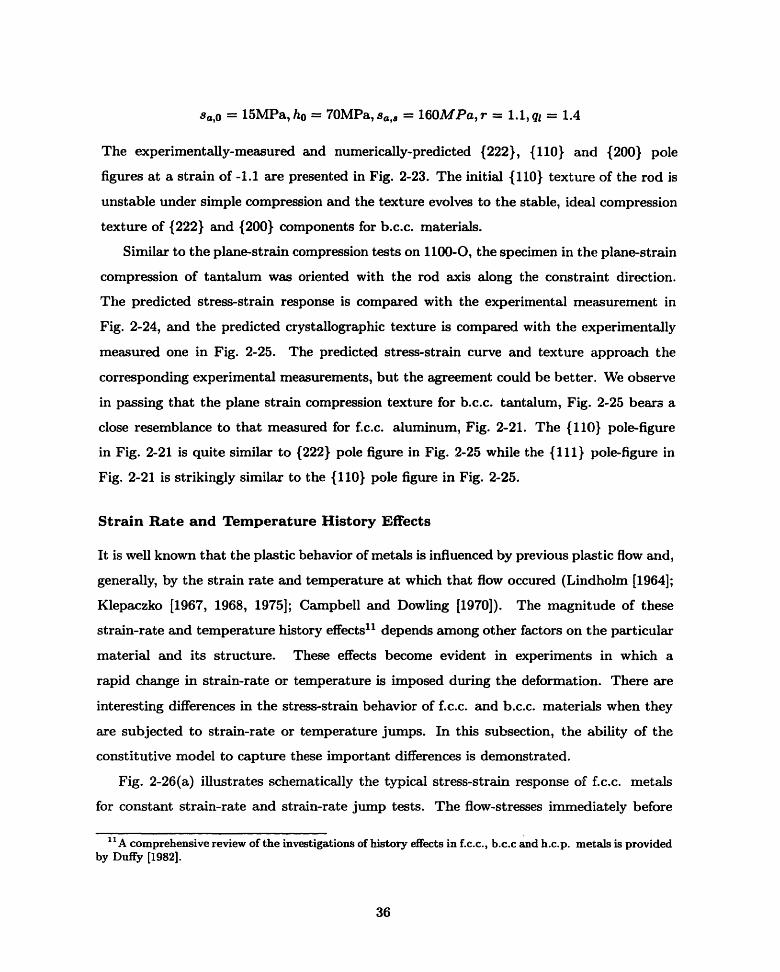
of the slip system hardening. Dorn, Goldberg and Tietz [1949] have reported temperature-
decrement experiments on commercially-pure aluminum (2S-0 annealed at 811 K for 20
minutes) that illustrate the effects of temperature history, Fig. 2-28(a). These tensile
tests were performed between two temperatures 12, 78 K and 292 K. The strain rate
was maintained at a constant value of 0.0011s- 1. The material parameters from Duffy
and co-workers's data is used to show the predictions from the constitutive model for
' 2Unlike the strain-rate jump tests, temperature changes here were not instantaneous. Instead, the testswere interrupted between changes in the temperature of the baths.
37

these conditions, Fig. 2-28(b). Again, the predictions are in very good agreement with
the experiments. As shown in Fig. 2-29, the predictions of the model are also in good
agreement with the experimental results for high-purity aluminum.
Dorn et al. [1949] also report temperature-increment tests where the initial part of the
tensile test was conducted at 78K which was followed by a change of bath-temperature
to 292K where the test was completed, Fig. 2-30(a). The predictions from the model
for this situation are shown in Fig. 2-30(b). The decrease in the flow stress is predicted
reasonably well at lower levels of strain, but at larger strains the model underpredicts the
change in the flow stress. It is known that during temperature-increment tests, the work-
hardened state reached due to straining at the lower temperature is unstable at the higher
temperature. This results in some initial work-softening leading to a larger decrease in flow
stress than would be possible with a temperature-increment at a constant state (Cottrell and
Stokes [1955]). The discrepancy in the predicted levels of flow stress can be attributed to the
inability in maintaining the state a constant between the changes -in the temperature of the
bath. Nevertheless, the qualitative aspects of a temperature-increment test are adequately
captured by the constitutive model.
Fig. 2-31 typifies the stress-strain behavior in b.c.c. materials under changes in strain-
rate history. We observe that though the flow stresses of both niobium and molybdenum are
sensitive to strain-rate they show little sensitivity to strain-rate history. Lopatin et al. [1992]
have reported the stress-strain response of pure tantalum under constant strain-rate and
strain-rate increment conditions, Fig. 2-32(a). The figure illustrates that pure tantalum
is quite insensitive to strain-rate history even at large strains. The slight overshoot in the
flow stress after the strain-rate increment above the flow stress level attained while straining
constantly at the higher strain rate can be attributed to yield-point phenomenon commonly
observed in b.c.c. materials. For the constant strain-rate and strain-rate jump simulations
on pure tantalum, the flow parameters estimated by Kothari and Anand [1997] for pure
tantalum are used:
O = 1.73 x 10⁷sec -1, AF* = 2.77 x 10⁻¹⁹J, p = 0.28, q = 1.34, s = 430MPa.
The initial value of the athermal part of the slip system resistance and its hardening
parameters are estimated by fitting the model to the measured "isothermal" stress-strain
38

curve, Fig. 2-32(a). The fit yields:
sa,o = 48MPa, sa,, = 245MPa, ha,0 = 100MPa, r = 1.1.
A latent hardening factor of ql = 1.4 is assumed. Lopatin et al. [1992] do not report the
initial texture of their compression samples. In the simulations to follow, an initial isotropic
texture 13 is assumed. Fig. 2-32(b) shows the predictions of the stress-strain behavior
for constant strain-rate and strain-rate jump situations. The predictions reproduce the
qualitative aspects of the stress-strain behavior. In contrast with the situation in the
modeling of f.c.c. materials, in b.c.c. materials the thermally activatable part of the
slip system resistance s is approximately constant with strain. Also, the hardening of
the athermal part of the slip system resistance sa is independent of the strain-rate. As a
consequence, the state, as quantified by the slip system deformation resistance, after the
strain-rate jump at any given level of strain is identical to the state at the same strain
attained through constant straining at the higher strain-rate. Thus, the flow stress level at
the end of the strain-rate jump is the same as the flow stress reached at the same strain
through a constant strain-rate test at the higher strain-rate. Fig. 2-33(a) and 2-33(b) show
the experimental and numerical prediction for the stress-strain response under strain-rate
decrements. The predictions again capture the lack of history effects reasonably well.
In conclusion, the rate and temperature-dependent polycrystal plasticity model
developed in this chapter has been demonstrated to capture the macroscopic stress-strain
response and predict the crystallographic texture evolution up to large strains under a wide
range of strain rates and temperatures for both f.c.c. and b.c.c. materials. Also, the model
accurately predicts the differences in the strain-rate and temperature history effects between
the f.c.c. and b.c.c. materials studied here.
13The nature of the initial texture should not affect the qualitative aspects of the results.
39

- JFI II I
I
I 8 a
I
> Y
IOr
0
Figure 2-1: Schematic diagram illustrating the temperature and strain rate sensitivity ofresolved shear stress at a fixed value of the deformation resistance s = s. + sa. is thetemperature above which there is enough thermal energy for the barriers to be overcomeby thermal activation alone. As shown in the figure, Oc is a function of the strain rate.
a2
C C1,
Figure 2-2: Schematic diagram illustrating the stress-strain curves observed in Cottrell andE
Figure 2-2: Schematic diagram illustrating the stress-strain curves observed in Cottrell andStokes' [1955] experiments. The notation used in the text for the relevant variables is alsoshown.
40
i=IT
r
- ~~~~~~~~~~~~~~~~~~~~~~~~~

4 0
1L4
100
pa0 75U
-
U 50
25
00 200 400 600 800
0 (K)
Figure 2-3: Variation of elastic constants for pure aluminum with temperature (Simmonsand Wang [1971]). The experimental data is fit through a third-degree polynomial function.
41

I I
90 180 270
0 (K)
100 -
80 -
I-
0I.09
60 -
40 -
20 -
n-I . I
0 90 180
(b)
-I------U I
270 360
0 (K)
Figure 2-4: Experimental data for the yield strength as a function of temperature and themodel's fit for the data of (a) Carreker and Hibbard [1957] for polycrystalline aluminum(b) Duffy [1974] for aluminum alloy 1100-0.
42
UU -
80 -
60 -
40 -
I-
wa:0
10
* £ =6.667x10 4 sec' 1
X Fit
AF = 3 x 10¹⁹ J; p = 0.141; q = 1.1
YO = 1.732 x 10⁶ sec 1
s, 0 = 8.76 MPa;s a, = 8.76 MPa
Y
Xx® xx v
xx xxxxxxx20 -
0-0
(a)
3360 450
* £ =5.774x 10- 4 sec - 1
X Fit
AF = 3 x 10-19 J; p = 0.141; q = 1.1
Y0 = 1.732 x 10⁶ sec'
xx s,O = 8.82 MPa; sa, 12.09 MPax x-
X X x x 4 XXXMXXXXxfX
450
r
_ _· · · · · ·
, D s | |~~
I
v

Ann
2£
10
0(a)U. 0.3
e
1(
12
8(
40
0
(b) 0.
Figure 2-5: Experimental data for the stressstrain response at different temperatures andstrain rates and the model's fit for the data of (a) Carreker and Hibbard [1957] (b) Senseny,Duffy and Hawley [1978.
43
3I

0.0000 0.0025 0.0050 0.0075
kBO/ ib 3
0.005
kBO/ b 3
0.0100
0.010
Figure 2-6: Saturation slip resistance plotted as a function of temperature and the model's fitto the data of: (a) Carreker and Hibbard [1957] (b) Senseny, Duffy and Hawley [1978]. Bothaxes are normalized by the temperature dependent shear modulus p. kB is the Boltzmannconstant and b is the Burgers vector.
44
le-02
a)CA0~
le-03
(a)
le-02
U,In
le-030.000
()

le-02
> le-03
le-040.000 0.005 0.010 0.015
kBe/I b 3
0.020
Figure 2-7: Saturation slip resistance plotted as a function of temperature and theconstitutive model's fit obtained using Carreker and Hibbard's data. The plot also showsthe extrapolation of the fit to elevated temperatures along with the data of Kocks [1976].
45

4W
300
200
100
(a) 0.0 0.1 0.2 0.3
(af)
160
120
-
80
40
o-1(b) 0.000 0.025 0.050 0.075 0.100 0.125
E
Figure 2-8: Comparison of the experimental data for the stress-strain response with themodel's predictions based on the parameters obtained from the fits: (a) Carreker andHibbard [1957] (b) Senseny, Duffy and Hawley [1978].
46
I I , I I I
IAA
Z/1IIf- - . - --- I
0

2.001.731.461.190.910.640.370.10
X2
I
22)
-X1
22)
X1
X2 X2
10)
-xi
X 2
Xl
Experimental
Figure 2-9: Representation of the texture ofgrains (Kothari and Anand [1997]).
10)
'Xl
X 2
)0}
-Xl
Numerical representation
annealed b.c.c. tantalum with 400 weighted
47

700
600
a 500
.E0-
400-
0. 300
200
100
10- 4 10-2 100 102 104 106
Strain Rate, 1/s
Figure 2-10: Fit of the Taylor-type crystal plasticity model to the data of Hoge andMukherjee [1977] and Duprey and Clifton [1995] on the strain rate dependence of the yieldstrength of b.c.c. tantalum (Kothari and Anand [1997]).
48

1000
900
800
Co
am
CE(L
0lazI
700
600
500
400
300
200
100
100 200 300 400 500 600 700 80(Temperature, K
Figure 2-11: Fit of the Taylor-type crystal plasticity model to the data of Hoge andMukherjee [1977] on the temperature dependence of the yield strength of b.c.c. tantalum(Kothari and Anand [1997]).
)o
49

RD RD
22)
-TD
RD RD
0)
TD
RD RD
)0)
.TD
Experimental Numerical representation
Figure 2-12: Representation of the texture of tantalum plate with 400 weighted grains(Kothari and Anand [1997]).
50
2.251.941.641.331.020.710.41 I0.10
:2)
TD
10)
-TD
00)
-TD

900
800
700
co 600
m 500
a400
300
200
100
I I U I ~ ~ ~ ~ ~ ~ ~ ~ ~ ~ _
0.1 0.2 0.3 0.4 0.5 0.6Strain
Figure 2-13: Comparison of the predictions from the Taylor-type crystal plasticity modelagainst the isothermal experiments of Nemat-Nasser and Issacs [1996] (Kothari and Anand[1997]).
51
Strain Rate of 5000/s
298 K
_ IC
r.I
JI,I
FI
rIVIlII
I- -- ~- Expenriment
I I I--..Crystal Plasticity Model
, I , I .I [ I , I , I I
I I i I I I
c-
I-

900
800
700
c 600
in 500
(n 400
300
200
100
.--. -2 A A
0.1 0.2 0.3 0.4 0.5 0.6Strain
Figure 2-14: Comparison of the predictions from the Taylor-type crystal plasticity modelagainst the adiabatic experiments of Nemat-Nasser and Issacs [1996] (Kothari and Anand[19r57]).
52
Girain rae oTr uuu/s
298 K
@ , -- ---~-J~e 498 K
I,_, 398 K
* ExperimentL - --- Crystal Plasticity Model
, I I I , I , I. , I , I ,
_ __ __ __ __Ir n W~~~~ I I I I ~~~~I I I
I

3.002.572.151.721.290.860.440.01
00)
Xi
0)
X,
0)
Xl
11)
. Xl
0)
xl
11)
-Xl
(a) (b)
Figure 2-15: (a) Experimentally measured texture in the as-annealed aluminum 1100-0 rodand (b) its numerical representation using 400 unweighted discrete grain orientations.
53
N2 -2
X2 X2

0%^ff
LUU
150
aooa 100
50
0
0.0 0.2 0.4 0.6 0.8 1.08
Figure 2-16: The measured compressive stress-strain response for 1100-0 at roomtemperature and the numerical fit from the model.
54

3.002.612.22-1.83 1.451.060.67 60.28 :
101
xl
0)
X,
X2 X2
101
Xl
0)
Xl
11)
.- X
1}
Xl
Experiment Simulation
Figure 2-17: Comparison of the experimentally measured texture in the simple compressionexperiment on 1100-0 at room temperature with the texture predicted by the Taylor-typecrystal plasticity model.
55
- * a~~~~
I
'X2 XI.-

400
300
a200
100
0
0.0 0.2 0
Figure 2-18: Comparison of the measured84 K with the numerical prediction.
.4 0.6 0.8 1.0
E
compressive stress-strain response for 1100-0 at
56
I

3.002.612.221.831.441.050.660.27 '
)0
X 1
)0)
· X!
10)
' x,
ii)
x,
10}
- X
I
xCl
Experiment Simulation
Figure 2-19: Comparison of the experimentally measured texture in the simple compressionexperiment on 1100-0 at 84 K with the texture predicted by the Taylor-type crystalplasticity model.
57
X2 X2Z
-X2 X2

200
150
t100
50
0
0.0 0.2 0.4 0.6 0.8 1.0
Figure 2-20: Comparison of the measured stress-strain response for plane-strain compressionof 1100-0 at 298 K with the numerical prediction.
58

X3
3.002.572.141.711.290.860.430.00
) 5.004.293.572.862.141.43
K,0.71 0.00
110)
0)
xi
0)
Xi
1)
XI
1)
X,
Experiment Simulation
Figure 2-21: Comparison of the experimentally measured texture in the plane-straincompression experiment on 1100-0 at 298 K with the texture predicted by the Taylor-typecrystal plasticity model.
59
X,I
X3

600
500
400
300
200
100
0.2 0.4 0.6 0.8 1.0 1Strain
Figure 2-22: Fit of the prediction from the Taylor-type crystal plasticity model againstthe measured stress-strain response in simple compression experiment on annealed b.c.c.tantalum (Kothari and Anand [1997]).
60
.2

X2
22)
.-X
2)
Xl
X 2 X 2
0})
XI
.0)
Xl
X2 X 2!
)o} o)0
-X1
Experimental Simulation
Figure 2-23: Comparison of the measured texture in the simple compression experiment onannealed b.c.c. tantalum against the texture predicted by the Taylor-type crystal plasticitymodel (Kothari and Anand [1997]).
61
XI
2.251.941.641.331.020.710.410.10
I

600
500
400
200
100
0.2 0.4 0.6 0.8 1.0 1Strain
Figure 2-24: Measured and simulated stress-strain response from the Taylor-type crystalplasticity model for the plane strain compression experiment on annealed b.c.c. tantalum(Kothari and Anand [1997]).
62
.2

xl22} 4.00
3.442.892.331.771.21
X3 0.663 0.10
Xl X,10o
X 3
Xl-- L
Xl
2001
X 3
Experimental Simulation
Figure 2-25: Comparison of the measured texture in the plane strain compressionexperiment on annealed b.c.c. tantalum against the texture predicted by the Taylor-typecrystal plasticity model (Kothari and Anand [1997]).
63
I
2.251.941.641.331.020.710.410.10
2)
X3
0)
X 3
(
(2C o0)
X 3
XII �L · AAA

a2
a2
IyC
(a) (a)
a2
T2
a1
8j(b)
Figure 2-26: Schematic diagram illustrating the(a) constant strain rate and strain-rate jump testjump tests in f.c.c. materials.
difference in the stress-strain response for(b) constant temperature and temperature
64
£

Rj�ftALM
160 -
120-
80-
40
0O
0.000 0.025 0.050 0.075 0.100 0.125(a) £
SZU
160
120
80
40
0
0.000 0.025 0.050 0.075 0.100 0.125Co) C
Figure 2-27: Stress-strain curves for constant true strain rate and strain-rate jump tests on1100-0: (a) Experimental results of Senseny, Duffy and Hawley [1978] (b) Predictions ofthe constitutive model.
65
-2= 1/3.- sec
. " ! I I . I . . .
!

il - -7T | L.L 1 !,, ,,,- ,, ,,,ai
_-~~~ ]'A WeM =
i t _ _ O,i_
~~~~~I" MOW-
252
224
196
168
140 1
112
84
56
28
0.00 0.04 0.08 0.12 0.16 0.20 0.24 0.28 0.32 0.36 0.40 0.44
Figure 2-28: Stress-strain curves for isothermal and temperature-decrement tests on 2S-0aluminum: (a) Experimental results of Dorn, Goldberg and Tietz [1949] (b) Predictions ofthe constitutive model with material parameters based on the data of Senseny, Duffy andHawley [1978].
66
I
I
(a)
252
224
196
168
i 140
112
84
56
28
0
(b)
0
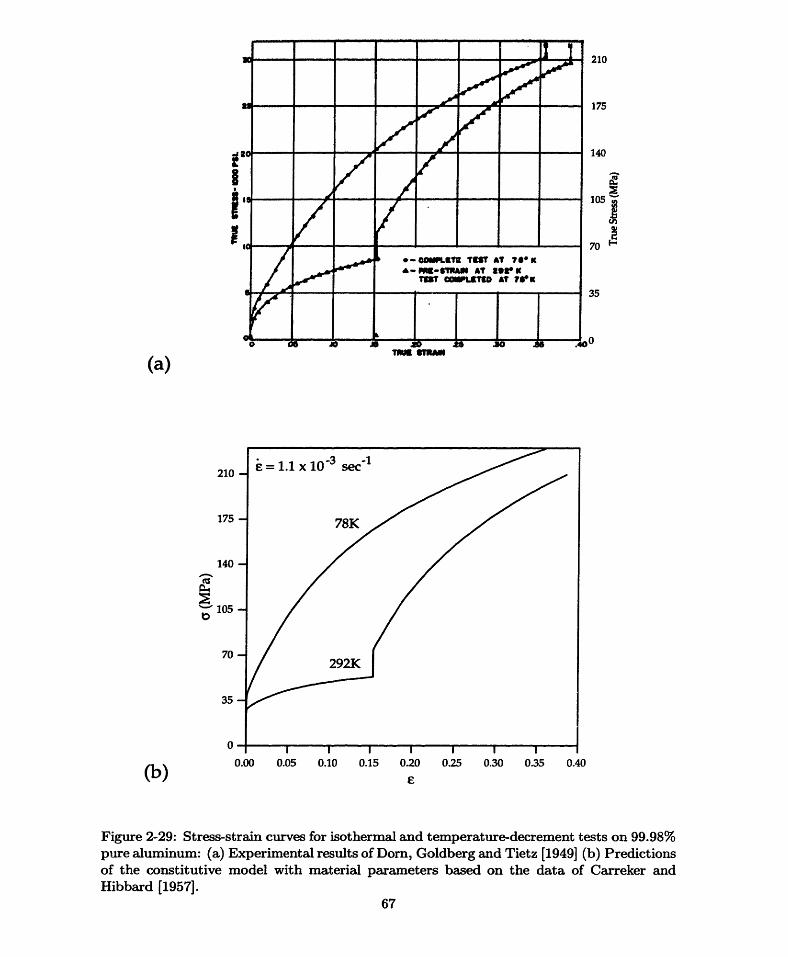
9i
I
I
(a)
210
175
140
' 105
70
35
0
(b)
0 /I O 0 .0 0A. III'o acs Jo 3e o
T/ TM I
210
175
140
105
cn
35
0.00 0.05 0.10 0.15 0.20 0.25 0.30 0.35 0.40
£
Figure 2-29: Stress-strain curves for isothermal and temperature-decrement tests on 99.98%pure aluminum: (a) Experimental results of Dorn, Goldberg and Tietz [1949] (b) Predictionsof the constitutive model with material parameters based on the data of Carreker andHibbard [1957].
67

I,
I I(a) tIM SpM
---
224
196
168
-'s 140
t: 112
84
56
28
0
252
224
196
168
140 a
112 E
84
56
28
0
0.00 0.04 0.08 0.12 0.16 0.20 0.24 0.28 0.32
Co) S
Figure 2-30: Stress-strain curves for isothermal and temperature-increment tests on 2S-0aluminum: (a) Experimental results of Dorn, Goldberg and Tietz [1949] (b) Predictions ofthe constitutive model.
68

eV
.. 70
60
j SO
40
s
to
0(
(a) Sta.(%/)
r _ __
10 s
140
.b 100
'0
1 60
40
Q 20
(J0 1 2 3 4 S 6 7 8 , ,0o , It
(b) Stin ( )
Figure 2-31: Stress-strain curves for constant true strain rate and strain-rate jump tests on(a) b.c.c. niobium and (b) b.c.c. molybdenum (Campbell [1970])
69
A& h
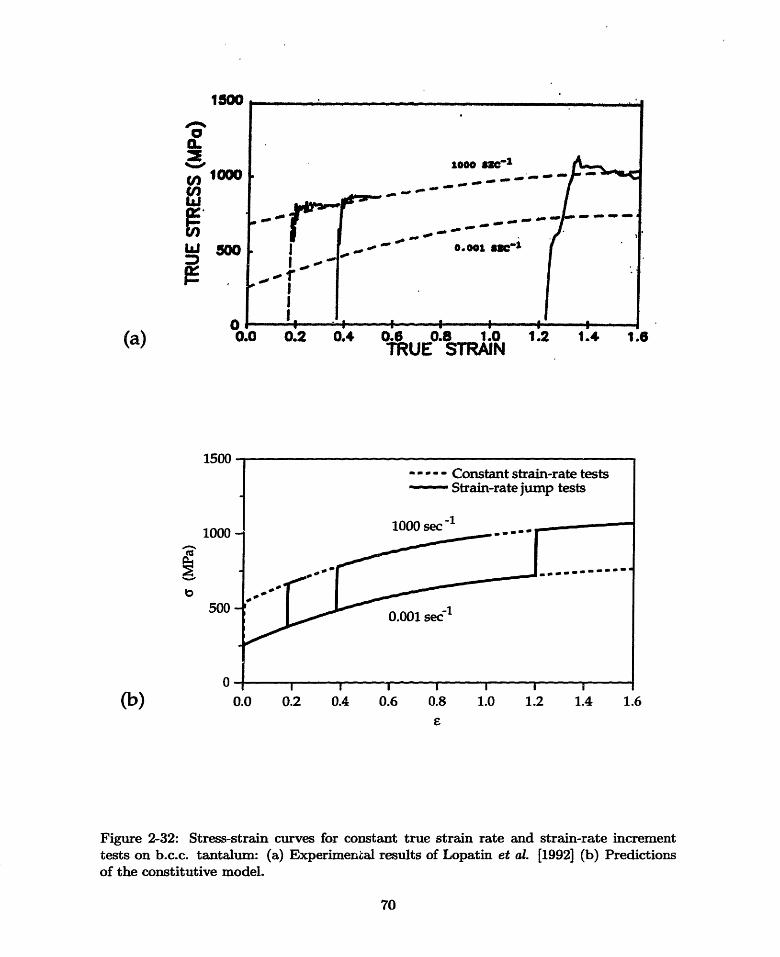
1a
0# 1a0bc
In
w 3C
(a)
1500
1000(-
500
0
TRUE STRAIN
0.0 0.2 0.4 0.6 0.8 1.0 1.2 1.4 1.6S
Figure 2-32: Stress-strain curves for constant true strain rate and strain-rate incrementtests on b.c.c. tantalum: (a) Experimental results of Lopatin et al. [1992] (b) Predictionsof the constitutive model.
70
(b)
-)14

1500
.1000
(a) 0.0 0.2 0.4 0.6 0.8 1.0 1.2 1.4 1.6TRUE STRAIN
13UU
1000
5O500-I ~0(b) 0.0 0.2 0.4 0.6 0.8 1.0 1.2 1.4 1.6
£
Figure 2-33: Stress-strain curves for constant true strain rate and strain-rate decrementtests on b.c.c. tantalum: (a) Experimental results of Lopatin et aL [1992] (b) Predictionsof the constitutive model.
71

Chapter 3
Application to DeformationProcessing of F.C.C. materials
Ears which develop during the drawing of anisotropic sheets are important defects that
form during the production of deep-drawn containers. These ears must be trimmed to
produce the desired height and shape of the container. A better understanding of the
process of development of ears during forming should lead to improved process designs
which reduce earing, and possibly eliminate the need for trimming. The quantitative
prediction of earing patterns is a classical outstanding problem in anisotropic plasticity
(e.g., Tucker [1961]; Wilson and Butler [1961]). Becker et al. [1993] have attempted to
predict earing patterns in polycrystalline aluminum sheets. While their calculations are
noteworthy, they were unable to obtain fully-drawn cups in their simulations. In this
chapter, the constitutive equations and computational procedures presented in Chapter 2
are employed to simulate the formation of earing defects in (i) single crystal sheets of pure
aluminum and (ii) polycrystalline sheet of A12008-T4. The finite element simulations on the
single crystal sheets are compared with the experimental results of Tucker [1961] while the
numerical simulation for the polycrystalline sheet is compared with experiments performed
on A12008-T4.
3.1 Earing in Single Crystal Cups of Aluminum
Tucker [1961], in some pioneering work, reported on the different earing patterns in cups
drawn from circular blanks of aluminum with different initial orientations. Depending
72

on the initial orientation of a blank, there is a wide variety in the number of ears, their
positions and heights, Fig. 3-1(a). In this study, the earing behavior in cups drawn from
circular blanks which were initially in the [001] and [111] orientations, Figs. 3-1(b) and
3-1(c) respectively, where these orientations refer to the crystallographic directions that are
normal to the blank are considered.
The geometry of the cup-drawing in the simulations approximates the apparatus used
by Tucker in his experiments, Fig. 3-2(a) (Becker et al. [1993]). Circular blanks 79 mm
diameter and 0.81 mm thick are drawn in an apparatus consisting of a punch and a die
of diameters 41.2 mm and 44 mm, respectively. Fig. 3-2(b) shows the finite element mesh
used for the simulation. Both the [001] and [111] orientations possess rotational symmetries
about the punch axis; accordingly, only a sector of the circular blank need be considered in
each analysis. Also, since the inplane-deformation of the sheet is of primary interest, the
sheet is modelled with two elements through the thickness ABAQUS continuum C3D8R
and C3D6 elements are used. The interfaces between the punch and the blank, the blank
and the blankholder, and the blank and the die are modeled as frictionless. Also, the die,
blankholder and the punch are treated as rigid surfaces. A constant force of 10 KN is
applied on the blankholder, and the punch speed is taken to be 1 mm/sec.
3.1.1 Material Parameters for Single-Crystal sheets of Aluminum
Tucker [1961] does not report the material properties for the single-crystal sheets used in
his experiments. The parameters used in our simulations are based on single-crystal data
available in the literature. The data of Cottrell and Stokes [1955] for the variation of
the yield-stress with temperature in single-crystals of 99.992% pure aluminum is used to
determine the flow parameters for the sheets in the simulations. The parameters obtained
from this fit, Fig. 3-3(a), are:
-Yo = 1.732 x 10⁶ sec-l, AF* = 2.5 x 10⁻¹⁹ J, p = 0.131, q = 1.1, X = 0.695.
The flow parameters for the single crystal aluminum are in close agreement with the
corresponding values for relatively-pure polycrystalline aluminum enlisted in Chapter 2.
The slip-system hardening parameters for the simulations are obtained by fitting the
model's predictions for the stress-strain response with that obtained in the channel-die
compression experiments of Becker et al. [1991] on single-crystals of commercial purity
73

aluminum as shown in Fig. 3-3(b). This yields the following parametersl:
s.,0 = 10 MPa,sa,o = 14 MPa,ho = 65 MPa,r = 2,s, = 186 MPa.
Also, the latent hardening parameter for all the deep-drawing simulations is taken to be
q = 1.4.
3.1.2 Cup-drawing simulation for the [001] and [111] oriented blanks
Fig. 3-4(a) is a schematic diagram of the earing pattern observed by Tucker in aluminum
single crystals in the [001] orientation (Fig. 3-1(b)). A total of four ears form along the
[100], [010], [00] and [010] initial directions in the blank. The symmetry of this orientation
permits a model which uses only a 450 sector of the blank. The 0° and 450 planes are
symmetry planes and are free of shear tractions.
Fig. 3-5(a), taken from Tucker's [1961] paper, shows the final shape of the aluminum
single-crystal cup in this orientation. Fig. 3-6(a) shows the predicted shape of the fully-
drawn cup. For clarity, the entire cup has been shown by suitably reflecting the 450 sector
that was simulated. This figure also shows the contours of the equivalent tensile plastic
strain e-P in the cup at the end of the drawing process2. The accumulated plastic strain is
maximum in the ears. The prediction of the number of ears and their position is accurate.
No attempt was made to compare the heights of the ears as the material in our simulation
is different from that used by Tucker in his experiments.
Fig. 3-1(c) shows that in the [111] orientation six ears form. Fig. 3-4(b) is a schematic
view of the earing pattern. The symmetry of this orientation permits a model which uses
only a 60° sector of the blank. The 0° and 60° planes are symmetry planes and are free of
shear tractions.
Fig. 3-5(b) (from Tucker [1961]) shows the final shape of the aluminum single-crystal
cup in this orientation. Fig. 3-6(b) shows the predicted shape of the fully-drawn cup. The
entire cup has been shown by suitably reflecting the 600 sector that was simulated. This
figure also shows the contours of the equivalent tensile plastic strain EP in the cup at the
1Due to the lack of single-crystal stress-strain data up to large strains for different strain rates andtemperatures, the dependence of the saturation value of the slip system resistance so on the strain-rate andtemperature is ignored. Since the deep-drawing experiments of Tucker [1961] were performed in isothermaland quasi-static conditions, the qualitative aspects of the results are not expected to be affected by thisassumption.
2For single crystals the equivalent tensile plastic strain is defined as FP = f P dt, where
t = {E., 7 - }a /}/, with = (3/2)' 'ii.
74

end of the drawing process. Again, the accumulated plastic strain is larger in the ears, and
the prediction of the number of ears and their position is accurate.
3.2 Earing in Polycrystal Cups of A12008-T4
3.2.1 Characterization of A12008-T4 Sheet
Polycrystalline A12008-T4 sheet3 , 0.7874 mm in thickness, was kindly provided by ALCOA
Technical Center. Metallographic specimens from the sheet were polished and then etched
with Keller's reagent (2mL 48% HF, 3mL conc. HC1, 5mL conc. HNO3 and 190mL H20)
to reveal the grains. The average grain diameter in the rolling plane was 60rm. The
initial crystallographic texture of the as-received sheet was measured by x-ray irradiation
using a Rigaku RU200 diffractometer. The procedure for the texture measurement is
provided in detail in Appendix C. Fig. 3-7(a) shows the measured pole-figures (equal-
area projections). Fig. 3-7(b) shows a numerical representation of this texture using a
weighted average over 192 components. Fig. 3-7(c) shows a numerical representation of
the texture using a weighted average over only 33 components. Although the texture
representation using 192 components is more accurate, in the numerical calculations for
cup drawing the computationally less expensive numerical representation, which employs
only 33 components, is used. Figs. 3-8(a) and 3-8(b) are inverse pole-figure plots for the
rolling and transverse directions, respectively.
Due to the lack of data for the yield-stress variation with temperature for A12008-T4,
for the deep-drawing simulation, the plastic flow parameters 4 obtained from the data of
Duffy [1974] for 1100-0 are employed,
; = 1.732 x 10⁶sec -1, AF* = 3 x 10⁻¹ 9J, X = 0.73,p = 0.141, q = 1.1.
In order to obtain the material parameters for the slip system deformation resistance
and its evolution, a tension test was conducted on a sheet-tension specimen (ASTM E8)
cut parallel to the rolling direction. The strains in the gauge section were measured using
an extensometer. Fig. 3-9(a) shows a schematic of the sheet-tension specimen. A finite-
3 A12008-T4 is an automotive alloy widely used in car-body panels.4We expect that due to the presence of alloying elements, AF* for 2008-T4 would be higher than that
for 1100-0. However, due to lack of the relevant data this difference is neglected in the calculation.
75

element representation of the specimen using 180 ABAQUS C3D8R continuum elements
is shown in Fig. 3-9(b). The measured load-displacement and stress-strain curves prior
to the onset of diffuse-necking are shown in Figs. 3-10(a) and 3-10(b), respectively. The
values for the hardening parameters were adjusted so that the numerical results matched
the corresponding experimental data. The numerical fit to the data is also shown in Figs. 3-
10(a) and 3-10(b). The material parameters obtained from the fit are:
s.,o = 40 MPa, a,O = 55 MPa, ho = 542 MPa, ss = 337 MPa, r = 2.
Fig. 3-10(b) also shows the stress-strain curve from a numerical simulation of tension
on a single element with the sheet texture represented by 192 components. The stress-
strain response obtained by using the dominant 33 components is almost identical to the
stress-strain curve for the 192 components.
3.2.2 Cup-Drawing Experiment
A schematic diagram of the geometry of the cup-drawing apparatus is shown in Fig. 3-
11(a). Circular blanks of diameter 101.6 mm and thickness 0.7874 mm, were drawn in an
apparatus comprising a round-nosed punch and die of diameters 50.8 mm and 53.035 mm,
respectively. All surfaces in contact with the deforming blank were polished to a surface
finish of 4. The punch, blankholder and die were machined from AISI/SAE D2-steel with
a Rockwell hardness of 62. The cup-drawing experiments were performed on a double-
action hydraulic press, powered by two dual-acting hydraulic cylinders. The hydraulic
cylinders could apply a maximum binder force of 35 tons and a maximum punch force of
20 tons. The hydraulic cylinder applying the binder force was servo-controlled to produce
a constant binder force, and the hydraulic cylinder applying the punch force was servo-
controlled to produce a desired punch position. The press was instrumented to measure
the forces and displacements. Strain gauges detected the binder and punch forces, while
LVDT's sensed the punch position. The press was controlled through a microcomputer
(IBM-486 PC) equipped with a real-time data-acquisition board (DT2801-A). Strain-gauge
signal conditioners (2B31K) were used to output the force signals from the binder and
punch force strain gauge Wheatstone bridge circuits. A constant binder force of 10 KN was
applied and the cup was drawn with a punch speed of 1mm/sec. Teflon sheets were used
76

as lubricants, to minimize the friction in the interfaces between the punch and the blank,
the blank and the blankholder, and the blank and the die.
The cups showed four ears: two along the rolling direction and two along the transverse
direction of the sheet, as shown in Fig. 3-12(a). Note that a cup drawn from a sheet with
a classical rolling texture (e.g., Hirsch et al. [1978]) forms four ears at 450 to the rolling
direction. The difference in the earing pattern between that situation and the situation in
our experiments, arises directly from the differences in the two initial textures. The inverse
pole-figure plots in Figs. 3-8(a) and 3-8(b) for the rolling and transverse directions provide
a clearer understanding of this situation. The texture contains predominantly two ideal5
components, namely, the 100} < 010 > Cube component and the 110} < 001 > Goss
component. Both of these orientations are known to form ears at 0° and 90° to the rolling
direction (Rollett et al. [1987]).
The thickness strains at the bottom and along the cup wall were measured at 0°, 560
(location of the trough) and 90° from the rolling direction, as shown in Fig.3-13. The sheet
thins at the bottom and at the nose of the cup while it thickens along most portion of the
wall. For all the three direcitons, the thickness strain is the minimum at the nose of the
cup. We observe that the thickness strains at the wall along the trough (56° from the rolling
direction) is higher than that along the rolling and transverse directions.
3.2.3 Simulation of Cup-Drawing
Fig. 3-11(b) shows the finite-element mesh used for the numerical simulation. A total of
672 ABAQUS continuum C3D8R and C3D6 elements were used, with 2 elements through
the thickness6. Since the initial texture of the sheet, Fig. 3-7(a), possesses orthotropic
symmetry, only a 900 sector of the circular blank was considered for the analysis. The die,
blankholder and punch were treated as rigid surfaces. A friction coefficient of = 0.1 was
used for the interface between the punch and the sheet top, and the interfaces between all
SThe indices {hkl} in the metallurgical notation {hkl} < uvw > denote the crystallographic planes thatare parallel to the rolling plane and the indices < uvw > refer to the crystallographic directions aligned withthe rolling direction.
6 The simulation with two elements in the thickness direction was found to provide a better quantitativeprediction of the cup-height when compared with that obtained from the calculation with one elementthrough the thickness. However, even with two elements in the thickness direction the bending strains arecaptured only crudely. A further refined mesh was not employed owing to computational limitations.
7Although teflon sheets were used for lubrication, there was some contact between the punch and sheetas a result of the tearing of the teflon sheet at large bending strains. The friction coefficient was assumed tobe 0.1. The results were not very sensitive to changes in this value.
77

other contacting surfaces were considered frictionless. In order to speed-up the simulation,
the density of the blank was artificially increased to increase the stable time increment s.
Fig. 3-12(b) shows the predicted shape of the fully-drawn cup. This figure also shows
the equivalent tensile plastic-strain Et contours in the cup at the end of the drawing process.
The prediction of the number of ears and their positions is accurate. The equivalent plastic
strains in the ears are quite large suggesting significant texture evolution in these areas.
Fig. 3-14(a) shows a comparison of the predicted cup-height with the experimentally-
measured height. The discrepancy in the predicted cup-height is due to the difference
between the predicted and measured cup-thickness. Fig. 3-15(a), 3-15(b) and 3-15(c) show
the comparison between the measured and predicted cup thickness strains at 0 °, 56' and
900 from the rolling direction, respectively. We observe that the increase in thickness of the
cup-wall is underpredicted by the model. A better agreement of the prediction with the
experiment is anticipated with an increase in the number of elements through the thickness.
Fig. 3-14(b) shows a comparison of the predicted punch load-displacement curve with the
values measured in the experiments. The prediction is in reasonable agreement with the
measured response.
Overall, the quantitative prediction of (i) the punch force versus punch displacement,
and (ii) the number of ears, their positions, and their heights, is very good.
Earing could be minimized by either of the following two methods: (i) tailor the
processing scheme prior to the cup-drawing operation to produce a "near-isotropic" initial
texture in the sheet; (ii) choose an initial shape 9 for the blank that would minimize the
earing. The capability to quantitatively predict the earing pattern, developed in this work,
could serve as a useful design and analysis tool in either of the two methods.
8In such "density-scaled" simulations one must ensure that the inertial effects are small. To do this onemust monitor the ratio of the total kinetic energy to the total internal (stored elastic + dissipated plastic)energy during the simulation, and ensure that this ratio does not exceed ;, 0.01-0.05 at any time during thesimulation.
9A shape which has more material along directions where troughs form would reduce the apparent earingin the fully-drawn cup.
78

;22I ia7
II
(a)
I ,. '' 7 '. /
N
" I1
(b) (c)
Figure 3-1: (a) Deep-drawn cups from single crystal sheets of pure aluminum arranged onstereographic projection of the standard unit triangle (Tucker [1961]). (b) Cup drawn fromblank with the [001] direction initially along the punch axis. (c) Cup drawn from blankwith the [111] direction initially along the punch axis.
79
, I
l l

oji1
t
(a)
(b)
Figure 3-2: (a) Geometry of the cup-drawing aparatus for the deep-drawing of single crystalsheets. (b) Exploded view of the finite element mesh used in the simulations
80

2.0
1.6 -
^ 1.2-
eo 0.8 -
0.4 -
0.0-0 125 250 375 500
0 (K)
nfl":-U
160
_ 120
80
40
0
(b) 0.0 0.3 0.6 0.9 1.2 1.5C
Figure 3-3: (a) Experimental data for the variation of flow stress with temperature in99.992% pure aluminum single crystals (Cottrell and Stokes [1955]) and the constitutivemodel's fit. The stress at each temperature is normalized by the value at 90K. Also,the flow stress has been corrected for changes in the elastic moduli with temperature.(b) Experimental stress-strain response from channel-die compression of aluminum singlecrystal with the initial orientation (001)[110] (Becker et al. [1991]) and the model's fit.
81
* £ =2.5 x 10 '5 sec' 1
X Fit
AF = 2.5 x 10⁻¹⁹ J; p = 0.131; q = 1.1
x j 0= 1.732 x 10⁶ sec-1; X = 0.695
x
X XW x xl c X x x xc x X x x
Ir T- I -- I ' I
� ___ ___ __

(a)
(b)
Figure 3-4: Schematic view of the earing pattern observed in the drawing of f.c.c. singlecrystals for (a) [001] oriented blank (b) [111] oriented blank.
82
I-

EP
0.63090.54180.45280.36370.2747
(a) (a )
M 0.55960.44800.33650.22500.1134
(b)
Figure 3-5: The earing pattern observedby Tucker [1961] for: (a) a [001] orientedblank. (b) a [111] oriented blank.
(b)
Figure 3-6: The predicted earing pattern for:(a) a [001] oriented blank. (b) a [111] ori-ented blank. The equivalent plastic straincontours are also shown.
83

RD
4.12 l - 1113.57 '~ N'91)
1.93 1 .38 j0.83 0.28
TI1
4.123.542.962.381.801.22
) 0.640.06
RD.. I
11) 4.123.573.022.471.931.38
-TD 0.83 0.28
RD
100)
- TD." 11 -1 16: * i.-a
RD
4110}
/
.TD
(a) (b)
Figure 3-7: (a) Experimentally measured initial texture of the sheet.representation of the measured texture using 192 weighted grains.representation of the measured texture using 33 weighted grains.
(C)
(b) Numerical(c) Numerical
84
RD
11)
TD
RD
)0)
TD
RD
101
TD
RD
(110}
TD
~~~~~~i~~~~~~~~~~~ ssl~~~~~~~~~~~~~~~~~~~~s~~~~~~~~~~~ir~~~~~~~~~~~~~~~
NW SWOV~p
RD. .

3.443.002.572.131.691.250.820.38
I
001
010100
(a)
001
010100
(b)
Figure 3-8: Inverse pole-figures computeddirection and (b) the rolling direction ofpresence of the Cube - {100} < 010 > and
from the measured texture for (a) the normalthe A12008-T4 sheet. The texture shows theGoss - {110} < 001 > orieptations.
85
v

-* [-- 2.54 --
9.525-0- -
0.7874
Figure 3-9: (a) Geometry of the sheet-tension specimen (ASTM E8) (All dimensions are inmillimeters). (b) Finite element mesh used for the sheet-tension simulation.
86
- 2.54 --
43.18
31.75
(a)
(b)
mS II I l I II - -
l!
I I
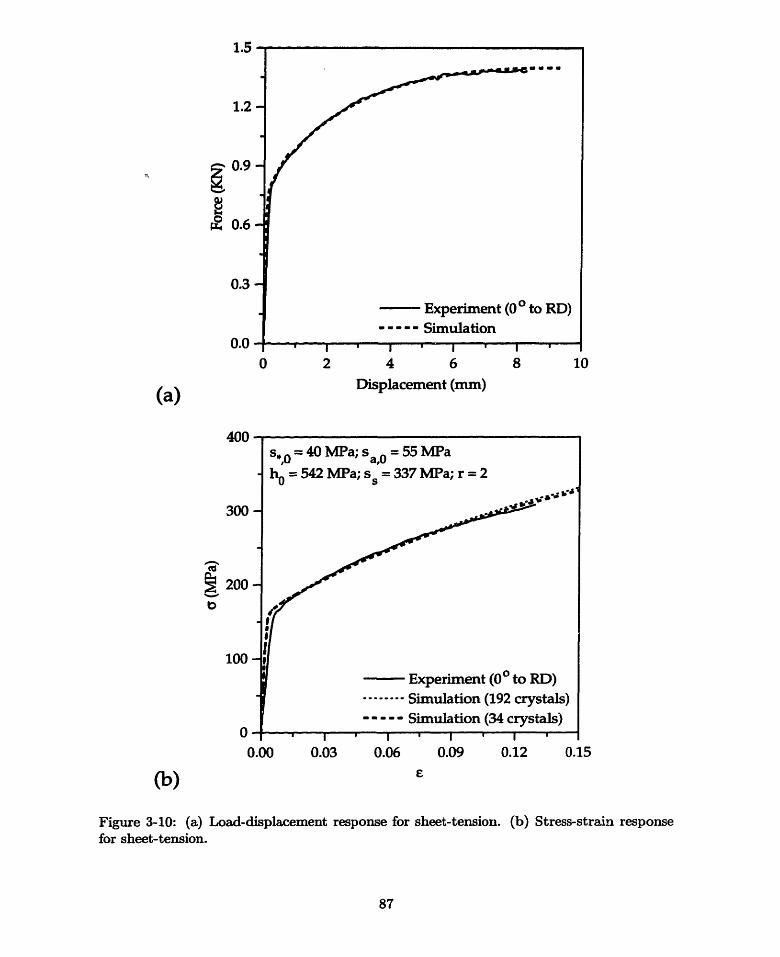
1.D
1.2
0.9
0.6
0.3
0.00 2 4 6 8 10
(a)Displacement (mm)(a)
*UU '-
300 -
~ 200 -
100 -
0-0.00 0.03 0.06 0.09 0.12 0.15
(b)
Figure 3-10: (a) Load-displacement response for sheet-tension. (b) Stress-strain responsefor sheet-tension.
87
s. = 40 MPa; S a,O = 55 MPa
ho = 542 MPa; Ss = 337 MPa; r = 2
----- Experiment (00 to RD).---.-- Simulation (192 crystals)
----- Simulation (34 crystals)I . I . I . I *
A1 And·

(a)
Punch
Blank Blankholder
(b)
Figure 3-11: (a) Geometry of the cup-drawing apparatus (All dimensions are in millimeters).(b) Exploded view of the finite element mesh used in the simulation.
88
��.M

(a)
- (0.65450.52210.38970.25740.1250
(b)
Figure 3-12: Comparison of the predicted earing pattern with that observed in theexperiment. (a) Observed earing pattern (The rolling direction is indicated by the arrow).(b) Numerical prediction. The numerical simulation also shows the equivalent plastic straincontours.
89

AV. -
0.3 -
0.2 -
cn
0.1-
0.0-
-0.1 -
-0.2 -0 15 30 45 60
Distance along cup (mm)
Figure 3-13: Experimentally measured thickness strain profile for the cup.
90
* 0° from RDO 560 from RD 0+ 90°from RD 00
O +
+
0+
O
O
i ' 1 II ' I I '
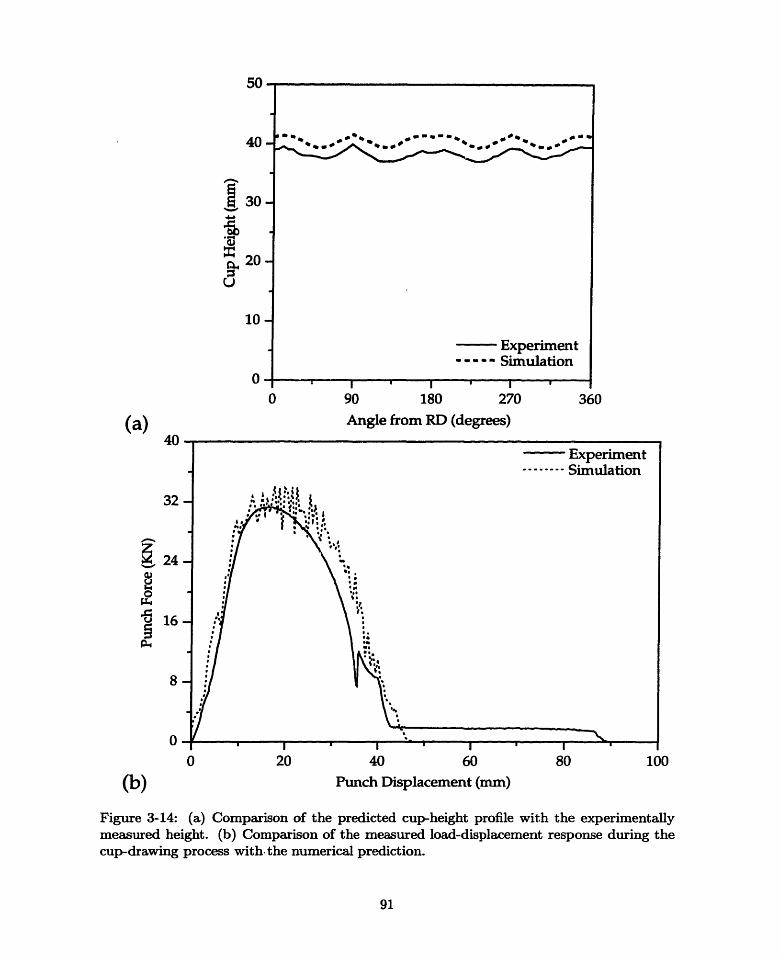
50
40-
30-
20-1U
10 -
0-0
32
24
0
- 16
8
0
(b)
I I I
90 180 270
Angle from RD (degrees)360
0 20 40 60 80
Punch Displacement (mm)100
Figure 3-14: (a) Comparison of the predicted cup-height profile with the experimentallymeasured height. (b) Comparison of the measured load-displacement response during thecup-drawing process with the numerical prediction.
91
(a)An
Experiment----- Simulation
·I I -
... !- . .I
Uv

0.3 -
0.2 -
0.1 -
0.0 -
-0.1 -
(a)0.4
0.3 -
0.2-
0.1 -
0.0 -
-0.1 -
(b)0.4
0.3-
I I I * I '
0 15 30 45 60 7
Distance along cup (mm)
I ' I * I ' I 0 15 30 45 60 7
Distance along cup (mm)5
(C) 0 15 30 45 60 75Distance along cup (mm)
Figure 3-15: Comparison of the experimentally measured and predicted thickness strainprofile for the cup along (a) 0 from the rolling direction (b) 56° from the rolling direction(c) 90° from the rolling direction.
92
O Experiment (O0 fromRD) o
o* Simulation
o
o0.o0
0.ooee
· 6~ 00
5
o Experiment (56 0from RD)* Simulation o0
0
0O
0
O *·o 00..G .0S I$O
.,
0.2 -
0.1 -
0.0 -
O Experiment (90 0 from RD)* Simulation
o00
0O
0OO ·
O 0
0O ° ·Oo
0.·. p-
I - I ' I ' I
-0.1 -
4-n.
I ._ .. ,, .1_ AnA
-u. -
-v./
.

Chapter 4
Plasticity of Polycrystalline H.C.P
materials
In this chapter, a finite-deformation constitutive model for plasticity of hexagonal materials
deforming by crystallographic slip is proposed. A full 3D finite-element model in which each
element represents a grain and the constitutive response is given through a single-crystal
constitutive model is used to simulate the response of a polycrystalline aggregate. Particular
attention is given to the modeling of isothermal high-temperature deformation of h.c.p.
titanium. However, the constitutive model is expected to be applicable to the modeling of
deformation of other hexagonal materials in temperature and strain-rate regimes where the
predominant mode of plastic deformation is crystallographic slip.
The hexagonal crystal structure (h.c.p.) is created when close-packed layers of atoms
are stacked in the order ABABAB... such that every third layer is in exactly the same
relative position as the first, Fig. 4-1(a). The interatomic spacing on the A plane is denoted
by a while the spacing between adjacent A planes is denoted by c. The ratio c/a is termed
the axial ratio. This ratio is different in different hexagonal metals; it has an ideall value
of 1.633. Titanium has an axial ratio of c/a = 1.587.
Unlike the cubic crystals, the native basis in a h.c.p. lattice is non-orthogonal, Fig. 4-
1(b). The native basis is denoted by the set of non-orthogonal base vectors, {al, a2, a3, c}
with al + a + as = 0. For computational purpose, an orthonormal basis is defined from
'The ideal value of the axial ratio is derived from a hexagonal-close-packed arrangement of equal-sizedhard spheres.
93

a combination of these crystallographic vectors. Fig. 4-1(b) shows the relation between a
simple hexagonal cell with base vectors, (al, a2, as, c) and its corresponding orthohexagonal
cell with base vetors, {a, b, c} which is used to calculate an orthonormal basis associated
with a h.c.p. lattice structure. The orthohexagonal and the hexagonal cells share the base
vector c. The other base vectors are related to the native base vectors by the relations,
a = a2 and b = a3 - al. The orthonormal basis, {ec, ec, ec}, is obtained by normalizing
these components, i.e., ec = , ei = T and ec = .
The hexagonal materials owing to their lower symmetry exhibit complex modes of
deformation. Unlik' the cubic crystals, hexagonal crystals possess more than one family of
slip systems. Also, the deformation resistances of the different families of slip systems
can be substantially different resulting in a highly anisotropic response at the single-
crystal level. For titanium, studies on single crystal2 (Rosi, Dube and Alexander [1953],
Churchman [1954], Akhtar [1975a, 1975b]) and coarse-grained polycrystals (McHargue and
Hammond [1953], Rosi, Perkins and Seigle [1956] and Paton, Williams and Rauscher [1973]),
aimed at determining the operative deformation modes in titanium, indicate that the
commonly observed slip systems in pure h.c.p. titanium are: the three equivalent basal
{0001} < 1120 >, the three equivalent prismatic {1010} < 1120 > and the six equivalent
pyramidal {1011} < 1120 > slip systems, as illustrated in Fig. 4-2. All of the three classes of
slip systems share a common slip direction, < 1120 > or < a >-direction. For convenience,
we shall refer to slip on these three classes of slip systems as < a >-slip.
Temperature is an important factor that affects the nature of plastic deformation in
titanium crystals. Conrad [1981] has reported the change in the critical resolved shear
stress with temperature for the basal-< a > and prisrmatic-< a > slip in single crystals,
Fig. 4-3. Both these slip resistances decrease dramatically with increase in temperature.
At temperatures below 300°C, the critical resolved shear stress for the basal-< a > slip is
nearly 5-6 times higher than that for the prismatic-< a > slip. At higher temperatures, the
critical resolved shear stress for both types of slip become less disparate, which then allows
for the possibility of slip on either of the planes. Rosi, Perkins and Seigle [1956] observed
that the propensity for pyramidal-< a > slip also increased with increase in temperature.
But these authors do not report the critical resolved shear stress on this slip system.
The < a >-slip on the prismatic {1010}, basal (0001) and pyramidal {10i1} planes
2 Studies on single crystals of titanium are limited due to the difficulty in growing them.
94

constitute twelve physically different slip systems but comprise only four independent ones
(Groves and Kelly [1963]). Slip on these systems does not provide for a mechanism for
strain parallel to the c-axis of the crystals. Other slip or twinning deformation modes are
required to accommodate a strain parallel to the c-axis of the hexagonal system. These
additional mechanisms whether slip on pyramidal planes with < 1123 > (< c+a >)
slip directions or twinning, have a strong influence on the overall inelastic behavior of
a polycrystal. At low homologous temperatures, the high deformation resistance on the
pyramidal < c + a >-slip systems precludes their operation. Under these conditions, the
ability to undergo generalized plastic flow is achieved through deformation twinning. The
two common twinning modes in titanium that have been observed at room temperature
are the six equivalent {1012} < 1011 >, and the six equivalent 1122} < 1123 > twin
systems (shown in Fig. 4-4). The direction of shear on the twin system (1012)[i011]
depends on the axial ratio. For c/a < V3V, which is the case for titanium, the direction
of shear i3 [1011] and twinning will occur under tension parallel to the c-axis. For this
reason, the {1012} < 1011 > twin systems are referred to as the "tensile" twin systems.
The magnitude of twin shear strain on the {1012} < 1011 > twin system in titanium is
0.1751. The {1122} < 1123 > twin systems are "compressive" systems (for c/a > VA) that
operate under compression parallel to the c-axis. The magnitude of twin shear strain on
the {1122} < 1123 > twin systems is 0.218. The propensity of titanium crystals to twin
decreases with increase in temperature, Fig. 4-5(a). Lii et al. [1970] performed tension tests
in a wide range of temperatures on specimens cut from a rolled plate with a strong alignment
of the basal planes parallel to the rolling plane. They observed that the volume fraction of
twins at a particular strain level decreased with increase in temperature, Fig. 4-5(b). At
temperatures in the vicinity of 700°C, the volume fraction of twins was quite small (< 3%)
even at large strains, eI - 0.8. In this temperature regime, < c + a >-slip on pyramidal
planes of the {1011} and {1122} families (see Fig. 4-2) has been observed to provide straining
along the c-axis (Paton and Backofen [1970]; Williams and Blackburn [1968]). Since the
focus of this study is the deformation of titanium single- and polycrystals in the vicinity of
750°C, attention is confined to plastic deformation solely by crystallographic slip.
In summary, at elevated temperatures, generalized plastic flow is maintained through
< a >-slip on the prismatic, pyramidal and basal planes in conjunction with < c + a >-slip
on the pyramidal planes. It is important to note that even at high temperatures, < c + a >-
95

slip is a significantly harder mode of deformation. As a consequence, the crystals in a
polycrystalline aggregate are to some degree still kinematically restricted.
4.1 Single Crystal Constitutive Model
The mathematical framework for the constitutive model of hexagonal materials is the same
as that for the face-centered-cubic and body-centered-cubic materials described in Chapter
2. For the sake of clarity, the same is summarized below.
The constitutive equation for stress is given in terms of the linear elastic relation:
T = C [Ee], (4.1)
where
Ee _ (1/2) {FeTFe- 1} and T* (detF e ) Fe-lTFe-T (4.2)
are the work-conjugate elastic strain and stress measures, respectively, and C is a fourth-
order anisotropic elasticity tensor. Fe is an elastic deformation gradient defined by
Fe FFp - i, det Fe > 0, (4.3)
where F is the deformation gradient and FP is the plastic deformation gradient with
det FP = 1.
Hexagonal materials exhibit transverse isotropy in their elastic behavior. As a result,
five independent elastic constants are required to describe the anisotropic elasticity tensor
C . These five constants are defined as follows,
Cll = (elc ® elc) C[elc ® elc],
C12 = (elc ® elc) C[e2 e2C],
C13 = (el c elc) · C[e3c ® e3c],
C33 = (e3c ® e3c) C[e3 X e0C],
C55 = (el c ® e3c) - C[2 sym {elc ® e3C}],
with C22 = C1 1, C23 = C13 , C44 = C33 and C66 = (C - C1 2). In eqns. 4.4-4.8, eic,
96
(4.4)
(4.5)
(4.6)
(4.7)
(4.8)

i = 1,2,3 is an orthonormal basis aligned with the [210], [1010], [0001] directions of the
hcp crystal lattice, respectively, Fig. 4-1(b). The values of these constants for a variety of
materials are tabulated as a function of temperature in Simmons and Wang [1971].
The evolution equation for the plastic deformation gradient is given by the flow rule:
PF - 1 = a So, SO -- m ® na, (4.9)a
with mc and no denoting the slip direction and the slip plane normal of the slip system a,
respectively, defined in the fixed reference configuration.
The components of the slip plane normals and slip directions with respect to an
orthonormal basis, as defined in Fig. 4-1(b), for the three basal-< a > (0001) < 1120 >, the
three prismatic-< a > {1010}' < 1120 >, the six pyramidal-< a > {1011} < 1120 >,
the twelve pyramidal-< c + a > {1011} < 1123 > and the six pyramidal-< c + a >
{1122} < 1123 > slip systems are presented in Tables 4-4, 4-5, 4-6, 4-7 and 4-8 respectively.
For the high-temperature isothermal deformation of titanium, a simple power-law for
the plastic shearing rate -ja on a slip system is adopted:
ja =~ - ,l sign(r'); t Aexp (- (4.10)
where )y is a reference plastic shearing rate, r' and s are the resolved shear stress and
the slip system deformation resistance respectively on the slip system a and the material
parameter m characterizes the material rate-sensitivity.
Finally, the slip system resistance is taken to evolve as:
hat= Z ha jy (4.11)
where had describes the rate of strain hardening on slip system a due to shearing on the slip
system /l; it describes both self-hardening and latent-hardening of the slip systems. Each
element ha/d in this matrix depends on the deformation history. It is fair to state that the
characterization of these instantaneous hardening moduli ha ~ for hexagonal crystals is a
formidable task if not an impossible one. For example, in a titanium crystal deforming
by three equivalent basal-< a > (0001) < 1120 >, three equivalent prismatic-< a >
{0100} < 1120 >, six equivalent pyramidal-< a > {1011} < 1120 >, the twelve equivalent
97

pyramidal-< c + a > {1011} < 1123 > and the six equivalent pyramidal-< c + a >
{1122} < 1123 > slip systems, there are 900(= 30 x 30) elements in this matrix that
need to be specified!
In order to obtain a tractable description of the crystal hardening, the following simple
form for the slip system hardening matrix had is adopted:
hap = qaf hP (4.12)
Here, hE denotes the self-hardening rate and qa is a matrix describing the latent hardening
behavior of a hexagonal crystal.
Very little information is available in the literature regarding the latent hardening
behavior of titanium crystals. Hence, a simple description for the matrix qa3 is adopted:
0qa/ ( 1 if a! and p are coplanar slip systems, (4.13)
q otherwise.
The following is the set of coplanar slip systems:
(i) the three basal slip systems:
{(0001)[1120], (0001)[2110], (0001)[1210]}
(ii) the six sets of first-order pyramidal slip systems:
(1011) [210], (1011) [2113], (1011) [11i23]},
(01l) [2110], (0111) [1i23], (0111) [1213]},
{(i101)[I120], (101)[1213], (101)[2113]},
{(1i011)[1210], (011)[213], (011)[1123]},
{(0111) [2110], (011)11 123], (0111) [1213]},
{ (1101)[112013], (10)[23], (101)[2113]}.
The parameter q could in general be different for different types of slip system pairs,
e.g., q for the interaction between basal-< a > and prismatic-< a > slip could be different
from q for the interaction between basal-< a > and pyramidal-< a > slip. Due to lack
of the relevant data, the same value of ql is assumed for the interaction between any two
non-coplanar slip systems. Also, any history-dependence of qj is neglected; q is taken to be
a constant for all deformation histories.
As in the case for the cubic crystals, the self-hardening rate h3 is taken to be given by
98

the following saturation form:
ha- ha 1-s sign - (4.14)
For hexagonal materials, the initial hardening rate ho and the saturation slip deformation
resistance s may in general be different for different families of slip systems. Also, for
situations involving large changes in strain rates and/or high temperatures, the saturation
value s cannot be taken as a constant. Therefore, the following phenomenological form
(Anand [1982]) is employed for the saturation value s:
s -- (2_)n (4.15)
where and n are slip system parameters which may be different for different families of
slip systems. The parameter m measures the instantaneous rate-sensitivity while m + n
measures the total macroscopic rate sensitivity in a strain-rate jump test.
The single crystal constitutive model has been implemented in a user-material subroutine
for ABAQUS/Standard.
4.2 Study of Single Crystal Response
In this section, the single crystal constitutive model is evaluated in terms of its predictions
for stress-strain response, slip system activity and evolution of the crystal lattice orientation
for monotonic tension of a high-purity titanium single crystal at 750C. The predictions are
compared with the experimental results of Akhtar 1975a].
The values of elastic parameters for single crystal h.c.p. titanium at 750C are taken as
(Simmons and Wang [1971]):
C11 = 125.3 GPa, C12 = 99.4 GPa, C13 = 68.8 GPa, C3 3 = 154.5 GPa, C55 = 31.6 GPa.
Fig. 4-6(a) shows the standard (0001) stereographic projection for titanium with the
important poles. The location of the loading axis for the initial orientation chosen by Akhtar
is shown as A inside the primary stereographic triangle in Fig. 4-6(b). This orientation is
given by the following three Euler angles in the notation of Kalidindi et al. [1992]:
99

9 w
430 280 00
The crystal was oriented such that basal-< a > slip initiated the plastic flow. Akhtar
measured the change in resolved shear stress on the active basal system and the evolution
of the crystal lattice orientation with strain, which are shown in Figs. 4-7(a) and 4-7(b)
respectively. He observed that the specimen deformed up to a resolved shear strain of
0.48 with virtually no work hardening at which point the resolved shear stress decreased
gradually by roughly 30%, Fig. 4-7(a). Also, he noticed that the tensile axis initally rotated
towards the [1120] direction (A to B in Fig. 4-7(b)). At a shear strain (resolved on the
basal slip system B1) of x 0.48, the lattice reoriented sufficiently to activate prismatic-
< a > slip. As a result, the tension axis changed its direction of rotation towards [2110],
the slip direction for the prismatic slip system (B to C in Fig. 4-7(b)). Akhtar reports
that there was no evidence of pyramidal-< a > for this orientation. Accordingly for the
simulation, only basal-< a > and prismatic < a > slip systems are considered. Also, based
on Akhtar's observation that there was very little work-hardening, the slip systems are
assumed to be non-hardening.
The the slip system deformation resistance on the basal-< a > and prismatic-< a > slip
systems are taken to be 8 MPa and 6.5 MPa, respectively. These values provide a reasonably
good fit for the resolved shear stress -shear strain response. The reference shearing rate is
taken to be - = 0.001sec- 1. The macroscopic strain-rate sensitivity of polycrystalline h.c.p.
titanium at 750C has been measured by a true strain-rate jump test in simple compression
(see Fig. 4-8). The rate-sensitivity parameter obtained from this test is m = 0.16. The
same value of m is assumed for our single crystal simulations.
The finite element calculation was carried out in ABAQUS/Standard. The finite element
mesh contained 20 ABAQUS-C3D8 elements, as shown Fig. 4-9(a). In accordance with
Akhtar's experiment, the simulation is performed at a constant true tensile strain rate
of 1.66 x 10⁻⁴sec-1 in the e3 direction. The top and the bottom X3 faces of the mesh
are constrained to remain parallel to each other and perpendicular to the straining axis.
Fig. 4-9(b) shows the deformed mesh. The deformation is reasonably homogeneous in the
central portions of the mesh. The following analysis is based on the response of an element
in this region of the mesh. Figs. 4-10(a) and 4-10(b) show the slip system activity and
100

the evolution of the crystal orientation with straining, respectively. Initially, the basal slip
system B1 is activated, Fig. 4-10(a). This results in the rotation of the tension axis towards
[1120], Fig. 4-10(b). At e 0.2, the prismatic slip system P2 becomes active, Fig. 4-10(a),
with an attendant rotation in the tension axis towards [2110], the slip direction for the slip
system P2 as shown in Fig. 4-10(b). With continued straining, the activity on the basal slip
system B1 is significantly reduced, Fig. 4-10(a). On approaching the 0001 - 1010 boundary,
another prismatic slip system P3 is activated. This results in the rotation of the tension
axis towards the (1010) pole. Fig. 4-10(c) shows the comparison of the predictions of the
resolved shear stress - shear strain response with the experimentally measured response.
The predictions are in very good agreement with the experiment. The model captures the
drop in the resolved shear stress at e 0.5 accurately.
4.3 Polycrystalline Plasticity of h.c.p. Titanium
In this section, we study the deformation of polycrystalline commercially-pure titanium
at an elevated temperature. Simple compression, simple tension, plane-strain compression
and tubular torsion experiments have been conducted on commerically-pure polycrystalline
titanium at 7500 C. The measured stress-strain response and evolution in crystallographic
texture are presented. The operative slip-systems are inferred from the observed textural
evolution. Finite element simulations of these simple deformations are performed on an
aggregate of grains and the predictions of the evolution in crystallographic texture and the
macroscopic stress-strain behavior are compared with experimental observations.
4.3.1 Simple Tension and Simple Compression of CP-Titanium at 750°C
Experimental Results
Nominally homogeneous tension and compression experiments have been performed on
commercially-pure polycrystalline titanium (98.88% pure) at 7500C. The titanium stock
used for all the experiments discussed below was obtained in the form of a 0.5" diameter
rod.
The as-received rod was sectioned and polished to a mirror-finish. The polishing
procedure adopted is outlined in Appendix C. The polished surface was then etched with
Kroll's reagent (1-3 mL HF, 2-6 mL HNO3 and 100 mL H2 0) to reveal the grains. Fig. 4-11
101

shows the micrographs for the longitudinal and transverse sections of the rod. The average
grain diameter was determined to be approximately 110pm.
Samples were also prepared from the as-received titanium stock for the measurement of
the initial crystallographic texture. The procedure employed for the measurement of the
texture is presented in detail in Appendix C. Fig. 4-12 shows the (0001), 10il and {1120}
pole-figures for the as-received titanium rod. We observe that the rod possesses a strong
texture with the basal planes aligned nearly perpendicular to the rod axis and the < 1120 >
directions along the rod axis.
After machining the specimens from the rod and prior to the experiments, the specimens
were annealed in an atmosphere of argon. The annealing schedule comprised of heating the
specimens to 750C, holding them at that temperature for 45 minutes, and then furnace
cooling the samples to room temperature (ASM Handbook Vol. 4 [1990]). The state of the
annealed specimen was characterized by measuring its grain size and the crystallographic
texture. Micrographs of the annealed sample are presented in FIg. 4-13. The grains were
reasonably equiaxed and the average grain diameter was approximately 175jtm. Fig. 4-14(a)
shows the (0001), 1011} and 1120} pole-figures for the annealed titanium sample. On
comparing the texture of the annealed specimen against that of the as-received specimen,
Fig. 4-12, we observe that a significant portion of the initial texture of the as-received rod is
retained after annealing. For the finite element simulations to be presented in later sections,
the texture of the annealed rod is represented by a set of 729(= 93) unweighted discrete
grain orientations as shown in Fig. 4-14(b). It is important to note that due to the lower
symmetry of the hexagonal crystal, a smaller collection of grains for the polycrystalline
aggregate would result in an artificially stiff response.
Two servo-hydraulic test systems manufactured by Instron Corporation were used to
perform all the experiments presented. The first is a Model 1322 tension/torsion machine
equipped with a high-temperature, vacuum furnace3 . Maximum vacuum attainable is
approximately 10-6 torr. Heating is provided by a cylindrical heating zone consisting of
tungsten mesh heating elements surrounded by a multiple layer set of molybdenum heat
shields. A Type R thermocouple {Platinum-13% Rhodium (+) versus
platinum (-)} spot welded to a titanium piece and placed close to the specimen served as
the feedback transducer to the temperature controller. The maximum load capacities of
3 The furnace was built by Centorr Associates, Suncook, New Hampshire.
102

the axial thrust cell and the torque thrust cell are 10,000 lbs and 10,000 lbs-in respectively.
The second test system features a custom manufactured high stiffness biaxial test frame.
The load capacity of the frame is 50,000 lbs/20,000 lbs-in. Heating for experiments on this
machine was provided through an Ameritherm Induction Heating System. The induction
heating coil was approximately 1" in diameter with 5 turns, made of 0.25" diameter copper
refrigeration tubing. Power was supplied by a 5KW self-tuning generator. The temperature
was controlled with the aid of feedback from a K-type thermocouple spot-welded to the
specimen in the gage-section by a Electromax V General-Purpose Single-Loop Controller
from Leeds and Northrup Instruments. The hydraulic grips of the testing machine were
water cooled making the ends of the specimens significantly cooler than the gage section.
However, the specimen was heated uniformly in its gage section.
Simple Compression
The simple compression experiments were performed at 750C, 5 x 10⁻⁶ torr in the
Model 1322 Instron machine. Low thermal-conductivity 94% alumina ceramic rods were
used for loading in compression. Compression platens used for the experiments were made
from either TZM (Mo-Ti-Zr alloy) or MA956 (Fe-Cr-Al-Ti high-temperature superalloy).
The platens were polished before each experiment to provide a smooth compression surface.
Compression specimens were initially 0.4" in diameter and 0.6" tall with the compression
axis along the rod axis. Shallow concentric grooves were machined on the end-faces of the
compression specimens to hold special high-temperature lubricant as shown in Fig. 4-15.
The lubricant used was boron nitride 4 and powdered glass 5 (glass classification code: 0010)
mixed in the ratio of 1:4 by weight (Brown, Kim and Anand [1989]). The lubricant mixture
was suspended in a medium of methyl alcohol and applied to the specimen ends. On drying
a thin layer of the lubricant mixture was deposited uniformly over the specimen end-faces.
The specimens deformed (with only a slight roll-over) to a true strain of-1.0, at a constant
true strain rate of -0.001 sec -1. After the completion of the test, the specimens were allowed
to cool6 in the furnace under vacuum.
The measured stress-strain 7 response for the compression test is shown in Fig. 4-17.
4Boron Nitride powder, grade HCP, was purchased from Union Carbide Corporation.5Glass was purchased as a powder from Corning corporation, Corning, New York.6 The typical duration for the deformed specimen to cool down to room temperature was approximately
30 minutes.7The measured compressive strains were corrected for the compliance of the load-train in the test setup.
103

The initially circular cross-section of the specimen did not remain circular with progressive
deformation due to the strong anisotropy of the initial texture. Fig. 4-18 shows the change
in the shape of the cross-section with deformation.
In order to ascertain that crystallographic slip is the predominant contributor to plastic
deformation in polycrystalline h.c.p titanium at high temperatures, the microstructure in
the specimens deformed to a true strain of -1.0 were studied. There were very few twins in
the deformed sample.
The deformed specimens were cut approximately along the mid-plane perpendicular to
the compression axis, polished and the crystallographic texture was measured. Fig. 4-19
shows the measured (0001), {1011} and {1120} pole-figures at a true strain of-1.0. The
directions el, e2 and e3 in the global basis are aligned with the directions of the material
axes, e, e and e', respectively, which are illustrated in Fig. 416.
An inverse pole-figure of the compression axis provides more insight into the deformation
mechanism leading to the evolution in texture. An inverse pole-figure plot is a representation
of a particular sample direction with respect to crystal coordinates. Since the crystal bases
of each crystal in a polycrystalline aggregate are oriented differently, the same specimen
direction projects differently in different crystals. Hence, the inverse pole-figure plot is the
distribution of a given sample direction when referred to the crystal bases.
The inverse pole-figure of the rod-axis for the deformed specimen at strain levels of 0,
-0.5 and -1.0 are presented in Fig. 4-20. We observe that on straining, the compression axes
at A migrate towards the 0001 - 1210 boundary, shown as the dashed lines from A to B in
Fig. 4-20. On approaching the boundary, the compression axes rotate along the boundary
towards the (0001) pole (B to C in Fig. 4-20). At a true strain of -1.0, the (0001) planes of
the crystals are approximately 45° from the compression axis.
Simple Tension
The simple tension experiments were performed at 750°C. The specimen was induction
heated in air. The tension specimen geometry is shown in Fig. 4-21. The gage section was
1" long and 0.25" in diameter. The tension test was performed at a nominal strain rate
of 0.001 sec - 1. The true-strain in the gage-section at any point in the deformation was
calculated based on the the cross-head displacement.
The measured stress-strain response is shown in Fig. 4-22. The gage-section deformed
without necking up to a true strain of 0.3. The initially circular cross-section ovalized with
104

deformation suggesting a strong anisotropy. Lii et al. [1970] have also reported pronounced
ovalization of their tension specimens with similar initial texture. The initial and deformed
cross-sections of the specimen are shown in Fig. 4-23.
Fig. 4-24 shows the (0001), {1011} and {1120} pole-figures at a true strain of 0.3. The
inverse pole-figure of the rod-axis for the deformed specimen at strain levels of 0, 0.2 and 0.3
are presented in Fig. 4-25. The tension axes migrate from a predominant [1210] direction
towards 0001 - 1100 boundary (A to B in Fig. 4-25). At large strains, the tension axis is
aligned in the neighborhood of the (1100) pole in most crystals.
Finite Element Simulations
In this section, full three-dimensional finite element simulations for simple compression and
simple tension are performed. A continuum material point in a polycrystalline aggregate
is represented by a 3D finite element mesh in which each element represents a grain. We
numerically represent the initial texture by 729 discrete grain orientations, shown in Fig. 4-
14. The set of grain orientations is randomly assigned to the elements (see Fig. 4-27(b)).
In these simulations, both compatibility and equilibrium are satisfied in the "weak" finite
element sense over the entire polycrystalline aggregate.
In order to identify the operative slip systems, simulations are carried out with different
assumptions for the operative slip systems. The predictions for the evolution in texture
are compared with the experimental measurements for each case. In these simulations, the
individual slip systems are assumed to be non-hardening 8. After identifying the operative
slip systems, hardening is introduced on the different slip systems and the predictions of the
stress-strain response and texture evolution are compared with the experimental results.
Identification of the Operative Slip Systems
In Appendix D, some simulations for a specially oriented single crystal which is
representative of the initial texture observed in the annealed rod are shown. The calculations
show that during simple compression basal-< a > slip rotates the compression axes towards
the (0001) pole while prismatic-< a > slip or pyramidal-< a > slip rotates the compression
axes towards the 0001 - 1210 boundary. During simple tension, basal-< a > slip rotates th.
tension axes towards the 1100 - 1210 boundary while prismatic-< a > slip or pyramidal-
8We do not expect the qualitative aspects of the texture to change significantly due to slip systemhardening.
105

< a > slip rotates the tension axes towards the 0001 - 1100 boundary. The inverse pole
figure plot for simple compression, Fig. 4-20, shows initial rotation of the compression axes
towards the 0001 - 1210 boundary (A to B) indicating the presence of prismatic-< a >
and/or pyramidal-< a > slip. On approaching the 0001 - 1210 boundary, the compression
axes migrate along the boundary towards the (0001) pole indicating the operation of basal-
< a > slip systems. The inverse pole figure plot for simple tension, Fig. 4-25, shows the
rotation of the tension axes from the [1210] direction towards the 0001 - 100 boundary
(A to B) consistent with the rotations brought about by the operation of prismatic-< a >
or pyramidal-< a > slip systems. In summary, the evolution of texture during simple
tension and simple compression indicate the presence of basal-< a > slip in conjunction
with prismatic-< a > and/or pyramidal-< a > slip. Since Akhtar did not observe any
pyramidal-< a > slip in his experiments on single crystals in a wide range of orientations,
the possibility of absence of pyramidal-< a > slip is also considered in the simulations.
In order to identify the operative slip systems, simple compression and simple tension
simulations are performed for each of the following cases:
(A) All 5 families of slip systems: Basal (0001) < 1120 >, Prismatic {1010} < 1120 >,
Pyramidal {1011} < 1120 >, Pyramidal {1011} < 1123 > and
Pyramidal {1122 < 1123 > slip systems.
(B) All families of slip systems with the exclusion of pyramidal-< a > slip: Basal
(0001) < 1120 >, Prismatic {1010} < 1120 >, Pyramidal {1011i < 1123 > and Pyramidal
{1122} < 1123 > slip systems.
All the slip systems are assumed to be non-hardening. With regards to the slip system
deformation resistances, for the basal-< a > and prismatic-< a > slip systems, Akhtar's
observations suggest that the ratio of the two deformation resistances 1 at elevated
temperatures, as shown in Fig. 4-26. Accordingly, the same deformation resistance is
assumed for both these families of slip systems. There is very little information available
in the literature regarding the critical resolved shear stress for pyramidal-< a > slip at
high temperatures. Rosi, Perkins and Seigle [1956] have reported some activity on these
slip systems at 8000C but the authors do not report the critical resolved shear stress. In
the simulations, the deformation resistance for the pyramidal-< a > slip systems is taken
to be the same as that for the prismatic-< a > and basal-< a > slip systems. Regarding
pyramidal-< c + a > slip, Paton and Backofen's [1970] measurements of yield strengths at
106

750°C in titanium single crystals oriented parallel to c-axis, where pyramidal-< c +a > slip
is the only mode of deformation, and perpendicular to the c-axis, where prismatic-< a >
slip is operational, indicate that the deformation resistance on the pyramidal-< c + a >
systems is 10-15 times that of the prismatic-< a > slip systems. For the simulations, the
value of the deformation resistance for the pyramidal-< c+a > slip systems is assumed to be
10 times that for the prismatic-< a > slip systems. Table 4-1 summarizes the assumptions
made above.
Table 4-1. Deformation resistances for different slip systemsso so so so
(0001) < 1120 > {1010} < 1120 > {1011} < 1120 > {1011} < 1123 > +{1122} < 1123 >
so so so 10 so
The value for so is determined by fitting the experimentally measured yield strength
in compression. For the strain-rate sensitivity parameter m, the value measured from the
strain-rate jump test, m=0.16, is used. The material parameters used in the simulations
are tabulated in Table 4-2.
Table 4-2. Material Parameters for h.c.p. Titanium (Non-hardening)0so so so so ho m
(0001) < 1120 > {1010} < 1120 > {1011 < 1120 > 1011} < 1123 > +{1122} < 1123 >
8.2 MPa 8.2 MPa 8.2 MPa 82 MPa 0 0.16
The polycrystalline aggregate is represented by a 3D-Finite Element Mesh comprising
of 729 (93) ABAQUS-C3D8 elements, as shown in Fig. 4-27(a). This mesh represents
one-eighth of a rectangular parallelopiped specimen. Each element represents a grain and
is assigned an orientation which is chosen randomly from the set of 729 orientations. All
the nodes on the planes X1 = 0, X2 = 0 and X3 = 0 have zero displacements in the 1, 2 and
3 directions, respectively. All the nodes on the top X3 face are moved in the e3 direction at
a constant true strain rate of -0.001sec- 1 for the simple compression simulation, and at a
nominal strain rate of 0.001sec- 1 for the simple tension simulation. Deformed finite element
107

meshes at late stages of the simulation are shown in Fig. 4-27(b) for compression and in
Fig. 4-27(c) for tension. The deformation of the aggregate is highly non-homogeneous as is
evident from the shape of the deformed finite elements.
The predicted macroscopic stress-strain curves for simple compression for the cases (A)
and (B) are shown in Fig. 4-28. The predicted crystallographic texture for each of the case
along with the experimentally measured texture is shown in Fig. 4-29. The stress-strain
response in both the cases show initial geometric softening. The nature of the stress-strain
curve is similar in both the cases; however, due to the additional slip systems available in
case (A), there is an attendant decrease in the flow-stress levels. We observe that there is
very little difference in the texture prediction for both cases, Fig. 4-29. Both predictions
agree reasonably well with the experiment. These observations suggest that either of the
assumed cases for the operating slip systems are plausible.
The predicted macroscopic stress-strain curves for simple tension for the cases (A) and
(B) are shown in Fig. 4-30. The stress-strain response for both cases are similar but for
a slight decrease in flow-stress levels for case (A). The measured and predicted texture for
each case along with the experimentally measured texture is presented in Fig. 4-31. The
texture prediction for case (B) matches the measured texture more closely. In particular,
the presence of pyramidal < a > slip systems in case (A) accentuates the concentration
of {1120} poles along the tension axis. However, the measured texture shows a high
concentration of {1120} poles 10- 15° from the tension axis. This feature is well-captured
with the assumption of basal-< a >, prismatic-< a >, 1st-order pyramidal-< c + a > and
2nd-order pyramidal-< c + a > slip systems. Hence, for the simulations that follow we
consider only these four sets of slip systems.
Simulation of Simple Compression and Simple Tension with Hardening
Based on the study in the previous subsection, the operative slip systems are taken
to be the basal-< a >, prismatic-< a >, 1st order pyramidal-< c + a > and 2nd order
pyramidal-< c + a > slip systems.
For the slip system hardening, the forms presented in equations (4.12), (4.14) and (4.15)
are adopted. Due to lack of relevant data, the initial hardening rate ho is assumed to be the
same on all the slip systems. Also, the saturation parameter is taken to be the same for
the basal-< a > and prismatic-< a > slip systems and 10 times this value for the pyramidal-
< c + a > systems. Since there is very little information available in the literature regarding
108

the nature of latent hardening in titanium crystals, simple tension and simple compression
simulations have been performed with different values for the latent hardening parameter ql
in the range 9 , 0 q < 1.5. The simulations and results are presented in Appendix E. The
study indicates that there is very little effect of changes in the latent hardening parameter
qj on the crystallographic texture evolution. The value, qt = 1, is chosen for the simulations
in the following sections.
The material parameters so, ho, 9 and r are determined by fitting the model to the
measured stress-strain response in simple compression. The parameters m and n are
determined by fitting the model to the strain-rate jump test. The curve-fits are shown
in Fig. 4-32. The fits yield the following set of parameters:
Table 4-3. Material Parameters for h.c.p. Titaniumso 50 _ so ho r m n ql
(0001) < 1120 > {010} < 1120 > {1011} < 1123 > +{1122} < 1123 >
8.2 MPa 8.2 MPa 82 MPa 12 MPa 1 0.16 0.1 1
(0001) < 1120 > {1010} < 1120 > {10i < 1123 > +(0001) < 1120 > {10i0} < 1120 > {10i1} < 1123 > +
{1122} < 1123 >18 MPa 18 MPa 180 MPa
Figs. 4-33 and 4-34 show the comparison of the predicted texture with the measured
texture at e=-0.5 and e=-1, respectively. The predictions agree closely with the experimental
results.
Fig. 4-32 also shows the prediction of the stress-strain response for the case when
pyramidal-< c a > slip is absent. We observe a severe locking in the stress-strain
response. This highlights the significant role played by the pyramidal-< c + a > slip
systems. Although the deformation resistance of these slip systems are substantially higher
9In choosing the range of values for ql, we were guided by observations in cubic crystals where this valuehas been experimentally determined to lie in the range, 0 < q < 1.5.
109

than that of the basal-< a > and prismatic-< a > slip systems, pyramidal-< c + a > slip
has a profound effect on the stress-strain response of the polycrystalline aggregate. However,
the slip activity on the pyramidal-< c + a > systems is substantially lower than that on
the basal-< a > and prismatic< a > systems. Hence, pyramidal-< c + a > slip has only a
slight influence on the texture evolution.
The parameters estimated from the fit to the simple compression experiment are used
to predict the stress-strain response and texture evolution for simple tension. Fig. 4-35
shows the comparison between the predicted and the measured stress-strain response. The
prediction is in very good agreement with the experimental result. The predicted textures
at e-=0.2 and E=0.3 are compared against the measured textures in Fig. 4-36 and Fig. 4-37,
respectively. We observe important changes in texture in deforming from =0.2 to e-=0.3.
The 1120} poles are aligned very close to the tension axis at e=0.2. When deformed to
e=0.3, the {1120} poles rotate by 10 - 150 from the tension axis. These changes in texture
are accurately captured by the model.
The predictions of the stress-strain curves along with the corresponding measurements
for the simple compression and simple tension experiments are presented in Fig. 4-38. We
observe from Fig. 4-38(a) that at a large strain-level of IEI ; 0.3, the flow-stress level for
tension is higher than that for compression. This is due to the difference in the evolution of
texture in the two situations. The calculations correctly predict this difference, Fig. 4-38(b).
4.3.2 Plane-Strain Compression of CP-Titanium at 750°C
Experimental Results
In order to probe the capability of the model to predict the stress-strain response and
textural changes in other deformation modes, plane-strain compression experiments have
been conducted on specimens machined from the rod. The plane-strain compression
experiments were performed at 750C in the Model 1322 Instron Machine under high
vacuum. Fig. 4-39 shows a schematic of the plane-strain compression apparatus. The die
and the plunger were machined from MA956. The die was seated on an alumina ceramic
rod. The load was applied on the plunger through another ceramic rod. All the specimens
were cubes with a side-length of 0.3". The tests were performed at a constant true strain
rate of -0.001 sec - 1. An attempt was made to minimize the friction between all contacting
110

surfaces by the application of boron nitride-powdered glass mixture. However, frictional
effects became significant at large strains, resulting in roll-over of the specimen sides.
The plane-strain compression samples were cored out from the rod as shown in Fig. 4-40.
The el, e2 and e3 directions of the global basis are aligned with the directions e, e and
e3, respectively, of the material basis. Two types of plane-strain compression experiments
were performed on the samples: (A) The compression direction was aligned with the rod
axis, e was the constraint direction and e'2 was the free direction; (B) The compression
direction was aligned with the rod axis, e' was the constraint direction and e' was the free
direction.
The measured stress-strain curves for the two types of tests are shown in Fig. 4-42. The
plane-strain compression test with e as the constraint direction shows a higher level of
flow-stress. The texture measured at e=-0.9 for the two tests are shown in Fig. 4-43.
Finite Element Simulations
Full 3D-finite element simulations are performed on the same finite element mesh, Fig. 4-
41(a), as was used for the simple compression and simple tension simulations. e3 is the
loading direction for both types of plane-strain compression simulations. All the nodes on
the bottom X3 face are fixed in the e3 direction and the nodes on the top X3 face are
moved in the e3 direction. In addition, for the first simulation, all the nodes on the outer
faces normal to the el direction have zero displacements in the el direction, while in the
second simulation, all the nodes on the outer faces normal to the e2 direction have zero
displacements in the e2 direction.
Figs. 4-41(b) and 4-41(c) show the deformed meshes for the plane-strain compression
simulations with e' and e' as the constraint direction, respectively. The predicted stress-
strain response for the two cases are compared against the corresponding experimental
results in Fig. 4-44. In both cases, the predicted initial flow-stress levels agree reasonably
with the corresponding experimental result for e < 0.5. But, at larger strains, the model
underpredicts the flow stress by a significant amount. The comparison of the predicted and
measured textures at =-O.9 is presented in Figs. 4-45 and 4-46. The predictions are in
reasonable first-order agreement for both cases.
The observed roll-over in the specimen at large strains and the attendant increase in
the measured flow-stress suggest the presence of significant friction between the contacting
111

surfaces. Hence, both the calculations have been repeated with a friction coefficientl ° of
p = 0.05 between all contacting surfaces. The predictionsll of the stress-strain response are
now in better agreement with the measurements, as shown in Fig. 4-47. The predictions of
the texture at e=-0.9 are shown in Figs. 4-48 and 4-49.
4.3.3 Tubular Torsion of CP-Titanium at 750°C
Experimental Results
Fixed-end, tubular torsion experiment has been conducted at 7500C. The initial geometry
of the torsion specimen is shown in Fig. 4-50. The tubular specimen has an inner diameter
of 6.35 mm and an outer diameter of 8.89 mm in the gage section. Two important geometric
ratios in the tubular torsion experiment are l/d and d/t, where 1, d and t denote the gage
length, the mean diameter and the wall thickness, respectively. A large d/t ratio ensures a
reasonably uniform shear strain distribution through the wall. For our specimen geometry' 2,
d/t = 6. The shear strain distribution in the wall is only approximately uniform. A large
l/d ratio can cause the specimen to buckle. The specimen had a lid ratio, 0.67. The
specimen was twisted to a nominal shear strain of 1.0. The specimen walls did not buckle
during the deformation. The rate of twisting was such that the nominal shear strain rate
was 0.001sec - 1. The shear stress was evaluated using the torque measurements through the
following relation:2
-r = td2 Torque (4.16)
where t is the gage section thickness and d = (di + do)/2 is the mean diameter of the gage
section. The normal stress was evaluated as:
Axial Load (4.17)rdt
The crystallographic texture was measured by grinding flat and polishing a location on the
radius of the gage section such that the measurement surface was perpendicular to the e',
l°In the presence of friction, the overall stress-strain respsonse is sensitive to the aspect ratio of the finiteelement mesh. Hence, the aspect ratio of the mesh is taken to be the ratio in the samples in our experiments.
l The results indicate that the use of an evolving coefficient of friction could further improve thepredictions. But, such a task is not undertaken here.
12 The outer diameter of the gage section was limited by the diameter of the rod and the wall thicknesswas made large enough to accomodate 10-15 grains through the thickness. Starting with a 0.5" diameterrod, this was the optimum geometry that could be obtained.
112

direction of the material axes.
Finite Element Simulations
The finite element simulation is performed on a 3D finite element mesh13 containing
720 elements, shown in Fig. 4-51(a). Note that the initial texture, Fig. 4-14(a), is not
axisymmetric about the specimen axis, e3. Figs. 4-52(a) and (b) show the pole-figures
(viewed along a direction perpendicular to the plane of shear) for the situation when 2 - 3
is taken to be the plane of shear and the situation when 1 - 3 is taken to be the plane of
shear, respectively. The two sets of pole-figures are quite different. This poses a problem in
choosing the plane and direction of shear while approximating the torsion by a simple shear
simulation. We overcome this problem by carrying out a full 3D simulation of torsion.
The l/d and d/t ratios used for the simulation correspond to those of the experimental
specimen. In the simulation, the nodes on the bottom X3 face are fixed in the el, e2 and
e3 directions. The nodes on the top X3 face are fixed in the e3 direction and prescribed
a twisting motion about the axis of the torsion specimen with the twist rate used in the
experiments. Fig. 4-51(b) shows the deformed mesh at a nominal shear strain of = 1.
Fig. 4-53 shows the calculated shear stress and normal stress response compared against
the corresponding experimental measurements. The predictions match closely with the
experiments up to a shear strain of y = 0.5. In particular, the model captures the sign
of the normal stress response. The sign of the normal stress is an outcome of the initial
texture of the torsion specimen. Bronkhort et al. [1992] observed a compressive normal
stress in their fixed-end thin-walled tubular torsion experiments on f.c.c. copper with an
isotropic initial texture. It is interesting to note that the normal stress for the torsion test
on titanium is tensile. This can be attributed to the strong "rod-type" initial texture in this
case. For y > 0.5, the model slightly overpredicts the shear stress. Also, the calculations
show a decrease in the the normal stress level at a smaller shear strain than that observed
in the experiments. The agreement could be improved by an increase in the number of
grains used to represent the sample. A comparison of the experimentally measured and
calculatedl4 textures is presented in Fig. 4-54. The predictions are in close agreement with
13In order to capture any strain gradients that may occur through the thickness of the gage section, 5elements were used along this direction.
14The texture was calculated from a set of 180 grains that were approximately perpendicular to the globalel direction in the deformed configuration.
113

the measurements.
In conclusion, the constitutive model captures fairly accurately the anisotropic stress-
strain response and the evolution of crystallographic texture in h.c.p. titanium under
nominally homogeneous deformations to large strains at high temperatures. To the best of
our knowledge, this is the first-time a combined experimental and computational effort of
this nature has been carried out to study the deformation of hexagonal materials.
114

Table 4-4. Basal Slip Systems (0001) < 1120 >a Miller-Bravais [no] c [mle Label
Notation
1 (0001)[1120] 0 0 1 _- 0 B1
2 (0001)[2110] 0 0 1 0 B2
3 (0001)[1210] 0 0 1 -1 0 0 B3
Table 4-5. Prismatic Slip Systems {0100} < 1120 >a Miller-Bravais [noa]C [moa l Label
Notation
1 (1010)[i2i0] 0 1 0 1 0 0 P1
2 (0110)[2110] 0 0 P22 22
3 (1100)[1120] - - ° P32 2 2
Table 4-6. Pyramidal < a > Slip Systems {10il} < 1120 >a Miller-Bravais [no c [moa ]c Label
Notation
1 (1011)[1210] 0 2c V- Za 1 0 0 R1
2 (01i11)[2110] vc _ c IVS 2 s 0 R2
4c2 3a2 /4+3a 4c+3a2 -2 23 (1101)[120] 3 C3a O R3
41 (1011)[1210] 0 2c 2 V3a -1 0 0 R4/4C2+3a2/4C2 _ -3O R5 (0i11)[2ii0] - 3ic c3- 3 o R5/4c 2+3a2 4+3a 2 4c2+3a2 2 2
6 (1io01)[1120 v'c C va _v 0 R6-4-+3a C 4c2+3a 2 2 2
115

Table 4-7. Pyramidal < c + a > Slip Systems {1011} < 1123 >Miller-Bravais
Notation
(1011)[2113]
(0111)[1123]
(1101)[1213]
(1011)[2113]
(0111)[1123]
(1101)[1213]
(101il)[1123]
(0111)[1213]
(1101)[2113]
(i011)[1123]
(0111)[1213]
(1101)[2113]
2c va°- 4 /4c2 +3a2
_ _ _c c v_ _a
'4c2 +3a2a 4 c 2 +3a27 /4c 2 +3a2~c'K~Z tv4o2 +32 4c+3 a
2c ac
4c+3a+3a2 V44c2+3a 2
__ _ _c c __ _ a
/0 v'4c/cC2+3a0s~i~i -743a= 4n~ c v3a
C+3 V4c2 +3a 2 4c2 +3a203c c %F/a
- 4c+ 3a 24c 2 +3a
[mlc
a a c2(c 2+a) 2(ac2 ±-2 ) (Vc-+a2)
a a c2(725) 2(c2,a/-) (c2+a2)
a c2(c 2+a2) 2(1c2+a2) (C 2+ 2)
a V,a c2(7v+'a7) -2(v-c 2+a2) ( 2+a)
a 0 c
2(-'+a2) 2(c 2 +a) ( 2-a)
a 0 c
a _ 3__ c2(7c2 +a2 ) 2(/ 2+O) (+aT)
a _ ¶ a c2( 2+) 2(1c) ( 2)
a _ c2(7c2+a2 ) 2(v'c2-a 2) ( 2+a2)
116
a
1
2
3
4
5
6
7
8
9
10
11
12
Label
R7
R8
R9
R10
R11
R12
R13
R14
R15
R16
R17
R18
In alc
_

Table 4-8. Pyramidal < c + a > Slip Systems {1122} < 1123 >a Miller-Bravais " [n]. [ma]c Label
Notation
2 (i2i2)[1213]( i ° ('4c+a2) a- °0TT) c R20( (VC-a) ()
3 (2112)[2i3]1 c - T- V4 rC a 2 a 2 2 ) a c R2132 2 (-212) 2 (v) 2(c2 +a 2) ( 2 -- a2 )
4 (I22)11-23] - - Z f a Ala 2 R224 (2(v'-+a2) 2(vc'+a2) ( 2+-a2 ) 2(4 2 -+a) 2(,/y2n) (c 2 +-a2)
5 (1212)[1213] 0-- 0 (v ) (a ) 0 ( ) R23
6 (2112)[2113]1 2(vT va2) Za _R2(,'~-ay)-(V 7 '~) (2) z(V----7 ) (vc%-+a) (V )
117

C
l \ta) L IC a
C
f-a3
I,I
I
I
I
I
a31I
I
I
a2 , a
(b) alFigure 4-1: (a) Structure of the hexagonal lattice. (b) Schematic diagram illustrating therelation of the simple hexagonal cell (light lines) to the orthohexagonal cell (dark lines) andthe hexagonal prism (dashed lines).
118

a2
a, (0001) alBasal-< a > slip Prismatic-< a > slip
c
a2
a1
Pyramidal-< a > slip
a 1 11213J
1st order Pyramidal-< c + a > slipa1
2nd order Pyramidal-< c + a > slip
Figure 4-2: Slip systems in high-temperature deformation of h.c.p. titanium.
119
a2 a 2

160
120
40
TI ftV* w AA At qLS
O 200 400 Go -w RJ ,-.~T(1K)
Figure 4-3: Effect of temperature on the critical resolved shear stress for basal and prismatic
slip in high-purity titanium (Conrad [1981]).
120
%f

a
C
(1:
a
a1
{1012 < 011 >
a1
{1122} < 1123 >
Figure 4-4: Twin systems in room-temperature deformation of h.c.p. titanium.
121

30
o 20
10
0"I 1
973K
kD) Ie
Figure 4-5: (a) Influence of temperature and purity on the volume fraction of twins at 5%compression in a-titanium (Paton, Williams and Rauscher [1973]). (b) Volume fractionof twins as a function of true strain in h.c.p. titanium deformed in tension at varioustemperatures (Lii, Ramachandran and Reed-Hill [1970]).
122
f12NVOLI

(a)
0001
(b)
1120
1010
Figure 4-6: (a) Standard stereographic (0001) projection for titanium. (b) Primaryorientation triangle showing the initial orientation of the tension axis.
123

I * I .
10
8-
- 6-
4-
2-
0-(a) 0.0 0.2 0.4 0.6
Irl
0001
1120
(b) 10io
Figure 4-7: Simple tension experiment performed on a titanium single crystal at 750°C(Akhtar [1975a]): (a) Resolved shear stress vs. shear strain curves for basal slip. (b) Inversepole figure showing the change in orientation of the tension axis with strain (A-B-C).
124
l | -

120
90
A, 60
30
00.0 0.1
Figure 4-8: Experimentally measured-0.0001sec- ' to e = -O.Olsec- l .
0.2 0.3 0.4 0.5
stress-strain response during strain-rate jump from
125

(a) 12
(b) Li
Figure 4-9: (a) The initial finite element mesh used in the simulation of tension of a titaniumsingle crystal. (b) Deformed mesh at = 0.7.
126

0001
1.-
1.0
1i-
0.5
0.00.0 0.2 0.4 0.6
(a) let (b) loio
-1nIU -
8-
6-
0-0.0 0.2 0.4 0.6
(c) 1I1
Figure 4-10: Comparison of the simple tension experiment performed on a titanium singlecrystal at 7500C (Akhtar [1975a]) with our numerical simulation: (a) Accumulated slipvs. macroscopic strain for active slip systems. (b) Inverse pole figure of the change inorientation of the tension axis. (c) Resolved shear stress vs. shear strain response on thebasal slip system B1.
127
1120
Experiment..... Simulation
I I
I I I I
11
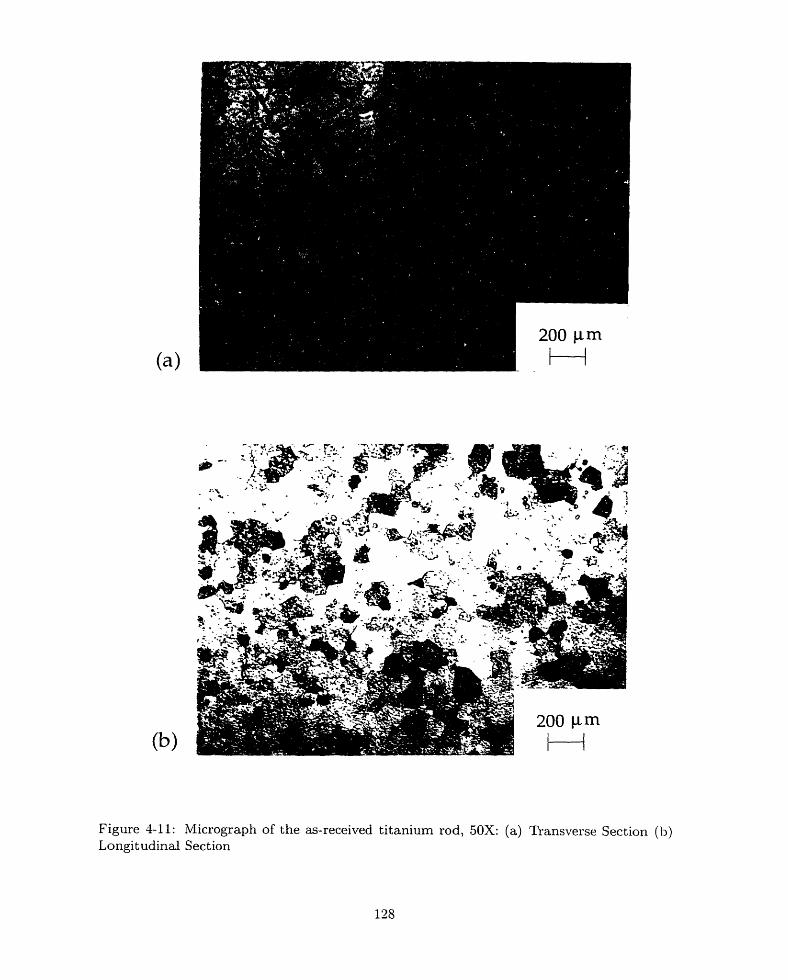
(a)
(b)
Figure 4-11: Micrograph of the as-received titanium rod, 50X: (a) Transverse Section (b)Longitudinal Section
128

3.002.572.151.721.290.860.440.01
01)
X,
011}
-X,
/ %X2(110(11201
- X,
Figure 4-12: Experimentally measured crystallographic texture of the as-received titaniumrod. The rod axis is aligned with the e3 direction.
129
- |~~~~~~~~~
X2LI
I

(a)
(b)
Figure 4-13: Micrograph of the annealed titanium rod, 50X: (a) Transverse Section (b)
Longitudinal Section
130

X2
3.002.572.151.721.290.860.440.01
01)
Xi
01)
Xi
) 1}
XI
1il)
-X,
11120 11201
Xl
(a)
-Xi
(b)
Figure 4-14: (a) Experimentally measured texture in the annealed CP-Titanium rod and(b) its numerical representation using 729 unweighted discrete grain orientations.
131
X2Y-2

85 Ii
' )0.02- I0.02"1
0.005"
0.4"
Figure 4-15: Geometry of compression specimens (All dimensions are in inches).
e3
Figure 4-16: Schematic illustrating the orientation of the material axes in the compressionspecimen.
132
__
I
I
0.1
I
I. J.1
I
I
I
I
I

I fn
O
JIV -
80 -
60 -
40 -
20-
-
0.0 0.20.2' I
0.4' I
0.6' I
0.8 1.0
£
Figure 4-17: ExperimentallyCP-Titanium at 7500C.
measured stress-strain response during simple compression of
133
_ 1I

i(b)
III -- - - -- -|-.- 1.- --1- I
Figure 4-18: Photographs of the section of the compression specimen perpendicular to theloading axis: (a) Initial (b) e = -0.5 (c) E = -1.
134
(a) '(c)
--t-- .- ,- - -- .-·-- ,CHF- I -:

3.002.572.151.721.290.860.440.01
01)
X,
Hri)
XI
X2
11120)
XI
Figure 4-19: Experimentally measured crystallographic texture at e = -1 in CP-Titaniumdeformed in simple compression at 750C.
135
X2

-'- .UU3.00I 21=U.1) C7 ~2110.. J I _
2.141.711.290.860.430.00
I \
(a) 1ooo i210
e=-0.502110
)0
/1 \t,) 0001 1210
£=- 1.002110
0
.- _O
,L;) 0001 1210
Figure 4-20: Inverse pole figure of the compression axis: (a) Initial (b) e = -0.5 (b) e = -1.The figures also show the lines of symmetry (bold lines) in the plot. The dashed lines(A-B-C) trace the evolution of the compression axis with strain.
136
- - - -
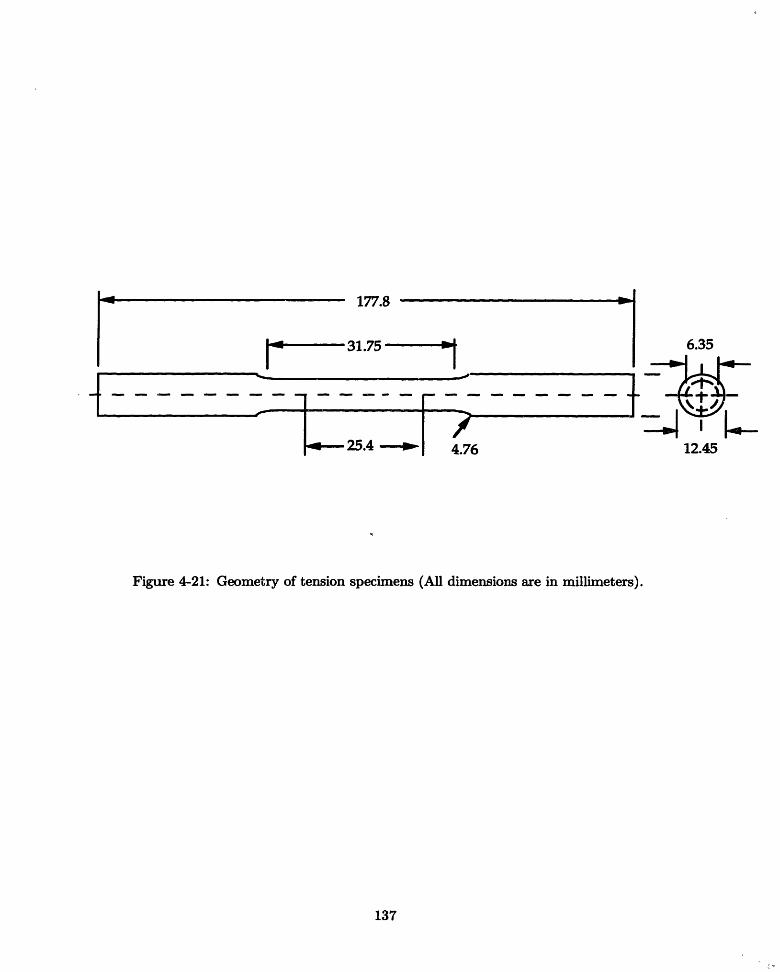
6.35
12.45
Figure 4-21: Geometry of tension specimens (All dimensions are in millimeters).
137
I -- - - -177.8
I I
- ~--
1.0--- 31.75 pi---~
i

I fin
Cu-
IUU -
80 -
60 -
40-
20 -
0
0.0I
0.10.20.2
I
0.3 0.4
£
Figure 4-22: Experimentally measured stress-strainTitanium at 750C.
response during simple tension of CP-
138
- - -L
II

'''4 xit'i-g~~~~i~' '5iL .. .t.( Iiiil~l 15:gll
1JW-rss~tilo i ¢, *., . I., A> x, t * i, A,..,
. g ,.v f s 9 ~ ~ ~ ~ ~ ~ ·:
.d i, '
..','e , . In _;,
--T'] - It!J1Ii.i T I i I ; I
I._ I ! iI ; I!t
A l
"K-'(a) I(b) (c)
Figure 4-23: Photographs of the section of the tension specimen perpendicular to the tensile
axis: (a) Initial (b) e = 0.2 (c) e = 0.3.
139
I i ' I - -
eINC"-, - -1- -

3.002.572.141.711.29
Q i
001)
V.Oj .
0.430.00
)i1)
. Xi
(1120I
Xi
Figure 4-24: Experimentally measured crystallographic texture at e = 0.3 in CP-Titaniumdeformed in simple tension at 750C.
140
�: Xi!
X2
....
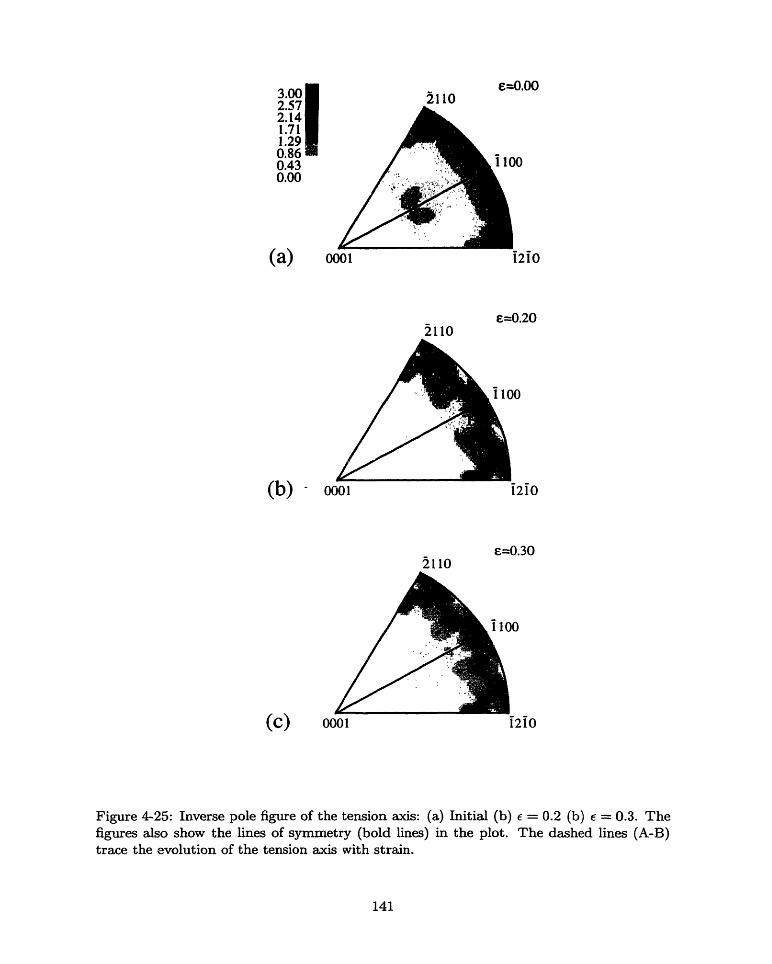
3002.572.141.711.29ne
2 10
U.00o m0.430.00
I I
(a) 0001
2110
/1 \
( ) 000l
2110
(C) 0001
Figure 4-25: Inverse pole figure of the tension axis: (a) Initial (b) e = 0.2 (b) = 0.3. Thefigures also show the lines of symmetry (bold lines) in the plot. The dashed lines (A-B)trace the evolution of the tension axis with strain.
141
£0.00
0
1210
£=0.20
1210
£=0.30
1210?_

700 900TEMPERATURE ' K -
Figure 4-26: The ratio of the critical resolved shear stress for basal to thatin high-purity h.c.p. titanium (Akhtar [1975a])
of prismatic slip
142
3.0
2
I
(C
-)
l )C)crO
A
[Ia [ I [ aa 2 A - -~
!.0
l-
500 1100
I - -
W
.. _

(a)
(c) (d)
Figure 4-27: Initial and deformed finite element meshes in simple compression and tensionsimulations: (a) Octant of a cube (b) Initial finite element mesh (c) Deformed mesh ate --1 in simple compression (d) Deformed mesh at e = 0.4 in simple tension.
143
I(b)

I t . -U
90-
~, 60-
30-
0-0.0 0.2 0.4 0.6 0.8 1.0
8
Figure 4-28: Stress-strain curves from simple compression simulation for the non-hardeningcase with two different assumptions for the slip systems.
144
----- (A) Prismatic+Basal+Pyramidal <a>+Pyramidal <c+a >
(B) Prismatic+Basal+Pyramidal <c+a >
mm m m m m I I I I.
I . I ' I . I '

(0001) 3.002.572.151.721.290.860.44
)i1)
Xl
20)
Xl
Experiment SimulationCase (A)
Figure 4-29: Experimentally measured texture after simple compression to calculated texture with two different assumpations for the slip systems.
SimulationCase (B)
= -1 and
145
3.00 2.572.151.721.290.860.440.01
OI) 3.002.572.151.721.290.86
X 1 0.440.01
X2
(0001)
Xl
X2
)i11
.xl
X2
X2
)il}
Xl
120)
xl
X2
X2
X2

1 on1 .V -
90 -
to
30 -
0-
-..... (A) Prismatic+Basal+Pyramidal <a>+Pyramidal <c+a >
..- (B) Prismatic+Basal+Pyramidal <c+a >
' I ' I ' I m
I I I
0.0 0.1 0.2 0.3 0.4
Figure 4-30: Stress-strain curves from simple tension simulation for the non-hardening casewith two different assumptions for the slip systems.
146

x23.002.572.141.711.290.860.430.00
X2
Ol) 3.002.572.141.711.290.86
X 1 0.430.00
)i1I
xl
20)
X1
X2
3.002.572.141.711.290.860.430.00
Experiment SimulationCase (A)
SimulationCase (B)
Figure 4-31: Experimentally measured texture after simple tension to e = 0.3 and calculatedtexture with two different assumpations for the slip systems.
147
01)
X1
)ilI
Xl
)ll
Xl
x2120)
·xl
X2X2

I201t
90
60
0
0
0.0 0.2 0.4 0.6 0.8 1.0
Figure 4-32: Experimentally measured stress-strain response in simple compression andstrain-rate jump tests and the corresponding numerical fits from the simulation. The figurealso shows the calculated stress-strain repsonse for simple compression in the absence of<c+a> slip.
148

01)
Xl
)11)
.Xi
[20)
' Xl
Experiment Simulation
Figure 4-33: Comparison of the experimentally measured texture after simple compressionto e = -0.5 with the texture predicted by the finite element model.
149
3.002.572.151.721.290.860.44 010.01 ;.~
)01)
. x,
)11)
.X,
11 S0m
xl
. ,v
X2Z

X2
o01)
Xi
fil
xl
X2
120}
x,
Experiment Simulation
Figure 4-34: Comparison of the experimentally measured texture after simple compressionto e = -1.0 with the texture predicted by the finite element model.
150
3.002.572.151.721.290.860.04410.01 -'I
I0001)
. Xl
Xil}
x,
2o}
Xl

I n1 uV -90 -
a 60-
30-
0
0.0 0.1 0.2 0.3 0.4
Figure 4-35: Comparison of the experimentally measured stress-strain response in simpletension with the numerical prediction.
151
- - ,,,, ,, , ,,, ,,, ,, . . . M.
Experimenta-'' Simulation
I I I I I

)01)
. Xi
01)
X
X2
)il}
- X1
11})
· X 1
X2
120}
Xl
Experiment
o20}
Xl
Simulation
Figure 4-36: Comparison of the experimentally measured texture after simple tension toe = 0.2 with the texture predicted by the finite element model.
152
3.0012.572.1411.71-1.290.86 W0.43000.00 ':5

X2
)01)
. X
il} 1)
X 1
120)
-Xl
Experiment
)1)
Xi
i 1)
- Xi
120)
-Xl
Simulation
Figure 4-37: Comparison of the experimentally measured texture after simple tension to= 0.3 with the texture predicted by the finite element model.
153
3.002.57 2.14/1.71E1.290.86-0.430.00

'I OI^LAU
90 -
60-
30 -
0
(a)
120
90-
T
i 60-
30-
0
(b)
I I I I
0.0 0.2 0.4 0.6 0.8 1.(
e
I . . . . . .
0.0 0.2 0.4 0.6 0.8 1.0
Figure 4-38: (a) Measured stress-strain response for simple compression and tension. (b)Simulation using the finite element model.
154
Simple Tension.... Simple Compression
Simple Tension-... -Simple Compression
I _ _ __ _
-l
- I I I I

Comnrsq.qinn
[unger
tmple
ConstraintDirection
Figure 4-39: Schematic of the plane-strain compression apparatus.
155
FreDir
Die
P-1

ii
Simple CompressionSpecimen
/ 2
e2
Plane-strainCompressionSpecimen
Figure 4-40: Schematic illustrating the orientation of the material axes in the plane-straincompression specimens and its relation to that in the simple compression specimen.
156
~mmmmmmmmmmm
~ammmmm..mq -
-
r S ..........-
/
r
I
e2IW I -MeI
I.- JI
I
I
I
I

(a)
(b) L
(c) 12
Figure 4-41: Initial and deformed finite element meshes in the plane-strain compressionsimulations: (a) Initial finite element mesh. (b) Deformed mesh at e = -0.9 for the casewith e' as the constraint direction. (c) Deformed mesh at e = -0.9 for the case with e'2 asthe constraint direction.
157

I _flILU
90
1: 60
30
0
0.0 0.2
Figure 4-42: Experimentally measuredcompression of CP-Titanium at 750C.
0.4 0.6 0.8 1.0
stress-strain response during plane-strain
158
I

3.002.572.151.721.290.860.440.01 .~' :
·01)
Xi
(0001)
X ',I
Ail)
X,
11)
X,
120}
Xl
20)
Xl
(a) (b)
Figure 4-43: Experimentally measured crystallographic texture at e = -0.9 in CP-Titaniumdeformed in plane-strain compression at 750°C with: (a) e' as the constraint direction and(b) e2 as the constraint direction.
159

1in
la
6tDt
Cf-
Figure 4-44: Cornpars e 1.0S ~ t r a i n , c o m p r iof itme e r i aeti zly m e a s u r e d s r e s t r s e ji n P lan e
strain COmnpresS/ono heepeieja~srnwith the uercal predctions assuming n frictjioon betw n cn
contacting
160

3.002.572.151.721.290.860.440.01
)01)
XI
101)
Xi
)1 1)
Xi
Oil}
'X!
'201
X1
11201
[Xl
Experiment Simulation
Figure 4-45: Experimentally measured texture after plane-strain compression to E = -0.9with e as the constraint direction and the corresponding texture predicted by the finiteelement model assuming no friction between contacting surfaces.
161
.
XI XI
X2 X2

3.0012.57 2.151.721.290:860.440.01
DOOl)
xI
D1)
Xl
1i1)
X,
X2 X2
)1 1}
Xi
i120}
-X,
120)
.X,
Experiment Simulation
Figure 4-46: Experimentally measured texture after plane-strain compression to e = -0.9with e as the constraint direction and the corresponding texture predicted by the finiteelement model assuming no friction between contacting surfaces.
162
.,
Y-2 Y-

1 0nLAU
90
30
0
0.0 0.2 0.4 0.6 0.8 1.08
Figure 4-47: Comparison of the experimentally measured stress-strain response in plane-strain compression with the numerical predictions assuming a friction coefficient of j- = 0.05between contacting surfaces.
163

3.002.572.151.721.290.860.440.01
M01)
'X,
01l)
Xl
i1)
X,
120}
Xi
)l1)
Xl
1201
"X 1
Experiment Simulation
Figure 4-48: Experimentally measured texture after plane-strain compression to = -0.9with e as the constraint direction and the corresponding texture predicted by the finiteelement model assuming a friction coefficient of u = 0.05 between contacting surfaces.
164
-X2 -X
'K2 N2·2,

X2
01)
xl
1i )
xl
120o
.Xl
Experiment Simulation
Figure 4-49: Experimentally measured texture after plane-strain compression to e = -0.9with e2 as the constraint direction and the corresponding texture predicted by the finiteelement model assuming a friction coefficient of ,p = 0.05 between contacting surfaces.
165
3.002.572.151.721.290.860.440.01 ,,S
(0001)
Xl
/'
il1
X,
,%. [ 11201
.X
X2·:-Iel~'11 171 11 1 -- ,,I

127
Ii--~~~~~~~~l8.89
- - I. -I1- - -- -Ii ------ I
6.35 12.07
Figure 4-50: Geometry of tubular-torsion specimen (All dimensions are in millimeters).
166
L
' -
____h
r - - - II= = =
t---I
-- 5.08 -0-

(a) 3<
(b) L
Figure 4-51: Initial and deformed finite element meshes in tubular torsion simulation: (a)Initial finite element mesh (b) Deformed mesh at = 1.
167

3.002.572.141.711.290.860.43 0.00
A'' '*~ (I/ ' ' \~~.
ooo1) )o1)
- xi
)11) )I 1)
x l
X3
20}
(
(a)
20o
Xl
(b)
Figure 4-52: Initial pole-figures in the tubular torsion specimen measured perpendicular to:(a) 2-3 plane of the specimen (b) 1-3 plane of the specimen.
168

80
60
- 20
0
-200.0 0.2 0.4 0.6 0.8 1.0
Shear Strain
Figure 4-53: Comparison of the experimentally measured shear stress-shear strain res ponseand normal stress-shear strain response in tubular torsion with the predictions from thefinite element model.
169

01) 01)
)11 11)
20}
x2
Experiment Simulation
Figure 4-54: Experimentally measured texture after tubular torsion tocorresponding texture predicted by the finite element model.
y = 1 and the
170
3.002.572.141.711.290.860.43 '",<0.00

Chapter 5
Conclusions
A reasonably successful physically-based model for polycrystalline plasticity of face-
centered-cubic materials has been developed. The model is essentially an extension of the
previous work by Anand and co-workers (Kalidindi et al. [1992], Bronkhorst et al. [1992],
Kalidindi et al. [1994]). The simple power-law relation for the plastic flow is replaced
by a more physically-motivated constitutive function based on the thermally-activated
theory of plastic flow (Kocks et al. [1976], Argon [1995]). The constitutive equations
have been implemented in both "static,implicit" and "dynamic,explicit" finite element
programs. The physical description for the plastic flow enables the the model to reproduce
the macroscopic stress-strain response and the crystallographic texture evolution up to large
strains ( 100%) for a wide range of strain-rates (10- 3 - 102 sec- 1) and temperatures (77
- 298 K). The material parameters in the model have been determined by calibrating it
against existing experimental data for aluminum (Duffy [1974], Senseny et al. [1978], and
Carreker and Hibbard [1957]). The predictive capability of the model has been evaluated by
comparing its predictions for the macroscopic stress-strain response and texture evolution
in simple compression and plane-strain compression for two temperatures, 77K and 298K,
with corresponding experimental results on A11100-O. The predictions are in reasonable
agreement with the experiments. The important differences in the behavior of f.c.c. and
b.c.c. materials with regards to strain hardening and strain-rate and temperature history
effects are also captured by the model. The predictions of the stress-strain repsonse compare
well with existing experimental data on strain-rate and temperature jump tests (Dorn et
al. [1949], Lopatin et al. [1992]).
171

In order to evaluate the applicability of the crystal plasticity model to actual deformation
processing operations, the phenomenon of formation of earing defects in cup-drawing has
been studied. Cup-drawing experiments were carried out on aluminum 2008-T4 sheets.
The predictions of the model of the load-displacement response, the number of ears, their
locations, and heights are in very good quantitative agreement with the experiments. This
capability could serve as a design and analysis tool for cup-drawing and related sheet-metal
forming applications.
A large deformation, crystal-plasticity based constitutive model for high-temperature
deformation of titanium is presented. The constitutive model and the computational
procedures have been implemented in a finite-element scheme. Quasi-static simple-
compression, simple-tension and plane-strain compression experiments have been conducted
on commercially-pure titanium at 750C, and the resulting macroscopic stress-strain
response and evolution in crystallographic texture have been measured. Full 3D finite
element simulations of these deformation modes have been carried out and comparison
of the predictions from the same against corresponding experiments shows the model to
be reasonably accurate. To the best of our knowledge, this is the first-time a combined
experimental and computational effort of this nature has been carried out to study the
deformation of hexagonal materials.
5.1 Suggestions for Future Work
The following are some suggestions for future areas of research:
* Twinning is an important mode of plastic deformation in hexagonal materials at room
temperature. The incorporation of twinning in a rate-dependent crystal plasticity
model would facilitate the study of deformation processing of h.c.p. materials at room
temperature. For a recent rate-independent crystal plasticity model for incorporating
both crystallographic slip and twinning, see Staroselsky and Anand [1997]
* For polycrystalline materials of the low symmetry crystal structure, the Taylor-type
averaging procedure does not work well. Other types of polycrystalline averaging
schemes such as the self-consistent method (Hutchinson [1977]) and the constrained-
hybrid method (Parks and Ahzi [1990]) have been developed for this situation.
172

There is a need to evaluate the applicability of these schemes to high-temperature
deformation of h.c.p. titanium.
* Other details of microstructure such as porosity, localized shear bands, etc. and their
evolution need to be incorporated in the constitutive model. Such details are necessary
in order to predict failure during deformation processing.
173

Appendix A
Time Integration Procedures
The time-integration procedure for a Taylor-type polycrystal modell may be stated as
follows. Let r = t + A t. Then, given
(1) F(t), F(r), (t), 0(7)
(2) (mn, no) - time independent quantities, for each grain,
(3) FP(t), 8a(t), T(t)} in each grain,
calculate
(a) {FP (r), sa (r), T (r) for each grain,
(b) volume averaged macroscopic stress T(r),
(c) texture {(mC(r)(k), na(T)(k)} at time r. and march forward in time.
The computational procedures for items (a), (b) and (c) depend on the nature of the
finite element procedure adopted. Fully-implicit Euler-backward schemes are employed for
the "static,implicit" finite element procedure. For the "dynamic,explicit" finite element
procedure, the computation of the time-integration steps are performed through a simple
Euler-forward scheme. In the following, the computational methodologyv for each of these
finite-element procedures is described.
A.1 Implicit Finite Element Procedure
For the computation of the list of variables in (a), the computing scheme of Kalidindi et.
al [1992] is adopted:-
'The time-integration procedure for a single crystal model is obtained simply by setting the number ofcrystals in the Taylor-aggregate to be one.
174

(i) Compute
A FP- T(t) FT(r) F(r) FP'(t), (A.1)
T*t C [ {A- 1}] (A.2)2 L 2 ~CI- L~J ) (A.2)
B a _ AS +So T A, (A.3)
C c [ o] (A.4)
where SI = (ml ® ng).
(ii) Solve
T*(7) i T*tr- A 'Ca, (A.5)a
8a(7) - sa(t) + Z h(r) A-YI, (A.6)
with
A a - - (7) At, (A.7)
for T*(7) and s(7r) using the following two-level iterative procedure.
In the first level of iterations, solve (A.5) for T*(7), keeping s(7r) fixed at its best
available estimate using a Newton-type iterative algorithm as follows:
Tn+l(7r) = Tn(r) - Jn'[Gn], (A.8)
where
Gn T(7r) - T*tr + ya (T(7r), s ()) Ca, (A.9)a
Jn - + +C ® a y' (T(T),s(7r)), (A.10)
where the subscripts n and n + 1 refer to estimates of T*(-) at the end of n and n + 1
iterations respectively, in the first level of the iterative scheme. The second level of the
iterative procedure involves a simple update (without iterations) of s(7r) using
S+1 = s-(t) + I, hea (sA(7)) IAY~ (T+l(T), sk(r)) I (A.11)
175

where the subscript k refers to the value of 8a (r) at the end of the kth update in the second
level of the iterative scheme.
In the rate-independent limit of plastic flow, i.e., for small values of ', the set of
equations (A.5) becomes very stiff and it becomes necessary to apply constraints to the
Newton corrections (A.8) in the first level of the iterative procedure. In this work, the
following constraint procedure has been adopted:
Let
{IA'Ylmax(r) = max0 IAyT(r)l (A.12)
If
IA IAmax < A7tol, (A.13)
then accept the Newton correction, else
(Ti)n+l(7) = (Tij)n(r) + 77 AT, (A.14)
where is a small factor. A value of 7 of 0.25 was found to give good results in the
calculations in this study.
(iii) Compute
FP(r)-1 + yaS } FP(t). (A.15)
It was necessary to normalize FP(T) by dividing the computed values of each of its
components by the cube root of the computed determinant so as to ensure that the
determinant of FP(-) is unity.
(iv) Compute
etF) I F(r)F P - (T)T*(T)FP - T ()FT(T) (A.16)det F(7)
After calculating the Cauchy stress in each crystal T(r), the macroscopic stress in (b)
is obtained by a simple volume-average,
qT = N=1k= vk T ( k) ,
The texture at time r is evaluated as follows:
m'(-r)(k) = Fe()mo = F(T)F P- (- )ma,
176

n(r)(k) = Fe- T(T)no = F-T()FpT ()nl,
The time-stepping for the implicit finite element procedure is automatically controlled
based on the maximum value of the slip increment. A parameter R = -a " is used as a"lim
measure for controlling time-increments where Ayaax is the maximum value of A7y over
all the crystals and all the integration points in the finite element mesh and A71im is a
prescribed value of slip increment based on the desired accuracy. A value of A71im = 0.02
was found to give good results in this work. If the value of R is greater than 1 then the
time-step is repeated with a time increment, Atnew = Atold. If 0.5 < R < 1, the value
of the time-increment is maintained and if R < 0.5, the time-increment is doubled i.e.,
Atn+l = 2Atn. The efficiency and speed of the scheme depends on the rate- sensitivity of
the material. The equations (A.5) become stiffer in the rate-independent limit requiring
more iterations to solve for the stresses.
A.2 Explicit Finite Element Procedure
(i) Calculate
FP-1 () -- Fp - (t){1 - A yQ(t)S } (A.17)a
Fe(T) = F(r)FP (r) (A.18)
Ee( ' ) = 1 {Fe()TFe())- 1} (A.19)
T* (T) = C[Ee(r)] (A.20)
(ii) Compute the hardening modulii,
hfl(t) = ho 1 (t) sign 1 - s(t) (A.21)
haP(t) = qch(t) (A.22)
(iii) Calculate the slip system deformation resistances and the resolved shear stresses on
each slip system at time T
8(T) = sa(t) + E h(r) IAy1 (A.23)
177

(A.24)
(iv) Calculate the shear increments on the slip systems at time r
if r' *<0'Aly a= I 0c(sg (" if 'r.- < , (A.25)
Af -- Atexp {- kGa(," ) I sign(ra ) if 0 < ra < s ,,
A time-stepping scheme is not required for the explicit finite element procedure. The
problem is solved with nearly equal increments in time subject only to slight variations due
to changes in the stability limit arising from changes in the mesh geometry.
178

Appendix B
Analytical Jacobian for
ABAQUS/Standard
An implicit finite element procedure employs a Newton-type iterative method for revising
the estimates of the nodal displacements. This requires the evaluation of a Jacobian matrix
that is consistent with the time-integration procedure used in the constitutive model.
The fully implicit Euler-backward time integration scheme has been implemented in the
finite element program ABAQUS/Standard [1996]. This program represents the symmetric
Cauchy stress tensor T(r) and a symmetric relative strain tensor Et(r)l as vectors according
to the following convention,
T(T) 11
T(r)22
T(r) 33
T(T) 12
T(')13
T(r)23
Et(T)11
Et(T)22
Et(7)33
2Et()12
2Et(r)13
2Et(j23
(B.1)
1This relative strain increment is given as Et(r) = lnUt(r), where Ut(r) is the relative stretch obtainedfrom the polar decomposition of the relative deformation gradient, Ft(-)
179

where T(r)ij and Et(-r)ij are the components of the tensors T(r) and Et(7), respectively.
The Jacobian matrix required by ABAQUS is defined as,
w = ae (B.2)
The Cauchy stress tensor for the time r = t + At is related to the second Piola-Kirchoff
stress measure by,
T( d) etF ) [Fe(r)T*(r)F eT ()] (B.3)
From (B.3) we obtain,
dT detFe1 [FeT*F eT + FedT*FeT + FeT*dFeT - (FeT*Fe)tr(dFeFe-')] (B.4)
In (B.4) all the variables are at time r. In what follows, unless otherwise stated all variables
are evaulated at time r. Equation (B.2) can be rewritten in the indicial notation as follows,
dTij = WijkldEt,k (B.5)
For convenience, let us define two fourth-rank tensors S and Q as,
aF e OT*S = Ew Q = (B.6)OEt ' Et
Rewriting (B.4) in the indicial notation and substituting (B.6) in this, we obtain the
following expression for the Jacobian,
Wijkl detFe [SimklTnFej + FiemQmklnJ + Fim-TSjnkl - FimT1nFe (SpqkFqpikl nndetF n(B.7)
Note that Wijkl in (B.7) can be reduced to the WIJ form in (B.2) by the following
180

transformation,
Wl112tWt2l12
W2212+W29212
Ws12+Wsl212
W1212+Wl2212
2
W2S12±W23U12
W1113+Wsss2
W1221L+W22al2
2
W 213+W,312
Ws313+W s3312
W2313+W2312
W12123W1132
W222:+W22322
W3 s2 A +WAs922
W1223+W1222
W1s2s +W1.322
W2 23 +W 2 33 22
For relatively small incremental stretch,
Et = lnUt(7) - Ut() - 1, Ut(r) -+ 1.
So, dEt : dUt. With the aid of this approximation, we can modify S and Q as,
F e OT*OUt Ut (B.9)
In order to compute Wijkl in (B.7), we need to calculate S and Q. In what follows, we
enumerate the steps for the same.
B.1 Calculation of Relevant Quantities
(i) Calculation of S = 8F :
Fe(T) = RtUtFe(t) {01 - 'yASO} (B.10)
where Rt, Ut is obtained from the polar decomposition of the relative deformation gradient
Ft. Differentiating (B.10),
dFe = RtdUtFe(t) - RtdUtFe(t) E A'yaSa - RtUtFe(t) E dAy'aSo0 0~~~~~~t
R= aA7'OUt
181
W221 1
W 33 11
W1 211
Wi 3 11
W2 31 1
W112 2
W 2222
W3 3 22
W1222
W2132 2
W 2322
¥W113 3
W2 23 3
W3 3 33
W1 2 33
W1 3 33
W 23 3 3
(B.8)
With
(B.11)
(B.12)

we rewrite (B.11) in the indicial notation as follows,
d = [RtikFl(t) - Rt,,ikFle(t) E AYSopj - RtmUtmnnFp(t)
Therefore,
Sijkl = Rt,ikFi;(t) - Rt,ikFe(t) AySopj - RtimUt,mnFp(t) E R*Sopj-a a
(ii) Calculation of Q = :
T*(r) = T*t r - > AyaCaa
Differentiating this expression,
dT(r) = dT'"' (B.16)- E dA7oCa - X A7yOdC"a at
LetT tr
8T = D.aut
WithaA
dT~t = CijmnmnkldUt,kl23
1Dijkl = 2Cijmnmnkl
acO
aUt
C = C [AS + STA],
dC' = C [dASo + S TdA],
182
dUt,kl.
(B.13)
(B.14)
(B.15)
Therefore,
(B.17)
(B.18)
(B.19)
(B.20)
Next, let
Since
(B.21)
(B.22)
a SRk'I O,pj

Substituting for dA from (B.19),
dCj = {CijmnImpk1Spn + CijmnS0ppnk1 } dUti
Therefore, 1n + msil 2 MPjm~mn
The relation for dT*, (B.16), can be rewritten in terms of V, R a and ja as,
dT*j = VDijkldUt,kL- Z RndUt,,lC~ - Z AaC7iJjdUtkl1,
From (B.25), we obtain Q as
Qijkl = -Dijkl- CijRn - k "r>J,
(iii) Calculation of Z = A:
A = FeT (t)Ut(T)Ut(T)Fe(t)
On differentiation,
dA = FeT(t)dUt(t)Ut(T)Fe(t) + FeT (t)Ut (t )dUt(t )Fe (t)
In the indicial notation,
dAij = Fiek (t)dUt,klUt,lmFj(t) + Fm(t)Ut,mkdUt,klF e(t)
Therefore,
Lijkl = F Tek (t)Ut,ImFej(t) + Fiem (t)Ut,mkFlej(t)
(iv) Calculation of R' = :I SW
A-y = ATy(T*(Ut)) (B.31)
Here for the sake of simplicity, the change in the deformation resistances during increment
At is neglected. Consequently, the plastic shear increment is dependent only on the resolved
183
(B.23)
(B.24)
(B.25)
(B.26)
(B.27)
(B.28)
(B.29)
(B.30)

shear stress. Equation (B.31) is differentiated using the chain rule as,
oyaa {Ut + aX} = ASya {T*(Ut) + aX} (B.32)
d hy U + aX)}l = OT x= a A(B33)~ oUt --- u- a- [ out I 'T*X
Let
Ba = a. (B.34)9T*
Then,
Ri = B' Qklij (B.35)
We can now substitute the expression (B.35) in equation (B.26) to get the final
expression for Q as follows,
Q = Z - (C a ® Ba)Q- y ATaJ (B.36)
Therefore,
Q = Z + '(C 9 ® B ) {V - E AyaJ} (B.37)
where Z is the fourth-rank identity tensor.
(v) Calculation of Ba = a:
B a A7 a A.T a = Oa 2(sO + SOT) (B.38)OT*= Ora OT* - 0ra 2
(vi) Calculation of Cijkl in global co-ordinates:
Let CC and C be the anisotropic elasticity tensor in the crystal and global basis
respectively. Then, the stress-strain relation referred to the crystal basis is given by
T*C = CC[EeC]
If Q is the orthognal tensor that rotates the crystal basis to the global basis,
T* = QT*CQT; EeC = QTEeQ.
T* = QCC[QTEeQ]QT, (B.39)
184

T. = QimCmnopQokQTPQjEkl (B.40)
Therefore,
Cijkl = QimQjnQkoQipCnnop (B.41)
B.2 Algorithm for computation of the Jacobian
1. Calculate
Cijkl = FiekT (t)Ut,lm(r)Fer (t) + Fjm(t)Ut,mk(r)Fje(t)
2. Calculate Cijkl in global co-ordinates,
Cijk = QimQjnQkoQlpCmnop
3. Calculate
Dijkl = 2CijmnZmnkl
4. Calculate
(a) nkl = CmpklSOpn + SSmppnkl
(b) Jijk, = "Cijmngmnkl
5. Calculate
B = aa 2(S + )
6. Calculate
(a) rCijkl = 1ijkl + E (CijBk )
(b) Qijkl = imn kl - E. a- amnkl
7. Calculate
(a) Rij = Bk Qklii
(b) Sijk, = Rt,ikFi(t) - Rt,ikFip(t) I E Sp) - Rt,imU,mnFnp(t) E RkS
8. Calculate the Jacobian
ij detFe [SimkTnne + FieQmnklFe + FTmnSjnkl -FiTmn (SpqklFqp )]Lj detFe . cs m nj
185

9. Reduce the Wijkl to the Wij form through equation (B.8). This Jacobian is for the
constitutive response of a single crystal. Compute the Jacobian for the constitutive
response of each of the crystals in the polcrystalline aggregate in a similar manner.
10. Calculate the overall Jacobian for the constitutive response at the integration point
as a volume-average of the Jacobians associated with the constituent crystals,
WIJ = Sk v(k)W(j)
186

Appendix C
Procedures for Measuring Pole
Figures
The crystallographic texture in the as-annealed and deformed specimens were obtained
by x-rayl irradiation using a RIGAKU RU200 diffractometer equipped with a pole-figure
goniometer. The specimens were all sectioned approximately at the mid-plane using a a
diamond wheel mounted on a BUEHLER ISOMET low speed saw. This ensured that the
cutting process did not alter the texture in the sample. The mounted samples were rough
ground in an ABRAPOL automatic polisher to a 10 #m finish with the application of 150
N force. This was followed by fine-grinding for 10-15 minutes using a 5 pum SiC paper with
the application of 100 N force. The specimens were then oxide-polished for 5-10 minutes
to a mirror-finish ( 0.05pm) using colloidal-silica suspension with the application of 50 N
force. The resulting surface was free of visible grinding marks.
For the measurement of the crystallographic texture, at first the 20 positions for the
specific crystallographic planes were located. For the 20 scans, a 1 divergence slit, a 10
scatter slit and a 0.3 mm receiving slit were used. Partial pole figures were generated by
using the Schultz reflection method on the {111}, {200} and {220} crystallographic planes
in aluminum and (0002), {1011i} and {1120} crystallographic planes in titanium. For the
pole-figures, the slits used were a 1 divergence slit, a Schultz slit, a 6 mm receiving slit and
a 7 mm scatter slit. The diffractometer used for the measurement of texture had a focussing
circle 185 mm in radius. With this geometry for the focussing apparatus, the irradiated
'The x-rays were generated from a copper target serving as the rotating anode.
187

surface was approximately 5.2 mm x 1.2 mm in area. The average grain diameters for the
aluminum and titanium specimens were 150 pm and 175 m , respectively. Consequently,
the irradiated surface samples about 280 grains in the aluminum specimens and 210 grains
in the titanium specimens. The background radiation for each pole-figure was measured
at approximately 2 from the corresponding 2 peak. All the x-ray measurements were
performed with a power level of 50 KV and 150 mA.
The experimental pole-figure data in its raw form is uncorrected and is in the form of
discretized intensities as a function of the goiniometer position angles. The raw data was
processed using the popLA software package (Kallend et al. [1994]). Each pole-figure was
corrected for background and defocusing2 In addition, spherical harmonics were used to
extrapolate the outer 15° of each pole-figure which was not measured in the experiments.
All the pole-figures presented in this study are equal-area projections of the specified
crystallographic planes.
2 The defocusing curve for the slit geometry used in the experiments was constructed theoretically usingthe methodology proposed by Tenckhoff [1970].
188

Appendix D
Single Crystal Studies on Titanium
In this chapter, the effect of different choices of slip systems on the stress-strain response,
slip system activity, and the evolution of the crystal lattice orientation in simple tension
and compression experiments on h.c.p. single crystals is anlayzed. This study is aimed at
providing information regarding the operative slip systems in high-temperature deformation
of h.c.p. titanium.
Fig. D-1(a) shows the inverse pole-figure of the rod axis for the annealed titanium rod.
The rod axis is located predominantly in the neighborhood of the [1210] direction. For the
simulations, a single crystal orientation that is representative of this initial texture, Fig. D-
1(b), is considered. Accordingly, the initial orientation of the single crystal is taken to be
specified by the following three Euler angles (Kalidindi [1992]):
B q w
850 250 00
The simple tension and compression simulations are performed for each of the follcwing
three different choices of slip systems:
(i) Basal-< a > slip systems only
(ii) Prismatic-< a > slip systems only
(iii) Pyramidal-< a > slip systems only.
The values of elastic parameters for single crystal h.c.p. titanium at 750°C are taken as
189

(Simmons and Wang [1971]):
Cu- = 125.3 GPa, C12 = 99.4GPa, C13 = 68.8 GPa, C33 = 154.5 GPa, C5 = 31.6 GPa.
The slip systems are assumed to be non-hardening. Also, for all the simulations, the
slip system deformation resistance is taken to be equal to so = 8 MPa. For the slip system
rate-sensitivity, the value measured from strain-rate jump tests on polycrystalline titanium
at 750°C, m = 0.16, is used.
A single eight-noded brick ABAQUS C3D8 element is used to perform the finite element
simulations in ABAQUS/Standard. The tension or compression direction is aligned with
one of the element axes. The two loaded faces of the cube are constrained to remain
parallel to each other and perpendicular to the tension or compression axis throughout the
deformation. The simulations are carried out at a constant true axial strain rate of ±t0.001
s- 1 to a final true strain of 0.25 in tension, and -0.25 in compression.
D.1 Simple Tension
Fig. D-2 shows the predictions of slip system activity, and evolution of the crystal orientation
when only basal-< a > slip is allowed. Initially, the basal slip systems B1 and B2 are
activated as shown in Fig. D-2(a). On straining, the tension axis rotates towards the
1010 - 1120 boundary, Fig. D-2(b). On approaching the boundary at a macroscopic strain
of e 0.05, the Schmid factors on both the slip systems become very small resulting in an
arrest in their activity.
Fig. D-3 shows the predictions of stress-strain curve, slip system activity, and evolution
of the crystal orientation when only prismatic-< a > slip is allowed. Two prismatic slip
systems, P1 and P2, are active, Fig. D-3(b). This results in the rotation of the tension axis
towards the 0001 - 1010 boundary as shown in Fig. D-3(c).
Fig. D-4 shows the predictions of stress-strain curve, slip system activity, and evolution
of the crystal orientation when only pyramidal < a > slip is allowed. Two slip systems, R2
and R5, are active, Fig. D-4(b). The orientation of the the tension axis rotates towards the
(1010) pole, Fig. D-4(c).
190

D.2 Simple Compression
Fig. D-5 shows the predictions of stress-strain curve, slip system activity, and evolution of
the crystal orientations for simple compression when only basal-< a > slip is allowed. Two
slip systems, B1 and B2, are active, Fig. D-5(b). The compression axis rotates towards the
(0001) pole along a great circle, Fig. D-5(c). The geometric softening in the stress-strain
response, Fig. D-5(a) is due to the decrease in Schmid factor with strain.
Fig. D-6 shows the predictions of stress-strain curve, slip system activity, and evolution
of the crystal orientations when only prismatic-< a > slip is allowed. Activity on slip
systems P1 and P2 (see Fig. D-6(b)) causes the compression axis to rotate towards the
0001 - 1120 boundary, Fig. D-6(c). Also, the compression axis has a slight tendency to
rotate towards the (1120) pole.
Fig. D-7 shows the predictions of stress-strain curve, slip system activity, and evolution
of the crystal orientations when onlt pyramidal-< a > slip is allowed. Two slip systems,
R2 and R5, are active, Fig. D-7(b). As in the case of prismatic slip, the compression axis
rotates towards the 0001 - 1120 boundary, Fig. D-7(c). But unlike the case of prismatic
slip, the compression axis has a slight tendency to rotate away from the (1120) pole.
D.3 Conclusions
The following conclusions can be made from the simple tension and compression simulations
on the titanium single crystal:
1. In tension, basal-< a > slip rotates the tension axis towards the 1010 - 1120 boundary.
Prismatic-< a > slip rotates the tension axis towards the 0001 - 1010 boundary while
pyramidal-< a > slip rotates it towards the (1010) pole.
2. In compression, basal-< a > slip rotates the compression axis towards the (0001) pole
while prismatic-< a > slip or pyramidal-< a > slip rotates the compression axis towards
the 0001 - 1120 boundary.
191

3.001 110
2.141.711.290.860.430.00
0
(a) 0001 i210
0001
1120
(b) 10i0
Figure D-1: (a) Inverse pole figure of the compression axis in the annealed titanium rod.The figure also shows the lines of symmetry (bold lines). (b) Primary orientation triangleshowing the initial orientation of the single crystal considered in the simulation.
192
I

U. jU
0.08
0.06
0.04
0.02
0.00
0.00 0.05 0.10 0.15 0.20 0.25
0.00 0.05 0.10 0.15 0.20 0.25(a) Iel
0001
{hi
1120
1010
Figure D-2: Numerical simulation of simple tension of a titanium single crystal at 750°Cwhen only basal-< a > slip is allowed: (a) The accumulated slip vs. macroscopic strain foractive slip systems. (b) Inverse pole figure of the change in orientation of the tension axis.
193
n 1 n

0.05 0.10 0.15 0.20 0.25
lel
0.5
0.4
0.3
0.2
0.1
0.0
(b) ).00 0.05 0.10 0.15 0.20
I1F
0.25
0001
(C)
1120
1010
Figure D-3: Numerical simulation of simple tension of a titanium single crystal at 750°Cwhen only prismatic-< a > slip is allowed: (a) The macroscopic stress-strain response (b)The accumulated slip vs. macroscopic strain for active slip systems. (c) Inverse pole figureof the change in orientation of the tension axis.
194
3U
25
20
9 15
10
5
0
(a) 0.00
P2
Pi
ft"

30 AA
-1-----I------I I ' I ' -
0.05 0.10 0.15 0.20
lel
0.3
-- 0.2
0.1
0.0
0.25 (b) 0.00 0.05 0.10 0.15 0.20 0.25
0001
(C)
1120
1010
Figure D-4: Numerical simulation of simple tension of a titanium single crystal at 750°Cwhen only pyramidal-< a > slip is allowed: (a) The macroscopic stress-strain response (b)The accumulated slip vs. macroscopic strain for active slip systems. (c) Inverse pole figureof the change in orientation of the tension axis.
195
25-
20-
15 -
10 -
5-
0
(a) 0.00
- .
-
30 nAUo.
v

U./D
0.50
0.25
0.00
0.05 0.10 0.15 0.20 0.25 (b) 0.00
I El
0.05 0.10 0.15 0.20 0.25
I e
0001
(C)
1120
1010
Figure D-5: Numerical simulation of simple compression of a titanium single crystal at750°C when only basal-< a > slip is allowed: (a) The macroscopic stress-strain response(b) The accumulated slip vs. macroscopic strain for active slip systems. (c) Inverse polefigure of the change in orientation of the tension axis.
196
I An
12C
(
-;
90
60
30
0
(a) o.oo
1JUn sac

2C
20
> 15
10
5
0
0.3
_- 0.2
0.1
0.0(a) °00 0.05 0.20 0.2515 0.00 0.2505 0.10 o.5 0.20(a) 0.0 II I
0001
1120
(C) loio
Figure D-6: Numerical simulation of simple compression of a titanium single crystal at750°C when only prismatic-< a > slip is allowed: (a) The macroscopic stress-strain response(b) The accumulated slip vs. macroscopic strain for active slip systems. (c) Inverse polefigure of the change in orientation of the tension axis.
197
0.25
A2n nAV.9

I I I
0.05 0.10 0.15 0.20
| £- I
0.25
U.3
0.2
0.1
0.0
(b) 0.00 0.05 0.10 0.15 0.20 0.25
lel
0001
(C)
120
1010
Figure D-7: Numerical simulation of simple compression of a titanium single crystal at750 C when only pyramidal-< a > slip is allowed: (a) The macroscopic stress-strainresponse (b) The accumulated slip vs. macroscopic strain for active slip systems. (c) Inversepole figure of the change in orientation of the tension axis.
198
OU
25-
20 -
6- 15 -
10 -
5-
n-
(a) o.oo
-
3n n
III
u

Appendix E
Effect of Latent Hardening on the
Polycrystalline Response of h.c.p.
Titanium
In chapter 4, the following form for the slip system hardening was introduced:
s= h| y3[, (E.1)
where ha describes the rate of strain hardening on slip system a due to shearing on the
slip system ,(. For the slip system hardening matrix h"a , the following simple form was
adopted:
ha = p q hp 1- sign 1 ( - (E.2)
where qap is a matrix describing the latent hardening behavior of a titanium crystal, y is a
reference shearing rate and ho, r, and n are slip system hardening parameters.
Also, the latent hardening matrix was taken to be decribed as:
pqk -( 1 if a and , are coplanar slip systems, (E.3)
qI otherwise.
Here, the parameter qi is assumed to be a constant and the same for interaction between
any two non-coplanar slip systems.
199

Since there is no experimental information available about the numerical value for qt, in
this chapter, numerical simulations of simple tension and compression are performed with
three different choices of the latent hardening parameter ql of 0, 1 and 1.5, respectively. The
effect of the different choices of the latent hardening parameter on the evolution of texture
and the stress-strain response in simple compression and tension of polycrystalline h.c.p.
titanium is analyzed.
The simulations are carried out with the assumption of basal-< a >, prismatic-< a >
and pyramidal-< c + a > slip systems. The initial texture is numerically represented by
729 unweighted grain orientations as shown in Fig. 4-14. The calculations are performed in
ABAQUS/Standard with a finite element mesh comprising 729 C3D8 elements where each
element represents a grain. The material parameters used for the calculations are estimated
by fitting the predictions from the model for q = 1 with the measured stress-strain response
for constant strain-rate and strain-rate jump compression tests, Fig. 4-32. The parameters
estimated from this fit are:
Table E-1. Material Parameters for h.c.p. Titaniumso so so ho r m n
(0001) < 1120 > {1010} < 1120 > {1011) < 1123 > +{1122} < 1123 >
8.2 MPa 8.2 MPa 82 MPa 12 MPa 1 0.16 0.1
(0001) < 1120 > {10i0} < 1120 > {1011} < 1123 > +{1122} < 1123 >
18 MPa 18 MPa 180 MPa
Fig.E-1 shows the predicted stress-strain curves in simple compression for the three
different values of ql. The stress-strain responses for ql = 1 and ql = 1.5 are nearly the same
but the stress-strain curve for ql = 0 differs significantly from the other two. In order to
capture the stress-strain response for values of the latent hardening parameter other than
1, there is a need to determine a "new" set of slip system hardening parameters for each
200

assumption for qj. Such a task is not undertaken here. Fig. E-2 shows the predicted texture
at e = -1 for the three different cases compared against the experimentally measured
texture. We observe that the texture evolution is quite insensitive to the changes in the
latent hardening parameter, q. The predictions of the stress-strain curves and the texture at
e = 0.3 in simple tension for the three different assumptions for q are presented in Figs. E-3
and E-4, repsectively. Again, the stress-strain curves differ but the texture evolution for
the three cases are nearly identical.
In conclusion, the study shows that the assumption for the latent hardening parameter
qt is not crucial for the calculation of texture evolution in polycrystalline h.c.p. titanium.
For the simulations on polycrystalline h.c.p. titanium, the value of the latent hardening
parameter is assumed to be q = 1. The effect of different values for q could be more
significant in the deformation of single crystals. In this context, there is a need for careful
experimental studies probing the latent hardening behavior of h.c.p. titanium and hexagonal
materials in general.
201

I 'n1 - -
90 -
t)
30 -
0 -
0.0 0.2 0.4 0.6 0.8 1.0
E
Figure E-1: Measured stress-strain response for simple compression and calculated stress-strain curves with three different assumptions for the latent hardening parameter qt.
202
ExperimentSimulation, q 1 = 0
- - Simulation, q 1 = 1- - Simulation, q1 = 1.5
' I' ' 'I
I I I I I I

x2 x2
(0001)
Xl
I
X2
)11) 01 )il}
x, - Xl
(b)
Figure E-2: (a) Experimentally measured texture after simple compression to e = -1;Numerically calculated texture with three different assumptions for the latent hardeningparameter qt: (b) ql = 0 (c) q = 1 (d) qt = 1.5
203
I
3.002.572.141.711.290.860.430.00
I1) 0001)
>.,!
o001)
Xl
20}
X,
X2
120
X2IIU
(a)
- x
(c) (d)
IIV I
X2 x2
(10-1) (IO-11
xl ~~~g~ ~ 7-
11 111 1
X I X I~~~~~~~il~
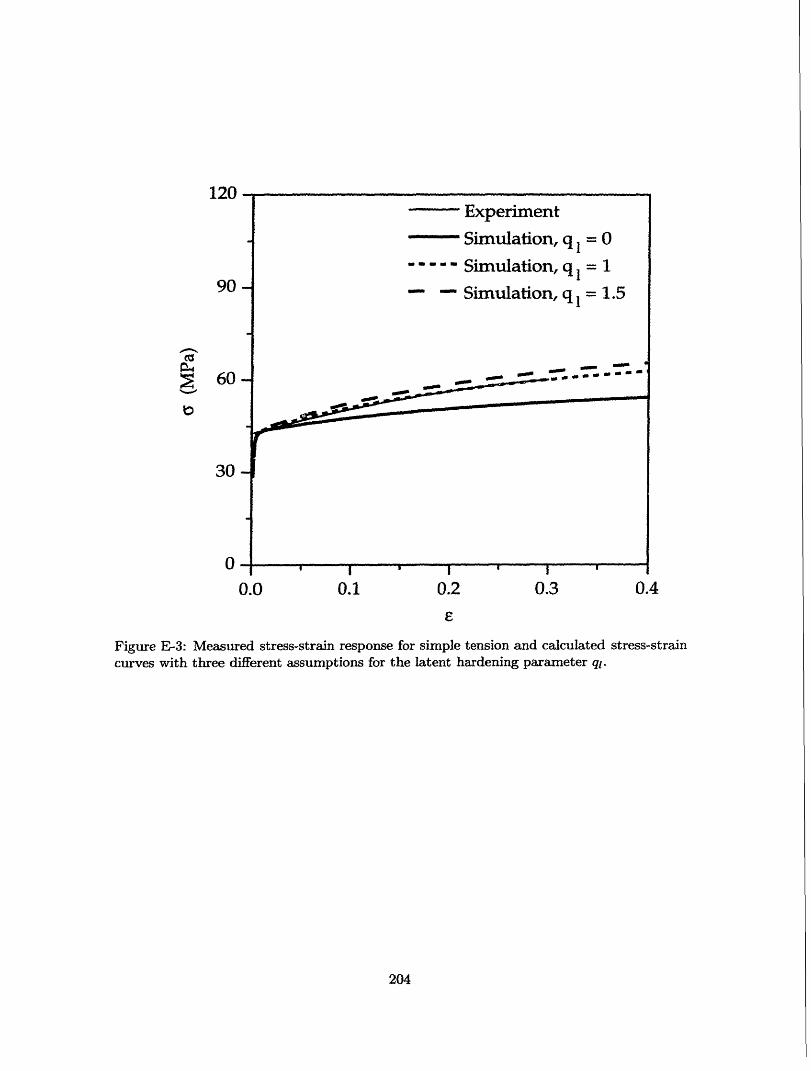
I PIn1I. -
90 -
60 -
30 -
0-0.0
! I
0.1 0.2 0.3 0.4
Figure E-3: Measured stress-strain response for simple tension and calculated stress-straincurves with three different assumptions for the latent hardening parameter ql.
204
ExperimentSimulation, q = 0
---- Simulation, q = 1- - Simulation, q = 1.5
._ ='~U _... ..·Ir~~~~.._. ��___�_
l - . T_ - -- _ --- -

X2X2I
I I_ (0001)
X,
X2
)i 1)
Xl
X2 X2
201
X,
(b)
Figure E-4: (a) Experimentally measured texture after simple tension to e = 0.3;Numerically calculated texture with three different assumptions for the latent hardeningparameter ql: (b) q = 0 (c) q = 1 (d) ql = 1.5
205
3.002.572.141.711.290.860.430.00It
01)
X1
X2
)1 1)
-Xl
1 }X2I.
01 1)
Xl Xl
X2
201
Xl
120)
(a)
20)
-Xl Xi
(c) (d)
X2 X2
,,
.~vj .~vj

Bibliography
[abaqus, 1994] Hibbit , Karlsson & Sorenson, Inc., Providence, R.I. ABAQUS Reference
Manuals, 1994.
[Akhtar and Teghtsoonian, 1975b] A. Akhtar and E. Teghtsoonian. Prismatic Slip in a-
Titanium Single Crystals. Metallurgical Transactions A, 6A:2201-2208, 1975b.
[Akhtar, 1975a] A. Akhtar. Basal Slip and Twinning in a-Titanium Single Crystals.
Metallurgical Transactions A, 6A:1105-1113, 1975a.
[Anand, 1982] L. Anand. Constitutive equations for rate-dependent deformation of metals
at elevated temperatures. ASME Journal of Engineering Materials and Technology,
104:12-17, 1982.
[Argon and East, 1979] A.S. Argon and G.H. East. Forest Dislocation Intersections in Stage
I Deformation of Copper Single Crystals. In P. Haasen, V. Gerold, and G. Kostorz,
editors, Proceedings of the 5th International Conference on the Strength of Metals and
Alloys, pages 9-16. Pergamon Press, Oxford, 1979.
[Argon, 1995] A.S. Argon. Mechanical Properties of Single Phase Crystalline Media:
Deformation at Low Temperatures. In R.W. Cahn and P. Haasen, editors, Physical
Metallurgy. Elsevier, Amsterdam, 1995.
[Asaro and Needleman, 1985] R.J. Asaro and A. Needleman. Texture development and
strain hardening in rate dependent Polycrystals. Acta Metallurgica, 33:923-953, 1985.
[Asaro and Rice, 1977] R.J. Asaro and J.R. Rice. Strain localisation in ductile single
crystals. Journal of the Mechanics and Physics of Solids, 25:309-338, 1977.
206

[Asaro, 1983a] R.J. Asaro. Micromechanics of Crystals and Polycrystals. Advances in
Applied Mechanics, 23:1-115, 1983a.
[Asaro, 1983b] R.J. Asaro. Crystal plasticity. ASME Journal of Applied Mechanics, 50:921-
934, 1983b.
[asm, 1990] ASM Handbook: Heat Treating. ASM International, The Materials Information
Society, 1990.
[Bassani, 1993] J.L. Bassani. Plastic Flow of Crystals. Advances in Applied Mechanics,
30:191-258, 1993.
[Beaudoin et al., 1994] A.J. Beaudoin, P.R. Dawson, K.K. Mathur, U.F. Kocks, and D.A.
Korzekwa. Application of Polycrystalline Plasticity to Sheet Forming. Computer Methods
in Applied Mechanics and Engineering, 117:49-70, 1994.
[Becker et al., 1991] R. Becker, J.F. Butler, Jr., H. Hu, and L.A. Lalli. Analysis of an
Aluminum Single Crystal with Unstable Initial Orientation (001)[110] in Channel Die
Compression. Metallurgical Transactions A, 22A:45-58, 1991.
[Becker et al., 1993] R. Becker, R.E. Smelser, and S. Panchanadeeswaran. Simulations of
Earing in Aluminum Single Crystals and Polycrystals. Modeling and Simulations in
Materials Science and Engineering, 1:203-224, 1993.
[Bronkhorst et al., 1992] C.A. Bronkhorst, S.R. Kalidindi, and L. Anand. Polycrystalline
plasticity and the evolution of crystallographic texture in FCC metals. Philosophical
transactions of the Royal Society of London A, 341:443-477, 1992.
[Brown et al., 1989] S. Brown, K. Kim, and L. Anand. An Internal Variable Constitutive
Model for Hot Working of Metals. International Journal of Plasticity, 5:95-130, 1989.
[Campbell and Dowling, 1970] J.D. Campbell and A.R. Dowling. The Behavior of Materials
Subjected to Dynamic Incremental Shear Loading. Journal of the Mechanics and Physics
of Solids, 18:43-63, 1970.
[Carreker and Hibbard, 1957] R.P. Carreker and W.R. Hibbard. Tensile Deformation of
Aluminum as a Function of Temperature, Strain Rate, and Grain Size. Transactions of
the AIME, 209:1157-1163, 1957.
207
[Churchman, 1954] A.T. Churchman. The slip modes of titanium and the effect of purity
on their occurence during tensile deformation of single crystals. Proceedings of the Royal
Society of London, A 226:216-226, 1954.
[Conrad, 1964] H. Conrad. Thermally Activated Deformation of Metals. Journal of Metals,
16:582-588, 1964.
[Conrad, 1981] H. Conrad. Effect of Interstitial Solutes on the Strength and Ductility of
Titanium. Progess in Materials Science, 26:123-403, 1981.
[Cottrell and Stokes, 1955] A.H. Cottrell and R.J. Stokes. Effects of temperature on the
plastic properties of aluminium crystals. Proceedings of the Royal Society of London, A
233:17-34, 1955.
[Deve and Asaro, 1989] H.E. Deve and R.J. Asaro. The Development of Plastic Failure
Modes in Crystalline Materials: Shear Bands in FCC Polycrystals. Metallurgical
Transactions, 20A:579-593, 1989.
[Doner and Conrad, 1973] M. Doner and H. Conrad. Deformation Mechanisms in
Commercial Ti-50A (0.5 at. pct. Oeq) at Intermediate and High Temperatures (0.3-
0.6Tm). Metallurgical Transactions A, 4:2809-2817, 1973.
[Dorn et al., 1949] J.E. Dorn, A. Goldberg, and T.E. Tietz. The Effect of Thermal-
mechanical History on the Strain Hardening of Metals. Transactions of the AIME,
180:205-224, 1949.
[Duffy, 1974] J. Duffy. Some experimental results in dynamic plasticity. In Mechanical
Properties at High Rates of Strain, pages 72-80. 1974.
[Duffy, 1982] J. Duffy. The Dynamic Plastic Deformation of Metals: A Review. Materials
Laboratory, Wright-Patterson Air Force Base, Ohio, 1982.
[Eleiche, 1980] A-S. M. Eleiche. The Influence of Strain-Rate History and Temperature
on the Shear of Commercially-Pure Titanium. Titanium '80 Science and Technology:
Proceedings of the Fourth International Conference on Titanium, 2:831-840, 1980.
[Frost and Ashby, 1982] H.J. Frost and M.F. Ashby. Deformation Mechanism Maps.
Pergamon Press, New York, 1982.
208

[Gil-Sevillano et al., 1980] J. Gil-Sevillano, P. Van Houtte, and E. Aernoudt. Large Strain
Work Hardening and Textures. Progress in Materials Science, 25:69-412, 1980.
[Groves and Kelly, 1963] G.W. Groves and A. Kelly. Independent Slip Systems in Crystals.
Philosophical Magazine, 8:877-887, 1963.
[Harren et al., 1988] S.V. Harren, H.E. Deve, and R.J. Asaro. Shear BaDd Formation in
Plane Strain Compression. Acta Metallurgica, 36:2435-2480, 1988.
[Havner, 1992] K.S. Havner. Finite Plastic Deformation of Crystalline Solids. Cambridge
University Press, 1st edition, 1992.
[Hill and Rice, 1972] R. Hill and J.R. Rice. Constitutive analysis of elastic-plastic crystals
at arbitrary strain. Journal of the Mechanics and Physics of Solids, 20:401-413, 1972.
[Hill, 1965] R. Hill. Continuum Micro-Mechanics of Elastoplastic Polycrystals. Journal of
the Mechanics and Physics of Solids, 13:89-101, 1965.
[Hirsch et al., 1978] J. Hirsch, R. Musick, and K. Lucke. Comparison between earing, R-
values and 3-dimensional Orientation Distribution Fuctions of rolled copper and brass
sheets. ICOTOM 5, 2:437-446, 1978.
[Hoge and Mukherjee, 1977] K.G. Hoge and A.K. Mukherjee. The Temperature and Strain
Rate Dependence of the Flow Stress of Tantalum. Journal of Material Science, 12:1666-
1672, 1977.
[Hutchinson, 1977] J.W. Hutchinson. Creep and Plasticity of Hexagonal Polycrystals as
Related to Single Crystal Slip. Metallurgical Transactions A, 8A:1465-1469, 1977.
[ICOTOM, 1991] ICOTOM. Proceedings of Ninth International Conference on Texture of
Materials. Textures and Microstructures, 14-18:1-1251, 1991.
[Kalidindi and Anand, 1994] S.R. Kalidindi and L. Anand. Macroscopic Shape Change
and Evolution of Crystallographic Texture in Pre-Textured FCC Metals. Journal of the
Mechanics and Physics of Solids, 42:459-490, 1994.
[Kalidindi et al., 1992] S.R. Kalidindi, C.A. Bronkhorst, and L. Anand. Crystallographic
texture evolution in bulk deformation processing of FCC metals. Journal of the Mechanics
and Physics of Solids, 40:536-569, 1992.
209

[Kallend et al., 1994] J.S. Kallend, U.F. Kocks, A.D. Rollett, and J.R. Wenk. popLA: the
Preferred Orientation Package from Los Alamos. 1994.
[Klepaczko, 1967] J. Klepaczko. Effects of Strain-Rate History on the Strain Rate
Hardening Curve of Aluminum. Arch. Mech. Stosowanej, 19:211-229, 1967.
[Klepaczko, 1968] J. Klepaczko. Strain-Rate History Effects for Polycrystalline Aluminum
and the Theory of Intersections. Journal of the Mechanics and Physics of Solids, 16:255-
266, 1968.
[Klepaczko, 1975] J. Klepaczko. Thermally Activated Flow and Strain Rate History Effects
for some Polycrystalline f.c.c. Metals. Materials Science and Engineering, 18:121-135,
1975.
[Kocks et al., 1975] U.F. Kocks, A.S. Argon, and M.F. Ashby. Thermodynamics and
Kinetics of Slip. In Progress in Material Science. Pergamon Press, London, 1975.
[Kocks et al., 1991] U.F. Kocks, J.S. Kallend, and A.C. Biondo. Accurate Representation
of General Textures by a Set of Weighted Grains. Textures and Microstructures, 14-
18:199-204, 1991.
[Kocks, 1976] U.F. Kocks. Laws for Work-Hardening and Low-Temperature Creep. Journal
of Engineering Materials and Technology, 98:76-85, 1976.
[Kothari and Anand, 1997] M. Kothari and L. Anand. Elasto-Viscoplastic Constitutive
Equations For Polycrystalline Metals: Application to Tantalum. Journal of the Mechanics
and Physics of Solids, 1997.
[Krausz and Eyring, 1975] A.S. Krausz and H.E. Eyring. Deformation Kinetics. Wiley,
New York, 1975.
[Lee and Backofen, 1966] D. Lee and W.A. Backofen. An Experimental Determination of
the Yield Locus for Titanium and Titanium-Alloy Sheet. Transactions of TMS-AIME,
236:1077-1084, 1966.
[Lii et al., 1970] Y. Lii, V. Ramachandran, and R.E. Reed-Hill. Some Aspects of the
Variation of the Strain Anisotropy in Titanium. Metallurgical Transactions, 1:447-453,
1970.
210

[Lindholm, 1964] U.S. Lindholm. Some Experiments with the Split Hopkinson Pressure
Bar. Journal of the Mechanics and Physics of Solids, 12:317-335, 1964.
[Lopatin et al., 1992] C.M. Lopatin, C.L. Wittman, J.P. Swensen, and P.F. Perron.
Dependency of Strain Rate Path of Mechanical Properties of Tantalum in Compression. In
R. Asfahani, E. Chen, and A. Crowson, editors, High Strain Rate Behavior of Refractory
Metals and Alloys, pages 241-247. The Minerals, Metals and Materials Society, 1992.
[Lush, 1990] A. M. Lush. Computational Procedures For Finite Element Analaysis of Hot-
Working. PhD thesis, Massachusetts Institute of Technology, June 1990.
[Mandel, 1974] J. Mandel. Thermodynamics and Plasticity. In D. Domingos, J.J. Nina,
M. N.R, and J.H Whitlaw, editors, Proceedings of the International Symposium on
Foundations of Continuum Thermodynamics, page 283. McMillan, London, 1974.
[Mathur and Dawson, 1989] K.K. Mathur and P.R. Dawson. On Modeling the Development
of Crystallographic Texture in Bulk Forming Processes. International Journal of
Plasticity, 5:67-94, 1989.
[Mathur and Dawson, 1990] K.K. Mathur and P.R. Dawson. Texture Development During
Wire Drawing. ASME Journal of Engineering Materials and Technology, 112:292-297,
1990.
[McHargue and Hammond, 1953] C.J. McHargue and J.P. Hammond. Deformation
Mechanisms in Titanium At Elevated Temperatures. Acta Metallurgica, 1:700-705, 1953.
[Nagtegaal anmid Taylor, 1968] J.C. Nagtegaal and L.M. Taylor. COMPARISON OF
IMPLICIT AND EXPLICIT FINITE ELEMENT METHODS FOR ANALYSIS OF
SHEET FORMING PROBLEMS. 242:1317-1326, 1968.
[Nemat-Nasser et al., 1994] S. Nemat-Nasser, Y.F. Li,
and J.B. Isaacs. Experimental/computational evaluation of flow stress at high strain
rates with application to adiabatic shear banding. Mechanics of Materials, 17:111-134,
1994.
[Orowan, 1940] E. Orowan. Problems of plastic gliding. Philosophical transactions of the
Royal Society of London A, 52:8-22, 1940.
211

[Parks and Ahzi, 1990] D.M. Parks and S. Ahzi. Polycrystalline Plastic Deformation and
Texture Evolution for Crystals Lacking Five Independent Slip Systems. Journal of the
Mechanics and Physics of Solids, 38:701-724, 1990.
[Paton and Backofen, 1970] N.E. Paton and W.A. Backofen. Plastic Deformation of
Titanium at Elevated Temperatures. Metallurgical Transactions A, 1:2839-2847, 1970.
[Paton et al., 1973] N.E. Paton, J.C. Williams, and G.P. Rauscher. The Deformation of
a-phase Titanium. Titanium Science and Technology, 2:1049-1069, 1973.
[Peirce et al., 1982] D. Peirce, R.J. Asaro, and A. Needleman. An analysis of nonuniform
and localized deformation in ductile single crystals. Acta Metallurgica, 30:1087-1119,
1982.
[Prantil et al., 1995] V.C. Prantil, J.T. Jenkins, and P.R. Dawson. Modeling Deformation
Induced Textures in Titanium Using Analytical Solutions For Constrained Single Crystal
response. Journal of the Mechanics and Physics of Solids, 43:1283-1302, 1995.
[Rice, 1971] J.R. Rice. Inelastic Constitutive Relations for Solids: An Internal Variable
Theory and its Application to Metal Plasticity. Journal of the Mechanics and Physics of
Solids, 19:433-455, 1971.
[Rollett et al., 1987] A.D. Rollett, G.R. Canova, and U.F. Kocks. The Effect of the Cube
Texture Component on the Earing Behavior of Rolled f.c.c. Metals. Proceedings of the
Conference on Formability and Metallurgical Structures, Orlando, FL, pages 147-157,
1987.
[Rosi et al., 1953] F.D. Rosi, C.A. Dube, and B.H. Alexander. Mechanisms of Plastic Flow
in Titanium - Determination of slip and twinning elements. Transactions of the AIME,
197:257-265, 1953.
[Rosi et al., 1956] F.D. Rosi, F.C. Perkins, and L.L. Seigle. Mechanisms of Plastic Flow
in Titanium At Low and High Temperatures. Transactions of the AIME, 206:115-122,
1956.
[Schmid and Boas, 1935] E. Schmid and W. Boas. Plasticity of Crystals. Chapman and
Hall, London, 1935.
212

[Schoenfeld et al., 1995] S.E. Schoenfeld, S. Ahzi, and R.J. Asaro. Elastic-Plastic Crystal
Mechanics for Low Symmetry Crystals. Journal of the Mechanics and Physics of Solids,
43:415-446, 1995.
[Senseny et al., 1978] P.E. Senseny, J. Duffy, and R.H. Hawley. Experiments on Strain Rate
History and Temperature Effects During the Plastic Deformation of Close-Packed Metals.
Journal of Applied Mechanics, 45:60-66, 1978.
[Simmons and Wang, 1971] G. Simmons and H. Wang. Single Crystal Elastic Constants
and Calculated Aggregate Properties. The M.I.T Press, Cambridge, 1971.
[Staroselsky and Anand, 1997] A. Staroselsky and L. Anand. Inelastic Deformation of
F.C.C. Materials by Slip and Twinning. Submitted to Journal of the Mechanics and
Physics of Solids, 1997.
[Taylor, 1938a] G.I. Taylor. Analysis Of Plastic Strain In A Cubic Crystal. In Stephen
Timoshenko 60th Anniversary Volume, pages 218-224. McMillan, New York, 1938.
[Taylor, 1938b] G.I. Taylor. Plastic Strain in Metals. Journal of the Institute of Metals,
62:307-324, 1938.
[Tenckhoff, 1970] E. Tenckhoff. Defocusing for the Schulz Tecnhique of Determining
Preferred Orientation. Journal of Applied Physics, 41:3944-3948, 1970.
[Teodosiu and Sidoroff, 1976] C. Teodosiu and F. Sidoroff. A theory of finite
elastoviscoplasticity of single crystals. International Journal of Engineering Science,
14:165-176, 1976.
[Teodosiu, 1970] C. Teodosiu. A dynamic theory of dislocations and its applications to the
theory of the elastic-plastic continuum. In R. Simmons J.A., de Wit and R. Bullough,
editors, Proceedings of the Conference on Fundamental Aspects of Dislocation Theory,
page 837. 1970.
[Tucker, 1961] G.E.G. Tucker. Texture and Earing in Deep Drawing of Aluminum. Acta
Metallurgica, 9:275-286, 1961.
[Vecchio, 1994] K.S. Vecchio. High-Strain, High Strain-Rate Deformation of Tantalum and
Tantalum-Tungsten Alloys. Supplement J. de. Phsique III, 4:301-306, 1994.
213

[Wenk, 1985] H.-R. Wenk. Preferred Orientation in Deformed Metals and Rocks: An
Introduction to Modern Texture Analysis. Academic Press, Inc., 1985.
[Williams and Blackburn, 1968] J.C. Williams and M.J. Blackburn. The Identification of
a Non-Basal Slip Vector in Titanium and Titanium-Aluminum Alloys. Physica Status
Solidi, 25:K1-K3, 1968.
[Wilson and Butler, 1961] D.V. Wilson and R.D. Butler. The Role of Cup-Drawing Tests
in Measuring Drawability. Journal of the Institute of Metals, 90:473-483, 1961.
214
THESIS PROCESSING SLIP
FIXED FIELD: ill. name
index biblio
ICOPIE ives Aero Dewey Hum
Lindgren Music Rotch Science
TITLE VARIES: '
NAME VARIES: '
IMPRINT: (COPYRIGHT)
PCOLLATION: Z / 1
· ADD. DEGREE: P DEPT.:
SUPERVISORS:
NOTES:
cat'r: date:page:
ADEPT: * I F7 IWYEAR: I11TT DEGREE: f' D-
wNAME: BALA5US AMA-NTANJ Sr; ksh
-
.